Submitted:
22 August 2025
Posted:
26 August 2025
You are already at the latest version
Abstract
This study employs CST simulations to analyze the electromagnetic response and cable coupling characteristics of electric vertical takeoff and landing (eVTOL) aircraft under lightning conditions. Based on the SAE ARP5414B standard, lightning zoning was carried out, and three typical strike scenarios—the nose, wing, and vertical tail—were established. Referring to representative lightning current waveforms in SAE ARP5412B, Component A was selected as the primary excitation source. On this basis, the L9(3³) orthogonal design method was applied to evaluate the influence of cable structure, length, and routing method on induced current. The results show that lightning strikes at the nose have the strongest coupling effect on the airframe, with both electric and magnetic fields exhibiting significant spatial distribution. Shielded cables effectively reduce induced current in the conductor core by diverting most of the coupled current through the shielding layer, while unshielded single-core cables demonstrate the weakest resistance to interference. Induced current increases with cable length, and Z-shaped wall-mounted routing produces stronger coupling than straight or suspended routing. This research provides a systematic approach for evaluating indirect lightning effects in eVTOL and offers engineering guidance for electromagnetic protection and cable design.
Keywords:
eVTOL
; Indirect lightning effects
; electromagnetic coupling
; cable shielding effectiveness
; CST simulation
; electromagnetic compatibility
1. Introduction
1.1. Research Background
Lightning is a severe natural discharge phenomenon that typically occurs in strong convective weather. It releases immense instantaneous energy, characterized by high voltage, large current, and strong electromagnetic radiation. The lightning process generates a large energy release, capable of discharging hundreds of kW/h of energy within microseconds [1]. The electromagnetic pulse field generated can significantly affect surrounding equipment in a very short period of time. The effects of lightning on aircraft primarily manifest in two aspects: direct effects and indirect effects. The direct effects refer to the thermal effects, mechanical damage, and structural harm caused by large currents when lightning strikes the aircraft. Indirect effects refer to the interference or even damage caused by the strong electromagnetic field generated during the lightning discharge, which induces or couples onto onboard cables, communication links, and sensitive electronic equipment, resulting in disruption of normal operation [2].
Electric Vertical Takeoff and Landing (eVTOL) aircraft, as an emerging type of aircraft, has become a key support for the development of low-altitude economy and Urban Air Mobility (UAM) due to its advantages in vertical takeoff and landing, low carbon emissions, high efficiency, and rapid travel. eVTOL is expected to be an important solution for alleviating urban traffic pressure and improving airspace utilization in the future. Currently, many companies are actively promoting eVTOL test flights and commercial applications, exploring scenarios such as short-distance passenger transport, logistics distribution, and emergency rescue. Its safety issues have also become a central focus of regulation and research.
Compared to traditional aircraft made with metal shells, eVTOL uses lightweight composite materials, such as carbon fiber, in its structure to reduce the weight of the aircraft and improve flight performance. Composite materials have significantly lower electrical conductivity than metals, lack current dissipation, and electromagnetic shielding capabilities, which notably decreases the resistance to lightning strikes [3]. Therefore, composite materials are prone to ablation, delamination, and even structural failure when struck by lightning. Moreover, the strong radiation field generated by direct or nearby lightning strikes can easily enter the interior of the aircraft through gaps or other coupling paths, coupling with sensitive equipment or signal cables, thereby interfering with or even damaging the equipment.
eVTOL typically operates in urban low-altitude airspace, which has a complex electromagnetic environment, including high-voltage power transmission, microwave communications, building scattering, and frequent thunderstorms and extreme weather conditions. Its ability to resist lightning interference is a critical part of the system’s airworthiness assessment. Therefore, there is an urgent need to focus on the coupling mechanisms of lightning’s indirect effects, based on the structural, electrical system, and operating environment characteristics of eVTOL, and develop high-fidelity numerical simulation models to provide theoretical support and technical basis for electromagnetic protection design and lightning airworthiness certification.
1.2. Current Research Status
The indirect effects of lightning pose a significant threat to the safety and electromagnetic compatibility of aircraft, especially for new composite material flying platforms like eVTOL, whose complex structures and high-density wiring make them more sensitive to lightning-induced coupling effects. Therefore, in recent years, scholars both domestically and internationally have conducted extensive research on lightning coupling paths, electromagnetic response characteristics, and cable protection strategies.
Alkasi [4] used EMA3D simulations to compare and analyze the response differences of aluminum alloy, CFRP, and copper-foil embedded composite materials under lightning indirect effects, finding that copper foil embedding effectively reduces the coupled current in cables, and shielded cables exhibit better inductive immunity. Zou, D. et al. [5], using the Su-27 as an example, studied the distribution of lightning currents at different lightning strike positions on the aircraft, providing an important basis for lightning coupling path research. Yang Z [6] conducted cable shielding performance analysis on composite aircraft bodies and verified the role of shielding structures and wiring methods in lightning protection. Aguilera [7] proposed a patch-supported macro finite element method for lightning-induced simulation of engine systems, improving the modeling efficiency for complex structural coupling paths. Qiu Yicheng [8] proposed a multi-physics field lightning modeling method combining thermodynamics, electromagnetics, and radiation coupling, revealing the formation mechanism and evolution law of lightning channels. Nie Yunke [9] modeled the lightning attachment areas and aerodynamic structures based on the CST platform, analyzing their impact on radar performance. Wang Yifan [10] studied the transient coupling of broadband electromagnetic pulses to multi-conductor transmission lines using the FDTD method, analyzing the effects of structural and boundary parameters on inductive responses. Bu Huinan [11] used a high-voltage electrode and field-circuit collaborative modeling method to systematically simulate the response of aircraft and onboard cables under lightning conditions, providing targeted protection recommendations.
Although previous research has provided rich simulation tools and theoretical foundations for lightning coupling paths, electric field distribution characteristics, and cable induced currents, there are still several research gaps and deficiencies in the following areas:
As an emerging flying platform with lightweight and electric features, eVTOL lacks research on lightning zoning, electromagnetic response, and cable coupling analysis specifically for this platform.
Most current studies focus on single-factor analysis of cable structures or shielding parameters, and there is a lack of systematic evaluation of the combined effects of wiring methods, cable lengths, and other parameters, as well as in-depth quantification of the coupling relationships among multiple parameters.
The relationship between the electromagnetic influence range of the lightning strike injection point and the cable coupling inside the aircraft remains underexplored. There is a lack of analysis methods that combine the distribution of electromagnetic fields and the response of cables.
Research Objectives and Main Contributions
To address the above gaps, this paper focuses on the electromagnetic response mechanisms and cable coupling characteristics of the eVTOL platform in lightning environments. Using simulation modeling and orthogonal experimental design, the following three aspects of work are carried out:
Lightning Zoning and Excitation Modeling: Based on the SAE ARP5414B standard, the lightning zoning for eVTOL structures is completed. Three typical lightning strike injection points, namely the nose, wings, and vertical tail, are selected. Lightning waveforms (Component A) are referenced from the SAE ARP 5412B standard to provide excitation conditions for subsequent simulations.
Aircraft Electromagnetic Response Analysis: Time-domain simulations are carried out using the CST platform to systematically compare the electric field and magnetic field strength distribution characteristics on the surface of the aircraft for different lightning strike locations, identifying that lightning strikes at the nose have the strongest coupling effect on the cabin area. Key coupling paths and sensitive areas are proposed.
Cable Coupling Effect Analysis and Optimization Recommendations: The L9(33) orthogonal experimental method is used to evaluate the impact of three main factors—cable structure, length, and wiring method—on the maximum induced current, and optimization recommendations such as prioritizing shielded cables, minimizing cable length, and suspending cables are proposed. These provide strategy support for the electromagnetic compatibility design of eVTOL platforms.
The research results not only enrich the modeling methods for indirect lightning effects but also provide actionable design bases for cable layout and lightning protection for new aircraft platforms.
2. Theoretical Basis and Coupling Mechanism
2.1. Transmission Line Matrix (TLM) Theory
The Transmission Line Matrix (TLM) method is a mature, full-time-domain electromagnetic field analysis technique, widely used in the analysis of electromagnetic problems such as radiation and scattering. The basic principle of this method is based on the similarity between the propagation behavior of electromagnetic waves in space and the transmission characteristics of voltage and current in transmission lines, which forms the basis for the development of this method. Currently, the TLM method has been extended to three-dimensional spatial problems.
In the TLM algorithm, the analysis region is first discretized and represented by an equivalent transmission line network, with each node in the network modeled by lumped elements. The physical properties correspond to the actual parameters of the problem, achieving spatial discretization. Then, the propagation of electromagnetic signals is simulated by the connection methods between the transmission lines and the behavior of the lumped elements, achieving time-domain discretization. When analyzing a one-dimensional transmission line problem, its lumped-parameter model can be simplified into a specific equivalent circuit structure, as shown in Figure 1.
According to Kirchhoff’s laws, the following equation can be obtained:
where and represent the voltage and current in the circuit, respectively; is the position; is the time coordinate; and are the distributed inductance and capacitance parameters, respectively. After rearranging, we obtain:
The two-dimensional TLM method is implemented by constructing a grid structure composed of parallel transmission lines. Each node receives incident pulses from four directions, and these pulses propagate along four transmission line branches into the node, where scattering occurs. The scattered waves then propagate along the transmission lines to adjacent nodes, simulating the propagation of electromagnetic waves in space. This process can be described by the following formula:
where is the pulse scattering matrix of the node, and is the connection matrix that describes the network topology. The subscripts represent the discrete time intervals for scattering. The following scattering formula is derived:
where represents scattering; denotes incident; are port numbers.
As shown in Figure 2, when the TLM method is extended to three-dimensional space, the Symmetrical Condensed Node (SCN) model is often used. In this algorithm, each node of a spatial unit is connected to adjacent nodes by short transmission line segments in six directions. Each direction is represented by two perpendicular voltage components [12]. Within one computational time step, these twelve voltage components will change, producing corresponding reflected waves, which then serve as the incident excitation for the adjacent grid nodes in the next iteration. This iterative process enables the accurate modeling and simulation of electromagnetic wave propagation in three-dimensional space.
This process can be described by the formula:
The Transmission Line Matrix (TLM) method is a problem-solving approach that transforms electromagnetic field issues into equivalent transmission line network problems. Its significant advantage lies in its ability to naturally integrate the electromagnetic field with boundary conditions, material dielectric properties, and other characteristics. This method does not require the re-establishment of equation models for each new structure. Parameters such as boundary conditions, dielectric loss, conductivity, permeability, and excitation sources can be easily incorporated into the program, achieving efficient modeling and simulation. Therefore, it is particularly suitable for handling engineering problems involving complex geometric structures and changing electromagnetic environments [13].
The TLM method is based on time-domain solutions, avoiding iterative calculations of large-scale linear equations in the frequency domain, which improves computational efficiency while ensuring simulation accuracy. Additionally, it allows for the extraction of large amounts of useful information in a single computation, including the transient response of a structure to pulse excitation, and by Fourier transforms, the frequency-domain characteristics of the system for arbitrary excitations, including resonant characteristics of both the fundamental and higher-order modes. This richness of information makes the TLM method uniquely advantageous in the analysis of broadband problems such as lightning, electromagnetic pulses, and high radiation, as well as cable and circuit coupling analysis. It has become an important tool in the modeling and analysis of complex electromagnetic systems.
In the subsequent work of this study, the TLM solving method will be primarily used for electromagnetic simulation analysis. The TLM solver in CST Studio Suite will be utilized to model and simulate the electromagnetic coupling effects under lightning excitation.
2.2. Basic Characteristics of Lightning Electromagnetic Fields
The Lightning Electromagnetic Environment (LEE) refers to the electromagnetic fields generated by the large currents flowing through the lightning channel during a thunderstorm discharge and their propagation characteristics in space. These electromagnetic fields not only cover a broad frequency spectrum but also exhibit significant time variability and spatial non-uniformity, which can have important impacts on aircraft, radar, communication equipment, and more.
- Origin and Components of Lightning Electromagnetic Fields
The lightning process primarily includes stages such as leader development, leader breakdown, return stroke, current continuation, and multiple discharges. Each stage generates different electromagnetic radiation characteristics. The resulting electromagnetic environment is mainly composed of the following parts:
Electric Field (E-field): Primarily originates from charge accumulation in the lightning channel, with near-ground electric field strengths reaching the kV/m range.
Magnetic Field (H-field): Formed by the large currents in the lightning, with typical peak values reaching several hundred A/m, especially prominent during the sharp current changes in the early stages of the lightning strike.
Lightning Electromagnetic Pulse (LEMP): A radiation wave formed by the rapid variations of both the electric and magnetic fields, which exhibits significant transient high-frequency characteristics and can propagate over long distances, coupling with system circuits [14,15].
- 2
- Frequency Spectrum Characteristics of Lightning
The electromagnetic radiation from lightning covers a very wide frequency range, from DC (static electric fields) to RF (MHz range) and even extending to microwaves (GHz) and X-rays. Its main frequency spectrum features are as follows:
The peak frequency is concentrated between 5-10 kHz, which is the primary energy concentration region for lightning radiation in the far-field area.
The electric field spectrum decreases inversely with frequency, with stronger radiation intensity in the lower frequency bands.
The frequency range below 1 MHz has a higher coupling risk to electronic devices, communication systems, etc., and can easily couple with sensitive circuits through conductors [16].
This study prioritizes selecting excitation source frequencies that are closely related to the operating frequency bands of onboard electronic equipment, the cable induction capacity, and the structural resonance frequencies, focusing on the low-frequency range. Considering factors like electromagnetic induction capacity, coupling path clarity, system sensitivity, and standard compatibility, the lightning frequency band below 30 MHz is chosen as the main simulation frequency band.
- 3
- Time Characteristics and Waveform Features
Fast Rise Time: The typical rise time of the lightning electric field waveform is from tens to hundreds of nanoseconds, with the dI/dt of some return strokes exceeding 100 kA/μs.
Pulse Width: The main pulse width ranges from tens to hundreds of microseconds, followed by a slower afterglow.
Multipulse Structure: A complete lightning strike typically includes multiple sub-discharge events, such as multiple leader-return stroke cycles, forming complex superimposed waveforms.
- 4
- Spatial Distribution Characteristics
Near-field Region (<100 m): Primarily consisting of static electric fields and induced fields, with high intensity and complex coupling paths.
Far-field Region (several kilometers or more): Primarily consisting of radiation fields, propagating in a spherical wave decay pattern.
Ground/Aerial Structure Effects: Terrain, conductivity, and object height alter the propagation paths and distribution patterns of lightning fields.
- 5
- Direct and Indirect Effects of Lightning
Based on the different paths of lightning effects, they can be divided into:
Direct Effects: Lightning current directly injected into the aircraft structure or cables, potentially causing structural ablation, thermal damage, fusion, and other severe consequences.
Indirect Effects: Lightning fields induce coupling into the system during spatial propagation, such as through onboard cables, circuits, or devices, causing voltage surges, current interference, or logic faults. In severe cases, this can also damage sensitive components.
Figure 3.
Illustration of Direct and Indirect Effects of Lightning.
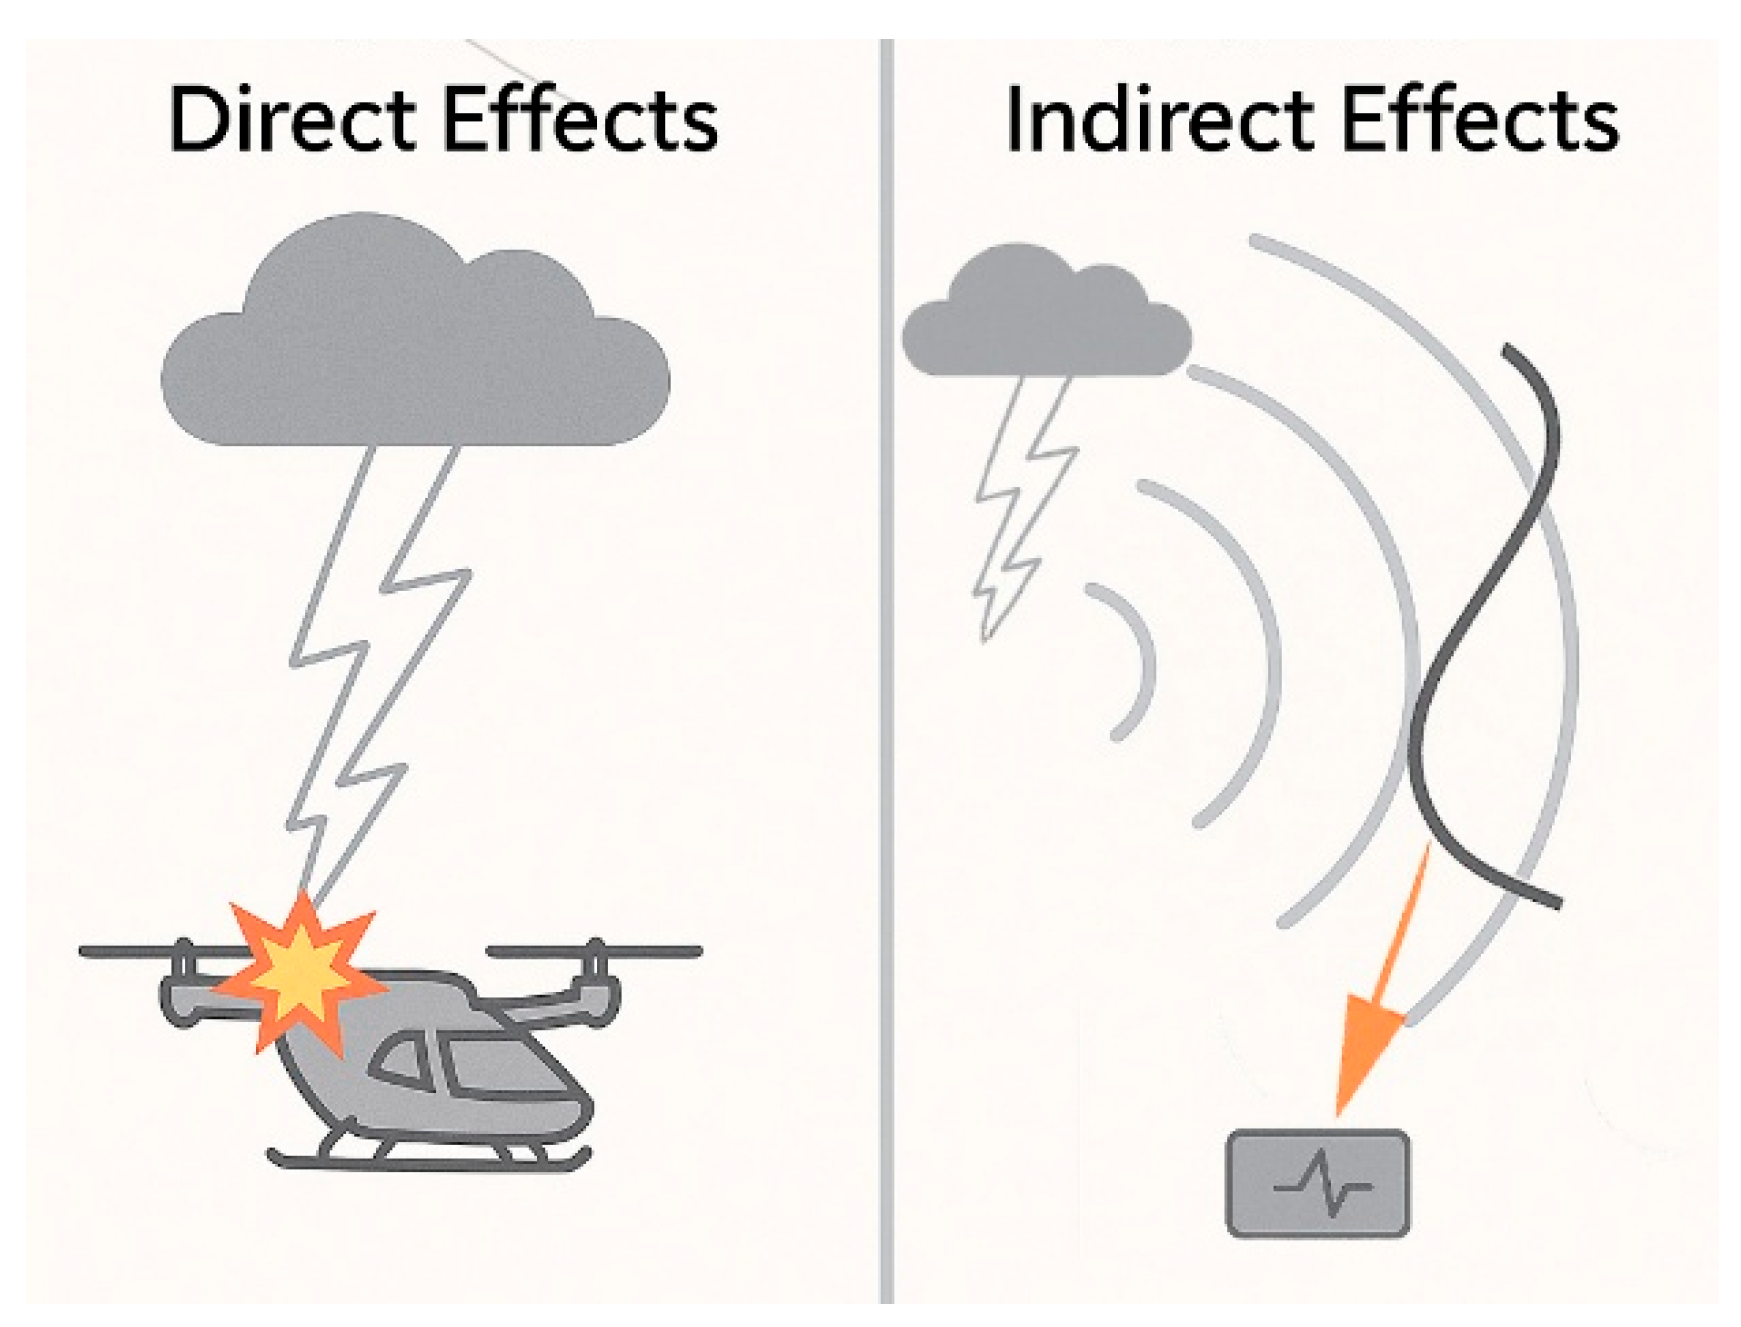
Due to the concealed nature, high occurrence probability, and difficulty in shielding of indirect effects, they have become a key focus in the lightning protection design of eVTOL systems. This paper focuses on the study of electromagnetic field coupling characteristics of indirect lightning effects and explores their impact mechanisms and protection strategies for onboard cable systems.
2.3. Lightning Coupling Methods
The main ways in which lightning interferes with internal systems of aircraft can be summarized into three coupling methods: electrostatic coupling, magnetic coupling, and resistive coupling. The mechanisms and impact characteristics of these coupling methods differ, and in electric vertical takeoff and landing (eVTOL) aircraft, due to the extensive use of composite materials, the shielding advantages of traditional metal shells are weakened, making lightning coupling effects more pronounced and requiring focused analysis.
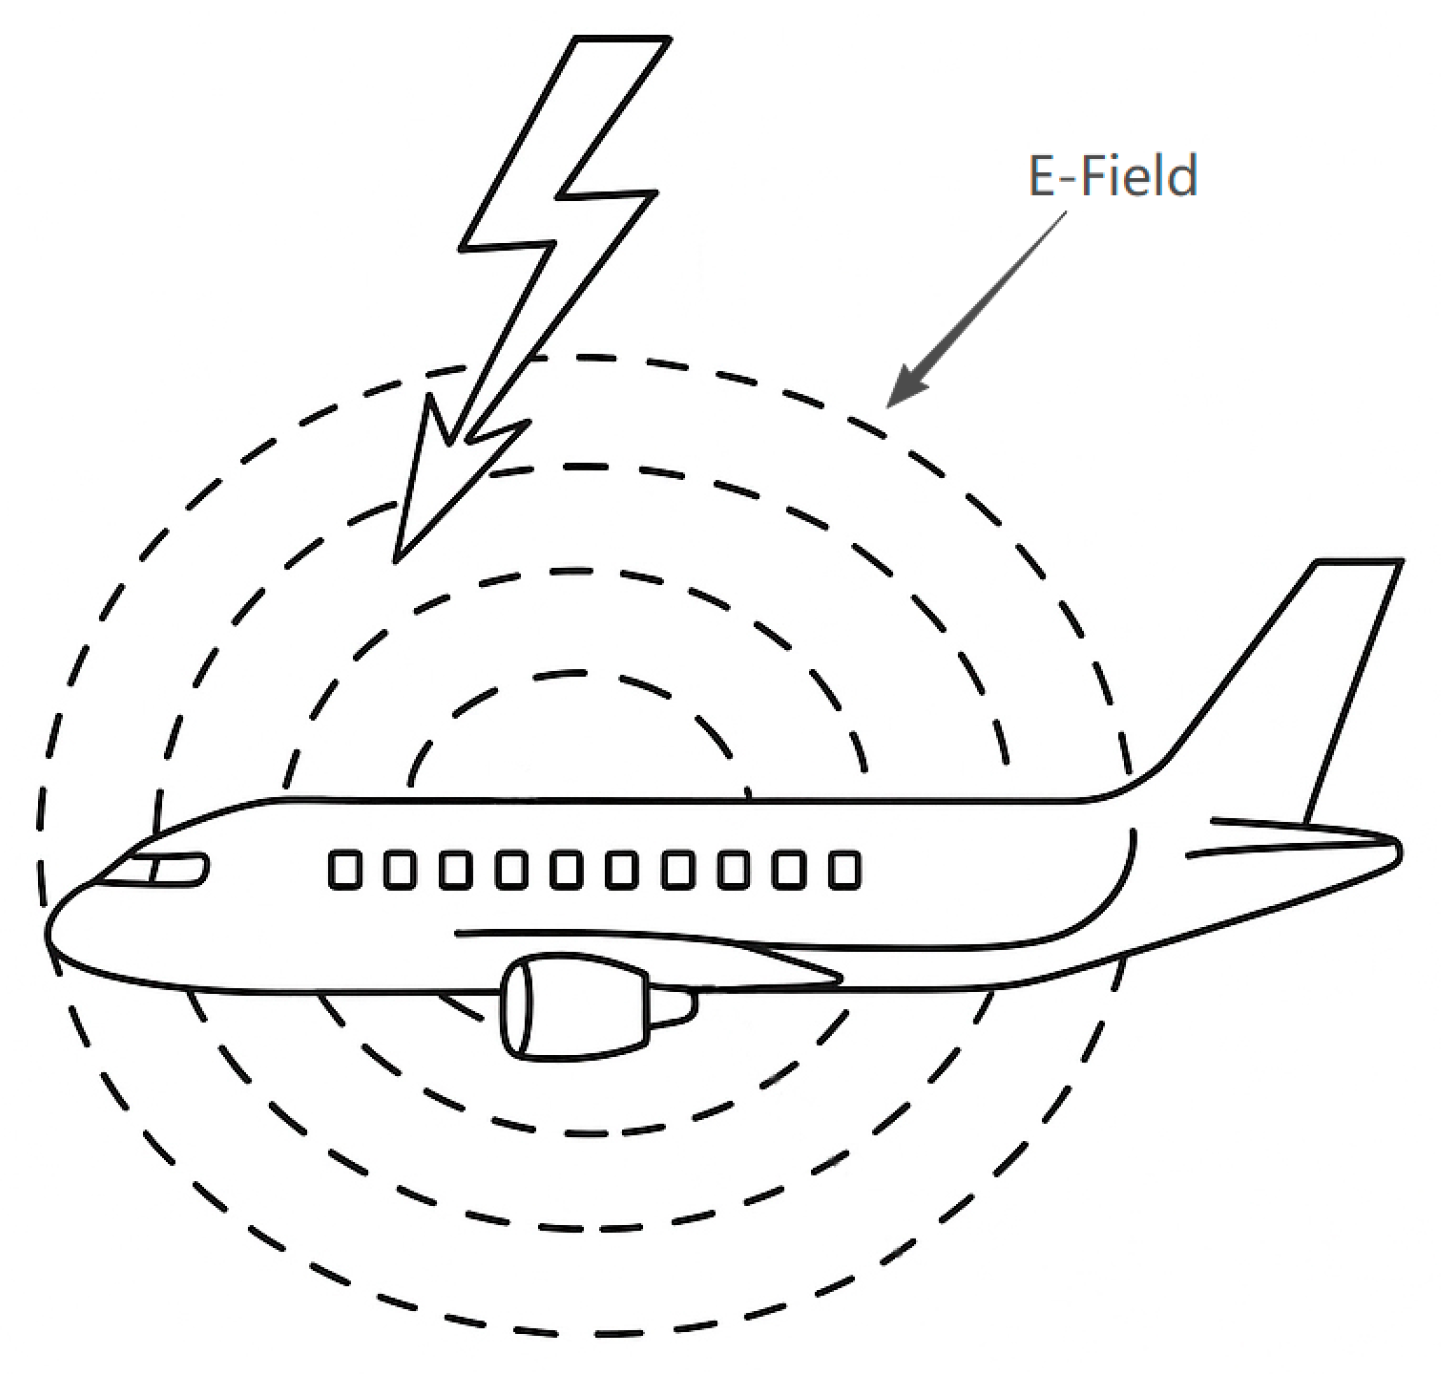
- Electrostatic Coupling
When lightning discharges, a strong electric field can enter the interior of the aircraft through gaps, hatches, windows, and other openings, inducing currents on internal conductors (such as cables and device shells). This coupling method is particularly prominent during the initial static charge accumulation stage of the lightning discharge. For traditional metal fuselages, their good conductivity and continuity can form a Faraday cage effect, effectively shielding the interior from the electric field. However, new aircraft like eVTOLs, which use composite materials, have poor conductivity and continuity, leading to a significant reduction in electric field shielding capability, thus increasing the risk of electrostatic coupling interference.
Figure 4.
Illustration of External Electric Field on Aircraft During Lightning Discharge.
- 2
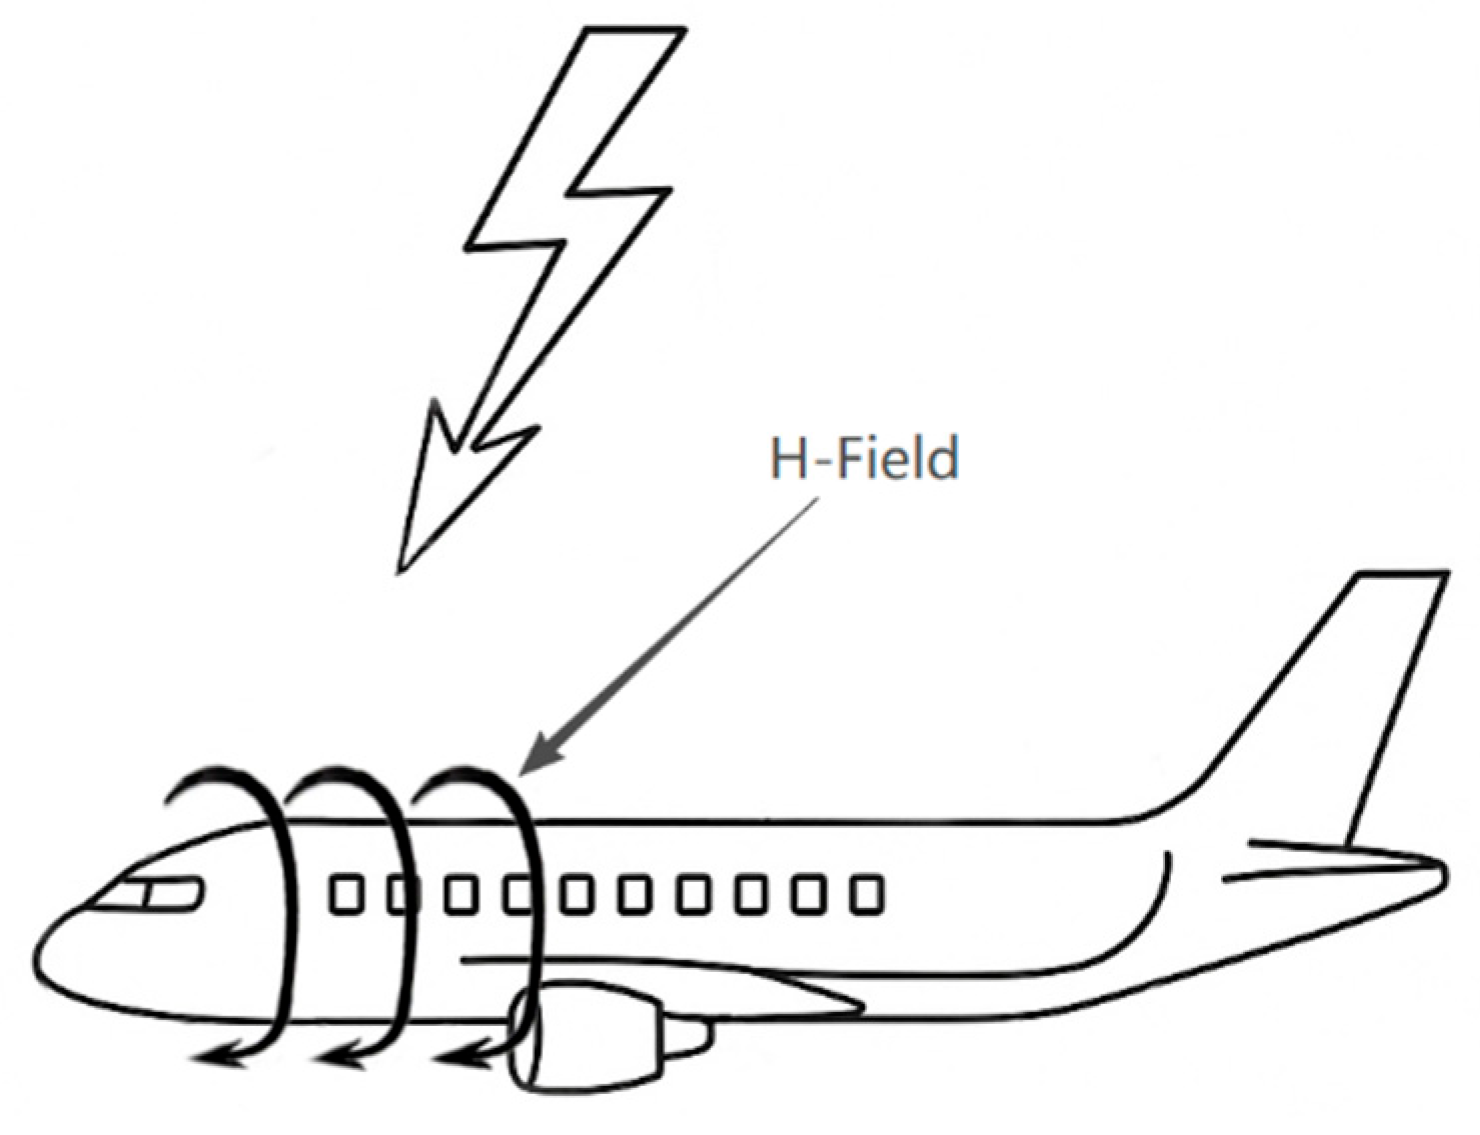
- Magnetic Coupling
When lightning current flows through the aircraft structure, it generates a strong magnetic field around it. Due to the rapid changes in the lightning current, this magnetic field also exhibits a rapid pulse characteristic. When the magnetic field crosses through structural openings, gaps, or other areas of the aircraft, it induces voltage and current in internal loops or cables. This coupling method is particularly pronounced during the main discharge stage of the lightning strike. Compared to metal materials, composite materials have weaker attenuation capacity for magnetic flux, so the magnetic field is more likely to penetrate into the aircraft. Furthermore, studies show that the magnetic field strength formed in composite material structures rises more quickly and reaches higher peaks, causing the induced lightning current on internal metal conductors to be much higher than that on traditional metal aircraft.
Figure 5.
Illustration of External Magnetic Field on Aircraft During Lightning Discharge.
- 3
- Resistive Coupling
Resistive coupling refers to the voltage (V=IR) formed along the current path due to the resistance of structural materials and connection parts when the lightning current flows through the aircraft. In metal aircraft, due to the low resistivity of metal materials, resistive coupling effects are minimal unless the lightning current must pass through significantly resistive joints, hinges, or other components. However, in eVTOL aircraft, which use a large amount of composite materials, their resistivity is typically several hundred to several thousand times higher than that of metals. When the lightning current flows through these areas, greater voltage drops are generated, which can form high voltages at device grounding points or structural gaps, thereby affecting the normal operation of sensitive equipment.
2.4. Lightning Protection Standards for eVTOL
Currently, major international aviation regulatory bodies (EASA, FAA) as well as the Civil Aviation Administration of China (CAAC) have developed or published relevant specific conditions and certification frameworks for eVTOLs based on existing aircraft standards, combined with the unique characteristics of eVTOLs. Additionally, test standards such as DO-160G, SAE ARP 5412B, SAE ARP 5414B, and SAE ARP 5416A provide important technical support for evaluating lightning resistance performance. The following is an overview of the airworthiness requirements and technical specifications for lightning protection of eVTOLs by these major organizations, which will lay the foundation for subsequent simulation analysis and compliance studies.
The European Union Aviation Safety Agency (EASA), in the context of eVTOL airworthiness, issued the “SC-VTOL-01 Small Vertical Takeoff and Landing Aircraft Specific Conditions” in 2019, based on the review of over 150 vertical takeoff and landing aircraft projects (applicable to non-pressurized aircraft with a maximum of 9 passengers and a maximum takeoff weight of 3175 kg) [17]. EASA has since published four versions of the Method of Compliance (MOC) to further explain and clarify these requirements. In 2021, EASA released SC E-19 “Specific Conditions for Pure Electric and Hybrid Electric Propulsion Systems” for the powerplants of eVTOLs. These conditions provide specific requirements for lightning protection in eVTOLs:
- Aircraft Level Requirements
Unless it can be demonstrated that the aircraft is unlikely to be struck by lightning, the aircraft must be capable of preventing catastrophic consequences from lightning strikes.
- 2
- Equipment Level Requirements
Unless it can be demonstrated that the electrical/electronic system is unlikely to be affected by lightning, the following requirements must be met: If the failure of any electrical or electronic system would prevent the aircraft from continuing safe flight and landing, the system must be designed and installed to ensure that its functionality is not adversely affected during and after a lightning strike, unless this recovery conflicts with other operational or functional requirements of the system. For aircraft authorized to operate in Instrument Meteorological Conditions (IMC), critical systems must also recover promptly after a lightning strike, ensuring the crew’s ability to respond to adverse conditions [18].
The Federal Aviation Administration (FAA) developed its first airworthiness guidelines for eVTOLs at the end of 2022 for Joby’s JAS4-1, which is equivalent to specific conditions. The final guidelines were officially released in March 2024. Furthermore, in May 2024, the FAA issued official airworthiness guidelines for Archer’s M001 model. Based on this, the FAA released Advisory Circular AC21-17-4 “Model Certification - Powered Lift Aircraft” in June 2024 (for aircraft with a maximum of 6 passengers and a maximum takeoff weight of 5670 kg), which is open for public comment [19]. This advisory circular provides a more efficient general airworthiness guideline for eVTOLs. Similar to EASA’s requirements, the advisory circular also divides eVTOLs into Enhanced Performance Category and Basic Performance Category, with the Enhanced Performance Category being intended for commercial passenger operations. The lightning protection requirements in AC21-17-4 for eVTOLs are essentially consistent with those outlined by EASA [20].
The Civil Aviation Administration of China (CAAC) has not yet established general eVTOL airworthiness approval requirements. According to the “Interim Regulations on the Flight Management of Unmanned Aircraft,” any design, production, importation, flight, or maintenance activity for medium- and large-sized civil unmanned aircraft systems must apply for airworthiness approval from the Civil Aviation Administration of China [21]. For systems already granted airworthiness approval, any major design changes and proposed flight activities also require re-application for airworthiness approval. The “Civil Unmanned Aircraft Operation Safety Management Rules” further specify that if the CAAC has already issued airworthiness standards but the standards do not cover sufficient safety requirements, the CAAC should develop “specific conditions” equivalent to the original airworthiness standard’s safety level. These specific conditions apply to situations such as novel or unique product designs, unconventional intended uses, or potential safety concerns based on similar products’ experiences. If no airworthiness standard is available, the “specific conditions” may incorporate applicable clauses from existing airworthiness standards and other relevant requirements based on the aircraft’s design and intended use [22].
As a result, Chinese eVTOL projects generally adopt a “case-by-case” approach, referring to EASA’s SC-VTOL, CCAR-23, and CCAR-27 regulations to establish specific conditions. In recent years, the CAAC has published three airworthiness documents related to eVTOLs: SC-21-002 “EHang EH216-S UAV System Specific Conditions” in February 2022 [23]; SC-21-004 “Autoflight V2000CG UAV System Specific Conditions” in November 2023 [24]; and the draft “Aerofugia AE200-100 Electric Vertical Takeoff and Landing Aircraft Specific Conditions” for public comments in December 2023 [25]. The Southwest China Civil Aviation Administration also established a project review team, which, in conjunction with the AE200-100’s design characteristics and operational scenarios, developed applicable specific conditions for airworthiness certification. Additionally, Chapter H of the revised CCAR-23-R4, “Supplementary Requirements for Electric Aircraft Power Systems,” can also serve as a reference for the certification of eVTOL electric power systems. Both the “EHang EH216-S Specific Conditions” and the “AE200-100 Draft Specific Conditions” clearly outline lightning protection requirements for eVTOLs, which are essentially in line with EASA’s SC-VTOL-01 and FAA’s AC21-17-4.
In terms of lightning compliance testing methods, eVTOLs and other new aircraft types currently still primarily follow traditional aircraft-related test standards, including RTCA DO-160G, SAE ARP 5412B, SAE ARP 5414B, and SAE ARP 5416A. Specifically, DO-160G [26] includes Chapter 22 “Lightning Induced Transient Susceptibility” and Chapter 23 “Lightning Direct Effects.” Chapter 22 tests are designed to simulate the transient voltage and current disturbances induced by lightning’s indirect effects on onboard cables. This is done by injecting different lightning pulse waveforms into the external interfaces of the equipment, assessing the equipment’s electromagnetic immunity to lightning strikes. Chapter 23 focuses on lightning’s direct effects, such as electrical heating and mechanical damage, typically applied to exposed structural components like radomes, connectors, and conductive rails. SAE ARP 5412B [27] defines the waveform simulation method for aircraft lightning environments and introduces typical lightning current waveforms, which include four major components representing different temporal characteristics of natural lightning, guiding the simulation of lightning strike excitation. SAE ARP 5414B [28] provides methods for partitioning the aircraft’s external surfaces to identify lightning strike exposure levels and potential attachment points. SAE ARP 5416A [29] specifies the test procedures and technical requirements for lightning effects testing, including lightning injection, verification, measurement, and evaluation. It is a crucial technical standard for testing both direct and indirect lightning effects.
This study will use the representative lightning waveforms, system protection requirements, and structural exposure partitions outlined in the above standards for simulation modeling and data analysis. The goal is to assess the electromagnetic response characteristics and cable coupling effects of typical eVTOL structures under lightning environments, providing theoretical and engineering foundations for lightning protection design of eVTOLs.
3. Simulation Model and Excitation Setup
3.1. Introduction to CST and Cable Studio
CST Studio Suite is a three-dimensional full-wave electromagnetic simulation software widely used in fields such as antenna design and electromagnetic compatibility (EMC) analysis. Its core feature is the integration of various electromagnetic solvers, including the Finite Integration Technique (FITT), Time Domain Finite Element Method (TDFEM), Transmission Line Matrix (TLM), electrostatic/magnetic field analyzers, and frequency domain solvers. CST enables electromagnetic modeling and analysis across the entire process from low to high frequencies, from static fields to transient behaviors. CST supports multi-physics coupling analysis through its modular structure, equipped with powerful modeling tools and optimization algorithms, allowing it to handle complex geometries and material properties.
In the eVTOL system lightning coupling modeling, CST Cable Studio, as a dedicated module within CST Studio Suite, is primarily used for simulating the coupling effects of complex cable networks under electromagnetic excitation. Cable Studio employs a hybrid modeling approach based on transmission line theory, capable of accurately modeling complex cable networks composed of shielded cables, unshielded cables, twisted pairs, connectors, and terminating loads. It combines external field sources (such as lightning, electromagnetic pulses) for induced voltage and current analysis. Cable Studio includes a variety of excitation sources (such as double-exponential pulses, waveform injection, and coupling source definitions) and frequency-domain/time-domain solvers, which can work directly with 3D simulation modules to achieve complete link modeling of field-to-port electrical responses. It is especially suitable for studying the transient interference characteristics of lightning’s indirect effects on onboard eVTOL equipment.
CST and its Cable Studio module provide a unified multi-scale modeling platform and efficient numerical solving methods for lightning effect analysis on eVTOLs, offering significant simulation support for studying electromagnetic coupling mechanisms and protection design.
3.2. eVTOL Model Setup
To carry out the analysis of coupling effects on the eVTOL under lightning environments, this study uses the AE200 electric vertical takeoff and landing (eVTOL) aircraft model developed by VoFly Changkong Company, as shown in Figure 6 [30]. Based on the external dimensions and structural features of the AE200 prototype, a simplified 3D model was created on the CST Studio Suite platform. The model retains the geometric features and major external parameters of the aircraft while simplifying the internal structure and some complex components to improve simulation efficiency and focus on the aircraft’s response characteristics to the electromagnetic field.
The model preserves the main external components, including the nose, wings, and vertical tail, while simplifying typical structures such as the cockpit (with transparent windows) and landing gear connection parts. The resulting model is shown in Figure 7 and Figure 8. The total length of the model is 11.76 meters, the wingspan is 17.22 meters, and the entire structure is modeled using conductive metal materials, facilitating subsequent lightning attachment simulations and cable coupling effect analysis.
3.3. Lightning Zoning
3.3.1. Introduction to Lightning Zoning
According to the SAE ARP 5414B standard, the aircraft surface is divided into three main zones based on the likelihood of lightning strikes and the conduction characteristics of the lightning current: Zone 1, Zone 2, and Zone 3. Zone 1 is the area most likely to experience the initial lightning strike and the first return stroke attachment. Zone 2 is the area that is not prone to initial lightning strikes but is more likely to experience secondary attachment during lightning sweeping. Zone 3 is less likely to experience direct lightning attachment but may serve as a current conduction path connecting different lightning strike points. Further, Zones 1 and 2 are subdivided based on the lightning attachment dwell time into sub-zones A, B, and C. As shown in Table 1, Zone 1A refers to the area with a short dwell time during the initial lightning attachment, Zone 1B has a longer dwell time during the initial attachment, and Zone 1C is where a smaller amplitude first return stroke may occur with a short dwell time. Zone 2A refers to areas with a short dwell time during lightning sweeping, while Zone 2B has a longer dwell time during sweeping.
Based on the SAE ARP 5414B standard, the typical lightning strike zoning for an aircraft places Zone 1A at the nose, wing tips, and the tip of the vertical tail. Zone 1B is typically located at the rear edge of Zone 1A, and Zone 1C is followed by the rear portion of the aircraft, which is typically designated as Zone 2A, with areas further behind falling into Zone 2B. Any regions that are less likely to experience lightning attachment are categorized into Zone 3.
3.3.2. Lightning Zoning Simulation
This section utilizes the lightning attachment zone classification and simulation methods outlined in standards such as SAE ARP 5416A to model and simulate the electric field distribution of the aircraft under different lightning strike scenarios. In actual flight conditions, there are two types of lightning strikes that the aircraft may experience: (1) when the aircraft traverses a natural lightning channel, cutting off the original channel and forming a bidirectional leader discharge process; and (2) the lightning leader process triggered by the aircraft itself. For these two scenarios, simulations are performed using rod-shaped and flat plate electrodes in CST’s low-frequency studio to model the electric field distribution characteristics.
- Flat Plate Electrode Model
To simulate the case where the aircraft itself triggers a lightning leader, a flat plate electrode model is used according to the recommendations of SAE ARP 5416A. The voltage on the upper flat plate is set to 3000 kV to simulate a thundercloud or strong electric field environment, and the lower plate is set to 0 V to simulate a grounded environment. The length and width of the plate are set to twice the maximum dimensions of the aircraft. The distance between the plate and the aircraft is set to 30 meters, ensuring the spacing is greater than 1.5 times the maximum size of the aircraft. The boundary condition is set to “Open Boundary,” and the model distribution diagram is shown in Figure 9.
The simulation results are shown in Figure 10. The warmer the color, the greater the electric field strength. The maximum electric field strength on the surface of the eVTOL is about 1.44×10⁶ V/m.
To more intuitively observe the relative strength distribution of the surface electric field, the electric field values are further expressed in logarithmic units (dB), as shown in Figure 11. It is clearly evident that the electric field strength on the nose, wing tips, top of the fuselage, and vertical tail surfaces is significantly higher than in other areas, indicating that these areas are more likely to become lightning attachment points.
- 2
- Rod-shaped Electrode Model
To simulate the scenario where the aircraft cuts off a natural lightning channel and forms a bidirectional leader, a rod-shaped electrode with a voltage of 3000 kV and a length of 1.5 meters is used in this section. The electrode is placed about 30 meters away from the aircraft, simulating the proximity of a natural lightning leader to the aircraft surface. The ground is also set to 0 V, and open boundary conditions are applied. The model distribution diagram is shown in Figure 12.
The simulation results are shown in Figure 13, where the maximum surface electric field strength reaches 2.76×10⁶ V/m, much higher than the result from the flat plate electrode model. This indicates a stronger electric field concentration during the natural lightning attachment process.
Similarly, the electric field distribution is expressed in dB values, as shown in Figure 14. The results show that both models exhibit consistent electric field distribution patterns, with significantly higher induced electric field strengths at the nose, leading edges of the wings, vertical tail, and top of the fuselage, indicating a higher probability of lightning attachment at these locations.
- 3
- Conclusion and Analysis
In summary, the results of both lightning strike simulation models indicate that the nose, wing tips, vertical tail, and other structures concentrate the electric field most intensely in the lightning environment, making them the most likely areas to experience lightning attachment. Therefore, in subsequent simulation studies, these typical lightning strike attachment areas will be selected as current injection points for in-depth analysis, further exploring their electromagnetic interference mechanisms and shielding optimization paths for onboard electronic systems.
3.4. Lightning Excitation Study
For the simulation study of lightning indirect effects, this research refers to the definition of typical lightning waveforms in SAE ARP 5412B. A typical lightning current component diagram is shown in Figure 15.
Descriptions of different lightning current components and their key parameters can be found in Table 2.
Lightning current waveforms are typically described using a double-exponential function (Double Exponential Function), with the mathematical expression as follows:
In the equation, is the current amplitude (unit: A); is the tail decay rate (unit: 1/s); and is the front rise time (unit: s).
Among the multiple lightning current components, Component A (First Return Stroke) has the most significant impact on aircraft and its electronic systems. To study the induced current effects of different lightning components on onboard cables, this paper selects representative Components A, C, and D for simulation modeling analysis, with their waveforms shown in Figure 16.
In the simulation setup, the nose section of the aircraft, as shown in Figure 17, is selected as the lightning current injection point.
Two typical cable bundles, including single-core cables and shielded cables, are laid along the same position inside the aircraft, as shown in Figure 18.
After constructing the 3D model, the 2D Modeling function in CST Cable Studio is used to model the cable layout. Then, external ports are inserted in the Schematic editor and connected to the lightning current injection port. In the excitation setup, corresponding excitation tasks are created based on the double-exponential function parameters of different lightning components. All cable ends are set with a matching resistance of 50 Ω, and current and voltage monitors, as well as ground points, are added. The final complete circuit diagram is shown in Figure 19. The simulation is then performed.
From the simulation results, the following conclusions can be drawn:
The induced current from Component A has the highest overall magnitude. In unshielded single-core cables, the peak induced current is approximately 93 A; in shielded cables, the maximum induced current in the core is approximately 0.78 A, while the induced current in the shield reaches 288 A.
Component C generates the smallest induced current. In unshielded single-core cables, the maximum induced current is only 0.3 A, in shielded cable cores it is 0.0029 A, and in the shield, the maximum induced current is 0.96 A. Compared to Component A, its effect is minimal and can be considered negligible.
The induced current from Component D is between Components A and C. In unshielded cables, the maximum induced current is about 28 A, in shielded cable cores it is 0.26 A, and in the shield, the maximum is 99.2 A. The current distribution pattern is similar to Component A, showing a clear coupling effect.
From the comprehensive analysis, it can be concluded that Component A has the most significant interference with the onboard cable system, making it the most influential lightning component; Component C has a much smaller coupling effect on the cables and can be neglected compared to Component A; Component D produces induced currents lower than Component A, and its current distribution patterns in the cable core and shield are highly consistent with Component A. Therefore, to unify the simulation conditions and focus on the most representative lightning excitation scenario, Component A is selected as the typical lightning excitation waveform for further analysis in subsequent studies.
The excitation waveform of Component A set in CST is shown in Figure 23, with a simulation time of 200 μs. The current reaches its peak at 6.4 μs and decays to half-peak at 69 μs.
3.5. Cable Setup
To study the coupling effects of lightning currents in different types of cables, three typical cable models were created in CST’s Cable Studio:
Unshielded Single-core Cable (4 mm diameter): This type of cable has a simple structure and is commonly used for general power or signal transmission scenarios with low shielding requirements. In strong electromagnetic environments, due to the lack of a shielding layer, it is easily affected by external lightning-induced fields.
Unshielded Twisted Pair Cable (2×2 mm): The twisted pair configuration reduces differential mode interference. Compared to single-core cables, it has better anti-interference capabilities and is widely used for differential signal transmission. However, without a shielding layer, it is still susceptible to common-mode lightning interference.
Shielded Cable (4 mm diameter): This type of cable has a metal shielding layer around the core, effectively suppressing the incident and leakage of electromagnetic waves. It has good electromagnetic compatibility in strong interference environments, such as lightning, and is commonly used in aircraft critical systems and high-anti-interference communication lines.
The geometric structure diagrams of the three cable models are shown in Figure 24, Figure 25 and Figure 26, and they will be used for the subsequent simulation study of induced current response under lightning component excitation.
The cables are arranged inside the aircraft, as shown in Figure 27.
4. Electromagnetic Response Analysis of the Aircraft Under Lightning
4.1. Modeling and Simulation of Different Lightning Strike Locations
In Section 3.3, the lightning zoning for eVTOL was introduced and analyzed in detail. Based on these zoning results, this section selects typical lightning strike locations: the nose, wing, and vertical tail, and simplified models of lightning strikes at these three locations are established in CST for subsequent lightning coupling effect simulation studies. The model diagrams for each excitation location are shown in Figure 28.
Since the lightning excitation reaches its peak current at 6.4 μs, surface current monitors and magnetic field monitors are set at this time point, as shown in Figure 29.
The boundary conditions for the simulation models are set to open boundaries to more accurately simulate the propagation characteristics of lightning electromagnetic waves in free space. The simulations are then performed.
4.2. Aircraft Electromagnetic Response Analysis
According to the previous setup, the simulation results are shown in Table 3:
To more intuitively display the electric field distribution characteristics at different lightning strike locations, the surface electric field from the simulation results is expressed in logarithmic units (dB). The visualization results are shown in Figure 30, Figure 31 and Figure 32.
From the above results, it can be concluded:
When the lightning strike occurs at the nose, the surface current distribution is more widespread, with the strongest electric field concentrated in the front and middle cabin sections as well as the wing area. The closer the cabin is to the lightning strike point, the stronger the electric field; the wing tips exhibit a stronger electric field compared to the rest of the wing.
When the lightning strike occurs at the wing, the surface current distribution is more localized, with the strong electric field primarily concentrated over the entire wing, and the wing tips show a stronger electric field.
When the lightning strike occurs at the vertical tail, the high electric field intensity is mainly concentrated on the vertical tail structure, especially the area at the lightning strike point. At the same time, the wing area of the aircraft also experiences some electric field enhancement, mainly around the wing tips.
Overall, the lightning strike at the nose produces the most widely distributed electric field, while the lightning strike at the wing exhibits the most concentrated electric field distribution. This is also reflected in the corresponding maximum surface electric field strength, as a more concentrated electric field distribution generally results in a higher maximum electric field strength. Additionally, because lightning strikes at the nose generate stronger electromagnetic coupling effects within the cabin, and cables and onboard equipment are typically arranged inside the cabin, from the perspective of electric field distribution, a strike at the nose will have a more significant impact on internal cables and onboard equipment.
Next, we will show the magnetic field distribution characteristics under different lightning strike locations, also expressed in logarithmic units (dB). The visualization results are shown in Figure 33, Figure 34 and Figure 35.
From the simulation results, it can be seen that the magnetic field distribution characteristics generally follow the same pattern as the electric field. In the case of a lightning strike at the nose, the overall magnetic field response of the aircraft is the most significant. After the lightning current is injected at the nose, it widely spreads along the aircraft structure, causing a significant increase in magnetic field strength in the front and middle cabin sections as well as the wing area. The high magnetic field region has a relatively wide coverage. In contrast, lightning strikes at the wing and vertical tail, while showing stronger magnetic field strength in localized areas, have a more concentrated influence.
From the comprehensive analysis, since onboard cables and equipment are mainly arranged inside the cabin, lightning strikes at the nose produce not only a high electric field distribution within the cabin but also a strong magnetic field response. In comparison, lightning strikes at the wing and vertical tail have more localized electric and magnetic field effects. Therefore, the subsequent simulation analysis will use the nose strike as the representative scenario to further study its electromagnetic coupling effects on onboard cables.
5. Cable Coupling Effect Analysis Based on Orthogonal Experiment
5.1. Introduction to the DOE Method
DOE (Design of Experiments) is a systematic experimental method used to establish the relationship between influencing factors and response variables by rationally organizing experimental plans, while controlling variables and resources. Its core goal is to obtain as much useful information as possible with as few experimental trials as possible, improving experimental efficiency, optimizing system performance, and identifying key factors.
5.2. L9(33) Orthogonal Experiment Design
In this study, the DOE method is used to analyze the influence of different cable arrangement parameters (length, cable structure, wiring method) on induced current response under lightning coupling effects, primarily analyzing the maximum induced current occurring on the cable core. The L9(33) orthogonal experiment design is employed, with the first 9 sets as representative experimental plans, covering 3 levels for each factor. Additionally, to further analyze the independent effect of wiring method on induced current, two control test groups (Test 10 and 11) are added, with Test 1 forming the supplementary experimental group where wiring method is the only variable.
The levels for each factor are set as follows:Cable Length: 1 m, 2 m, 3 m.
Wiring Method: Free-hanging wiring, Wall wiring, Zigzag wall wiring.
Cable Structure: Unshielded Single Wire (4 mm diameter), Unshielded Twisted Pair (2×2 mm), Shielded Cable (4 mm diameter).
The experimental design is shown in the table below:

Table 4.
L9(33) Orthogonal Experiment Plan for Cable Lightning Coupling Effects.
| Experiment Number | Cable Length | Wiring Method | Cable Structure |
| 1 | 1 m | Wall wiring | Unshielded Single Wire |
| 2 | 1 m | Free-hanging wiring | Unshielded Twisted Pair |
| 3 | 1 m | Zigzag wall wiring | Shielded Cable |
| 4 | 2.m | Wall wiring | Unshielded Twisted Pair |
| 5 | 2.m | Free-hanging wiring | Shielded Cable |
| 6 | 2.m | Zigzag wall wiring | Unshielded Single Wire |
| 7 | 3.m | Wall wiring | Shielded Cable |
| 8 | 3.m | Free-hanging wiring | Unshielded Single Wire |
| 9 | 3.m | Zigzag wall wiring | Unshielded Twisted Pair |
| 10 | 1 m | Free-hanging wiring | Unshielded Single Wire |
| 11 | 1 m | Zigzag wall wiring | Unshielded Single Wire |
5.3. Analysis of Experimental Results
Based on the experimental design mentioned above, after completing the 11 experimental simulations, the maximum induced current response results for each cable arrangement were compiled. The statistical table is shown in Table 5. For ease of subsequent analysis, the table records the maximum induced current magnitude for each group of experiments, both in the cable core and in the shielding layer (if present).
From the data above, it can be seen that the induced current in the conductor core varies significantly under different experimental conditions, indicating that experimental factors have a substantial impact on lightning coupling responses. The following analysis will explore the influence of the three main factors on the induced current to further identify the dominant factors and their behavior.
- Cable Structure
From the results of experiments 1–9, it is evident that the cable structure has the most significant impact on the induced current among the three factors. The results for different cable structures are summarized in Figure 36.
Among these, cables with a shielded structure (Experiments 3, 5, and 7) show very low induced current in the conductor core, ranging from 1.05 to 1.35 A, but the induced current in the shielding layer is as high as 257–374.58 A. This indicates that most of the coupling current is absorbed by the shielding layer, significantly reducing the interference exposure of the conductor core and effectively providing protection through the shielding structure.
In contrast, unshielded single-core cables show a significantly higher induced current in the conductor core, ranging from 110 to 197.61 A (Experiments 1, 6, and 8), and exhibit the weakest anti-interference capability.
Unshielded twisted pair cables exhibit intermediate performance in terms of induced current. The conductor core induced current in Experiment 2 is 66.75 A, while the maximum induced current in Experiments 4 and 9 is 97.67 A and 106.22 A, respectively. This suggests that the twisted pair structure has certain mutual coupling characteristics, and the twisted structure helps reduce the loop area, providing some suppression of the induced interference, but still not as effectively as the shielded structure.
In conclusion, the ranking of lightning coupling resistance for different cable structures is as follows: Shielded Cable > Unshielded Twisted Pair Cable > Unshielded Single-core Cable. Therefore, to improve system electromagnetic compatibility in lightning electromagnetic environments, shielded cables should be prioritized. In applications where shielded cables cannot be used, multi-core twisted pair cables should be considered. Non-shielded single-core cables should be avoided, especially in areas close to lightning strike zones or regions with severe electromagnetic leakage.
- 2
- Cable Length
In general, the longer the cable, the higher the induced voltage it intercepts in the lightning induction field, resulting in higher induced current. The simulation results of this study confirm this trend. In the results of Experiments 1–9, the average maximum induced current for cables of different lengths was calculated, and Figure 37 was generated.
For the 1 m cable, the average conductor current is about 59.4 A; for the 2 m cable, it increases to about 95.7 A; and for the 3 m cable, it further rises to about 101.7 A. This trend is also further confirmed by the simulation currents for both unshielded single-core and unshielded twisted pair cables.
Figure 38.
Induced Current for Different Lengths of Unshielded Single-core Cable.
As seen from the experimental results, as the length of the unshielded single-core cable increases, the maximum induced current shows an increasing trend: 110.19 A for 1 m (Experiment 1), 194.27 A for 2 m (Experiment 6), and 197.61 A for 3 m (Experiment 8). The induced current distribution also increases with cable length. At 1 m, the induced current is the smallest, while at 2 m and 3 m, the differences are not significant due to the wiring structure, though the induced current at 3 m is slightly larger than at 2 m.
Figure 39.
Induced Current for Different Lengths of Unshielded Twisted Pair Cable.
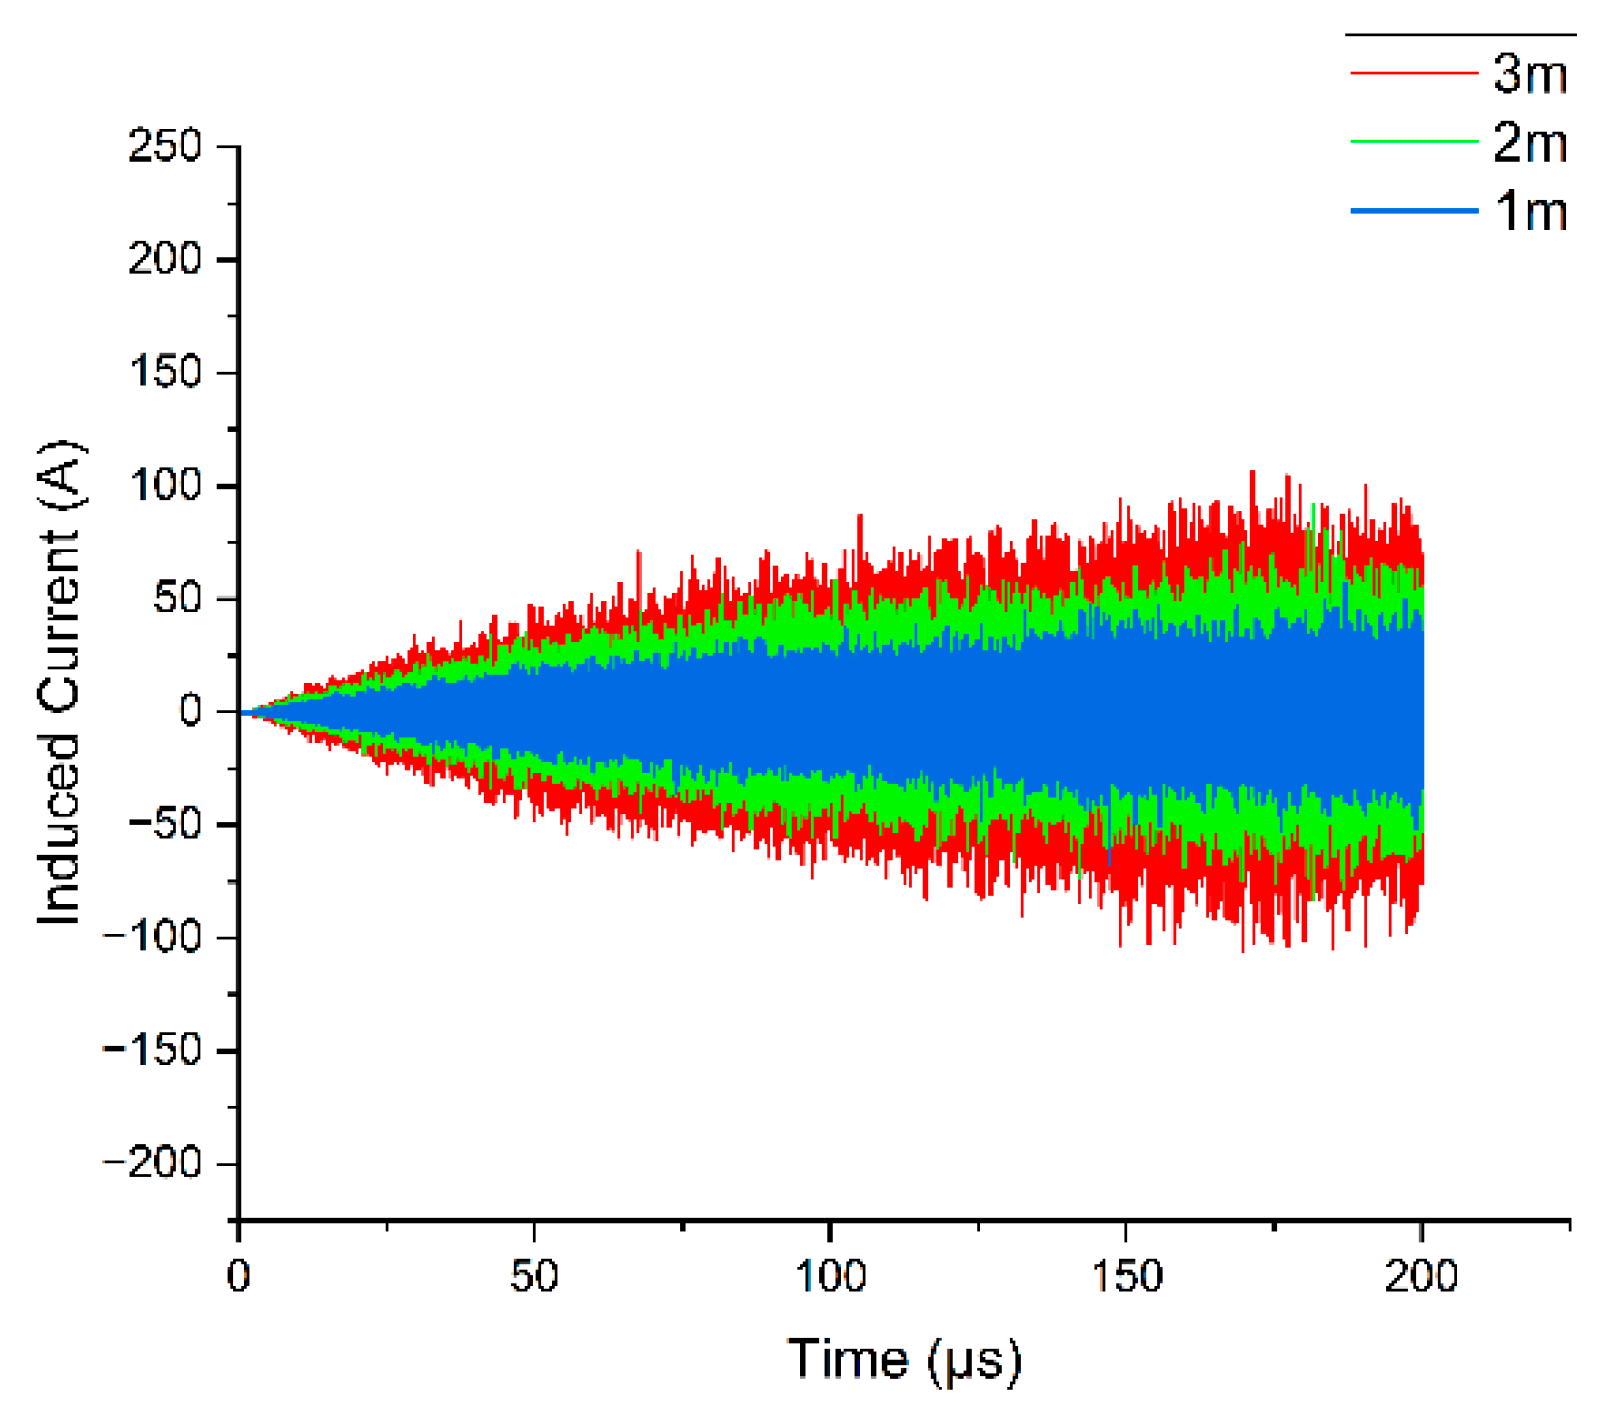
The same trend is observed with unshielded twisted pair cables. For 1 m (Experiment 2), the induced current is the smallest, with 2 m (Experiment 4) showing a current value between 1 m and 3 m, while 3 m (Experiment 9) shows the highest induced current value.
Thus, in lightning high-electromagnetic exposure areas, it is advisable to minimize the length of critical cables or choose more concentrated wiring schemes while ensuring system functionality. For applications where long cables are necessary, it is recommended to use shielding measures to enhance protection.
- 3
- Wiring Method
Compared to cable structure and length, the wiring method has the least impact on the maximum induced current. To study this factor more precisely, additional experiments 10 and 11 were set up and compared with Experiment 1 (all 1 m unshielded single-core cables). The results show that in Experiment 1 (wall wiring), the maximum current is 110.19 A; in Experiment 10 (free-hanging wiring), it is 93.86 A; and in Experiment 11 (Zigzag wall wiring), it is 183.46 A, as shown in Figure 40.
The results show that, under the same conditions, Zigzag wall wiring produces the highest induced current, followed by wall wiring, and free-hanging wiring produces the lowest induced current.
In conclusion, in lightning protection design, Zigzag wall wiring should be avoided as it produces the highest induced current under the same conditions and may result in more severe coupling effects. This complex wiring not only increases the total length of cables but may also expand their effective exposure area in space, which is unfavorable for improving electromagnetic compatibility. Free-hanging wiring should be prioritized, as it effectively reduces the coupling intensity of lightning-induced current while meeting system wiring requirements. Conventional wall wiring serves as an intermediate option. Ultimately, the cable path should be simplified, and the exposure area reduced based on the actual platform structure characteristics to improve the system’s protection against lightning indirect effects.
6. Conclusion
This study, set against the background of the lightning indirect effects on eVTOL, conducts modeling and simulation analyses around three aspects: lightning zoning, excitation comparison, and aircraft response and cable coupling effects. The main conclusions are as follows:
Lightning Zoning Analysis: Based on the SAE ARP 5414B standard, key lightning strike regions such as the nose, wings, and vertical tail were identified, providing spatial references for subsequent electromagnetic response simulations.
Excitation Comparison: Based on SAE ARP 5412B, three typical lightning components were compared in terms of their induced current effects on onboard cables. Component A, with representative waveform characteristics, was selected due to its significant impact.
Aircraft Electromagnetic Response Analysis: The results show that in the case of lightning strikes at the nose, the distribution range of the aircraft’s electric and magnetic fields is the widest, with a complex coupling path, and the most significant impact on the interior of the cabin.
Cable Coupling Experiment Analysis: Based on the L9(33) orthogonal design, the effects of different factors on induced currents were clarified:
- Cable Structure: Shielded cables provide the best protection, followed by unshielded twisted pair cables, and lastly unshielded single-core cables. Shielded cables significantly reduce induced current in the conductor core, offering a clear protective effect. They are the preferred structure for improving lightning resistance.
- Cable Length: Induced current is positively correlated with cable length, meaning longer cables generate higher induced current in lightning environments. It is recommended to minimize the length of critical cables.
- Wiring Method: The wiring method also affects induced current, with free-hanging wiring being superior to both Zigzag wall wiring and wall wiring. It is recommended to prioritize free-hanging wiring in the design.
The results of this study provide important references for lightning protection planning and wiring strategies in the early design phase of eVTOL systems.
Author Contributions
Conceptualization, Hangyu Chen; methodology, Hangyu Chen; software, Hangyu Chen; validation, Chao Zhou; formal analysis, Yifang Tan; investigation, Yizhi Shen; resources, Xin Li; data curation, Hangyu Chen; writing—original draft preparation, Hangyu Chen; writing—review and editing, Xin Li; visualization, Chao Zhou; supervision, Xin Li; project administration, Xin Li; funding acquisition, Xin Li. All authors have read and agreed to the published version of the manuscript.
Funding
This research was funded by Research on the Influence of High-Speed Railway Pantograph–Catenary Arc on the Flight Safety of eVTOL at Emerging Urban Integrated Transportation Hubs (F2024KF17D), Mechanism Analysis of Electromagnetic Interference Effects from High-Speed Railway Pantograph–Catenary Arcs on Navigation and Positioning Systems of Low-Altitude UAVs (25CAFUC04008), Multi-Objective Intelligent Optimization of Task Execution Strategies for UAV-Based Interference Source Detection (24CAFUC03021), Research on the Impact of High-Speed Railway Pantograph–Catenary Arc on the Flight Safety of Low-Altitude Unmanned Aerial Vehicles (2025UASKLSP02), Construction of a University–Industry Collaborative Talent Training Base for Cultivating New-Type Aviation Talents with Civil Aviation Characteristics (MHJY2025009), Study on HIRF Coupling Effects on Airborne Equipment of eVTOL (GY2024-63E), The Innovation and Entrepreneurship Training Program for Students of Civil Aviation University of China (S202410624146), The Innovation and Entrepreneurship Training Program for Students of Civil Aviation University of China (S202410624141).
Institutional Review Board Statement
Not applicable.
Informed Consent Statement
Not applicable.
Data Availability Statement
The data that support the findings of this research are available from the author, H.C., upon reasonable request.
Conflicts of Interest
The authors declare no conflicts of interest.
References
- Lu, J. (2022). Simulation and Experimental Research on Aircraft Lightning Effects (Master’s thesis, Nanjing University of Aeronautics and Astronautics). Master’s. https://link.cnki.net/doi/10.27239/d.cnki.gnhhu.2022.001327. [CrossRef]
- Ding, D. (2022). Research on Lightning Indirect Effects of Aircraft Cables Based on Multivariable Coupling (Master’s thesis, Civil Aviation University of China). Master’s. https://link.cnki.net/doi/10.27627/d.cnki.gzmhy.2022.000714. [CrossRef]
- Wang, M. (2017). Study on Lightning Damage Characteristics of Aircraft Carbon Fiber Composite Laminates (Master’s thesis, Hefei University of Technology). Master’s. https://kns.cnki.net/kcms2/article/abstract?v=9IId9Ku_yBYkkC5LghhectgUNAMnHQb5MAfQVub8c6yfyUtBCrOmjdZng5NbQXEgIs7Z7XLhllQsmRT8JPukduHAw_8CKb3eA4UGHDqCPkstsuojmkrhWUI6KrgI5zStUfWrRfnmFqOeIu8bSiFUpK-9p6lum0djMZT3Ka8GaDmtL2P577HnVg==&uniplatform=NZKPT&language=CHS.
- Alkasi, U. (2023). Analysis and Comparison of Lightning Indirect Effects in Aluminum, Composite Fiber Reinforced Plastic and Expanded Copper Foil embedded CFRP Aircraft with EMA3D. 2023 7th International Electromagnetic Compatibility Conference (EMC Turkiye), 1-8. [CrossRef]
- Zou, D., Qiang, H., Xi, C., & Sun, H. (2024). Indirect Effects Simulation of Lightning on Military Aircraft Based on EMA3D. 2024 IEEE International Conference on Computational Electromagnetics (ICCEM), 1-3. [CrossRef]
- Yang Z, Wei Y, Shi X. Analysis of Cable Shielding and Influencing Factors for Indirect Effects of Lightning on Aircraft. Aerospace. 2024; 11(8):674. [CrossRef]
- Aguilera, P., Lair, C., Issac, F., Michielsen, B., Hélier, M., & Darces, M. (2016). Simulation of indirect effects of lightning on an aircraft engine. 2016 IEEE International Symposium on Electromagnetic Compatibility (EMC), 293-297. [CrossRef]
- Yi-Cheng Qiu. Numerical Simulation Methods for Aircraft Exposed to Lightning Strikes[J]. Acta Aeronautica et Astronautica Sinica. [CrossRef]
- Nie, Y. (2023). Simulation Study on Aircraft Lightning Zoning and the Influence of Lightning Diverter Strips (Master’s thesis, Nanjing University of Science and Technology). Master’s. https://link.cnki.net/doi/10.27241/d.cnki.gnjgu.2023.002038. [CrossRef]
- Wang, Y. (2023). Research on the Coupling of High-Power Electromagnetic Pulses to Multi-Conductor Transmission Lines (Master’s thesis, Yan’an University). Master’s. https://link.cnki.net/doi/10.27438/d.cnki.gyadu.2023.000658. [CrossRef]
- Bu, H. (2022). Research on Aircraft Electromagnetic Effects under Lightning Environment (Master’s thesis, Xidian University). Master’s. https://link.cnki.net/doi/10.27389/d.cnki.gxadu.2022.003683. [CrossRef]
- D. P. Johns, “Development of the TLM method for EMC/EMI analysis,” 2010 URSI International Symposium on Electromagnetic Theory, Berlin, Germany, 2010, pp. 279-282. [CrossRef]
- Huang, J. (2016). Simulation and Research on Lightning Indirect Effects on Aircraft (Master’s thesis, Southwest Jiaotong University). Master’s. https://kns.cnki.net/kcms2/article/abstract?v=9IId9Ku_yBalkJc4qeihi68__thDp0J8BWiV8107YxedS_QAJ5RAS4z1UFWMpe5urXxnmrTpoKz0QaWWo3o6nHgszuPZX8eyqqRN3ittOOpj13ly2UNpC2zpjm9NU8e4uR75EOhF3mMrxNrUWKeQLQKLZYZtUq2lcWGuE8J2wNLsZNH2tdsiSw==&uniplatform=NZKPT&language=CHS.
- Gen, Y. (2010). Expression of Lightning Electromagnetic Field. Journal of Yunnan Normal University.
- Zhang, P., He, W., Wang, L., & L. (2013). Analysis on Lightning Electromagnetic Fields. Applied Mechanics and Materials, 401-403, 350 - 353. [CrossRef]
- Rakov, V. (2016). Electromagnetic methods of lightning location. 161-177. [CrossRef]
- European Union Aviation Safety Agency SPECIAL CONDITION Vertical Take-Off and Landing (VTOL) No: SC-VTOL-01, 2 July 2019.
- European Union Aviation Safety Agency Fourth Publication of Proposed Means of Compliance with the Special Condition VTOL,No: MOC-4 SC-VTOL, 18 December 2023.
- Federal Aviation Administration Advisory Circular AC No: 21.17-4, June 13, 2024.
- Federal Aviation Administration Statement on eVTOL Aircraft Certification Monday, June 10, 2024.
- Interim Regulations on the Flight Management of Unmanned Aerial Vehicles. Gazette of the State Council of the People’s Republic of China, 2023, (20):6-16.
- Rules for the Operational Safety Management of Civil Unmanned Aerial Vehicles. Gazette of the State Council of the People’s Republic of China, 2024, (09):35-84.
- Special Conditions for EHang EH216-S Unmanned Aerial Vehicle System SC-21-002, 2022-02-09.
- Special Conditions for Autoflight V2000CG Unmanned Aerial Vehicle System SC-21-004, 2023-11-12.
- Draft Special Conditions for Aerofugia AE200-100 Electric Vertical Take-Off and Landing Aircraft for Consultation, 2023-12-01.
- RTCA DO-160G Environment condition and test procedures for airborne equipment[S]. Special. 135(SC-135) and approved by the RTCA Program management committee (PMC), 12-2010.
- SAE Aerospace. SAE ARP5412B. Aircraft Lightning Environment and Related Test Waveforms [S]. USA: Society of Automotive Engineers, 2013.
- SAE Aerospace. SAE ARP5416A. Aircraft Lightning Zone [S]. USA: Society of Automotive Engineers, 2018.
- SAE Aerospace. SAE ARP5416A. Aircraft Lightning Test Methods [S]. USA: Society of Automotive Engineers, 2013.
- Aerofugia. (2023). AE200Y airworthiness configuration prototype [Image]. Source: China Civil Aviation New China Civil Aviation Network.
Figure 1.
Lumped Parameter Model of Transmission Line.
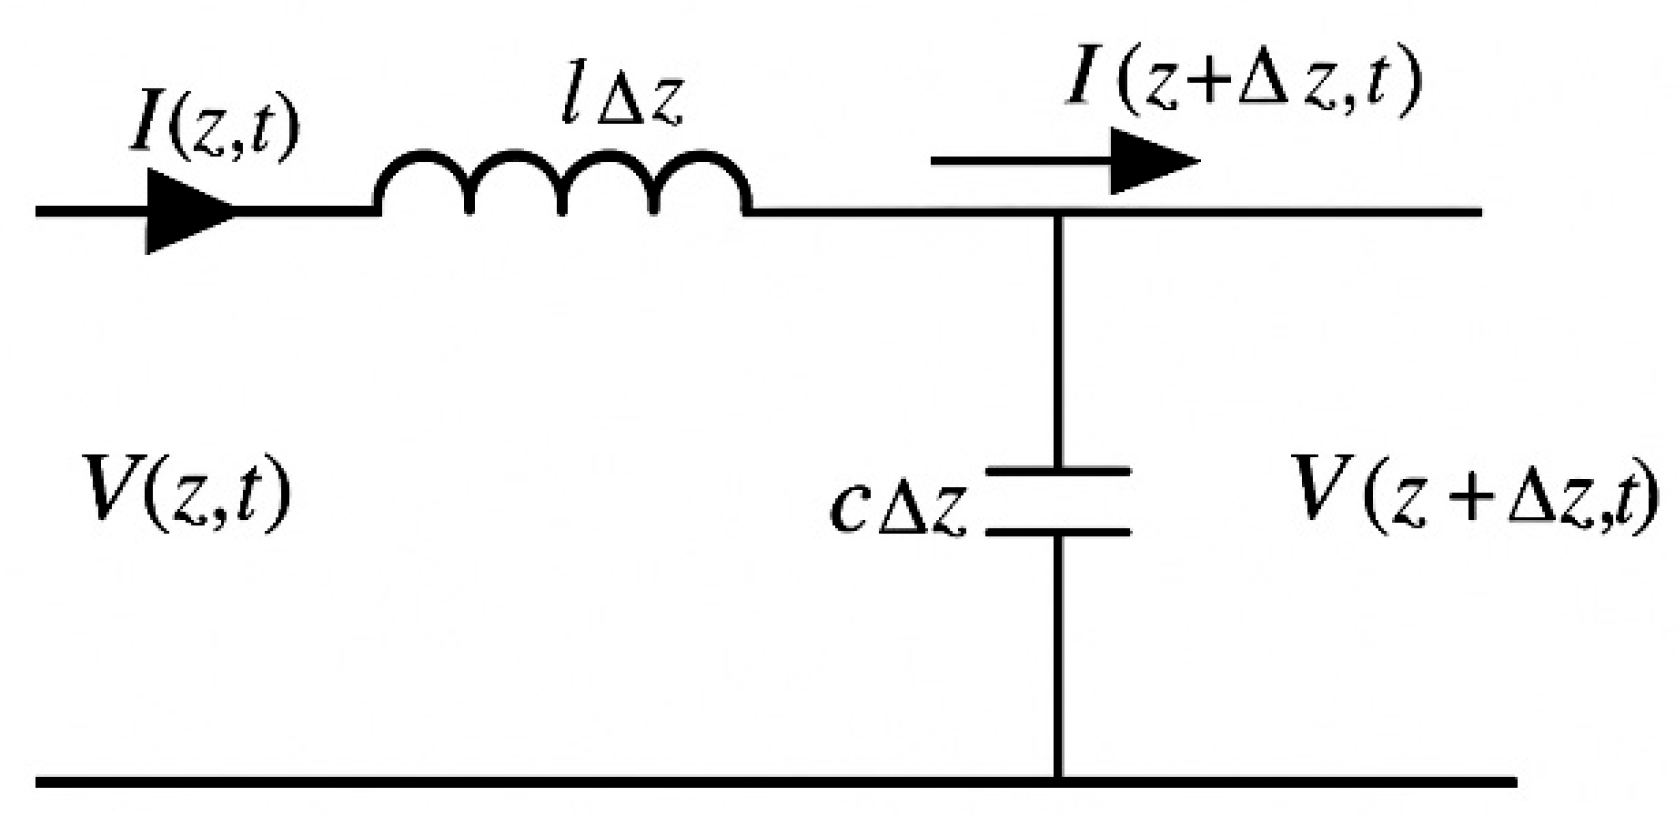
Figure 2.
Illustration of Symmetrical Condensed Node Model.
Figure 6.
AE200 Prototype.
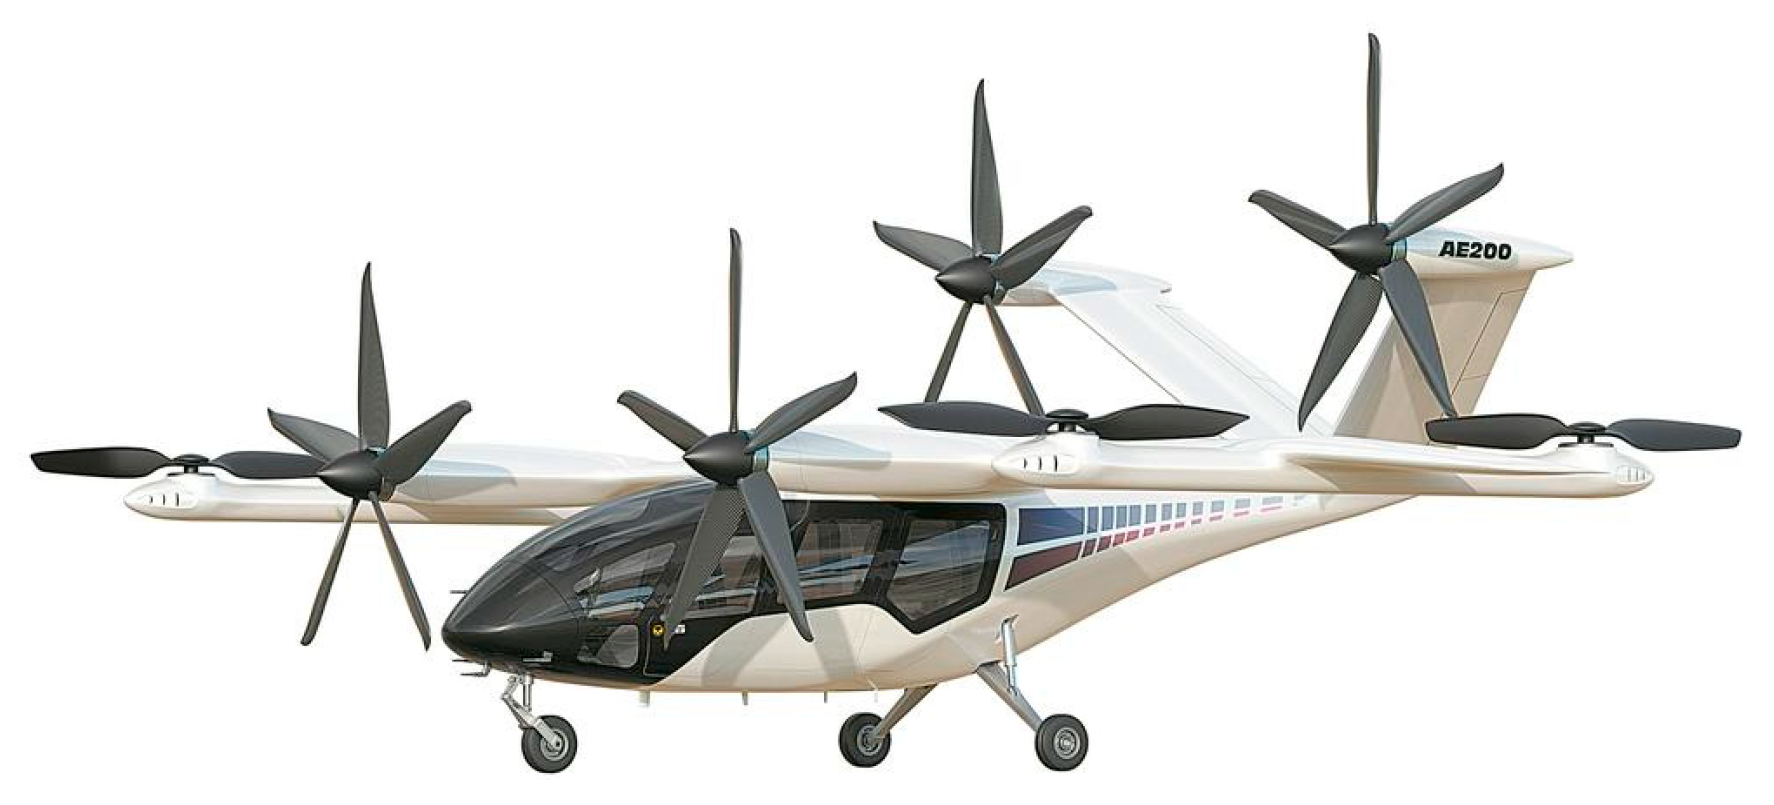
Figure 7.
eVTOL Model Schematic.
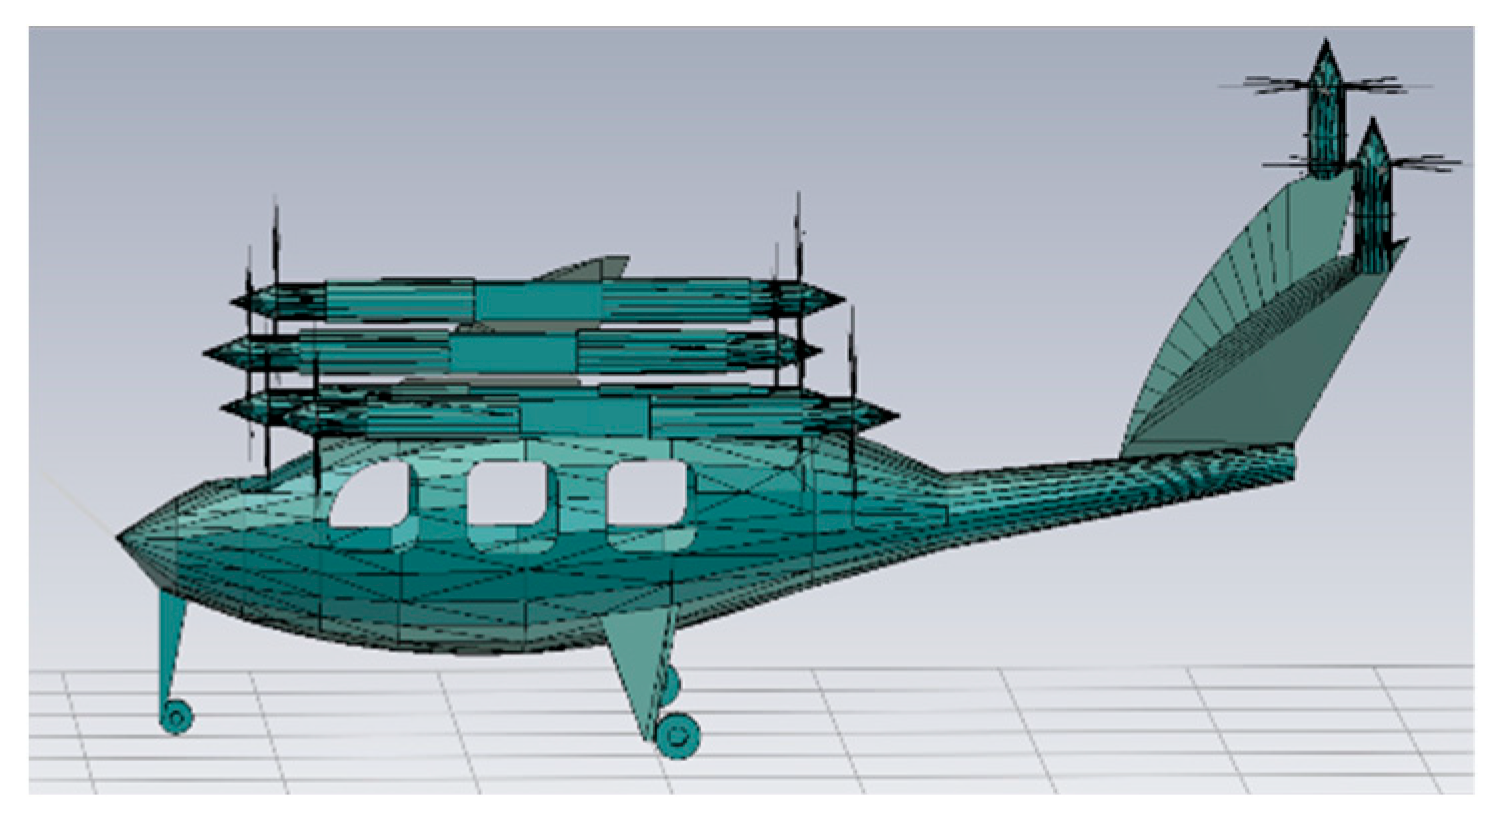
Figure 8.
eVTOL Model Dimensions Schematic.
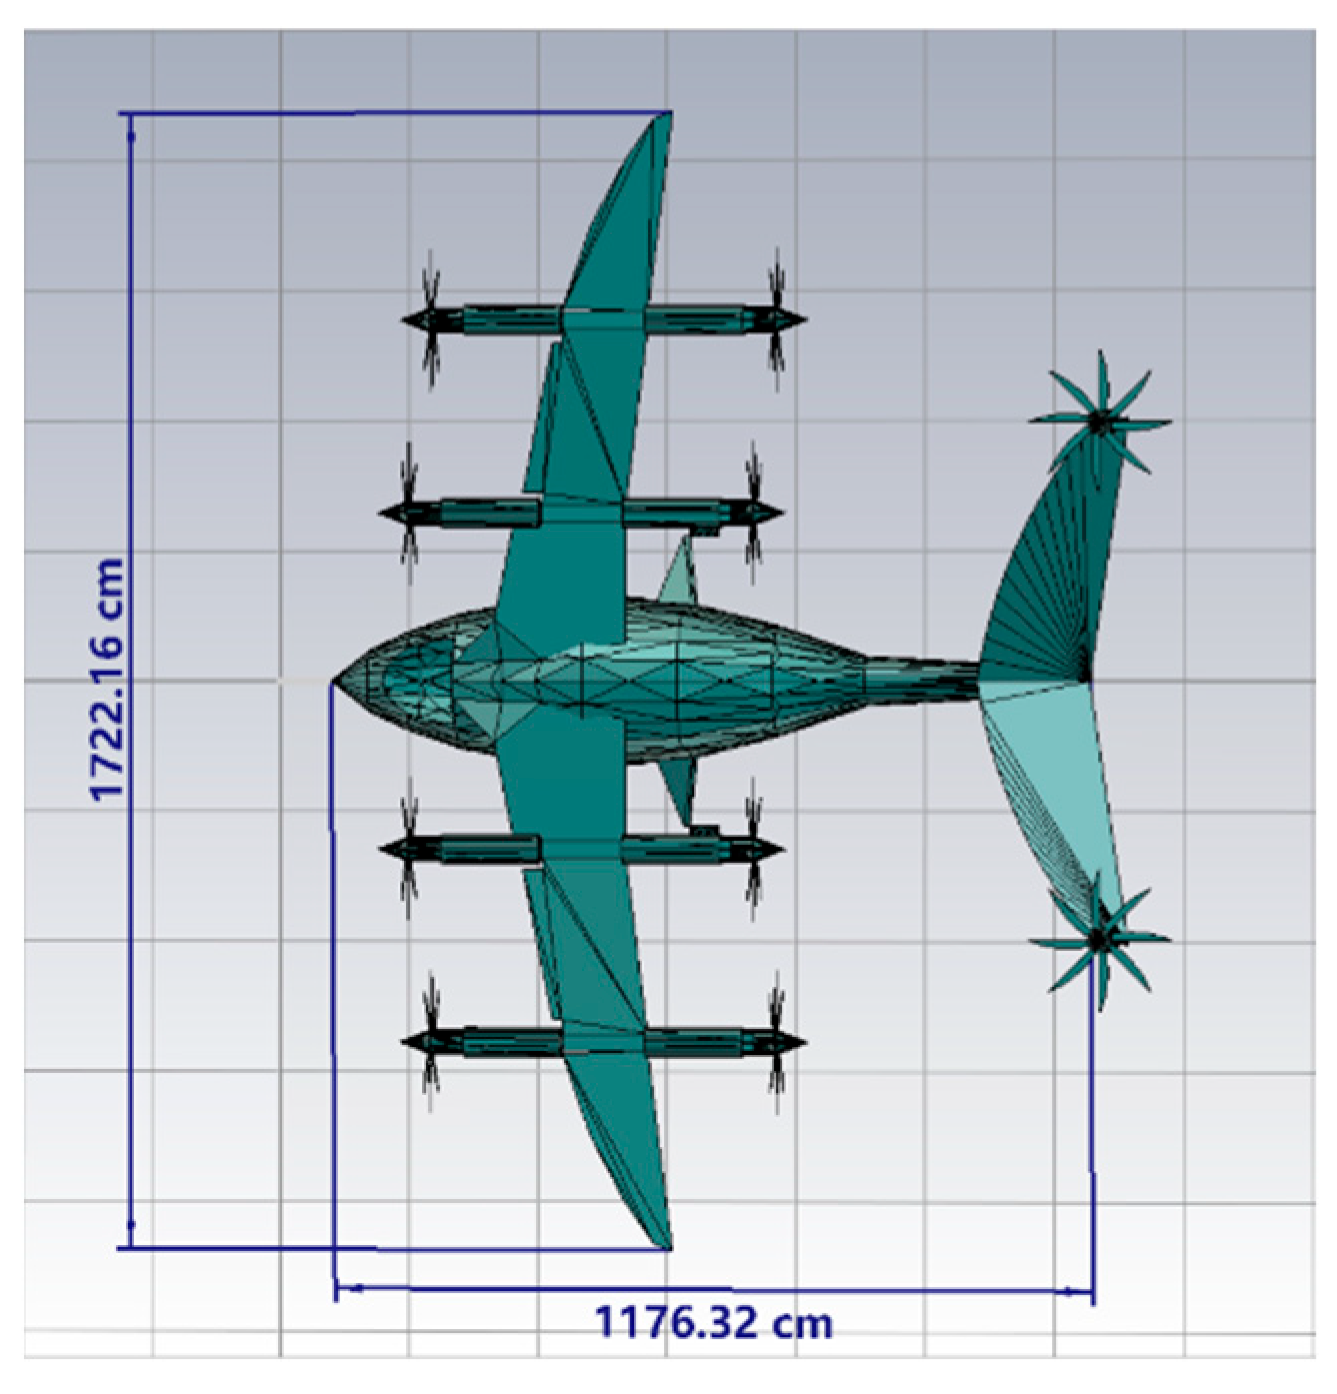
Figure 9.
Flat Plate Electrode Simulation Model Distribution.
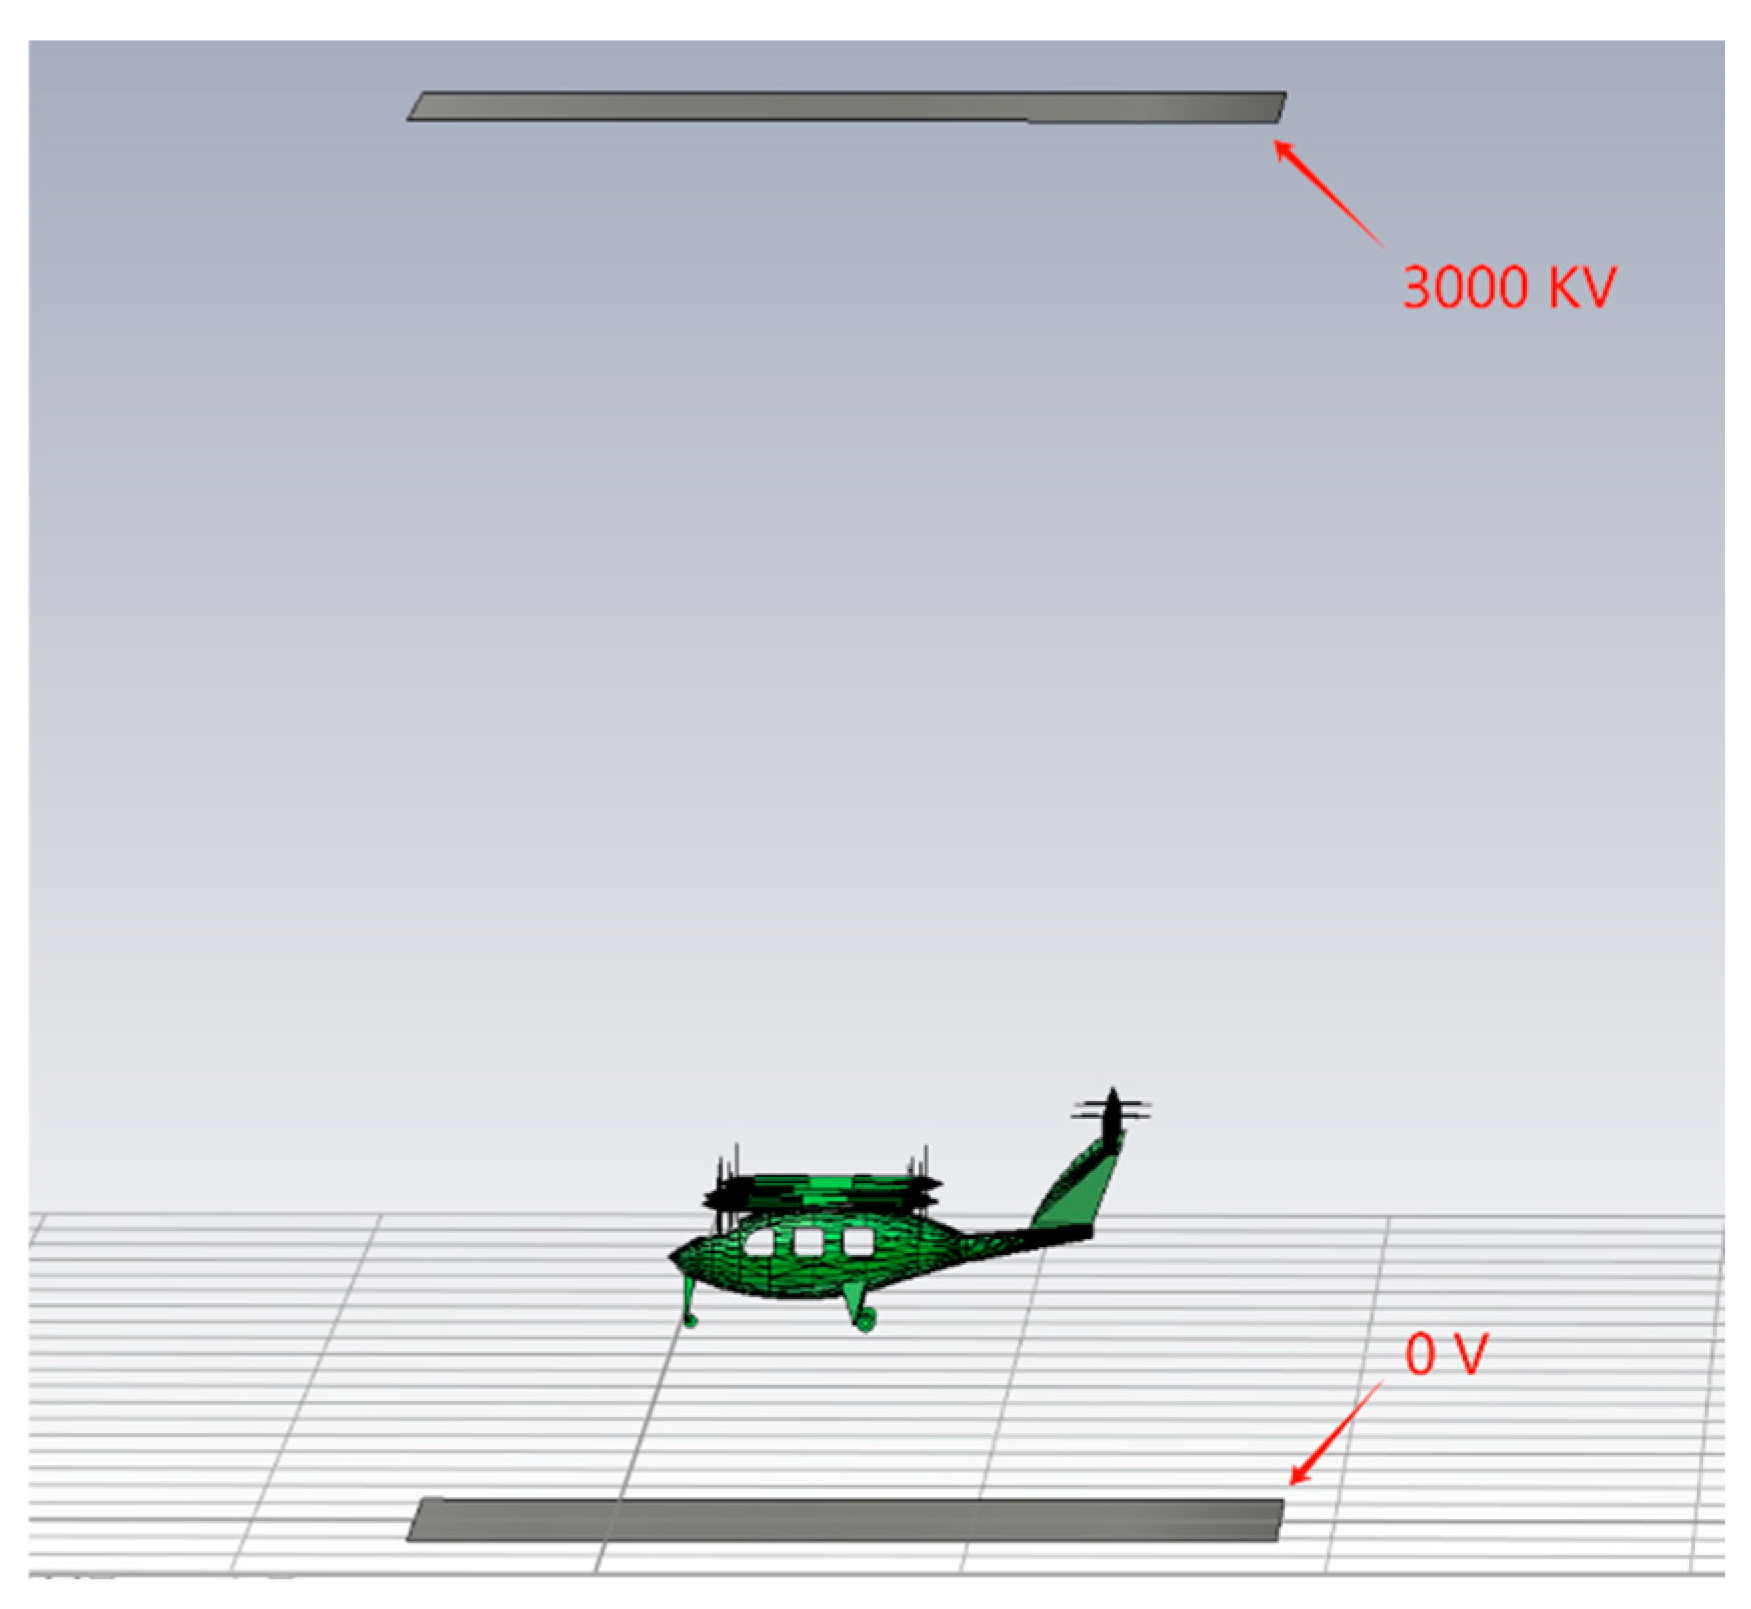
Figure 10.
Surface Electric Field Distribution During Lightning Leader Simulation.
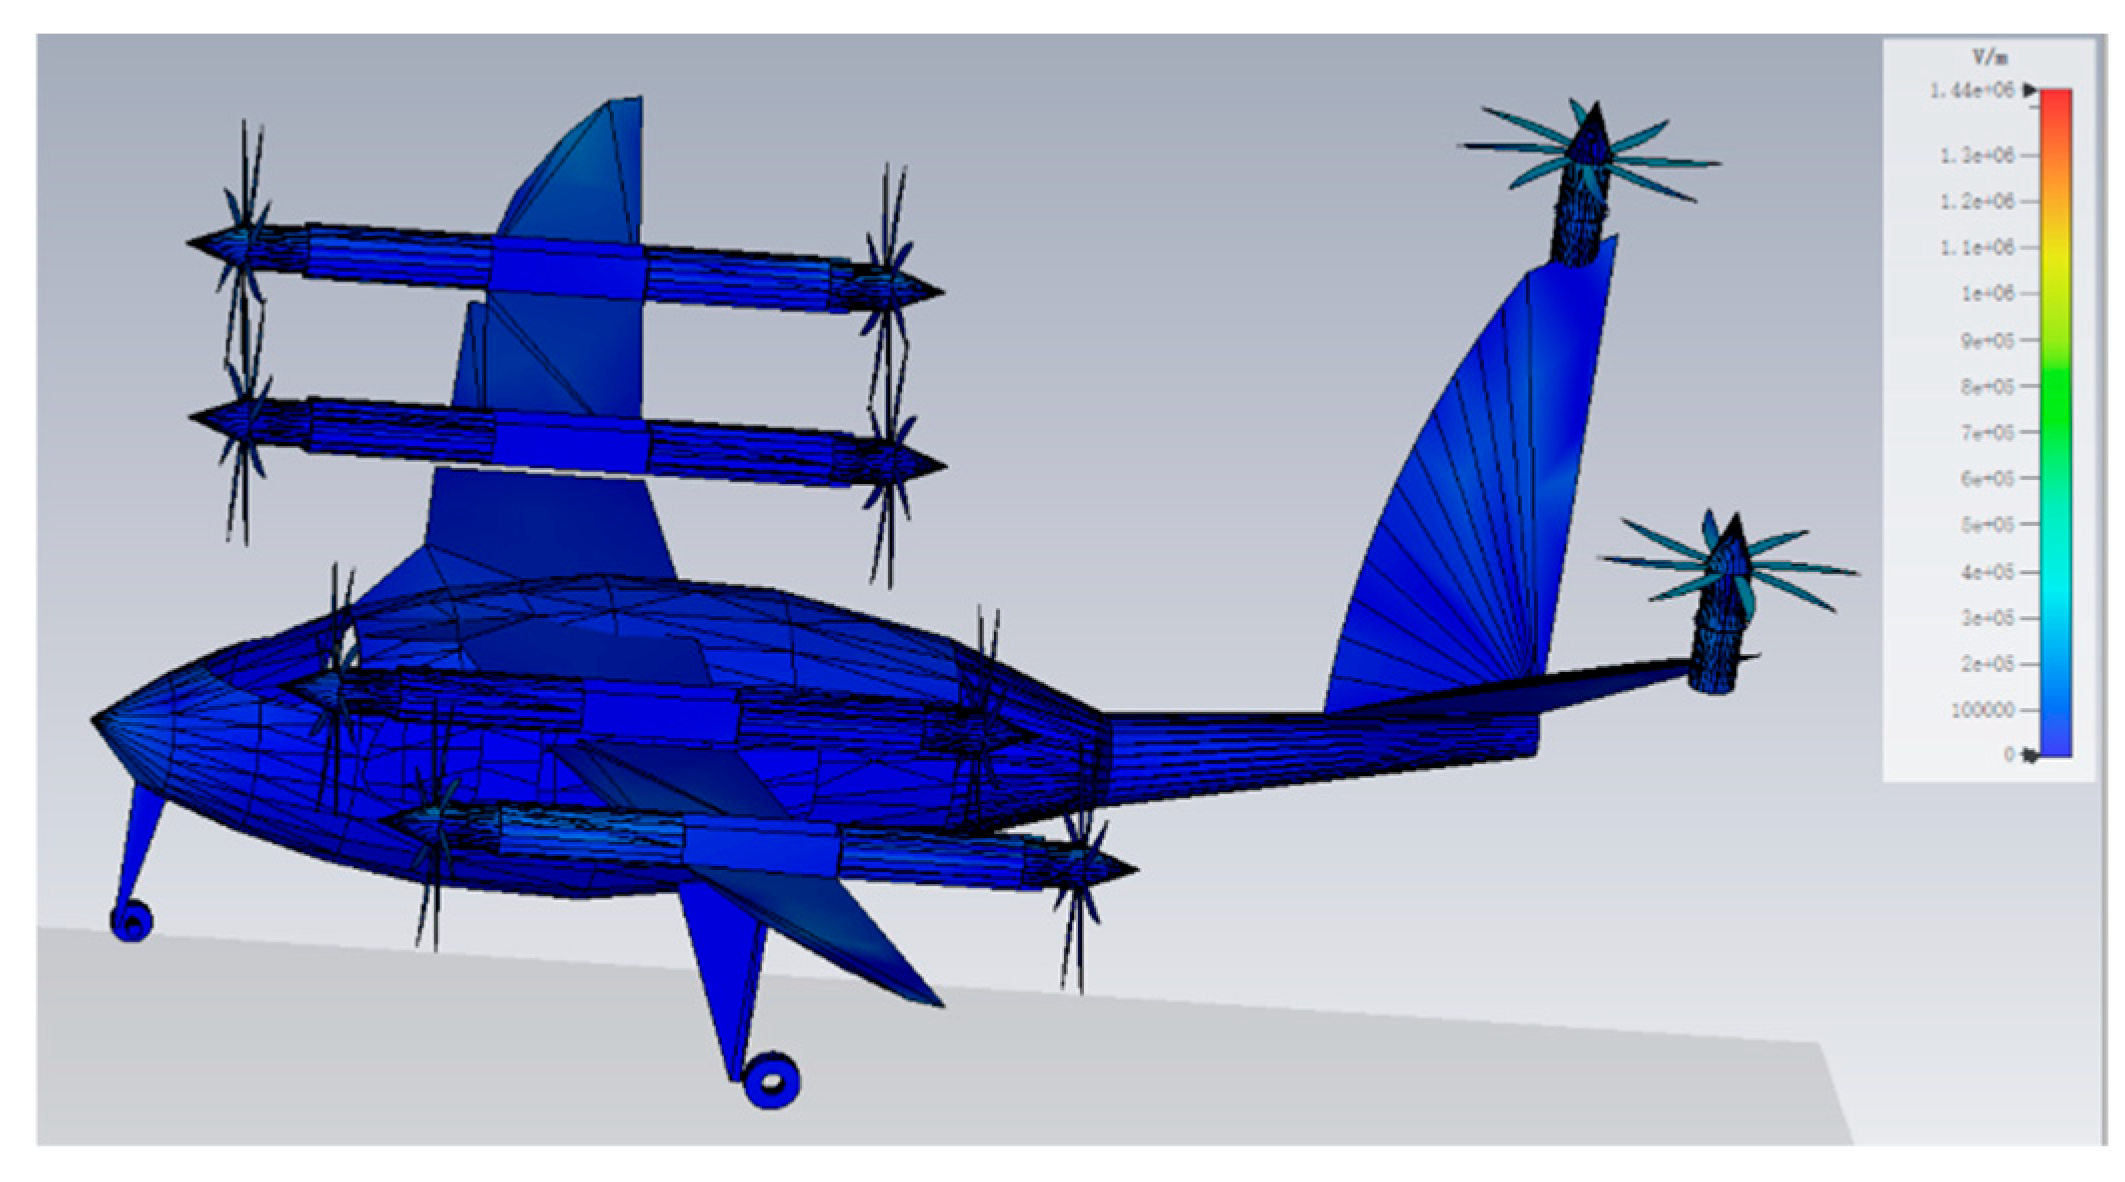
Figure 11.
Surface Electric Field Distribution During Lightning Leader Simulation (dB).
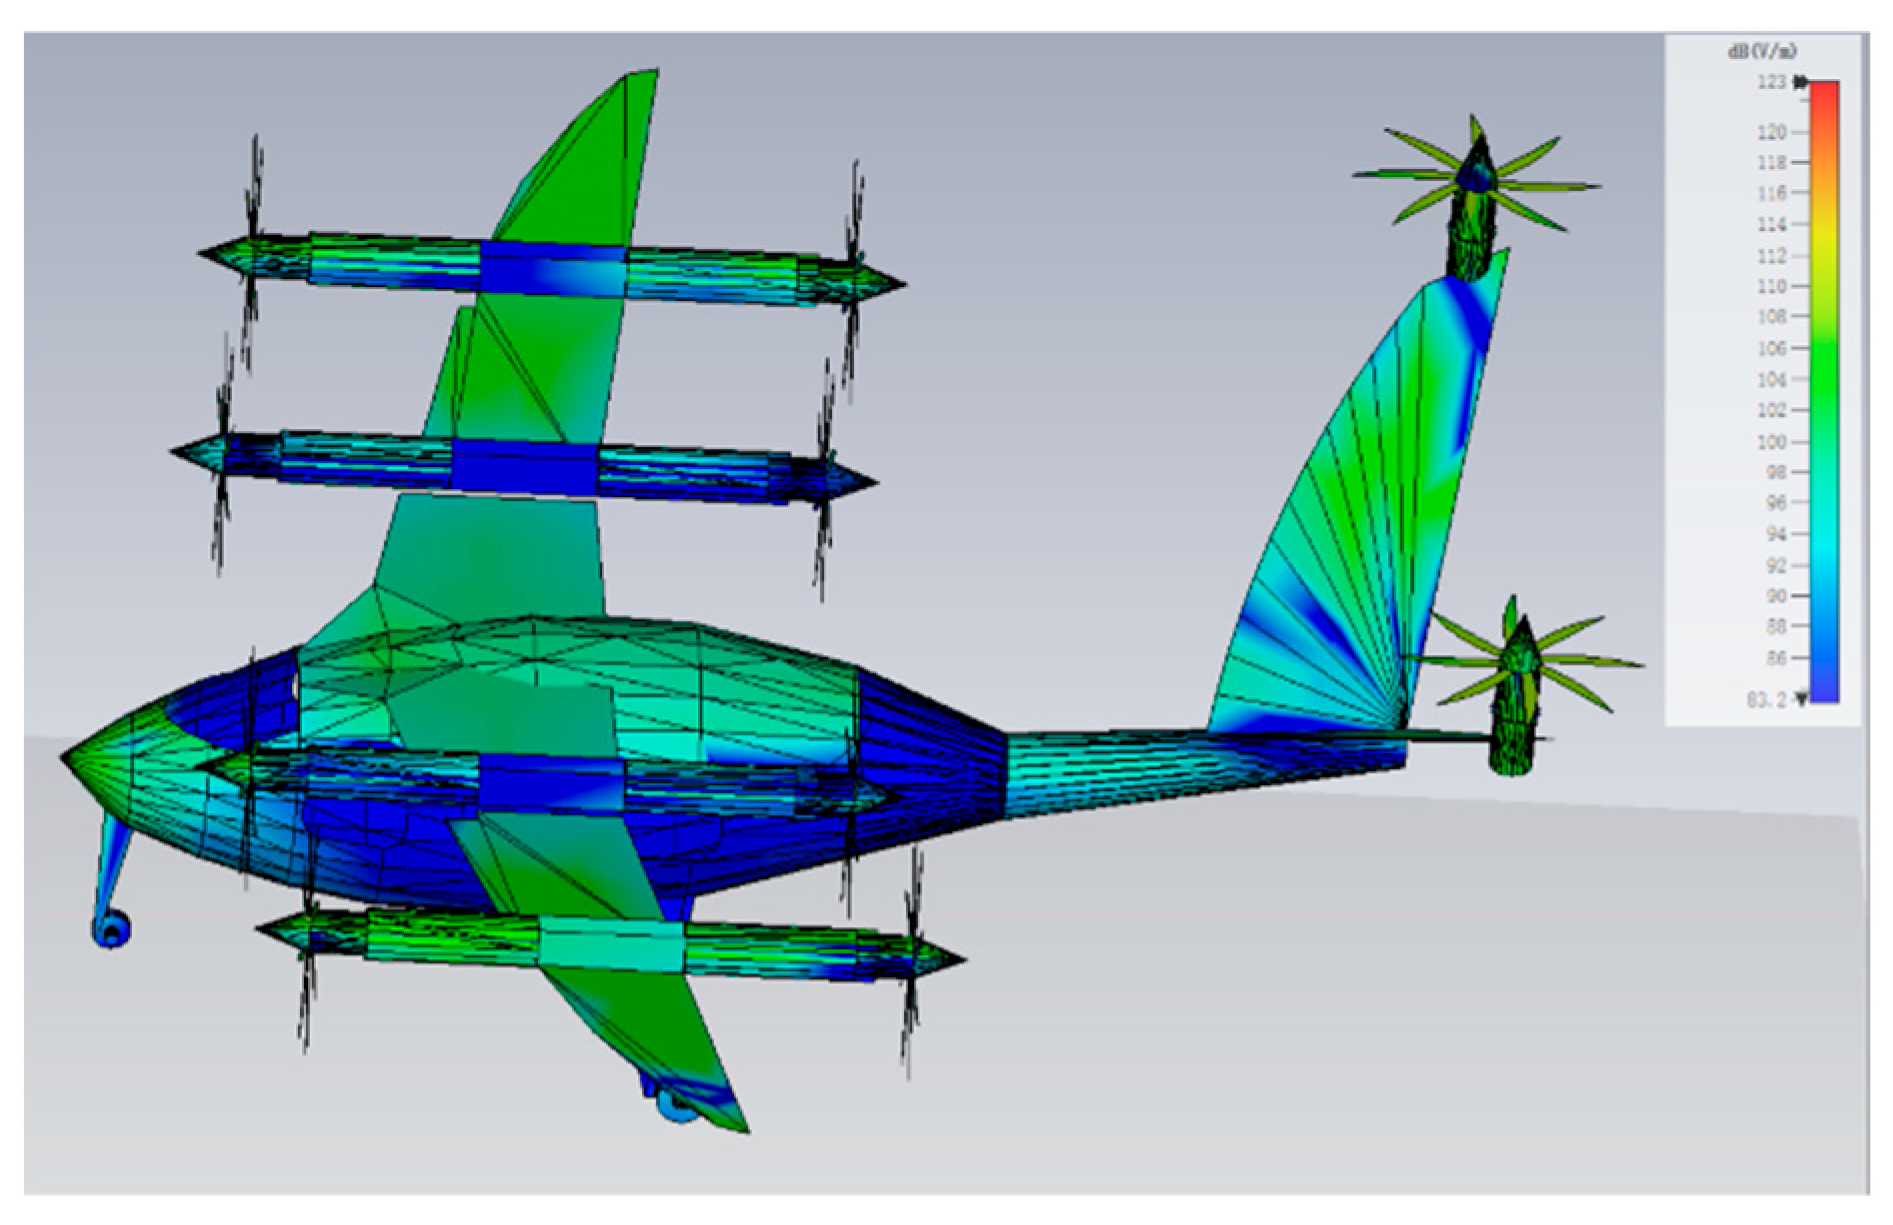
Figure 12.
Rod-shaped Electrode Simulation Model Distribution.
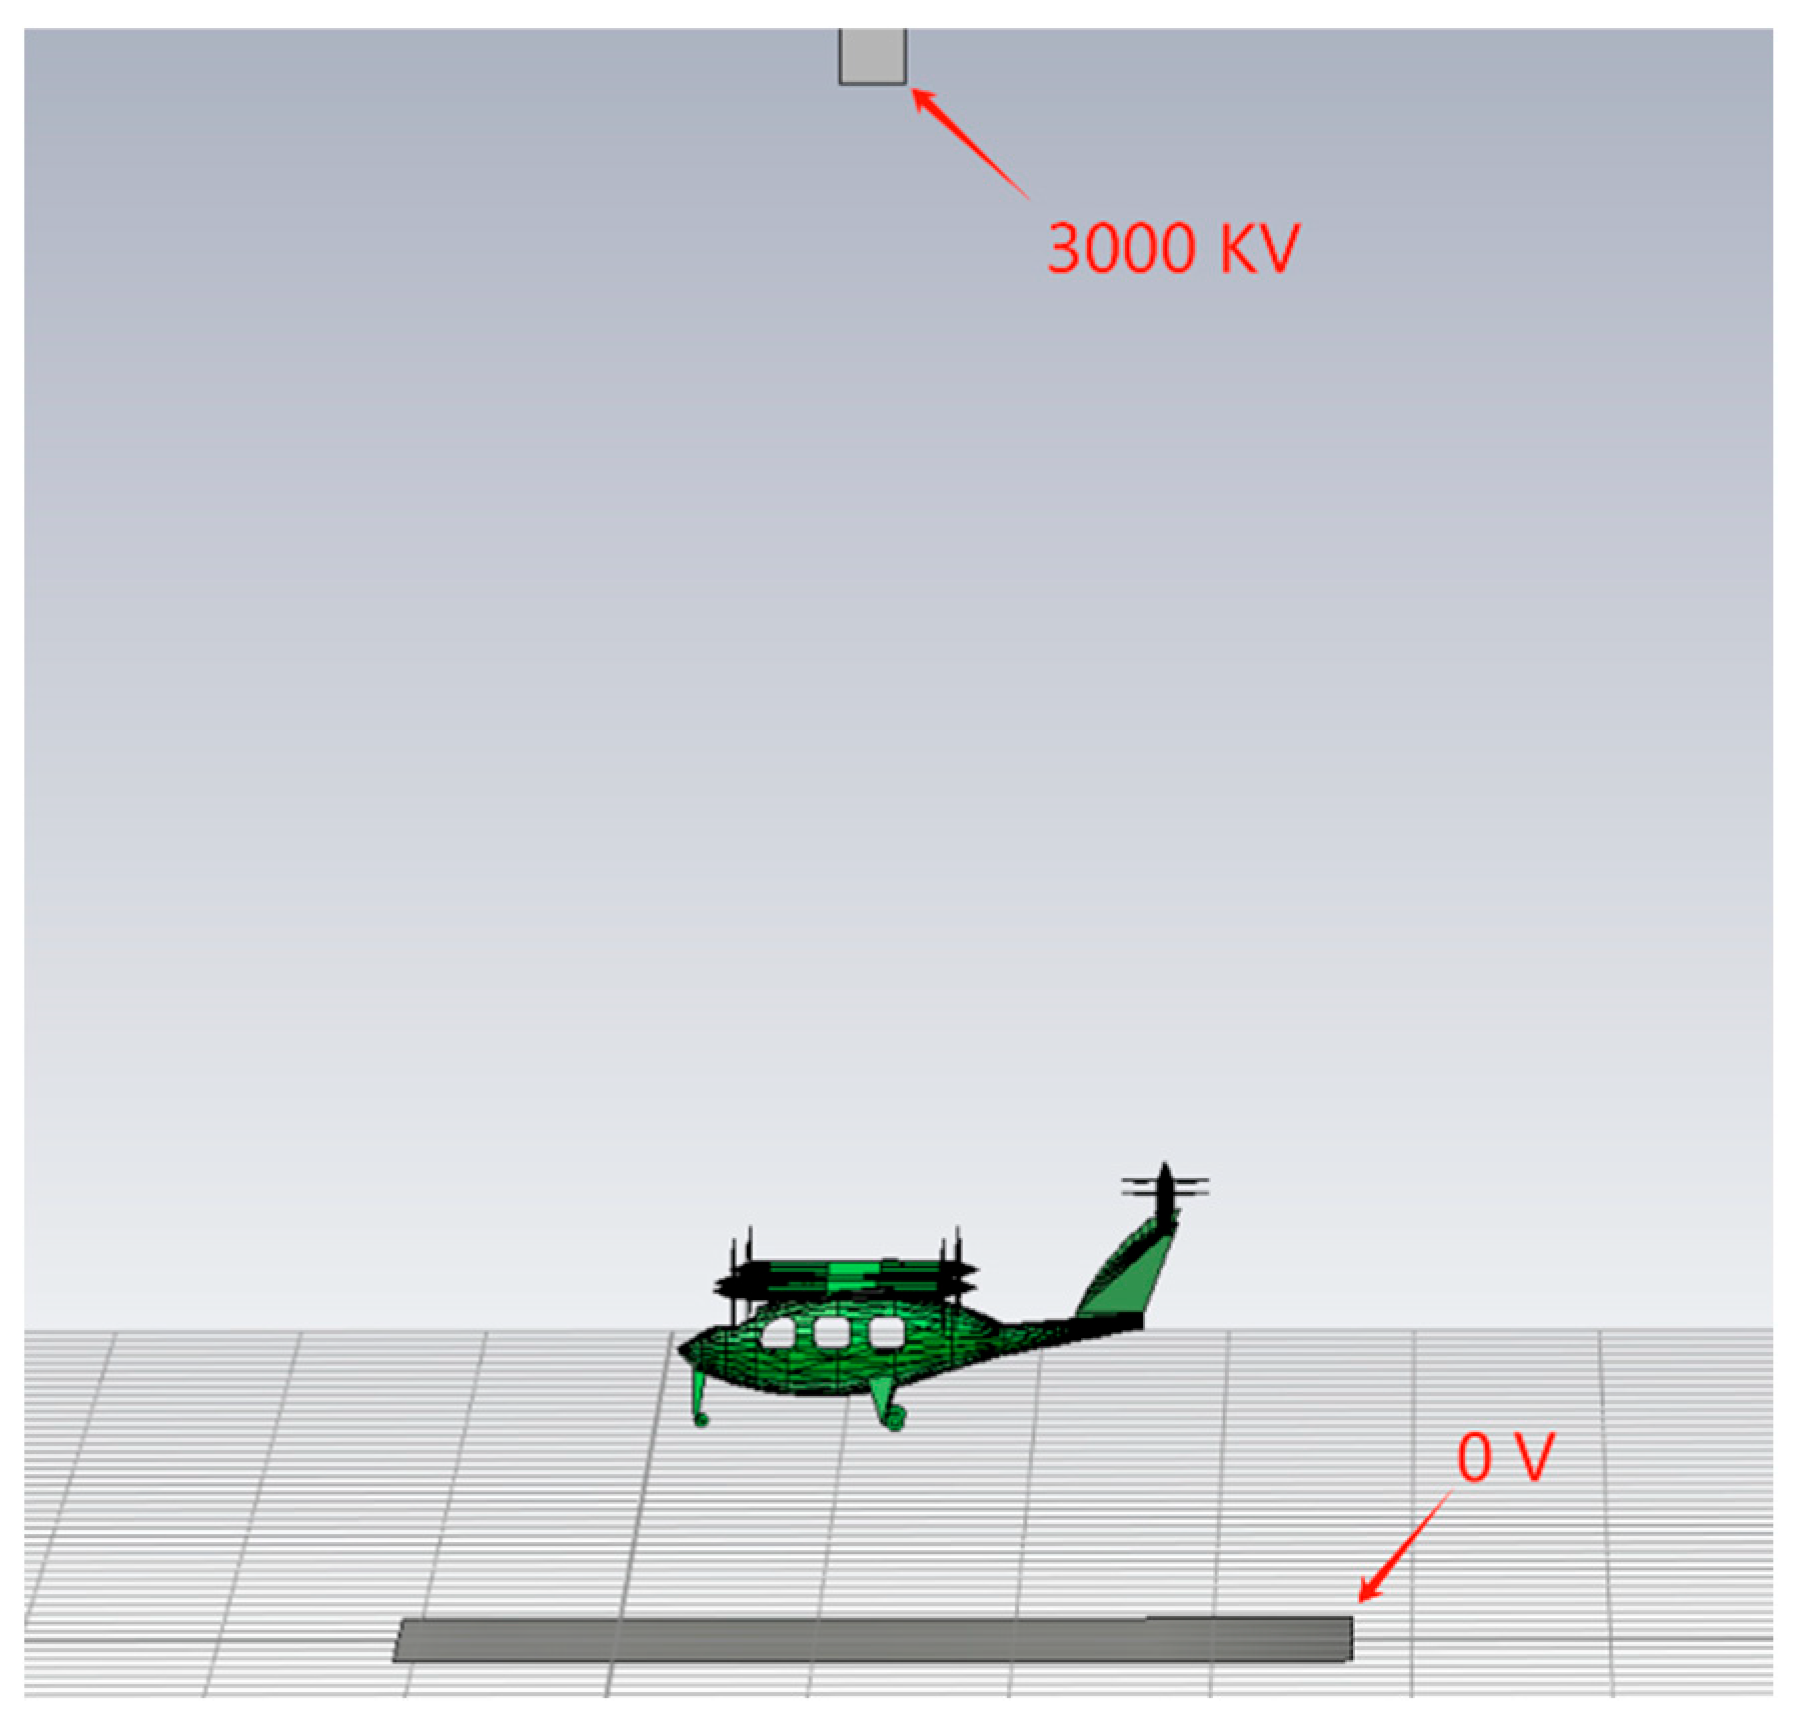
Figure 13.
Surface Electric Field Distribution During Bidirectional Leader Simulation.
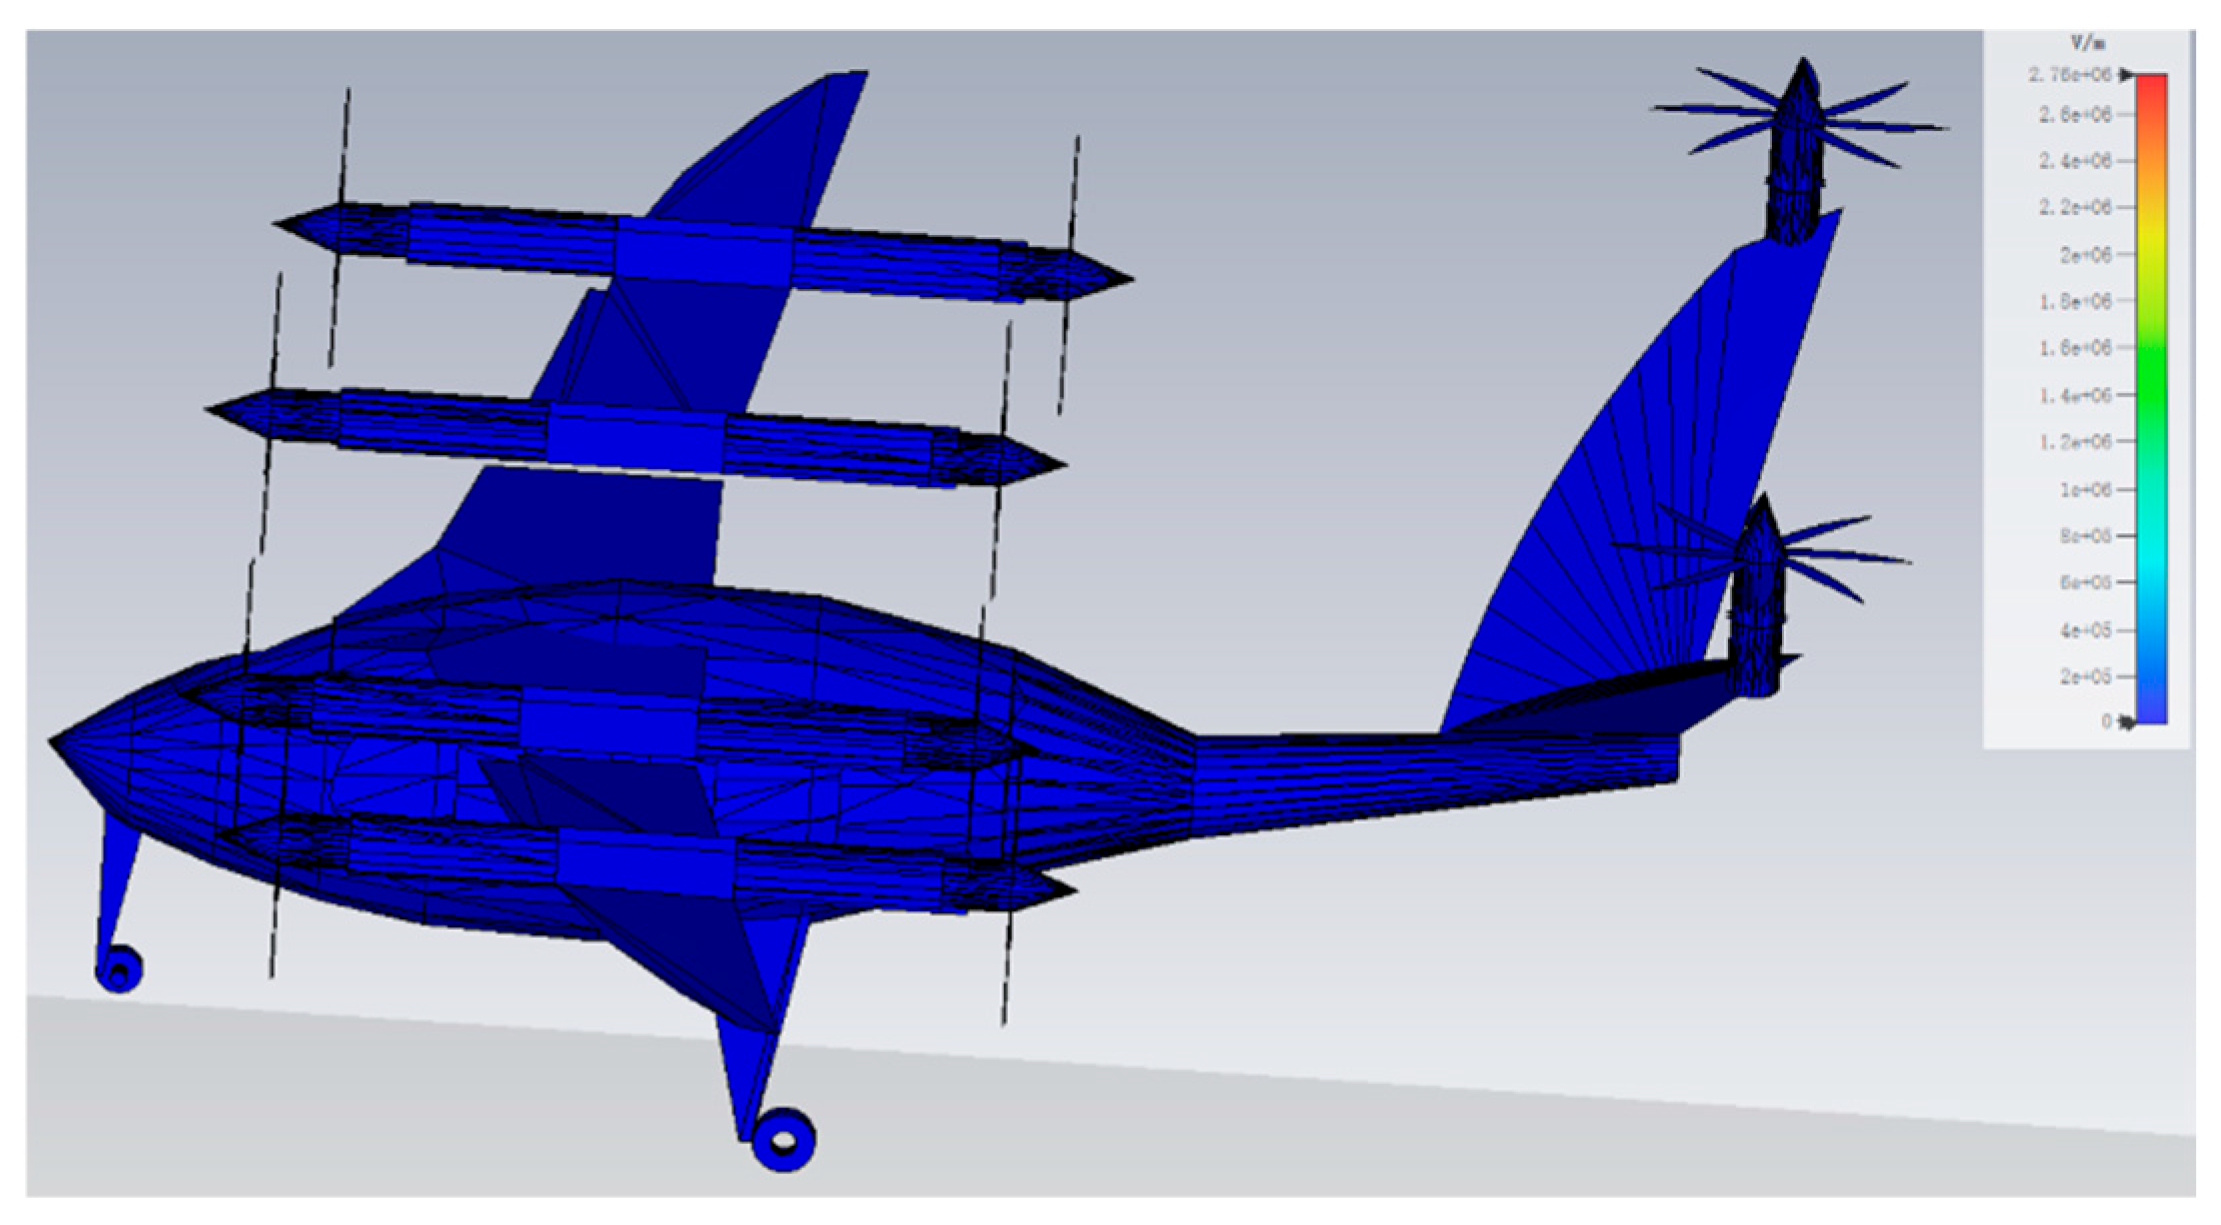
Figure 14.
Surface Electric Field Distribution During Bidirectional Leader Simulation (dB).
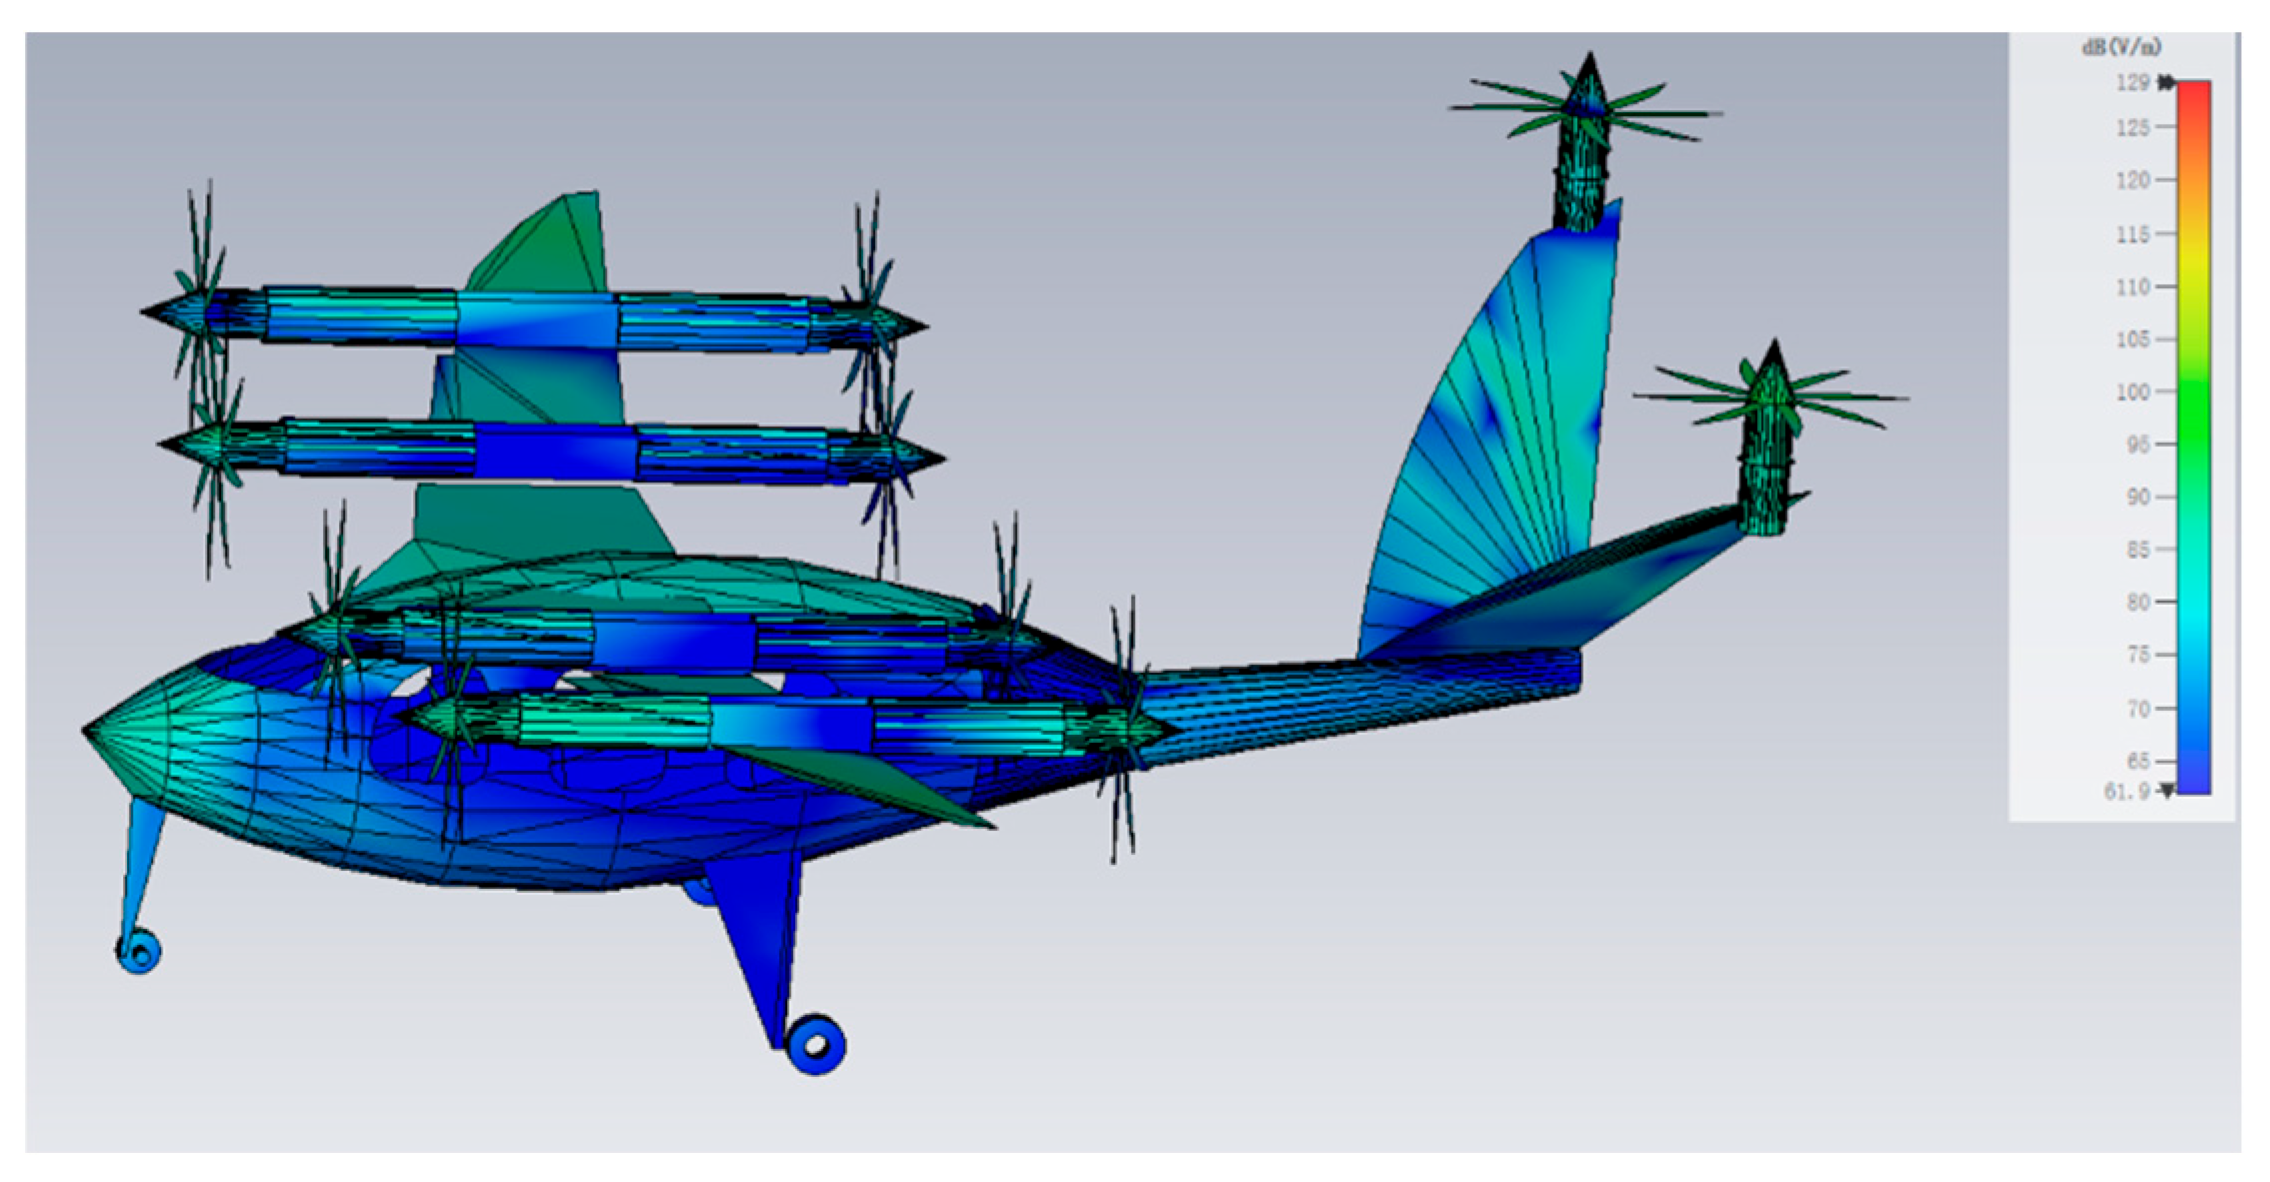
Figure 15.
Typical Lightning Current Component Diagram.
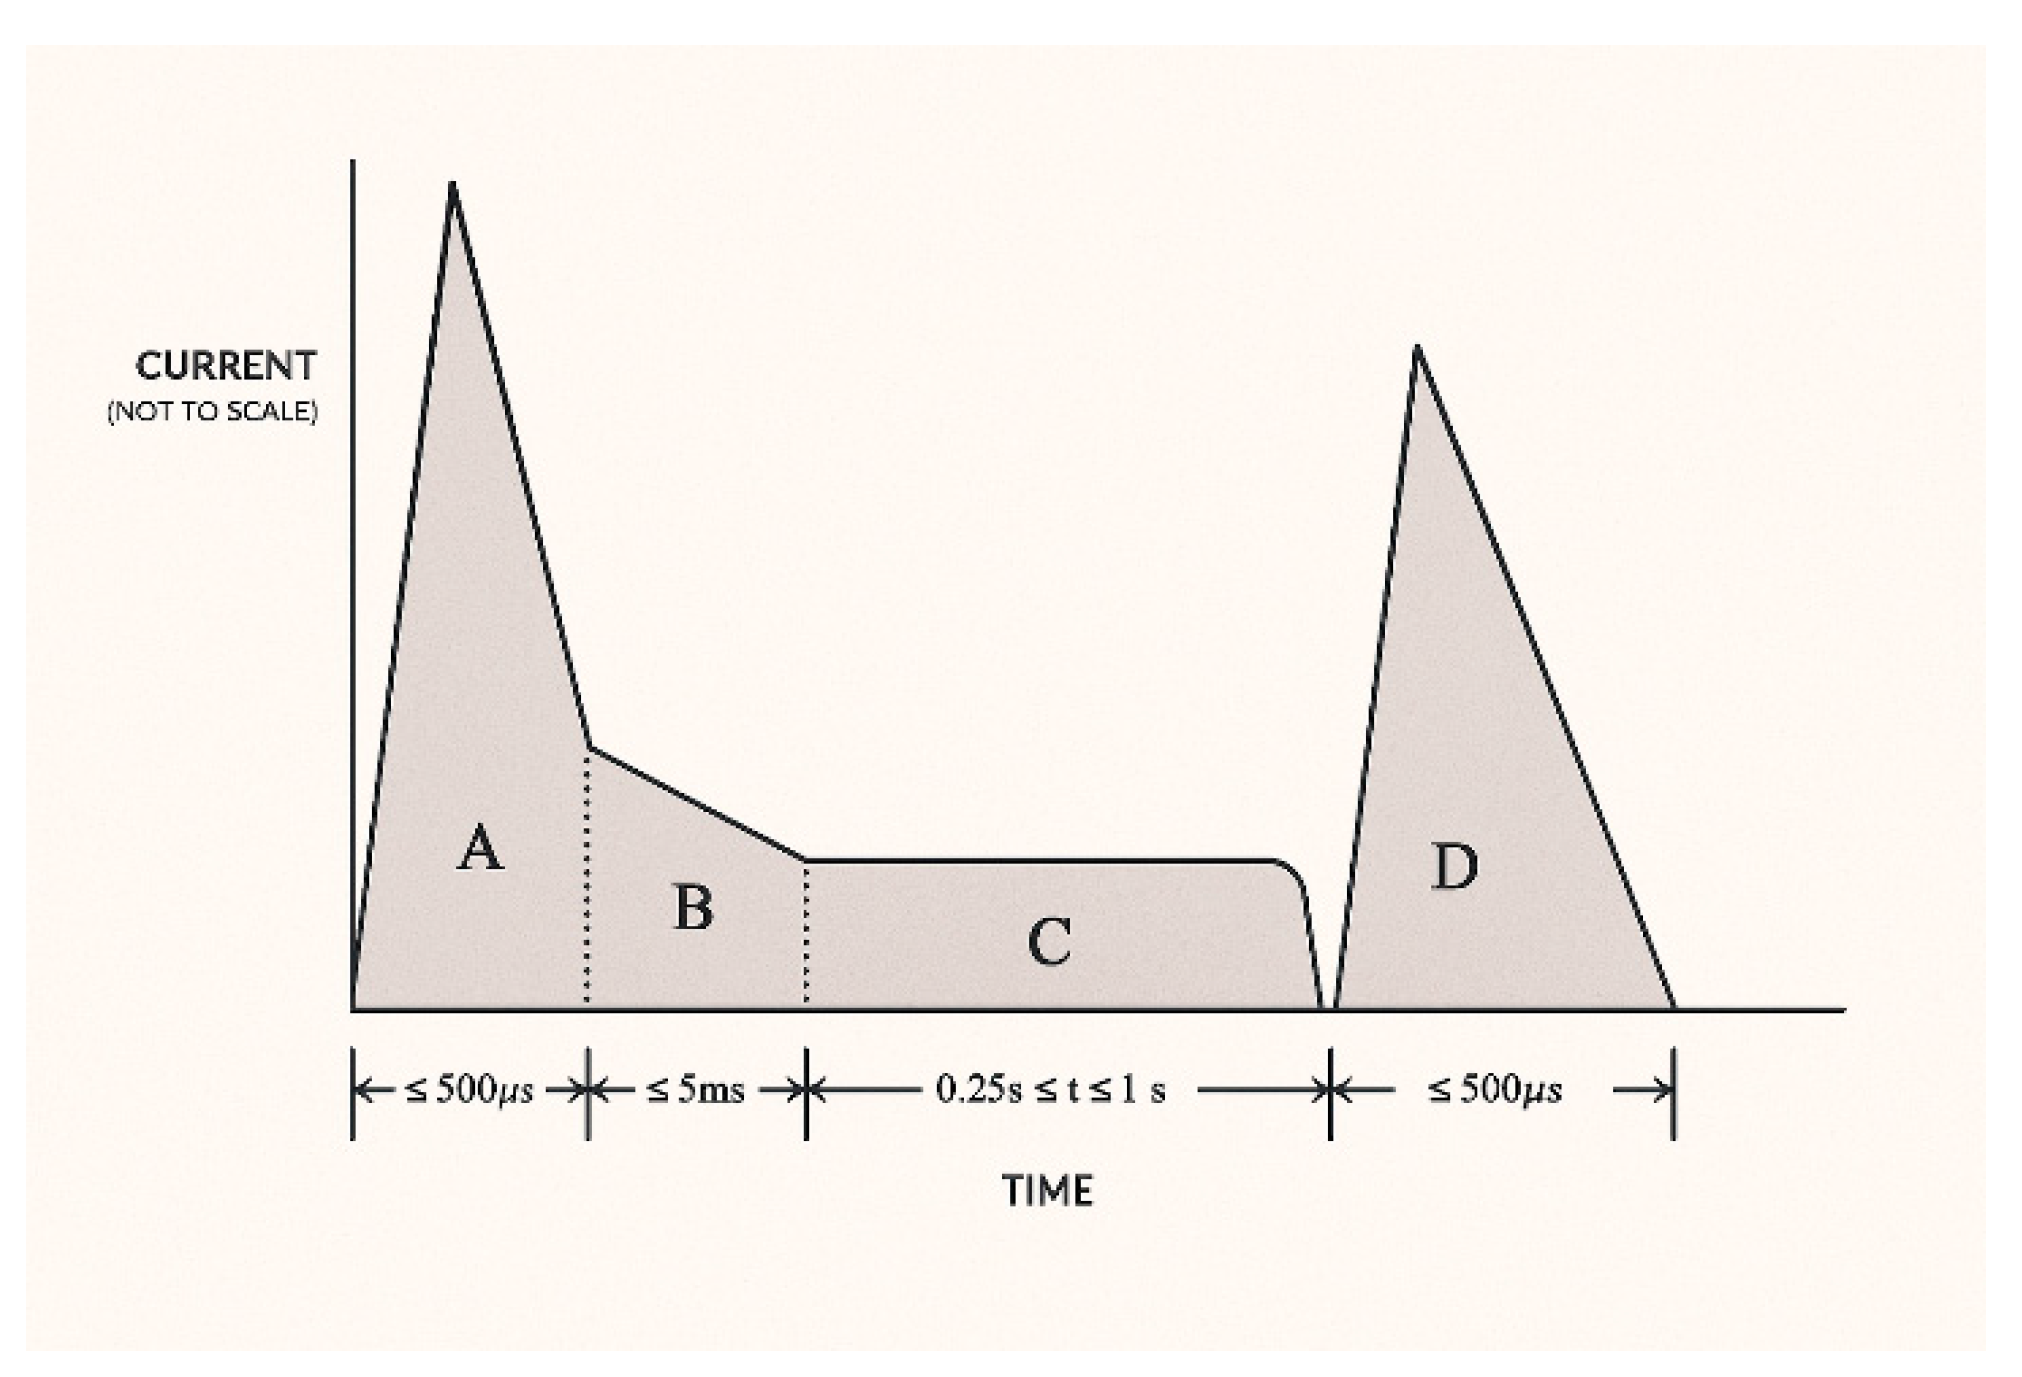
Figure 16.
Time-domain Waveform Diagram of Lightning Current Components: (a) Component A, D; (b) Component C.
Figure 16.
Time-domain Waveform Diagram of Lightning Current Components: (a) Component A, D; (b) Component C.
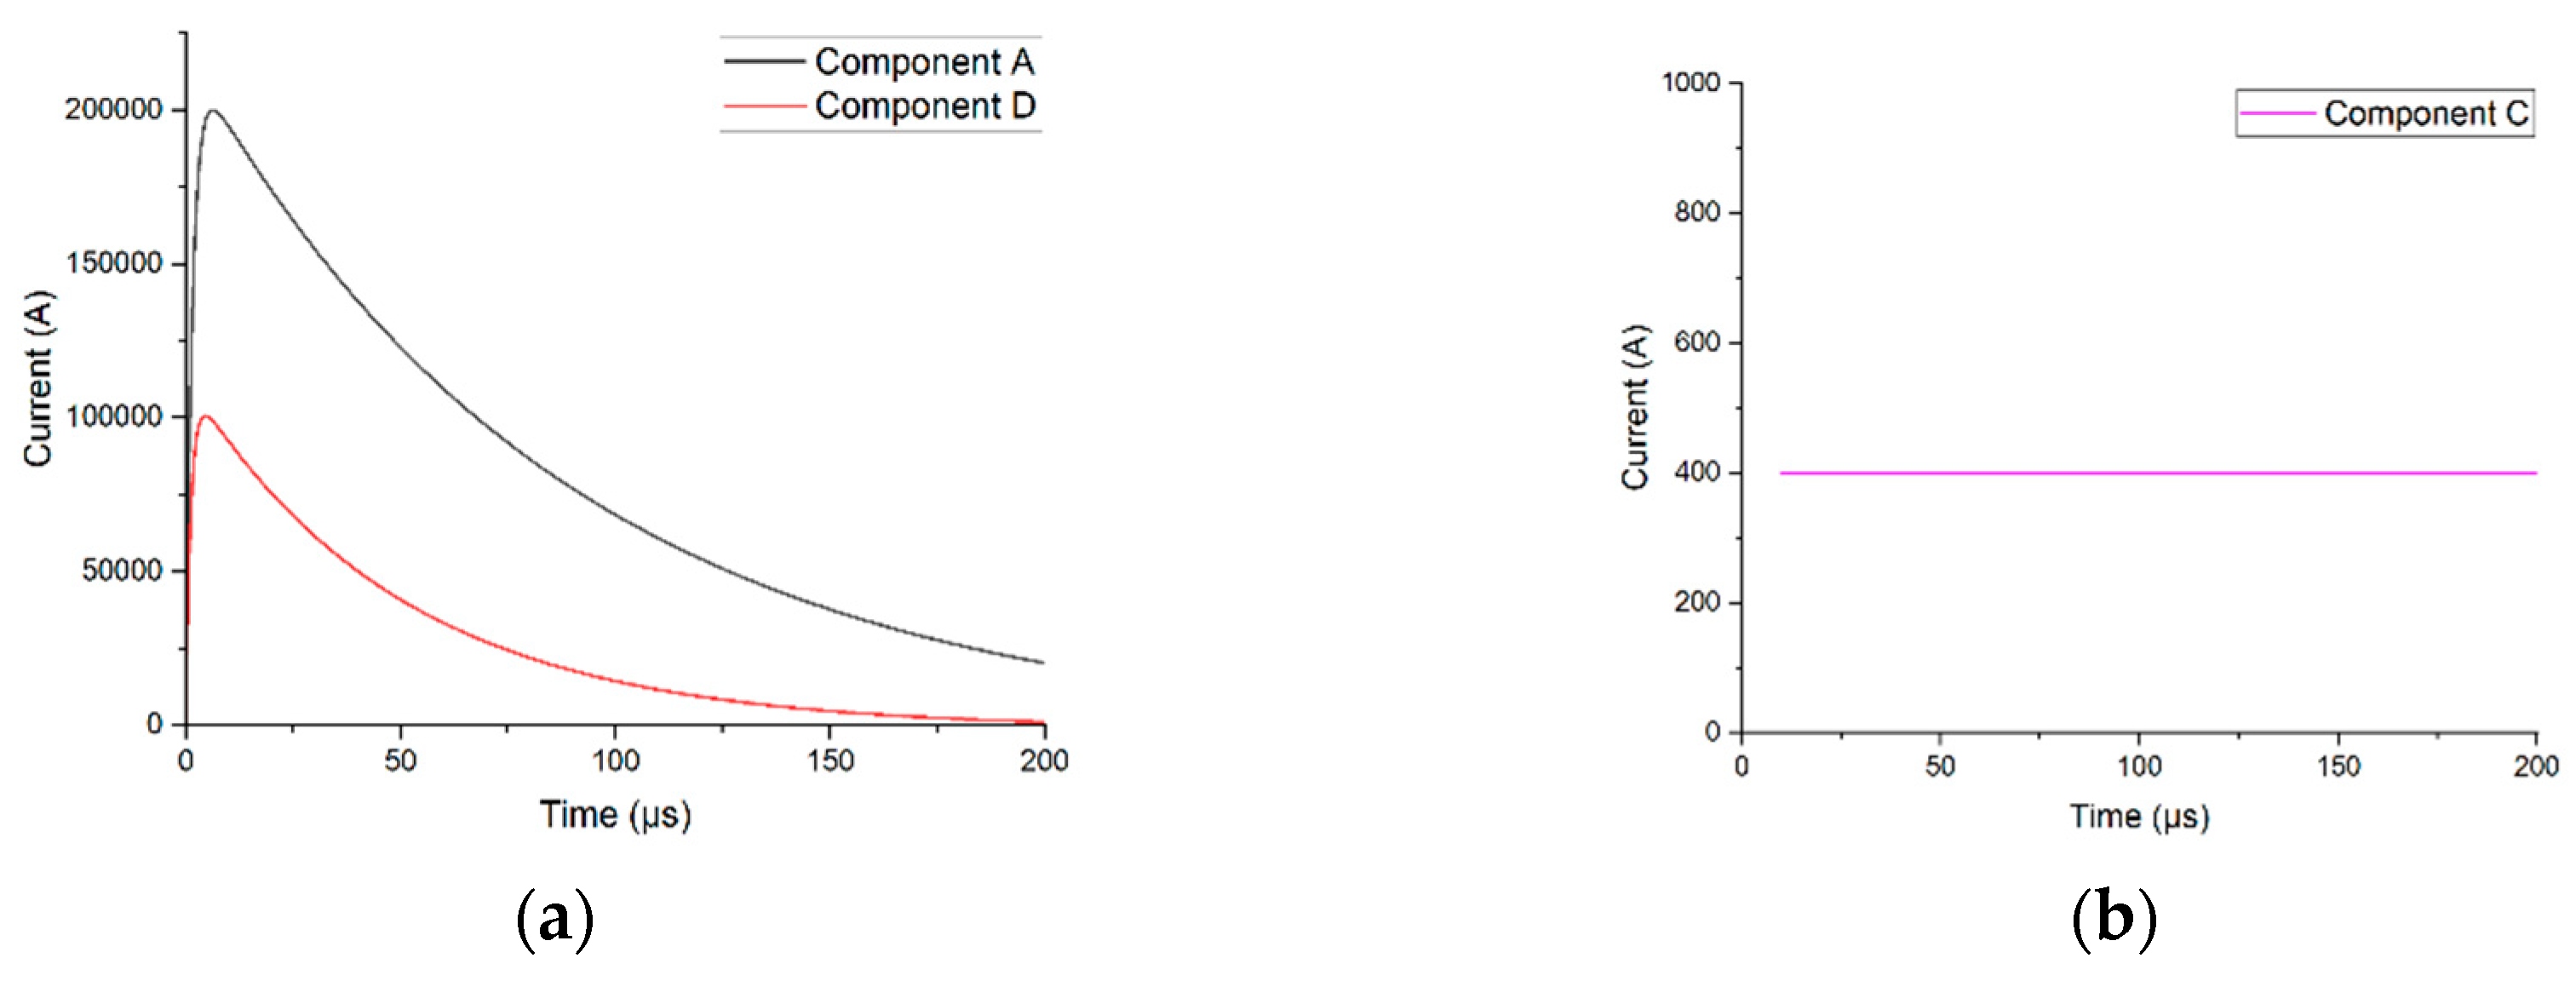
Figure 17.
Lightning Current Injection Point Diagram.
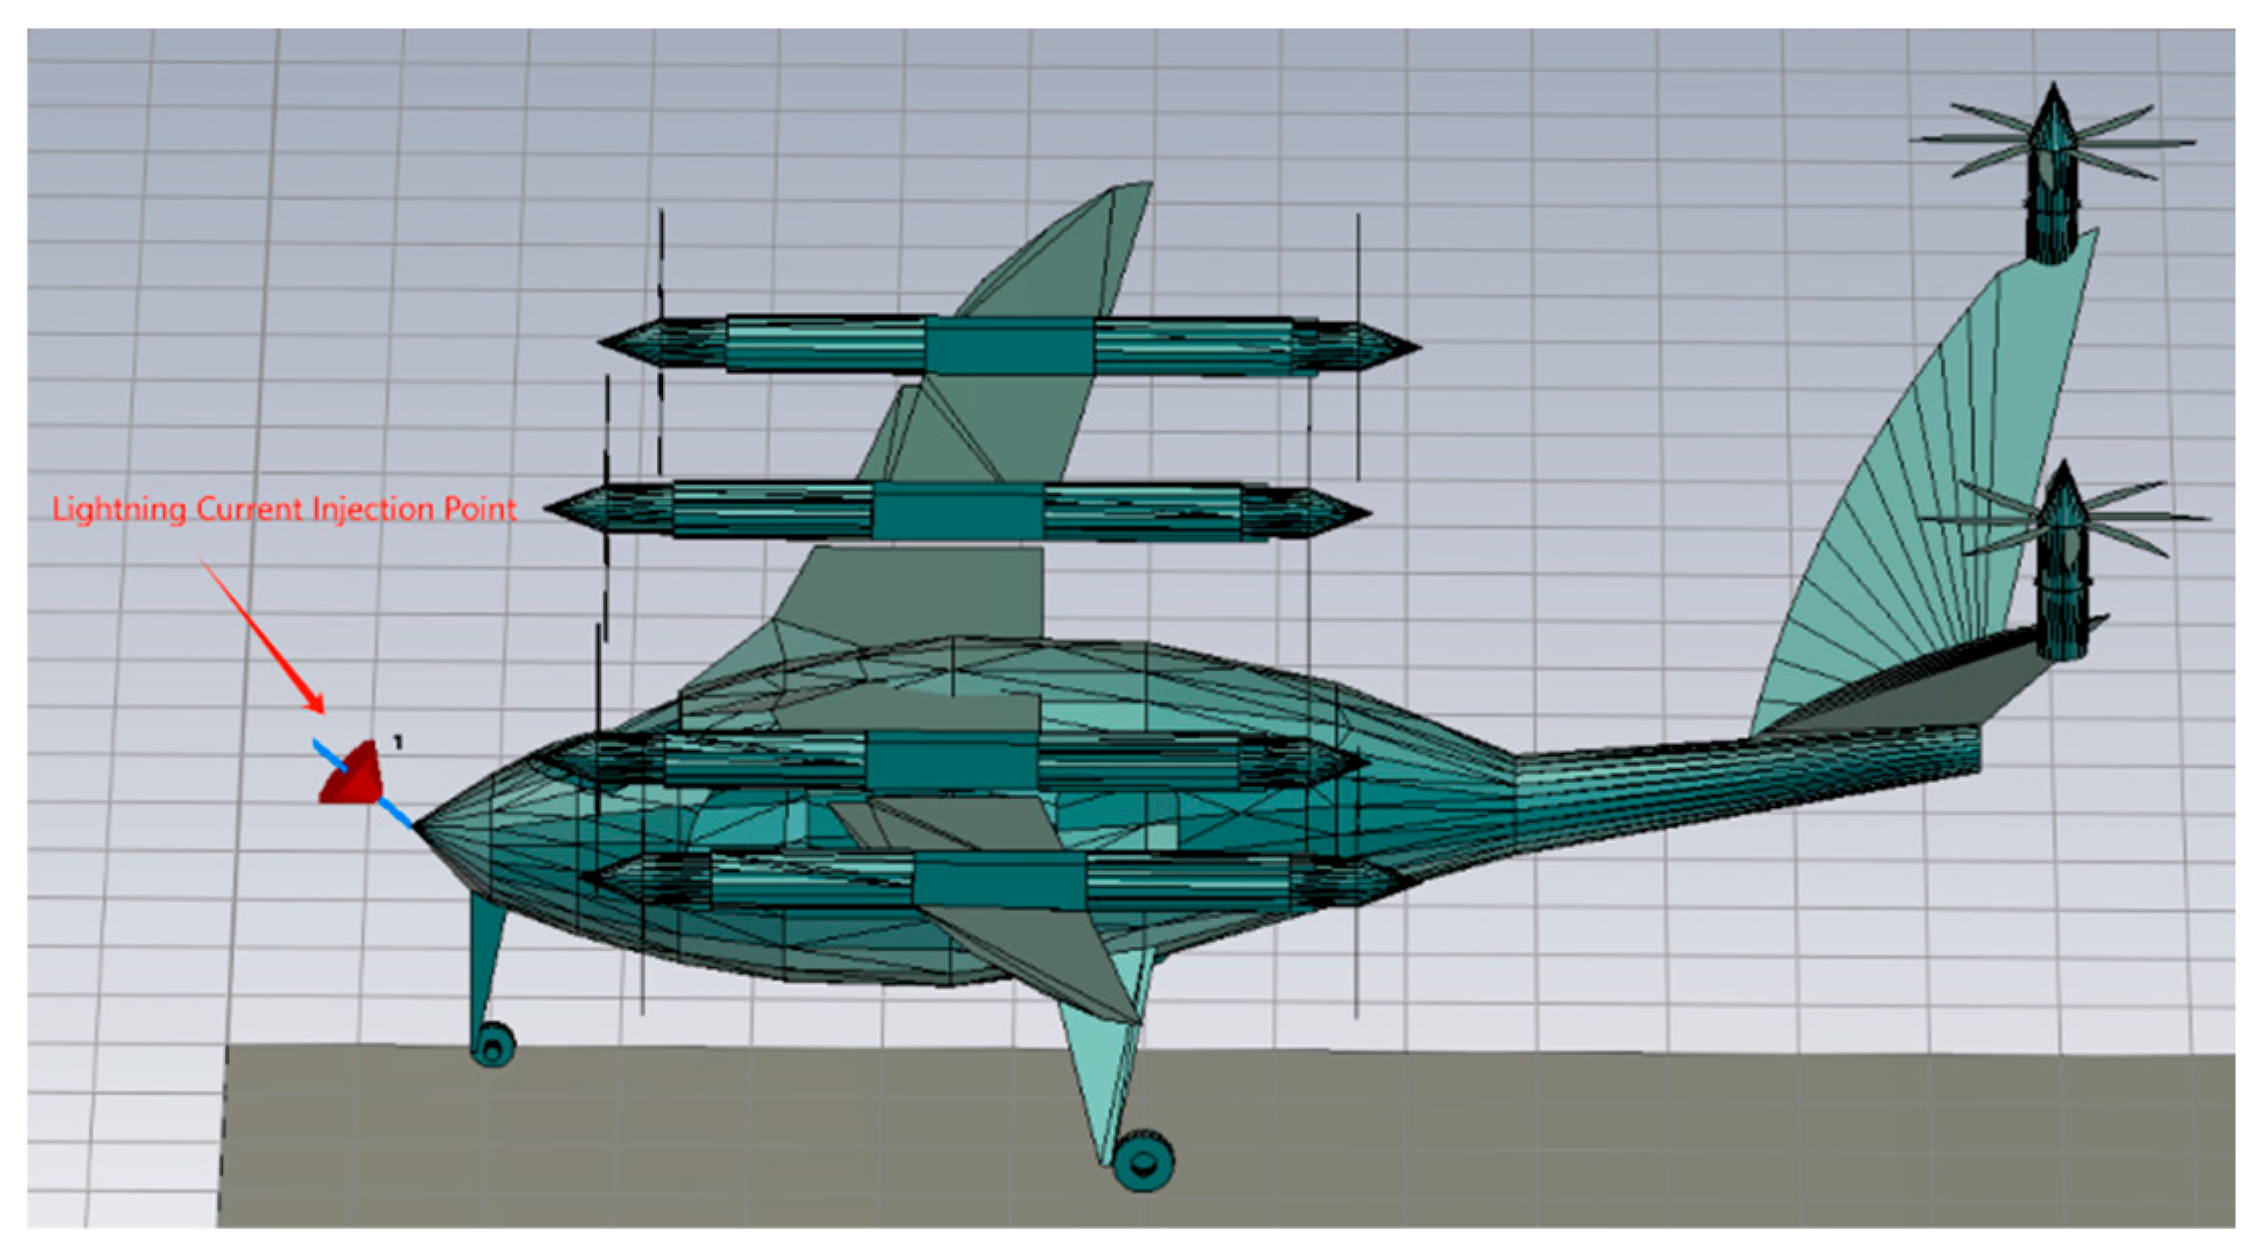
Figure 18.
Cable Bundles Model Diagram.
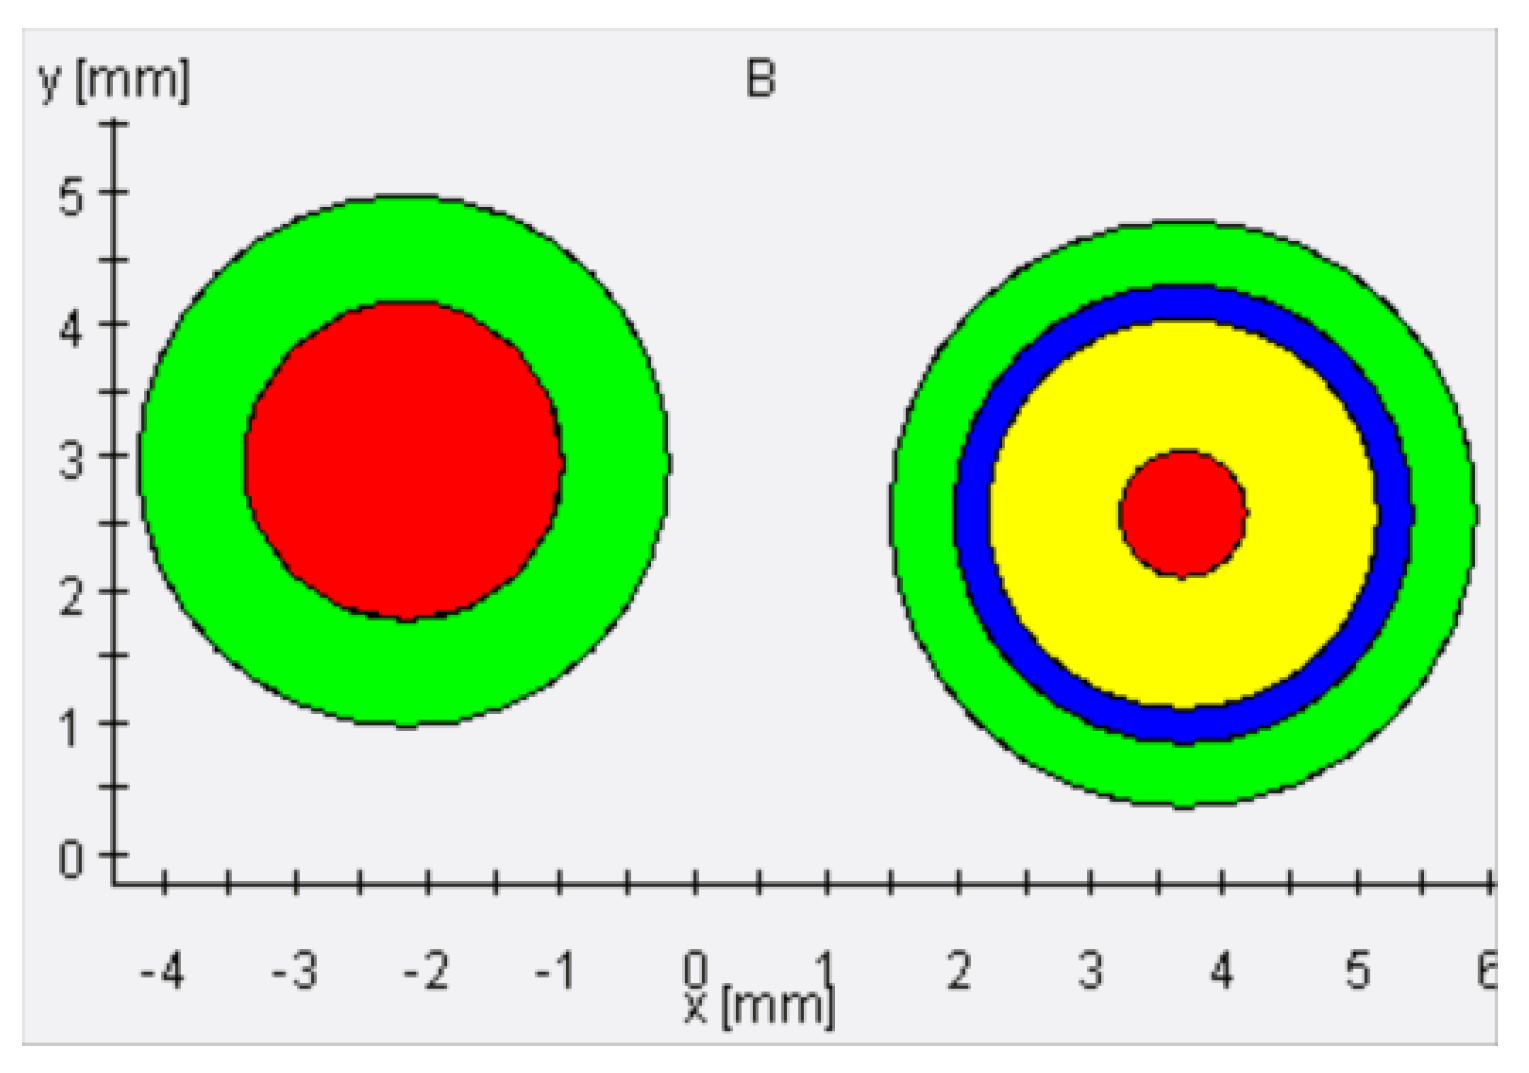
Figure 19.
Circuit Structure Diagram.
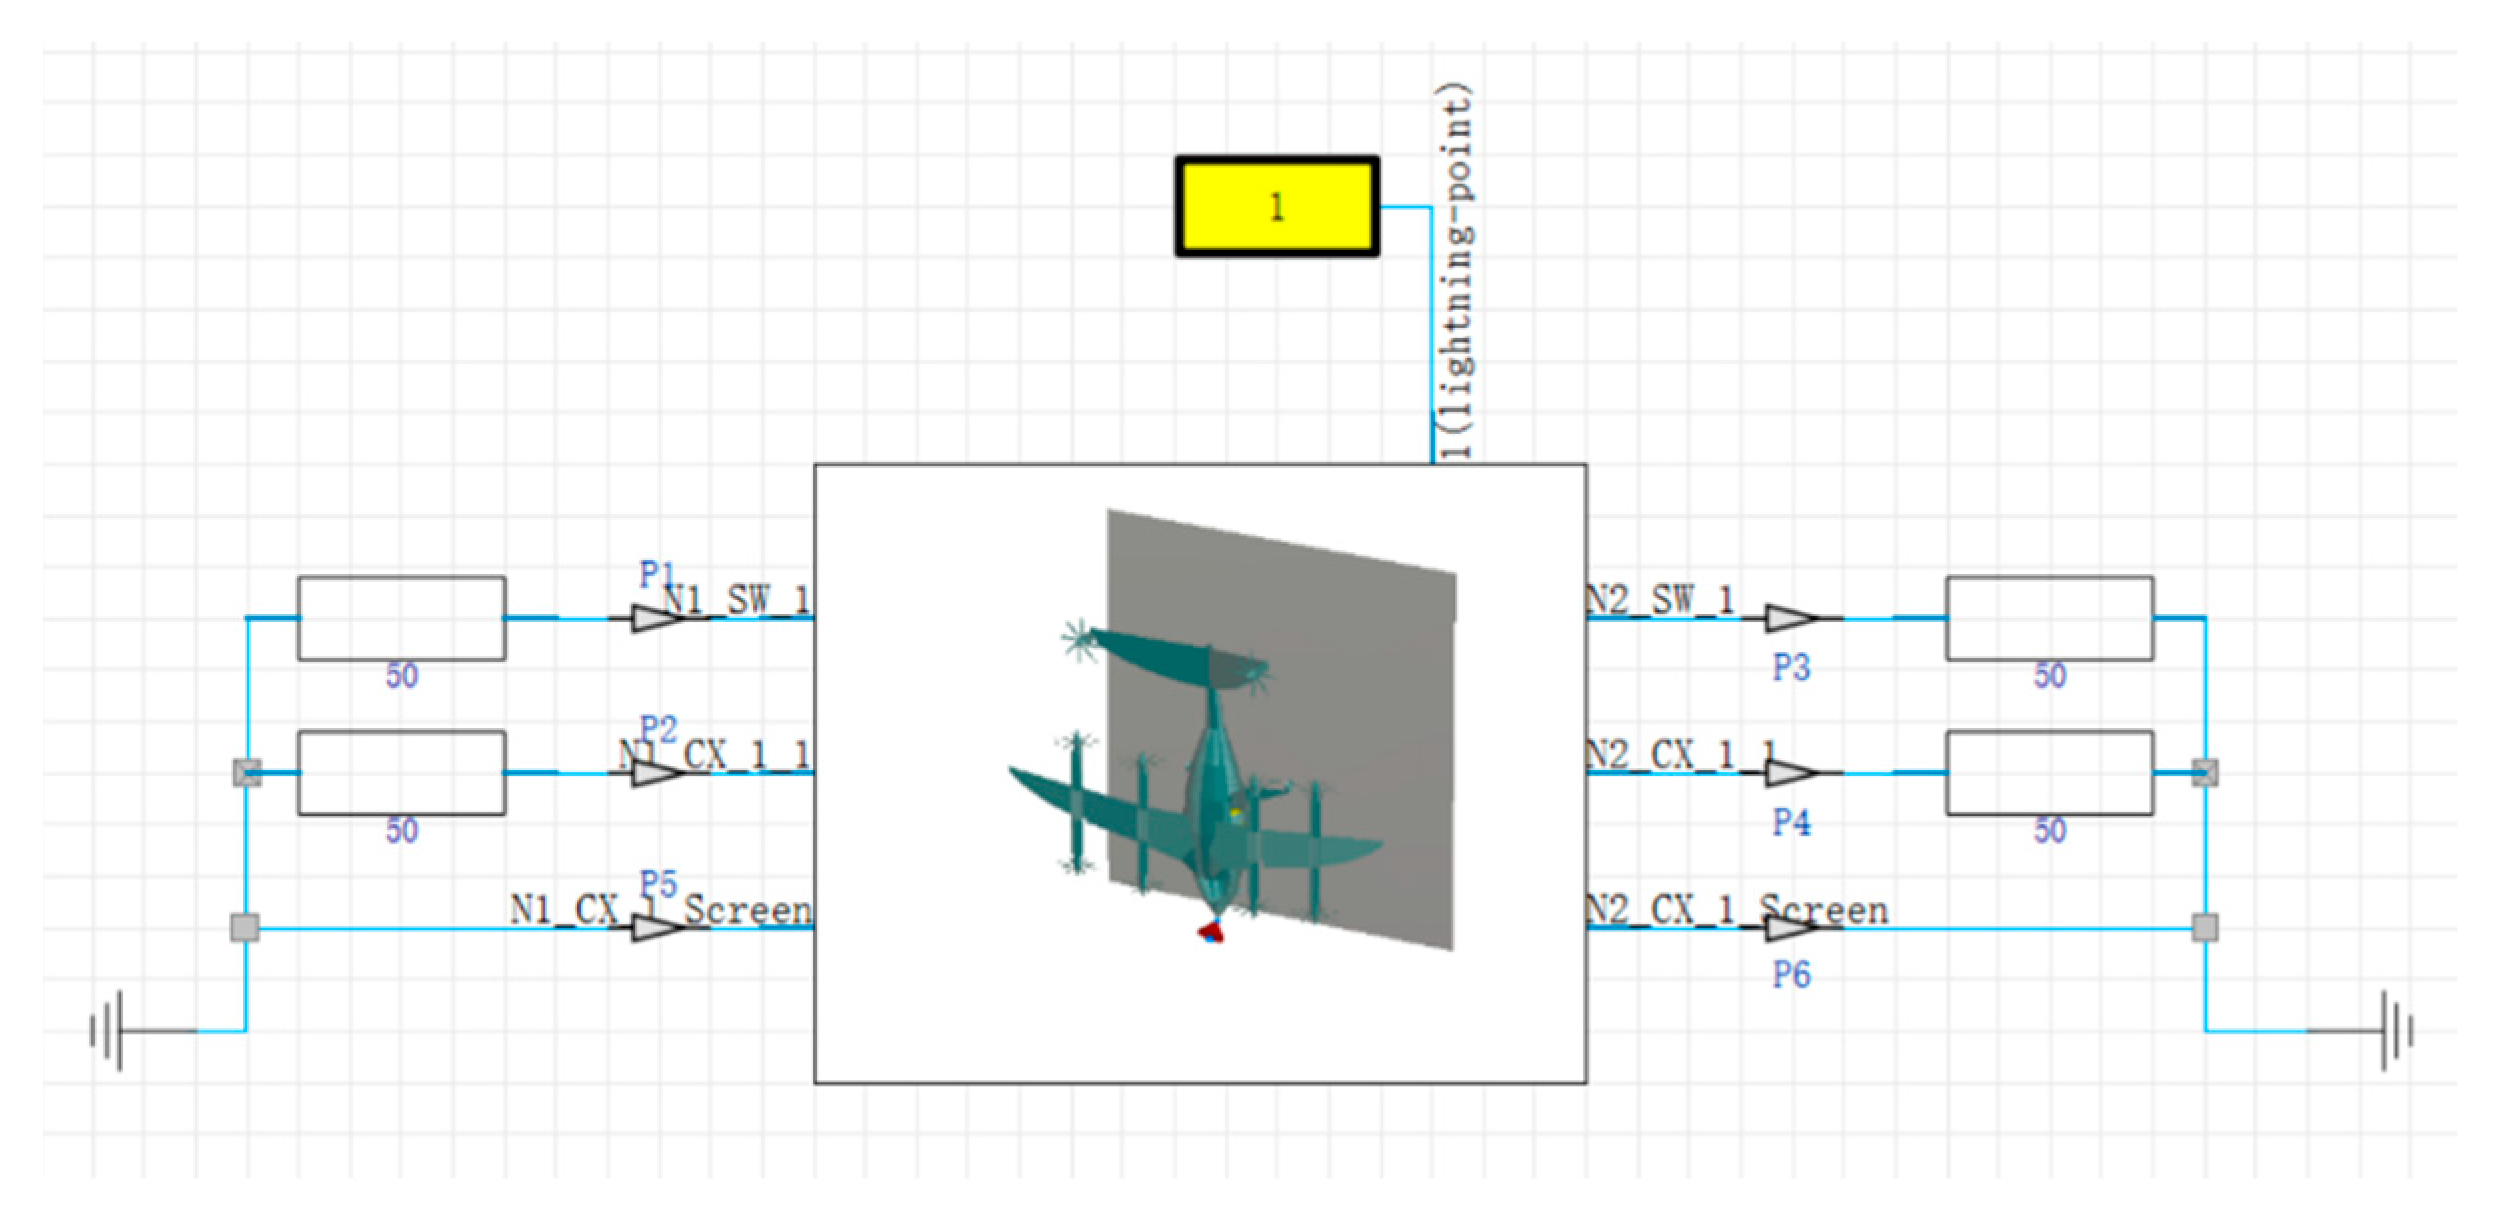
Figure 20.
Induced Current in Single-core Cable under Different Lightning Components.
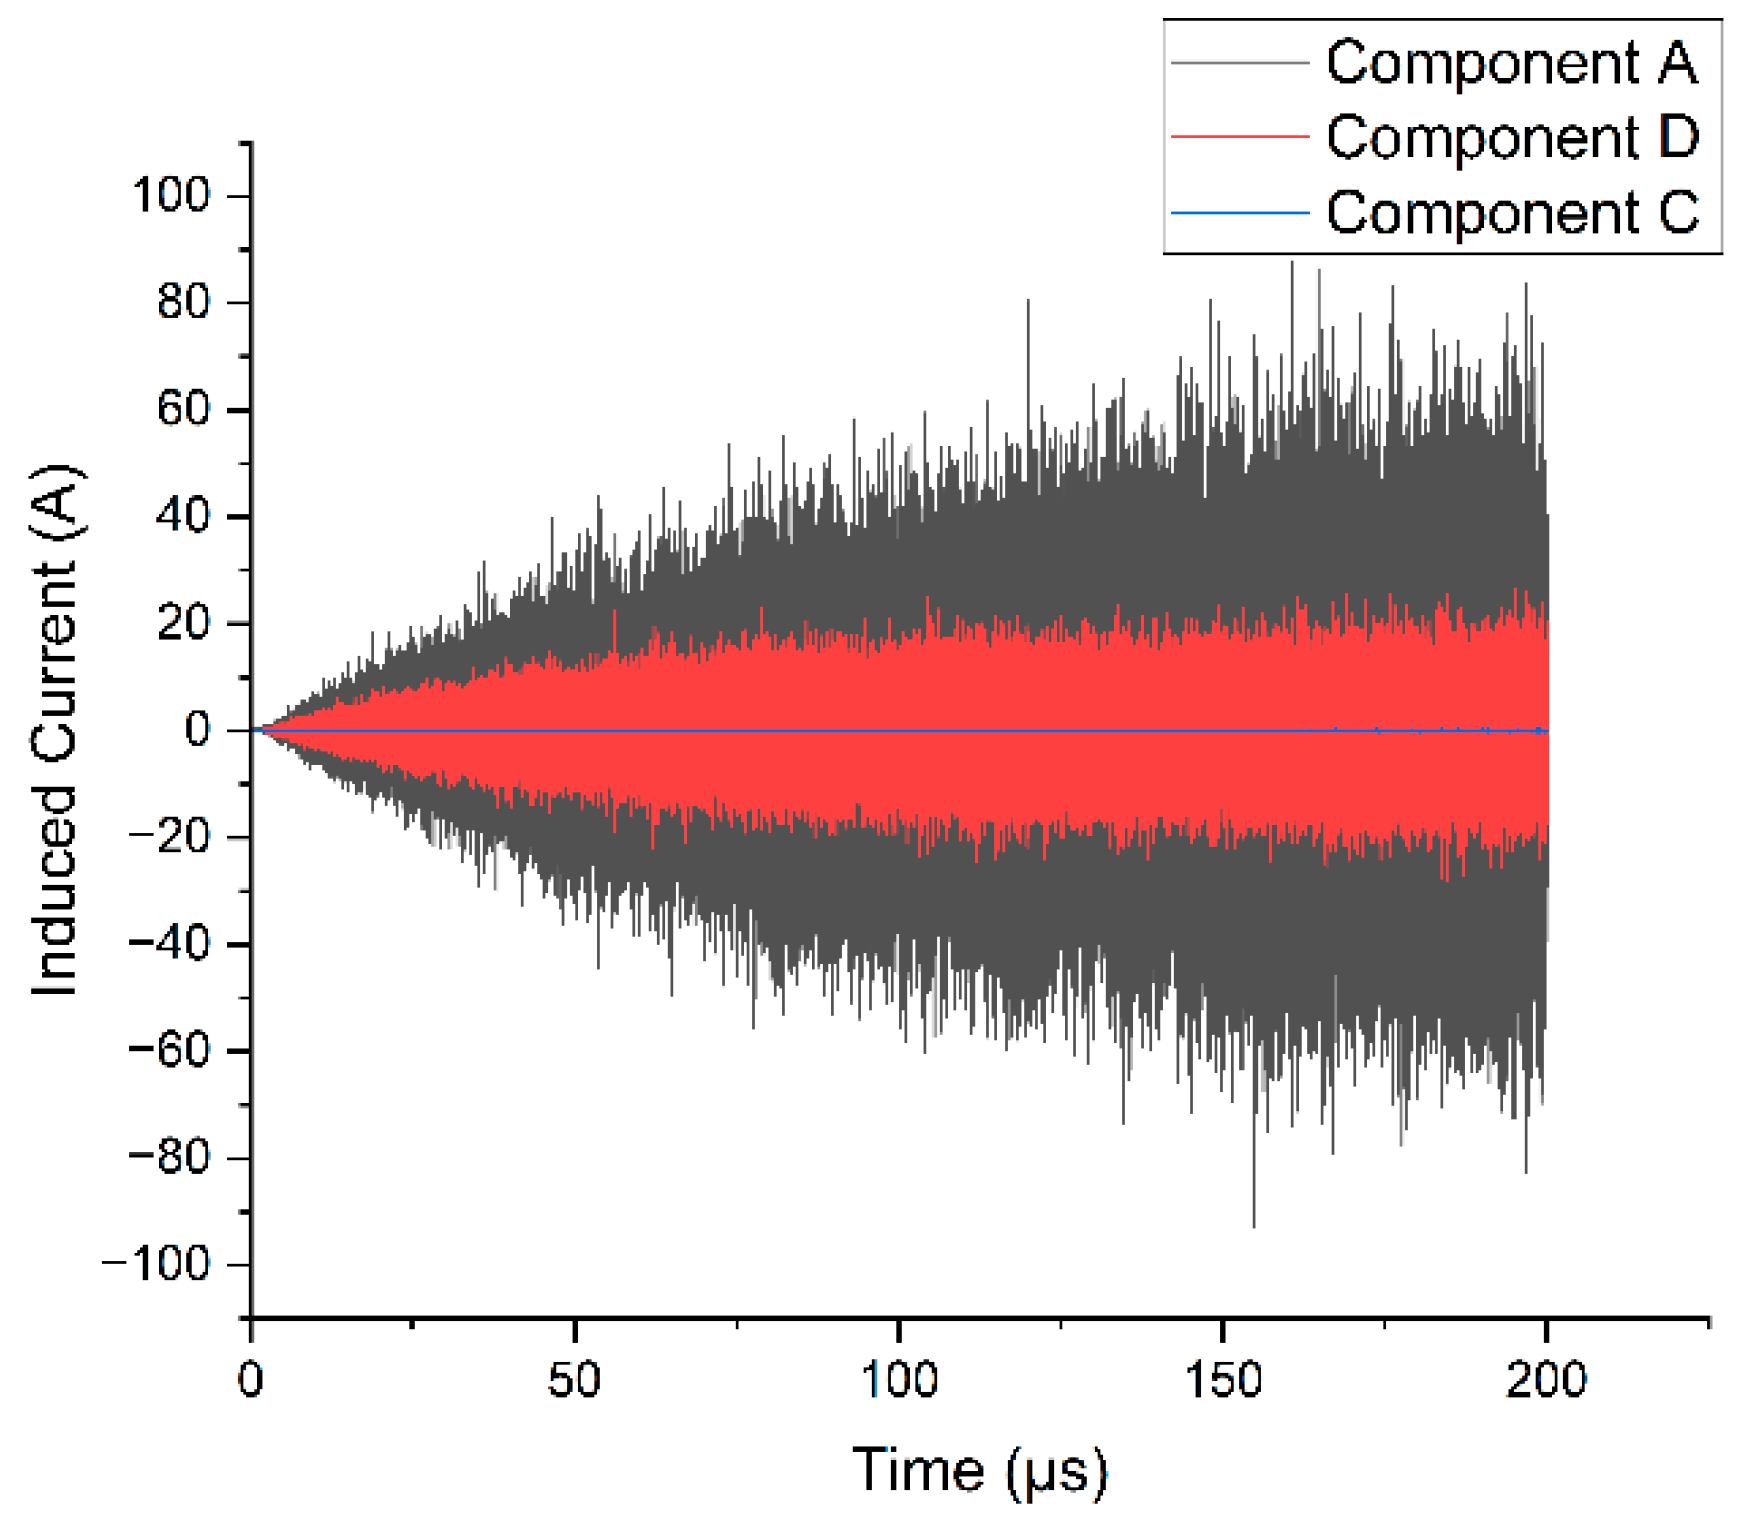
Figure 21.
Induced Current in Shielded Cable Core under Different Lightning Components.
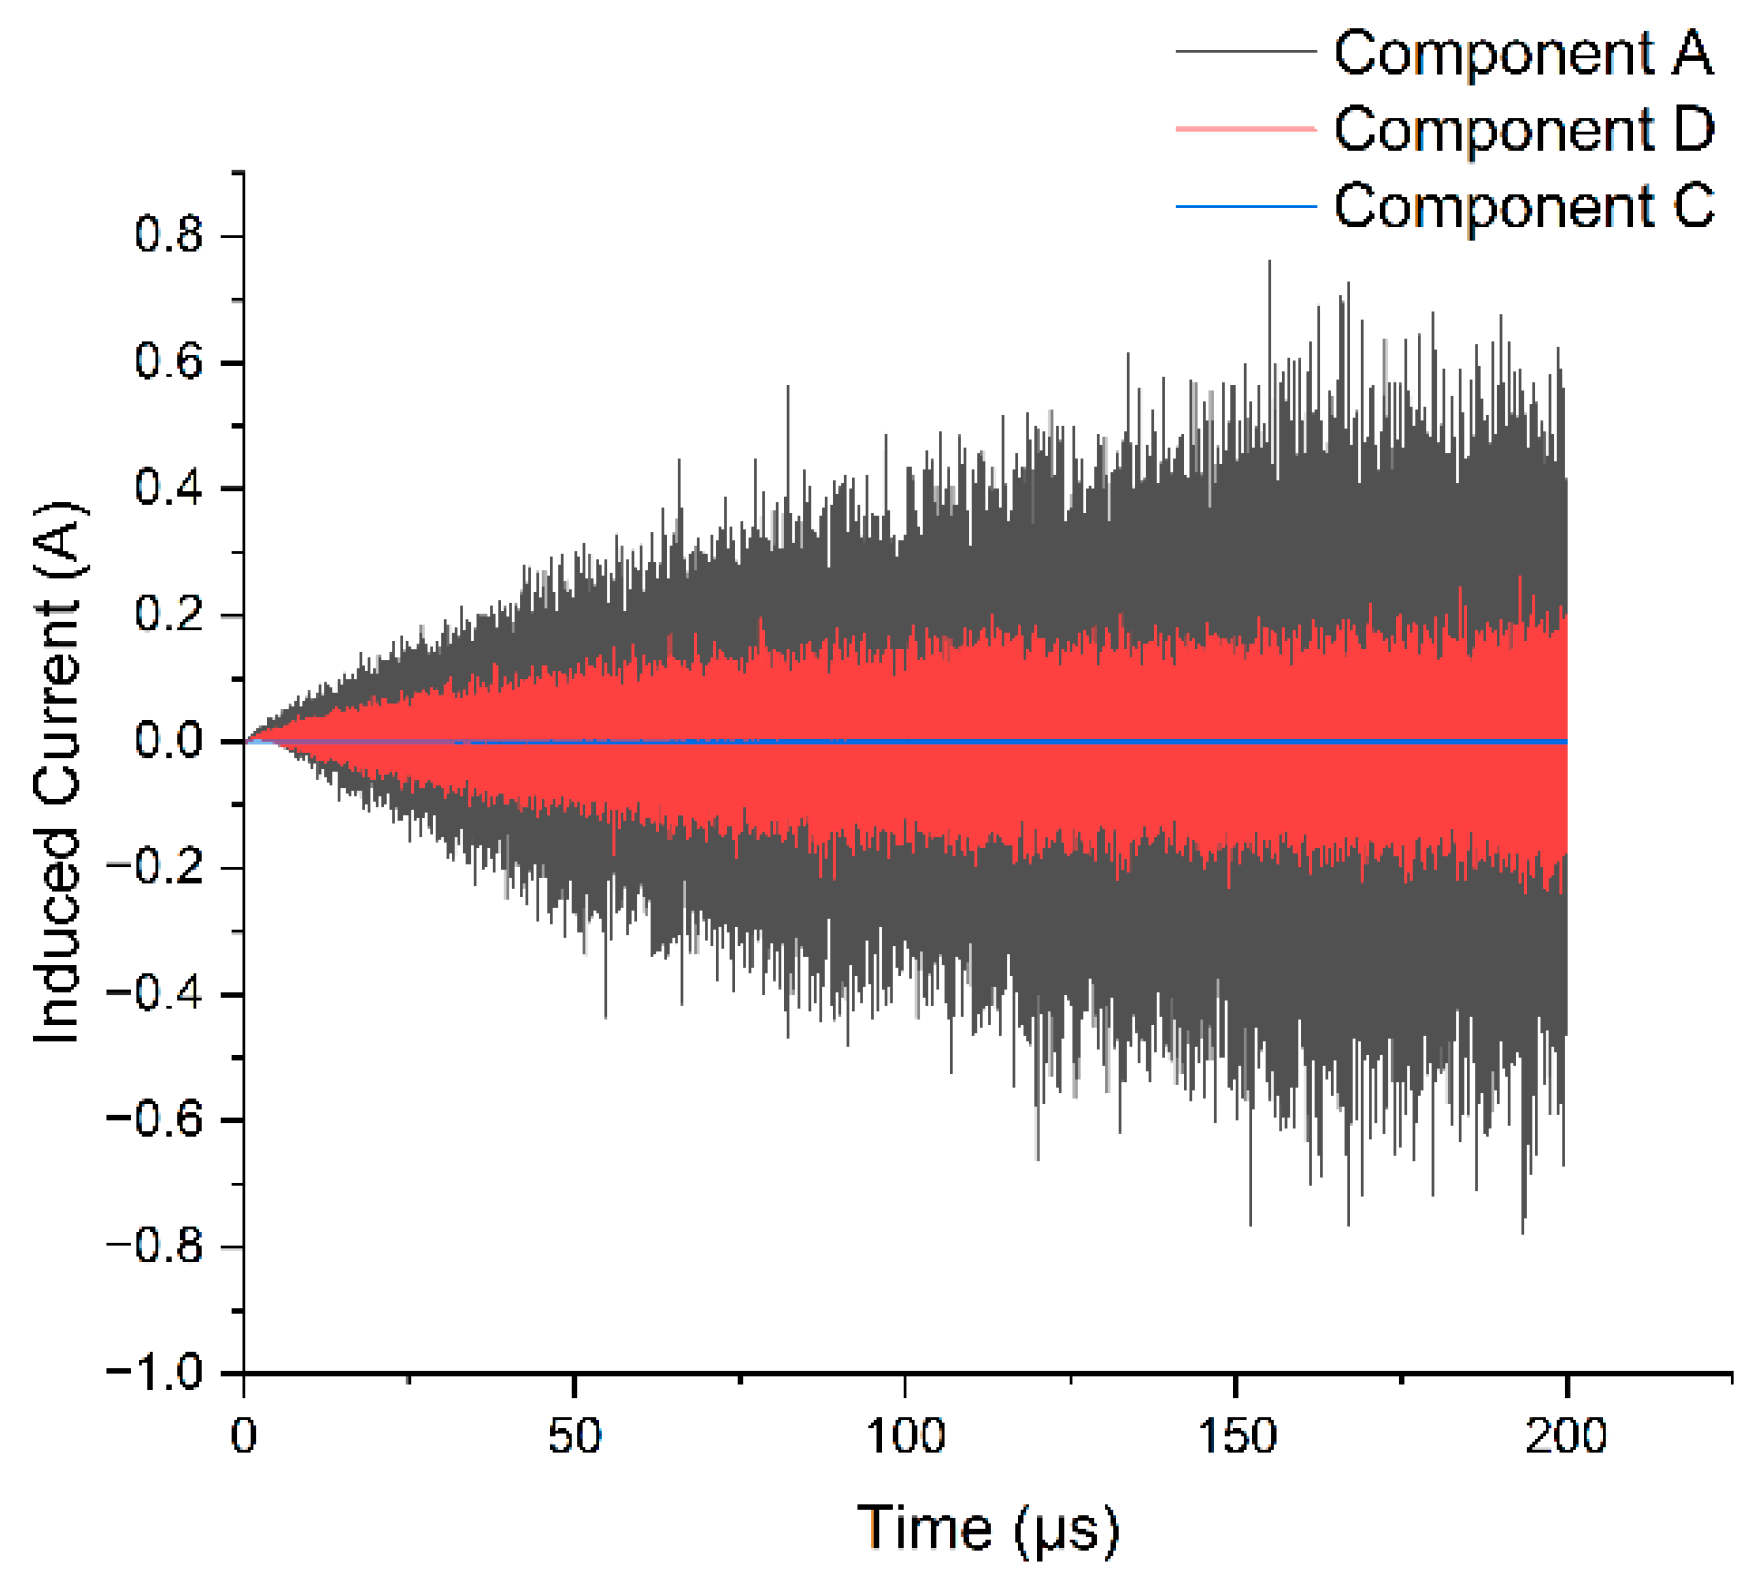
Figure 22.
Induced Current in Shielded Cable Shield under Different Lightning Components.
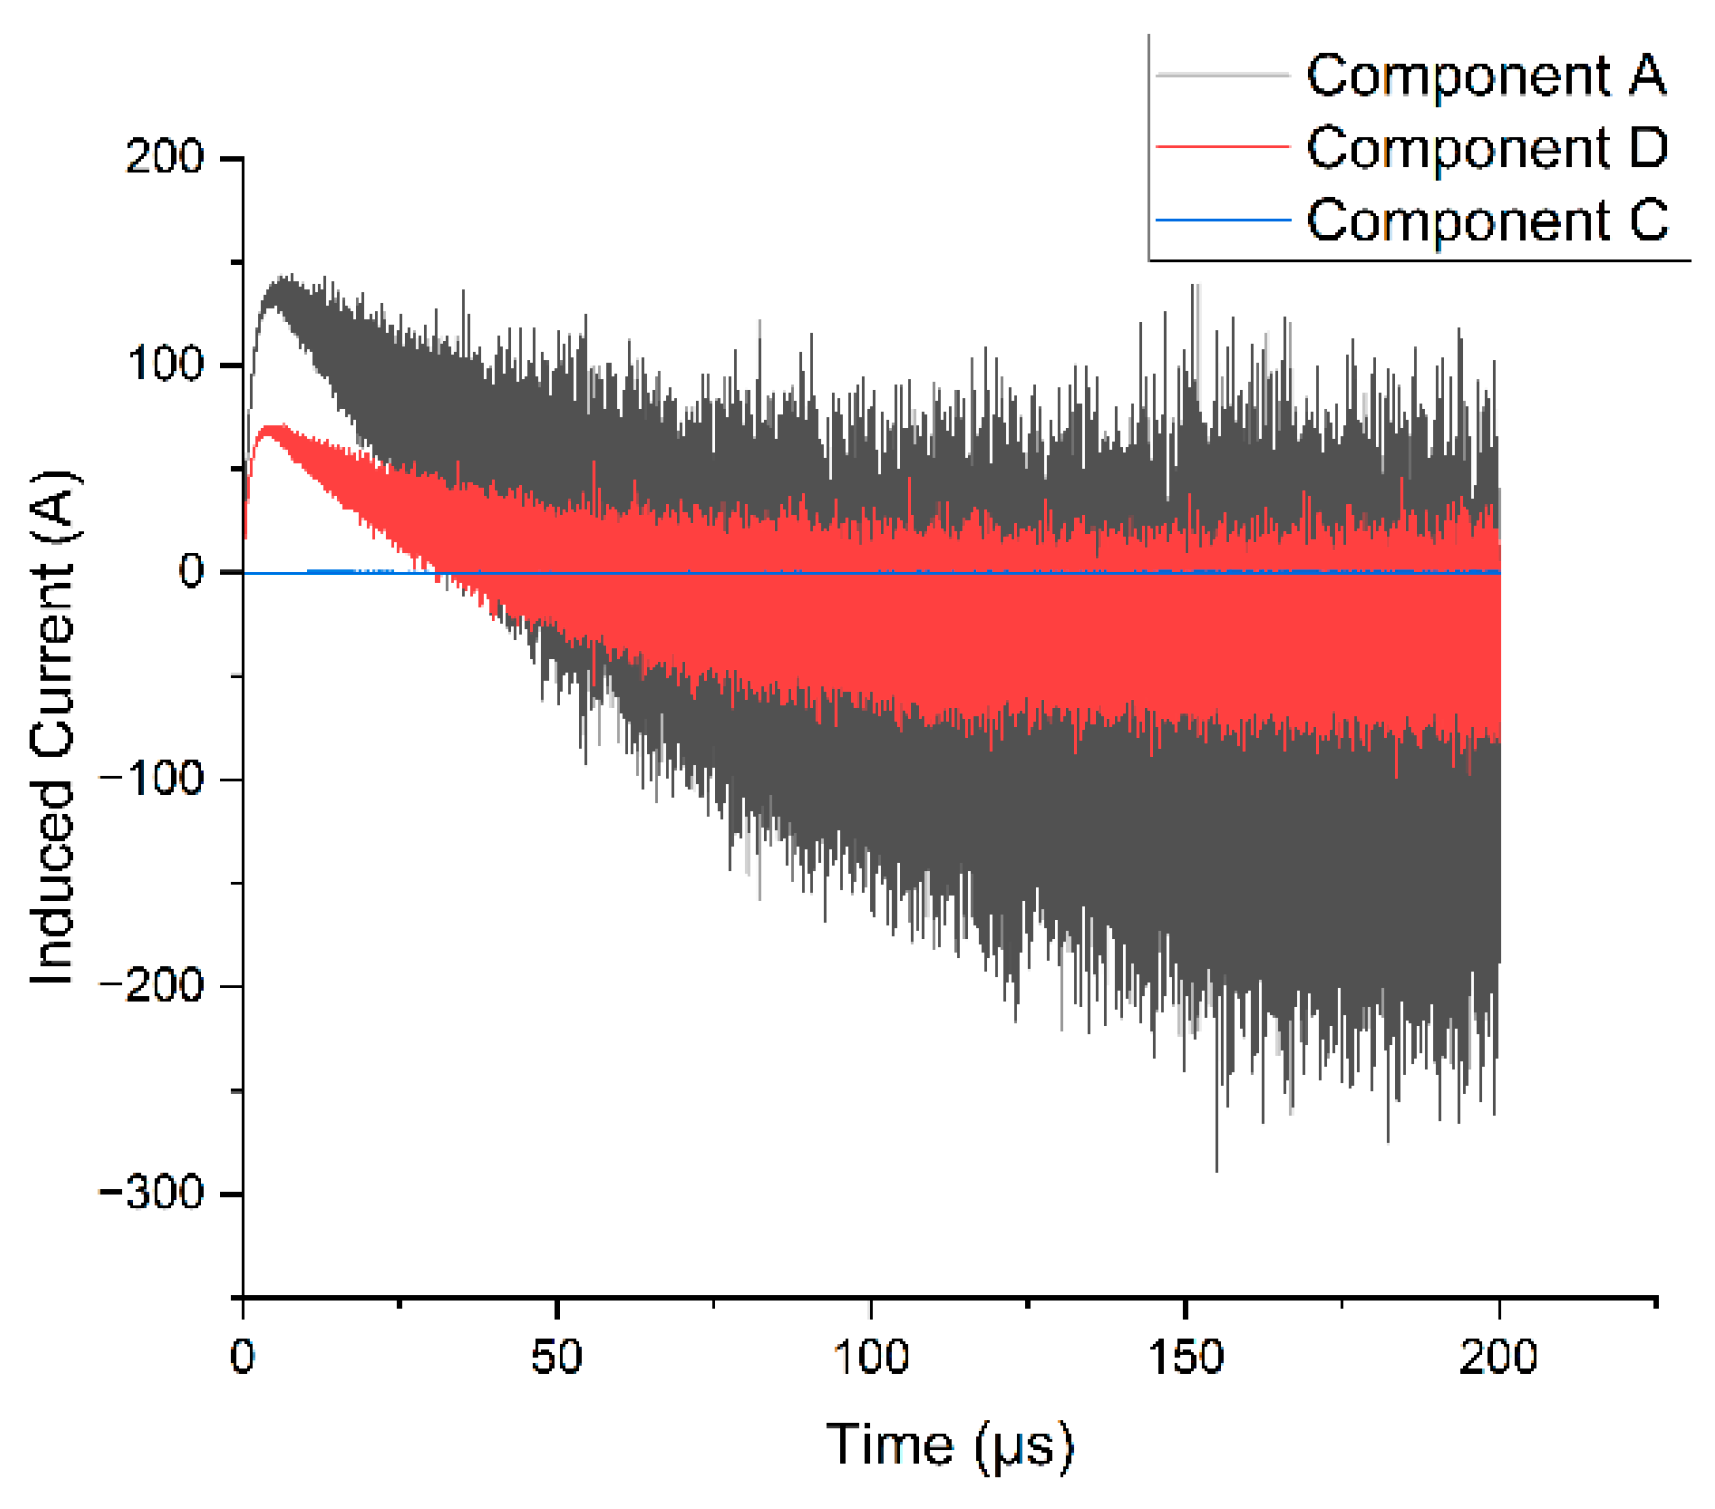
Figure 23.
Time-domain Waveform of Lightning Component A in CST.
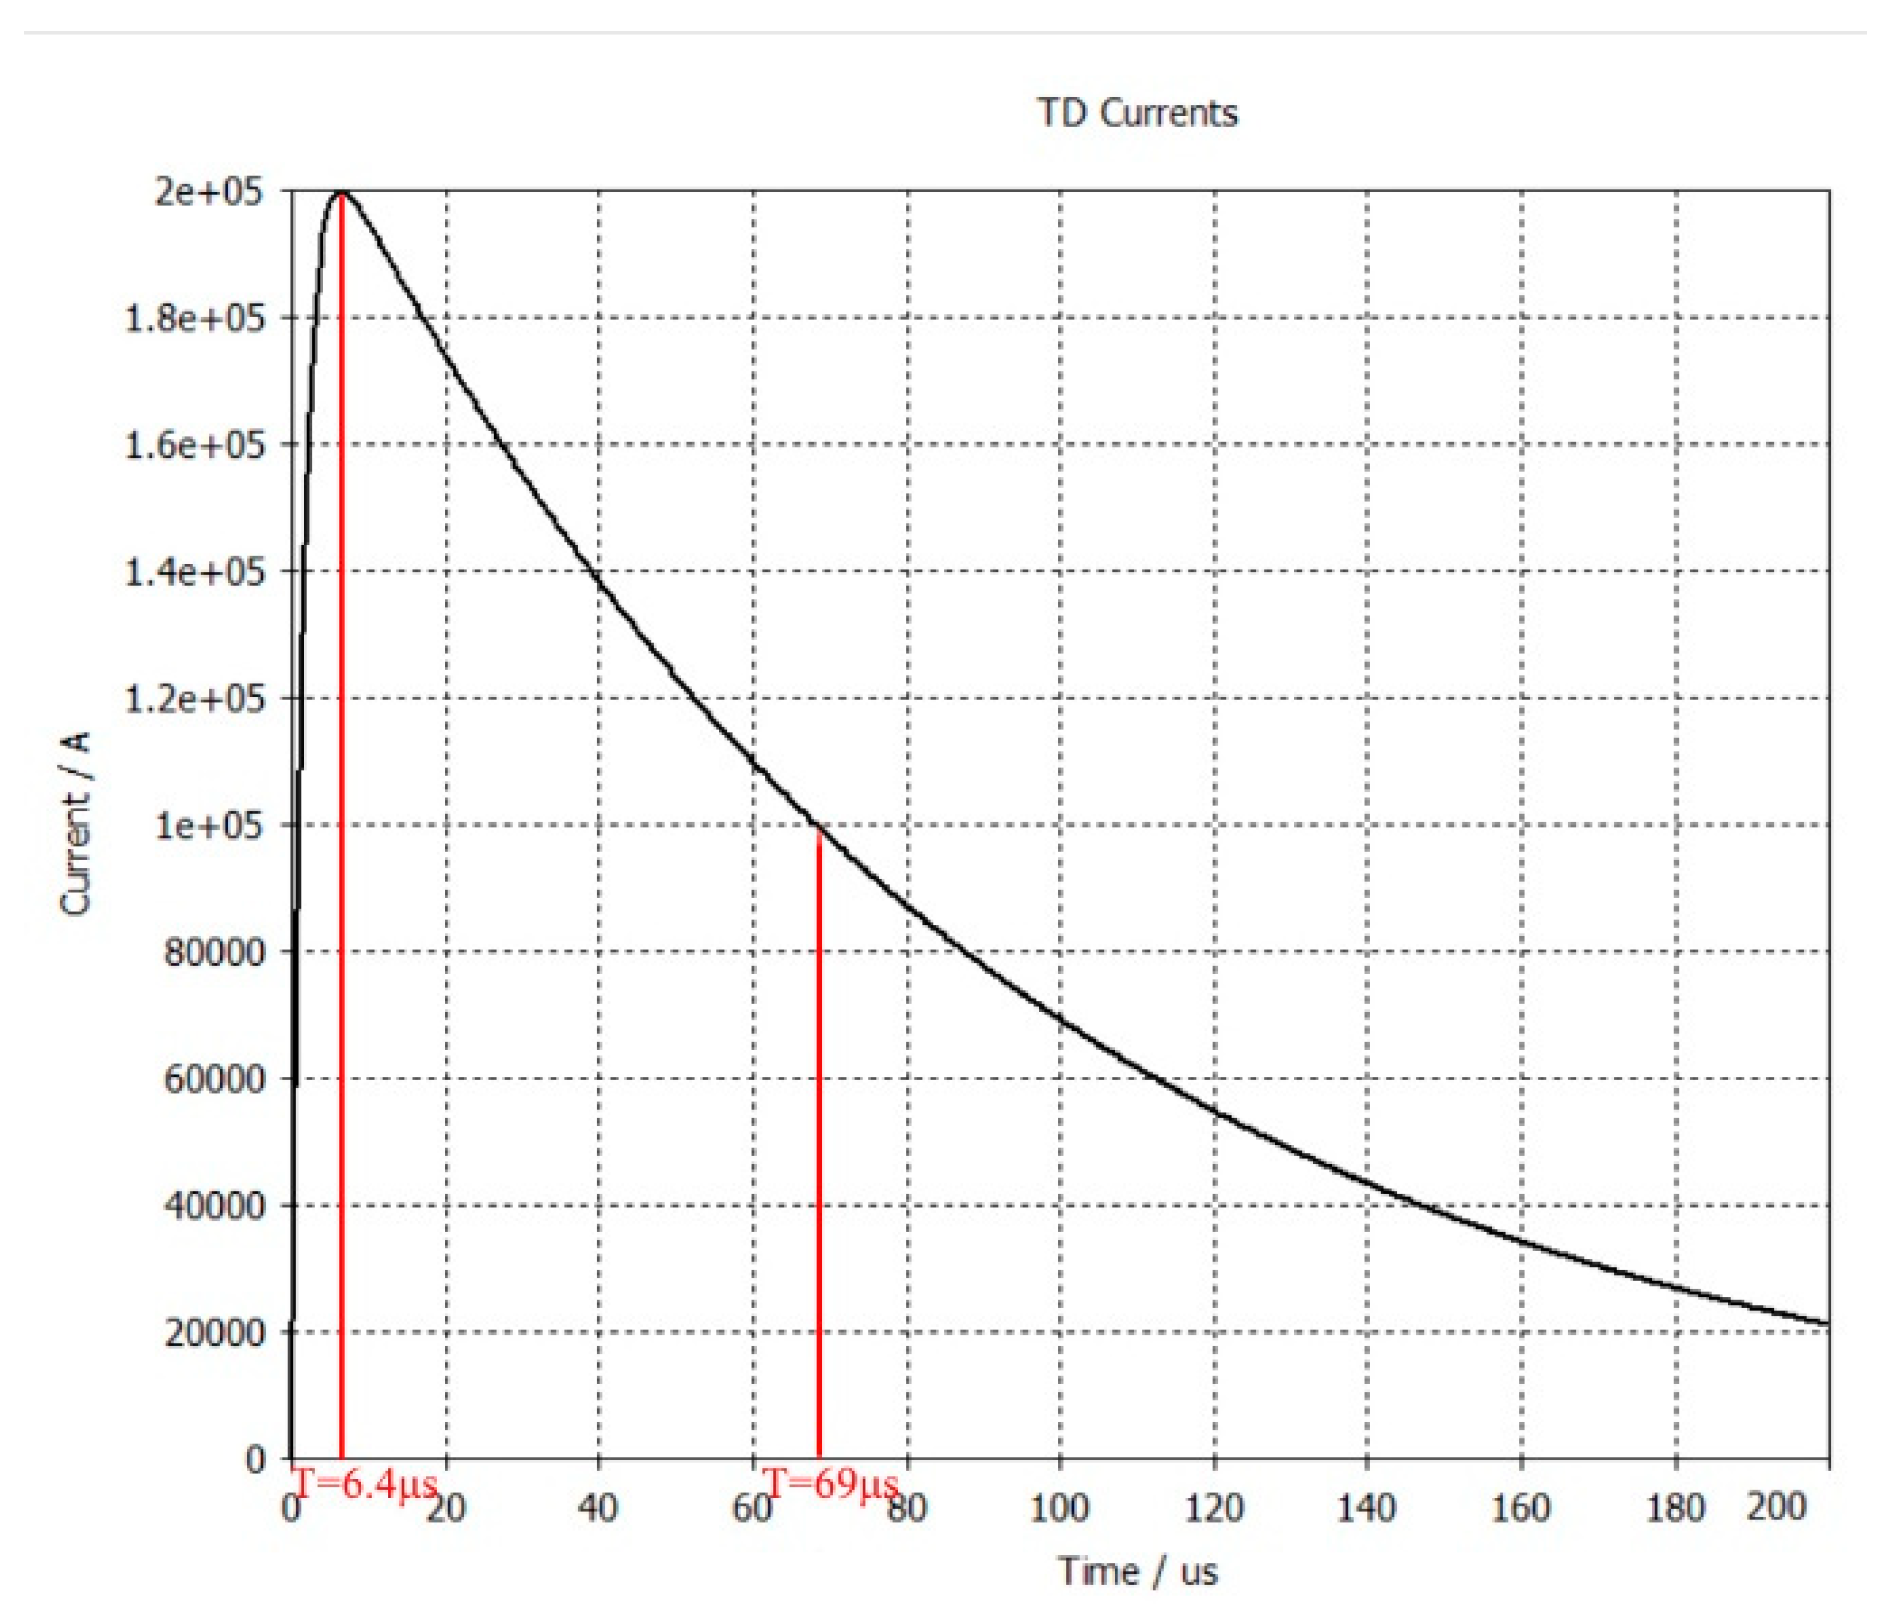
Figure 24.
Unshielded Single-core Cable Structure Diagram.
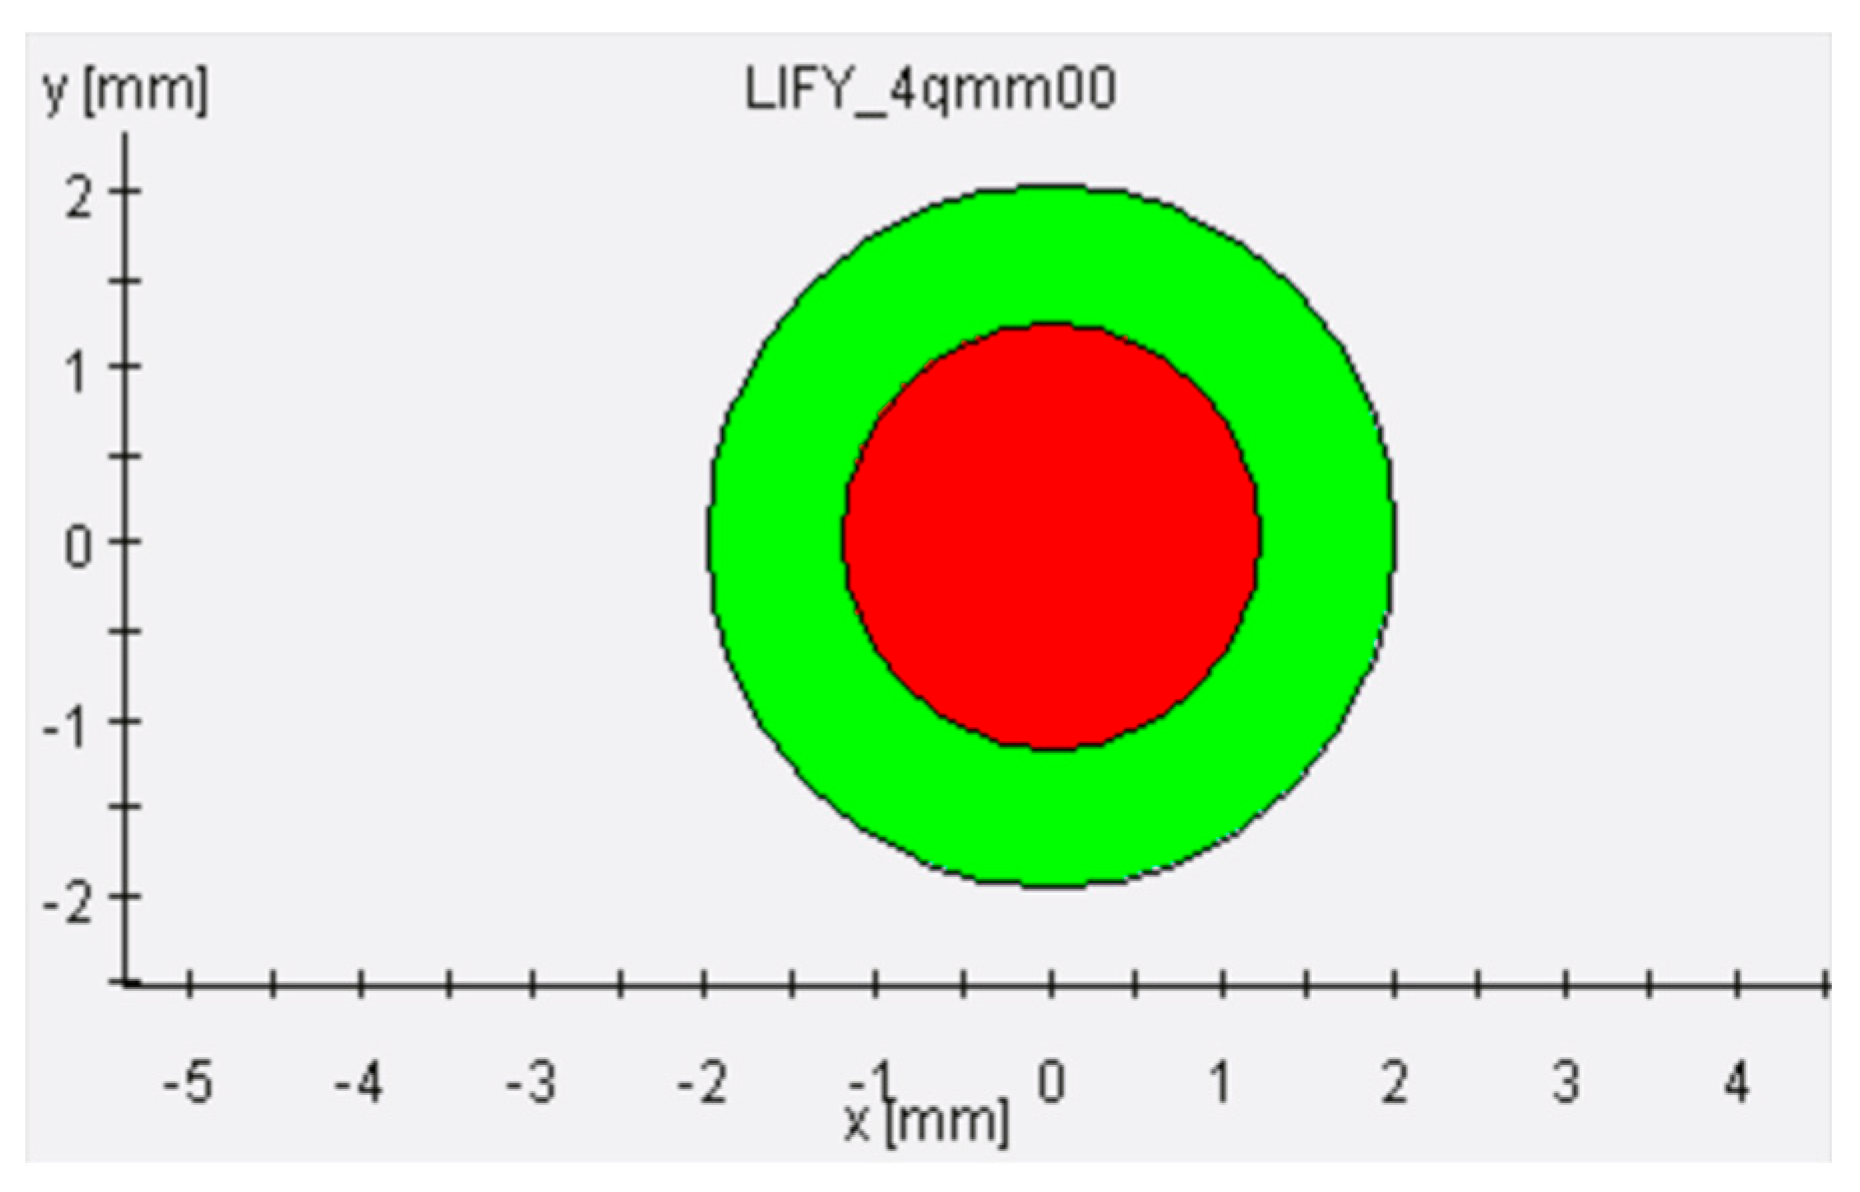
Figure 25.
Unshielded Twisted Pair Cable Structure Diagram.
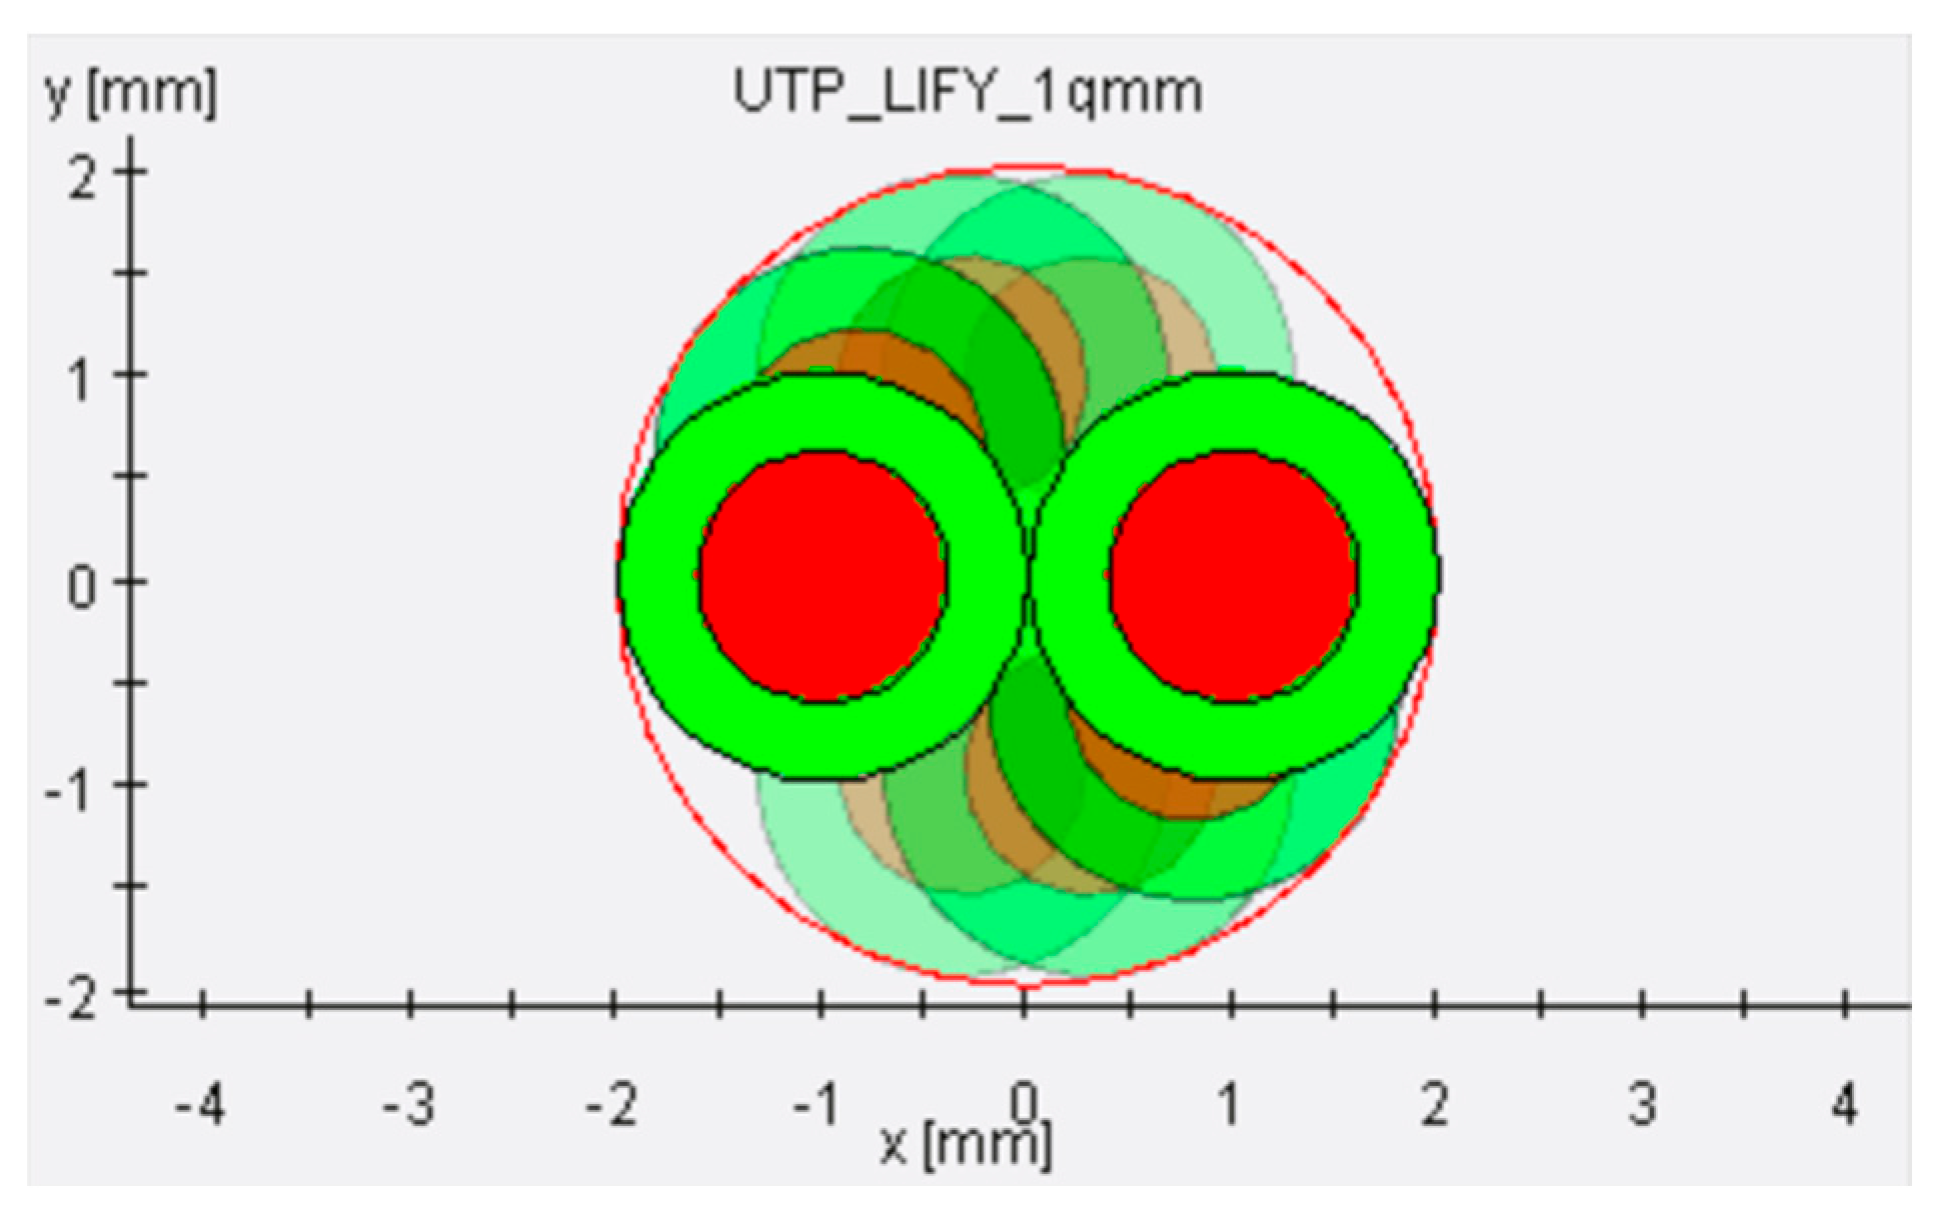
Figure 26.
Shielded Cable Structure Diagram.
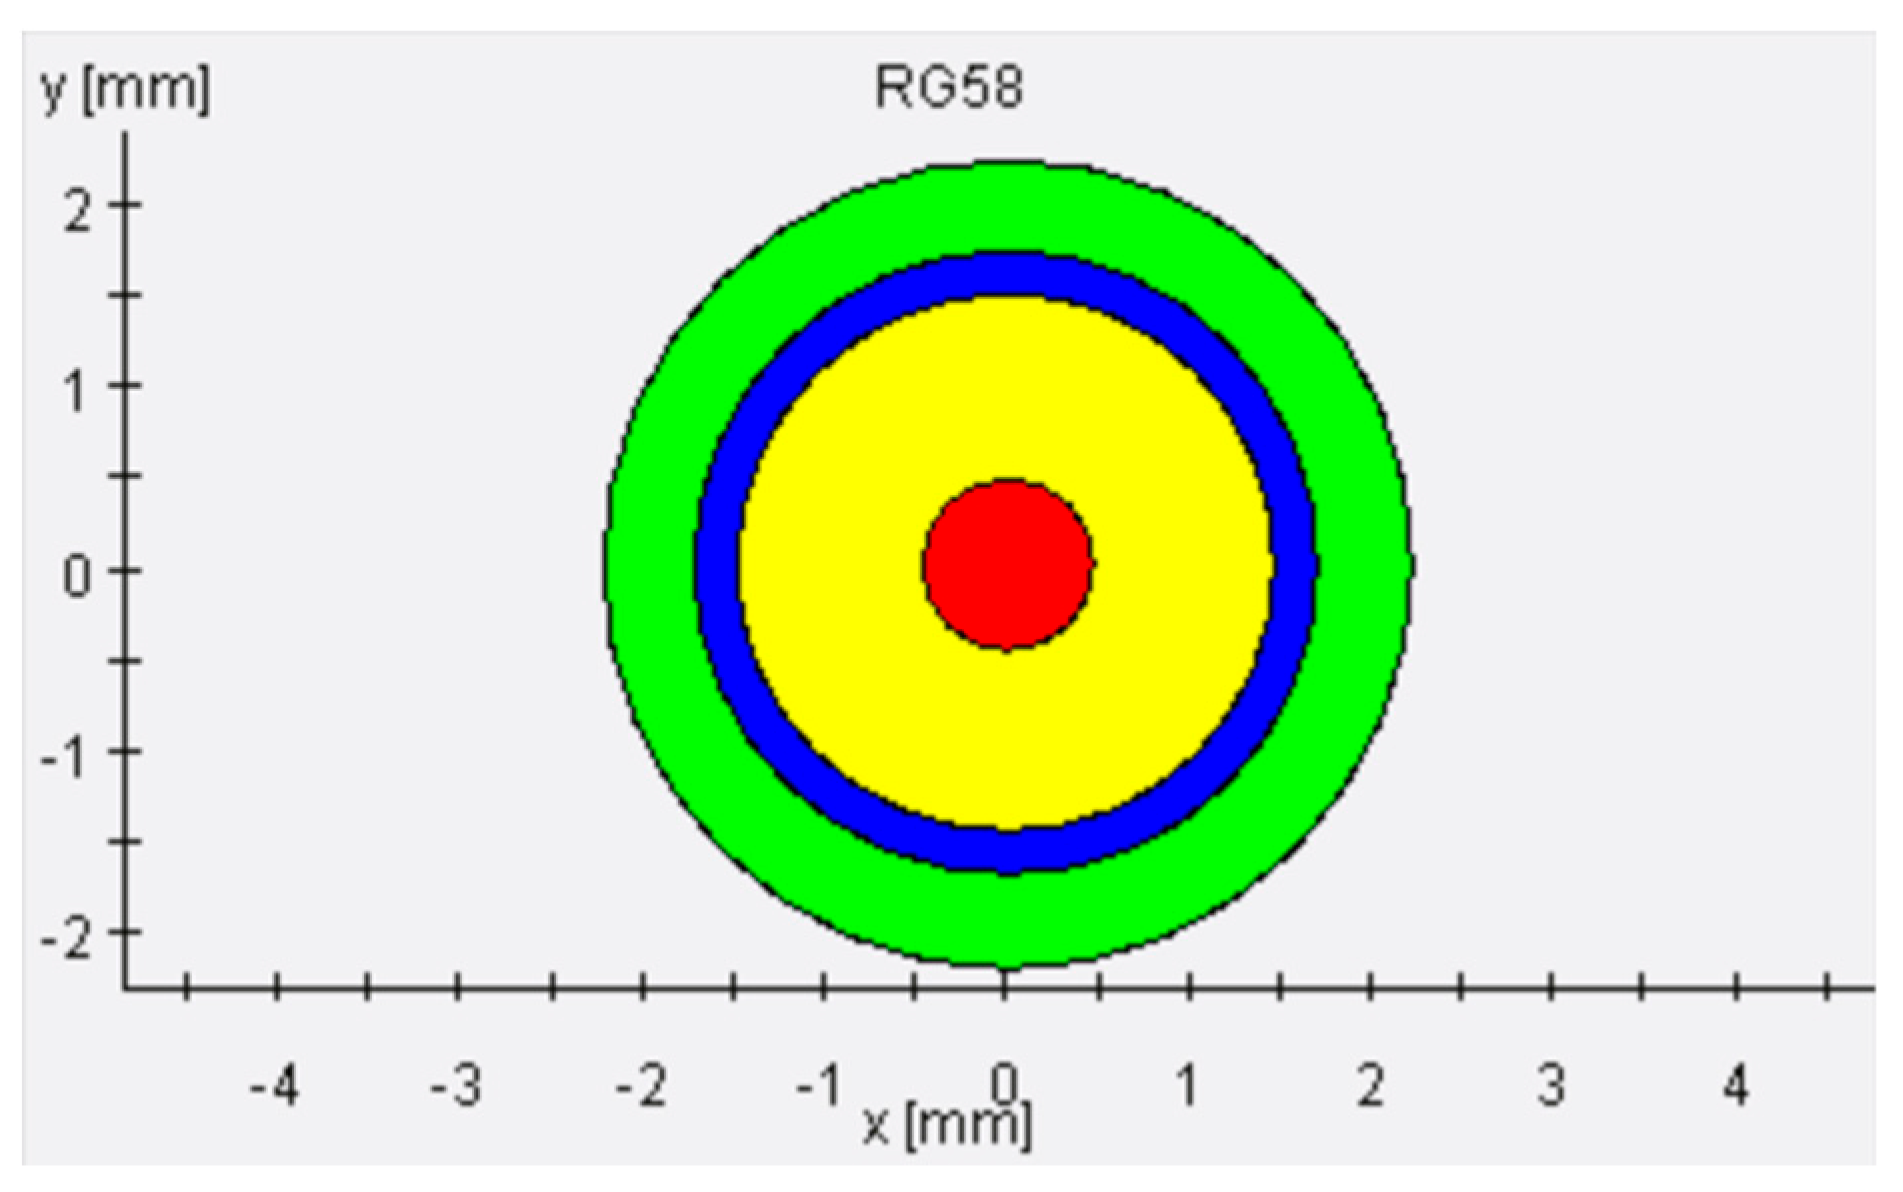
Figure 27.
Cable Arrangement Diagram.
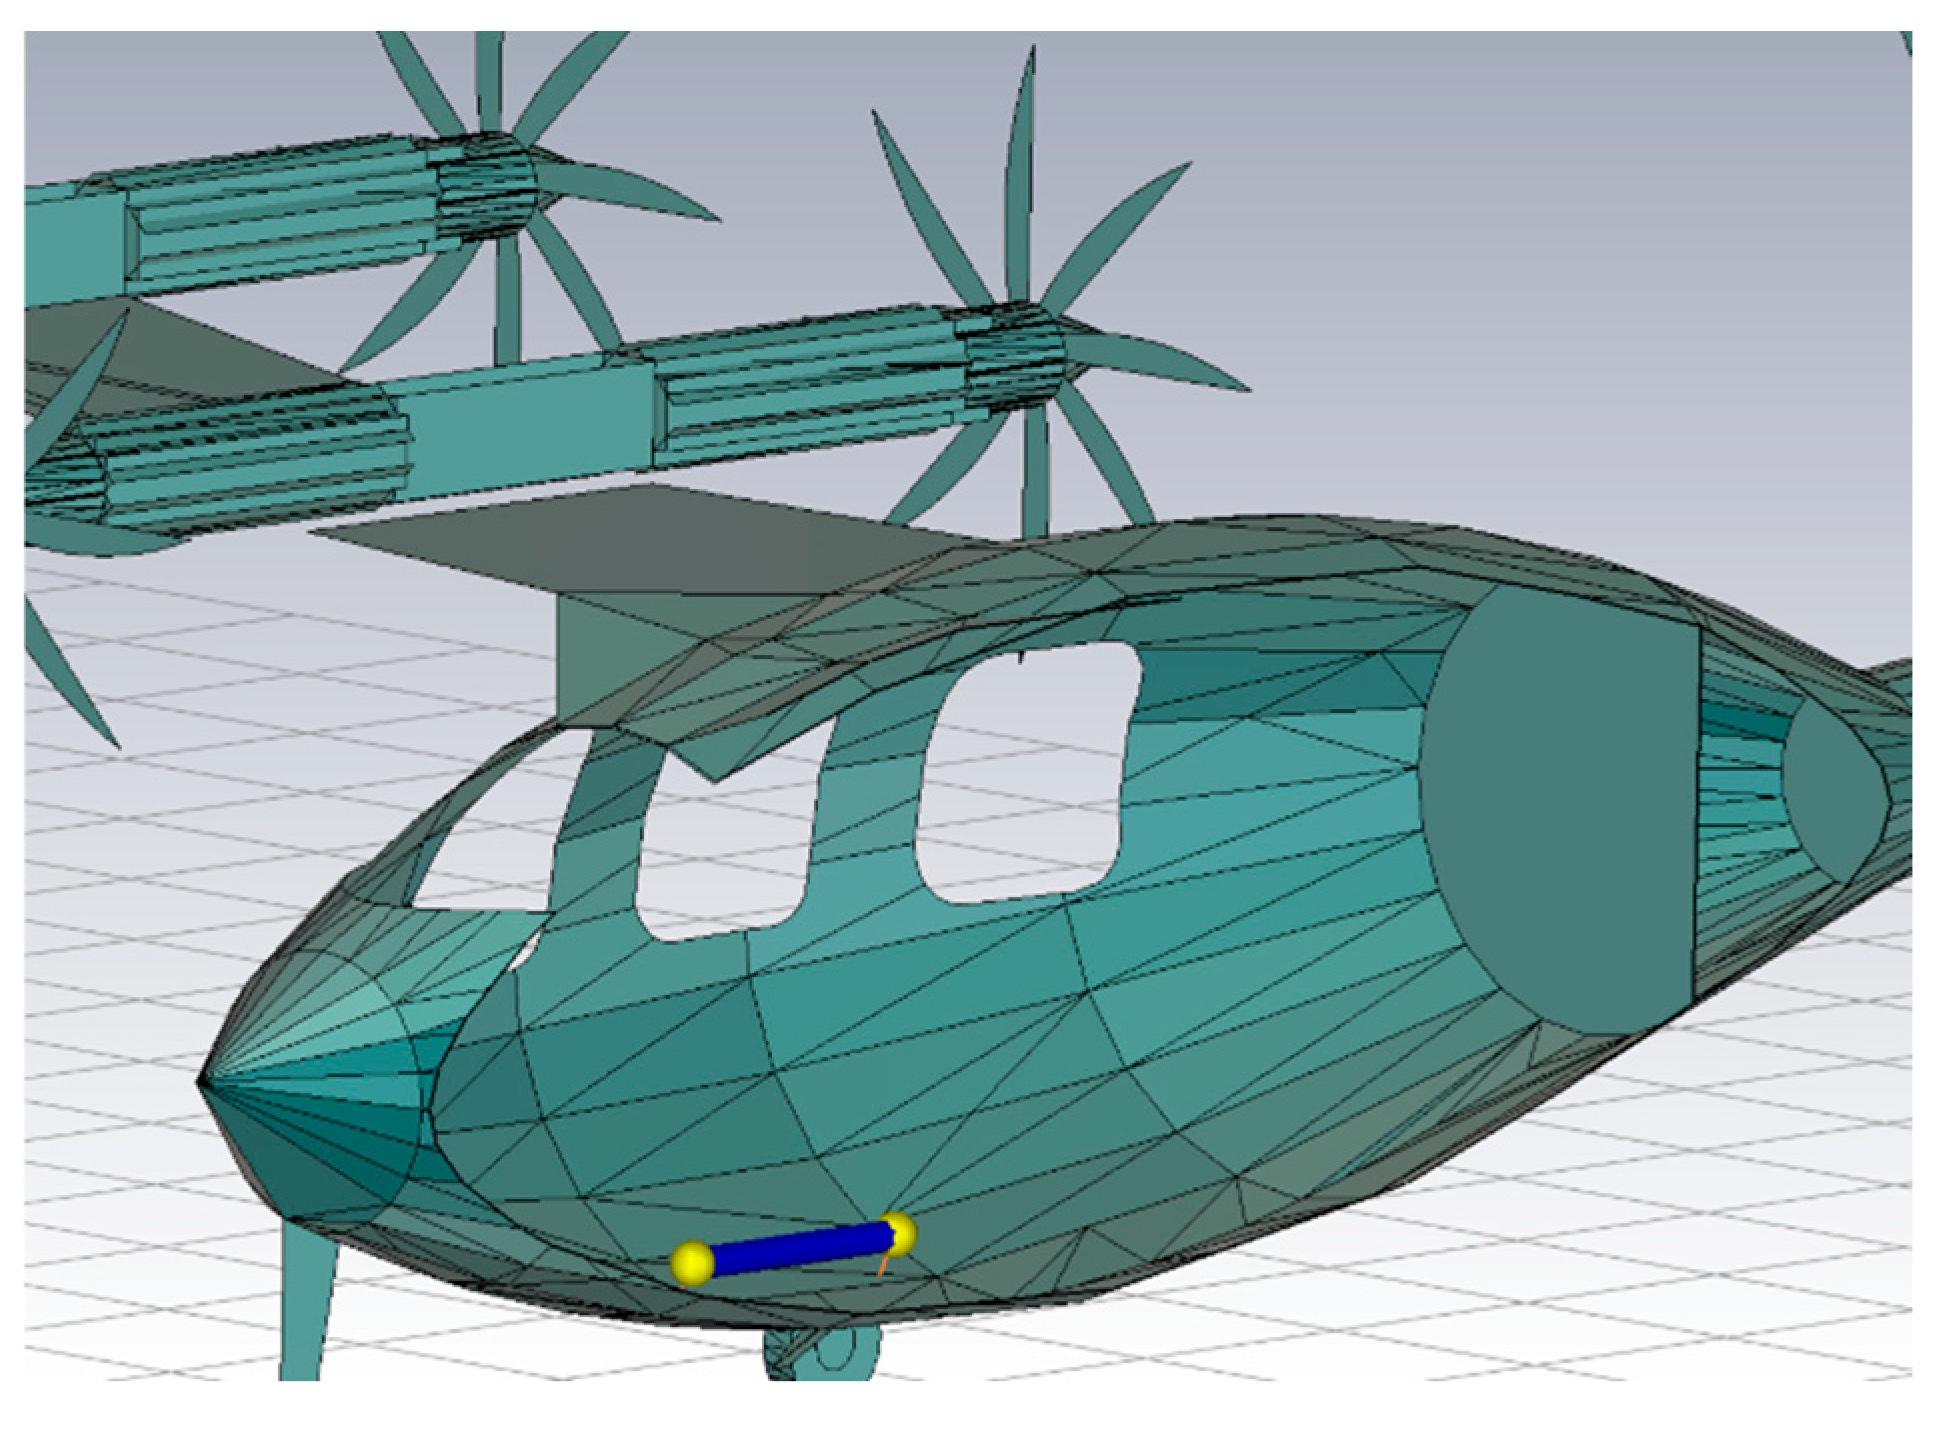
Figure 28.
Lightning Strike Location Diagrams: (a) Nose (b); Vertical Tail; (c) Wing.
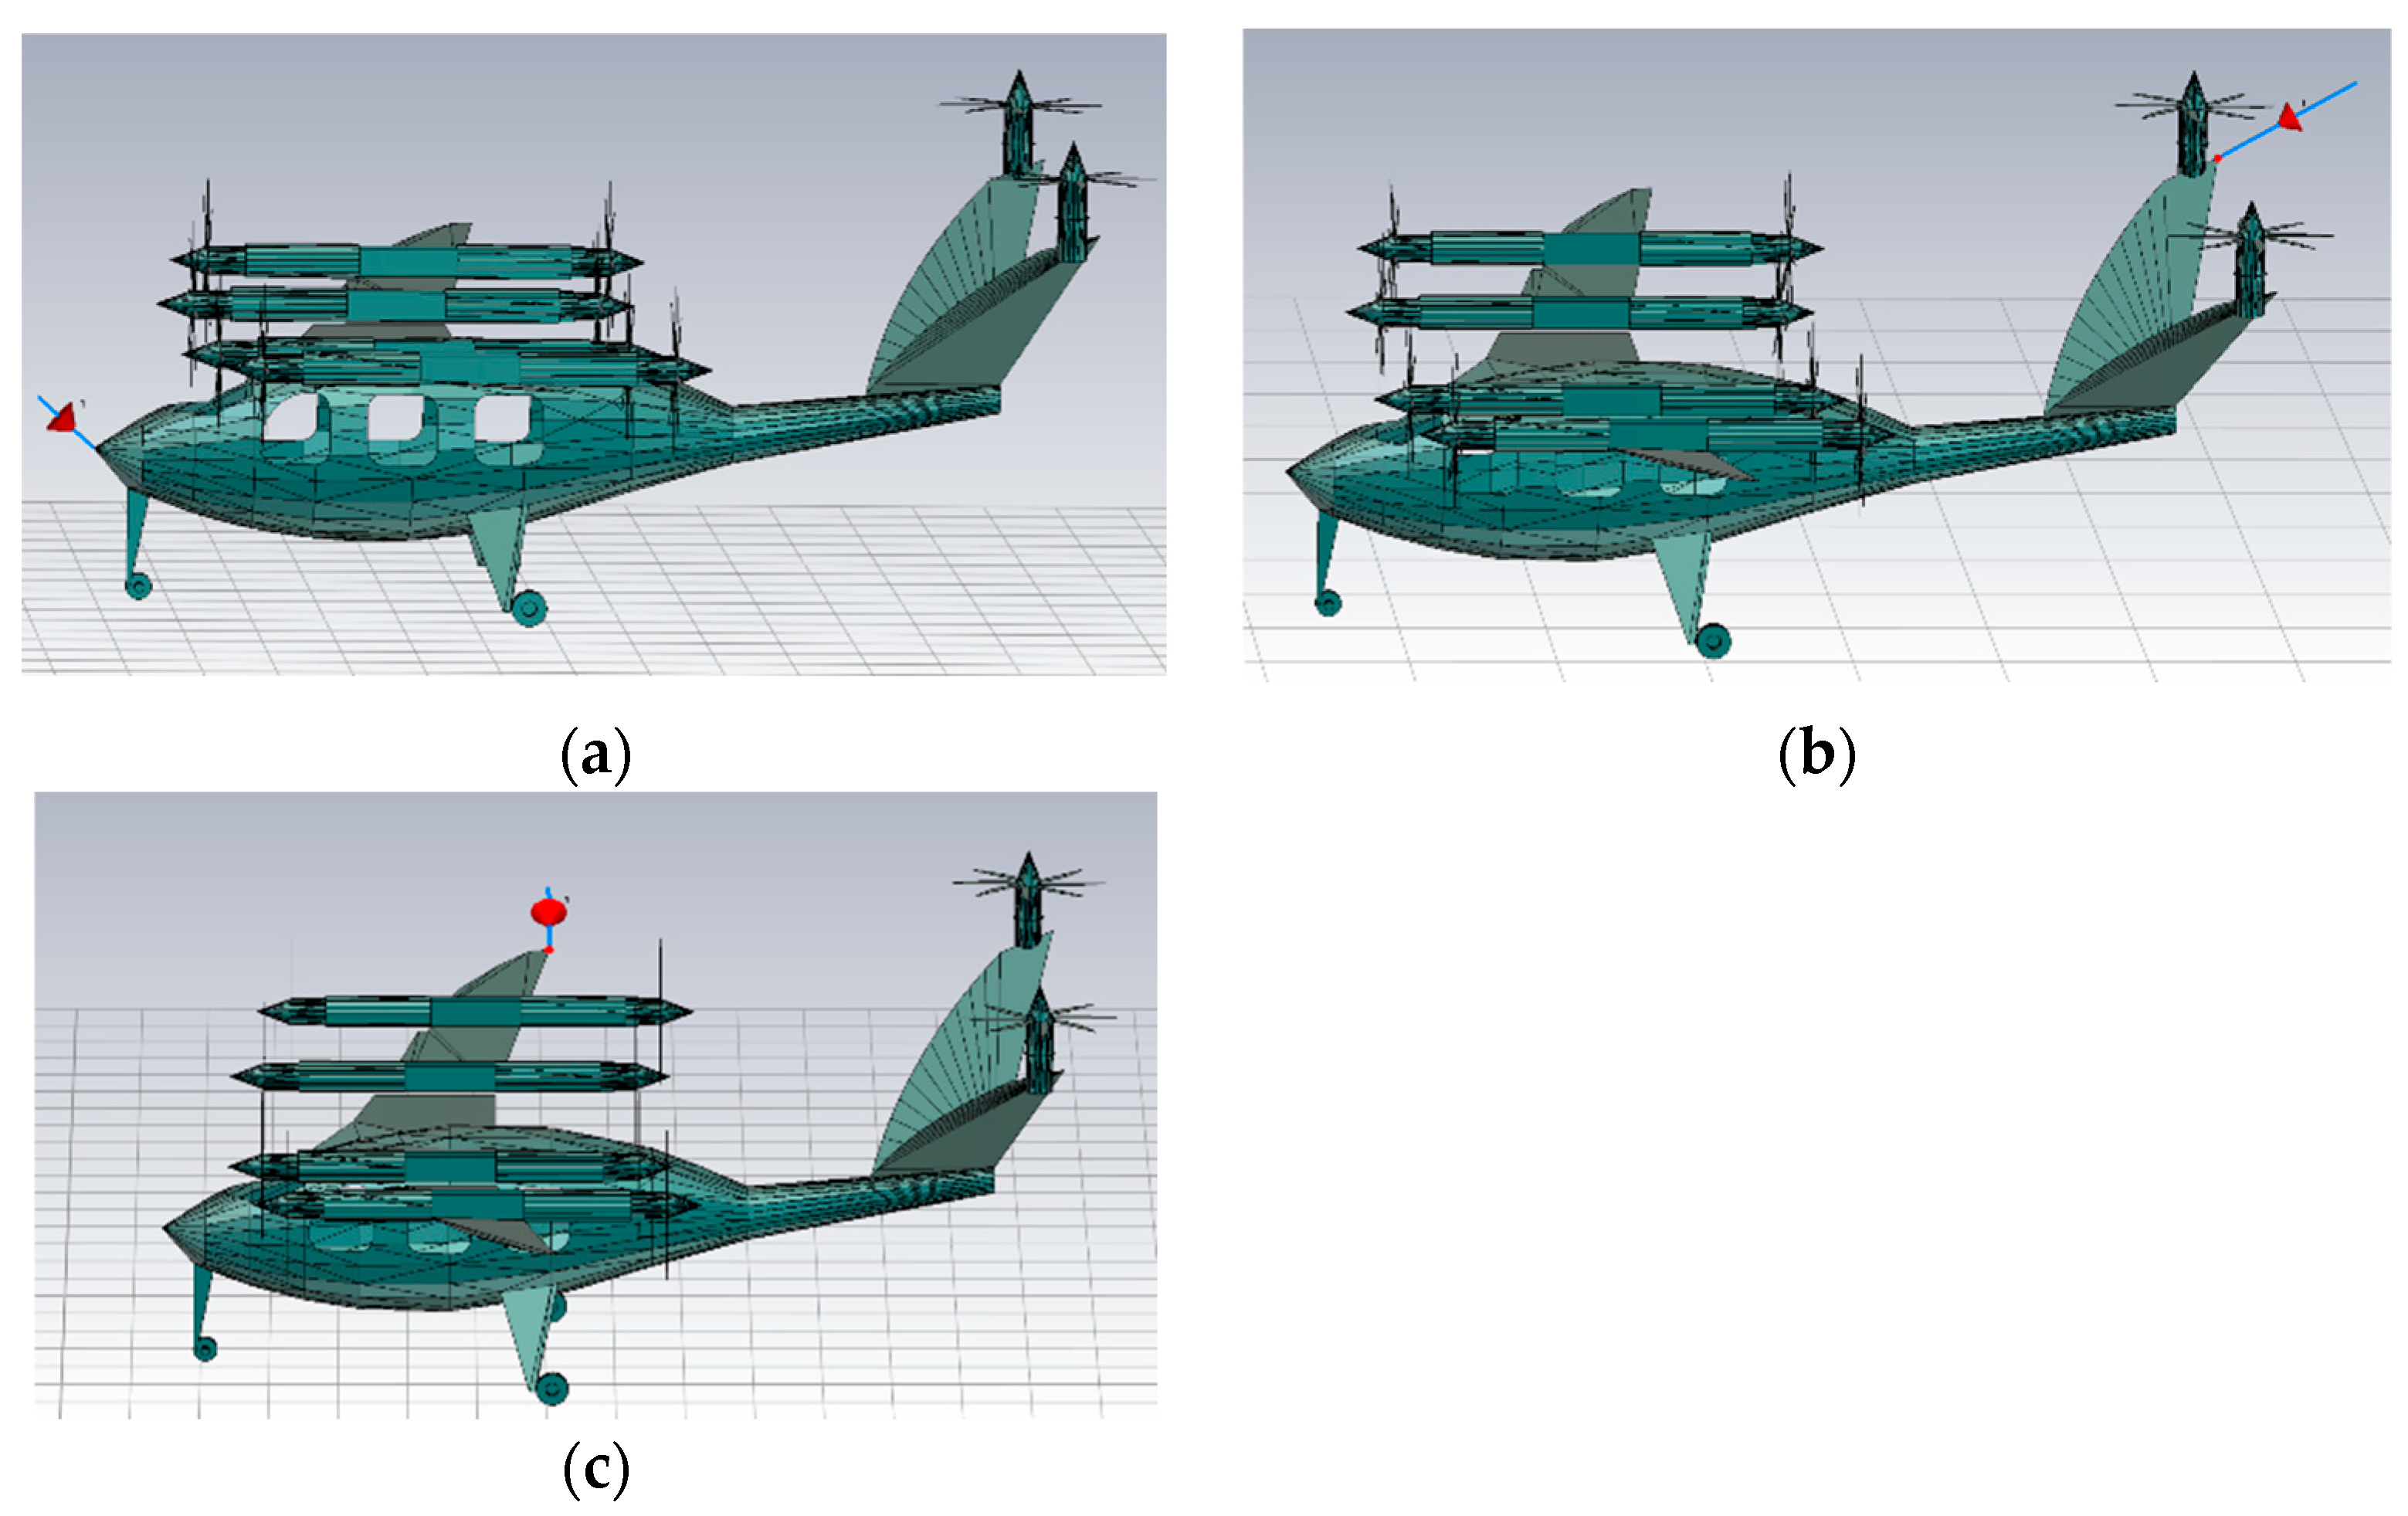
Figure 29.
Monitor Parameter Settings.
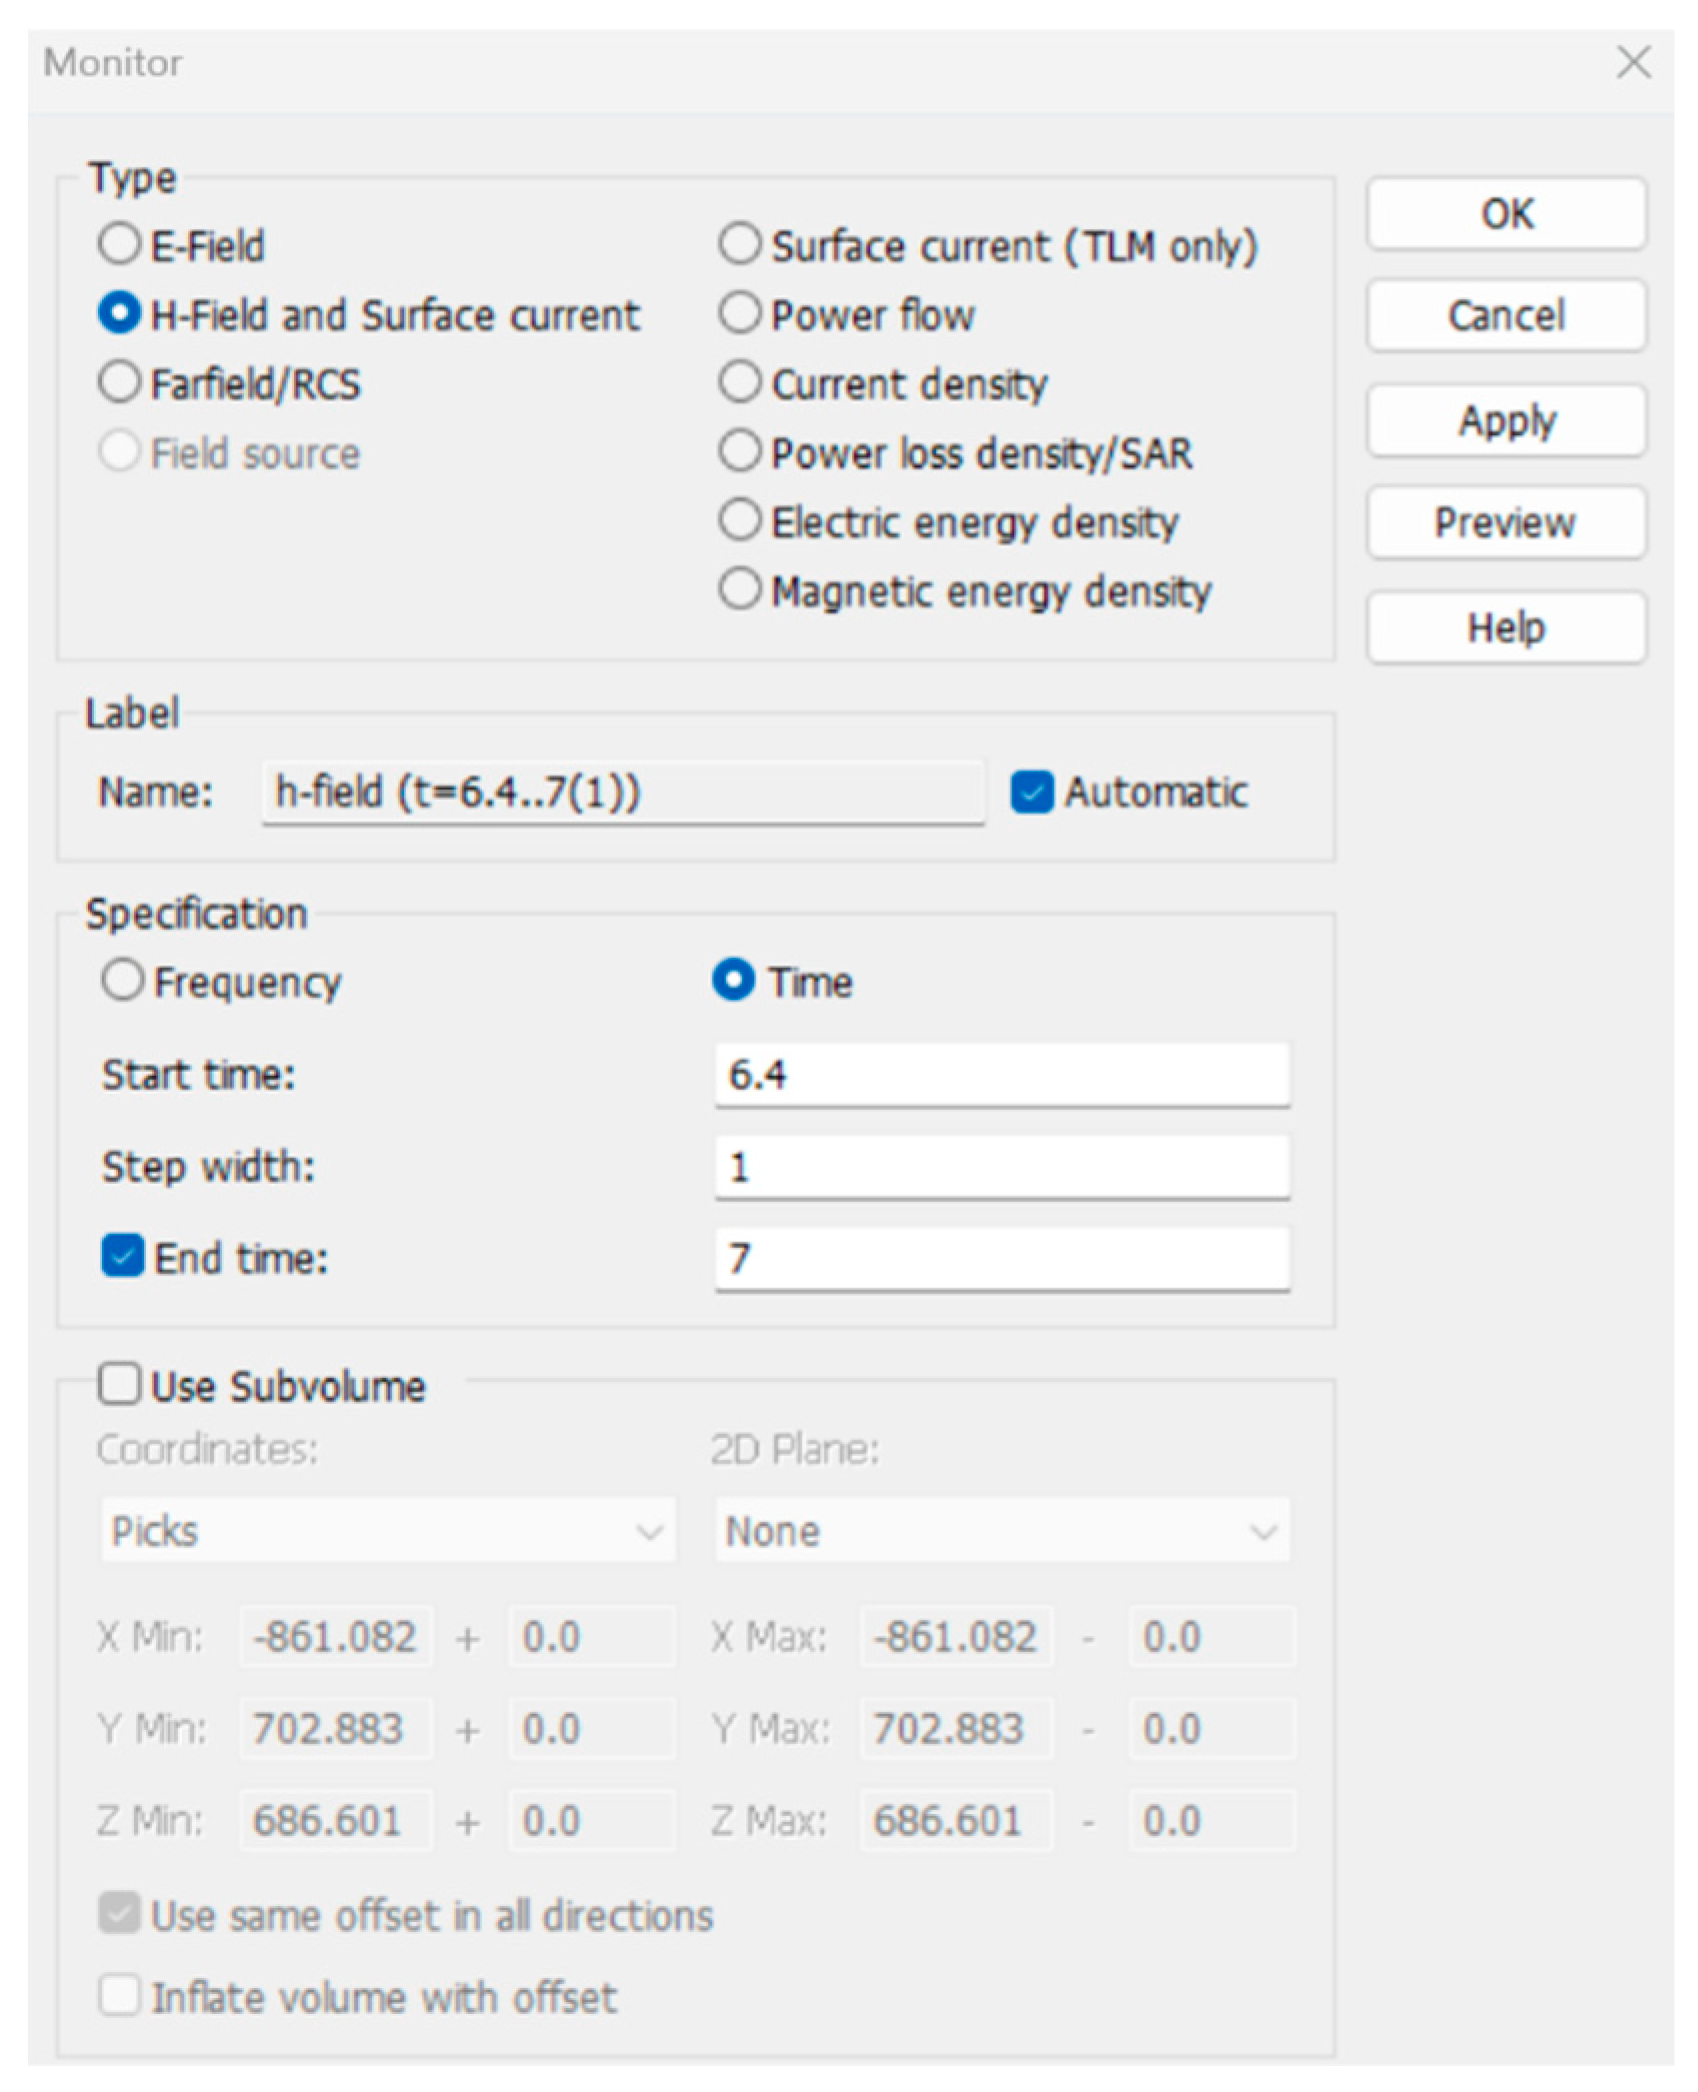
Figure 30.
Surface Electric Field Distribution When Struck at the Nose (dB).
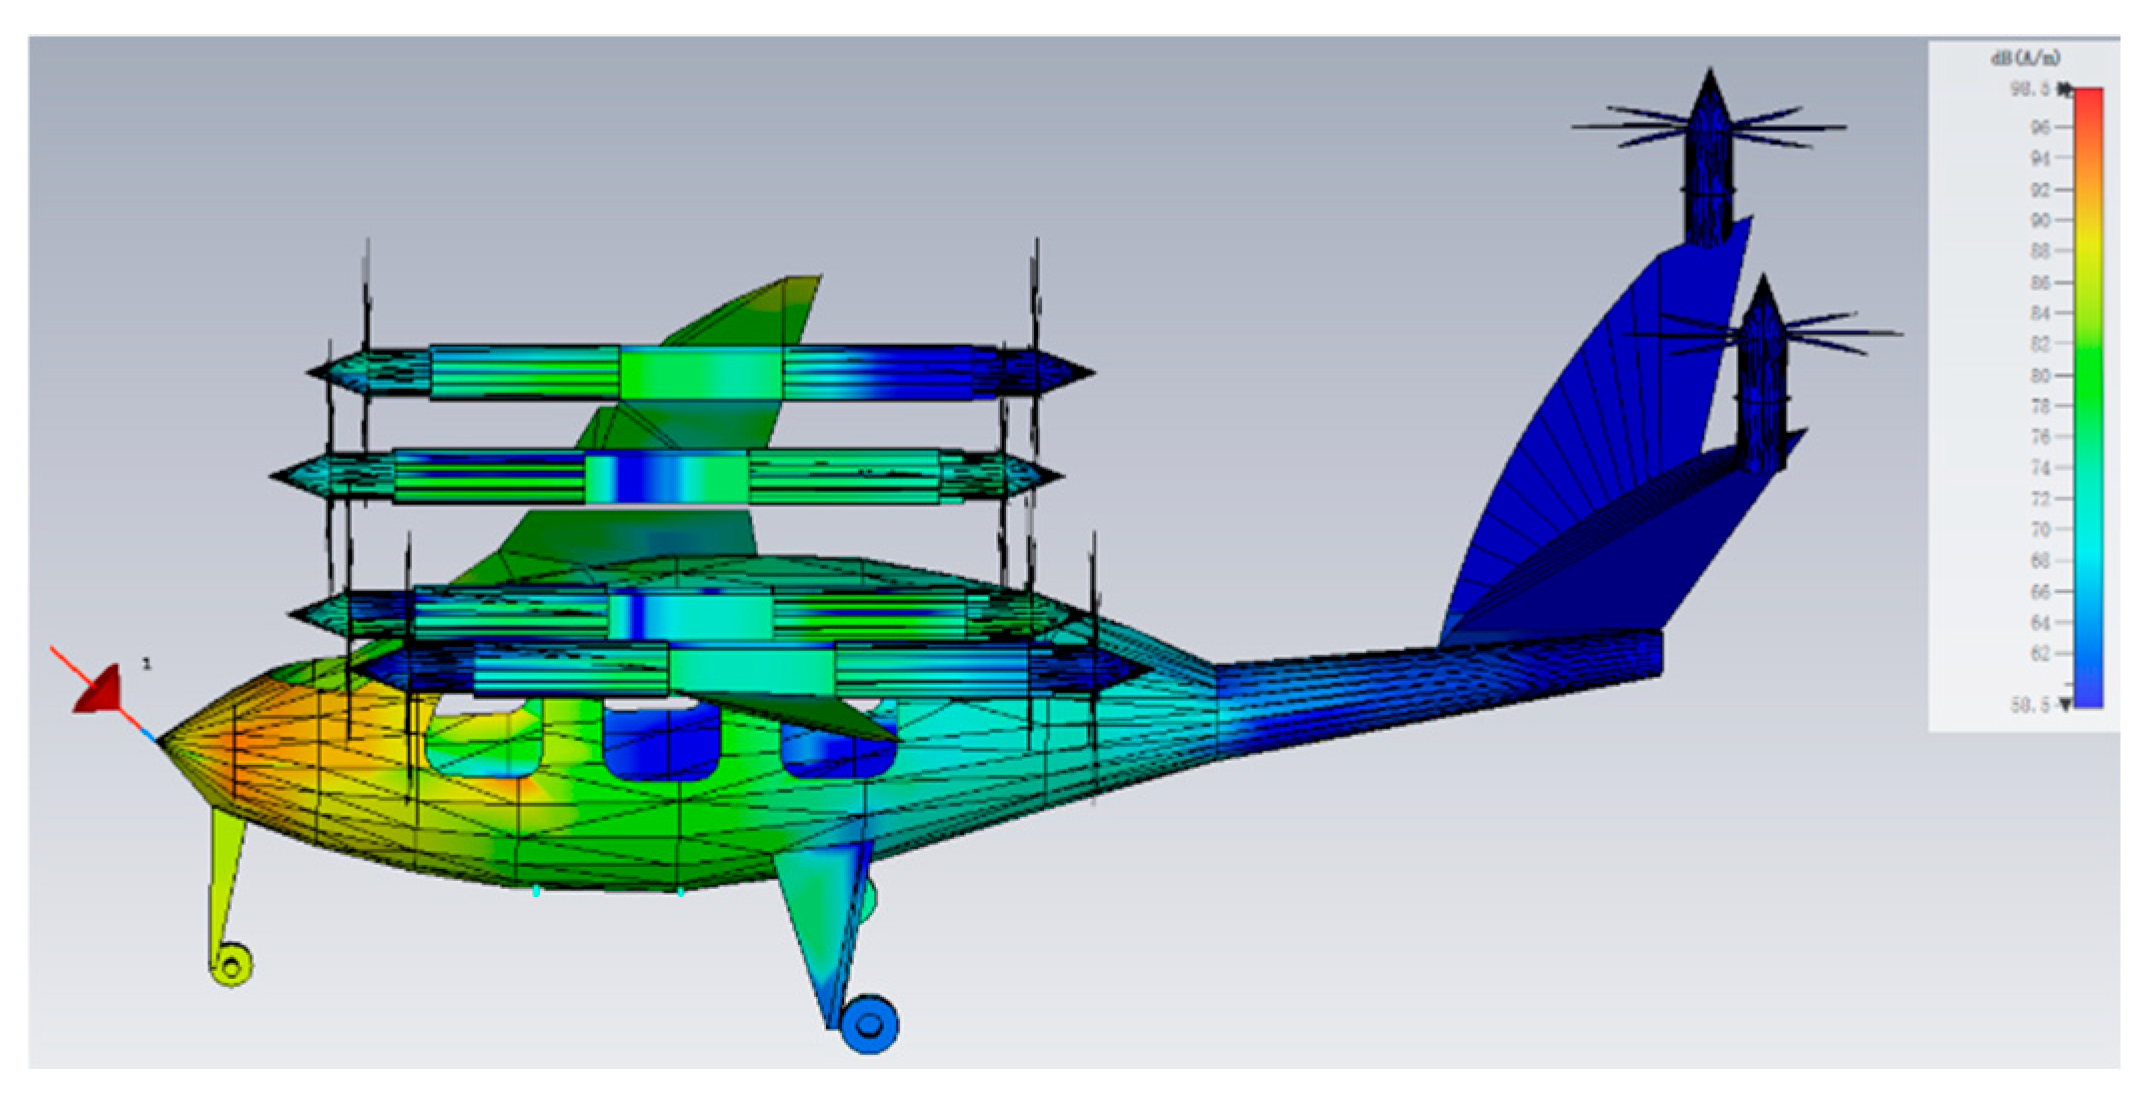
Figure 31.
Surface Electric Field Distribution When Struck at the Wing (dB).
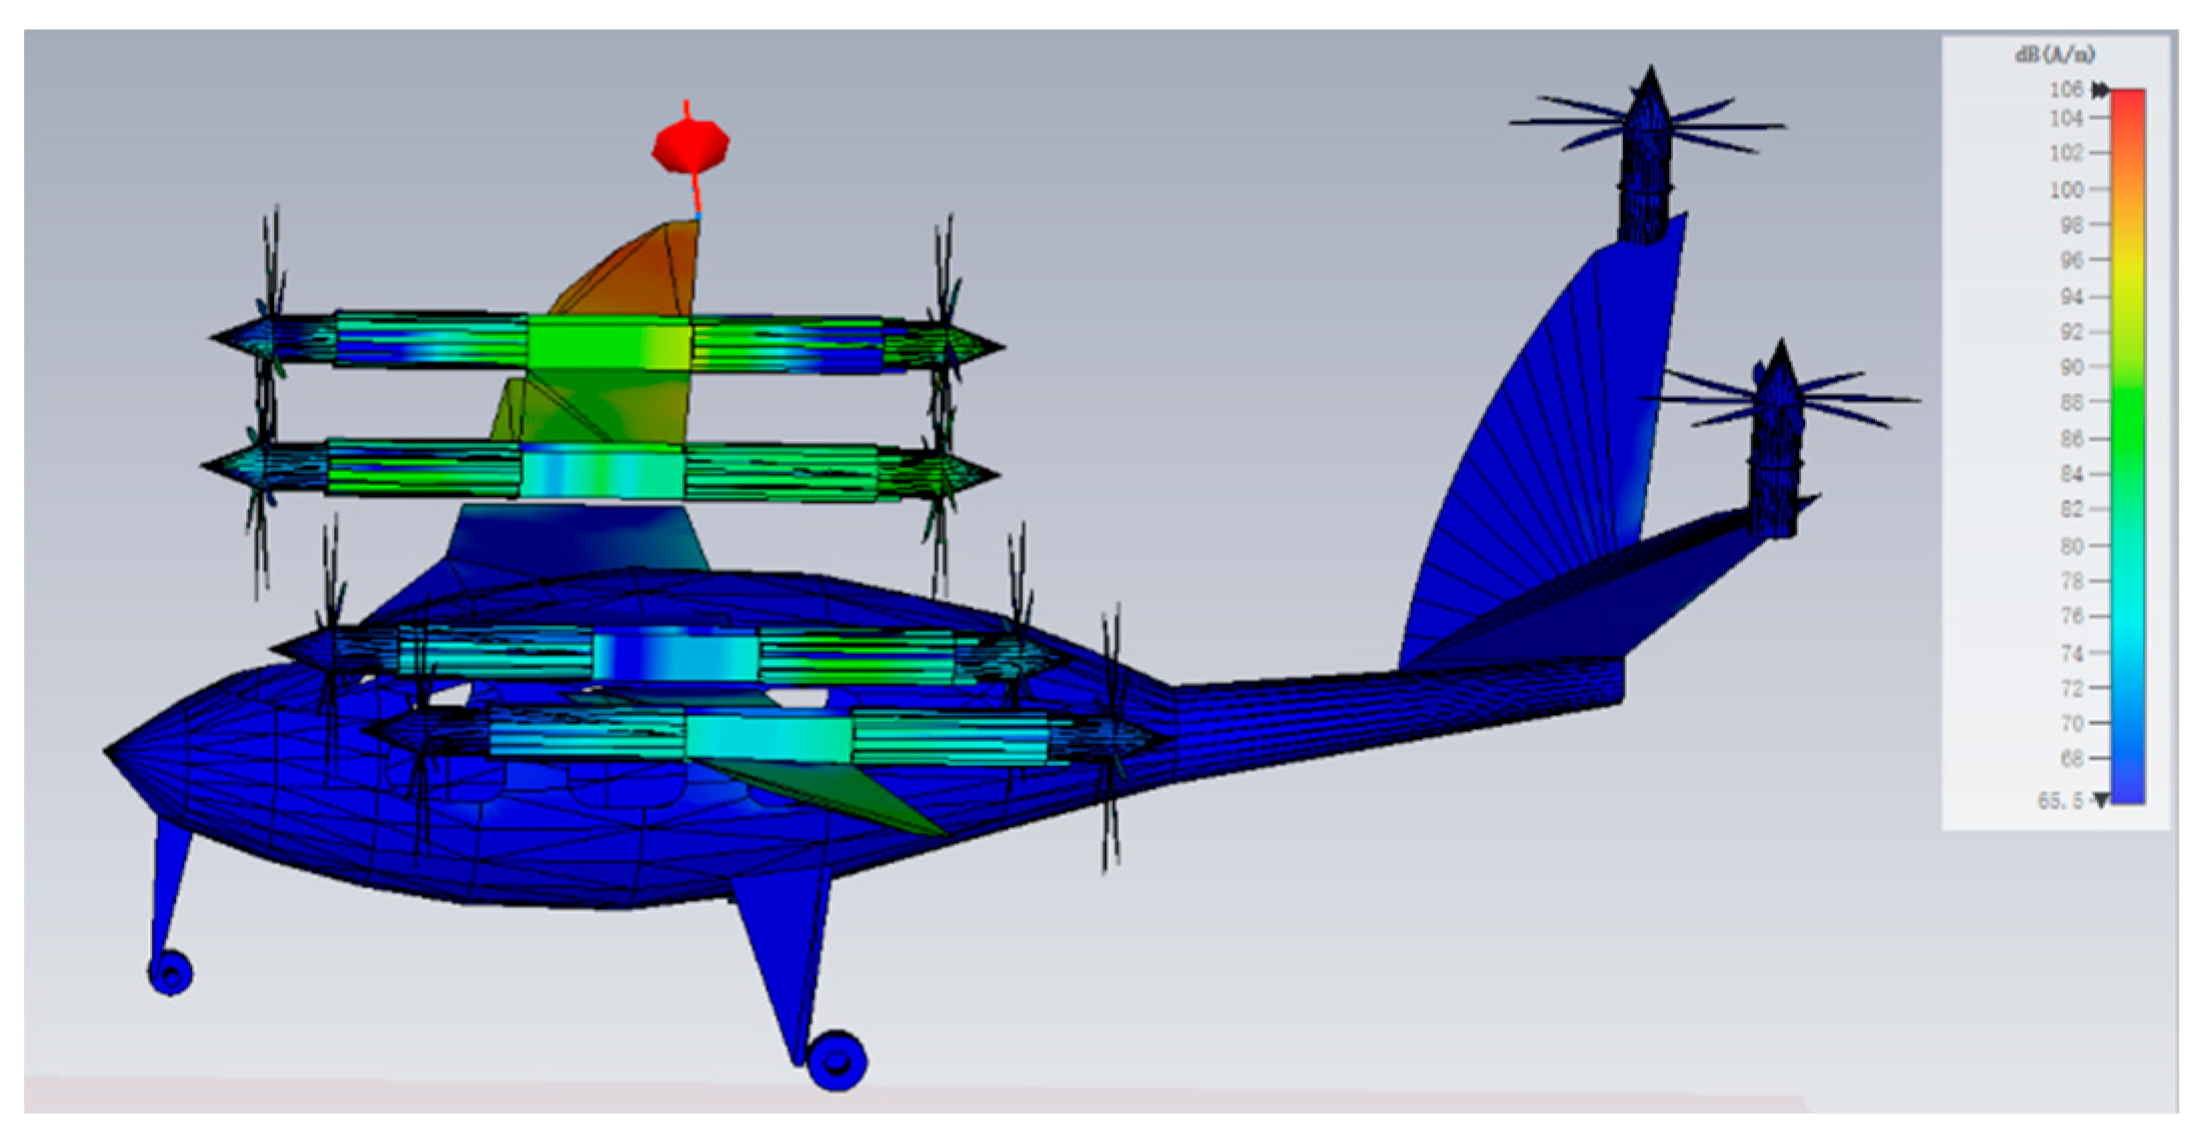
Figure 32.
Surface Electric Field Distribution When Struck at the Vertical Tail (dB).
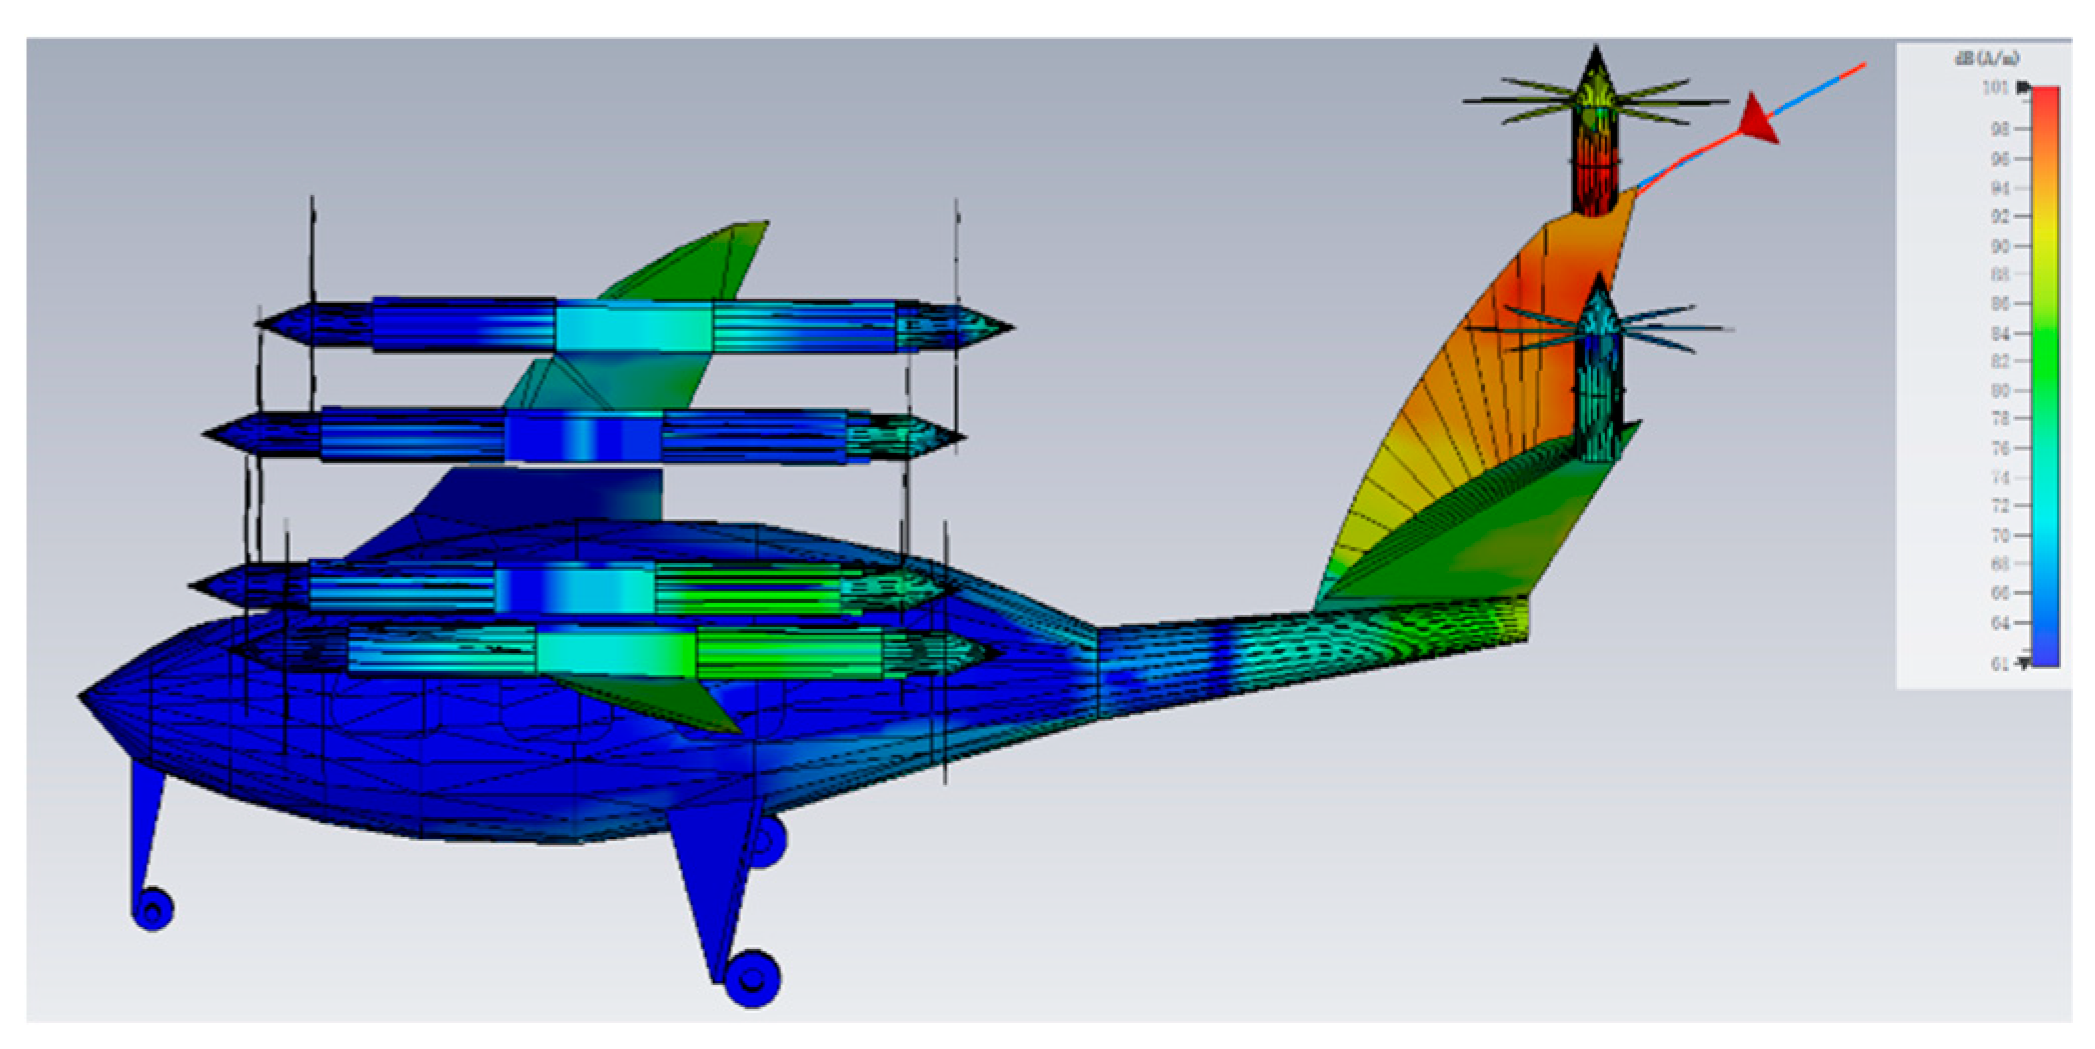
Figure 33.
Surface Magnetic Field Distribution When Struck at the Nose (dB).
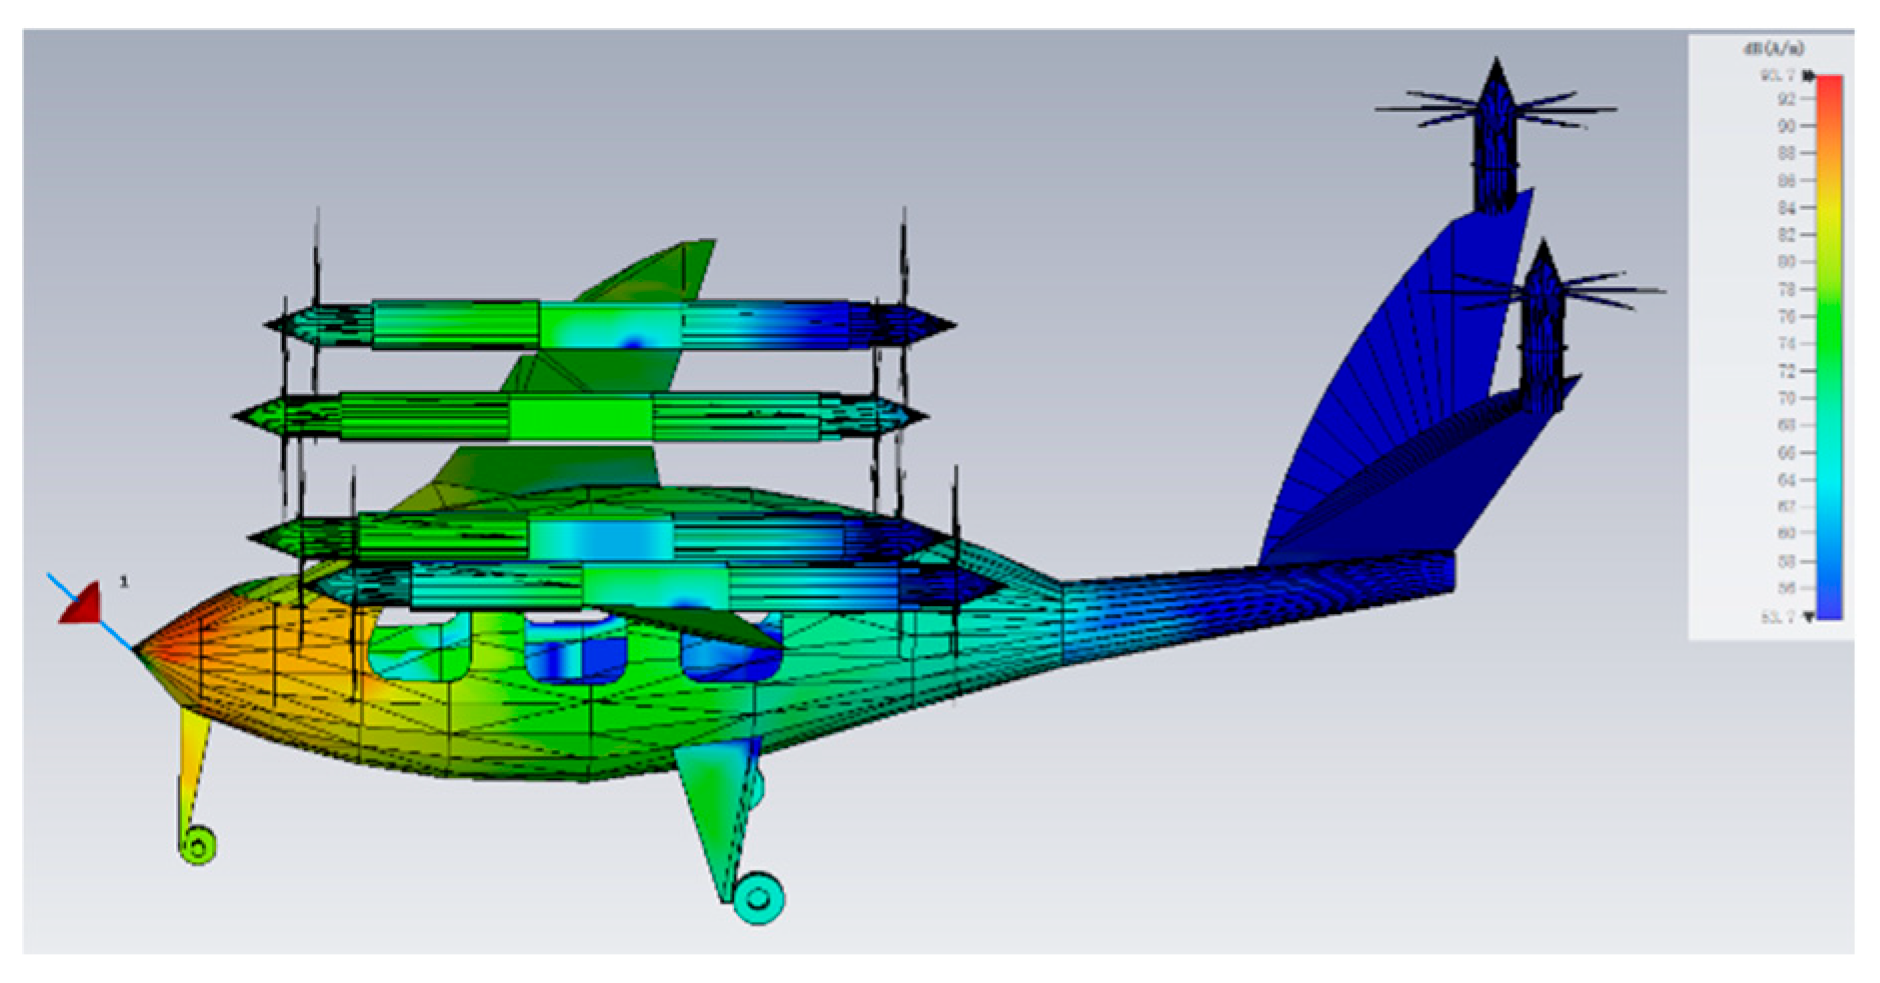
Figure 34.
Surface Magnetic Field Distribution When Struck at the Wing (dB).
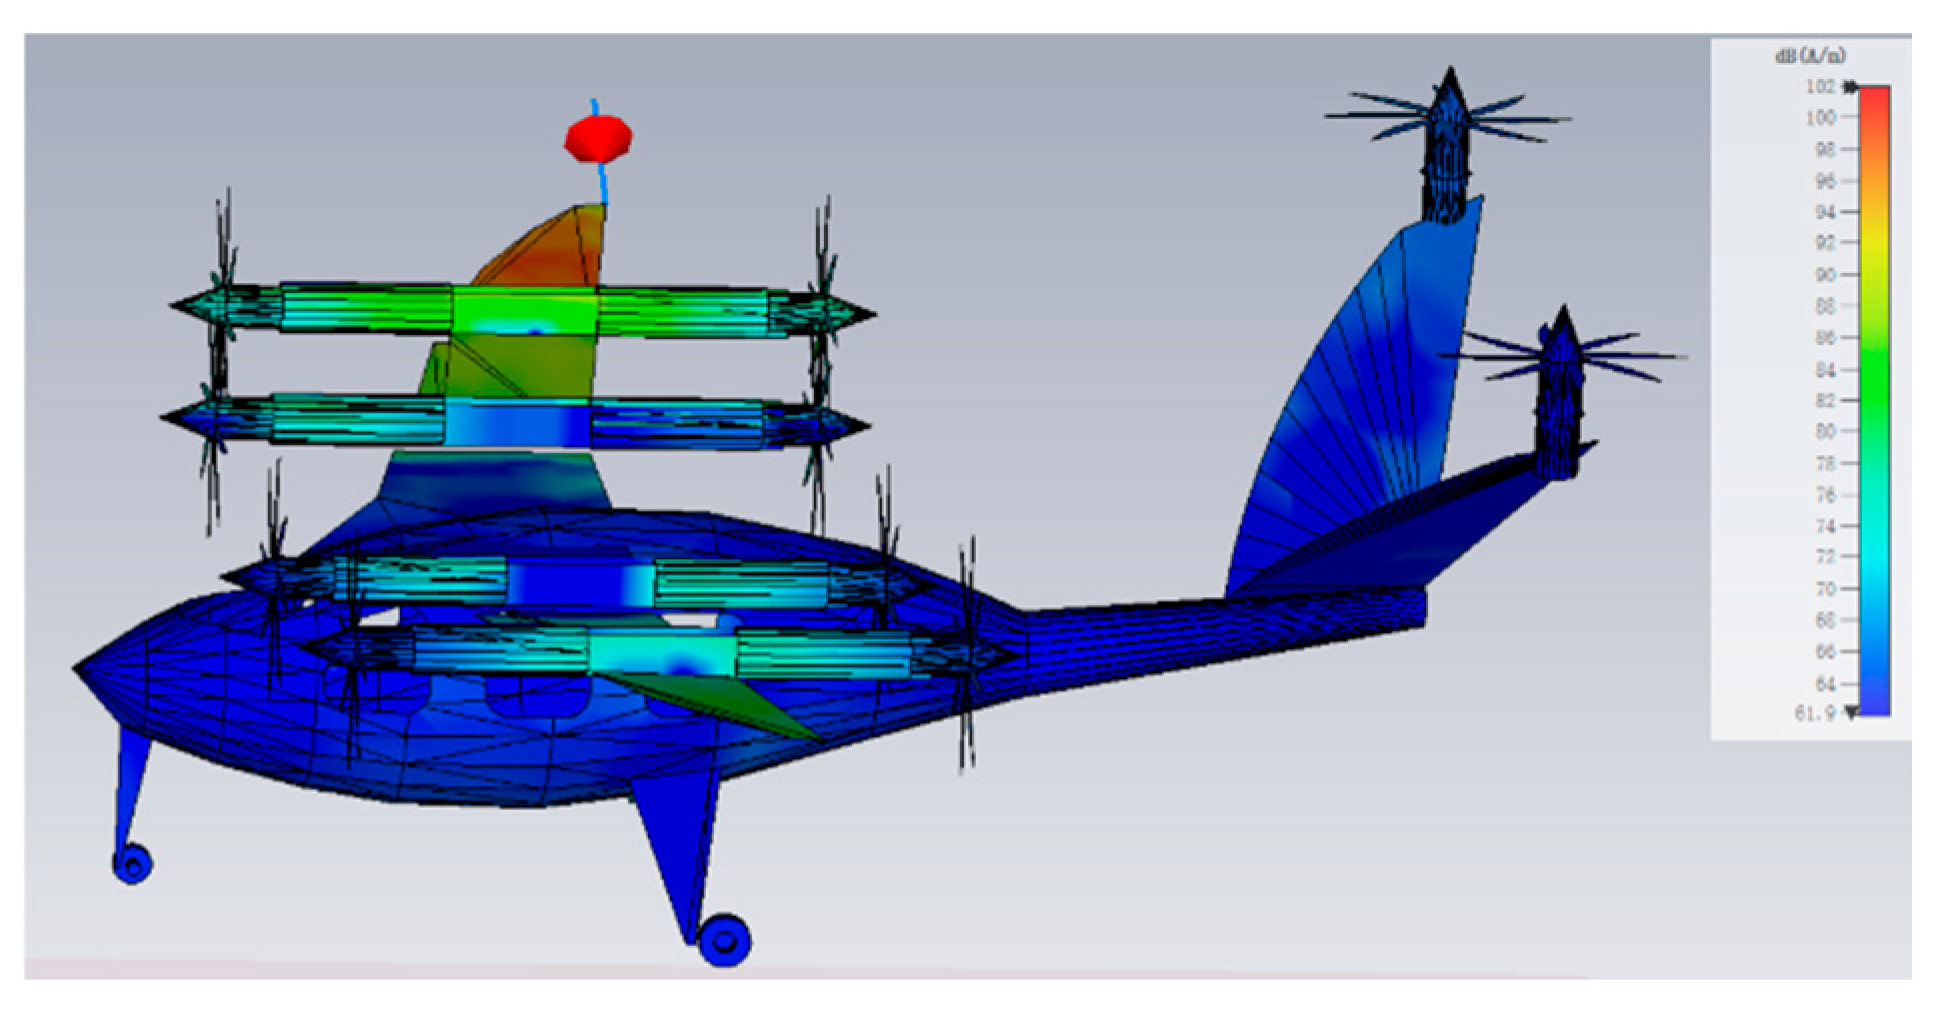
Figure 35.
Surface Magnetic Field Distribution When Struck at the Vertical Tail (dB).
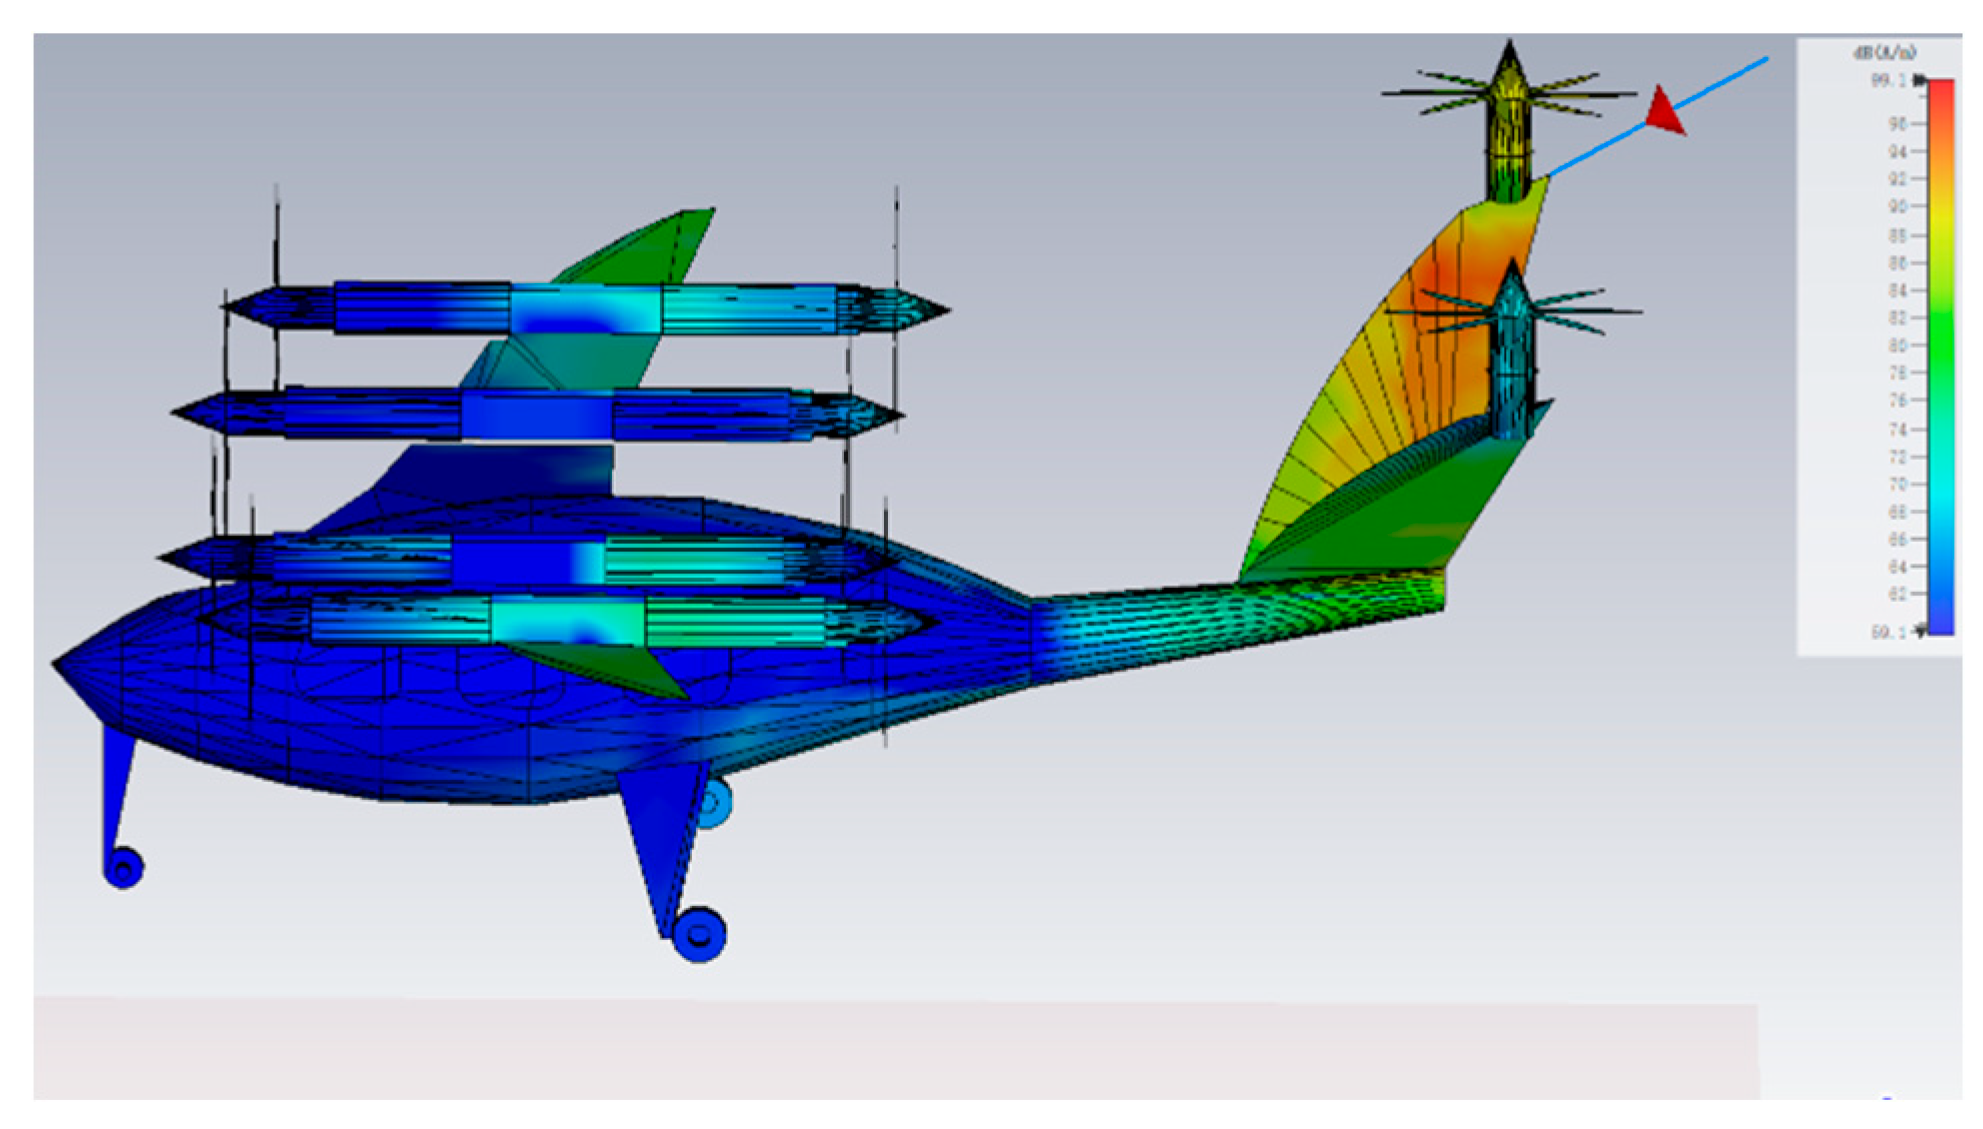
Figure 36.
Maximum Induced Current in Conductor Core for Different Cable Structures.
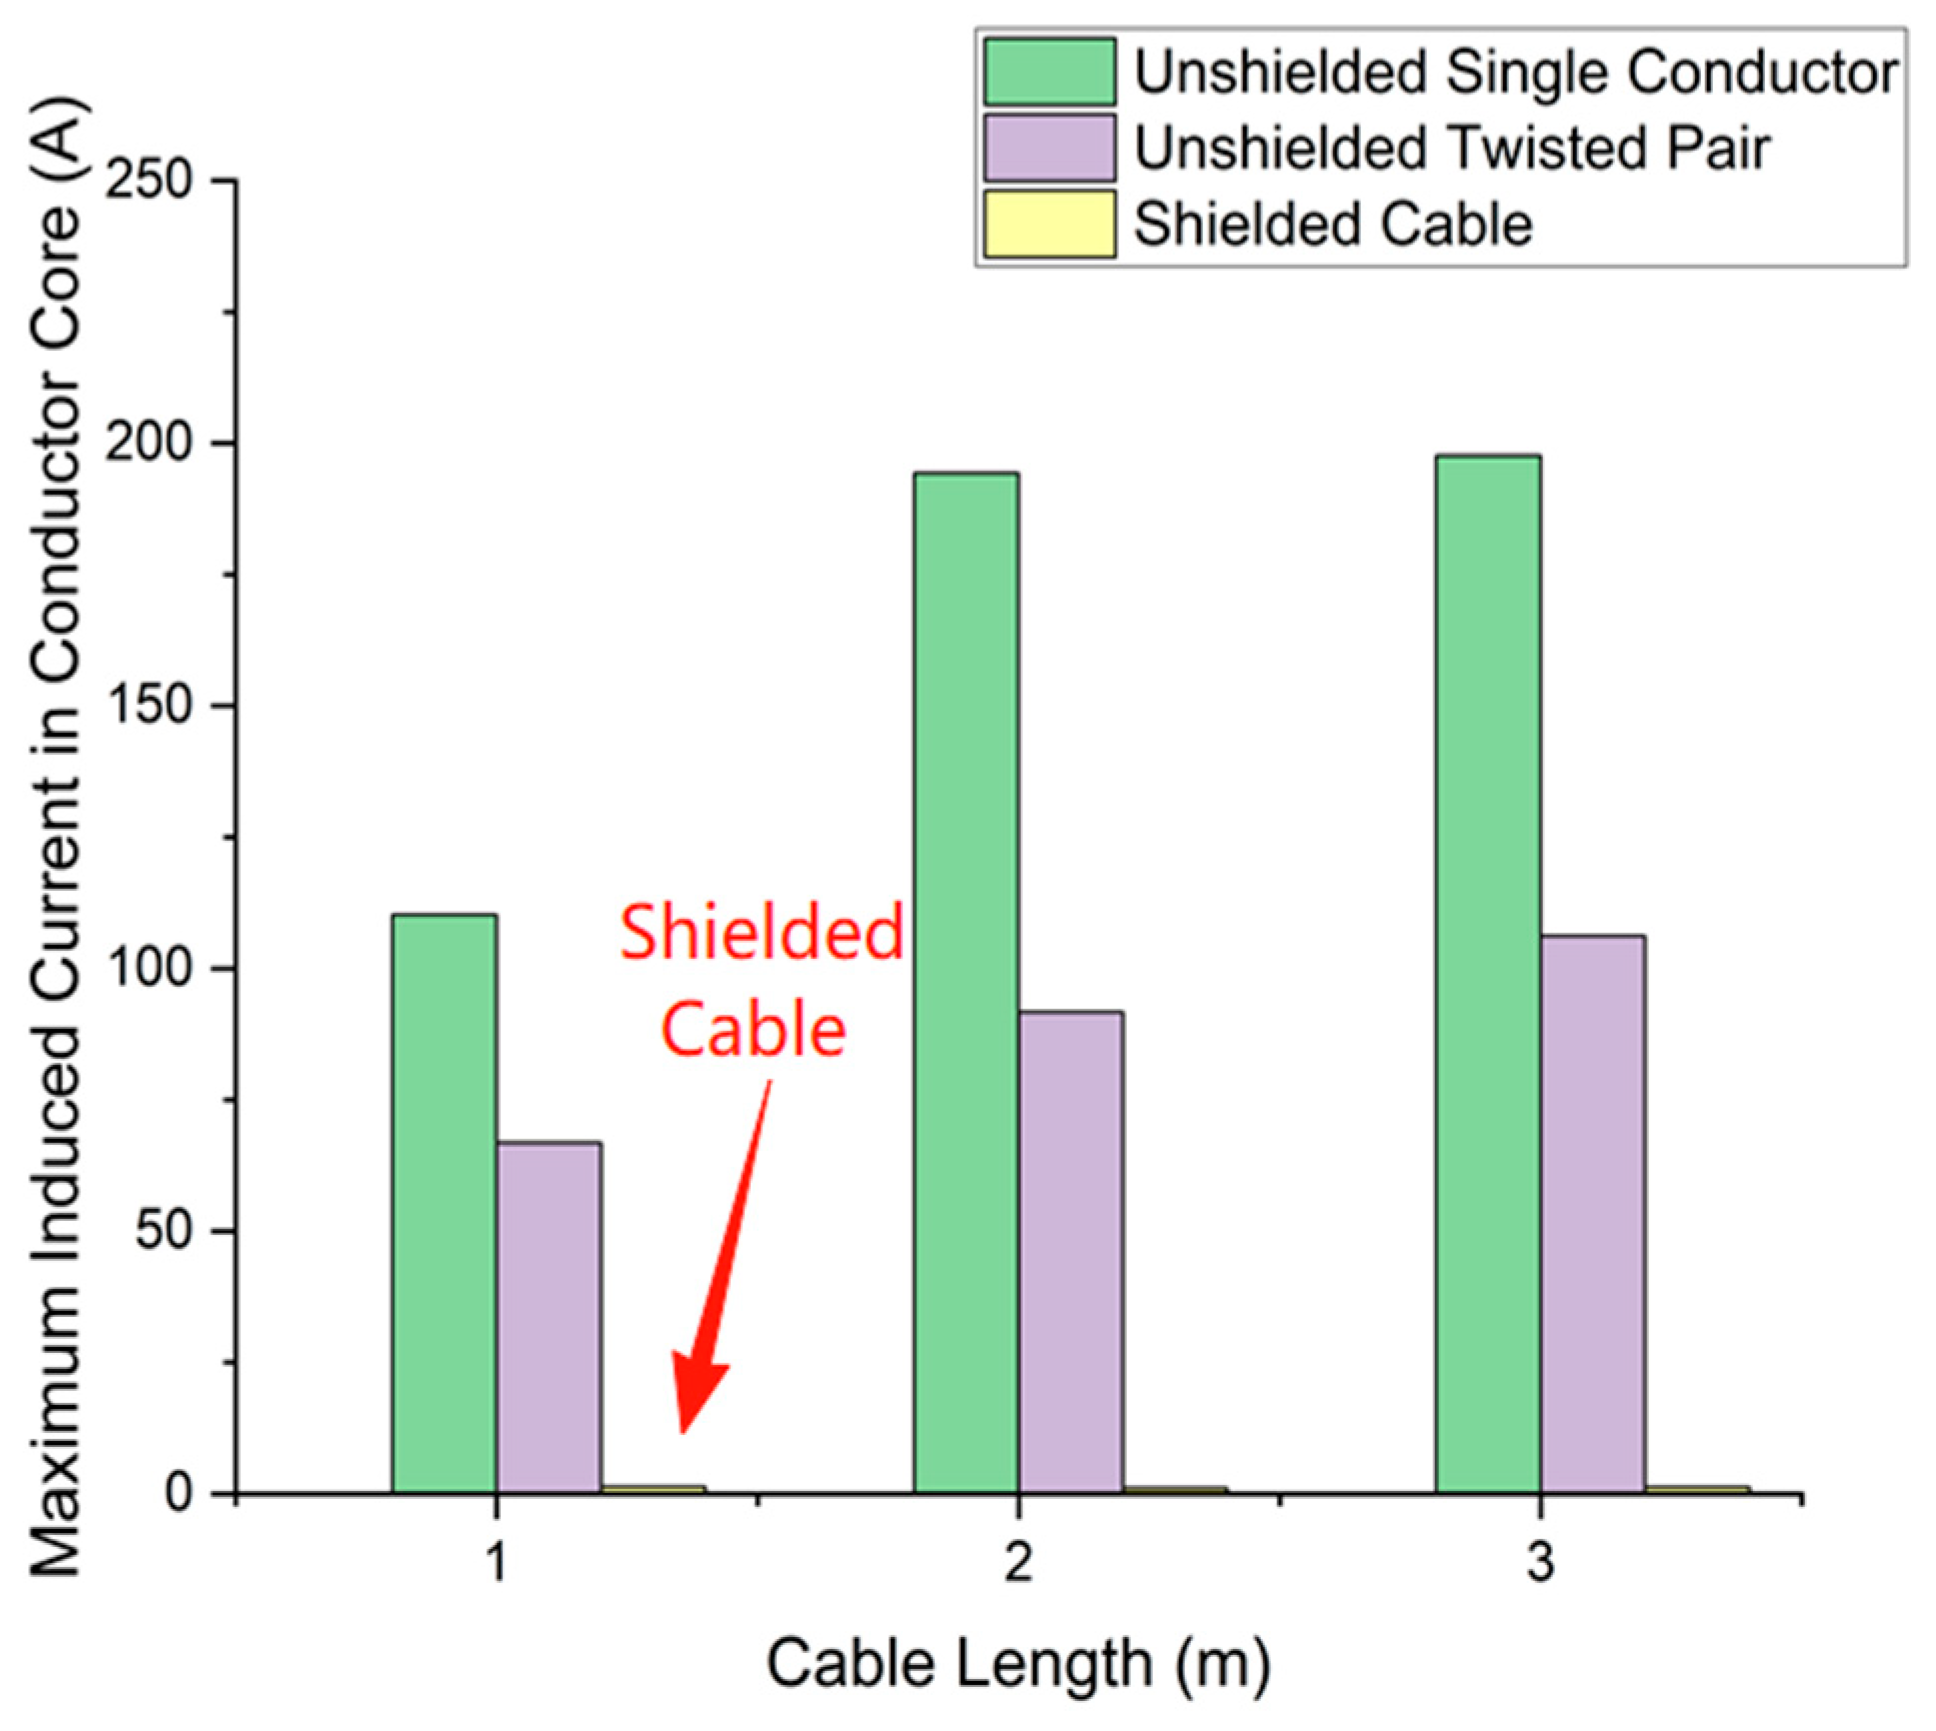
Figure 37.
Average Maximum Induced Current for Different Cable Lengths.
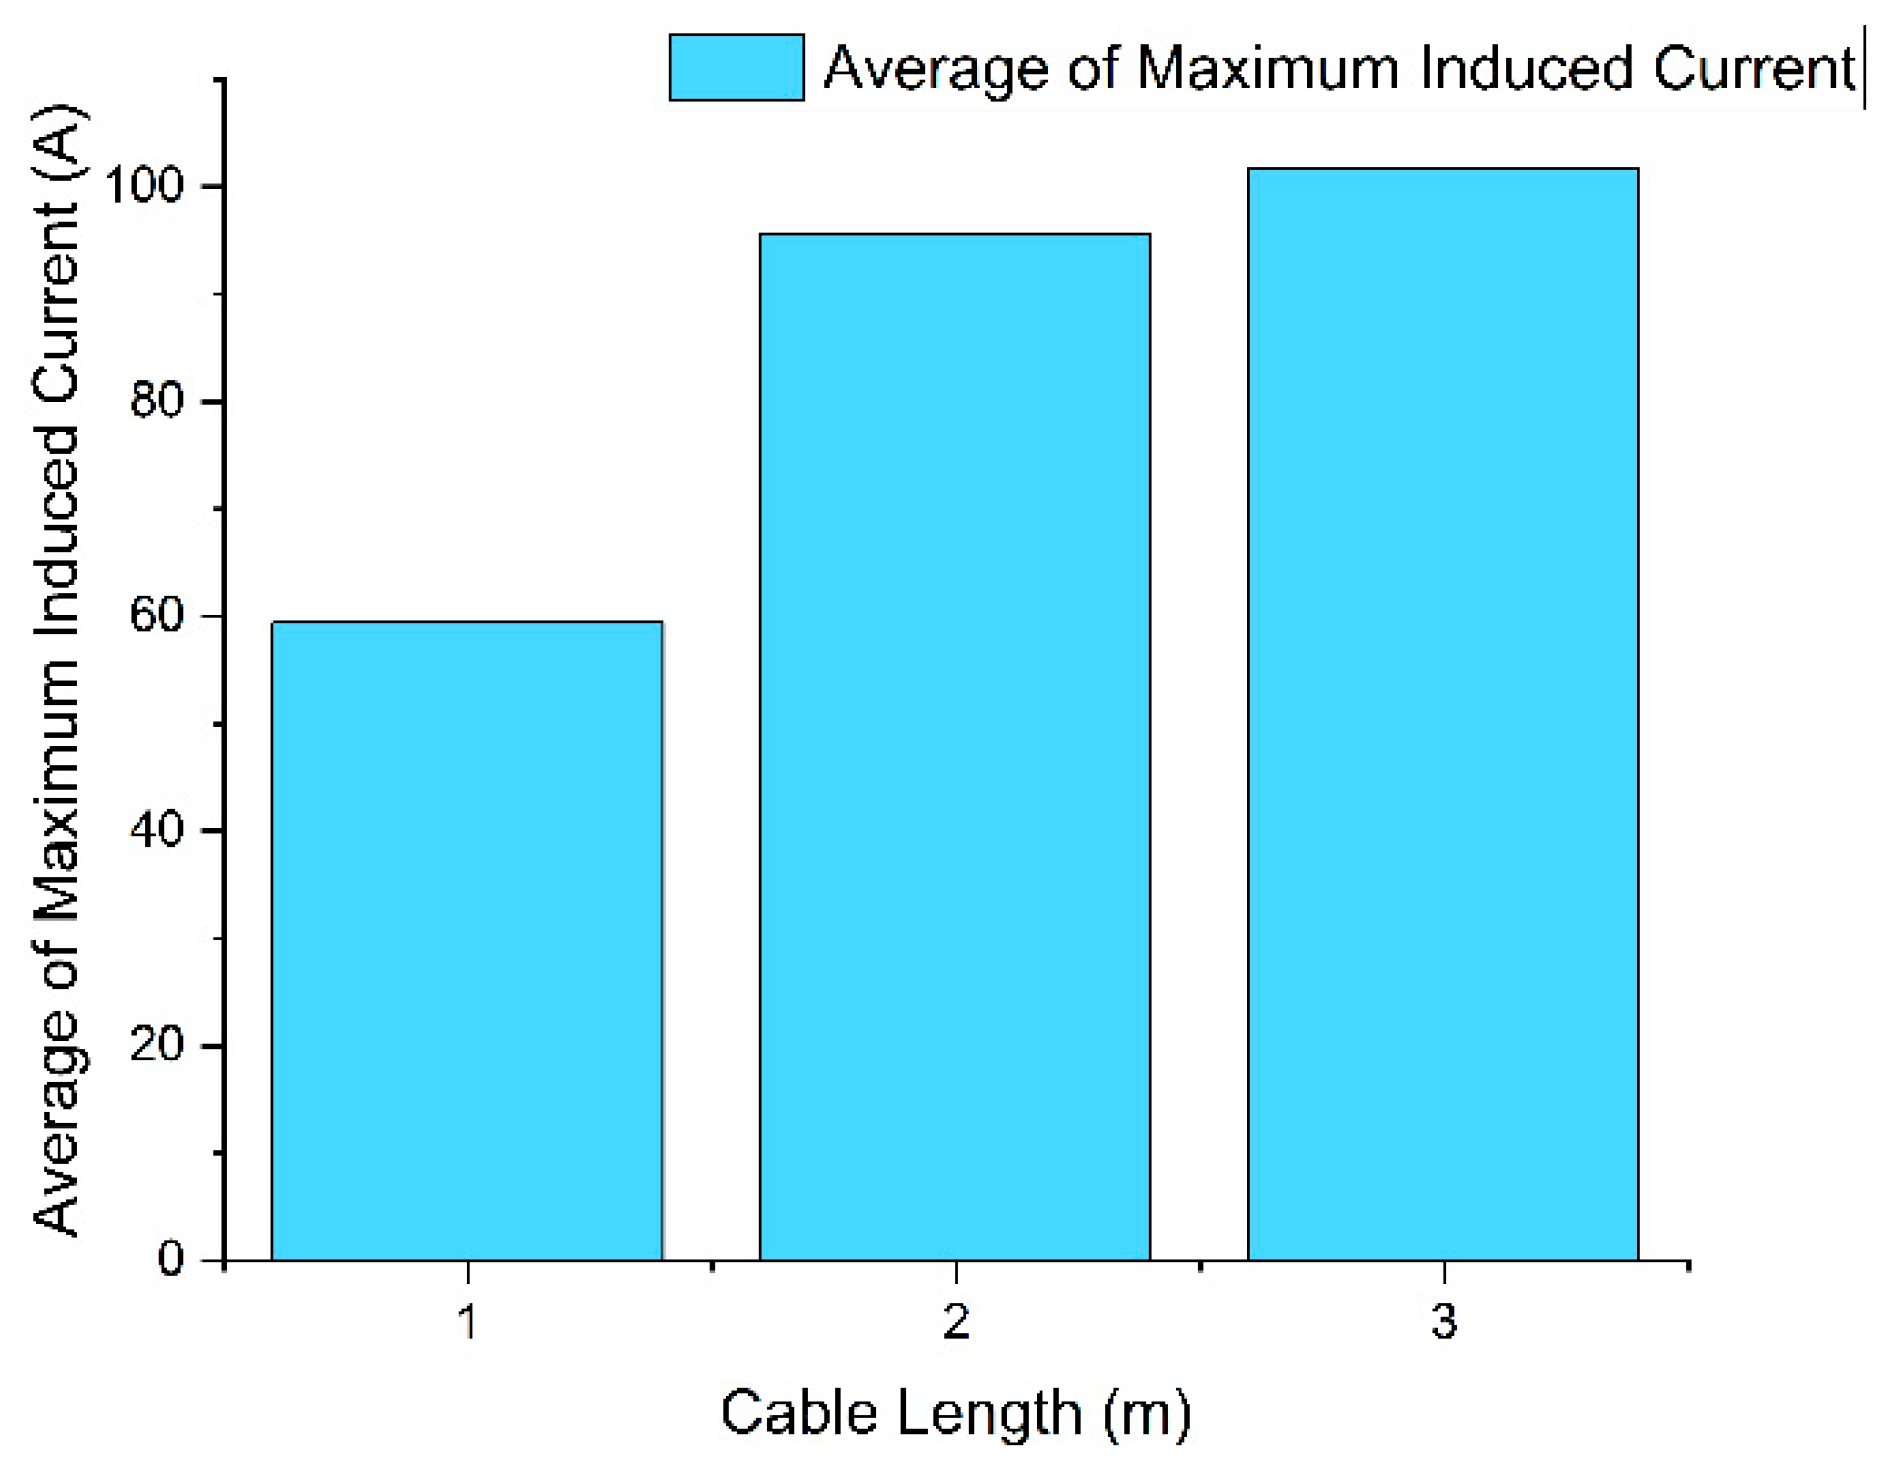
Figure 40.
Maximum Induced Current in Conductor Core for Different Wiring Methods.
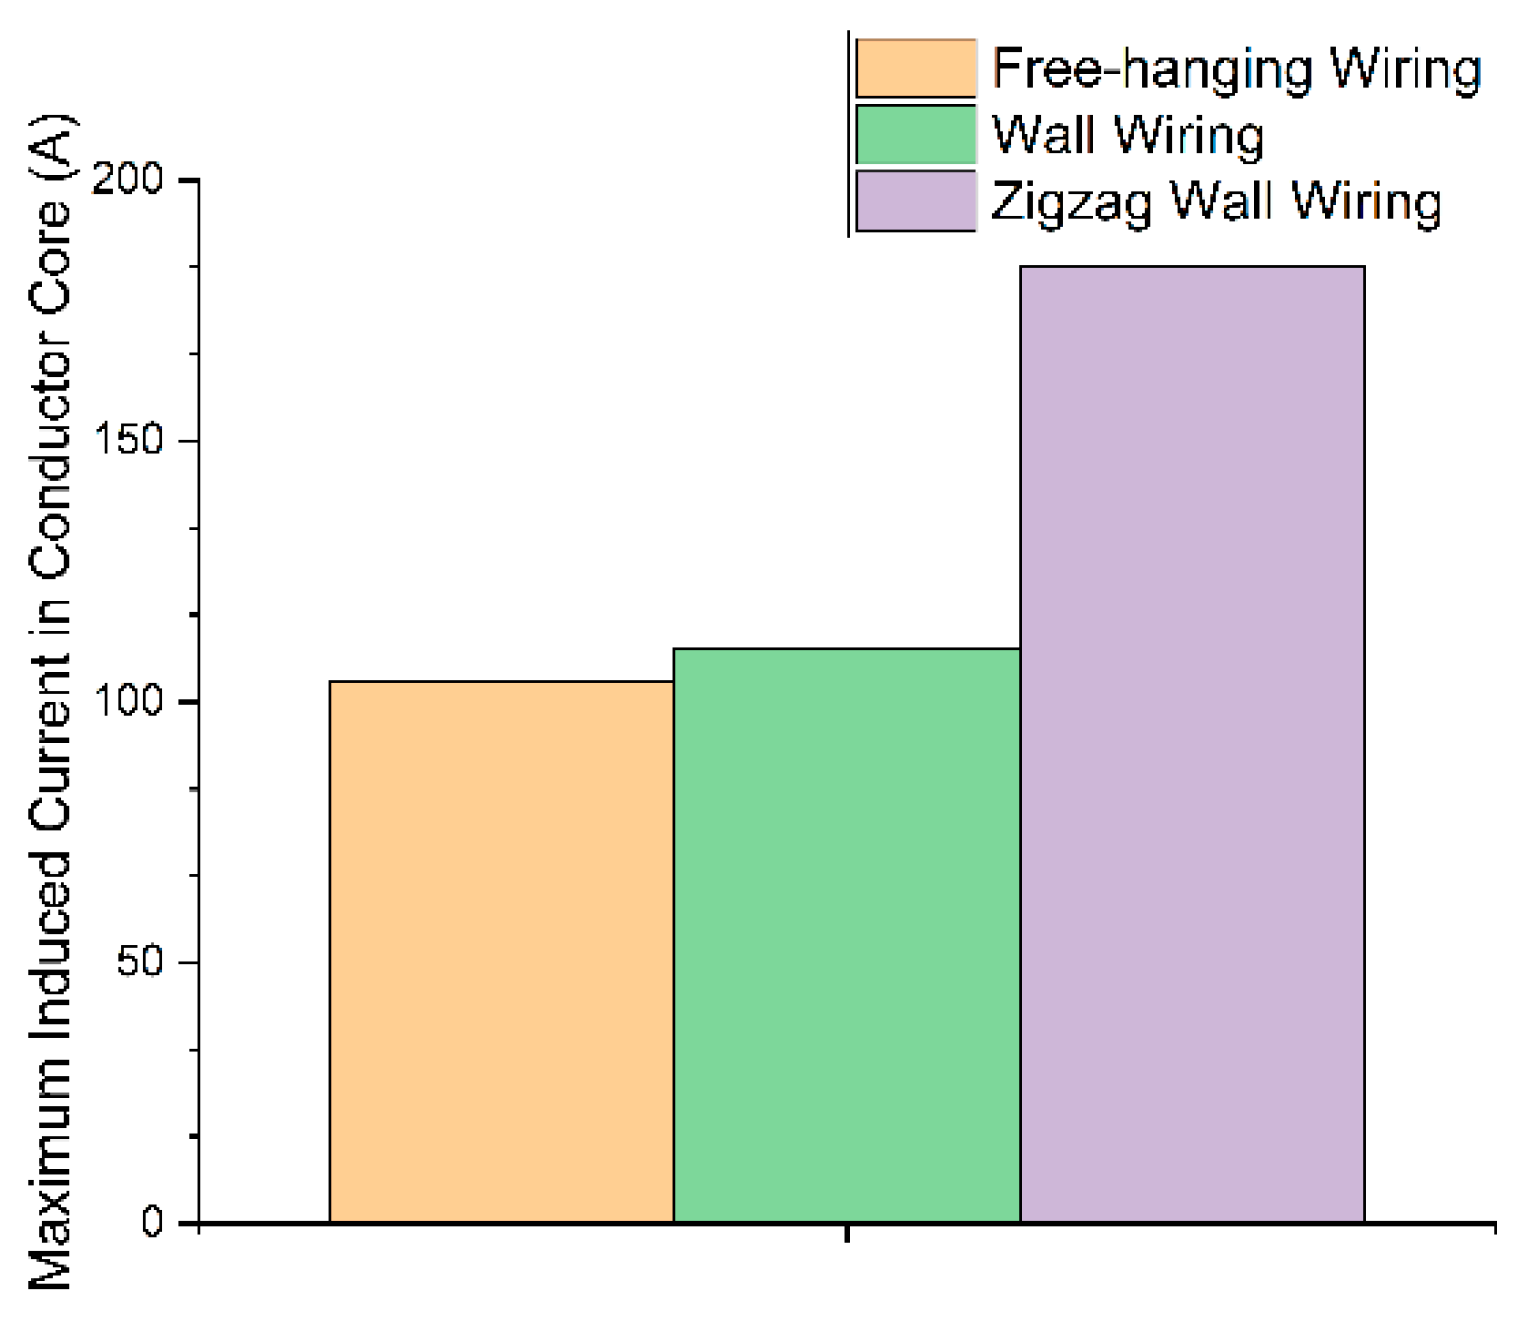
Table 1.
Lightning Attachment Zones and Their Characteristics.
| Zone | Sub-zone | Description | Lightning Attachment Characteristics |
| Zone 1 | 1A | Initial attachment, short dwell time | High attachment probability, short duration |
| 1B | Initial attachment, long dwell time | High attachment probability, long duration | |
| 1C | Smaller first return stroke, short dwell time | Medium attachment probability, smaller current | |
| Zone 2 | 2A | Sweeping attachment, short dwell time | Subsequent lightning, short sweep duration |
| 2B | Sweeping attachment, long dwell time | Subsequent lightning, long sweep duration | |
| Zone 3 | Low probability of direct attachment, only conducts lightning current | Current path, no direct strike | |
Table 2.
Typical Lightning Current Components and Key Parameters.
| Component | Name | Key Parameters |
| A | First Return Stroke | Peak current: 200 kA ± 10% Action Integral: 2×10⁶ A2·s ± 20% Duration: ≤ 500 μs |
| B | Intermediate Current | Maximum charge transfer: 10 C ± 10% Average current amplitude: 2 kA ± 20% Duration: ≤ 5 ms |
| C | Continuing Current | Current amplitude range: 200 ~ 800 A Charge transfer: 200 C ± 20% Duration: 0.25 s ≤ t ≤ 1 s |
| D | Subsequent Return Stroke | Peak current: 100 kA ± 10% Action Integral: 0.25×10⁶ A2·s ± 20% Duration: ≤ 500 μs |
Table 3.
Maximum Surface Electric Field and Magnetic Field Strength at Different Lightning Strike Locations.
Table 3.
Maximum Surface Electric Field and Magnetic Field Strength at Different Lightning Strike Locations.
| Strike Location | Maximum Surface Electric Field Strength (V/m) | Maximum Surface Magnetic Field Strength (A/m) |
| Nose | 84,426 | 48,364 |
| Wing | 189,000 | 125,000 |
| Vertical Tail | 112,000 | 90,513 |
Table 5.
Simulation Results.
| Experiment Number | Maximum Induced Current in Conductor Core (A) | Maximum Induced Current in Shielding Layer (A) |
| 1 | 110.19 | None |
| 2 | 66.75 | None |
| 3 | 1.35 | 374.58 |
| 4 | 91.67 | None |
| 5 | 1.05 | 257.81 |
| 6 | 194.27 | None |
| 7 | 1.29 | 318.32 |
| 8 | 197.61 | None |
| 9 | 106.22 | None |
| 10 | 93.86 | None |
| 11 | 183.46 | None |
Disclaimer/Publisher’s Note: The statements, opinions and data contained in all publications are solely those of the individual author(s) and contributor(s) and not of MDPI and/or the editor(s). MDPI and/or the editor(s) disclaim responsibility for any injury to people or property resulting from any ideas, methods, instructions or products referred to in the content. |
© 2025 by the authors. Licensee MDPI, Basel, Switzerland. This article is an open access article distributed under the terms and conditions of the Creative Commons Attribution (CC BY) license (http://creativecommons.org/licenses/by/4.0/).
Copyright: This open access article is published under a Creative Commons CC BY 4.0 license, which permit the free download, distribution, and reuse, provided that the author and preprint are cited in any reuse.


