
Submitted:
21 August 2025
Posted:
22 August 2025
You are already at the latest version
Abstract
Optimizing the layout of data centers is important for the rapid development of digital infrastructure, while also addressing the issues of energy consumption, environmental sustainability, and geographic resource distribution. Traditional strategies usually focus only on the distance to demand centers and ignore the energy and environmental costs of data centers in densely populated areas. In this paper, we propose a layout optimization model based on energy consumption constraints that combines integer linear programming with binary decision variables. The model combines energy efficiency, renewable resource availability, and regional characteristics to balance economic benefits and environmental impacts, consistent with the "East data, West computing" project. The experimental results showed that the energy efficient scenario consistently reduced costs, from ¥3.68×10^8 to ¥3.08×10^8 without energy constraints, and from ¥4.08×10^8 to ¥3.47×10^8 under energy consumption constraints. Additionally, energy constraints increased the number of required data centers from two to three. The results of the study emphasized the importance of strategic siting, especially in low electricity price areas, in order to optimize the layout and improve sustainability.
Keywords:
data center layout optimization
; energy consumption constraints
; integer linear programming
; binary decision variables
; east data
1. Introduction
Digital technology's rapid growth and surging data volumes drive the need for large data centers, critical for cloud computing, big data, AI [1,2], IoT, and 5G. These facilities underpin the digital economy but face challenges, as escalating energy consumption harms the environment, and strategic siting is essential. China’s "East Data, West Computing" strategy addresses this by shifting data center operations to western regions with abundant clean energy, cooler climates, and lower costs, promoting efficiency and sustainability.
Data center layout optimization involves balancing electricity usage, geographic location, resource availability, and policy [3,4]. Historically concentrated in economically developed eastern areas, data centers there faced high energy costs and environmental pressure. The "East Data, West Computing" initiative necessitates new models to ensure balanced, sustainable network development, integrating economic and environmental factors. Energy consumption depends on size, computing power, climate, renewable energy access, and power system stability, while policies and social environmental concerns also impact layout and operations. Researchers now leverage dynamic optimization algorithms and machine learning to adapt to evolving market and environmental demands [5,6,7,8].
Early studies used cost models to evaluate siting factors like power supply and policy. Goiri and Hans proposed a nonlinear cost-minimization model with response time and availability constraints [9,10], while Wang et al. analyzed data center spatial distributions and their impacts on energy use and emissions [11]. Recent work applies intelligent techniques like mixed integer programming and heuristics to improve energy efficiency and sustainability.
In this paper, we propose a data center layout optimization model based on energy consumption constraints. The model integrates integer linear programming (ILP) and binary decision variables to optimize data center layout while minimizing construction and operation costs. By integrating parameters such as energy price, resource capacity, and geographic characteristics, the model provides a comprehensive framework for sustainable data center development. The contributions of this paper are mainly in the following three aspects.
(1) The development of an optimization framework that combines energy consumption constraints and resource availability to provide an innovative approach to data center siting, which is highly consistent with the goals of the "East data, West computing" project.
(2) Detailed analyses of user demand nodes and alternative site parameters were performed to determine the optimal configuration that balances economic and environmental objectives.
(3) The proposed model's effectiveness is confirmed via extensive simulations, which highlight its notable benefits in reducing energy consumption and enhancing data center operational efficiency.
The paper's structure is as follows. Section 2 reviews related work on data center layout optimization. Section 3 details the proposed optimization model, including decision variables, objective functions, and constraints. Section 4 presents the experimental setup and results, and Section 5 concludes with future research directions.
2. Related Work
2.1. Data Center Layout Issues
The data center layout problem has been a focus of attention in both academia and industry. Scholars usually focus on how to reduce cost, improve energy efficiency, reduce network latency, and support sustainable development through optimal siting. Data center layout involves various factors, such as power supply and cost, geographic location, policy support, resource availability, and environmental factors.
Most of studies focus on how to use cost models to evaluate various factors affecting data center location. For example, Goiri et al. proposed a nonlinear cost-minimization model constrained by response time, data consistency, and service availability, later linearizing the problem to analyze potential U.S. regions and develop a decision-making tool for optimal siting [9,10]. Hans et al. divided the total cost into the siting fixed costs and variable costs due to resource availability to better understand the cost structure in data center operations [10]. Turek et al. integrated climate factors such as temperature, humidity and wind speed into a cost model, proposing an energy-efficient data center siting optimization model [12]. Yan et al. developed a Total Cost of Ownership (TCO) model for long-term data preservation, accounting for equipment replacement, data migration, and energy consumption over extended operational lifespans [13]. Li et al. used a multi-criteria decision model incorporating energy costs, land availability, and infrastructure to frame big data center siting [14]. Wang et al. analyzed data center spatial distributions, revealing layout impacts on energy use, emissions, and regional development [11]. Turek et al. confirmed siting optimization importance via a dynamic model of temperature’s impact on data center energy use [15]. Wang Shun et al. developed a carbon emission-minimizing model with a hyper-heuristic algorithm based on ant colony principles for low-carbon vehicle routing [16]. Yawen Wang integrated carbon emissions into grid distribution center siting models, developing an improved immune particle swarm algorithm for optimized, highly applicable layouts [17].
2.2. Optimization Models for Siting Problems
Siting problem research is a core domain of optimization modeling, encompassing classical frameworks such as the Maximum Covering Location Problem (MCLP), ensemble coverage model, and p-median model, which are widely applied in emergency facility planning, industrial logistics, and urban infrastructure design.
Proposed by Church and ReVelle, MCLP aims to maximize the number of demand points covered by selecting a specified number of facilities within a predefined service radius, critical for public emergency infrastructure like first-aid centers and fire stations [18]. In 2016, Colombo et al. enhanced MCLP-solving efficiency via a variable neighborhood search method using exponential neighborhoods [19]. Drakulic et al. extended MCLP to fuzzy environments, using fuzzy numbers to model uncertain coverage radii and inter-location distances for enhanced ambiguity resilience [20]. Sudtachat proposed ambulance siting schemes with varying unit numbers via compliance table strategies [21]. Stanimirović et al. designed multi-type emergency service networks using MCLP, incorporating diverse incident and unit types [22]. Mišković et al. developed dynamic robust DMCLP, leveraging hybrid variable neighborhood search and linear programming to improve solution efficiency [23]. Manuel et al. addressed MCLP data inaccuracy with a binary linear multi-objective model, using the augmented weighted Chebyshev method for coverage-reliability trade-offs [24]. Wei Wang and Shining Wu comprehensively analyzed discrete-coverage emergency facility siting, exploring solution methods and future directions for coverage models [25].
The ensemble coverage model seeks to minimize the number of facilities required to fully cover all demand points, with Toregas et al. first formalizing it to reduce facility count or construction costs [26]. Perera et al. applied it to EV charging infrastructure planning, developing a life-cycle framework to balance costs and coverage for long-term optimization [27]. Xia et al. studied two-tier path planning with ground vehicles and UAVs for multi-area coverage, minimizing travel time and energy consumption [28]. Qiang Su optimized EMS resource allocation via an improved dual coverage model to reduce delayed emergency costs [29]. Agam and Andriansyah et al. applied ensemble coverage algorithms to waste management, optimizing facility locations [30]. Liu and Cao et al. proposed an ensemble model for emergency medical facilities during the COVID-19 pandemic to optimize layouts [31].
The p-median model selects p facilities from candidate locations and assigns demand points to minimize transportation costs, widely used in industrial siting for factories and warehouses. Çelik et al. applied the p-median model to EV charging station siting, using genetic algorithms to optimize locations with considerations for user accessibility and grid capacity [32]. Jabbarzadeh proposed a robust model for post-disaster blood supply networks, optimizing facility siting and resource allocation [33]. Bayram studied shelter siting by integrating evacuation traffic assignment to determine optimal locations [34]. Shahriari proposed joint siting for ground and air emergency medical services to enhance service levels [35]. Murad et al. modified the p-median model with accessibility and service quality metrics to optimize public hospital locations in Jeddah, improving citywide health coverage [36]. Calik et al. proposed a p-center model to minimize the maximum distance between demand points and facilities [37]. Gwalani et al. addressed large-scale p-median problems by decomposing regions by demand density, developing a distributed algorithm for near-optimal clustered solutions [38].
Contemporary siting research integrates constraints like energy use, resource limits, and time sensitivity. Razi et al. optimized search and rescue vessel siting under time constraints to enhance maritime emergency response speed via constrained optimization [39]. Glavić compared p-center and improved p-median models for winter road maintenance siting, showing the latter’s advantage in balancing coverage and costs [40]. In this context, this study constructs a data center area layout optimization model under energy consumption constraints, aiming to improve resource use efficiency, reduce energy consumption and optimize overall service level through rational layout.
3. Methodology
Under the energy consumption constraint, a data center regional layout optimization model is constructed, combining integer linear programming and 0-1 planning, aiming to optimize the regional layout of data centers and minimize the construction and operation costs while meeting the energy consumption limit. The core idea of this optimization model is to rationally configure data center site selection and resource allocation based on ensuring that user demands are met, in order to achieve double optimization of economic benefits and energy efficiency. The construction of the methodology includes the setting of user demand nodes and alternative point parameters, as well as the specific design and solution process of the optimization model, through which the complex regional layout and energy consumption constraints are effectively addressed.
The steps of model construction are shown in Figure 1, which demonstrates the basic framework of data center regional layout, including the relationship between alternative points, user demand nodes, and layout siting decisions. Figure 1 will clearly present the setting of decision variables and constraints, as well as the formation process of optimization objectives.
3.1. Definition and Characteristics of User Demand Nodes and Alternative Points
In data center area layout optimization, the selection of user demand nodes and alternative points is crucial. User demand nodes are specific locations that need services provided by the data center, and the characteristics of these nodes directly affect the design of layout optimization. Define the set of user demand nodes as , where the user's computation and storage demand on the demand node is usually expressed as the computational load demand , and the communication demand between each user demand node and the data center is usually measured by the data transfer rate . For the alternative points, a number of potential layout points are selected considering factors such as electricity price, energy efficiency, and climate conditions. The setting of alternative point parameters impacts the data center's energy consumption, construction cost, and operational efficiency, significantly influencing the final layout optimization results. The set of alternative points is defined as . Each alternative point has different electricity price, energy efficiency and resource cap. The price of electricity in the region where the alternative point is located, , is an important part of the operating cost; the energy usage efficiency; Energy usage efficiency reflects the data center's energy efficiency, typically measured as the ratio of total energy consumed by the data center to the energy consumed by IT loads. is defined as the resource constraints of the alternative location and determines the size of the data center that can be built at that location.; is defined as the maximum storage resources available and affects the storage capacity that can be provided by the data center. These parameters will be used as key inputs to the constraints and objective functions in the optimization model to ensure that the business requirements of each user demand node are met.
3.2. Identification and Analysis of Decision Variables
Decision variables are the core components in the optimization model and are the uncertain variables to be optimized in the model, including whether the data center is sited at an alternative point and the user connection and interconnection. These variables are all binary variables, and are denoted by , , and for the data center siting variable, the user-data center connection variable, and the interconnection variable between data centers, respectively. Specifically, if a data center is constructed at an alternative point, the variable takes the value of 1, otherwise it is 0. Similarly, if the user demand node is connected to the data center, the variable takes the value of 1, otherwise it is 0. For the interconnection between data centers, if the centers of the two alternatives are connected to each other, the variable also takes the value of 1, otherwise it is 0. These binary variables are set not only to simplify the decision-making process, but also to effectively describe the location of data centers, user demand allocation, and network interconnection between data centers, so as to optimize the regional layout of data centers. For clarity, the relationships between decision variables and their constraints are visualized in Figure 2.
3.2. Design of Objective Function and Constraints
The objective function and constraints are central to the optimization model, determining its feasibility and optimal solution. The objective function is usually oriented to cost minimization, while the constraints define the practical limitations of data center layout and operation to ensure that specific requirements are met. With these constraints met, the regional layout of the data center is optimized by minimizing the total cost, thus maximizing economic benefits and sustainable development.
The core objective of the objective function is to minimize the total cost of the data center, which includes two main components, namely the initial construction cost and the operation cost. Through detailed analysis and comprehensive consideration of these two parts of the cost, the optimal solution can be provided for the regional layout of the data center, so as to maximize the cost-effectiveness.
For the initial construction cost, it is the fixed cost that the data center needs to invest in the early stage of planning and construction, which is mainly composed of three aspects. The first aspect is the land lease cost, which is the land lease cost to be paid for the location of the data center. The land lease cost varies greatly from region to region, and is usually determined according to the geographic location and market price of the alternative site. Land acquisition fee and total cost in the regional layout are defined in Eq. 1 and Eq. 2 below.
where represents the price per unit of land area; represents the footprint of the data center.
The second aspect is the construction and installation costs, which are mainly related to the acquisition of the underlying infrastructure, such as the power supply and distribution system, the heat dissipation and cooling system and the integrated cabling system, as well as the construction costs. The power supply and distribution system includes equipment such as distribution cabinets, transformers, uninterruptible power supply, diesel generator sets and battery backup to ensure a stable power supply to the data center. The cooling system, comprising air-cooling or liquid-cooling equipment, controls the heat generated during operation to ensure normal data center functioning. Comprehensive cabling system mainly includes network cabinets, optical cable laying and termination, and bridges and other equipment to ensure unimpeded communication and data transmission between equipment in the data center. The construction cost of these systems together constitute the initial construction cost of the data center, which directly affects the decision of site selection. The mathematical expression of the construction engineering fee and total cost in the regional layout of the data center as expressed in the following Eq. 3 and Eq. 4.
where e represents the total number of equipment types in the required power supply and distribution system, and and represent the unit price and quantity of equipment in the power supply and distribution system of category e, respectively; c represents the total number of equipment types in the required heat dissipation and cooling system, and and represent the unit price and quantity of equipment in the heat dissipation and cooling system of category c, respectively; and l represents the total number of equipment types in the required integrated wiring system, and and represent the unit price and quantity of equipment in the integrated wiring system of category l, respectively.
The third aspect is the communication network cost, which involves the network cost for connecting the selected user demand node location to the selected data center and the network cost required for interconnecting different data centers, as shown in Eq. 5 and Eq. 6.
where denotes the cost per unit length of the fiber optic network; is the distance between the two locations to be connected.
For the operation cost, it is the variable cost that the data center needs to spend in the process of daily operation, which can also include three aspects. The first aspect is the power consumption cost, which is the most important part of the operation cost, mainly including the power consumption cost of servers, cooling equipment and lighting. It is expressed as Eq. 7.
Where , , and are given constants. represents the power consumption of processors in the data center during computation; represents the amount of time the user's business requirements data is stored in the data center; represents the power consumption of storage devices during data storage; is the design life of the data center, set by the initial planning.
The second aspect is the cost of equipment maintenance, which includes routine maintenance and repair costs for servers, network equipment, cooling systems, etc. The equations for equipment maintenance cost and total cost are shown in Eq. 8 and Eq. 9.
where denotes the portion of the investment in data center equipment calculated on a fixed percentage basis
The third aspect is the labor cost, which involves the salary expenses of operation managers, technical support staff, etc., and is defined as Eq. 10.
where denotes the unit data center manpower cost.
The cost structure is illustrated in Figure 3, highlighting the components and their mathematical formulations as defined in the model. Combining the above cost factors, the mathematical expression of the objective function is shown in Eq. 11.
The constraints cover the number of data centers, user requirements, energy consumption, and resource use. Specifically, the constraint on the number of data centers ensures that they are only located at predefined alternative sites, with the total number not exceeding the available alternatives, so as to reasonably allocate resources and control the construction cost. The mathematical expression for this constraint is defined as Eq. 12.
where is the total number of alternative points.
The user demand constraint ensures that each user demand node is connected to at least one data center, thus ensuring that the user's business requirements are satisfied. The specific mathematical expressions are Eq. 13 and Eq. 14.
In order to improve the efficiency of fault handling, the communication interconnections between data centers need to be constrained to ensure that there are sufficient interconnections between data centers, and the specific mathematical expression is defined as Eq. 15.
The energy consumption constraint specifies that the total energy consumption of the data center cannot exceed a predefined energy consumption limit to ensure that the data center operation is sustainable in terms of energy usage. This constraint ensures that the total energy consumption of the data center does not exceed the specified upper limit while meeting user requirements, thus effectively controlling energy consumption. The computational resource constraint and storage resource constraint for the alternative points are defined as Eq. 16 and Eq. 17.
To conclude this methodology section, Figure 4 comprehensively showcases the integer linear programming model construction. Starting from the input of parameters including resource limitations , , the model proceeds to define binary decision variables , , and . These variables are then incorporated into the objective function, aiming to minimize the total cost, which is a combination of construction and operation costs. Simultaneously, a series of constraints, such as those on data center quantity and user demands , are applied. Through this process, the model achieves the optimal data center layout, integrating various factors to balance economic and environmental objectives.
4. Experiment
4.1. Condition Setting
To simulate data center layout strategies under diverse regional resource constraints in the "East Data, West Computing" project and maximize economic benefits, two scenarios were established, namely the conventional baseline and the energy-efficient scenario.
The conventional baseline scenario adheres to current policies, focusing on constructing an integrated new computing network system. It evaluates data center feasibility using parameters like electricity prices and Power Usage Effectiveness (PUE) in candidate cities, aiming to balance energy efficiency and costs within existing infrastructure. In contrast, the energy-efficient scenario aligns with national goals for data center efficiency. The planning goal was to reduce the PUE value of data centers in cluster cities to less than 1.25, and even strive to reduce it to 1.2 in some areas, so as to achieve greater energy-saving benefits as shown in Table 1. This requires promoting green data center construction, increasing renewable energy use, and optimizing cross-regional computing scheduling. Together, these scenarios enable multi-dimensional evaluations of data center layouts, energy efficiency, and economic benefits, providing a scientific foundation for future planning, optimization, and policy-making.
According to the specific implementation content of the "East data, West computing" project, this paper selected a series of parameters closely related to the construction and operation of data centers by analyzing the seven hub nodes identified in the project and the ten planned data center clusters. Specifically, 12 cities including Beijing, Tianjin, Shijiazhuang, Shanghai, Nanjing, Hangzhou, Shenzhen, Chengdu, Hohhot, Guiyang, Lanzhou, and Yinchuan were selected as the user demand nodes in this paper, and the computational load and data traffic of these cities were expressed in terms of millions of instructions per second (MIPS) and millions of bits per second (Mbps), respectively. MIPS stood for the computational power of the user demand nodes, while Mbps represented the size of data traffic. To ensure the rationality of data center design, this paper set the computing load and data traffic demand of each city based on the demand characteristics of each city, referring to the relevant domestic studies and industry reports, as shown in Table 2, which reflected the differences in the demand for computing resources and data transmission capacity in different regions. Based on the data of these cities, we carried out example analysis, and concluded eight cities, including Langfang, Hefei, Zhuhai, Mianyang, Baotou, Zunyi, Lanzhou, and Yinchuan, as alternative points for detailed parameter setting and analysis. The selection of alternative cities took into account their geographic location, power supply, policy support and infrastructure development. Based on the relevant data from China Power Intelligence Network, this study set the upper limit of the deployment of computing and storage devices for these alternative sites, and considered their energy supply capacity and resource constraints. Table 3 listed in detail the parameters such as the geographic location and the upper limit of computing and storage resource deployment for these alternative points. With these data, it was possible to evaluate the resource allocation effectiveness of different alternative points in meeting the computing and storage requirements of user demand nodes, and then optimize the layout.
In order to ensure the accuracy of the computational load, the processor performance was set as shown in Table 4 with reference to the Intel Xeon Gold series, and the running power of the computational load was set to 2.8×10^-5 kW/MIPS. Meanwhile, the performance of the data storage device was adjusted accordingly, and the running power of the storage load was set to 3.7×10^-10 kW/Mbit, based on the PB-class hard disk performance was estimated.
The data storage time is set to 365 days, and the power consumption of the computing load and storage load provides the basis for subsequent economic benefit analysis. The operating life of the data center is set to 12 years, which provides a long-term perspective for comprehensively estimating its construction and operation costs. The economic benefits of data center construction and operation are comprehensively estimated based on the set key parameters. First, the construction cost of the data center includes the initial land acquisition cost and equipment procurement cost. The land acquisition cost is about ¥1.55 million, while the construction and equipment procurement cost, including power supply and distribution system, heat dissipation and cooling system, is about ¥3.2 million. In addition, the cost of fiber optic construction was also taken into account and set at ¥7,200/km. These initial investments provide an important foundation for subsequent operations. During the operation phase, the annual O&M cost of the data center is ¥650,000, while the labor cost during the life cycle of the data center is about ¥450,000 in total.
4.2. Experimental Results and Analysis
The regional layout optimization model proposed in this paper was an integer linear programming problem, which was solved using the YALMIP toolbox and CPLEX solver in Matlab. In this paper, two scenarios were studied, namely the conventional baseline scenario and the energy efficient scenario. The model considered two scenarios in which the data center meets the user's demand in Scenario A and meets the demand under the energy consumption constraints in Scenario B, as shown below.
In the conventional baseline scenario, the electricity price and energy efficiency parameters of each alternative point were shown in Table 1. According to the CPLEX solution, in Scenario A, when two data centers were laid out, the total cost was the lowest at ¥3.68×10^8, calculated using the total cost formula Eq. 11, which aggregates the land cost Eq. 2, construction cost Eq. 4, communication network Eq. 5 and Eq. 6, power consumption cost Eq. 7, maintenance cost Eq. 9, and labor cost Eq. 10, while satisfying the constraints defined in Eqs. 12–15, as shown in Table 5. The data center layout and communication network were shown in Figure 5(a). The data center located in Wuzhong connected the user demand nodes in Chongqing, Guiyang and other cities to provide data processing and storage services, while the data center located in Baotou served the demand in Hohhot, Beijing, Tianjin and other cities. In Scenario B, the layout of one data center could not satisfy the demand, and the total cost was at least ¥4.08×10^8 as shown in Table 5 when three data centers were laid out, calculated using the total cost formula Eq. 11 and considering the constraints defined in Eqs. 12–15 and the energy expansion constraints in Eqs. 16–17. The data centers in Baotou, Tianshui and Wuzhong were responsible for connecting user demand nodes in different regions respectively.
In the energy efficient scenario, the solution results showed that in Scenario A, the total cost was the lowest at ¥3.08×10^8 calculated using Eq. 11 and Eqs. 12–15, as shown in Table 6, when two data centers were laid out, and the layout and communication network were shown in Figure 6(a), with the data centers in Baotou and Yinchuan meeting the needs of the cities of Hohhot, Beijing, and Tianjin, respectively. In Scenario B, the lowest total cost was ¥3.47×10^8 calculated using Eq. 11 and Eqs. 12–17, as shown in Table 6, when three data centers were laid out, and the layout was shown in Figure 6(b). At this time, the data centers in Baotou, Lanzhou and Yinchuan established communication networks with different user demand nodes to provide data processing and storage services.
When the constraints were different, the layout and total cost of the data centers were different. As shown in Figure 7(a-b), under the demand constraint, the total cost of layout optimization was low and only two data centers were needed to meet the demand. However, after adding the energy consumption constraint, three data centers were required in the layout optimization, and the communication network connection changed, and some user demands were transferred from the data center in Baotou to the data center in Yinchuan, and the cost increased accordingly. Considering the layout with energy consumption constraints might lead to cost increase, but the resource constraint was a necessary factor to consider due to the difference in resource endowment.
The results of different energy efficiency scenarios differed under the same constraints. As shown in Figure 8(a-b), the number of layouts was the same in the conventional baseline scenario and the energy-efficient scenario, but the total cost in the energy-efficient scenario was significantly lower than that in the conventional baseline scenario. The energy-efficient scenario resulted in a lower energy consumption efficiency of the data center, and thus the optimized total cost was significantly reduced. Therefore, to achieve green development of data centers, it was important to pay attention to energy efficiency and consider energy efficiency factors in layout optimization.
Combined with the relevant analysis and research process, the following suggestions are made for the development of the data industry under the energy consumption constraints and the optimization of the regional layout of data centers to be considered, firstly, further research on energy-saving technologies, and future research should focus on the development and application of more advanced energy-saving technologies for data centers, such as indirect evaporative cooling technology, high-efficiency cooling systems, and the integration of renewable energy sources. These technologies have the potential to significantly reduce data center energy consumption and carbon emissions. Secondly, it is crucial to strengthen regional collaboration and promote the coordinated development of regional data centers, which can be achieved through the establishment of a unified national data center network and the promotion of inter-regional sharing of resources and information. Lastly, policy support and standardization. The government should continue to provide policy support and standardization for the development of data centers, which includes developing more detailed regulations and standards for the construction and operation of data centers, as well as providing incentives for energy-efficient and environmentally friendly data center projects.
5. Conclusions
This paper introduces a data center layout optimization model that addresses the critical challenges of energy consumption and resource distribution in the context of rapid digital infrastructure development. By developing an integer linear programming model, we have demonstrated that energy constraints significantly affect the number of required data centers, total layout costs, and communication network connectivity. The results show that the total cost is consistently lower in the energy-efficient scenario than in the baseline scenario, highlighting the importance of improving energy efficiency to reduce costs. The study also shows that data center siting is closely related to electricity prices. In both the baseline and energy-efficiency scenarios, total cost is lowest when the data center is located in an alternative site with lower electricity prices.
The results highlight the significant potential of incorporating energy-saving policies and intelligent optimization techniques in data center planning. However, future challenges remain, including improving cross-regional resource scheduling, adapting to evolving energy standards, and addressing policy uncertainties. Addressing these issues will require further advancements in optimization algorithms and collaboration between policymakers and industry stakeholders.
References
- Chen, Zhao, et al. "Scene Chinese Recognition with Local and Global Attention." Pattern Recognition 158.000(2025). [CrossRef]
- Z. Chen, "Arbitrary Shape Text Detection With Discrete Cosine Transform and CLIP for Urban Scene Perception in ITS," in IEEE Transactions on Intelligent Transportation Systems. [CrossRef]
- Wang, Jiao'e, Du Fangye, and Xiao Fan. Spatial evolution of new infrastructure and its determinants: A case study of big data centers. [J] Journal of Geographical Sciences 78.2 (2023): 259-272.
- Li, Yuan, et al. Spatial characteristics and location selection of global data center expansion. [J] Journal of Geographical Sciences 78.8 (2023): 1936-1954.
- Chen, Min, et al. "Internet data centers participating in demand response: A comprehensive review." Renewable and Sustainable Energy Reviews 117 (2020): 109466. [CrossRef]
- Liang, G. U. O., et al. "Research on key technologies of data center parameter automatic optimization based on machine learning." Information and Communications Technology and Policy 46.6 (2020): 21.
- You, Yang, et al. "Imagenet training in minutes." Proceedings of the 47th international conference on parallel processing. 2018.
- Zhang, Qingxia, et al. "A survey on data center cooling systems: Technology, power consumption modeling and control strategy optimization." Journal of Systems Architecture 119 (2021): 102253. [CrossRef]
- Goiri, Ínigo, et al. "Intelligent placement of datacenters for internet services." 2011 31st International Conference on Distributed Computing Systems. IEEE, 2011.
- Hans, Ronny, et al. "Setting Priorities-A Heuristic Approach for Cloud Data Center Selection." CLOSER. 2015.
- Wang, Jiaoe, Du Fangye, and Xiao Fan. "Spatial evolution of new infrastructure and its determinants: A case study of big data centers". Journal of Geographical Sciences, 27.12 (2021): 259 - 272.
- Turek, Dirk, and Peter Radgen. "Optimized data center site selection—Mesoclimatic effects on data center energy consumption and costs." Energy Efficiency 14.3 (2021): 33. [CrossRef]
- Yan, Wenrui, et al. "LT-TCO: A TCO Calculation Model of Data Centers for Long-Term Data Preservation." 2019 IEEE International Conference on Networking, Architecture and Storage (NAS). IEEE, 2019.
- Li, Chenliang, Xiaobing Yu, and Wen-Xuan Zhao. "An integrated approach to site selection for a big data center using PROMETHEE-MCGP methodology." Journal of Intelligent & Fuzzy Systems 41.6 (2021): 6495-6515. [CrossRef]
- Turek, Dirk, and Peter Radgen. "Optimized data center site selection—Mesoclimatic effects on data center energy consumption and costs." Energy Efficiency 14.3 (2021): 33. [CrossRef]
- Wang, Shun, et al. Low carbonlocation-routing problem based on evolutionary hyper-heuristic algorithm of ant colony selection mechanism. [J] Computer Integrated Manufacturing Systems 26.6 (2020): 1702-1716.
- Wang, Yawen. Research on location optimization of power supplies distribution center based on carbon constraints. [J] Shanghai Energy Conservation 12 (2020): 1427-1432.
- Ghaderi, Abdolsalam, and Morteza Momeni. "A multi-period maximal coverage model for locating simultaneous ground and air emergency medical services facilities." Journal of Ambient Intelligence and Humanized Computing 12 (2021): 1577-1600. [CrossRef]
- Colombo, Fabio, Roberto Cordone, and Guglielmo Lulli. "The multimode covering location problem." Computers & operations research 67 (2016): 25-33.
- Drakulić, Darko, Aleksandar Takači, and Miroslav Marić. "New model of maximal covering location problem with fuzzy conditions." Computing and informatics 35.3 (2016): 635-652.
- Sudtachat, Kanchala, Maria E. Mayorga, and Laura A. Mclay. "A nested-compliance table policy for emergency medical service systems under relocation." Omega 58 (2016): 154-168. [CrossRef]
- Stanimirović, Zorica, et al. "A two-phase optimization method for solving the multi-type maximal covering location problem in emergency service networks." Information Technology and Control 46.1 (2017): 100-117. [CrossRef]
- Mišković, Stefan. "A VNS-LP algorithm for the robust dynamic maximal covering location problem." OR Spectrum 39.4 (2017): 1011-1033. [CrossRef]
- Arana-Jiménez, Manuel, Víctor Blanco, and Elena Fernández. "On the fuzzy maximal covering location problem." European Journal of Operational Research 283.2 (2020): 692-705. [CrossRef]
- Wang, Wei, et al. "Emergency facility location problems in logistics: Status and perspectives." Transportation research part E: logistics and transportation review 154 (2021): 102465.
- Toregas, Constantine, et al. "The location of emergency service facilities." Operations research 19.6 (1971): 1363-1373. [CrossRef]
- Perera, Piyaruwan Harindra Kaluthantirige. Recharging infrastructure planning for electric vehicles: a lifecycle thinking approach. Diss. University of British Columbia, 2020.
- Xia, Yangsheng, et al. "Two-layer path planning for multi-area coverage by a cooperative ground vehicle and drone system." Expert Systems with Applications 217 (2023): 119604. [CrossRef]
- Su, Qiang, Qinyi Luo, and Samuel H. Huang. "Cost-effective analyses for emergency medical services deployment: A case study in Shanghai." International Journal of Production Economics 163 (2015): 112-123. [CrossRef]
- Syahputra, Rizki Agam, Prima Denny Sentia, and Riski Arifin. "Determining Optimal New Waste Disposal Facilities Location by Using Set Covering Problem Algorithm." Conference on Broad Exposure to Science and Technology 2021 (BEST 2021). Atlantis Press, 2022.
- Liu, Jingkuang, et al. "Optimization of site selection for emergency medical facilities considering the SEIR model." Computational Intelligence and Neuroscience 2022.1 (2022): 1912272. [CrossRef]
- Çelik, Serdar, and Şeyda Ok. "Electric vehicle charging stations: Model, algorithm, simulation, location, and capacity planning." Heliyon 10.7 (2024).
- Jabbarzadeh, Armin, Behnam Fahimnia, and Stefan Seuring. "Dynamic supply chain network design for the supply of blood in disasters: A robust model with real world application." Transportation research part E: logistics and transportation review 70 (2014): 225-244. [CrossRef]
- Bayram, Vedat, Barbaros Ç. Tansel, and Hande Yaman. "Compromising system and user interests in shelter location and evacuation planning." Transportation research part B: methodological 72 (2015): 146-163. [CrossRef]
- Shahriari, Milad, et al. "Bi-objective approach for placing ground and air ambulance base and helipad locations in order to optimize EMS response." The American journal of emergency medicine 35.12 (2017): 1873-1881. [CrossRef]
- Murad, Abdulkader, et al. "Optimizing health service location in a highly urbanized city: Multi criteria decision making and P-Median problem models for public hospitals in Jeddah City, KSA." Plos one 19.1 (2024): e0294819. [CrossRef]
- Calik, Hatice, Martine Labbé, and Hande Yaman. "p-Center problems." Location science (2015): 79-92.
- Gwalani, Harsha, et al. "A distributed algorithm for solving large-scale p-median problems using expectation maximization." PeerJ Computer Science 10 (2024): e2446. [CrossRef]
- Ren, Zhi-Gang, et al. "New ideas for applying ant colony optimization to the set covering problem." Computers & Industrial Engineering 58.4 (2010): 774-784. [CrossRef]
- Razi, Nasuh, and Mumtaz Karatas. "A multi-objective model for locating search and rescue boats." European Journal of Operational Research 254.1 (2016): 279-293. [CrossRef]
Figure 1.
Overview of steps in model construction.
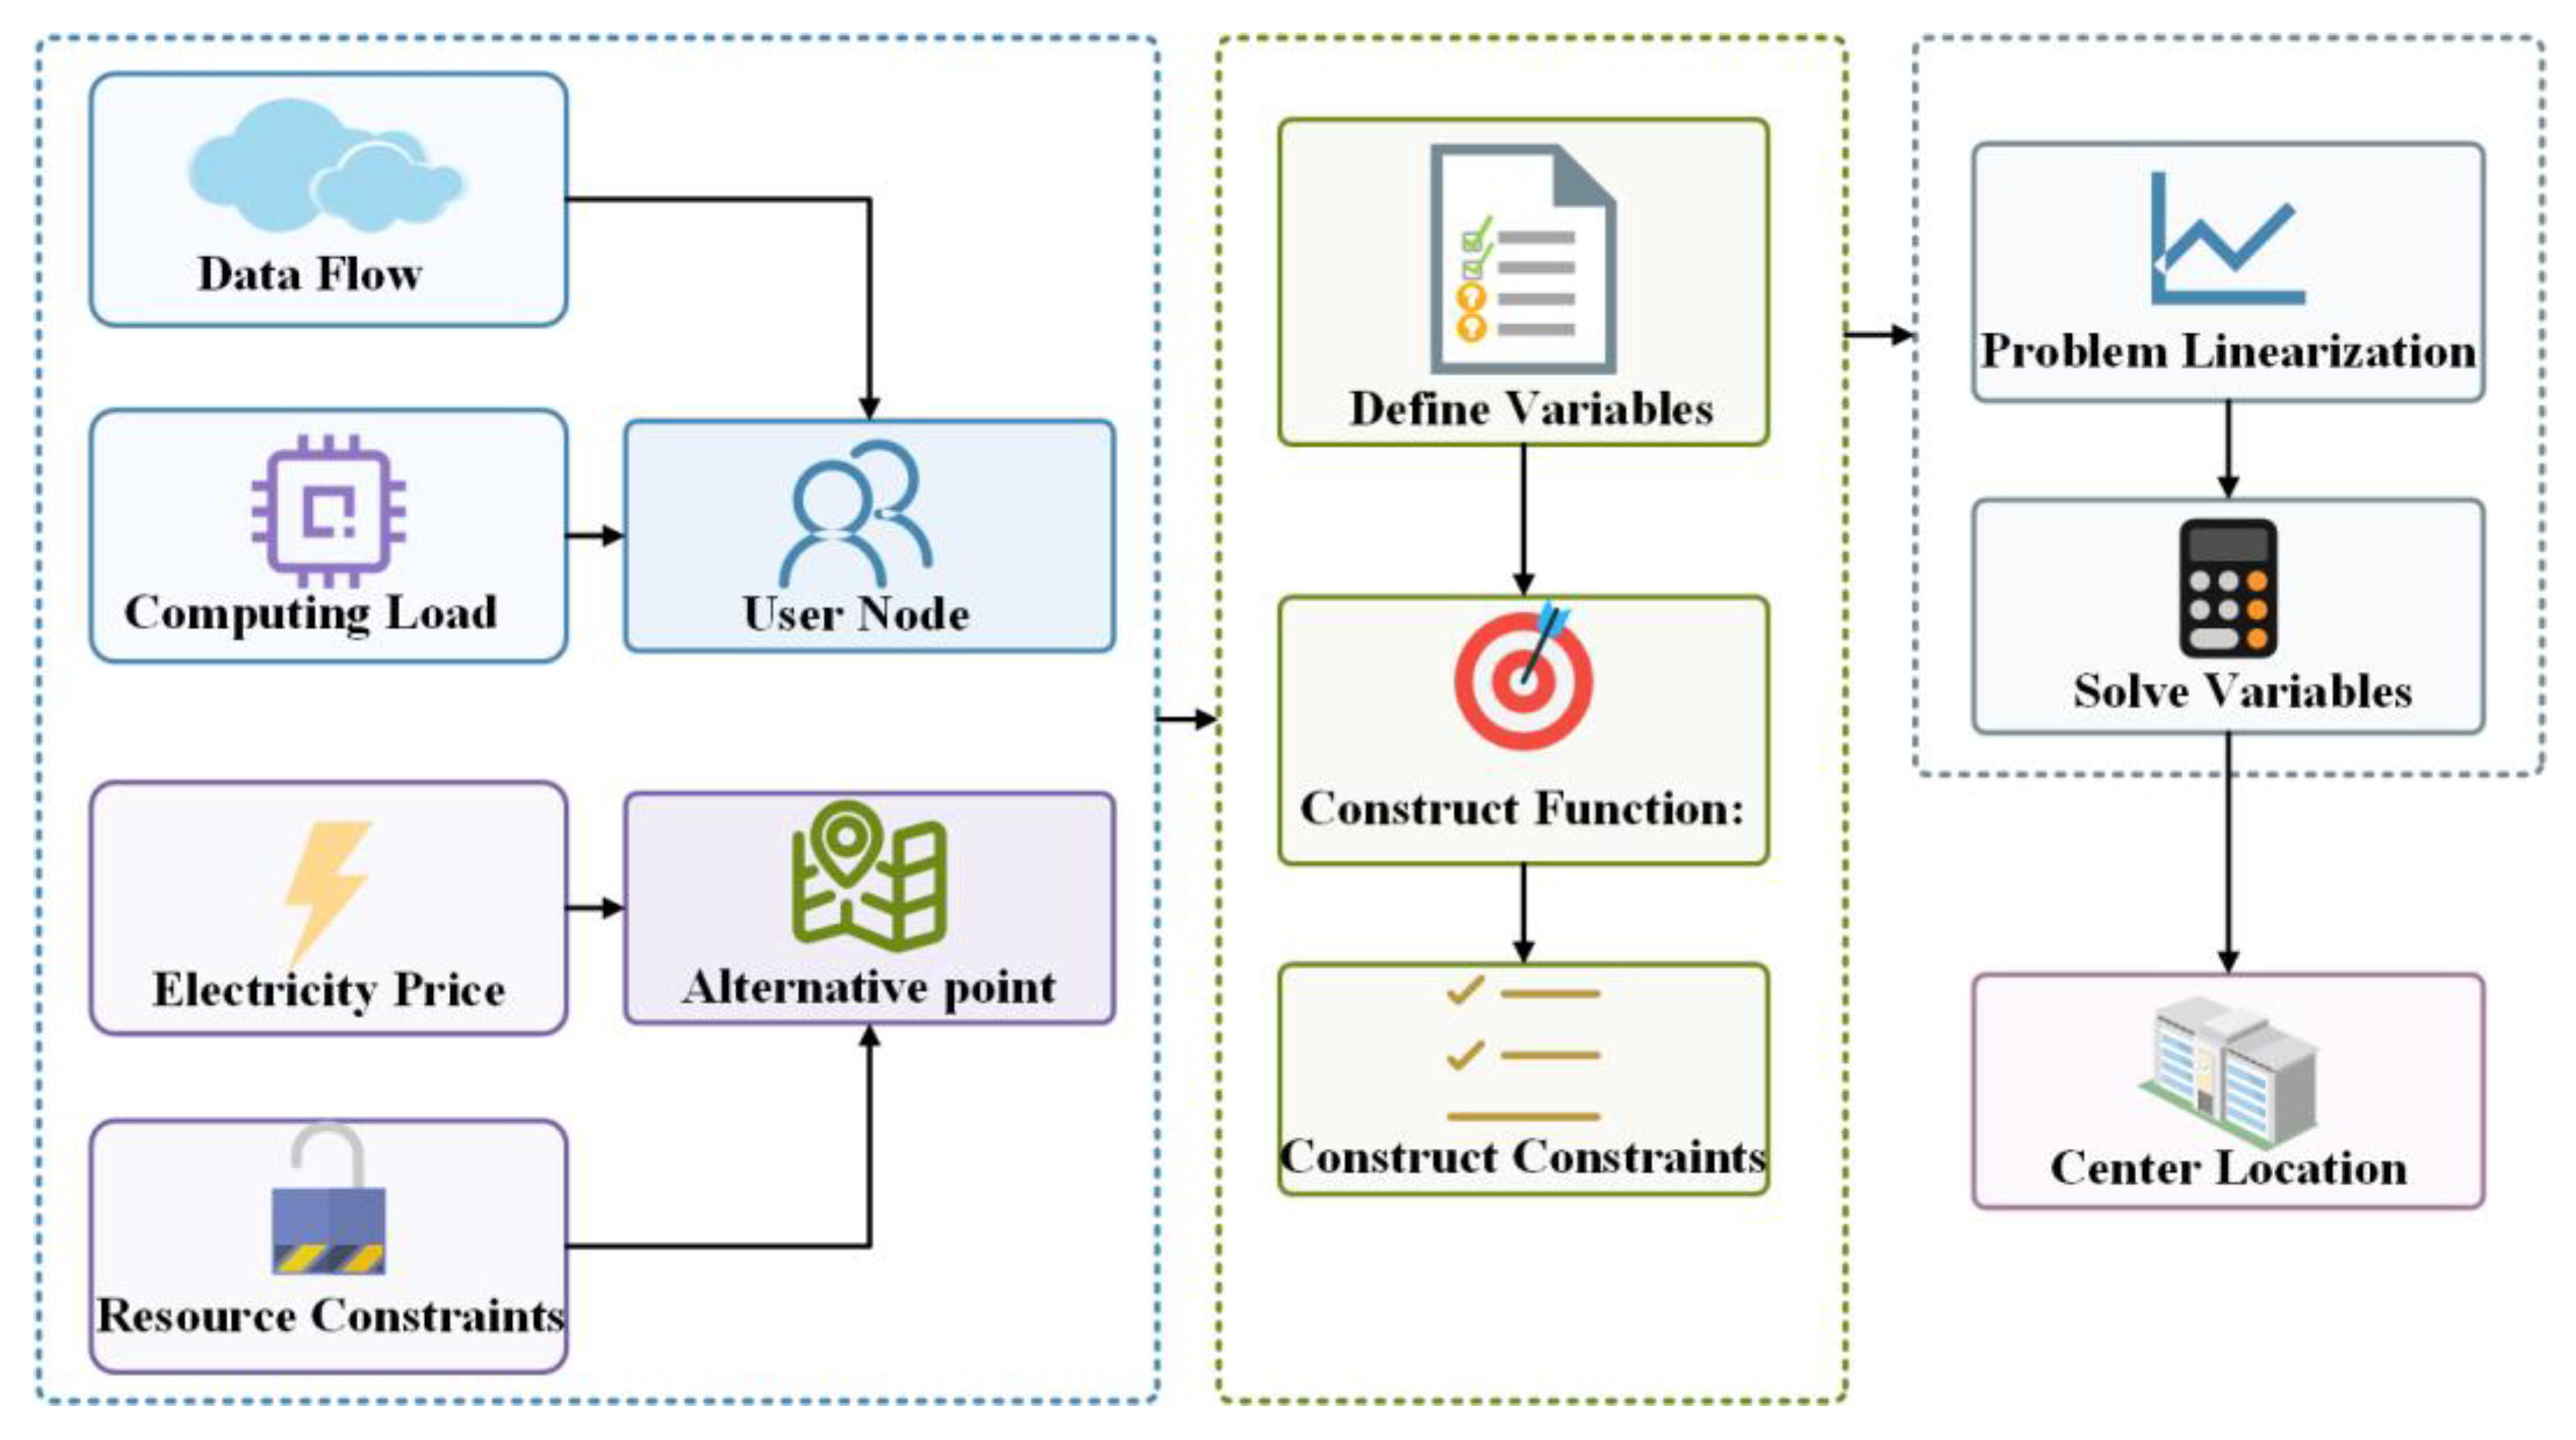
Figure 2.
Relationship of Decision Variables and Constraints.
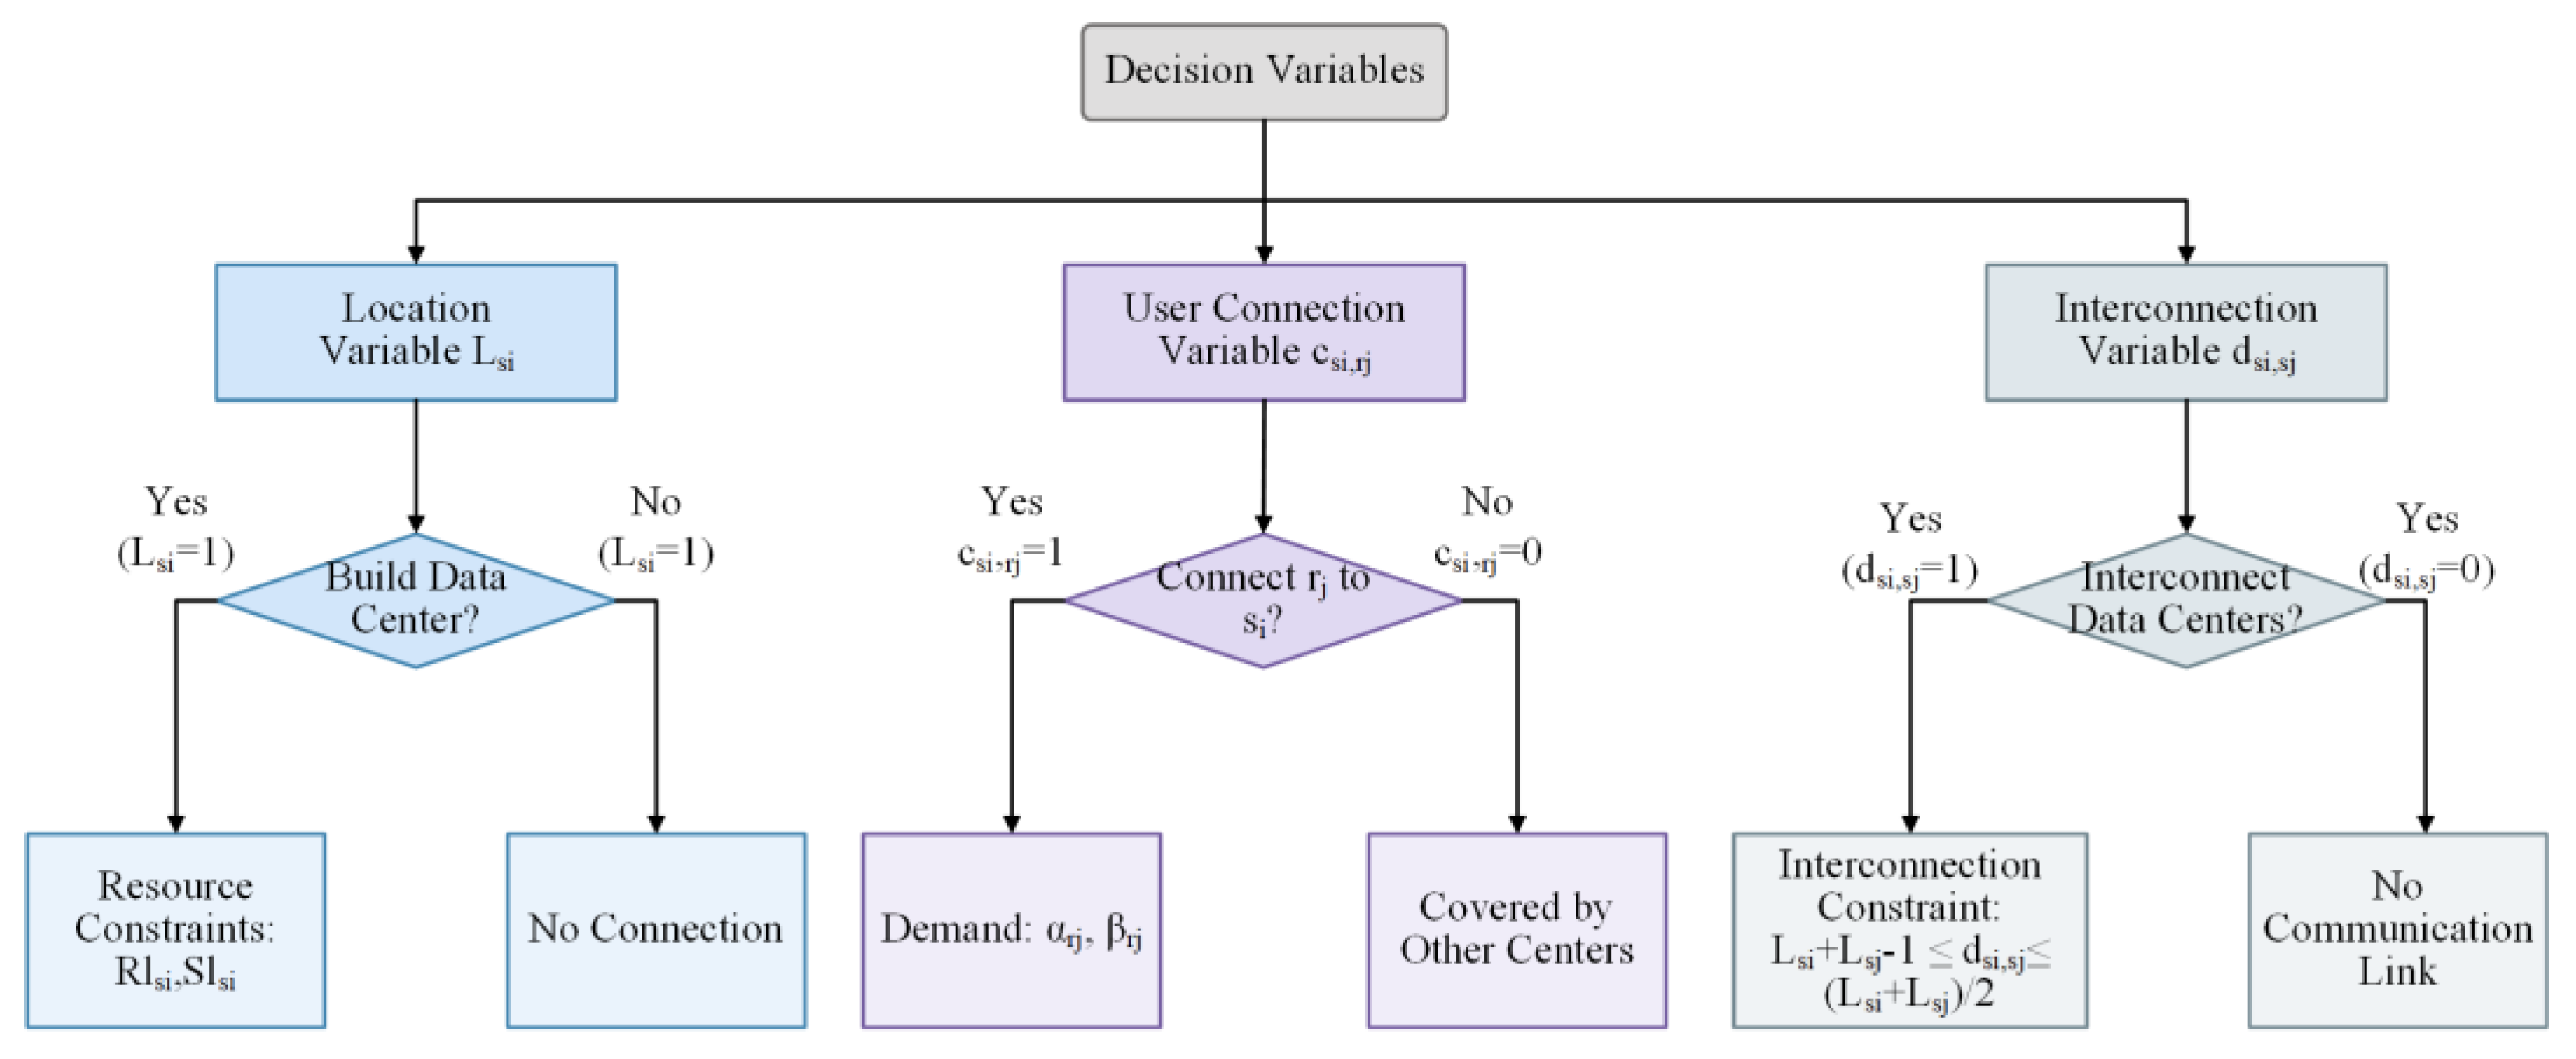
Figure 3.
Cost Structure of the Objective Function.
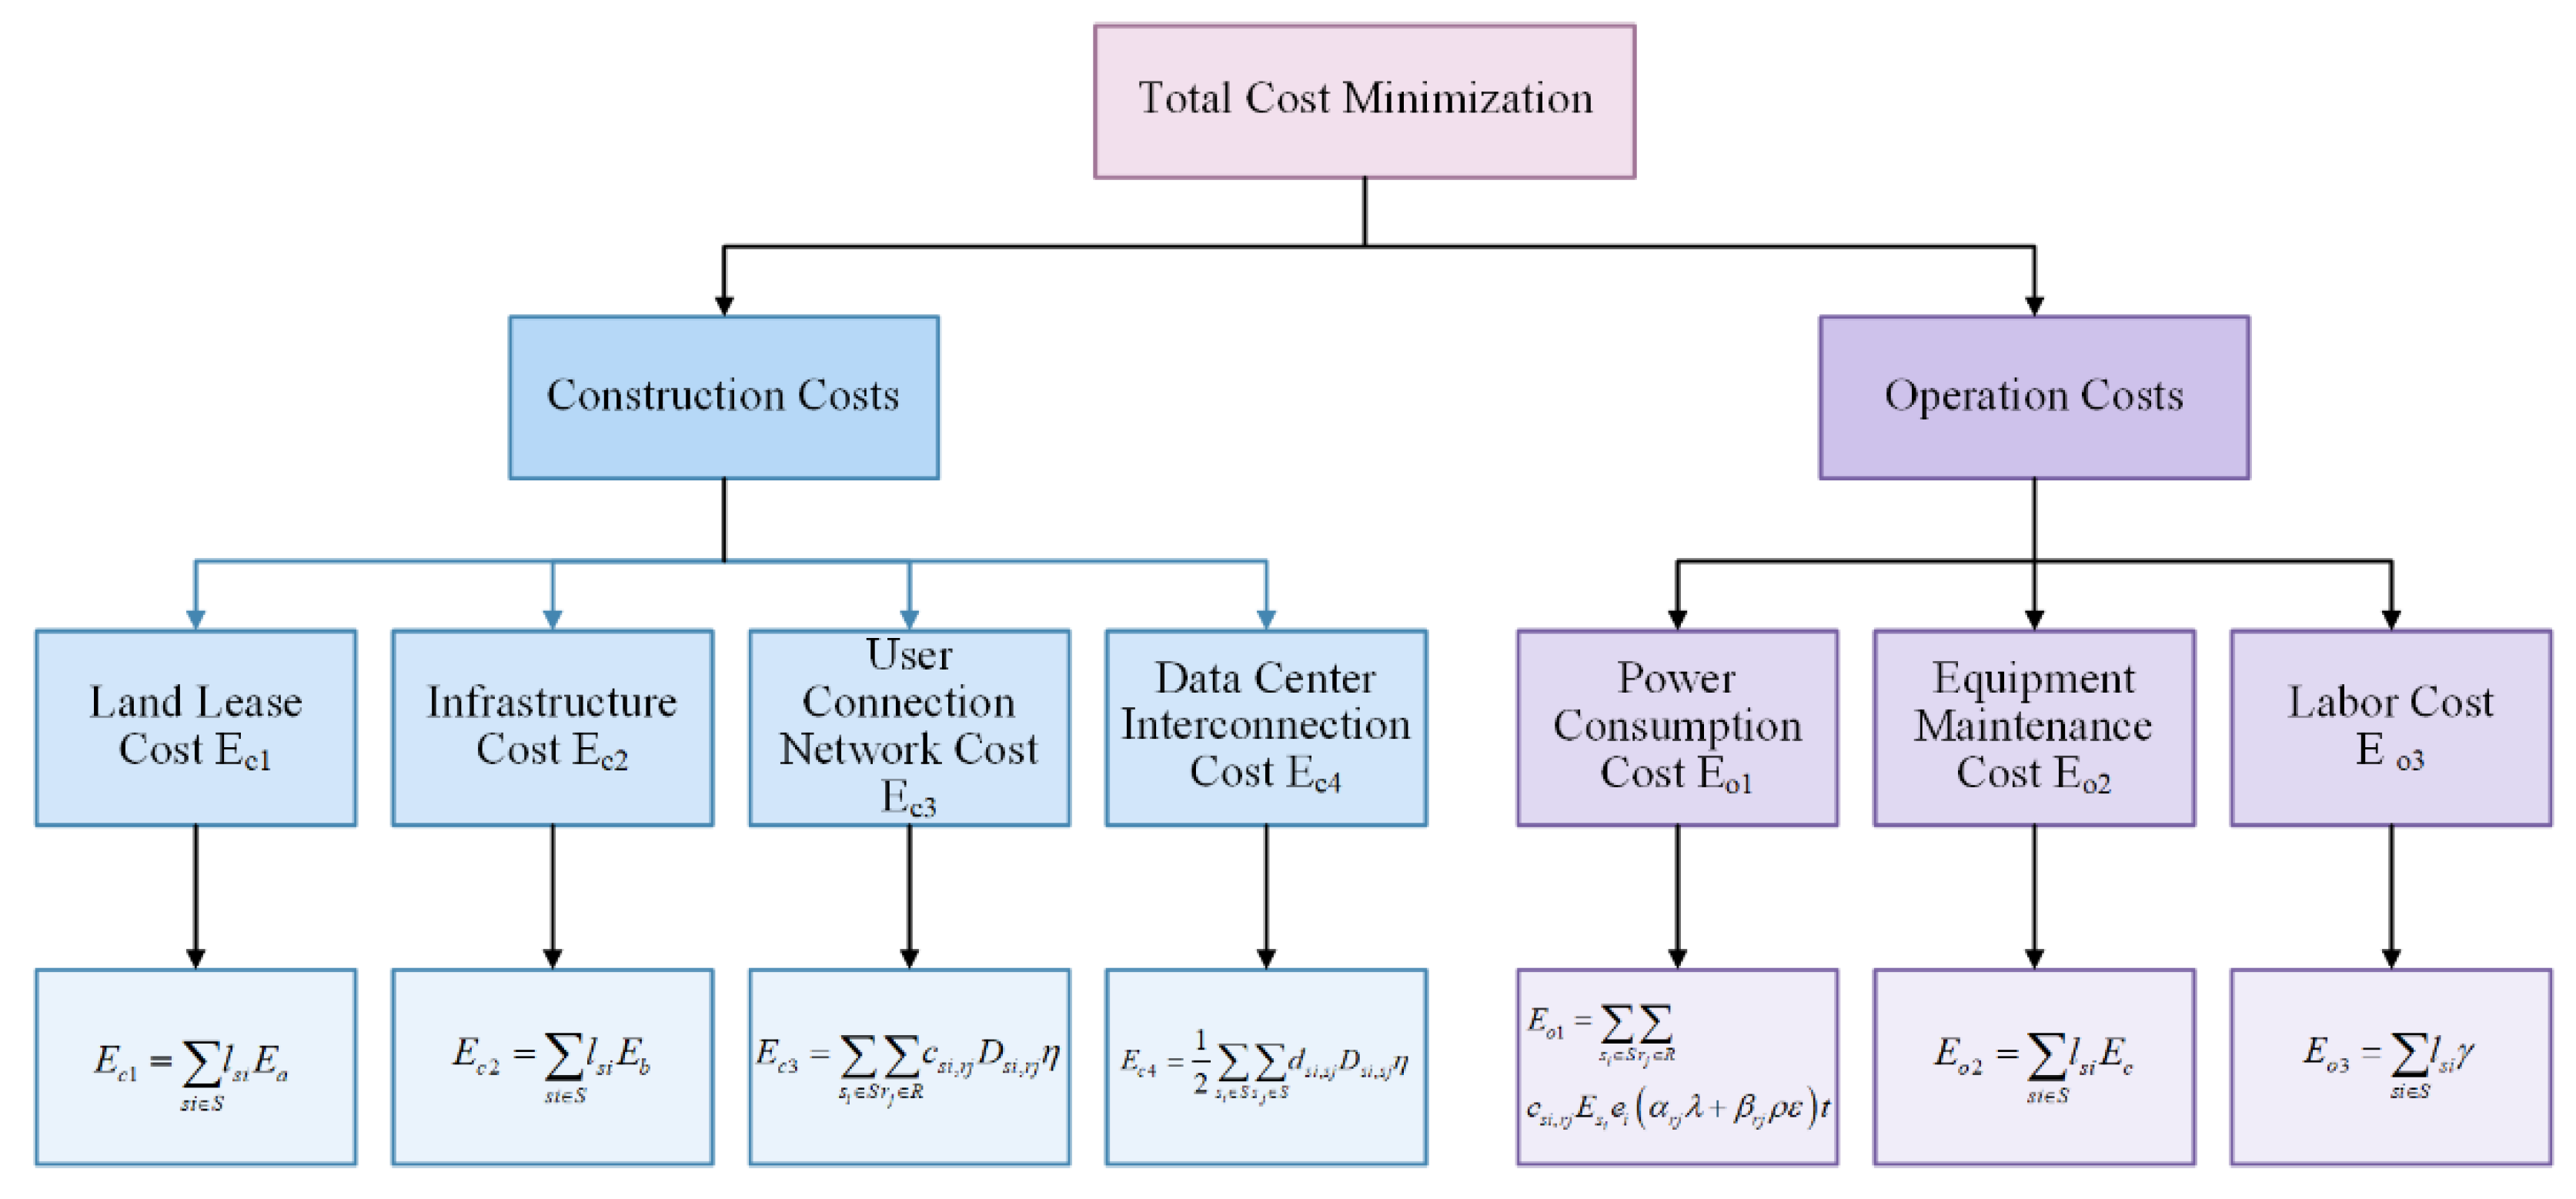
Figure 4.
Detailed Steps of Integer Linear Programming Model for Data Center Layout Optimization.
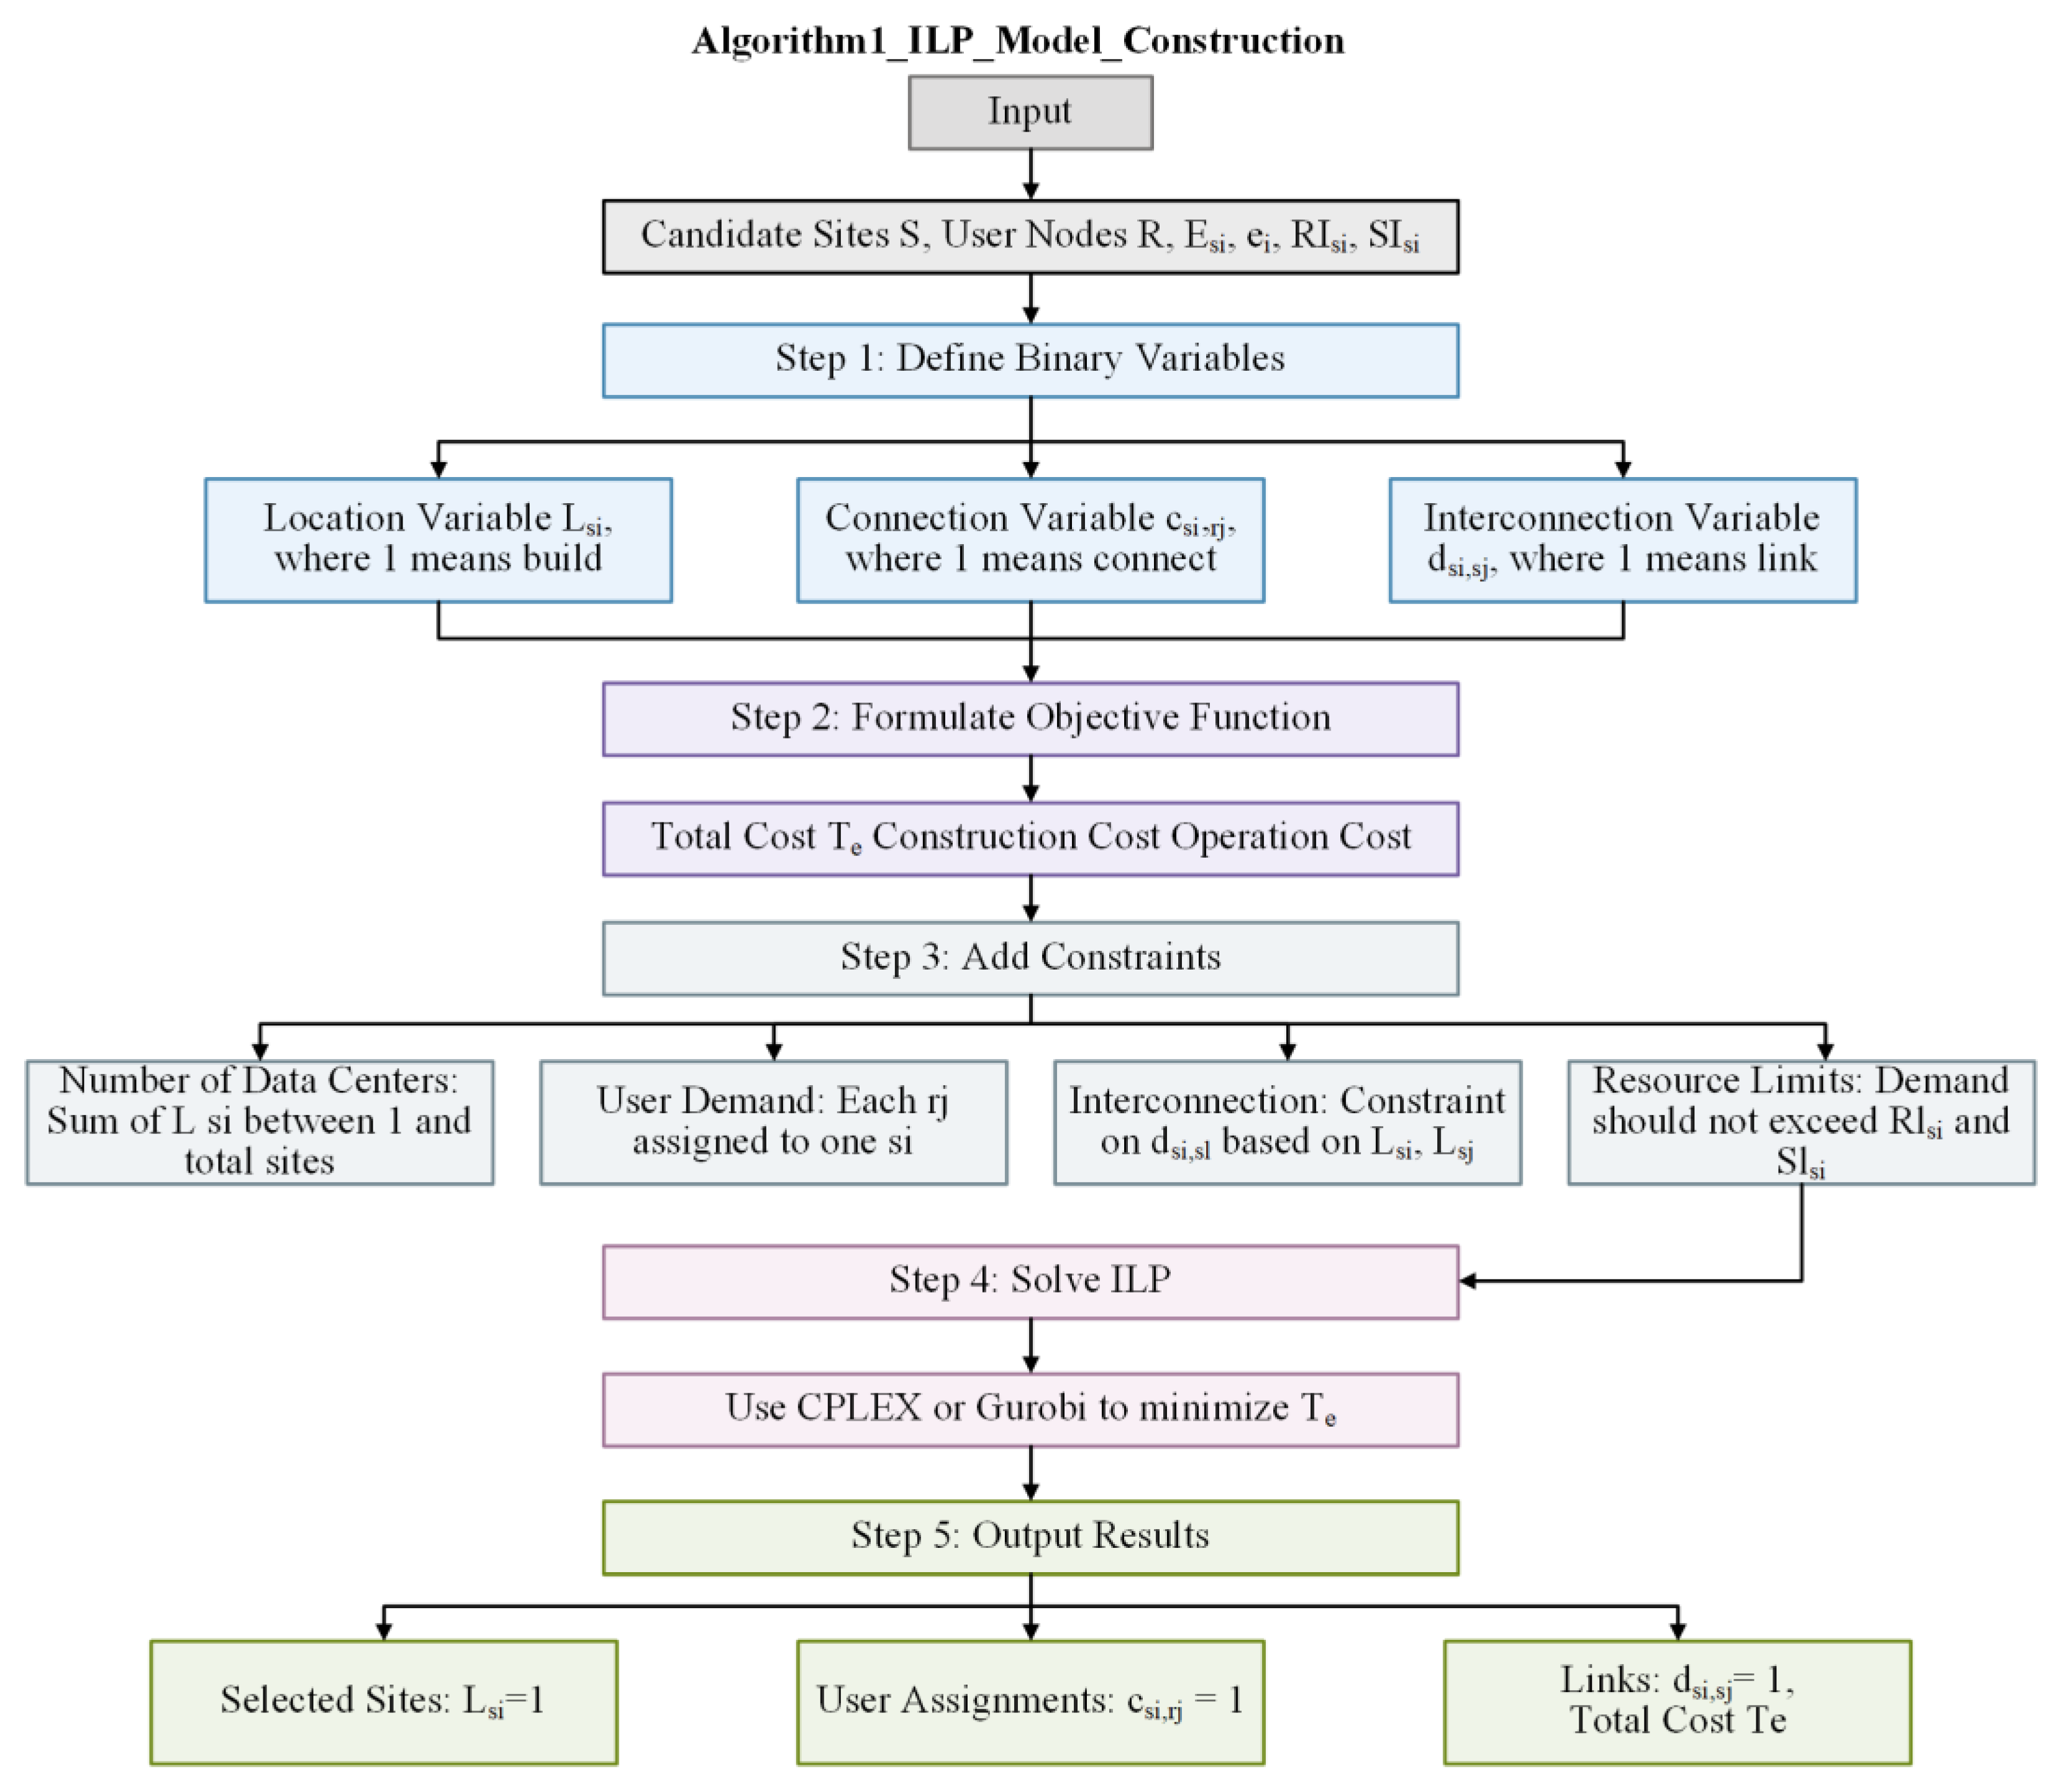
Figure 5.
The data center layout and communication network, conventional baseline scenario with (a) Scenario A layout results and (b) Scenario B layout results.
Figure 5.
The data center layout and communication network, conventional baseline scenario with (a) Scenario A layout results and (b) Scenario B layout results.
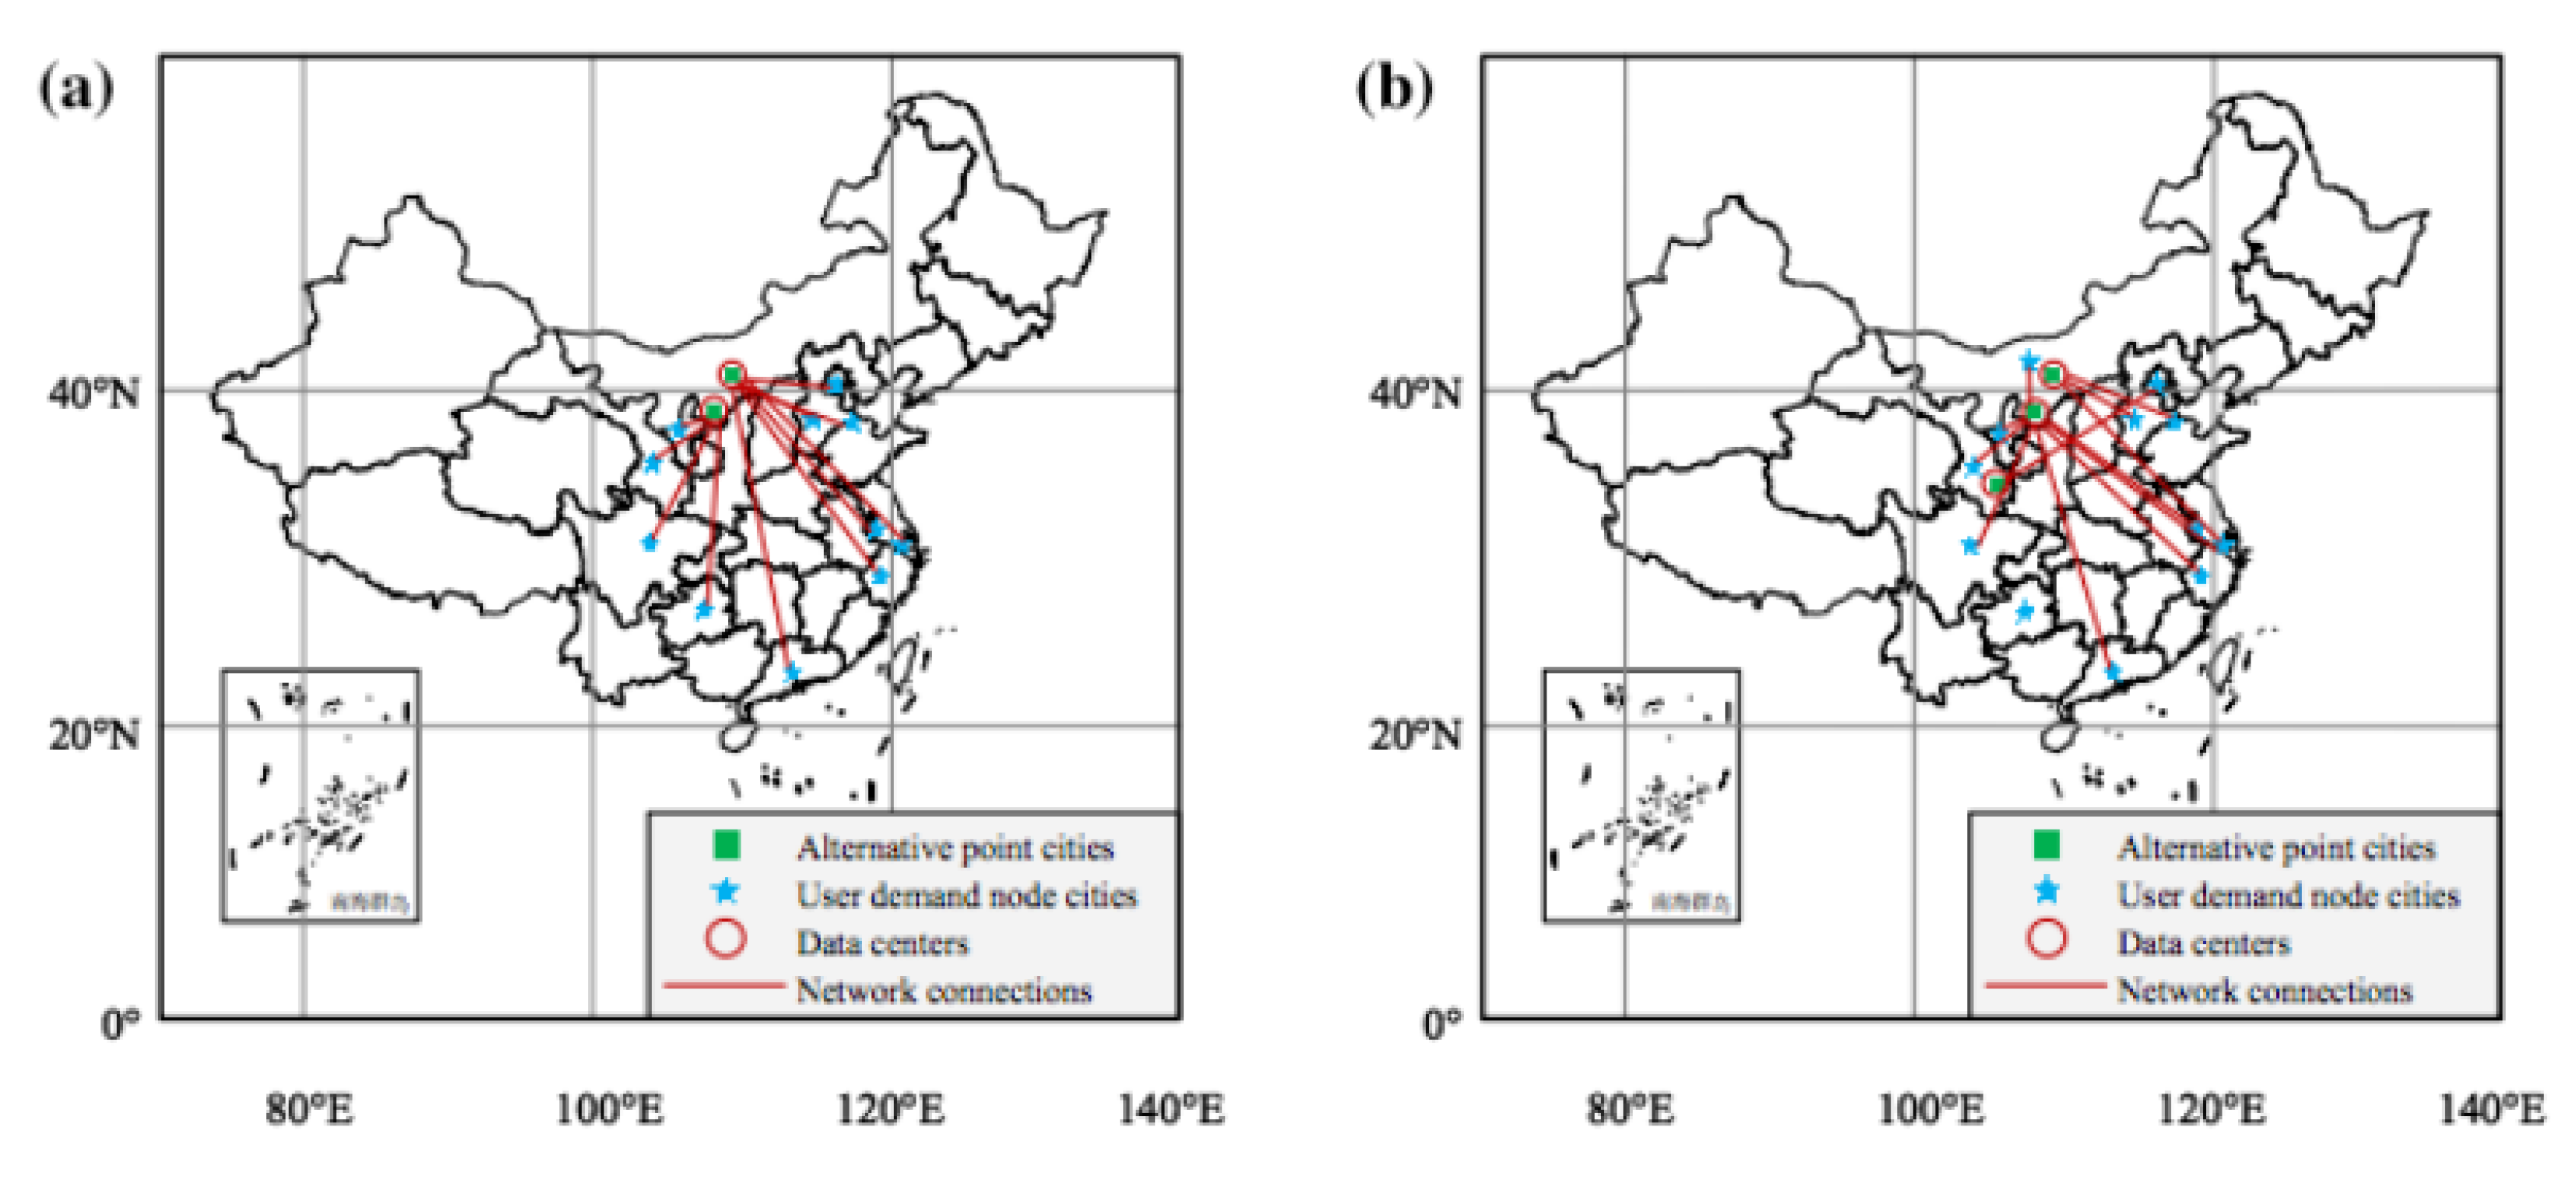
Figure 6.
The data center layout and communication network, energy efficient scenario with (a) Scenario A layout results and (b) Scenario B layout results.
Figure 6.
The data center layout and communication network, energy efficient scenario with (a) Scenario A layout results and (b) Scenario B layout results.
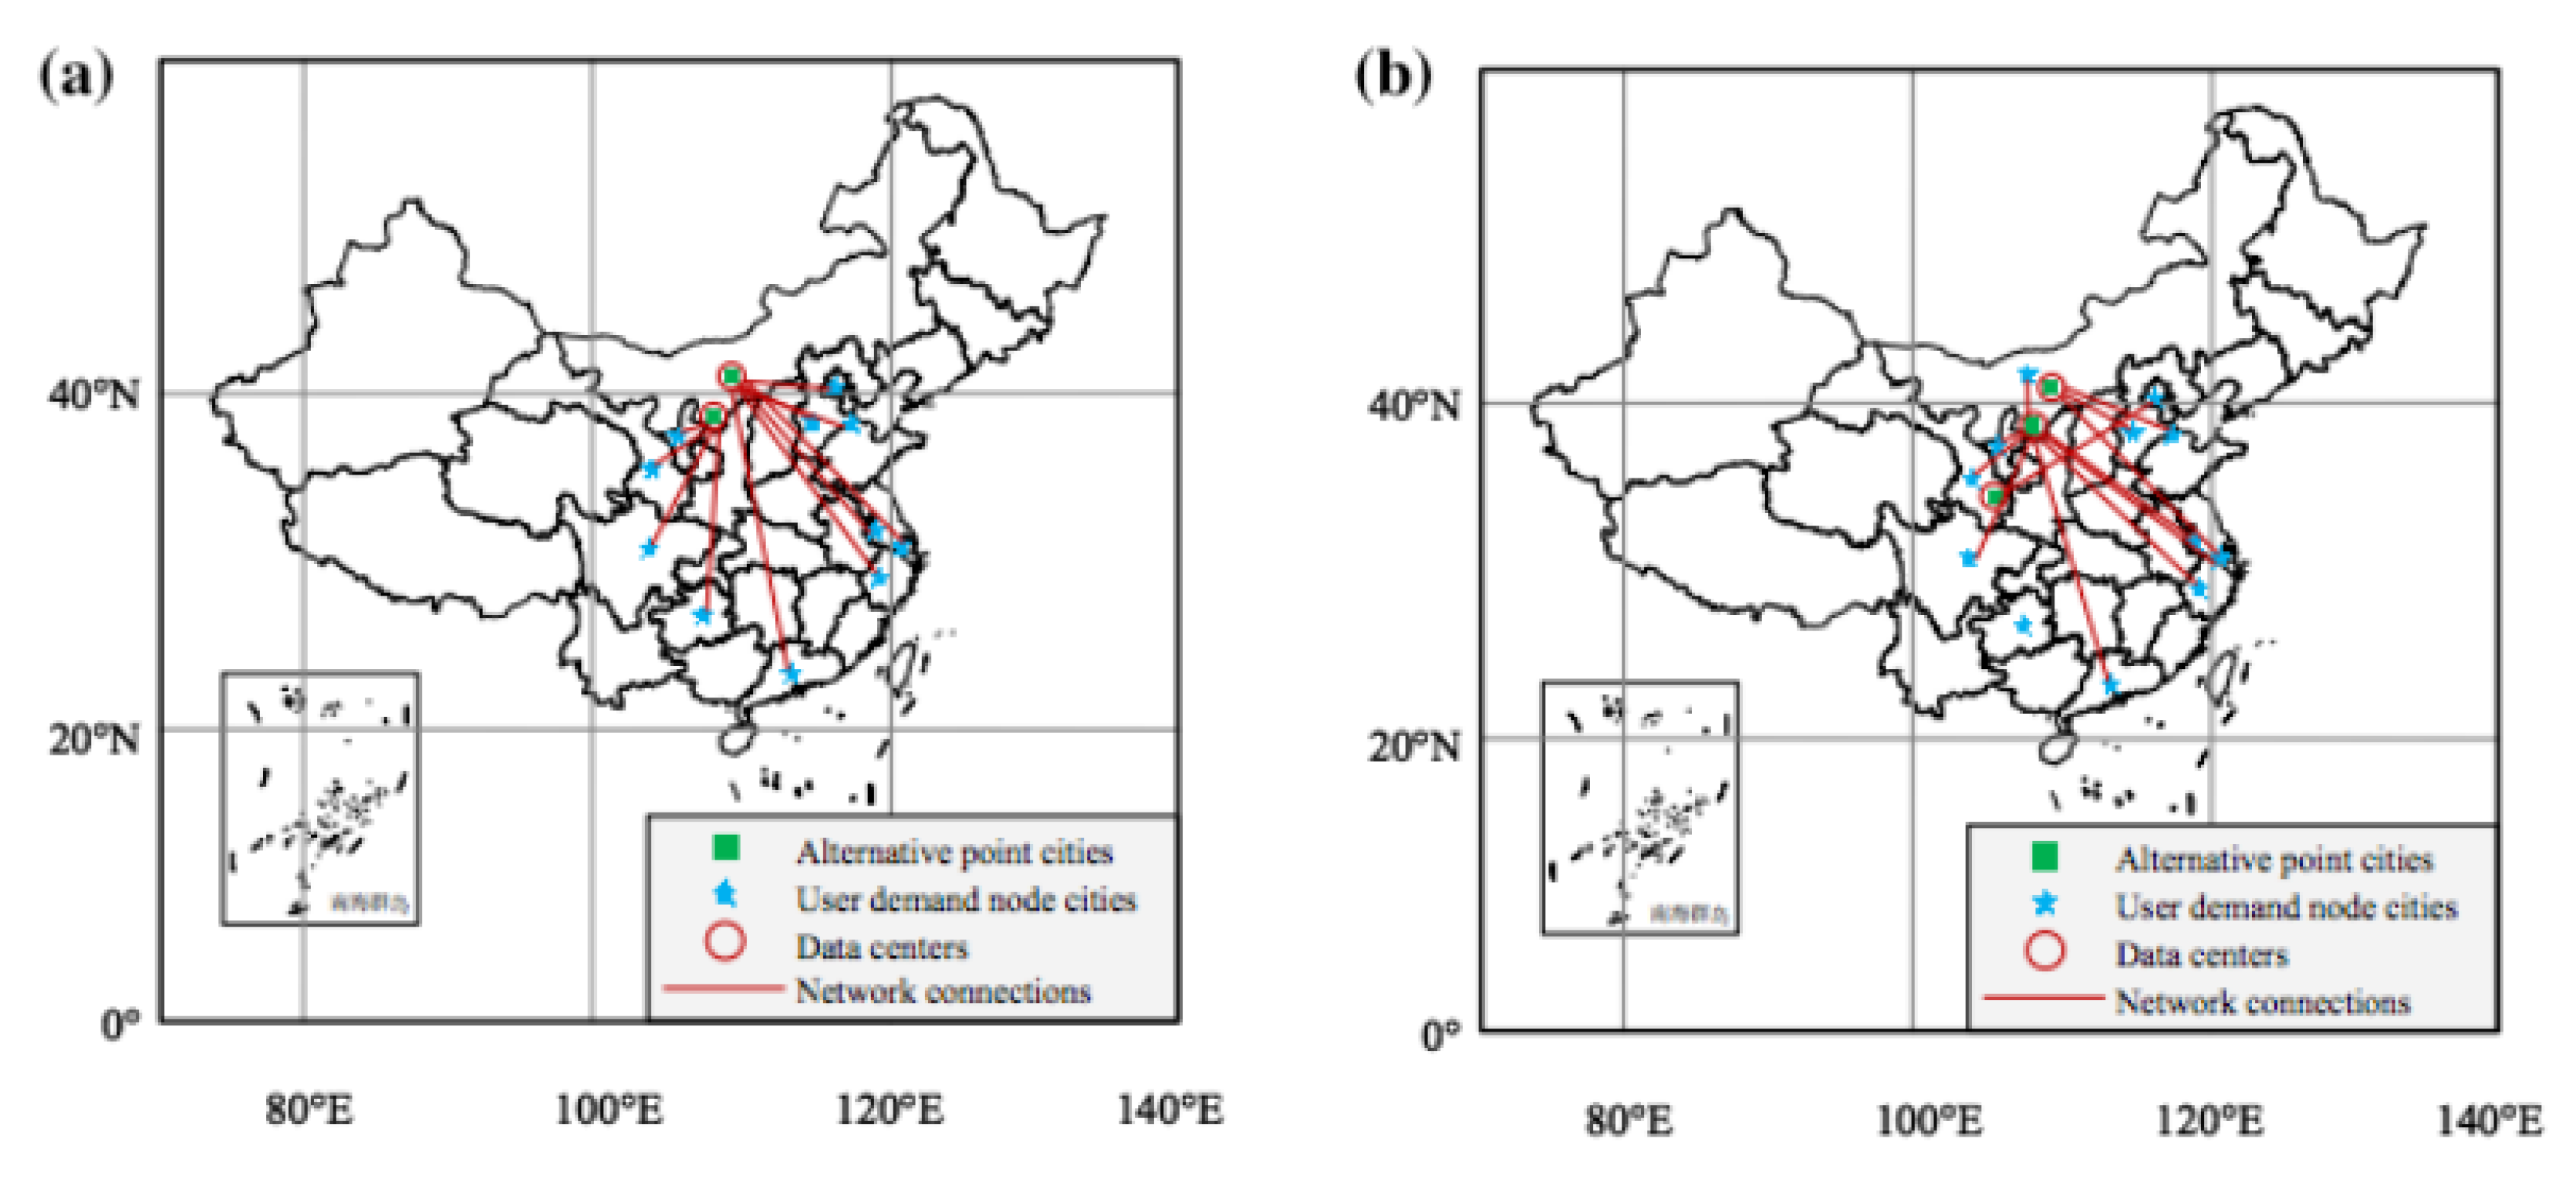
Figure 7.
The cost function of different constraint conditions under (a) conventional baseline scenario and (b) energy efficient scenario.
Figure 7.
The cost function of different constraint conditions under (a) conventional baseline scenario and (b) energy efficient scenario.
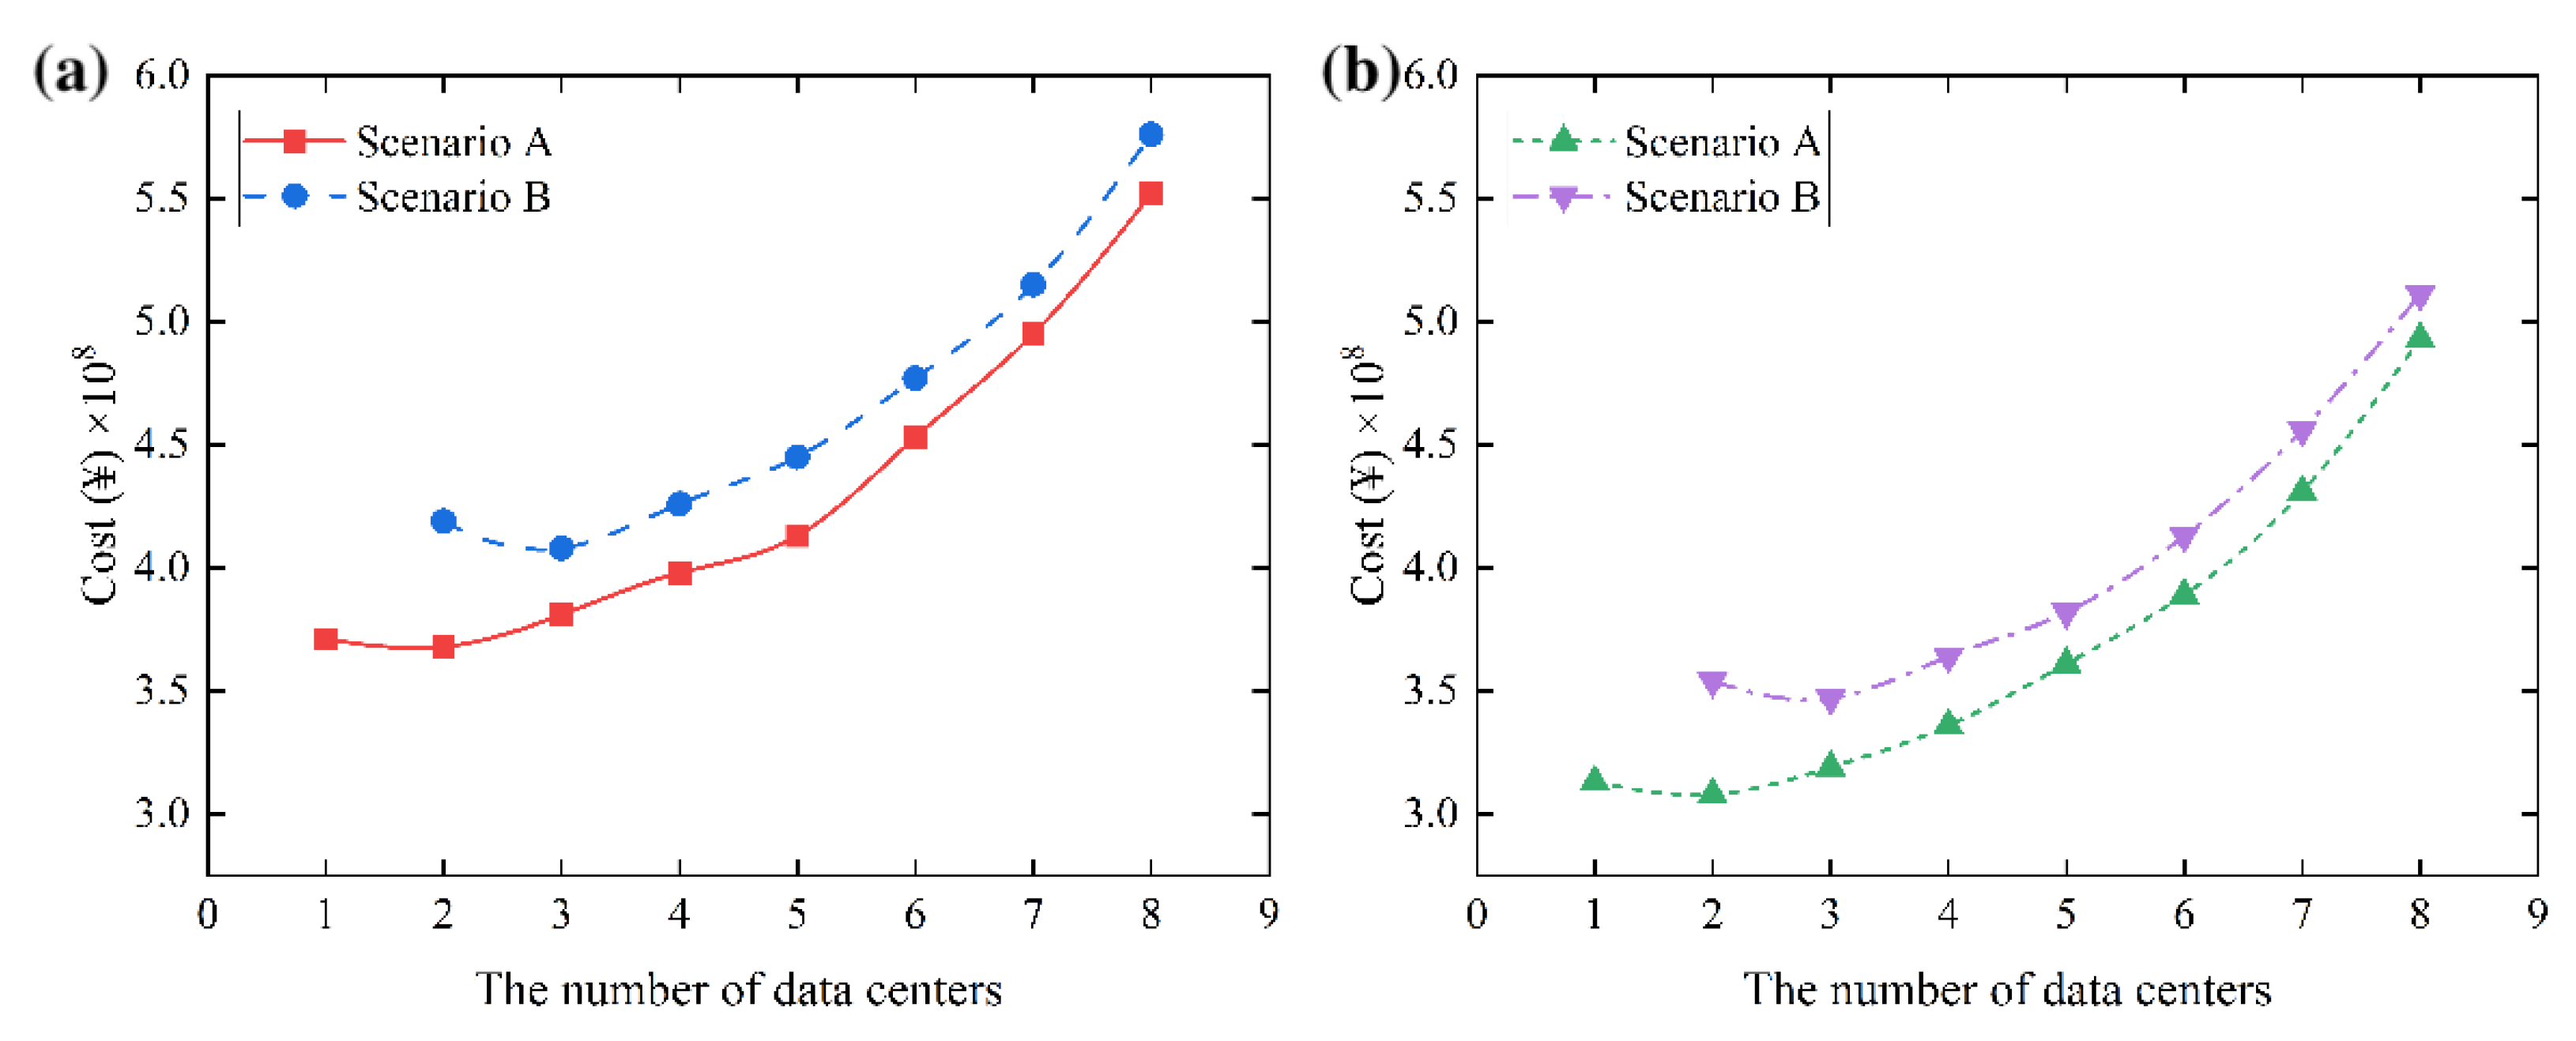
Figure 8.
The cost function of different efficiency scenario under (a) demand constraint and (b) energy consumption constraint.
Figure 8.
The cost function of different efficiency scenario under (a) demand constraint and (b) energy consumption constraint.
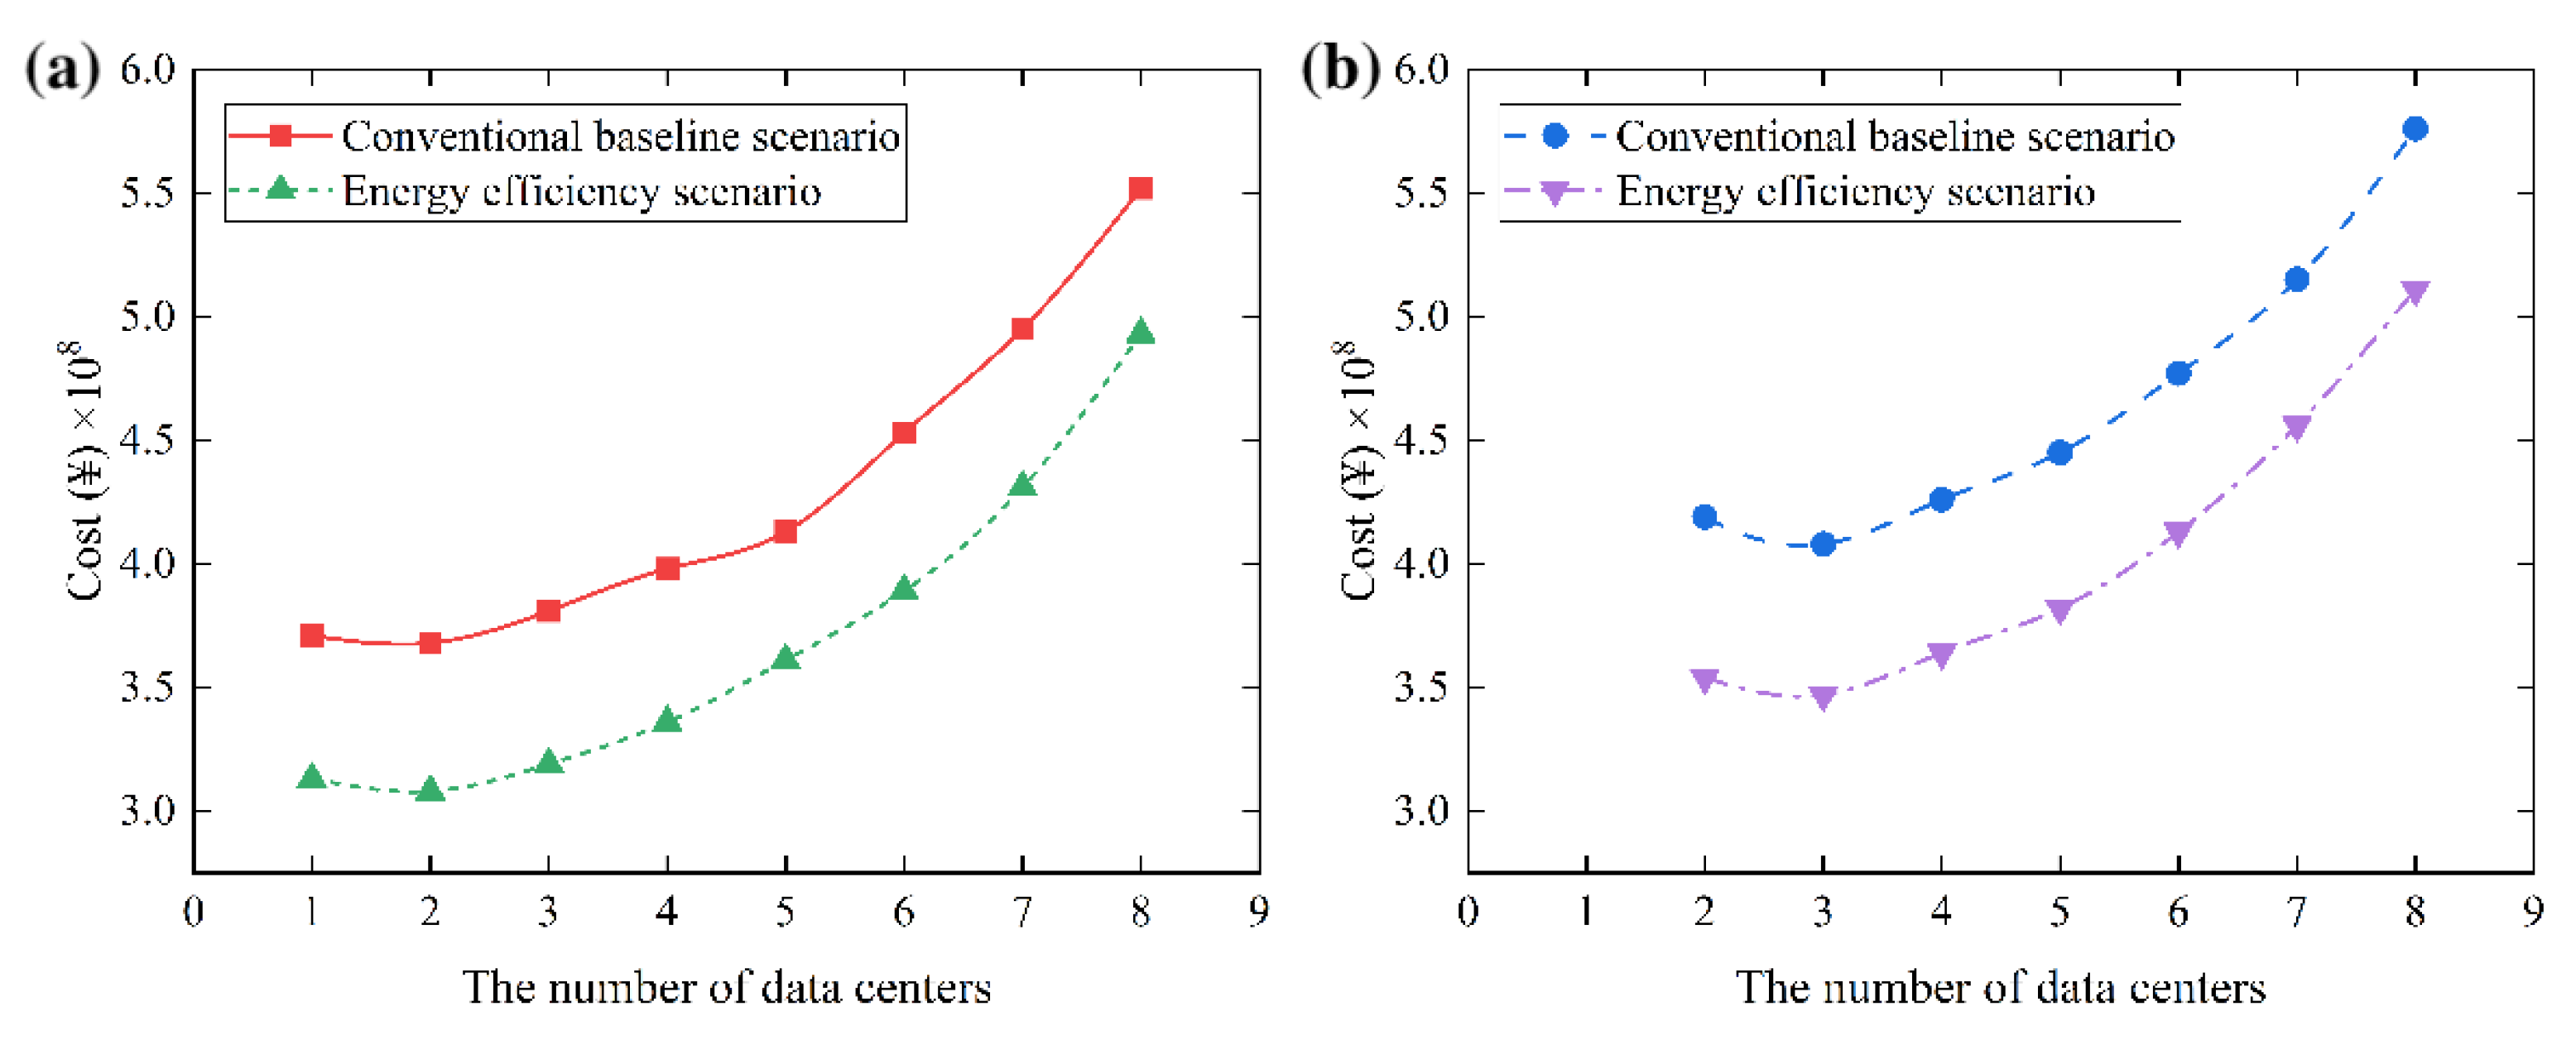

Table 1.
Scenario setting related parameters.
| Alternative point cities | Conventional baseline scenario | Energy efficiency scenario | ||
| Electricity prices | Efficiency | Electricity prices | Efficiency | |
| Langfang | 0.44 | 1.49 | 0.44 | 1.25 |
| Hefei | 0.48 | 1.49 | 0.48 | 1.25 |
| Zhuhai | 0.57 | 1.49 | 0.57 | 1.25 |
| Mianyang | 0.43 | 1.49 | 0.43 | 1.25 |
| Baotou | 0.31 | 1.49 | 0.31 | 1.2 |
| Zunyi | 0.36 | 1.49 | 0.36 | 1.2 |
| Lanzhou | 0.39 | 1.49 | 0.39 | 1.2 |
| Yinchuan | 0.32 | 1.49 | 0.32 | 1.2 |
Table 2.
Parameters related to user demand nodes.
| Province | User demand node | Longitude/oE | latitude/oE | αri/MIPS | βri/Mbps |
| Inner Mongolia | Hohhot | 111.75 | 40.84 | 1.54×10^11 | 2.64×10^7 |
| Beijing | Beijing | 116.41 | 39.9 | 4.49×10^10 | 7.70×10^7 |
| Tianjin | Tianjin | 117.19 | 39.13 | 3.34×10^10 | 5.91×10^7 |
| Ningxia | Yinchuan | 106.23 | 38.49 | 4.09×10^10 | 7.01×10^7 |
| Hebei | Shijiazhuang | 114.5 | 38.05 | 1.55×10^11 | 2.66×10^7 |
| Gansu | Lanzhou | 103.83 | 36.06 | 5.42×10^10 | 9.30×10^7 |
| Jiangsu | Nanjing | 118.77 | 32.04 | 2.51×10^11 | 4.31×10^7 |
| Shanghai | Shanghai | 121.47 | 31.23 | 6.20×10^10 | 1.06×10^7 |
| Sichuan | Chengdu | 104.07 | 30.57 | 4.53×10^10 | 7.99×10^7 |
| Zhejiang | Hangzhou | 120.15 | 30.29 | 1.90×10^11 | 3.26×10^7 |
| Guizhou | Guiyang | 106.71 | 26.58 | 6.24×10^10 | 1.07×10^7 |
| Guangzhou | Shenzhen | 114.06 | 22.54 | 3.24×10^11 | 5.12×10^7 |
Table 3.
Parameters related to alternative points.
| Province | Alternative point | Longitude/oE | latitude/oE | Rlsi/MIPS | Slsi/Mbps |
| Hebei | Langfang | 116.71 | 39.53 | 1.80×10^12 | 1.01×10^17 |
| Anhui | Hefei | 117.27 | 31.86 | 1.49×10^12 | 7.93×10^16 |
| Guangdong | Zhuhai | 113.56 | 22.27 | 2.95×10^12 | 1.63×10^17 |
| Sichuan | Mianyang | 104.73 | 31.47 | 1.79×10^12 | 1.02×10^17 |
| Inner Mongolia | Baotou | 109.84 | 40.65 | 2.82×10^12 | 1.49×10^17 |
| Guizhou | Zunyi | 106.93 | 27.73 | 1.38×10^12 | 7.13×10^16 |
| Gansu | Tianshui | 105.73 | 34.58 | 1.12×10^12 | 5.71×10^16 |
| Ningxia | Wuzhong | 106.20 | 37.98 | 1.02×10^12 | 5.73×10^16 |
Table 4.
Data center-related equipment parameters.
| Parameter | Meaning | Unit | Data |
| ρ | Data Storage Duration | day | 365 |
| λ | Processor Computing Power Consumption | kW/MIPS | 2.8×10^−5 |
| ε | Storage Device Power Consumption | kW/Mbit | 3.7×10^−10 |
| η | Cost per Unit Length of Optical Fiber Network | ¥/km | 7200 |
| t | Design Lifespan of Data Center | year | 12 |
Table 5.
Total cost of Scenario A layout results and Scenario B layout results under the conventional baseline scenario.
Table 5.
Total cost of Scenario A layout results and Scenario B layout results under the conventional baseline scenario.
| The number of data center | Total cost (¥) | |
| Scenario A | Scenario B | |
| 1 | 3.71×10^8 | - |
| 2 | 3.68×10^8 | 4.19×10^8 |
| 3 | 3.81×10^8 | 4.08×10^8 |
| 4 | 3.98×10^8 | 4.26×10^8 |
| 5 | 4.13×10^8 | 4.45×10^8 |
| 6 | 4.53×10^8 | 4.77×10^8 |
| 7 | 4.95×10^8 | 5.15×10^8 |
| 8 | 5.52×10^8 | 5.76×10^8 |
Table 6.
Total cost of Scenario A layout results and Scenario B layout results under the energy efficient scenario.
Table 6.
Total cost of Scenario A layout results and Scenario B layout results under the energy efficient scenario.
| The number of data center | Total cost (¥) | |
| Scenario A | Scenario B | |
| 1 | 3.13×10^8 | - |
| 2 | 3.08×10^8 | 3.54×10^8 |
| 3 | 3.19×10^8 | 3.47×10^8 |
| 4 | 3.36×10^8 | 3.64×10^8 |
| 5 | 3.61×10^8 | 3.82×10^8 |
| 6 | 3.89×10^8 | 4.13×10^8 |
| 7 | 4.31×10^8 | 4.56×10^8 |
| 8 | 4.93×10^8 | 5.11×10^8 |
Disclaimer/Publisher’s Note: The statements, opinions and data contained in all publications are solely those of the individual author(s) and contributor(s) and not of MDPI and/or the editor(s). MDPI and/or the editor(s) disclaim responsibility for any injury to people or property resulting from any ideas, methods, instructions or products referred to in the content. |
© 2025 by the authors. Licensee MDPI, Basel, Switzerland. This article is an open access article distributed under the terms and conditions of the Creative Commons Attribution (CC BY) license (http://creativecommons.org/licenses/by/4.0/).
Copyright: This open access article is published under a Creative Commons CC BY 4.0 license, which permit the free download, distribution, and reuse, provided that the author and preprint are cited in any reuse.


