Submitted:
20 August 2025
Posted:
22 August 2025
You are already at the latest version
Abstract
This study aims to examine the effects of noise levels in the design studio of the De-partment of Interior Architecture and Environmental Design at Afyon Kocatepe Uni-versity on students. Noise levels were measured at different times and locations within the studio environment. To assess the impact of these noise levels on students, a survey was administered to gauge their perceptions of noise. The survey questions assessed students' perceptions of noise levels and noise diversity in design studios in terms of discomfort, difficulty concentrating, communication difficulties, and overall producti-vity. According to the results, the majority of students stated that the noise in the stu-dio distracted them and reduced their productivity. The noise level measurement re-sults also supported these perceptions, showing that the limit values were exceeded most of the time. In this regard, design solutions such as spatial partitions, fab-ric-covered panels, sound-absorbing vinyl flooring, and acoustic ceiling elements were proposed to reduce noise in studio 130. In this context, the goal is to create a more effi-cient and comfortable learning environment for design studios where students need to maintain high levels of motivation and concentration while working on projects.
Keywords:
design education
; interior quality
; noise
1. Introduction
Room acoustics and noise control principles are used in contending with noise. Room acoustics, led by the period of reverberation in closed volumes, organizes the parameters of room acoustics. Whereas, noise control includes the preventive measures that would be taken for keeping the sound levels under control, which are conveyed through the outer covering of the building and the division elements. At Türkiye within this framework, the law containing the information related to noise control in buildings, “No. 30082 Regulation on the Protection of Buildings Against Noise” was published in the Official Gazette on 31 May 2017 and went into force on 31 May 2018. Through this regulation, it defined the matters that should be taken into consideration from the aspect of design, construction, use, and maintenance that could decrease all kinds of damage that could occur to the physiological and psychological structures of individuals for realizing the conditions of hearing well and perception of all kinds of noise that could affect individuals during all kinds of construction, operation, and operation activities [1].
Noise, especially in educational buildings, is an important environmental factor, which negatively affects learning processes. Noise in educational buildings affects the concentration, motivation, and general learning performance of students. It is of critical importance in these types of areas to take under control both internal and external sources of noises for constituting a healthy and productive learning environment. Table 1 shows the standard noise levels in dB(A) and building classes for educational facilities, as published in the Official Gazette by the Ministry of Environment and Urbanization in the Regulation on the Protection of Buildings Against Noise.
In this context, maintaining noise levels within standards in educational structures, and particularly in studios where design education is provided, is important in terms of the quality and efficiency of education. The functioning of design courses in studio environments differs from theoretical courses conducted in traditional classroom environments; this situation creates significant differences in students' perception processes and in-class motivation. This study is based on the claim that design studios differ from traditional classroom environments in terms of interior design, teaching methods, noise levels, and students' behavioral patterns during lessons. Additionally, it is argued that the noise generated during project-based lessons in design studios has an impact on students' learning processes and motivation.
The aim of this study is to measure the noise level in the buildings providing design education in Afyon Kocatepe University Department of Interior Architecture and Environmental Design and to evaluate the effects of this noise on students' learning processes.
Within the scope of the study, the compliance of the existing noise levels in the design studio with national and international standards was evaluated. For this purpose, noise levels were measured once a week over a 14-week period, at different time intervals. The survey results were evaluated through statistical analyses, revealing significant correlations between measured noise levels in the studio and students’ work efficiency. The study identified the primary noise sources in the Interior Architecture and Environmental Design Department’s design studio and proposed design and managerial measures to mitigate their impact, thereby improving the overall acoustic quality of the studio environment. Based on the findings, recommendations were made for the use of noise-reducing space dividers, acoustic panels, and surface materials to enhance and redesign learning environments in the context of design studios.
1.1. Concept and Effects of Noise
The concept of noise, which stems from the word “nausea” in Latin, is defined as “the wrong noise at the wrong place at the wrong time” and “unwanted noise” [3]. Whereas, noise is formed physically as generally high-level complex sounds that are of indiscriminate structure and that do not have compatible tonal components [4]. Noise has always been a problem, especially for cities. The most significant difference between modern societies and past societies is that a greater segment of the population is affected by noise pollution [5].
Noise pollution is one of the main problems in cities throughout the world [3] and it is defined by the World Health Organization (WHO) as unwanted or excessive noise that could have harmful effects on human health and environmental quality [6].
Noise pollution is one of the environmental problems created by urbanization and is an important factor that can lower the quality of life [7-3]. It negatively affects the mental health and work performance of people and it can pave the way in time for high blood pressure and memory loss [8-9]. Furthermore, it is observed that it can be the cause of various negative emotional behaviors, such as annoyance, sleep disorders, cardiovascular diseases and cognitive disorders, headaches, dizziness, and fatigue or directly for hearing loss and/or hearing disorders, anger, disappointment, unhappiness, anxiety, and moreover depression [10-11-12-13-14-15-16-17]. [18] summarized in the manner given below the effects on people of different noise frequencies:
- 0-35 dB(A): Noise that does not produce damage,
- 36-65 dB(A): Disturbing noise that can upset sleep and rest,
- 66-85 dB(A): isturbing noise that can damage mentally and that can pave the way for hearing disorders,
- 86-115 dB(A): Noise that damages mentally and physically and that paves the way for psychosomatic diseases,
- 116-130 dB(A): Dangerous noise, deafness and similar important situations, and
- 131-150 dB(A): Very dangerous noise, unbearable without a protective device. Noise level that produces instant damages.
When the sources that are the cause of noise are examined, it is found that there are two basic sources, inside buildings and outside buildings. [4] stated that some of the sources of noise inside buildings are from noise sources that negatively affect people located within the buildings where they live or work have been listed as follows:
- High level speaking voices,
- Walking noises, dragging things, repair works, and other impact noises,
- Music, radio, TV noises raised electronically,
- Noises of home appliances (mechanical or electrical tools),
- Noise of garbage shafts,
- Closed garages,
- Slamming door noises,
- Businesses, studios, repair shops, and other factories related to buildings and houses,
- Shared services areas (staircases, elevators, etc.),
- Bowling alleys and other closed sports areas,
- Flowing water noises in bathrooms and kitchens, and
- Insulated music studies, rehearsal rooms [4].
1.2. The Effect of Noise in Educational Buildings
Inside building noises are special noises stemming from all kinds of mechanical, electronic systems, and vital activities found within a building [4] that affect relatively fewer people and that enter into the building acoustics area of examination. Noises arising from sources such as furniture, human voices, office noises, lift, ventilation, hydrophore are shown as examples of in-building noise sources.
The source of the noise, level, and effect changes according to building types (Table 2). It is very important to investigate the noise level in educational buildings, which are the subject of this study, and to take measures against noise in the context of student motivation.
There are many factors in the places inside buildings where classrooms are located in the educational buildings, such as the physical environmental conditions outside the building, vibration in the building, mechanical tools that make noise, and noises stemming from the facilities [22].
[23-22] stated that in case the limits of noise levels in educational buildings are exceeded, then it could negatively affect the quality of education-instruction by paving the way for the negativities listed below:
- Masking the talking and decreasing the ability to comprehend,
- Dissipating the mental and physical attention,
- Prolonging the period of reading and learning,
- Bad temper in student behaviors and decreased interest in course, and
- Raising of teachers voices due to existing noise and for exhaustion to occur in a short period of time.
The noises stemming from both inside and outside educational buildings contribute negatively to the psychological, behavioral, and academic developments of students [22], and is a factor that decreases the educational-instructional quality by disturbing the learning environment and prevents healthy communications [24]; [25]; [26] Consequently, it is rather important to decrease or prevent noise in educational buildings, whose aim is to teach or instruct, and to educate people [27].
In the guide by WHO published for environmental noise, there are various limit values. These limit values for classrooms in schools determined that the noise limit level of 35 dB(A) was required. In the regulation published in the Official Gazette No. 27601 (June 2010) in Turkey, the acceptable background noise in classrooms is determined as 35 dB(A) in case of closed windows and 45 dB(A) in case of open windows. [25] suggests a limit of 35 dB(A) for small classroom and meeting spaces, while [28] argue that this value should be in the range of 38-47 dB(A) with NC30-0. The recommended external noise level for educational buildings is in the range of 40-60 dB(A) (LAeq), regardless of the form of planning, and this limit also applies to design studios [29].
Educational spaces are not only areas where knowledge transfer takes place, but also physical environments with special functions that are shaped according to the quality, duration, student profile and pedagogical approach of the education offered. In this context, the design of educational environments, especially in applied fields such as architecture and interior architecture, is of great importance. Because in this type of education, there is a dynamic structure in which both theoretical and practical courses are intertwined [30].
An effective educational environment should fulfil not only auditory but also visual and spatial needs. But managing this complex structure in studios requires much more customised solutions than in traditional classroom designs. The flexible use of space, its adaptability to different learning scenarios and the sustainable provision of acoustic comfort are vital for both pedagogical success and the general well-being of students. Otherwise, students' motivation may decrease and they may be distracted from the learning process. For this reason, it is very important to create quality spatial conditions especially in design education institutions [31].
1.3. The Effects of Noise Level on Students in Design Studios
Design studios, like all other learning environments, are special places where not only knowledge transfer but also social interaction takes place. These studios, which are the basic building blocks of design education, are environments where students gain both professional and cultural gains, design principles are discussed, alternative solutions are developed and learning is realised by doing. Design education involves a process in which mutual interaction is fundamental. In this context, studios are environments where both individual and collective learning forms are intertwined, unlike the classical classroom understanding [32] , and design studios turn into living spaces that are actively used outside of class hours and where students spend most of their time. Therefore, not only physical but also pedagogical and sociological factors need to be taken into account in these spaces. As stated by [33], design studios offer an educational model based on learning by doing with their pedagogical functions and common production [34] The courses in the studios aim to provide students with versatile skills such as perceiving environmental factors, critical thinking, generating creative ideas, self-expression and problem solving. According to [35], the activities in design studios are divided into two as formal and informal. Formal activities include knowledge transfer, group work and jury assessments, while in informal processes students learn from each other's experiences and observations independently of the coordinators. However, these requirements often seem to contradict each other. For example, while an open and interactive environment is necessary for students to communicate effectively in groups, auditory privacy is also critical for individual focus and learning. Balancing this dual need is possible with the success of not only physical but also acoustic design strategies . In design studios, auditory environmental conditions should be considered as a factor that directly affects the focus of users and the quality of communication. Voice communication between users should be designed so as not to distract other individuals in the same environment [31-35]. Various studies conducted in design-centred programmes show that space comfort directly affects students' studio experiences. Providing auditory comfort in these special environments where students reveal their individual creativity, exchange ideas with group dynamics and participate in production processes is critical to increase learning effectiveness.
Design studios are intensive production spaces where students spend long periods of time. According to research, students spend on average more than three hours per session in these environments. During this time, indoor environmental quality (IEQ) plays a decisive role in students' academic performance and general well-being. Factors such as inadequate ventilation, excessive temperature, low light level and noise pollution can negatively affect students' cognitive processes [36]. Noise is one of the most common environmental stressors in design studios. It has an effect on students' creative processes at a level that can prevent them from focussing and information processing. In particular, group work, social interactions and a constantly moving learning environment generate high levels of background noise in studios. This interrupts the auditory communication process, which is directly related to academic success [37-38].
[38-39] found that the physical characteristics of design studios have a significant impact on students' perceptual evaluations and physical disturbances such as hearing impairment, stress and sleep disorders; [40] psychological symptoms including decreased concentration and irritability.
The architectural characteristics of studio environments are shaped by many factors, from furniture arrangement to surface choices, from sound reflection rates to the location of sources. In open-plan studios, sources and receivers are not fixed, making it difficult to control the direction and intensity of sound. This necessitates space-specific acoustic analyses. While the direction and intensity of sound can be predicted in normal classroom settings, such standardized solutions are often insufficient in studio environments [30].
In the light of all these findings, it is concluded that auditory comfort should be provided in order to maintain the motivation and productivity of students, especially in departments providing design education, in environments where long-term and intensive studios are carried out. Failure to provide auditory comfort in design studios can cause serious productivity losses by negatively affecting students' pedagogical gains and academic motivation in individual or group work. Table 3 shows the spatial differences between traditional classrooms and design studios
2. Materials and Methods
2.1. Materials
This study aims to determine the noise levels reaching the design studios in Interior Architecture departments from the environment and to examine the effect of this noise on students' motivation in design courses. Within the scope of the study, the existing noise levels in the studios were measured and the data obtained were evaluated by comparing with the relevant acoustic standards. In line with the analyses, it is aimed to determine the necessary physical and design measures to increase the working efficiency of the students. In the study, answers to the following questions were sought:
- What are the current noise levels in the design studios in the Department of Interior Architecture and Environmental Design?
- Do these noise levels comply with national and international noise level standards?
- How do noise levels affect the working efficiency of Interior Architecture and Environmental Design students?
- What are the noise sources in the work area and how can the impact of these sources be reduced?
- What measures should be taken to improve the sound quality in Interior Architecture and Environmental Design studios?
Afyon Kocatepe University, which is the study area, was established in 1992 and has 31520 students and approximately 2000 academic and administrative staff since its establishment. It continues its educational activities with 13 faculties, 3 institutes, 3 colleges, 1 state conservatory and 14 vocational schools [17]. Within the Faculty of Fine Arts (Figure 1), where the study was carried out, there are Departments of Interior Architecture and Environmental Design, Cinema and Television, Ceramics, Painting and Traditional Turkish Arts.
The total number of students of the faculty is 1123 and the total number of academic and administrative staff is 55. Due to its location, the Faculty of Technology meets with the State Conservatory in a common courtyard. The total number of students of these three faculties is 2811. When the built environment of the Faculty of Fine Arts was examined; it was seen that the most intensively used open spaces by students and staff were the courtyard and car park. The study was carried out in the design studio of the Department of Interior Architecture and Environmental Design in Faculty of Fine Arts . The reasons why this department is preferred as a field study can be listed as the fact that most of the courses in the department are carried out in design studios and students take courses related to acoustics. Within the scope of the study, when the classrooms and studios used by the Department of Interior Architecture and Environmental Design in the Faculty of Fine Arts building were examined; the studio numbered 130 given in Figure 2 was selected for the measurement of the noise level. Design studio 130 is a studio with a façade to the courtyard and the external noise is higher than the other studios.
2.2. Methods
The method of the study consists of noise measurements and questionnaire analyses with students using the studio where noise measurements were made. Within the scope of the study, noise measurements were made in the studio (studio no. 130), which has a façade to the courtyard that students use intensively between classes. According to the Regulation on the Assessment and Management of Environmental Noise dated 27.04.2011, measurements are planned to be carried out during the daytime hours from 07:00 to 19:00 in the morning (09:00)-afternoon (12:00)-evening (17:00). Measurements were taken once a week during project classes over a period of 14 weeks, covering one academic term.
The measurements were taken using a high-quality sound level meter with data logging capabilities, the PCE-NDL 10. This device can measure in A and C frequency weightings in S (slow) and F (fast) modes; it records sound pressure level (SPL) and dose measurements in decibels (dB(A). Measurement data can be stored both in the device's internal memory and on an SD card. The device's technical accuracy varies at temperatures of 23 ± 5 °C and frequencies below 94 dB(A): Before each measurement, the device is calibrated using a PCE-SC 42 brand calibrator capable of performing two-stage calibration at 94 dB(A) or 114 dB(A) levels.
This instrument is a Class 2 certified, portable, reliable and accurate sound calibrator. It enables quick and accurate checking of sound level meters in routine laboratory or field calibrations. As a result of the measurements, Lmin, Lmax, Leq values were obtained. The obtained A-weighted parameters are defined below.
Lmax (the highest noise level): “The highest level at any moment of the changing noise according to time”,
Lmin (the lowest noise level): “The lowest level at any moment of the changing noise according to time”, and
Leq (equivalent noise level): “The total noise energy which shows continuity regularly or irregularly between a certain T time or the noise scale in the dB(A) units obtained with the division of the measurement period of noise pressures [41] (Figure 3).
The measurements were taken in studio no. 130 and in the corridor where this studio was located for 10 minutes. When measuring noise coming from the courtyard, the device was positioned 1.5 meters high, 1 meter away from the window, and with no reflective surfaces around it. When measuring noise from the corridor, the device was positioned at a height of 1.5 meters, 1 meter away from the corridor, and without any reflective surfaces around it. When measuring in the middle of the studio the device was positioned at a height of 1.5 meters, at the exact center of the studio, and without any reflective surfaces around it. The measurements in the studio were made when the students were in the classroom during the lesson and when the studio was empty between/after the lesson. The points of the measurements and the plan and sections of the studio are given in Figure 4. The measurements were made in front of windows and doors in the studio, in the centre of the studio and in the corridor of the studio to determine the noise coming from out to the training areas.
After the measurements, a questionnaire study was carried out to determine the students' level of noise exposure and discomfort in the design studio The questionnaires were conducted with the 3rd and 4th year Interior Architecture and Environmental Design students due to the high number of applied courses carried out in design studios. There are 248 students studying in the 3rd and 4th year in the department.
The sample size was determined based on 95% confidence level and 5% margin of error; in this context, the number of subjects was calculated as 151. The following equation [17-42-43] was used to determine the sample size:
n= (Z^2 NPQ)/(ND^2+Z^2 PQ)
n= (〖1.96〗^2×248×0.95×0.05)/(248×〖0.05〗^2+〖1.96〗^2×0.95×0.05)
It's here;
n = Sample size,
Z = Confidence coefficient (1.96),
P = Probability of the property being present in the mass (0.95),
Q = 1 - P (0.05),
N = Main mass size (248),
D = The margin of error is taken as (0.05).
In order to apply the equation correctly, the algorithm was written in C programming language and tested with different values and its accuracy was checked. The formula used in the C programme is as follows:
n = ((pow(Z,2) * N * P * Q) / ((N * pow(D,2)) + (pow(Z,2) * P * Q)))
As a result of the calculations made, the sample size was determined as 151, and the number of subjects was increased to 192 in order to increase the reliability of the study. The questionnaires were administered between 17-21 May 2025.
The questionnaire consists of 5 sections and 15 questions in total. While the first part includes questions to determine the participant information, the second part includes questions to determine the participants' discomfort from noise. In the third and fourth sections, there are questions to determine the noise in the building and its surroundings and in the studio. In the last section, there are questions about the disturbing effects of noise. In order to conduct the survey, approval was obtained from Afyon Kocatepe University Social and Human Sciences Scientific Research and Publication Ethics Committee with decision number 2024/316. The data obtained from the survey results and the results obtained from the measurements of noise levels were compared and analyzed. Figure 5 shows the relationships established between the survey questions and the measurements of the noise level in the design studio in the model that constitutes the methodology of the study.
In this study, various statistical analyses were used to compare and interpret survey data and noise measurements. An independent samples T-Test was used to compare noise levels based on the presence or absence of students, a one-way ANOVA was used to examine the average differences between different locations and noise types, and a Post-Hoc Tukey test was used to determine which groups had significant differences. The Chi-Square Test (χ²) was applied to evaluate the relationship between categorical data (noise types, location types, and complaint rates). The Paired T-Test was used to compare measurements taken at the same location but under different conditions. Pearson Correlation Analysis was performed to determine the linear relationship between measured noise levels and the percentage of discomfort indicated in the survey results, and simple linear regression analysis was applied to evaluate the predictive power of noise level on the percentage of discomfort. Since there was no direct measurement data for noise levels according to work types, the relevant locations were logically matched, and a representative matching and descriptive comparison method was used.
3. Results
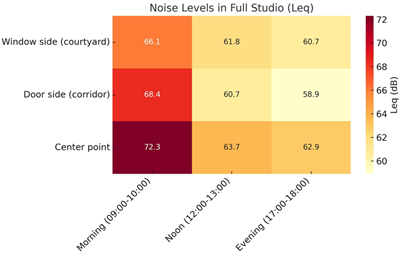
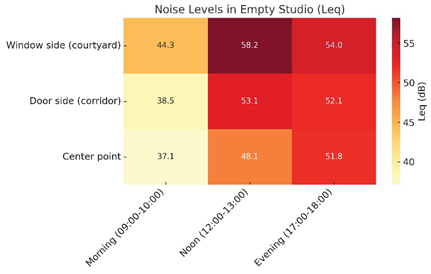
The data obtained as a result of the measurements of the noise level are given in Table 4 in dB(A) as Leq, Lmax and Lmin.
The data obtained as a result of the questionnaires and the analyses of the data obtained from the noise measurements made in the studios are presented in Table 5 in order to measure the effect of noise levels on the students in the study area, studio 130.
In the literature, in studies conducted by [44] ; [45] and [46] it was stated that when the alpha confidence coefficients are above 0.60, it can be accepted as “reliable”. “Cronbach alpha” is 0.87 so scale reliability is provided for each dependent variable (Table 6).
According to the data obtained; Relationship between questions 3 and 4; Chi-square test: χ²(1, N=192) = 48.09, p < 0.001
Since the p-value is much smaller than 0.05, there is a statistically significant relationship between being bothered by noise and having difficulty concentrating in non-classroom settings. This indicates that the vast majority of participants exposed to noise also experience concentration problems (Table 7).
- The value r=0.528 indicates a moderate positive relationship.
- Since p<0.001, this relationship is statistically highly significant.
- In other words, as annoyance from noise increases, the likelihood of experiencing concentration problems in non-classroom settings also increases.
In the survey results, 92% of participants stated that the environmental factor that bothers them the most in their daily lives is “noise.” To confirm this finding, Leq values were compared according to student presence in measurements taken at all locations and times. The independent sample t-test showed that noise levels were significantly higher when students were present (t = 4.98, p = 0.00056). The average Leq value was measured as 65.50 dB(A) when students were present and 46.55 dB(A) when they were absent (Table 8).
When comparing the presence/absence of students in the morning, noon, and evening measurements, it is observed that the presence of students increases noise levels in all time periods. The highest difference was observed in the morning hours (68.93 dB(A) – students present, 39.97 dB(A) – students absent; difference ≈ 29 dB(A). This situation can be explained by the fact that in the morning hours, students enter and exit the premises intensively, engage in preparatory activities, and generally have a high level of activity.
In the afternoon hours, the difference is approximately 9 dB(A), indicating that the noise level remains high even when students are absent, likely due to meal and rest periods. In the evening, the difference is approximately 8 dB(A); this indicates that, despite the decrease in student activity as the day progresses, there are still some sources of noise (e.g., technical equipment, outdoor sounds) in the environment.
These findings clearly demonstrate the effect of student presence on noise levels and support the survey data indicating that “noise” is the most disturbing environmental factor.
According to the survey results, the most disturbing types of noise for participants were, in order: construction noise (70%), human voices (65%), vehicle traffic (55%), and technical equipment/echo (45%) (Figure 6).
According to the survey results, participants reported being most bothered by construction noise (70%) and human voices (65%). Vehicle traffic was found to be disturbing at a rate of 55%, while technical equipment/echo was found to be disturbing at a rate of 45%. When the measurements were examined, the average Leq values corresponding to these noise types ranged between 62.67 and 66.30 dB(A).
Chi-square test: χ² = 6.28, p = 0.099 → Not significant Correlation: r = -0.831 → Strong negative correlation (high dB(A) does not always cause high discomfort). The results of the chi-square test indicate that the differences in complaint rates between noise types are not statistically significant (χ² = 6.28, p = 0.099). This suggests that the perceived annoyance levels between noise types are largely similar.
Correlation analysis revealed a strong negative relationship between the measured Leq values and complaint rates (r = -0.831). This result suggests that the level of discomfort depends not only on the intensity of the sound but also on the type of noise, its continuity, and individuals' sensitivity to this sound.
In surveys, courtyards are one of the areas where noise is most intensely felt outdoors. Measurements (with/without students) were compared in the morning, afternoon, and evening. Paired t-test: t = 1.90, p = 0.197 → No statistically significant difference was found (p>0.05).
The difference between student presence and noise level in the morning 21.8 dB (A) is quite high and can be explained by entry-exit traffic and outdoor interaction. The difference is lower in the afternoon and evening, and it is observed that outdoor noise is relatively high even when students are not present during these hours (Table 9).
Studio (midpoint) and corridor measurements were compared. One-way ANOVA: F = 0.357, p = 0.611 → No statistically significant difference between the two locations. Post-hoc Tukey test: No significant difference was found in the midpoint–corridor comparison; confidence intervals indicate that the difference may be zero.
Although studio (70%) and corridor (65%) emerged as spaces causing high levels of discomfort in the survey data, no significant difference was detected in terms of the measured average Leq values (Figure 7). This suggests that the perception of discomfort is related not only to sound intensity but also to factors such as the type of sound, its continuity, and the acoustic properties of the space.
R² = 0.706 → The model explains 70% of the variation in the discomfort percentage.
Coefficient (Leq): -4.12 → When the measured sound level increases by 1 dB (A), the discomfort percentage decreases by approximately 4.1% (this finding is unexpected).
p-value = 0.365 → Not statistically significant
According to the survey results, the most disturbing noise source in classrooms and studios is outdoor noise (60%), followed by other students' conversations (50%) and echo/plumbing noises (40%). When these perceptions are compared with measurement data, it is observed that the average Leq values measured for the external environment (courtyard) and other students (corridor) are quite close to each other (62.87 dB and 62.67 dB(A). The studio midpoint measurements associated with echo/plumbing, on the other hand, have a relatively higher average noise level 66.30 dB(A) (Figure 8).
Multiple regression analysis shows that the measured noise levels explain 70% of the variation in the discomfort percentage (R² = 0.706). However, the fact that the obtained coefficient is negative (a decrease in the percentage of discomfort as Leq increases) and the p-value is not statistically significant (p = 0.365) indicates that noise perception cannot be explained solely by sound intensity. This situation indicates that participants have different sensitivities to certain types of noise and that noise perception may be influenced by acoustic parameters such as frequency content, continuity, and predictability, as well as the reverberation characteristics of the space.
For example, despite having high dB(A) values, echo/plumbing noise has a lower discomfort rate, suggesting that steady, continuous, and low-frequency sounds may be perceived as less annoying than fluctuating and sudden noise sources. Similarly, even if dB(A) levels are similar for outdoor and student-generated noise, speech sounds involving social interaction may have a more detrimental effect on psychological and cognitive attention.
Therefore, these findings suggest that, from both architectural acoustic design and noise management perspectives, strategies should be developed not only to reduce noise levels but also to improve noise types and acoustic comfort conditions.
While 70% of the students stated that the most disturbing way of working in the studios in terms of noise was group work, 65% of them stated that the in-class humming disturbed them during group critiques and 60% of them stated that the in-class noise did not disturb them during table critiques (Figure 9).
Individual work has a medium noise level of 66.3 dB(A) on average.
Group work (corridor + midpoint average) shows the lowest value at 64.48 dB(A).
The jury presentation (midpoint – morning hours, high density) shows the highest value at 72.3 dB(A).
These values suggest that noise levels increase significantly in events requiring high participation and high speech density, such as juries, while remaining more balanced in group work.
When noise effects were analyzed, concentration loss (88%), inability to understand conversations (60%), and fatigue (52%) were observed (Figure 10).
Pearson Correlation: r = 0.966 → There is a very strong positive correlation between noise intensity dB(A) and survey percentages.
In other words, as the measured noise level increases, the percentage of negative effects caused by this noise also tends to increase.
R² = 0.933 → Noise level explains 93% of the variation in the effect percentage.
Slope = 8.94 → When the noise level increases by 1 dB(A), the rate at which the related effect is observed increases by approximately 8.94%.
p-value = 0.167
These results indicate a strong connection between noise level and perceived negative effects. In particular, loss of concentration was reported at the highest rate (88%) in the space where the highest dB(A) value was measured (studio – midpoint, 66.3 dB(A)). This finding highlights that noise types that negatively impact work efficiency are more pronounced in tasks requiring particular attention.
The high correlation coefficient obtained indicates that both noise level reduction and noise source control are critical in noise management strategies. As noise levels increase, concentration loss, headaches/stress, and difficulty understanding speech increase in parallel. These findings indicate that maintaining the Leq value below 60 dB(A) for noise control in design studios is critical for students' cognitive performance and comfort.
4. Discussion and Conclusions
In this study, in line with the data obtained from the questionnaires applied to 192 interior architecture students; it was determined that the noise level increased as the number of students in the studios increased. Students stated that they were negatively affected by these increased noise levels. Noise causes cognitive and psychological problems such as distraction, loss of concentration, stress, fatigue and decreased creativity, reducing overall satisfaction. Although some students reported that they were not bothered by higher noise levels, this did not appear to have a positive impact on overall satisfaction. These findings are in parallel with the results of the studies conducted by [47-48]. As stated in the research of [49], high noise levels in interior design studios can cause health problems such as restlessness, headaches, high blood pressure and stress. Auditory communication is a critical element for academic success and has direct effects on learning engagement and cognitive performance.
The results of the noise measurements made in the courtyard, corridor and studio centre in the morning, noon and evening hours, both when the studio is full and when it is empty, and the results of the questionnaires applied to the students in the studio number 130 of Afyon Kocatepe University Department of Interior Architecture and Environmental Design were evaluated together. In the measurements made when the studio was empty; the intensity of the sounds coming from the courtyard, especially at noon, is due to the increase in student traffic during these hours. In the morning hours, the location where noise is measured at the lowest level is in the center of the studio, which is due to the low level of circulation inside the building during this time period and the relatively isolated location of the studio. In this context, the fact that the lowest noise level is measured in the studio during the morning hours and when students are not present indicates that the main cause of the increase in noise inside the building is the activities that occur during classes.
The measurements made during the hours when the students are in the studio show that the noise level is the highest in the morning and in the studio centre. The main reason for this is that design courses are mostly held in the morning and different interactive learning methods such as group work, table and general critique are preferred in these courses.
According to [29], it was observed that the limits of 35 dB(A) recommended by the World Health Organisation for classrooms and 55 dB(A) for outdoor spaces were exceeded. Prolonged exposure of students to loud noise negatively affects their auditory health, cognitive capacity and psychological well-being. Unfortunately, many interior architecture studios lack adequate acoustic solutions and this situation prevents students from adapting to the studio culture and actively participating in the design processes. Noise was found to reduce the quality of the activities carried out in the studio environment and to cause serious problems, especially in terms of speech intelligibility. For example, the inability to hear the information given by the trainers clearly reduces the efficiency of the training. The drawing sounds and conversations that occur during individual work cause buzzing in the environment, which makes it difficult to understand the conversations and creates effects such as fatigue, headache and distraction on users. The lack of auditory comfort is exacerbated by the fact that users have to raise their voices because they cannot hear each other.
This study clearly demonstrates that interior design studios have different auditory comfort needs than traditional classrooms. In line with the recommendations of [50] ; studio layouts should be reorganised, sound insulation should be strengthened and noise barrier solutions should be implemented. In order to reduce the noise level in studios; material selection should be made carefully, special space solutions should be developed by using items such as wooden coverings, windows with retractable casement windows and acoustic ceiling panels. Such acoustic interventions are known to contribute positively to students' academic achievement.
In this framework, some suggestions are presented to improve the auditory comfort of design studio 130. An organization that allows for collaborative work and at the same time ensures voice privacy can increase efficiency and user satisfaction. Revisions to construction materials can help to reduce noise levels while maintaining the visual and collaborative advantages of the open plan. An acoustically effective arrangement requires the covering of floor, ceiling and wall surfaces with suitable materials and the use of panels that prevent sound transmission between work groups. These boards facilitate noise control by providing acoustic shade and function as surfaces where students can exhibit their work. In this context, the design studio 130 has been redesigned with a new interior layout suitable for different working styles and supporting auditory comfort, and the proposed plan scheme is presented below (Figure 10).
Considering the effects of environmental psychology on increasing auditory comfort, the design criteria to be applied in design studios are important. In this context, layout and material changes that will reduce the noise level of the space have been proposed for design studio 130. Spatial boundaries have been created in the concern of performing different functions together in the layout.The surfaces of the existing storage areas on the wall surface were covered with acoustic fabric that provides sound absorption. In this way, acoustic improvements were targeted in the working area of the space. Vertical acoustic partition panels were used in the area where the noise potential of the space is thought to be the most intense, since the group working areas are critical at the desk. The NRC acoustic value (sound absorption absorption value) of the panels is in the range of 0.95-1.00 [51]. These panels were designed as a result of both functional and aesthetic concerns, and were placed functionally in order to provide noise control as well as surfaces on which projects can be hung. In the same section, it was planned to improve the acoustics of the area by applying baffles covered with acoustic fabric on the ceiling surface. The NRC acoustic value (sound absorption absorption value) of the material used in the baffle ceiling applied to the ceiling with hanging apparatus is in the range of 0.80-0.85 [52]. It was aimed to replace the mosaic floor covering throughout the studio with acoustic vinyl material and thus improve the acoustics in the space. The impact sound absorption value of the vinyl material is Lw 20 dB(A) [53]. the use of the studio in practical lessons, it is aimed to control the sound in the space with these interventions .
As a result, this research is expected to contribute to further studies on the creation of healthy acoustic conditions in interior architecture studio. The findings obtained include guiding suggestions for design education institutions, space planners, interior architects, architects, landscape designers and decision makers who determine educational policies.
Author Contributions
“Conceptualization, B.O. and Ş.E.O.; methodology, B.O., Ş.E.O., S.M., F.M, M.Ç; validation, B.O., Ş.E.O., S.M., F.M. M.Ç; formal analysis, S.M. and F.M.; investigation, B.O. and M.Ç.; resources, B.O. and M.Ç.; data curation, Ş.E.O., B.O., S.M.; writing—original draft preparation, Ş.E.O., B.O., S.M., F.M, M.Ç; writing—review and editing, Ş.E.O., B.O., S.M.; visualization, F.M.; supervision, Ş.E.O. All authors have read and agreed to the published version of the manuscript.”
Funding
This research received no external funding.
Data Availability Statement
Data is contained within the article or supplementary material
Conflicts of Interest
“The authors declare no conflicts of interest.” “The funders had no role in the design of the study; in the collection, analyses, or interpretation of data; in the writing of the manuscript; or in the decision to publish the results”.
References
- Şimşek, O. Noise Control in Classrooms: An Examination through a Case Study. Eksen Dokuz Eylül University Faculty of Architecture Journal 2021, 2(1), 34–51. [in Turkish].
- Ministry of Environment and Urbanization. Regulation on the Protection of Buildings against Noise. Official Gazette, 31 May 2017. Available online: https://www.lexpera.com.tr/mevzuat/yonetmelikler/binalarin-gurultuye-karsi-korunmasi-hakkinda-yonetmelik-1 (accessed on 13 August 2025).
- Wen, S., Gan, W. S., & Wang, M. (2023). Investigation on the performance of an active noise control window system mounted on the top-hung window of a residential room. Applied Acoustics, 206, 109323. [CrossRef]
- Kurra, S. Environmental Noise and Its Management I, II, III. Bahçeşehir University Publications: Istanbul, Türkiye, 2009. [in Turkish].
- Murphy, E., & King, E. A. (2014). Environmental noise pollution: Noise mapping, public health, and policy (p. 283). Elsevier.
- Firdaus, S., Anwar, A. I., Khan, A. A., Ahmed, Z., & Anjum, R. (2020). A comprehensive review of adverse effect of noise pollution on human health and its prevention. European Journal of Biomedical, 7(12), 129–133.
- Silva, L. T., Oliveira, I. S., & Silva, J. F. (2016). The impact of urban noise on primary schools: Perceptive evaluation and objective assessment. Applied Acoustics, 106, 2–9. [CrossRef]
- Stansfeld, S. A., & Matheson, M. P. (2003). Noise pollution: Non-auditory effects on health. British Medical Bulletin, 68(1), 243–257. [CrossRef]
- Mostafavi, A., & Cha, Y. J. (2023). Deep learning-based active noise control on construction sites. Automation in Construction, 151, 104885. [CrossRef]
- Basner, M., Baisch, W., Davis, A., Brink, M., Clark, C., Janssen, S., & Stansfeld, S. (2014). Auditory and non-auditory effects of noise on health. The Lancet, 383(9925), 1325–1332. [CrossRef]
- Chen, L., Tang, B., Liu, T., Xiang, H., Sheng, O., & Gong, H. (2020). Modeling traffic noise in a mountainous city using artificial neural networks and gradient correction. Transportation Research Part D: Transport and Environment, 78, 102136. [CrossRef]
- Ding, T., Yan, A., & Liu, K. (2019). What is noise-induced hearing loss? British Journal of Hospital Medicine, 80(9), 525–529. [CrossRef]
- Evans, G. W., & Hygge, S. (2007). Noise and performance in children and adults. In D. Prasher (Ed.), HandB(A)ook of Noise and Health (pp. 97–106). CRC Press. [CrossRef]
- Halonen, J. I., Dehbi, H. M., Hansell, A. L., Gulliver, J., Fecht, D., Blangiardo, M., ... & Tonne, C. (2017). Associations of night-time road traffic noise with carotid intima-media thickness and blood pressure: The Whitehall II and SABRE study cohorts. Environment International, 98, 54–61. [CrossRef]
- López, E. F., & Morales, F. C. (2014). Construction and validation of questionnaire to assess recreational noise exposure in university students. Noise & Health, 16(72), 292–298. [CrossRef]
- Vlachokostas, C., Achillas, C., Michailidou, A. V., & Moussiopoulos, N. (2012). Measuring combined exposure to environmental pressures in urban areas: An air quality and noise pollution assessment approach. Environment International, 39(1), 8–18. [CrossRef]
- Onay, B.; Bayazıt Solak, E.; Sava, B.; Şahin, C. A Study on the Evaluation of Noise in the Central Campus of Afyon Kocatepe University. TUBİD 2024, 5(1), 1–11. [in Turkish].
- Polat, S.; Buluş Kırıkkaya, E. Effects of Noise on the Educational Environment. In Proceedings of the 13th National Educational Sciences Congress, Malatya, Türkiye, 6–9 July 2004. [in Turkish].
- Ministry of Environment and Forestry. Regulation on the Assessment and Management of Environmental Noise (2002/49/EC). Official Gazette, 4 June 2010. Available online: https://www.tumer.org.tr/turcevCMS_V2/files/%C3%87EVRESEL%20G%C3%9CRLT%C3%9CN%C3%9CN%20DE%C4%9EERLEND%C4%B0R%C4%B0LMES%C4%B0%20VE%20Y%C3%96NET%C4%B0M%C4%B0%20Y%C3%96NEMEL%C4%B0Ğ%C4%B0.pdf (accessed on 12 August 2025). [in Turkish].
- Erol, H.B. Acoustic Performance Criteria in the Use of Materials in Interior Spaces. Master’s Thesis, Mimar Sinan Fine Arts University, Institute of Science, Istanbul, Türkiye, 2006. [in Turkish].
- Demirarslan, D.; Demirarslan, K.O. An Interdisciplinary Approach in the Design of Interior Spaces in the Context of Environmental Awareness: The Relationship between Interior Architecture and Environmental Engineering. Journal of Natural Disasters and Environment 2017, 3(2), 112–128. [in Turkish]. [CrossRef]
- Bulunuz, M.; Orbak, A.Y.; Bulunuz, N. Noise Pollution in Schools: Causes, Effects and Control. Bursa Uludağ University Publications: Bursa, Türkiye, 2021. [in Turkish].
- Avşar, Y.; Gönüllü, M.T. Evaluation of Indoor and Outdoor Noise in Some Schools in Terms of Educational Quality: The Case of Istanbul. In Proceedings of the GAP 2000 Symposium, Şanlıurfa, Türkiye, 16–18 November 2000; pp. 16–18. [in Turkish].
- Bulunuz, N., Bulunuz, M., Orbak, A. Y., Mutlu, N., & Tavşanlı, Ö. F. (2017). An evaluation of primary school students’ views about noise levels in school. International Electronic Journal of Elementary Education, 9(4), 725–740.
- Long, M. (2006). Architectural acoustics. California: Elsevier Academic Press.
- Onay, B.; Şahin, C. A Study on the Analysis of Noise in Educational Institutions and Their Surroundings in the City Center of Isparta. Turkish Journal of Forest Science 2022, 6(2), 457–479. [in Turkish]. [CrossRef]
- Güremen, L. A Study on the Evaluation of the Effects of Indoor and Outdoor Auditory Comfort Conditions in Primary Schools on Users: The Case of Amasya. E-Journal of New World Sciences Academy 2012, 7(3), 580–604. [in Turkish].
- Cavanaugh, W. J., & Wilkes, J. A. (Eds.). (1999). Architectural acoustics: Principles and practice. John Wiley & Sons.
- Özçevik, A. Auditory Comfort Requirements in Architectural Design Studios and a Case Study. Ph.D. Thesis, Anadolu University, Eskişehir, Türkiye, 2015. [in Turkish].
- Egan, M. D. (2007). Architectural acoustics (2nd ed.). New York: McGraw-Hill.
- Demirbaş, O. Ö. (1997). Design studio as a life space in architectural education: Privacy requirements (Yüksek lisans tezi). Bilkent Üniversitesi, Fen Bilimleri Enstitüsü, Ankara.
- Bilmez, D.H.; Çelik, K.; Diri, C.; Arpacıoğlu, Ü. Evaluation of Architectural Studios in Terms of Acoustic Comfort Conditions: The Case of Çukurova University Architecture Department YADYO Studio. Journal of Architectural Sciences and Applications 2022, 7(2), 852–870. [in Turkish].
- Bar-Eli, S., & Oxman, R. (2000). The architectural design studio: Current trends and future directions. In Design Studio: The Melting Pot of Architectural Education Conference.
- Schön, D. (1985). The design studio: An exploration of its traditions and potential. RIBA Publications.
- Ketizmen, G. Investigation of Methodological and Spatial Effects on the Formation of the Architectural Design Studio. Master’s Thesis, Anadolu University, Institute of Science, Eskişehir, Türkiye, 2002. [in Turkish].
- Al-Jokhadar, A., Alnusairat, S., Abuhashem, Y., & Soudi, Y. (2023). The impact of indoor environmental quality (IEQ) in design studios on the comfort and academic performance of architecture students. Buildings, 13(11), 2883. [CrossRef]
- Hassanain, M. A., Sanni-Anibire, M. O., & Mahmoud, A. S. (2023). Design quality assessment of campus facilities through post-occupancy evaluation. International Journal of Building Pathology and Adaptation, 41(4), 693–712.
- Okoyeh, I. I., Ezezue, A. M., Ezennia, S. I., Irouke, V. M., & Aniegbuna, A. I. (2024). A review of the impact of noise pollution on students in architecture studios in universities. International Journal of Advance Research and Innovative Ideas in Education, 10(2), 2060–2068.
- Çağatay, K.; Sönmez, M.Ç.; Dinçbaş, G.K. The Effects of Design Studios and the Heating System Used on Students’ Perceptual Evaluations. In Proceedings of the International Academic Research Congress, Ankara, Türkiye, 16–18 September 2019. [in Turkish].
- Wålinder, R., Gunnarsson, K., Runeson, R., & Smedje, G. (2007). Physiological and psychological stress reactions in relation to classroom noise. Scandinavian Journal of Work, Environment & Health, 33, 260–266.
- Çalış, M. Highway Noise and Economic Analysis of Noise Barriers. Master’s Thesis, Istanbul Technical University, Institute of Science, İstanbul, Türkiye, 2007. [in Turkish].
- Akten, M. Determination of the Existing Potentials of Some Recreation Areas in Isparta Province. Süleyman Demirel University Journal of Forestry Faculty 2003, 4(2), 115–132. [in Turkish].
- Kalıpsız, A. Statistical Methods. Istanbul University Faculty of Forestry Publications No: 2837, İstanbul, Türkiye, 1981. [in Turkish].
- Panayides, P. Coefficient alpha: interpret with caution, Europe’s Journal of Psychology. 2013; 9 (4), 687- 696.
- Kaplan, R. M., Saccuzzo, D. P. Psychological Testing: Principles, Applications, & Issues. Belmont, CA: Wadsworth, Cengage learning. 2010.
- Cronbach, L.J. Coefficient alpha and the internal structure of tests, Psychometrika, 1951; 16 (3), 297-334.
- Pheng, H. S., Yean, T. S., Lye, K. H., Ismail, A. I. M., & Kassim, S. (2006). Modeling noise levels in USM Penang campus. In Proceedings 2nd IMT-GT Regional Conference on Mathematics, Statistics & Applications. Universiti Sains Malaysia, Penang.
- Thakur, G. S. (2006). A study of noise around an educational institutional area. Journal of Environmental Science & Engineering, 48(1), 35–38.
- Doygun, H., & Kuşat Gurun, D. (2008). Analysing and mapping spatial and temporal dynamics of urban traffic noise pollution: A case study in Kahramanmaraş, Turkey. Environmental Monitoring and Assessment, 142(1), 65–72. [CrossRef]
- Cain, R., Jennings, P., & Poxon, J. (2013). The development and application of the emotional dimensions of a soundscape. Applied Acoustics, 74(2), 232–239. [CrossRef]
- Aksa Akustik. Technical Specification of Acoustic Fabric Covered Panel. Available online: https://www.aksaakustik.com/akustik-kumas-kapli-panel/ (accessed on 1 August 2025).
- Acoustic Baffle Technical Specifications. Available online: https://www.aksaakustik.com/akustik-baffle/ (accessed on 14 August 2025).
- Kalyon Yapı Zemin. Floor Covering Technical Specifications (Tapiflex Essential 50). Available online: https://www.kalyonyapizemin.com/img/urunler/147/TS_TR_Tapiflex_Essential_50.pdf (accessed on 14 August 2025).
Figure 1.
Visual of the Department of Interior Architecture.
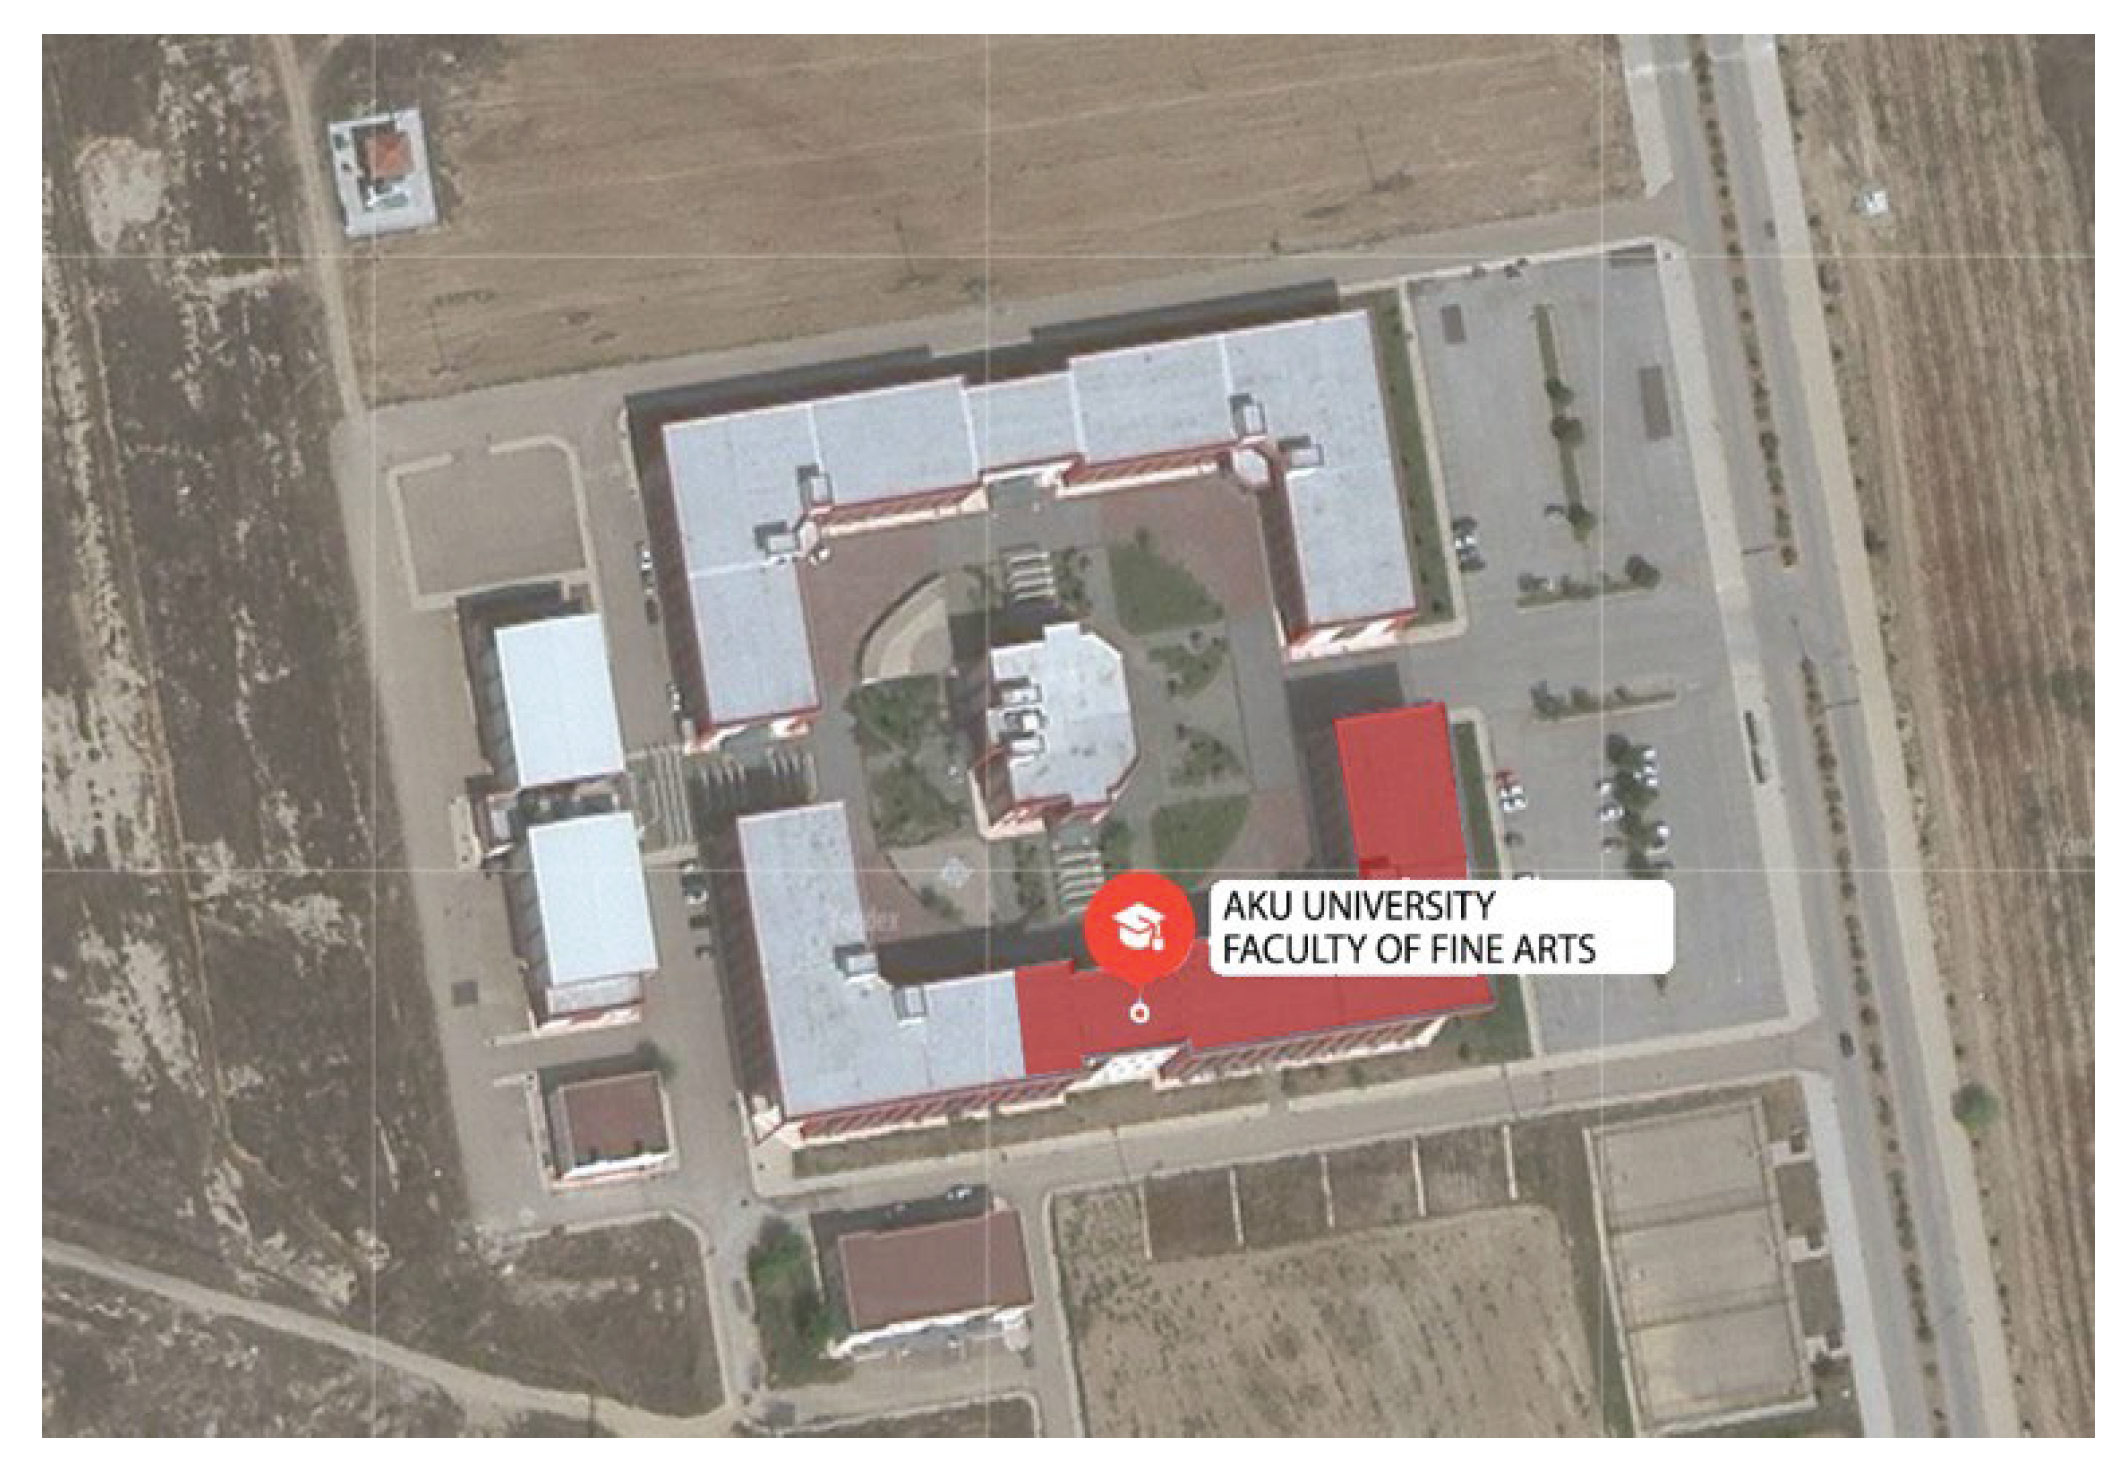
Figure 2.
Schematic plan of studio 130 of the Department of Interior Architecture and Environmental Design.
Figure 2.
Schematic plan of studio 130 of the Department of Interior Architecture and Environmental Design.
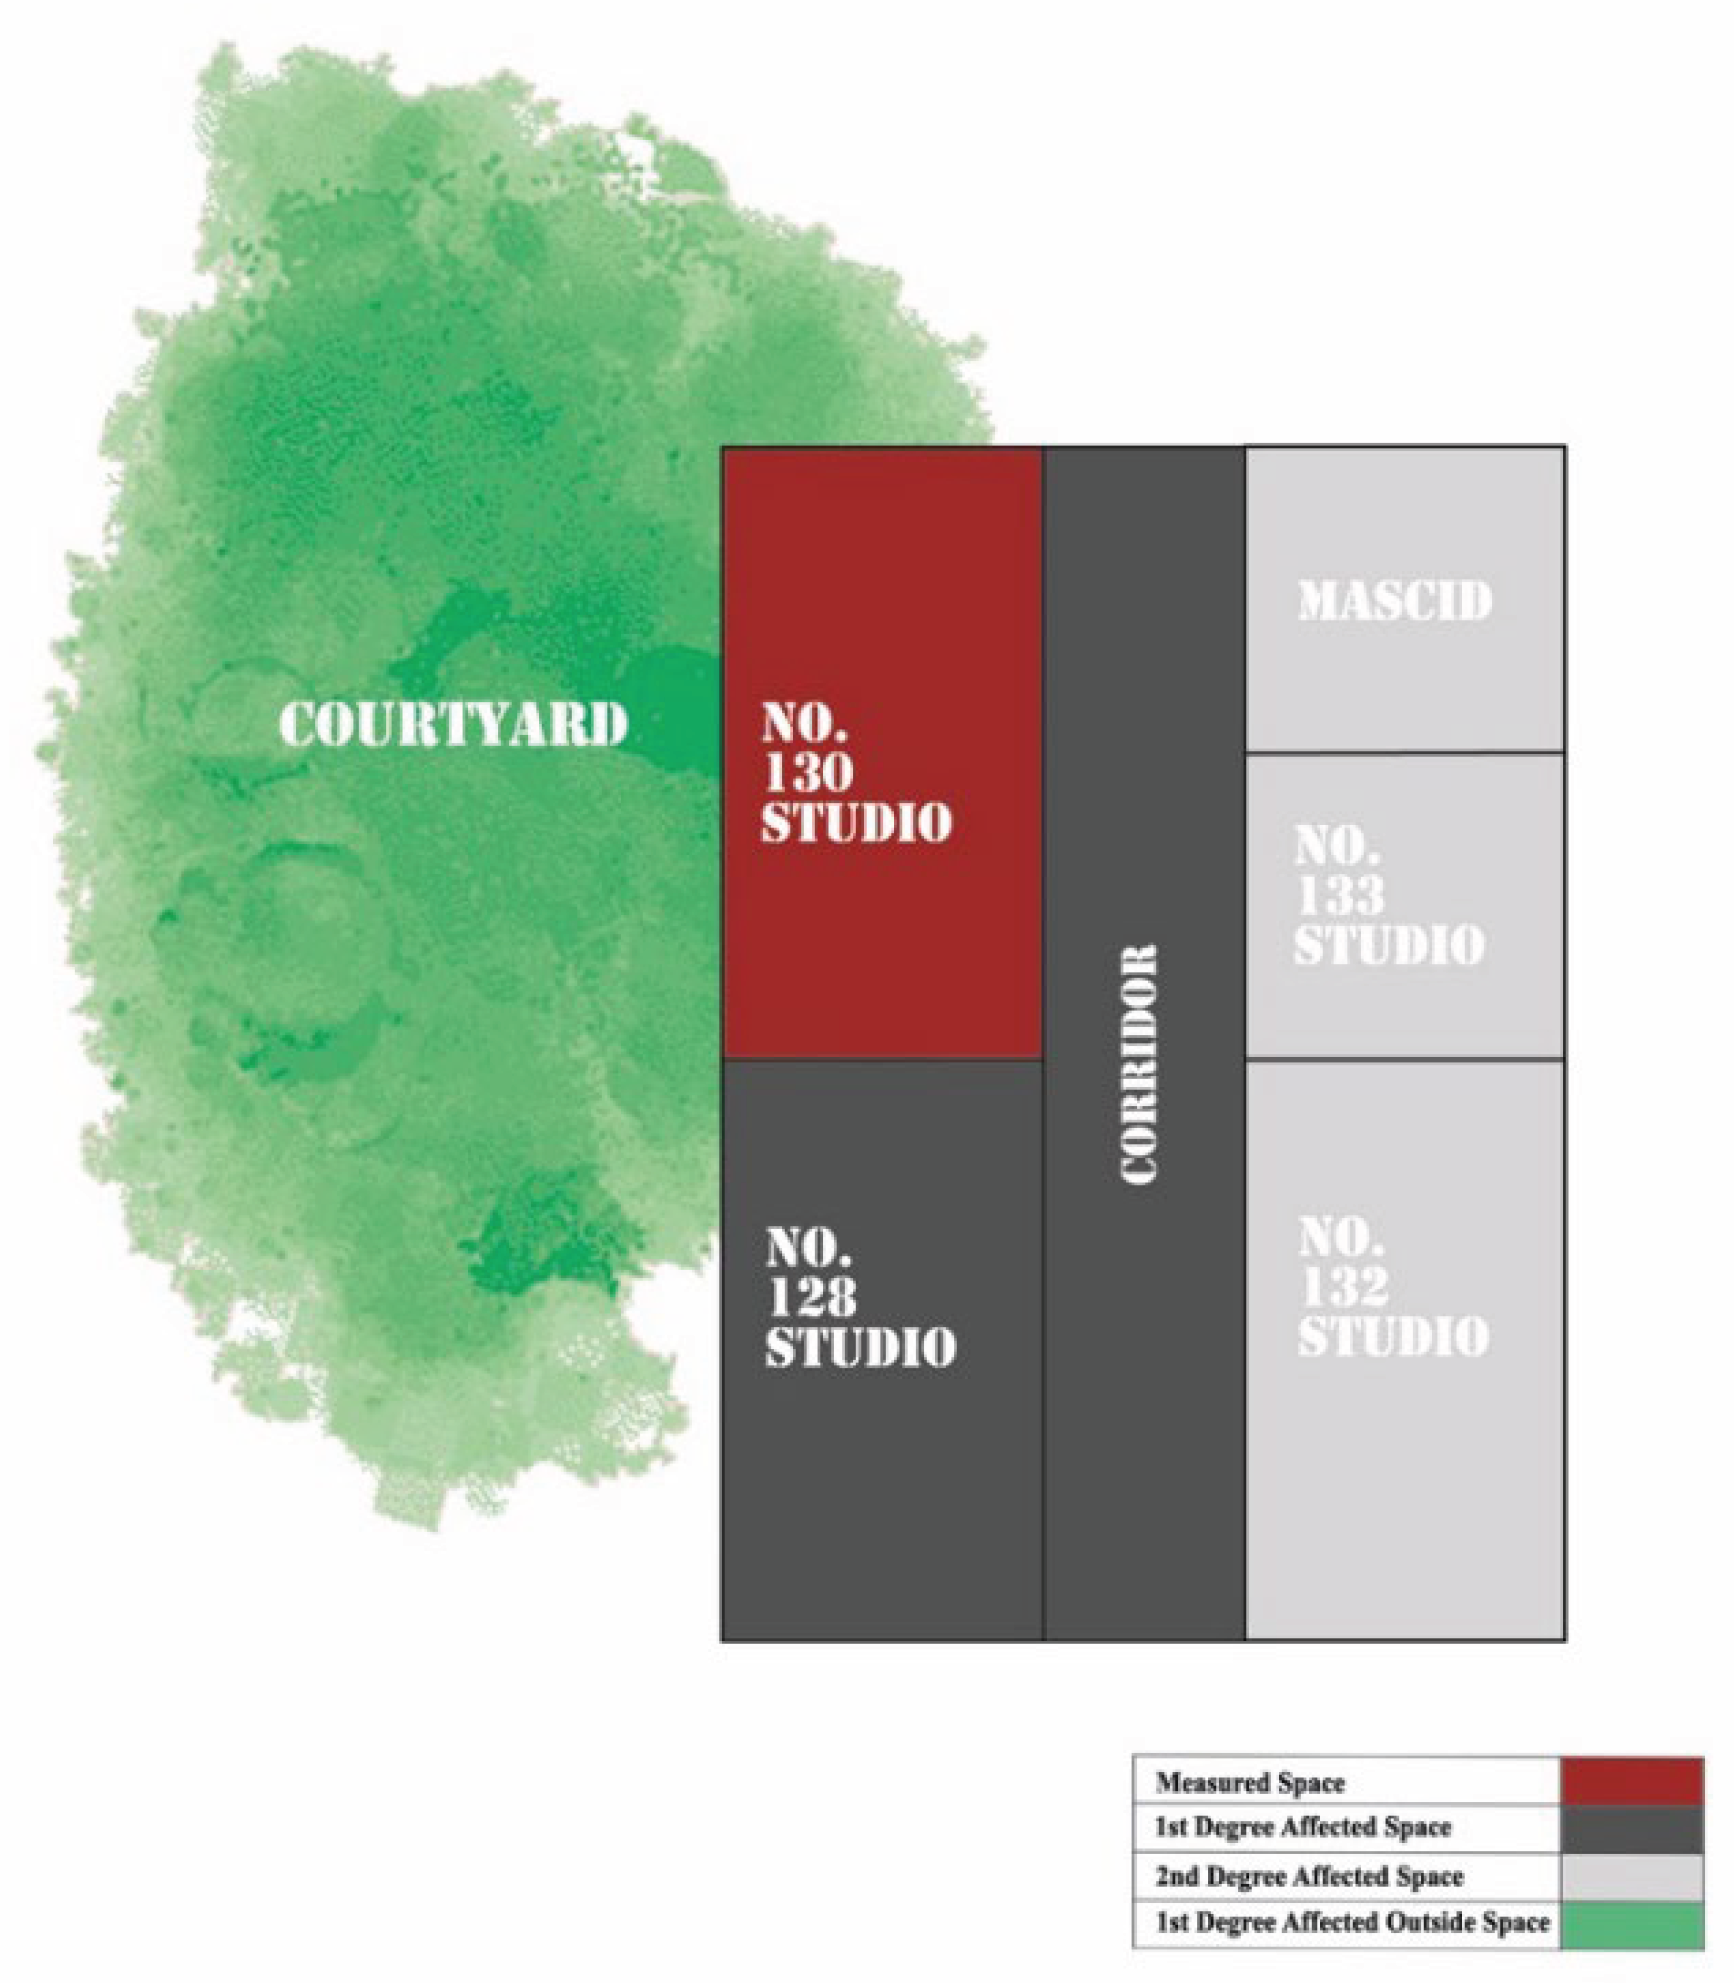
Figure 3.
Sound measuring tool with which the measurements were made.
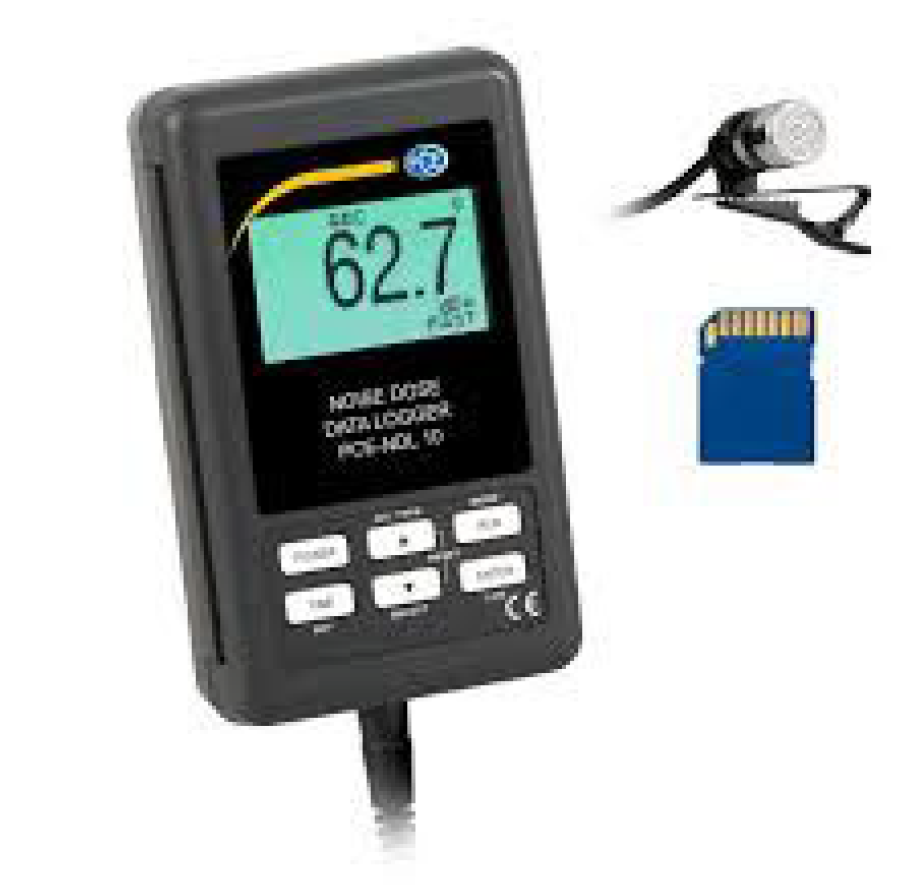
Figure 4.
Measurement points and studio plan.
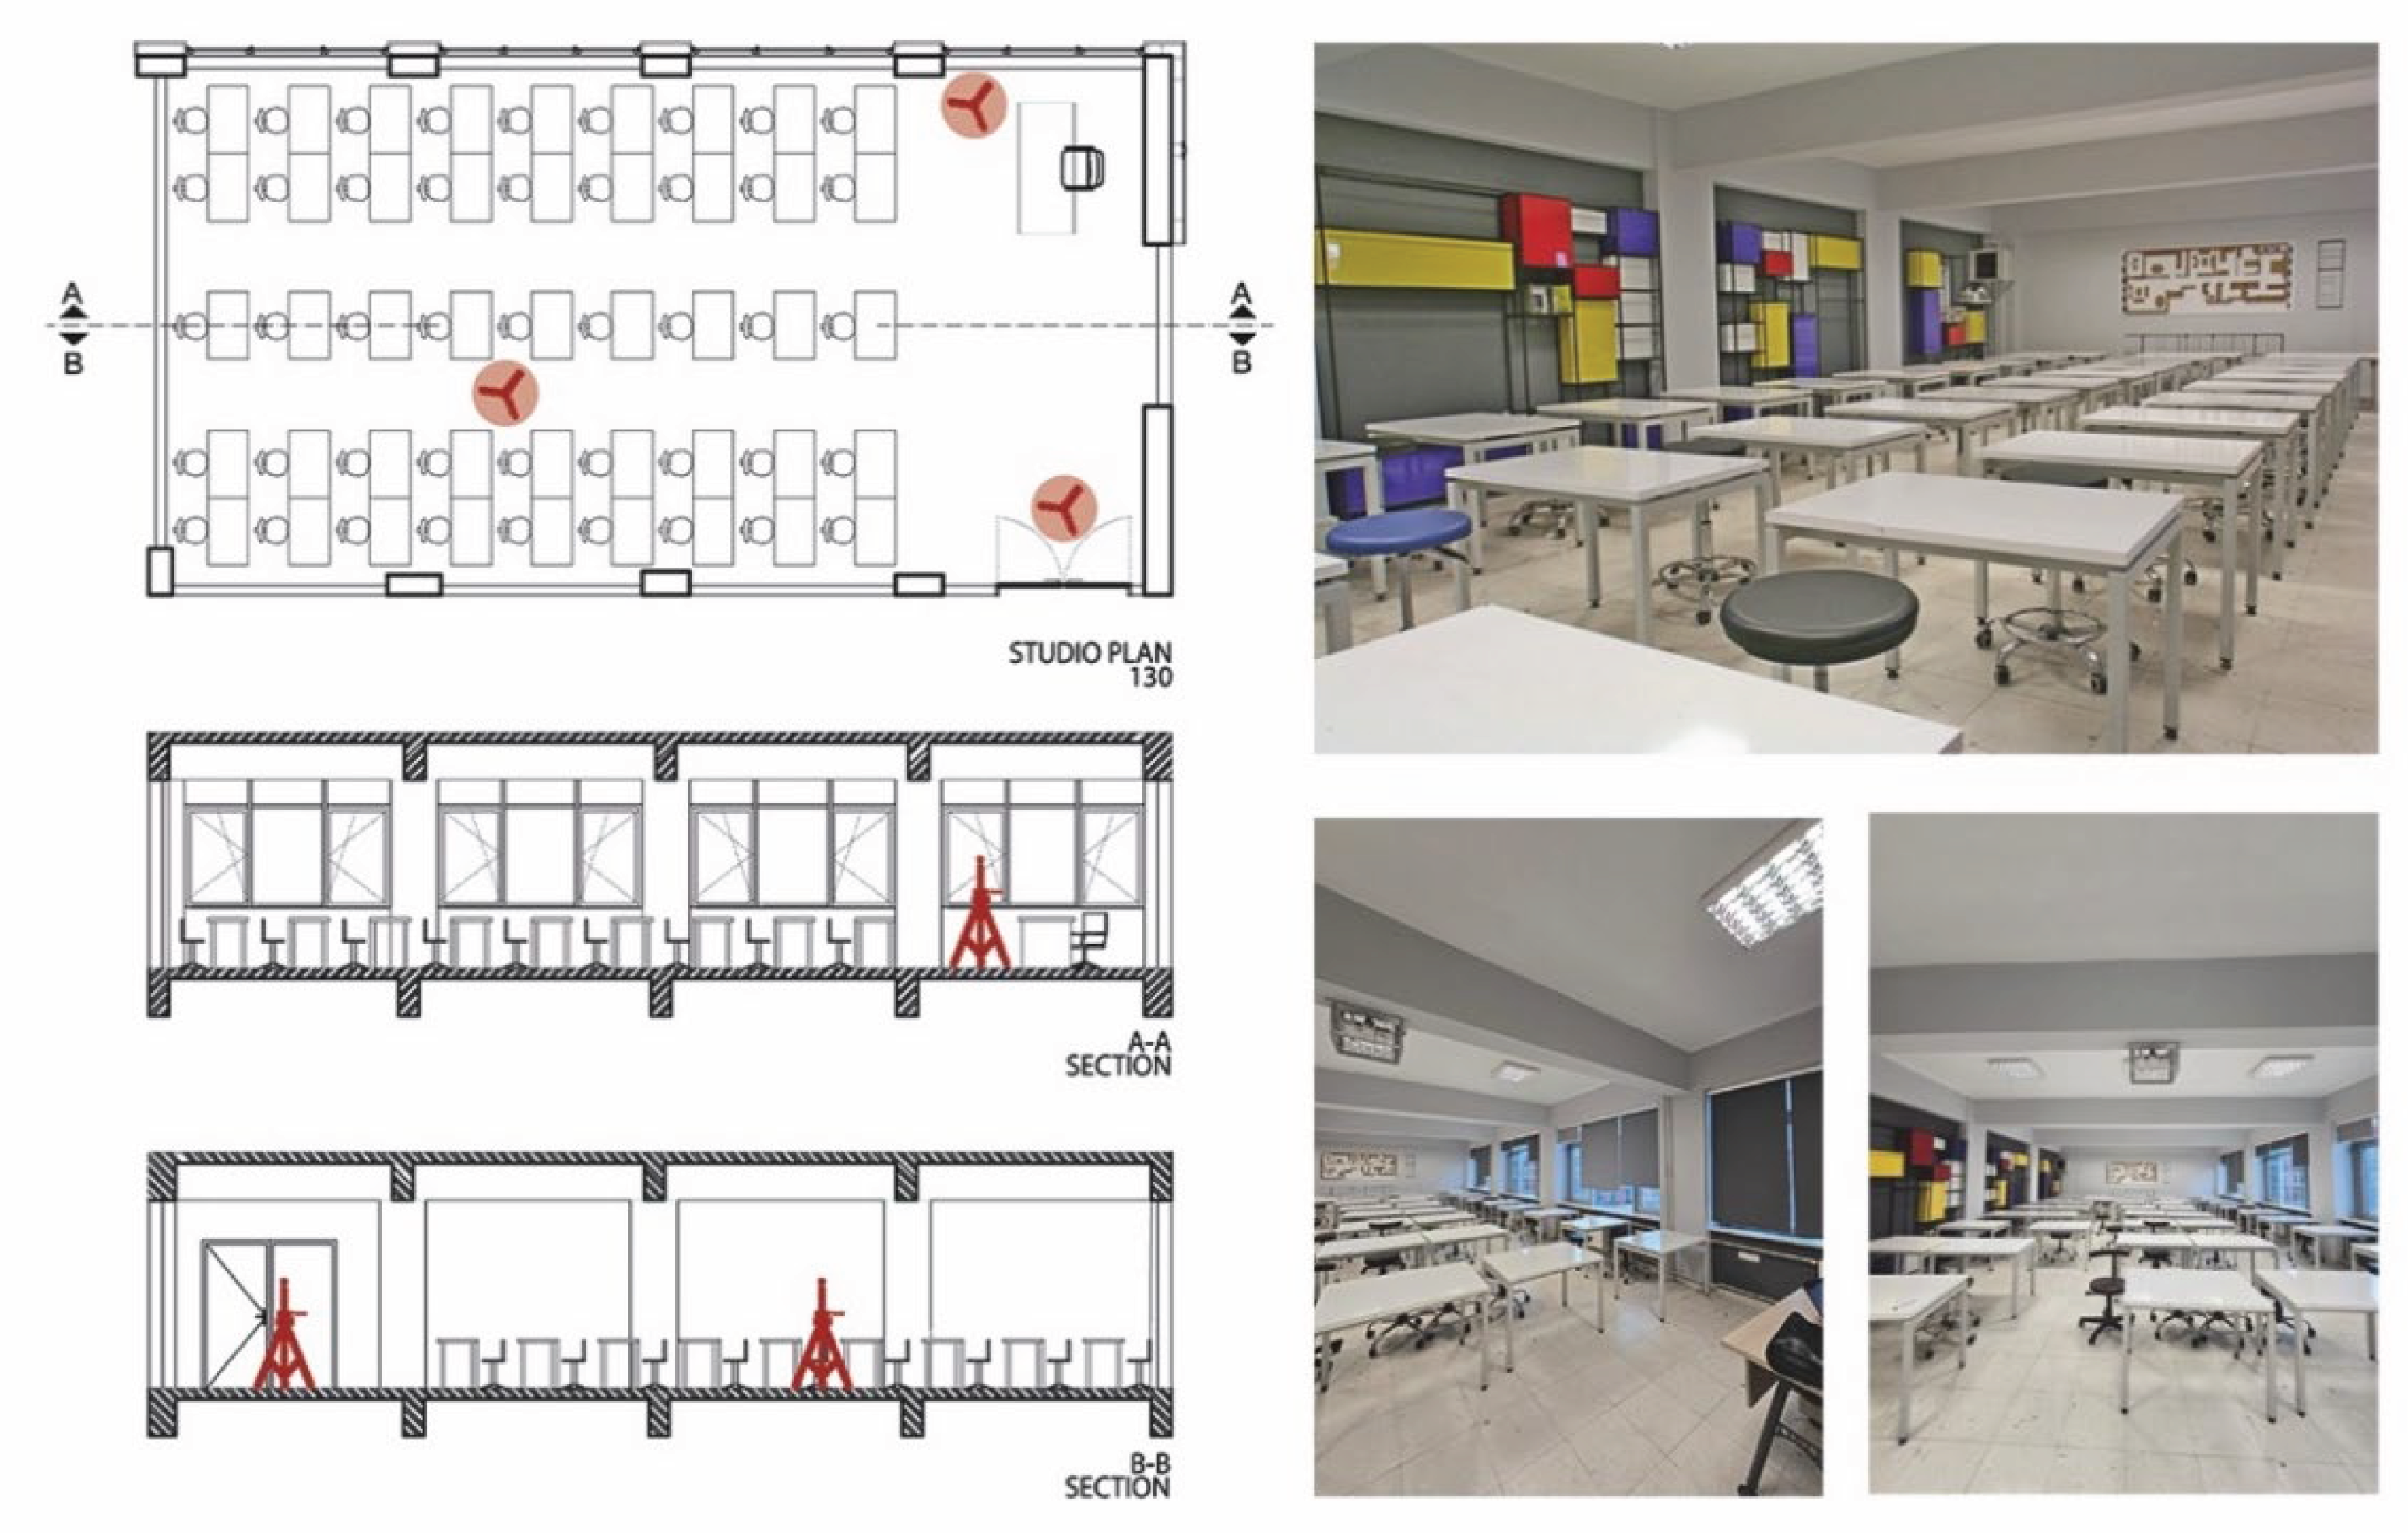
Figure 5.
Methodology of the study.
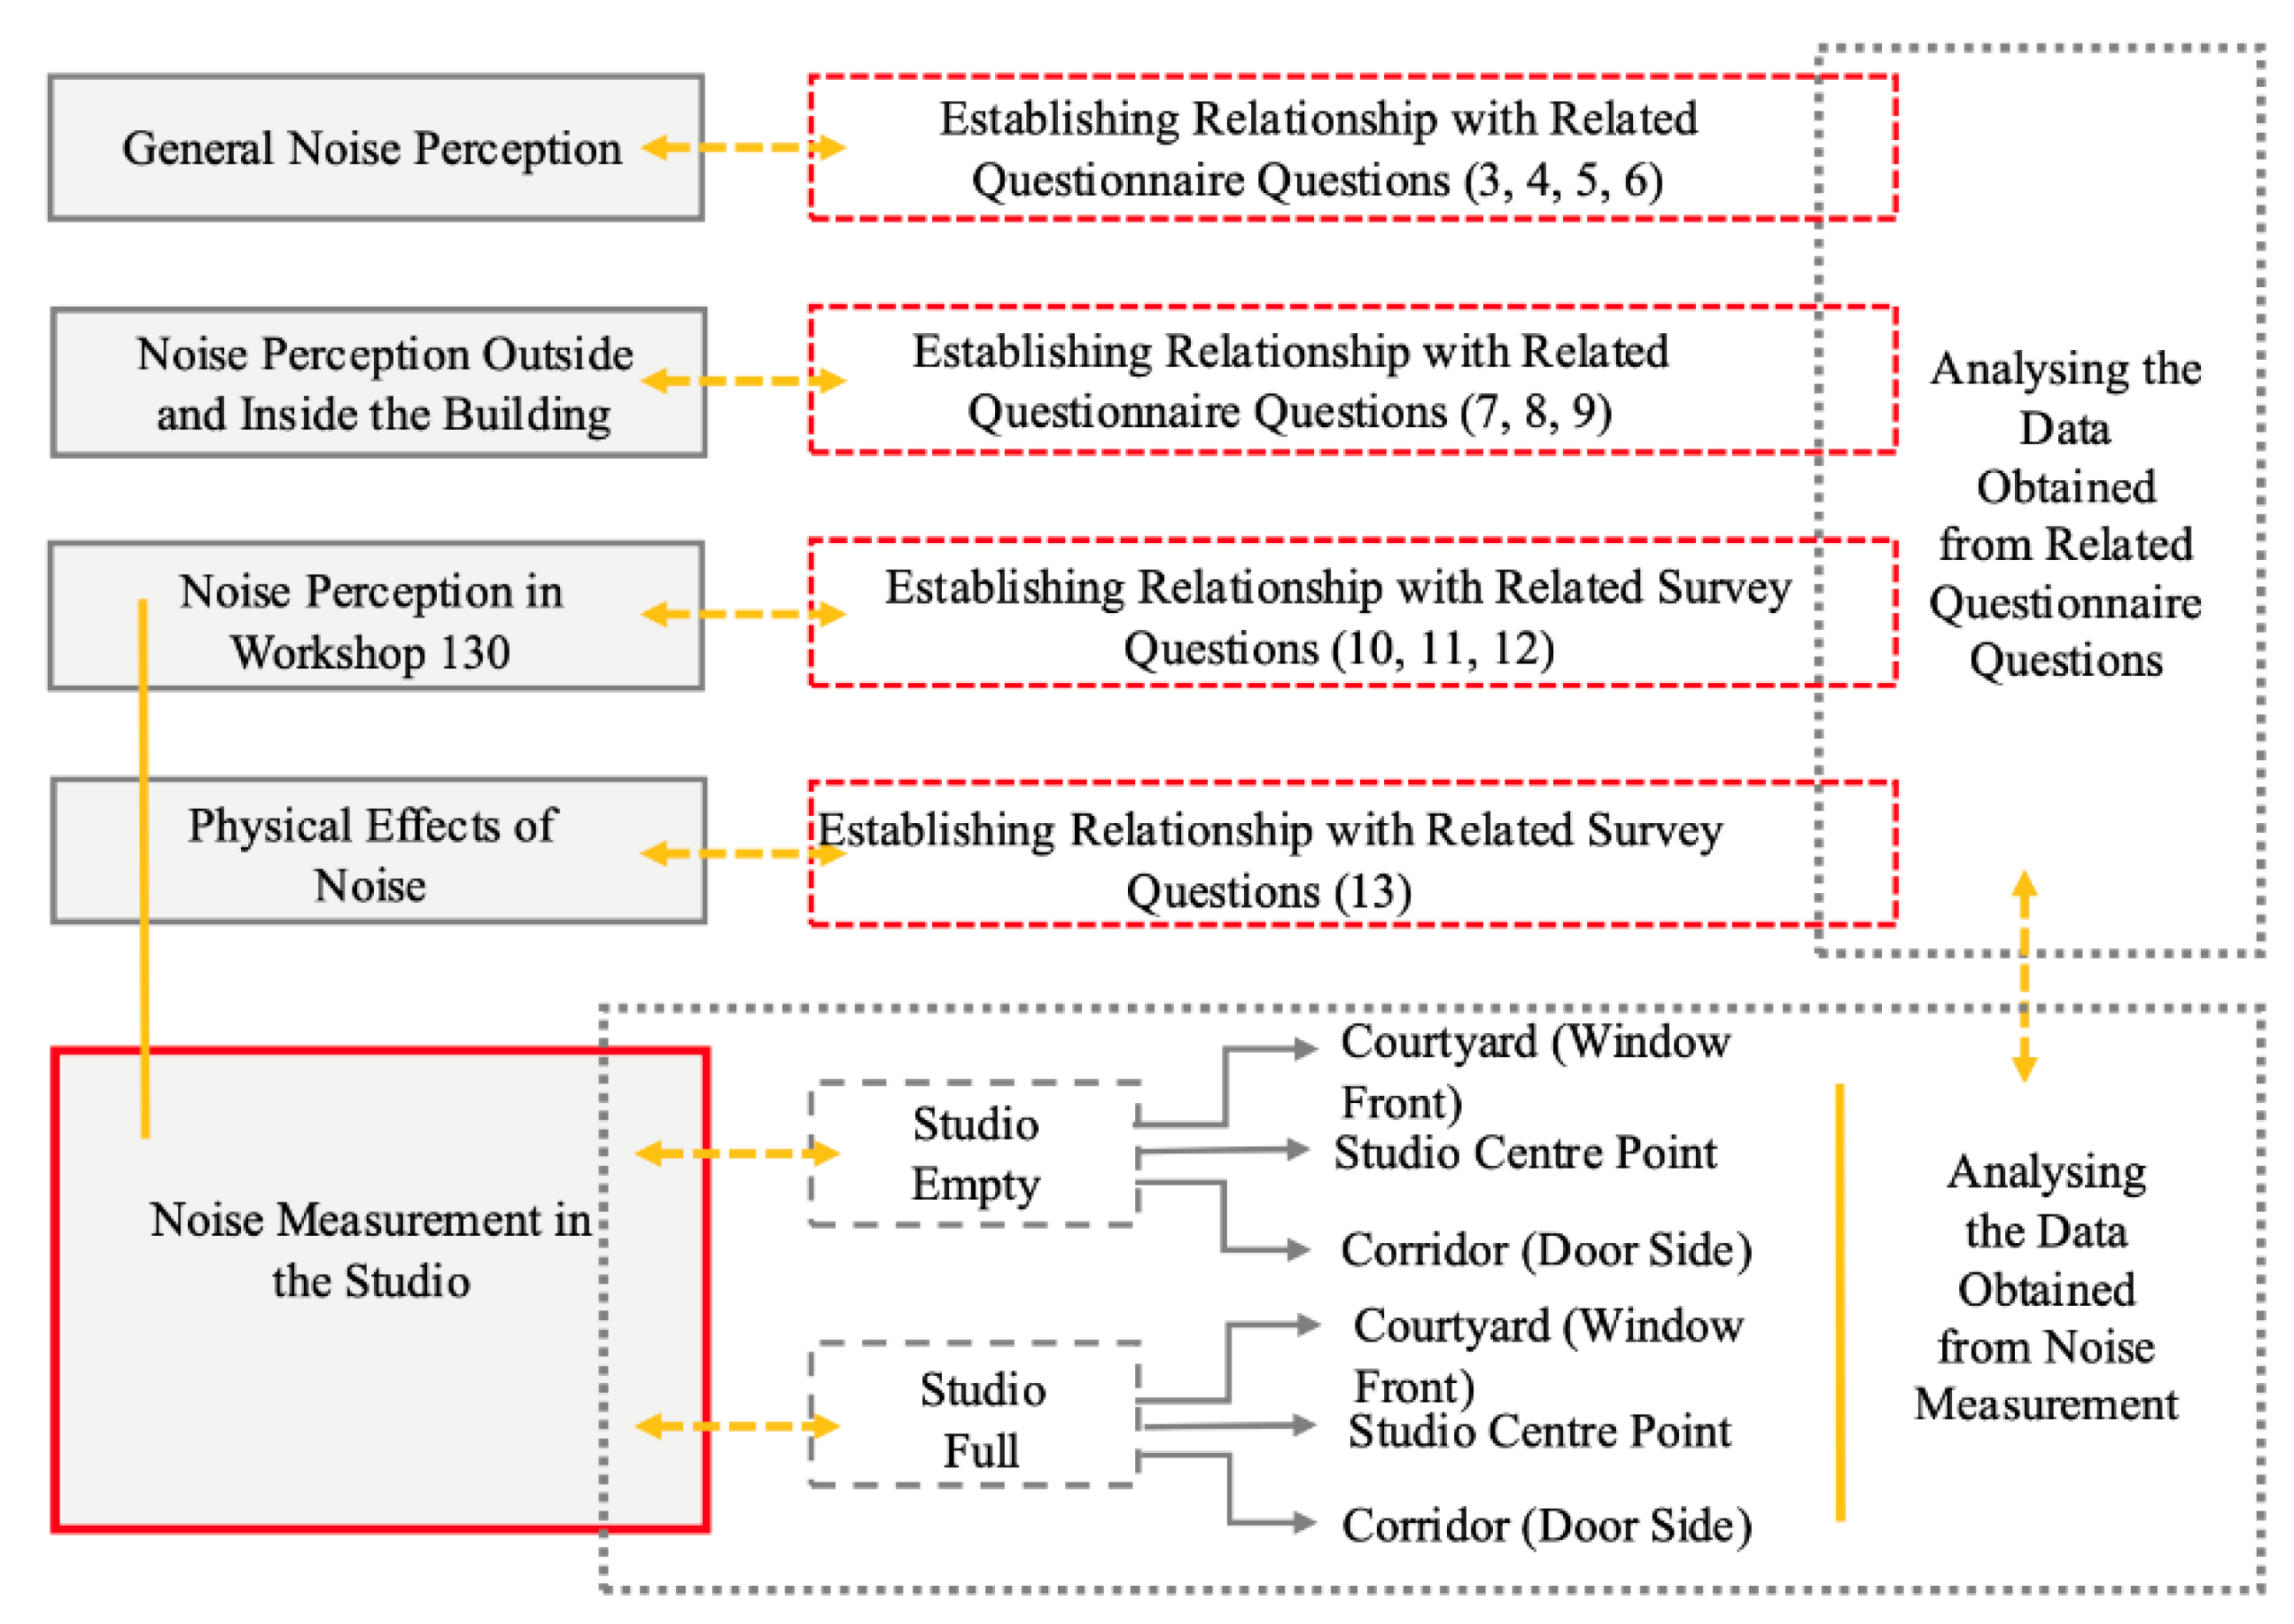
Figure 6.
Types of noise sources .
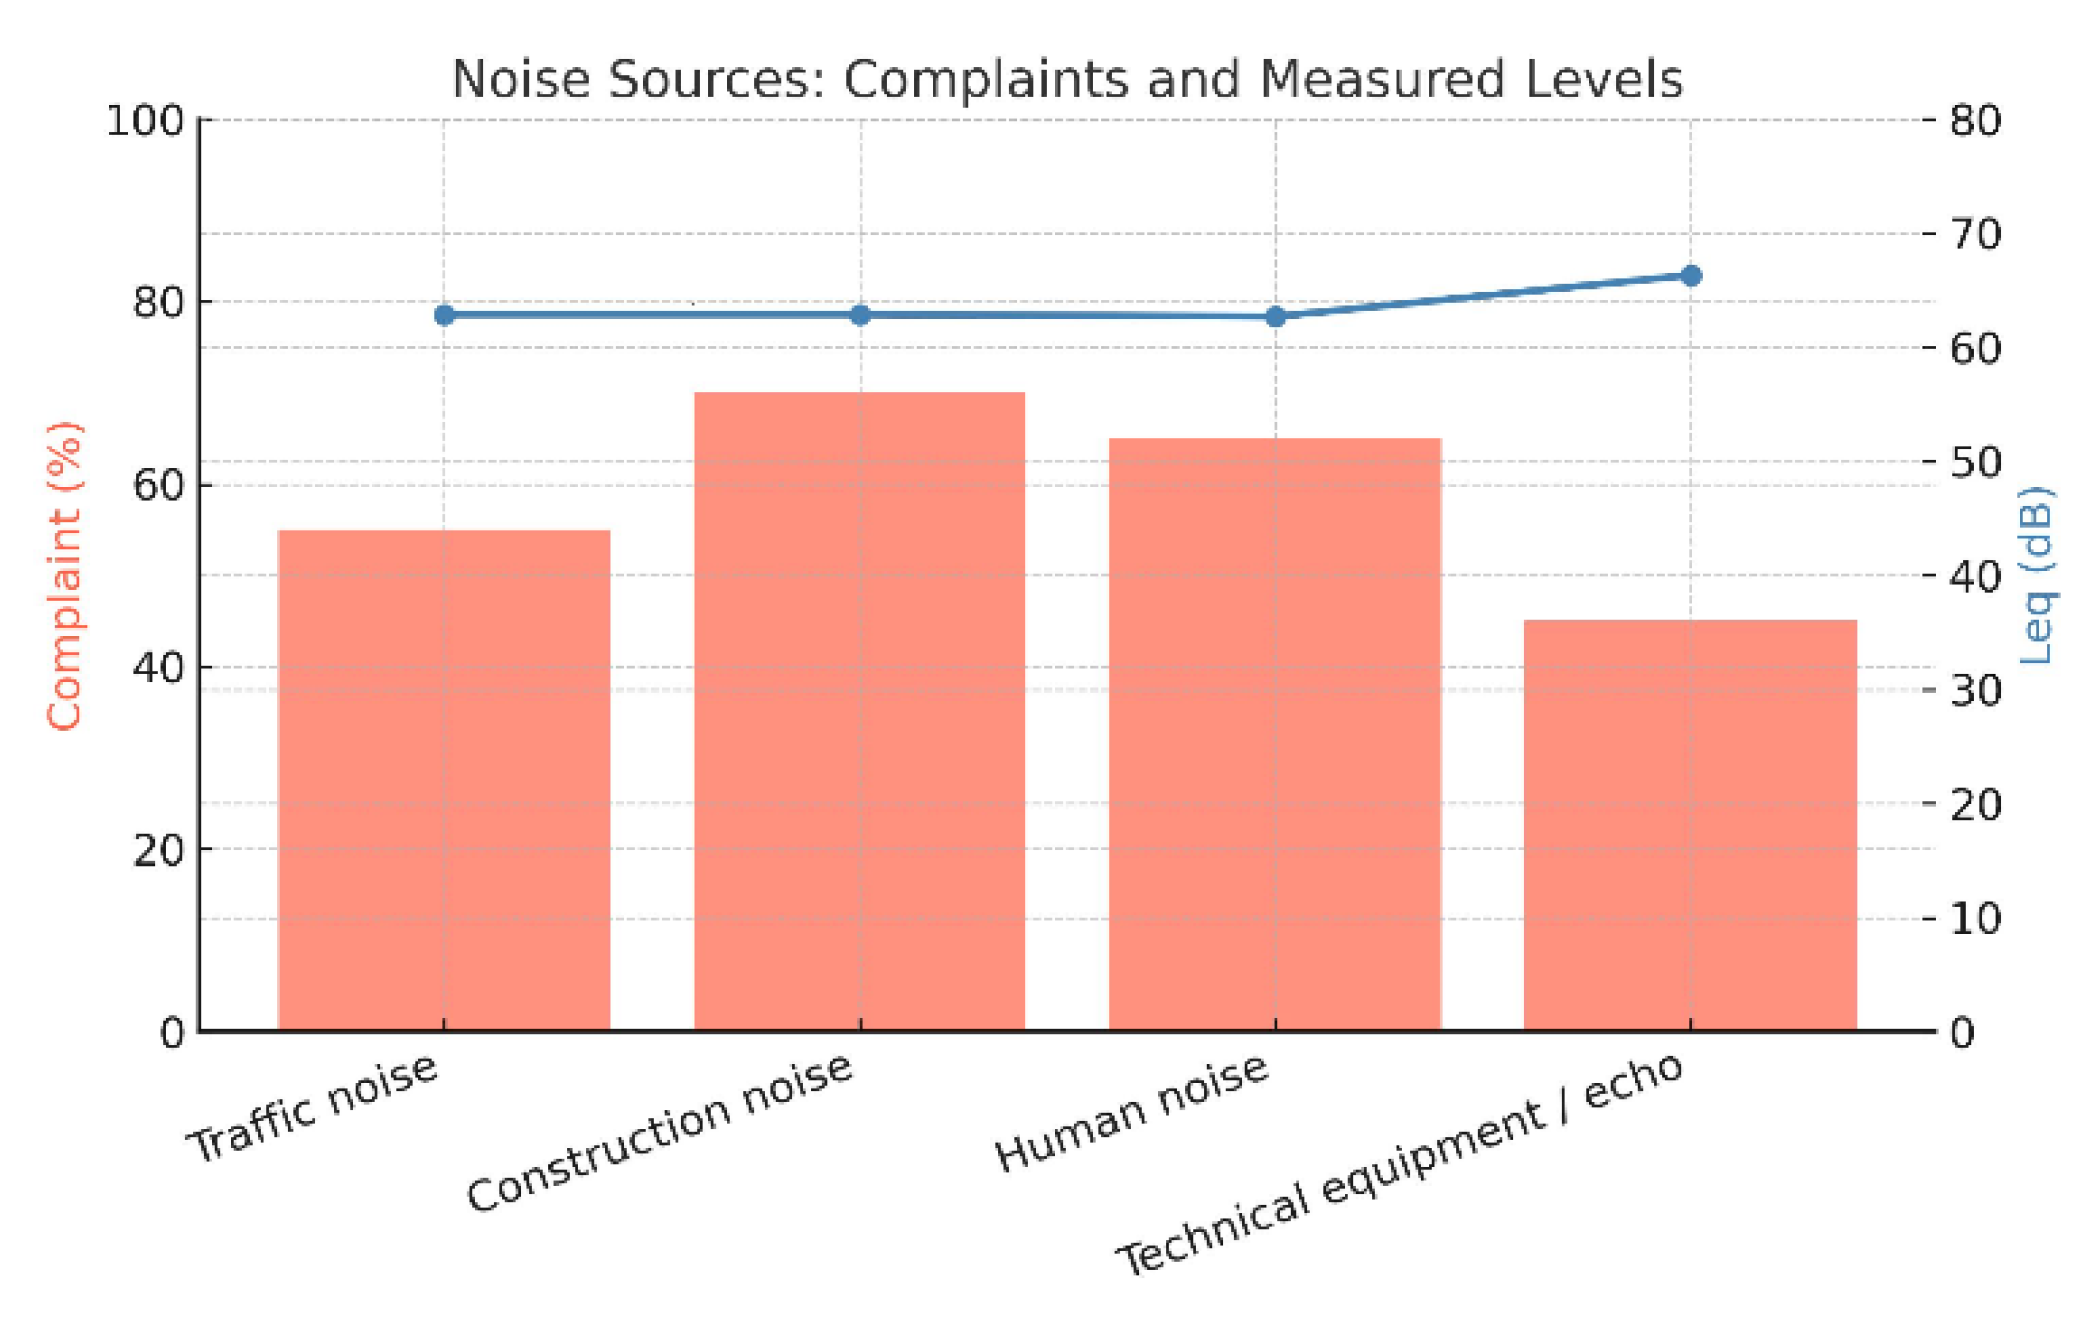
Figure 7.
Number of students disturbed by noise in the venues.
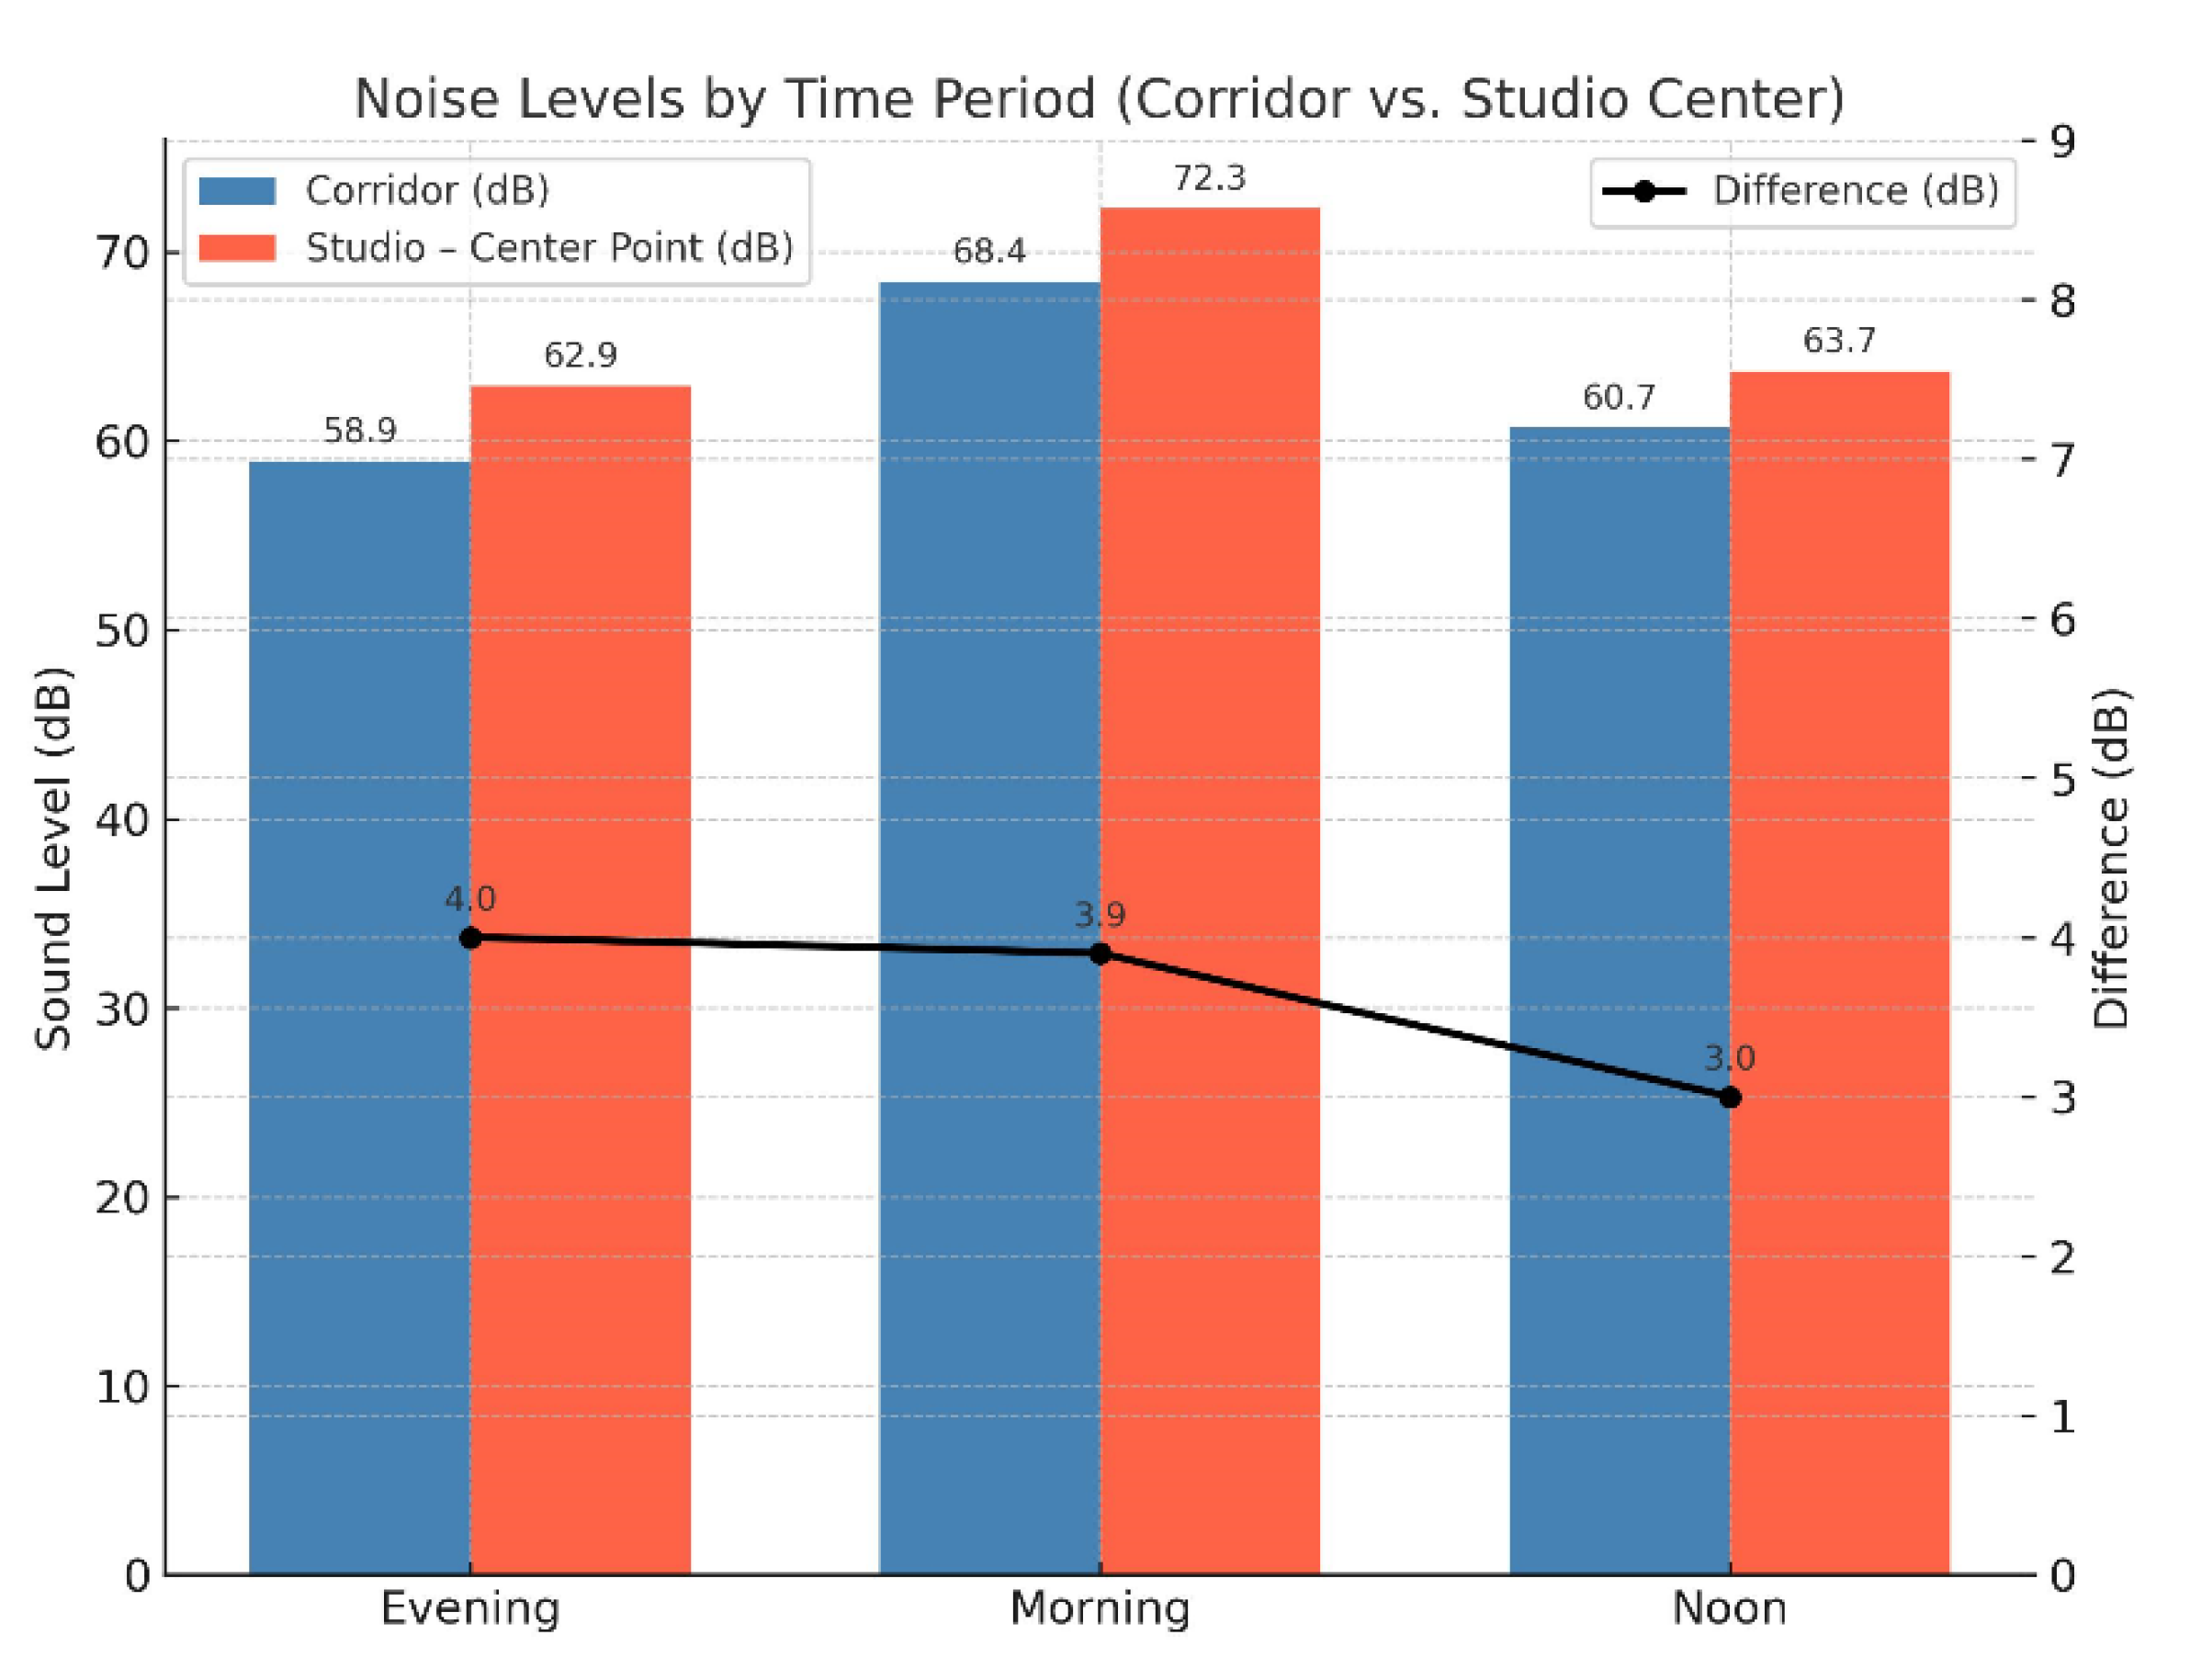
Figure 8.
Noise sources complaints and noise levels.
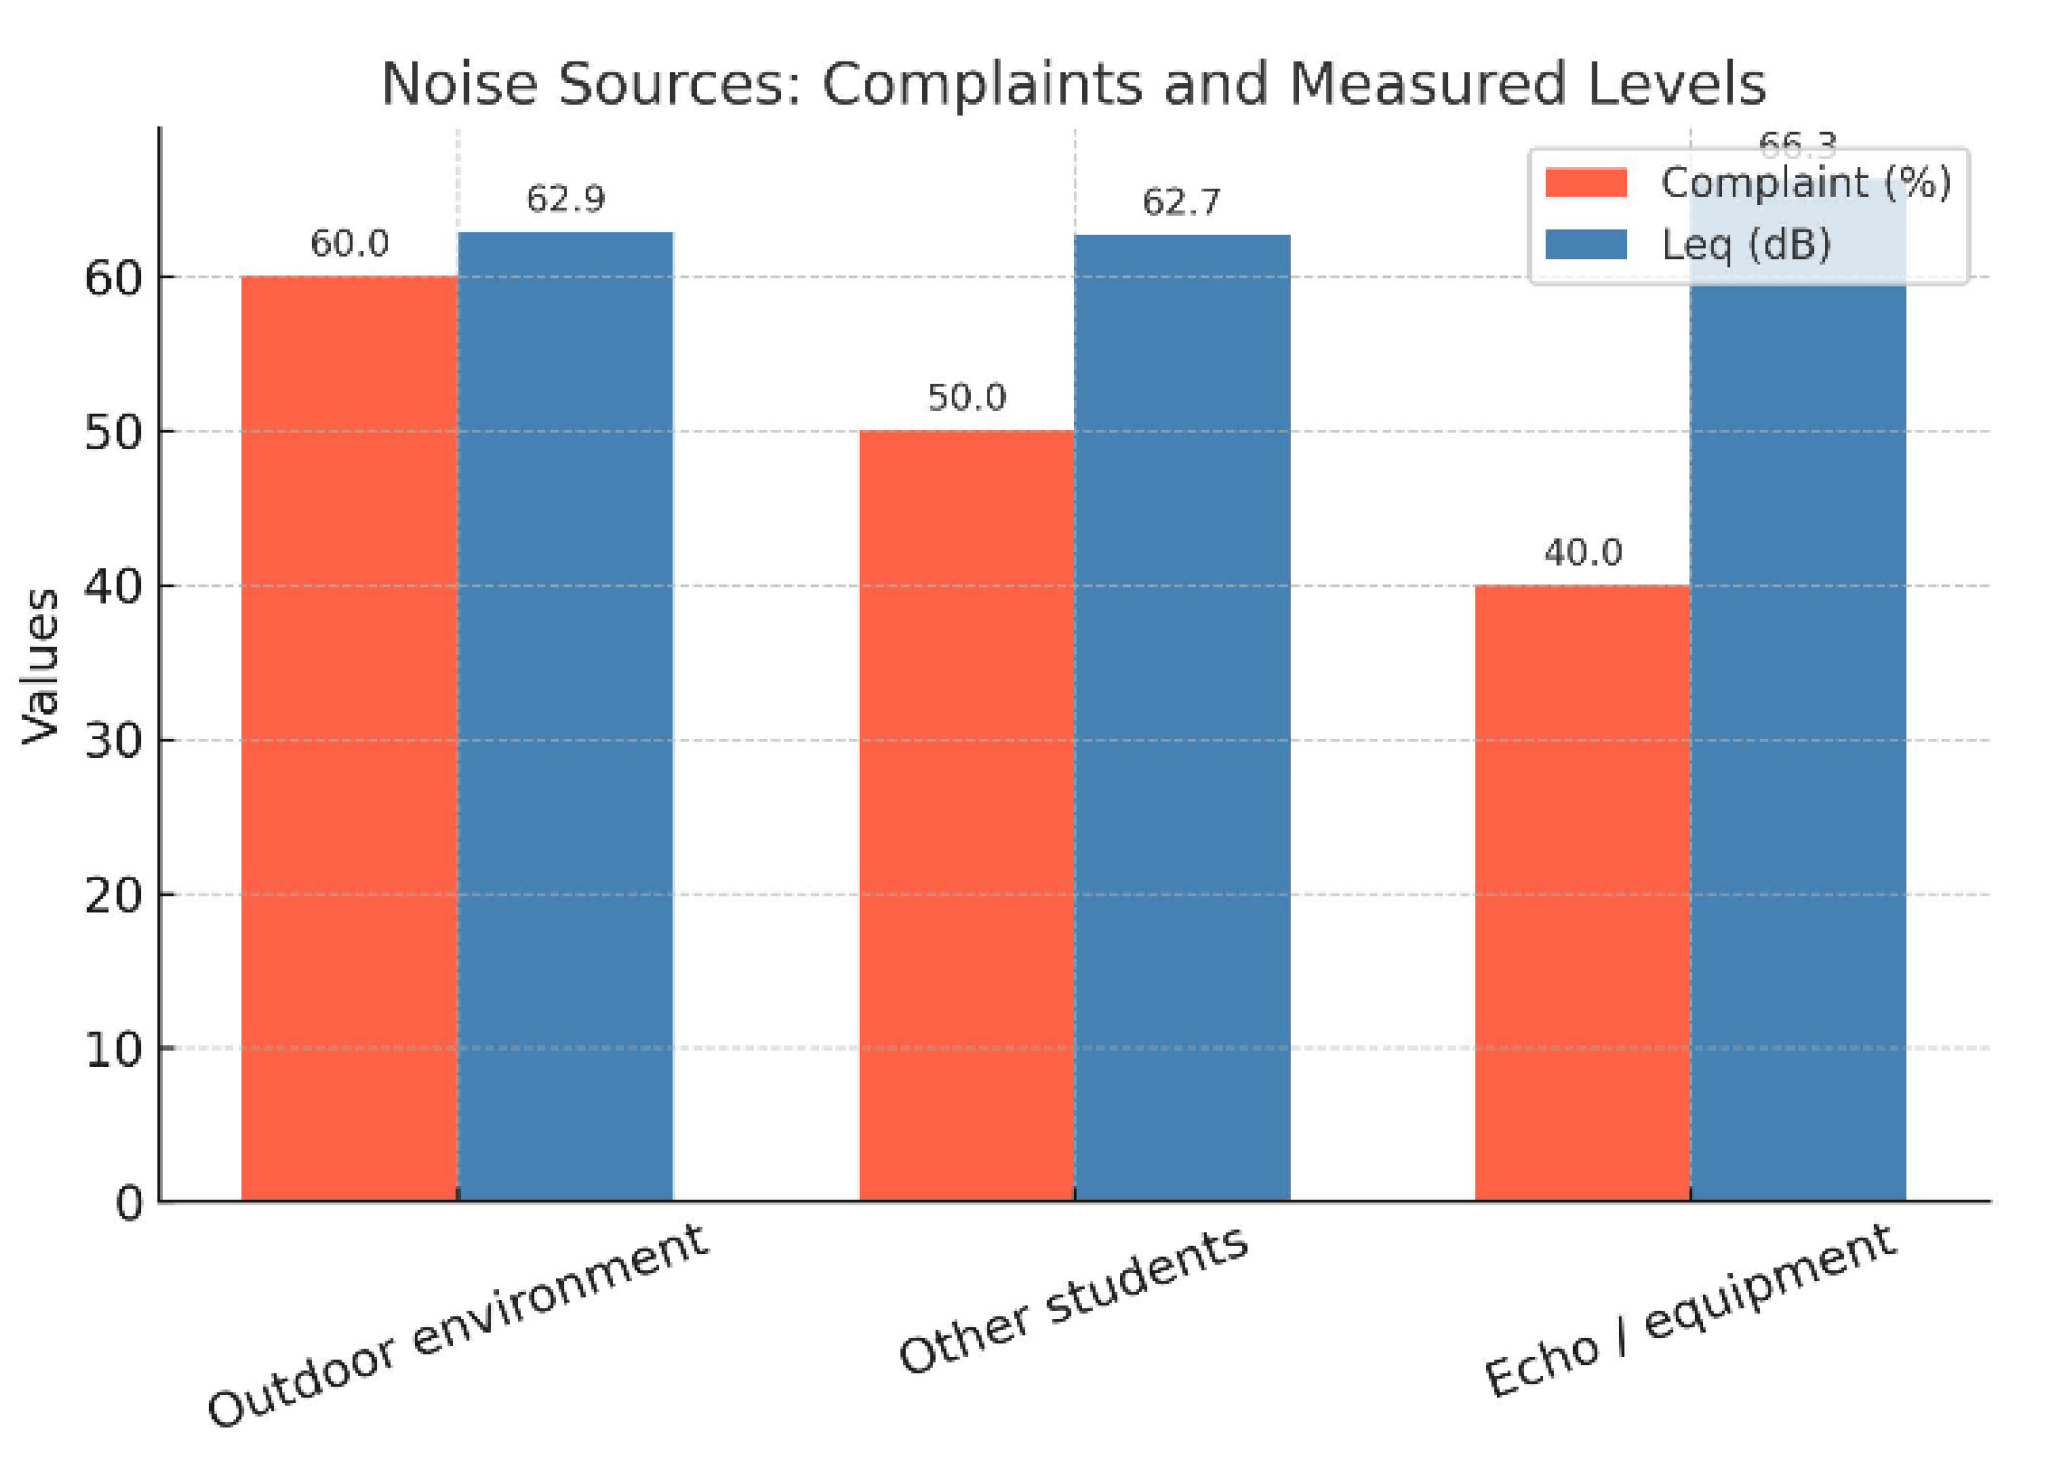
Figure 9.
Noise disturbance levels of students according to work types.
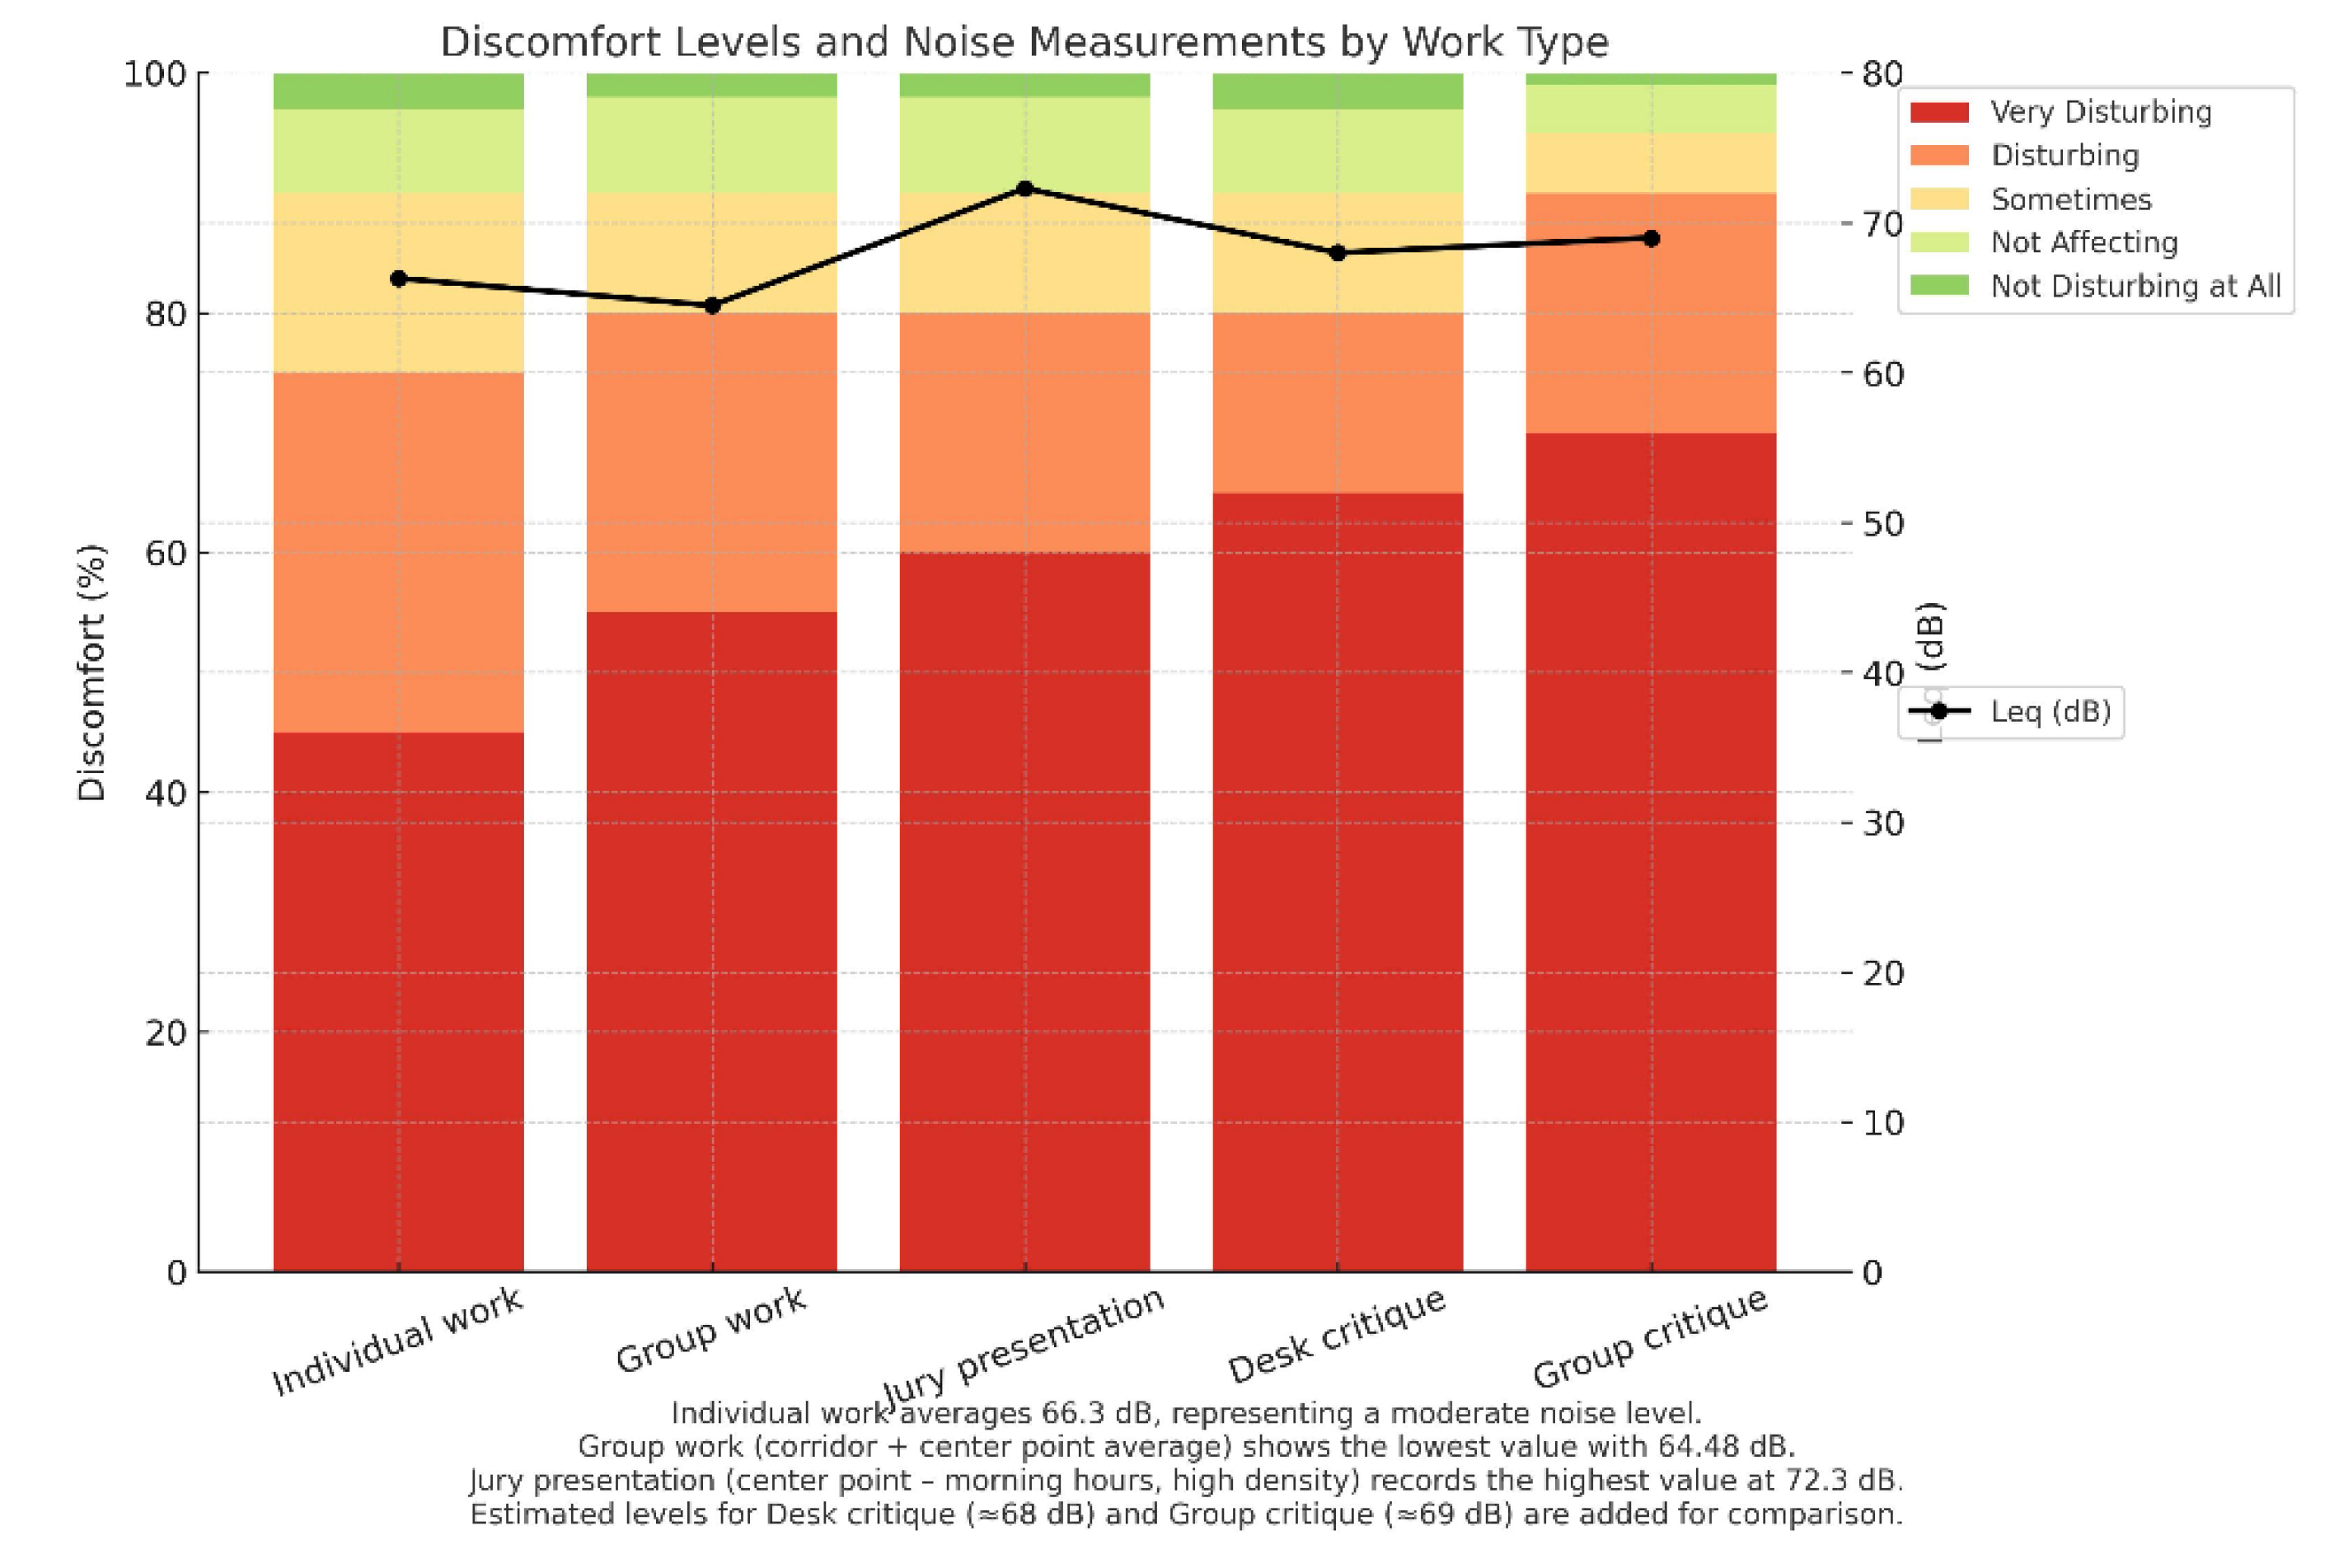
Figure 10.
The effect of noise on students.
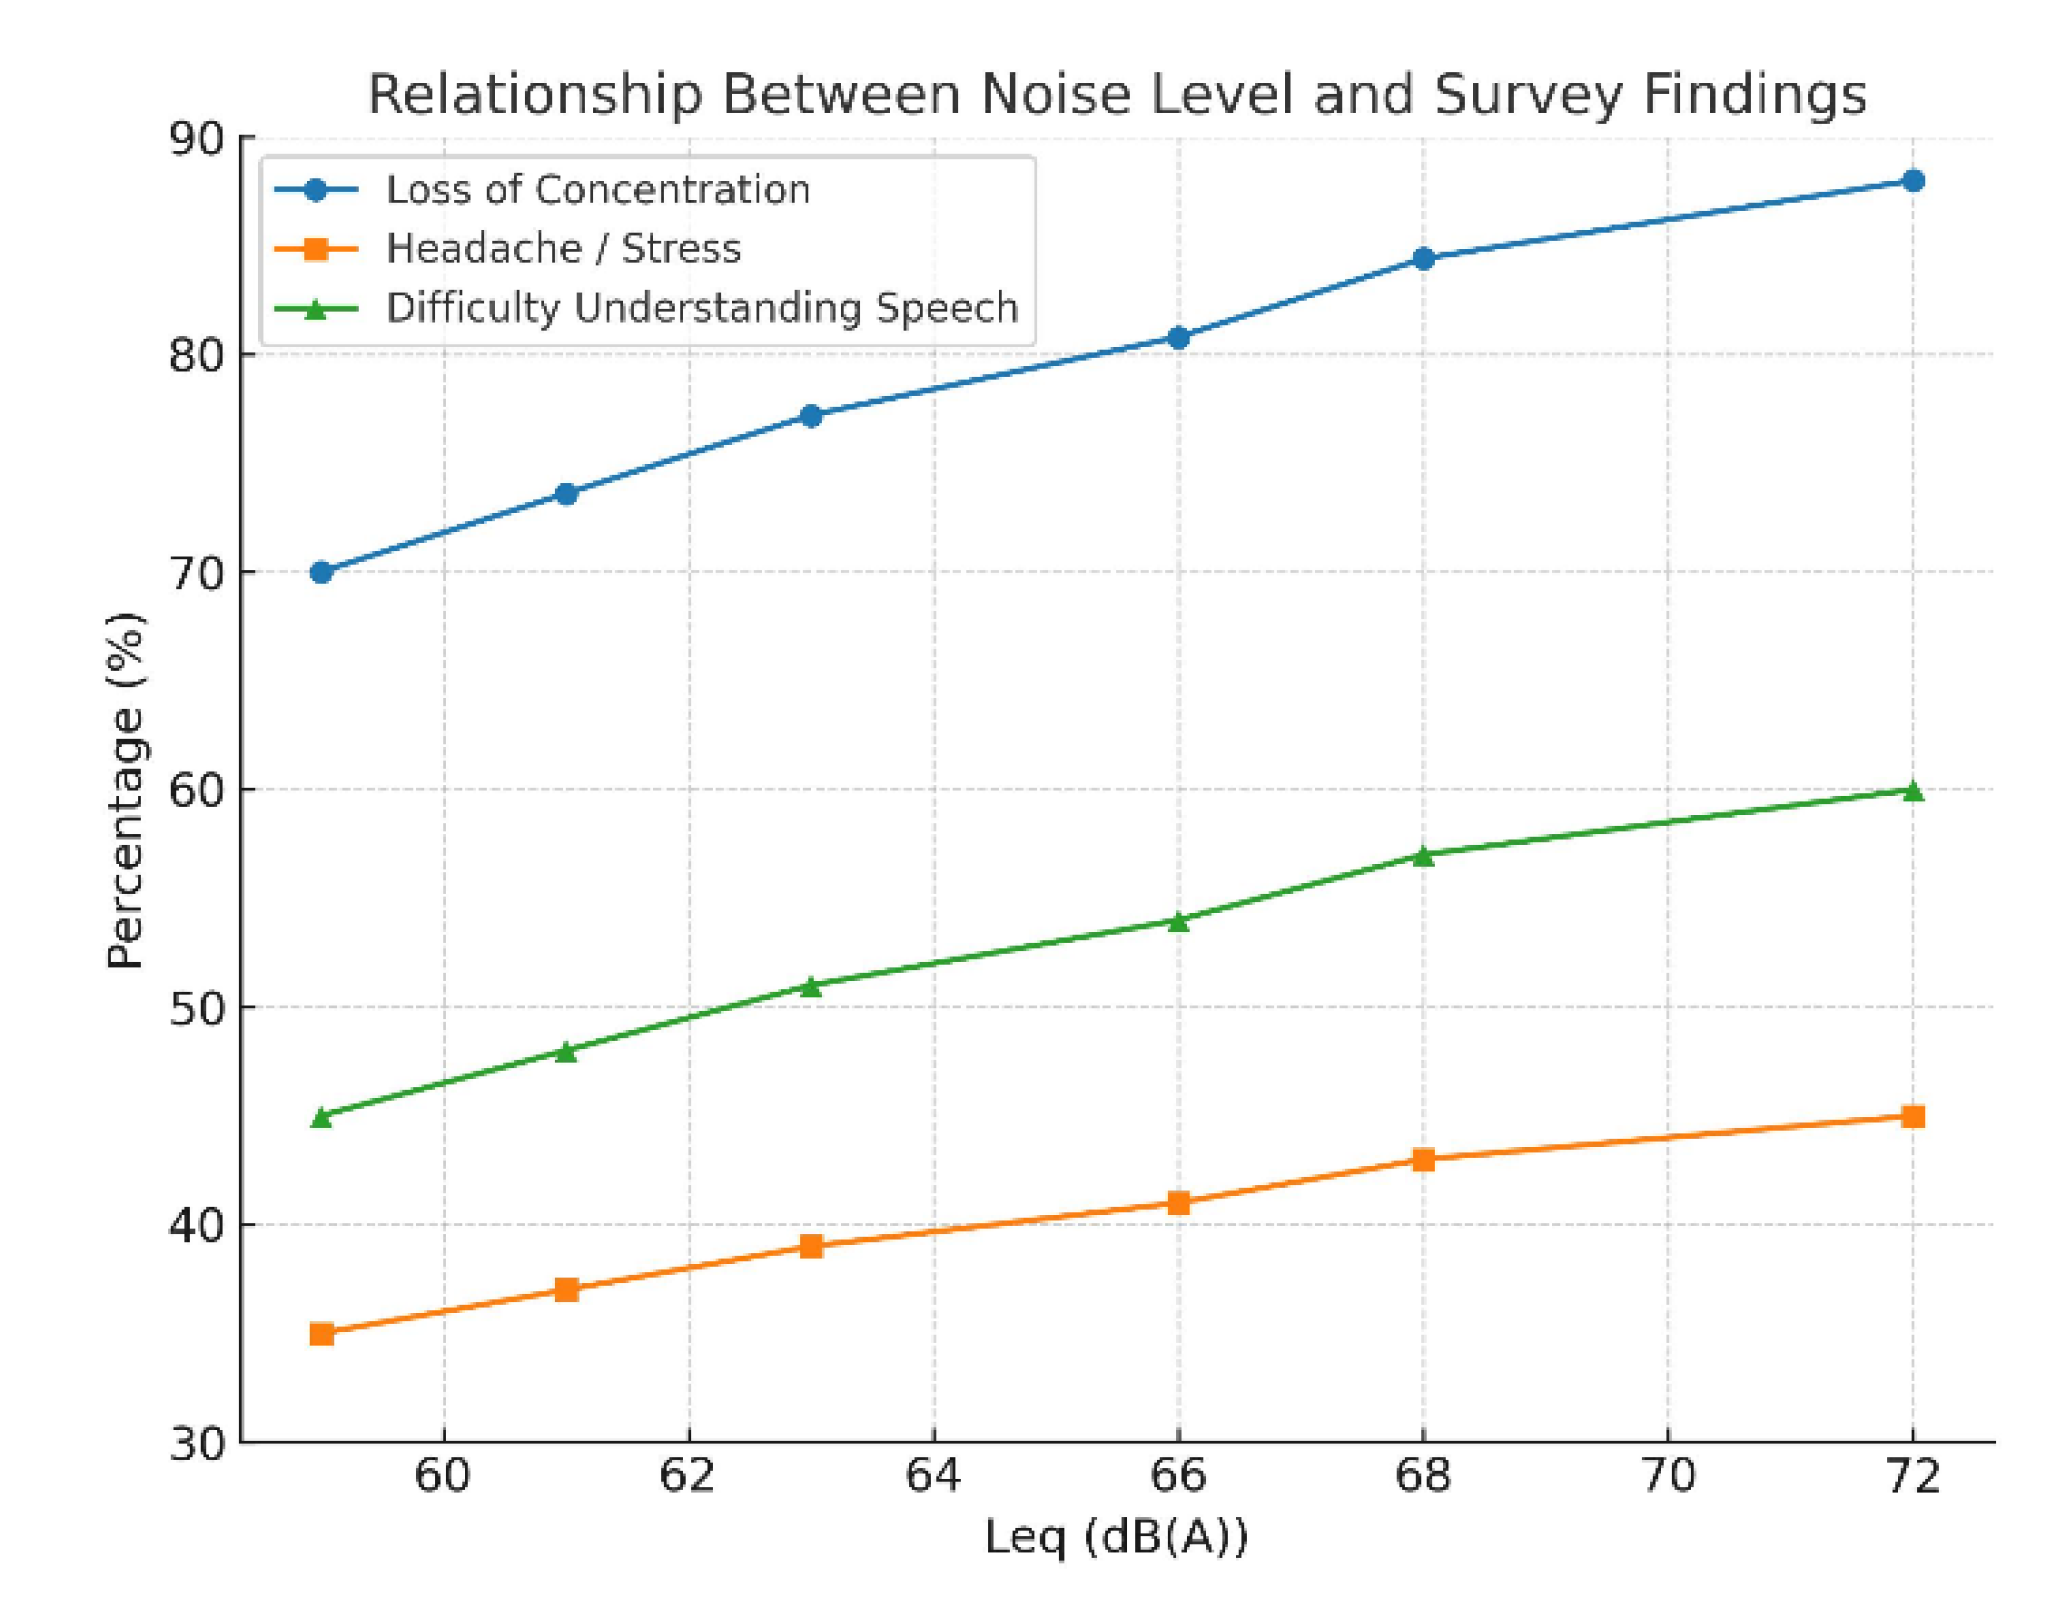
Figure 10.
Alternative studio plan and suggestions for space design.
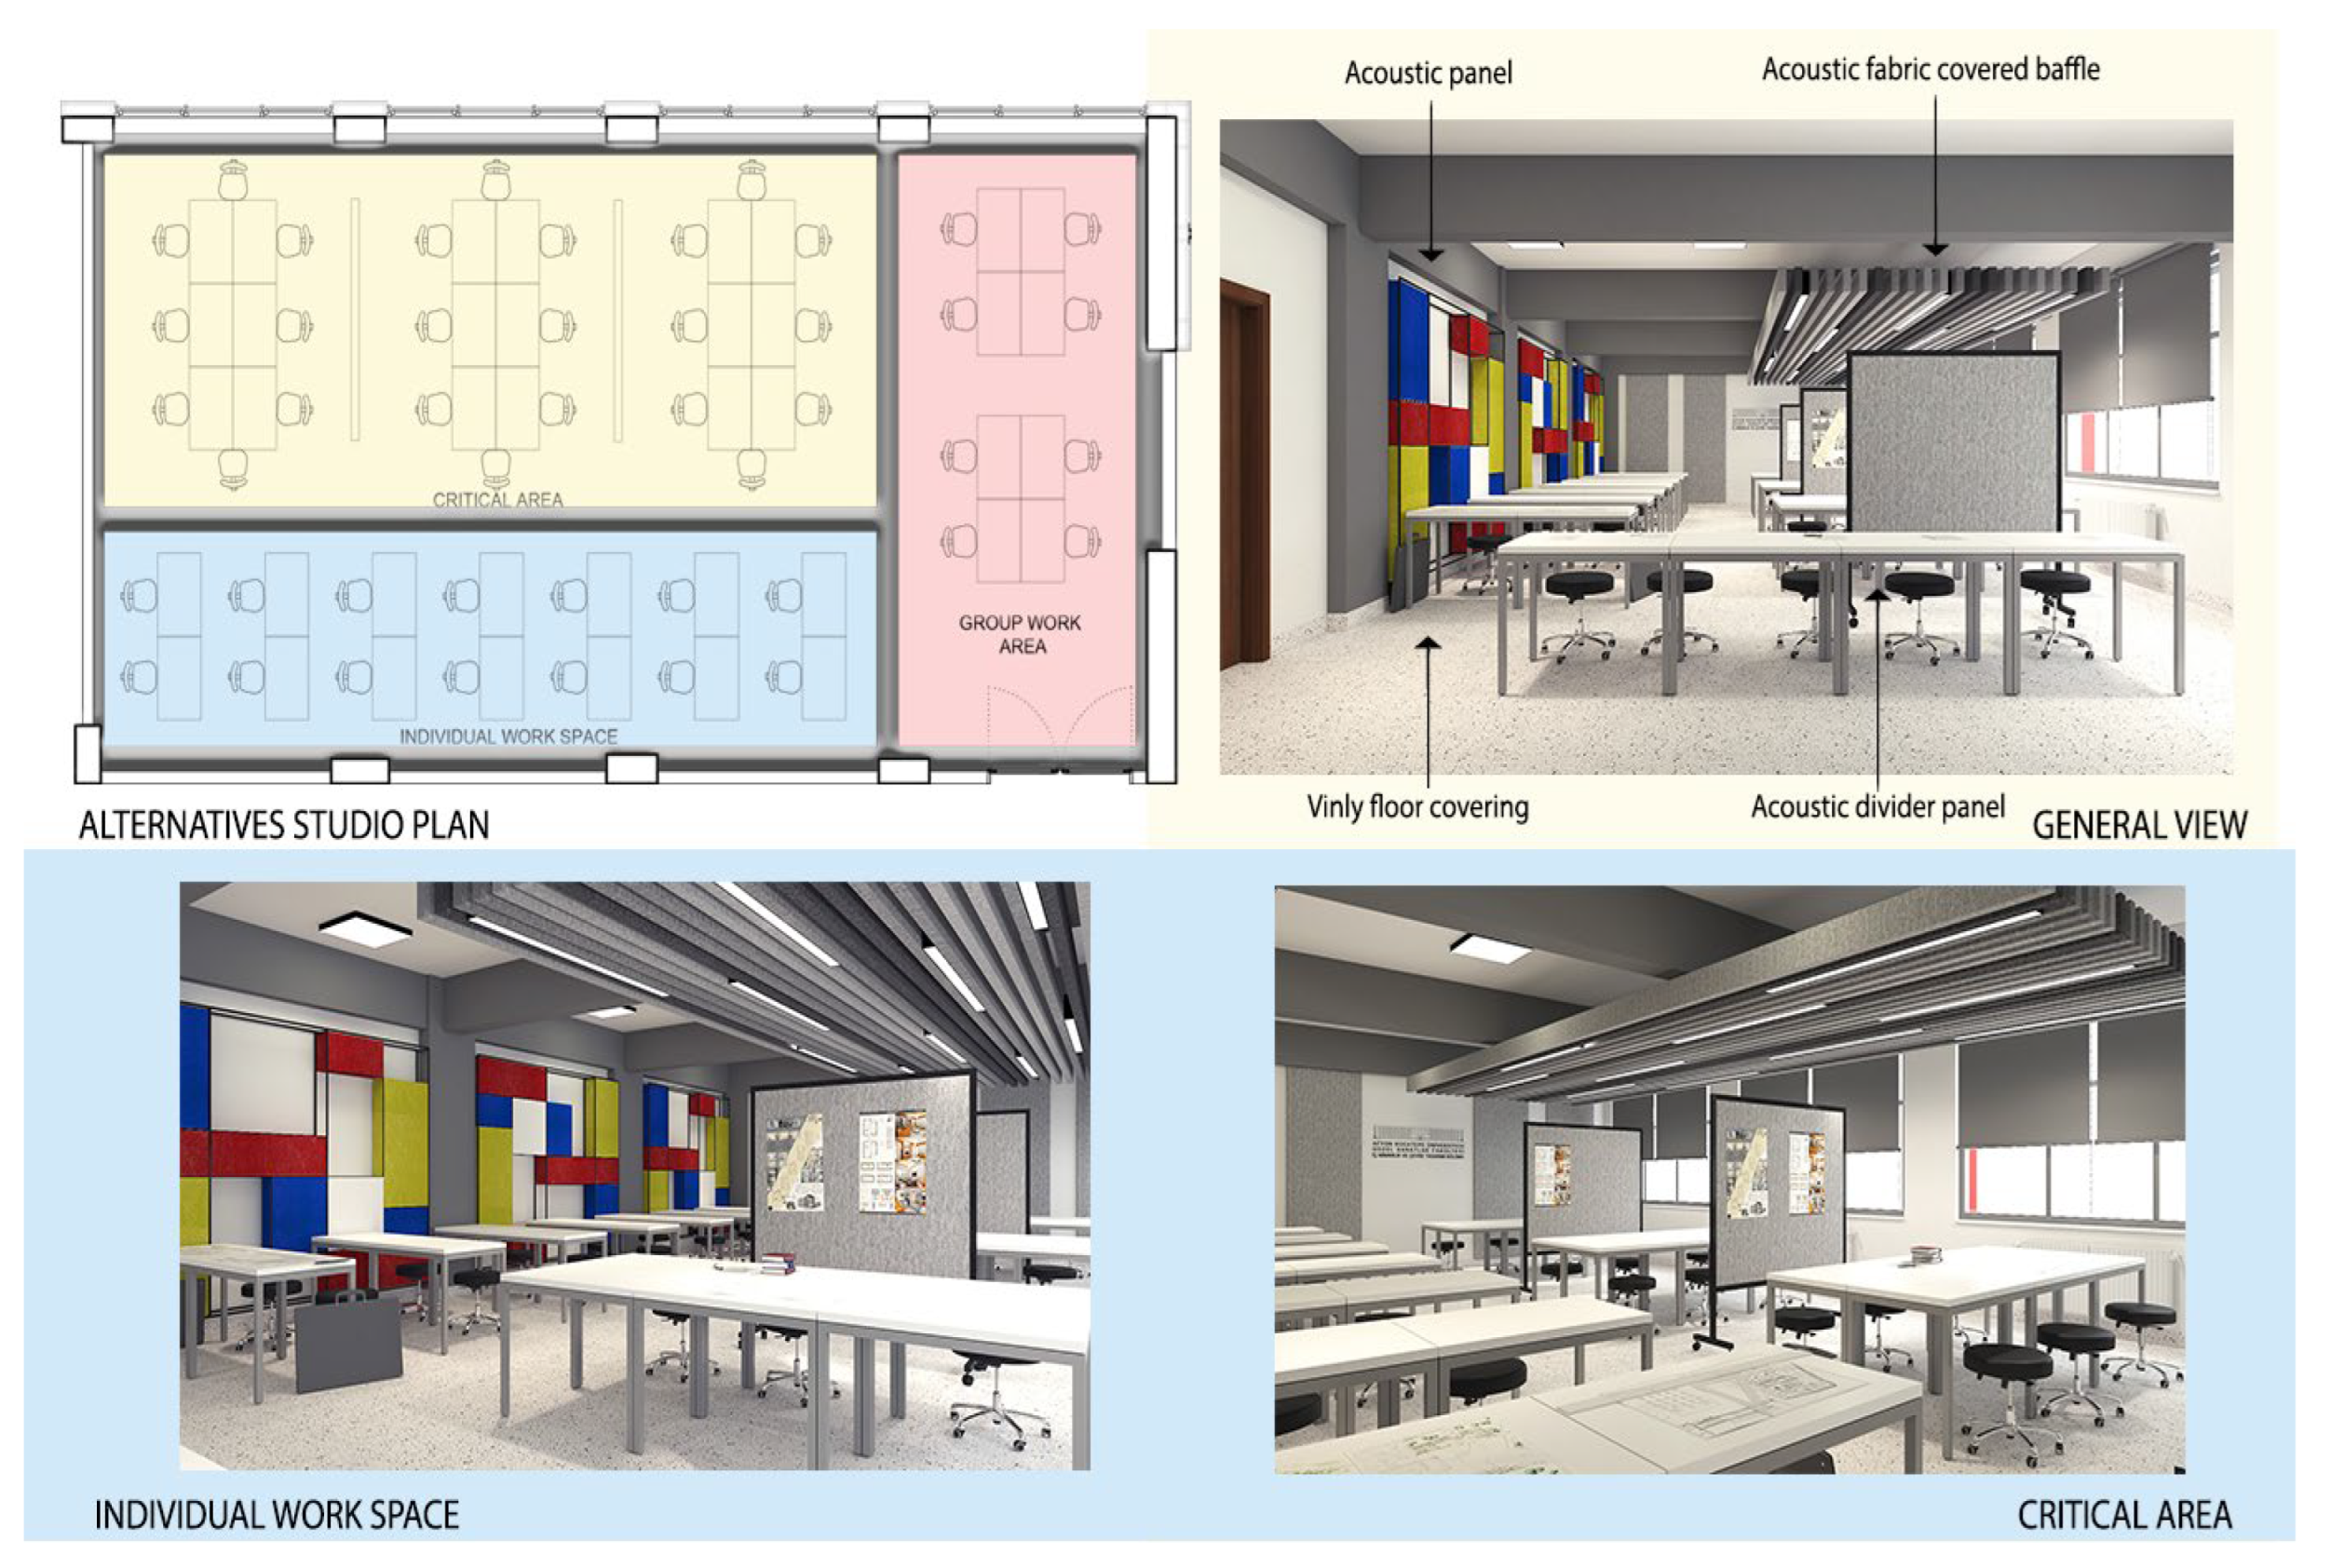

Table 1.
Permissible Indoor Noise Levels (Class buildings) [2].
Table 1.
Permissible Indoor Noise Levels (Class buildings) [2].
| Type of venue | Time slot | A | B | C | D | E | F |
| Educational area | Class hour | ≤35dB(A) | ≤40dB(A) | ≤45dB(A) | ≤50dB(A) | ≤55dB(A) | ≤60dB(A) |
| Building types | Noise Sensitive Activity Area | Activity Area with Noise Source |
| Education Buildings |
Classrooms, reading rooms, conference rooms, administrative spaces, infirmary and maintenance rooms, laboratories, sleeping facilities in kindergartens | Courtyards and playgrounds, sports halls, studios, music studios, kitchen and utility areas, car parks and garages. |
Table 3.
Spatial differences between traditional classroom environments and design studios.
| Dimensions / |
Traditional Classroon
|
Design Studio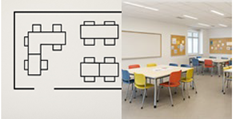
|
|
Features Layout |
Seats are usually arranged in a single direction, facing the teacher. | There are flexible, modular desks and seating arrangements. |
| Fixed seating arrangements are common. | There is movable furniture suitable for group work. | |
| The classroom area is mostly rectangular in shape. | There are work areas of various sizes (individual, group, shared exhibition area). | |
| Walls are usually bare or limited to simple boards/cabinets. | Walls, boards, shelves, and display surfaces are used extensively. | |
|
Educational Model |
Teacher-centered, with an emphasis on knowledge transfer. | Student-centered, with an emphasis on project- and problem-based learning. |
| Based on a predetermined curriculum and topics. | Process-oriented, including research, idea development, implementation, and presentation stages. | |
| Student interaction may be limited. | The instructor acts as a mentor/guide. | |
| Performance measurement is typically done through written exams and tests. | Assessment processes are conducted through portfolios, project presentations, and discussions. | |
|
Acoustics Comfort |
The noise level is generally low and controlled. | The noise level is generally high (conversations, presentations, teamwork, studio equipment noise). |
| Sound insulation is planned according to standard class design. | Open-plan or semi-open spaces can increase reverberation and noise problems. | |
| Reverberation time is kept short. | Sound control must be provided with acoustic panels, ceiling elements, and furniture surfaces. | |
| Window and door insulation is sufficient against external noise. | If noise control is not implemented, concentration loss and communication problems may occur. |
Table 4.
Noise Level Measurement Results of Studio 130 of the Department of Interior Architecture and Environmental Design.
Table 4.
Noise Level Measurement Results of Studio 130 of the Department of Interior Architecture and Environmental Design.
| Measurements Taken While Students Are Present in the Studio | ||||||
| Morning hours (09:00-10:00) | Leq | Lmax | Lmin | |||
| Inside studio filled | Window front (courtyard) | 66.1 | 73.7 | 50.3 | ||
| Door side (corridor) | 68,4 | 70,7 | 49,7 | |||
| Studio Centre point | 72,3 | 78.8 | 52 | |||
| Noon hours (12:00-13:00) | Leq | Lmax | Lmin | |||
| Inside studio filled | Window front (courtyard) | 61,8 | 67 | 51,3 | ||
| Door side (corridor) | 60,7 | 66,5 | 47,9 | |||
| Studio Centre point | 63,7 | 68,2 | 50,7 | |||
| Evening hours (17:00-18:00) | Leq | Lmax | Lmin | |||
| Inside studio filled | Window front (courtyard) | 60,7 | 65,7 | 43,7 | ||
| Door side (corridor) | 58,9 | 62,7 | 42,9 | |||
| Studio Centre point | 62,9 | 66,7 | 48,4 | |||
 |
||||||
| Measurements Taken While Students Are Not Present in the Studio | ||||||
| Morning hours (09:00-10:00) | Leq | Lmax | Lmin | |||
| Inside studio empty |
Window front (courtyard) | 44,26 | 49,1 | 35,7 | ||
| Door side (corridor) | 38,5 | 45,1 | 30,8 | |||
| Studio Centre point | 37,1 | 45,5 | 30,4 | |||
| Noon hours (12:00-13:00) | Leq | Lmax | Lmin | |||
| Inside studio empty | Window front (courtyard) | 58,2 | 64,8 | 42.1 | ||
| Door side (corridor) | 53,1 | 55,8 | 40.3 | |||
| Studio Centre point | 48,1 | 53,3 | 40,1 | |||
| Evening hours (17:00-18:00) | Leq | Lmax | Lmin | |||
| Inside studio empty |
Front of window (courtyard) | 54 | 62,4 | 45,7 | ||
| Side of door (corridor) | 52,1 | 57,5 | 42,2 | |||
| Studio Centre point | 51,8 | 56,6 | 41,9 | |||
 |
||||||
Table 5.
Analysis of noise measurements and survey results.
| Noise Impacts | Question No | Analysing the Questionnaire Questions | |
| General Noise Perception | 3 | Noise is the most disturbing factor in everyday life | |
| 4 | There is a focusing problem | ||
| 5 | The most disturbing noises among the noise types are; construction voice, human voice and vehicle voice | ||
|
Noise Perception Outside and Inside the Building |
6 | There is a noise problem around the building | |
| 7 | The courtyard is the area where the noise is felt | ||
| 8 | Very disturbing noise inside the building | ||
| 9 | The most noisy places in the building are respectively; studio, corridor, classroom | ||
|
Noise Perception in Studio 130 |
Question No | Analysis of Questionnaire Questions | |
| 10 |
The most disturbing sound source in the studio is the noise coming from outside and other students' conversations. | ||
| 11 |
Level of discomfort in the working environment (highest rates) | ||
| Individual work | Very uncomfortable | ||
| Group work | Very uncomfortable | ||
| Table critique | Very uncomfortable | ||
| Group critique | Very uncomfortable | ||
| Jury presentation | Very uncomfortable | ||
| 12 | Noise during table or group critiques has a negative impact on communication. | ||
|
Physical Effects of Noise |
Question No | Analysis of Questionnaire Questions | |
| 13 | Noise impacts (highest rates in order) | ||
| Loss of concentration | |||
| Inability to understand conversations | |||
| Fatigue | |||
| Headache / stress | |||
Table 6.
Cronbach Alfa results.
| Item | Scale Mean if Item Deleted | Scale Variance if Item Deleted | Corrected Item-Total Correlation | Cronbach's Alpha if Item Deleted |
Scale Reliability |
| 1 | 45,2 | 20,1 | 0,54 | 0,86 | 0.87 |
| 2 | 45,1 | 20,4 | 0,52 | 0,86 | |
| 3 | 44,9 | 20 | 0,58 | 0,85 | |
| 4 | 45 | 20,3 | 0,56 | 0,86 | |
| 5 | 45,3 | 20,5 | 0,55 | 0,86 | |
| 6 | 45,2 | 20,2 | 0,57 | 0,85 | |
| 7 | 45,1 | 20,1 | 0,59 | 0,85 | |
| 8 | 45,2 | 20,6 | 0,53 | 0,86 | |
| 9 | 45 | 20,3 | 0,56 | 0,86 | |
| 10 | 45,1 | 20,4 | 0,52 | 0,86 | |
| 11 | 45,3 | 20,2 | 0,57 | 0,85 | |
| 12 | 45,2 | 20,1 | 0,55 | 0,86 | |
| 13 | 45,1 | 20,3 | 0,54 | 0,86 |
Table 7.
Correlation analysis.
| Variable 1 | Variable 2 | Correlation Coefficient (r) | p-value |
| Disturbance from Noise | Focusing Problem | 528 | 3.766 |
Table 8.
Survey results.
| Time-Period | Status | Average Leq dB(A) | Standart Deviation |
| Morning | Student present | 68,93 | 3,13 |
| Morning | No student present | 39,97 | 3,82 |
| Noon | Student present | 62,07 | 1,52 |
| Noon | No student present | 53,13 | 5,05 |
| Evening | Student present | 60,83 | 2,00 |
| Evening | No student present | 52,63 | 1,19 |
Table 9.
Survey results.
| Period | Student Present dB(A) | No Student Present dB(A) | Difference |
| Morning | 66,1 | 44,3 | 21,8 |
| Noon | 61,8 | 58,2 | 3,6 |
| Evening | 60,7 | 54,0 | 6,7 |
Disclaimer/Publisher’s Note: The statements, opinions and data contained in all publications are solely those of the individual author(s) and contributor(s) and not of MDPI and/or the editor(s). MDPI and/or the editor(s) disclaim responsibility for any injury to people or property resulting from any ideas, methods, instructions or products referred to in the content. |
© 2025 by the authors. Licensee MDPI, Basel, Switzerland. This article is an open access article distributed under the terms and conditions of the Creative Commons Attribution (CC BY) license (http://creativecommons.org/licenses/by/4.0/).
Copyright: This open access article is published under a Creative Commons CC BY 4.0 license, which permit the free download, distribution, and reuse, provided that the author and preprint are cited in any reuse.


