
Submitted:
20 August 2025
Posted:
21 August 2025
You are already at the latest version
Abstract
This study investigates the influence of digitalised content strategies on customer churn reduction through the mediating role of Brand Attractiveness, focusing on the retail industry and targeting Millennial consumers in Klang Valley, Malaysia. Guided by the Stimulus-Organism-Response (S-O-R) framework, the research examines the effects of Augmented Reality, Mobile Apps, Online Communities, Social Media, and Virtual Reality on Brand Attractiveness and subsequent customer churn reduction. A quantitative, cross-sectional research design was employed. Primary data were collected via an online survey from 306 Millennial respondents using a structured questionnaire. Partial Least Squares Structural Equation Modelling (PLS-SEM) through SmartPLS 4 was utilised to analyse the measurement and structural models, with bootstrapping (10,000 resamples) used for mediation analysis to ensure the robustness of the results. The findings indicate that Mobile Apps, Online Communities, and Virtual Reality exert significant positive effects on Brand Attractiveness, whereas Augmented Reality exhibits no significant direct or mediating effects. Social Media engagement shows a statistically significant but practically negligible mediation effect on customer churn reduction. Furthermore, Brand Attractiveness significantly mediates the relationships between key digital strategies and churn reduction, highlighting its central role. These outcomes offer critical insights for retail managers seeking to reduce customer churn by enhancing Brand Attractiveness through well-designed digital touchpoints. Future research should adopt longitudinal approaches and consider integrating emerging technologies, such as AI and blockchain, to extend the model across diverse retail settings and demographic segments.
Keywords:
Gamification
; Digitalisation
; Brand Attractiveness
; Customer Churn Reduction
; Millennials
; Retail Industry
1. Introduction
The retail industry in Malaysia, especially in the Klang Valley area, is having a hard time keeping customers. Millennials are leaving more than other groups, with 68% of them switching brands or stores every year [1]. One reason for this is that old ways of keeping customers do not match what Millennials want. They now look for digital, fun, and interactive experiences with brands [2]. Because of this, this study looks at how using digital tools with game-like features can help stop customers from leaving. It also checks if brand attractiveness plays a role in this process. The study uses a method called partial least squares structural equation modelling (PLS-SEM) to look at how all these things are connected.
This research looks at five kinds of digital content that use game features to make people more interested. The first is Augmented Reality (AR) [3], which puts digital rewards and tasks over real-world settings. The second is Mobile Apps (MA) [4], which show things like progress bars and badges. The third is Online Communities (OC) [5], which use scoreboards and user levels. The fourth is Social Media (SM) [6], where users can share wins and join challenges. The last one is Virtual Reality (VR) [7], which creates full brand experiences. All these use basic game parts like points, rewards, and friendly competition to make the customer experience better. This study uses the Stimulus-Organism-Response (S-O-R) model [8] to explain what happens. The game-like features are the stimulus. Brand attractiveness is what the person feels inside, and staying with the brand is the response.
Even though other studies show that gamification helps with customer interest [9,10], some problems are still not solved. First, there is not much research on how each type of digital gamification affects how people feel about a brand in Malaysia especially in Klang Valley regions. Second, no one has really studied how brand attractiveness might help explain the link between gamification and customer loyalty [11]. Third, many older studies use simple models like linear regression, which do not work well when the data is not normal [12].
This study tries to fix these problems. It uses PLS-SEM because it works well when there are many variables and when the data is complicated [13]. It looks at Millennials in the Klang Valley because they make up 40% of buyers there [14]. This group also shows the highest number of people leaving and the biggest interest in digital games [15]. The study uses known ways to measure how people use digital tools [16] and follows strong steps for testing mediation [17] to make sure the results are good.
The study gives three significant contributions. First, it uses ideas from environmental psychology [18] to show how digital tools change how people see brands. Second, it proves that brand attractiveness is an important part of why people stay with a brand after playing digital games. Third, it helps businesses see which types of digital gamification work best, so they can use their money and time wisely in digital marketing.
This is useful for stores in Malaysia that are trying to keep Millennial customers. It shows which game-like tools work best to make a brand more attractive, like comparing AR and VR. This helps shops decide where to spend money for better results. The study also explains how and why these tools help people stay loyal, showing that both the technology and the feelings it creates matter.
So, this study gives new ideas about how digital tools with game parts can help reduce customer loss in Malaysian stores. It shows clearly how brand attractiveness fits into this by using the PLS-SEM method. It also helps store owners plan better by showing how each digital tool (AR, MA, OC, SM, VR) uses games to make people more engaged and more likely to stay. To guide this investigation, the following research questions have been formulated:
RQ1: How does Augmented Reality influence Brand Attractiveness?
RQ2: How do Mobile Apps influence Brand Attractiveness?
RQ3: How do Online Communities influence Brand Attractiveness?
RQ4: How does Social Media influence Brand Attractiveness?
RQ5: How does Virtual Reality influence Brand Attractiveness?
RQ6: How does Brand Attractiveness influence Customer Churn Reduction?
RQ7: Does Brand Attractiveness mediate the relationship between digitalised content strategies and Customer Churn Reduction?
2. Materials and Method
This study is based on the Stimulus-Organism-Response (S-O-R) model underpin theory [18]. The model (Figure 1) explains how things around people, called stimuli, can affect how they feel or think on the inside, which then changes how they act. In this case, digital content strategies are seen as stimuli. These include online features that are fun, interesting, or interactive. These strategies can change how much people like or feel connected to a brand, which is the internal state or organism part of the model. When people feel more positive about a brand, they are less likely to stop using it. This is the response. The S-O-R model is helpful because it gives a clear way to understand how digital and gamified tools lead to changes in behaviour. This is important when studying Millennials, because they often use digital platforms and respond strongly to engaging content. So, by looking at how digital experiences affect feelings about a brand, and how that leads to customers staying longer, the study gives a better understanding of how to keep customers through digital methods.
2.1. Augmented Reality (AR) and Brand Attractiveness
The relationship between Augmented Reality (AR) and brand attractiveness is now receiving more attention in marketing research. Several studies have shown how AR can change the way people view brands and help improve brand outcomes. For example, Caboni et al. [19] showed that using AR in marketing can increase brand awareness, strengthen brand associations, improve perceived quality, and boost brand loyalty. These aspects are important for building positive consumer attitudes toward a brand. Yuan et al. [20] also found that when people enjoy using AR in shopping, they feel more connected to the brand. This emotional connection makes the brand more attractive.
In retail, AR is often used for virtual try-ons. This helps customers see how products look or fit before buying. Rhee and Lee [21] found that using virtual fitting tools increased purchase intentions and brand advocacy. This suggests that improved shopping experiences through AR can enhance brand attractiveness, especially among younger consumers like Millennials. From a theoretical perspective, Prasad et al. [22] employed the Stimulus-Organism-Response (S-O-R) framework to explain how AR attributes such as interactivity, vividness, and media richness serve as stimuli that increase experiential value and, in turn, strengthen brand equity. These findings confirm that enhanced consumer experiences foster stronger emotional bonds with brands, reinforcing their attractiveness [23,24,25,26]. Thus, the following hypothesis is proposed:
H1.
Augmented Reality positively influences Brand Attractiveness.
2.2. Mobile Applications (MA) and Brand Attractiveness
Mobile applications have emerged as a critical tool for enhancing customer engagement and strengthening brand attractiveness. Ho and Chung [27] highlighted that customer engagement with mobile apps significantly affected repurchase intentions, suggesting that active engagement fostered stronger emotional connections with consumers and enhanced brand attractiveness. Similarly, Boateng et al. [28] applied attachment theory to show that experiential value and brand attachment acted as key mediators in building brand loyalty, which is closely linked to perceived brand attractiveness.
Further supporting the role of mobile applications in driving brand outcomes, Boonsiritomachai and Sud-On [29] found that hotel-branded mobile apps positively influenced purchase intentions and word-of-mouth communication. This indicated that mobile apps improved brand visibility and consumer trust, both of which are important for building brand attractiveness. Tiwari et al. [30] extended this understanding by examining the idea of technology product “coolness.” They showed that the perceived coolness of mobile apps significantly enhanced emotional attachment and positive brand views, which contributed to brand attractiveness.
Some recent studies also looked at how mobile apps help build good service relationships and cognitive experiences. Ahn and Kwon [31] showed that different types of customer service features in mobile apps led to positive consumer behaviours. Ahn [32] also found that positive thinking experiences in food-related apps changed how people felt and behaved. These studies suggested that social presence and cognitive engagement in mobile apps are important for how people view a brand. Thus, the following hypothesis is proposed:
H2.
Mobile Applications positively influence Brand Attractiveness.
2.3. Online Communities (OC) and Brand Attractiveness
The relationship between online communities and brand attractiveness has received a lot of attention from researchers. Many studies focus on how consumer engagement, trust, and how the community works play a part in this. Bowden and Mirzaei [33] showed that when people take part in online brand communities, they see the brand in a better way. This is because they have more personal and meaningful interactions with the brand. Chavadi et al. [34] used the S-O-R model to show that brand communities on social media help build trust and brand value. These changes then affect what people decide to buy. These findings show that being part of a community helps people trust a brand more and see more value in it. This makes the brand more attractive.
Some other research looks at how trust helps connect online communities and consumer actions. Kamalasena and Sirisena [35] found that taking part in online groups and reading what others say online helps people want to buy something. This happens because they start to trust the brand. Trust is the key link between joining a community and finding the brand attractive. Bao and Wang [36] looked at people who join brand microblogs. They found that when people feel connected and trust the brand, they are more likely to take part. This makes the relationship with the brand stronger and helps people see the brand as more attractive [37,38,39].
Some new studies look at how talking about sustainability and group identity in online spaces helps brand attraction [40,41]. Taken together, these studies show that online communities make a brand more attractive by helping people stay involved, building trust, showing expert voices, and sharing clear messages about values like sustainability. Based on the reviewed literature, the following hypothesis is proposed:
H3.
Online Communities positively influence Brand Attractiveness.
2.4. Social Media (SM) and Brand Attractiveness
Social media plays an important role in shaping how consumers see and feel about brands. It allows brands to connect with consumers through quick, two-way conversations. These real-time interactions help build trust and make brands seem more open and genuine. Kapuściński et al. [42] found that the way a brand responds on social media, including the tone of messages and the gender of spokespersons, can make a difference in how attractive people find the organisation. Similarly, Santiago and Serralha [43] also showed that when brands use real content and focus on good interactions, people think better of them.
The traits of social media influencers also matter a lot. Santiago and Serralha [43] found that how an influencer looks, how kind they seem, and how much they are like their followers all affect how believable they are. Nugroho et al. [44] agreed with this. They found that when influencers look good, seem skilled, and act in a trustworthy way, it helps people see the brand in a better light and makes Millennials more likely to buy. These studies show that influencers do more than just promote products. They help brands make stronger and more positive links with people [45,46,47]. Based on these studies, the following hypothesis is suggested:
H4.
Social Media positively influences Brand Attractiveness.
2.5. Virtual Reality (VR) and Brand Attractiveness
Virtual reality (VR) got a lot of attention in research because of how it helps make brands more attractive, especially in retail. VR gives brands a way to create real-looking and fun shopping spaces that catch the interest of customers. Yuan et al. [20] found that when people enjoy VR shopping, they feel a stronger sense of ownership, which is closely linked to brand attractiveness. They also found that emotional connection with a brand makes this link even stronger. Jin et al. [48] showed that VR made stores seem more appealing, even if people had not heard of the brand before. These studies showed that VR, by offering deep and fun experiences, helps brands build closer emotional ties with customers.
In shops, the experience people have mattered a lot for how they connect with the brand. Rhee and Lee [21] found that people who liked virtual fitting tools were more likely to act positively toward the brand. This means that VR can help make brands more attractive by making shopping more enjoyable. Pahlevi et al. [49] also found that VR trips made places look more appealing to visitors. This shows that good VR settings can help people see brands in a better way across different fields. In retail, brands can use the same idea to give customers fun and rich experiences that stay in their memory [50,51].
Millennials make up a big part of today’s shoppers, and they respond well to new tech experiences. They know how to use digital tools and like brands that give them something fun and interactive [52]. Since Millennials are open to tech and want exciting experiences, VR is a strong way for brands to make themselves more attractive. Based on these insights, the following hypothesis is proposed:
H5.
Virtual Reality positively influences Brand Attractiveness.
2.6. Brand Attractiveness and Customer Churn Reduction
In today’s retail market, especially among Millennials, brand attractiveness is a key factor in helping reduce customer churn. Chuah et al. [37] found that the attractiveness of brand fan pages helped increase customer engagement. This was important for lowering resistance and keeping people involved with the brand. Their study showed that while good-looking content matters, quick replies and changes based on what customers want are even more important. These things helped people stay more engaged and less likely to leave the brand. For Millennials, who want fun and personal experiences, how fast and flexible a brand is plays a big role in building loyalty and lowering churn.
Besides engagement, being seen as real or true also matters for keeping customers. Uysal and Okumuş [53] showed that when people saw a brand as honest and based on real values, they were more satisfied and loyal. Brands that seem real and care about values match well with what Millennials want. This makes them more likely to stay with the brand and less likely to leave. In today’s market, many Millennials prefer brands that share their personal and social values. Because of this, being honest and value-driven is important for keeping them from switching to other brands.
Online shopping has also made brand attractiveness even more important for reducing churn. Ke et al. [54] found that when people saw bad reviews or low ratings, they were less likely to buy again. This means that how people see a brand online, including what others say about it, can directly affect churn. Since Millennials often use online platforms and pay attention to reviews, bad feedback can quickly change their minds. This shows that brands need to watch their online image and keep service levels high to stop customers from leaving.
Emotional bonds formed through social media and one-sided relationships with influencers also help improve brand attractiveness and reduce churn [55,56]. Based on the reviewed literature, it is proposed that:
H6.
Brand Attractiveness positively influences Customer Churn Reduction.
2.7. Mediating Role of Brand Attractiveness
Mediators help explain how and why one thing affects another in research models. Hair et al. [57] said that looking at mediation makes models better and helps show hidden links between variables. Memon et al. [15] also pointed out that adding a factor like Brand Attractiveness helps us understand how something like Customer Churn Reduction happens. Studying these in-between links not only makes the model stronger but also fits with the Stimulus-Organism-Response (S-O-R) model [18]. In this model, outside factors like digital content affect what people do through changes in their thoughts or feelings. Based on this idea, the review below looks at how Brand Attractiveness acts as a link between different digital tools and lower customer churn.
Augmented Reality (AR) has become a popular digital tool in retail. Some studies showed that AR makes customer experiences better by adding things like touch, sound, and active use [19,20]. These experiences helped people feel more connected to brands, which made the brands seem more attractive [21,22]. Because AR increases brand attractiveness, it likely helps lower churn for Millennials, who like new and exciting digital tools.
Mobile apps are also a keyway to keep people interested. Studies found that well-made apps helped people stay involved and loyal because they had good brand experiences [27,28]. Easy-to-use apps made brands seem modern and reliable, which made people like them more [29,30]. So, it is likely that Brand Attractiveness explains how mobile app use leads to fewer customers leaving.
Online communities give people a space to share and connect with brands. Bowden and Mirzaei [33] found that taking part in these groups made people more engaged and emotionally close to the brand. Other studies showed that being in social media brand groups helped build trust and made brands seem more valuable [34,35]. When people are active in these spaces, they are more likely to find brands attractive. This leads to more loyalty and less churn [36]. Because of this, Brand Attractiveness may be the link between joining these groups and staying with the brand.
Social media is also a big part of how brands and customers connect, especially for Millennials. Influencer marketing and online brand posts helped people trust brands and think better of them [37,38]. These tools made brands seem more real, honest, and close to people [39,40]. Also, when people follow digital influencers or see posts from other users, they often feel closer to the brand, which helps lower churn [42,43,44]. So, Brand Attractiveness might be what explains how social media efforts reduce customer loss.
Virtual Reality (VR) has changed how customers see and connect with brands. VR lets brands give fun and full experiences that make people feel more involved and connected [48,49]. Studies said that these deep experiences helped people like the brand more and stay longer [50,51]. VR also helped users form personal links with brands, which led to loyalty and fewer people leaving [52]. Because of this, Brand Attractiveness may explain how VR tools help reduce churn. Thus, the following hypotheses are stated:
H7a.
Brand Attractiveness mediates the relationship between Augmented Reality and Customer Churn Reduction.
H7b.
Brand Attractiveness mediates the relationship between Mobile Apps and Customer Churn Reduction.
H7c.
Brand Attractiveness mediates the relationship between Online Communities and Customer Churn Reduction.
H7d.
Brand Attractiveness mediates the relationship between Social Media and Customer Churn Reduction.
H7e.
Brand Attractiveness mediates the relationship between Virtual Reality and Customer Churn Reduction.
2.8. Methodology
This study used a quantitative, cross-sectional design to look at how digital content strategies affect Brand Attractiveness and Customer Churn Reduction. A survey was used to collect data. This method works well for getting standard answers from many people in a short time [58]. The study followed a positivist approach, which focuses on facts, testing ideas, and making findings that apply more widely [59].
A structured questionnaire was used to get data from Millennial consumers living in Klang Valley, Malaysia. The survey had three parts. The first part asked about age, gender, and other personal details. The second part asked about five digital content strategies: Augmented Reality, Mobile Apps, Online Communities, Social Media, and Virtual Reality. The last part measured the middle variable, Brand Attractiveness, and the outcome, Customer Churn Reduction. All questions were scored using a five-point scale, from 1 (strongly disagree) to 5 (strongly agree). The questions were taken from earlier studies that had already tested them [60,61,62].
Before the main survey, a small test was done to check if the questions were clear and worked well. Thirty people took part in this pre-test. They were similar to the target group. Reliability was checked using McDonald’s Omega (ω), which gives better results than Cronbach’s Alpha when items vary in strength [63,64]. All constructs had Omega values above 0.70, which means the reliability was acceptable [65]. The results were: Augmented Reality (ω = 0.82), Mobile Apps (ω = 0.80), Online Communities (ω = 0.79), Social Media (ω = 0.84), Virtual Reality (ω = 0.86), Brand Attractiveness (ω = 0.88), and Customer Churn Reduction (ω = 0.81). These values showed that the survey was good enough for the full study.
The study focused on Millennials, people born between 1981 and 1996 [12]. This group was chosen because they are a big part of the market and use digital tools often. The needed sample size was worked out using G*Power [66], with a medium effect size (f² = 0.15), power of 0.80, and error level of 0.05. This showed that at least 92 people were needed. But, following suggestions for bigger samples in complex models [66], the study collected 306 valid responses to get stronger and more reliable results.
People were chosen using convenience sampling. They were Millennials living in Klang Valley. Even though random sampling is usually better for wider use of results, it is not always possible. Calder et al. [67] said that being typical of the population is not always needed when the goal is to test a theory. Based on this idea, a non-random method was used because the study aimed to test ideas, not to speak for the whole population [68]. In many social studies, using a theory in a new setting is more important than random selection.
The data was analysed using Partial Least Squares Structural Equation Modelling (PLS-SEM) with SmartPLS 4 [69]. PLS-SEM was chosen because it works well with complex models and is useful for testing and predicting results [70]. It also does not need the data to follow a normal curve, which is helpful in surveys where the data is often not normal [70,71,72,73].
The analysis had two steps. First, the measurement model was checked. This looked at item strength, reliability (Composite Reliability), convergence (Average Variance Extracted, AVE), and uniqueness (Heterotrait-Monotrait ratio, HTMT). Next, the structural model was tested by looking at link strengths, R² values, effect sizes (f²), and prediction (Q²) [74].
This method gave a strong setup for studying how digital tools with game-like features affect Brand Attractiveness and, through it, lower Customer Churn. The results are expected to help retail companies find better ways to keep Millennials loyal by using smart digital strategies.
3. Results and Discussion
Partial Least Squares Structural Equation Modelling (PLS-SEM) was used to test both the measurement and structural models by using SmartPLS 4 software [69]. This method was chosen because it works well with data that are not normally distributed, which is common in surveys [70].
Since all the data came from one source, the possibility of common method bias (CMB) was checked before the main analysis (Table 1). Following the guidance of Kock and Lynn [75,76], a full collinearity test was done. This method involves checking how much each variable overlaps with a common factor by calculating the variance inflation factor (VIF). If VIF values are 5 or below, it means there is no serious CMB problem. In this study, the VIF values ranged from 1.615 to 3.994, which are within the safe range. Therefore, the risk of bias from using one source is low, and the study’s findings can be considered reliable.
3.1. Demographic Analysis
A total of 306 valid responses were collected for the study (see Table 2). In terms of gender, the sample was relatively balanced, comprising 52.9% male and 47.1% female respondents. With respect to race, the majority identified as Malay (54.6%), followed by Chinese (37.6%), Indian (5.6%), and other ethnicities (2.3%).
In terms of marital status, 51.0% of the respondents were married, 47.7% were single, and 1.3% were divorced. The highest level of education attained by the majority was a bachelor’s degree (51.3%), followed by a master’s degree (31.0%), doctoral degree (7.2%), diploma (8.2%), and secondary education (2.3%). Regarding employment status, 71.2% of respondents were employed in the private sector, 14.4% in the government sector, 11.4% were self-employed, 1.3% were unemployed, 0.7% were retired, and 1.0% identified as housewives.
For monthly personal income, 4.9% of respondents reported earning RM 2,000 or less, 18.6% earned between RM 2,001 and RM 4,000, 29.1% reported earnings between RM 4,001 and RM 6,000, 17.3% between RM 6,001 and RM 8,000, 12.7% between RM 8,001 and RM 10,000, and 12.4% reported earnings of RM 10,001 and above. Additionally, 4.9% indicated having no income. Age-related information was not collected in the survey. This decision was made as the study specifically targeted Millennials, defined as individuals born between 1981 and 1996, thus ensuring that all respondents fell within the same generational cohort. As such, there was no necessity to further stratify the sample by age range.
These demographic characteristics reflect a diverse and representative sample of the Millennial population residing in Klang Valley, Malaysia.
3.2. Measurement Model Assessment
The The analysis began with an evaluation of the measurement model to check the reliability and validity of the research constructs, based on the guidelines from Hair et al. [70] and Ramayah et al. [73]. After this, the structural model was tested to see if the proposed relationships held true.
First, reliability at the item level was checked using outer loadings. All loadings were above the recommended minimum of 0.50 [77], which showed that each item was reliable on its own (Table 3). Next, convergent validity was tested using the Average Variance Extracted (AVE). This test checks how much of the indicator’s variation is explained by the construct, compared to error [77]. Each construct showed an AVE above the 0.50 threshold, meaning more than half the variance was captured (Table 3). Internal consistency was tested using Composite Reliability (CR). All CR values were above the 0.70 cut-off, showing strong reliability [65,70]. The CR scores ranged from 0.875 for Mobile App to 0.970 for Brand Attractiveness (Table 3). These results align with recent studies that suggest CR and McDonald’s Omega give better estimates of consistency than older methods like Cronbach’s Alpha [63,64].
The discriminant validity (HTMT) results in Table 4 showed that most construct pairs exhibited values below the recommended threshold of 0.90 [70,73], supporting adequate discriminant validity. However, the HTMT value between Virtual Reality and Augmented Reality was slightly higher at 0.918. To further verify discriminant validity, the bootstrapped 90% confidence interval was examined. The analysis showed that the upper limit did not exceed 1, confirming that the overlap between these two constructs remains within acceptable boundaries.
Together, these results confirmed that the measurement model was reliable and valid.
3.3. Structural Model Assessment
The test for multivariate skewness and kurtosis showed that the data did not follow a normal distribution. Mardia’s multivariate skewness (β = 11.2117, p < 0.05) and kurtosis (β = 84.4682, p < 0.05) were both significant, which confirmed that the data was not normally distributed. Because of this, the study used bootstrapping with 10,000 resamples to get stable estimates for path values, standard errors, t-values, and p-values. This followed the guidelines of Becker et al. [72] and Hair et al. [70].
As shown in Table 5 and Figure 2, the path results gave mixed support for the study’s hypotheses. Mobile Apps (β = 0.269, p < 0.05), Online Communities (β = 0.275, p < 0.05), Social Media (β = 0.117, p < 0.05), and Virtual Reality (β = 0.275, p < 0.05) had a significant and positive impact on Brand Attractiveness. These findings supported H2, H3, H4, and H5. However, Augmented Reality (β = –0.135, p < 0.05) had a negative effect, so H1 was not supported. Brand Attractiveness had a strong and positive effect on Customer Churn Reduction (β = 0.687, p < 0.05), which confirmed H6. These results were supported by the 95% bias-corrected confidence intervals, where significance was confirmed as none of the intervals crossed zero.
Effect sizes (f²) were interpreted using Chin’s [78] guideline: 0.02 = small, 0.15 = medium, and 0.35 = large. Brand Attractiveness had a large effect on Customer Churn Reduction (f² = 0.896). Mobile Apps (f² = 0.081), Online Communities (f² = 0.072), and Virtual Reality (f² = 0.034) had small effects. Augmented Reality (f² = 0.008) and Social Media (f² = 0.013) had no meaningful effect. Collinearity was checked using VIF values. All values were below 5, ranging from 1.457 to 3.893 [70,76], which showed that multicollinearity was not an issue.
Although Social Media had a significant positive effect on Brand Attractiveness, the effect size (f² = 0.013) was below the 0.02 level, meaning the effect was small. This suggests that while social media helped shape brand perceptions for Millennials in Klang Valley, its practical effect was smaller compared to other digital tools. The same was true for Mobile Apps, Online Communities, and Virtual Reality, which also showed small effect sizes. Still, in studies on consumer behaviour, small effects are common and can still give useful insights when looked at together [70]. Even with small individual effects, the model had good explanatory power, as shown by the R², which support the model’s usefulness.
The R² results showed that 38.7% of the change in Brand Attractiveness and 47.3% of the change in Customer Churn Reduction were explained by the model. This shows moderate strength, based on Hair et al.’s [70] standards.
The findings offered useful insights into how digital content strategies influence Brand Attractiveness and help lower churn. Mobile apps, online communities, social media, and virtual reality all showed positive effects. These results support earlier studies that found mobile apps enable personal engagement [27], online communities build a sense of belonging [33], social media supports direct interaction [36], and virtual reality provides immersive brand experiences [48].
However, the negative effect of Augmented Reality on Brand Attractiveness was unexpected. Although AR is often seen as new and exciting, this suggests that not all AR features are welcomed by users. Poor design, confusing interfaces, or unclear benefits may have frustrated users and weakened their view of the brand [19,20,21]. This highlights the need for AR to be user-friendly and well-aligned with the customer journey, especially for Millennials who expect smooth and valuable digital experiences [13].
The strong positive link between Brand Attractiveness and Customer Churn Reduction also supports previous findings that emotional and mental engagement leads to stronger loyalty [10,11]. As Millennials tend to switch brands easily and face few barriers online, making a brand more attractive is vital for keeping their loyalty [14]. In summary, the analysis confirmed that strong digital content strategies can help attract and retain Millennial consumers in Klang Valley. Brands that use mobile apps, online communities, social media, and virtual reality effectively are likely to boost brand appeal and reduce churn. However, they must be cautious in using augmented reality, to avoid damaging the brand. These findings offer practical guidance for both local and global retailers in connecting better with Millennial customers [12].
For mediation test, it was done to check how Brand Attractiveness works as a link between digital content strategies and Customer Churn Reduction. Table 6 showed that the mediation effects were significant for Mobile Apps (β = 0.185, p < 0.05), Online Communities (β = 0.189, p < 0.05), Social Media (β = 0.080, p < 0.05), and Virtual Reality (β = 0.189, p < 0.05). These results supported H7b to H7e. But the effect for Augmented Reality was negative (β = –0.093, p < 0.05), which went against the expected positive link, so H7a was not supported. This test confirmed that Brand Attractiveness plays an important part in how digital strategies affect churn. Even though the effect sizes (v²) were small, between 0.034 and 0.036 they still mattered. According to Preacher and Kelley [79] and Kenny [80], 0.01 is already a small but meaningful effect. In marketing and social research, small mediation effects are common, especially in studies about complex consumer behaviour [70].
These results show that Brand Attractiveness plays a key role in building customer loyalty. Even small improvements in how a brand looks or feels can help reduce churn over time. This matters especially for Millennials in Klang Valley, who are tech-savvy, come from different backgrounds, and have varied income and education levels [12,14]. They expect smooth and engaging digital experiences, so even slight changes in how they view a brand can affect their loyalty [13].
Although Social Media showed a statistically significant mediation effect through Brand Attractiveness (H7d), the effect size was very small (v² = 0.006) and below the level needed for practical impact [79,80]. This means the link is real, but weak. In large samples, small effects can still appear significant. However, from a business point of view, this suggests that social media, while useful for spreading brand messages [36,41], may not be very effective in reducing churn. The failure of Augmented Reality to show a positive mediation effect (H7a) highlights the need for better design. Millennials expect digital tools that are simple and helpful [13], and AR features that are hard to use or not clearly useful may harm their view of the brand [19,22,25]. This shows that creativity alone is not enough [17]. Brands must also focus on usefulness and ease of use so that new technology adds value rather than causes frustration [25].
3.4. PLS Predictive Assessment
Following the procedure outlined by Shmueli et al. [74], PLS predict was employed to assess the out-of-sample predictive performance of the model (see Table 7). The 10-fold cross-validation technique was applied, generating case-level predictions for the measurement items related to both Brand Attractiveness (BA) and Customer Churn Reduction (CC). Predictive power was evaluated by comparing the prediction errors of the PLS-SEM model to those of a linear model (LM). According to Shmueli et al. [74], predictive power is classified as strong when all prediction errors (PLS-LM) are lower; moderate when the majority are lower; low when only a minority are lower; and absent when none are lower.
For the Brand Attractiveness construct (BA1 to BA5), the results indicated that four out of five indicators (BA2, BA3, BA4, and BA5) demonstrated lower prediction errors under the PLS model compared to the LM model, while BA1 recorded a higher error. Consequently, the model can be considered to exhibit moderate predictive power, approaching the threshold for strong predictive ability. In contrast, for Customer Churn Reduction (CC1 to CC5), only two indicators (CC2 and CC5) exhibited lower prediction errors in the PLS model relative to the LM benchmark. This outcome suggests that the model’s predictive power for Customer Churn Reduction is low according to the classification guidelines. However, it is important to note, as Shmueli et al. [74] highlighted, that the primary aim of PLS-SEM is to balance both explanatory and predictive capabilities. While low predictive power may indicate limitations in forecasting new observations for this construct, it does not invalidate the model’s explanatory strength, which remains essential for theory testing and development. Furthermore, model adjustments focused solely on predictive improvements could risk undermining theoretical coherence.
Additionally, the Q² Predict values for both constructs were positive, reinforcing the model’s predictive relevance. Specifically, the Q² Predict values ranged from 0.254 to 0.368 for Brand Attractiveness, and from 0.124 to 0.208 for Customer Churn Reduction. These positive Q² Predict values, coupled with prediction error values near zero, affirm that the model possesses acceptable predictive accuracy and practical relevance.
4. Conclusions
This study gave important input to the growing research on how digital tools with game-like features help reduce customer churn in the retail industry. By using the Stimulus-Organism-Response (S-O-R) model [18], the study showed how digital content strategies – Augmented Reality, Mobile Apps, Online Communities, Social Media, and Virtual Reality affect customer behaviour through Brand Attractiveness. While past studies mostly looked at direct effects between gamification and customer engagement [6,7], this research went further by showing how Brand Attractiveness works in the middle. It pointed out the emotional and mental responses that lead to loyalty. The study focused on the retail market in Klang Valley, Malaysia, and used real data from Millennial consumers. This group is known for using digital tools often and changing brands easily [14]. The results help make gamification research more useful in the real world and show that theories need to fit the retail setting.
From a business point of view, the findings give useful ideas to help retailers keep their customers and improve loyalty in a tough digital market. The strong positive results from Mobile Apps, Online Communities, Social Media, and Virtual Reality mean that stores should spend wisely on digital tools that are fun, social, and engaging. These tools are now a key part of staying competitive in the retail space. For brands that want to connect with Millennials who expect smooth and personal digital experiences [12,13] it is important to give them useful and enjoyable touchpoints. But the negative result for Augmented Reality is a warning. If AR tools are not easy to use or do not give clear value, they can make people dislike the brand. This shows the need to design AR features that are simple, helpful, and user-friendly [19,22]. This study gives managers a plan to follow use digital tools in a smart and balanced way to improve Brand Attractiveness and customer loyalty, which will help lower churn in fast-changing markets.
There are some limits to this study. First, the sample came from convenience sampling. While this method works well for testing ideas [67], the results may not apply to other groups beyond Millennials in Klang Valley. Future studies could use better sampling methods, like stratified or random sampling, to get a more complete picture. Second, the study was cross-sectional, meaning it used data from one point in time. This makes it hard to say what causes what. Studies that follow people over time could show how digital strategies and Brand Attractiveness change and affect churn in the long run. Third, this study only looked at five types of digital content. Future work could include new technologies such as AI-based personalisation, blockchain loyalty systems, or gamified shopping websites. Using interviews or focus groups could also help explain how people really feel about these tools and improve the theory. Lastly, comparing results from different types of retail businesses like clothing, food, or electronics could help show what digital strategies work best in each area.
Author Contributions
All authors contributed equally to the conception and design of the study. All authors have read and agreed to the published version of the manuscript.
Funding
This research received no external funding.
Institutional Review Board Statement
This study received ethical approval from [Research Management Centre, Multimedia University] (Ref: [EA0782024]). Participants provided written informed consent and were assured of confidentiality, voluntary participation, and the right to withdraw at any time.
Informed Consent Statement
Informed consent was obtained from all subjects involved in the study. Participation was voluntary, and all respondents were assured of confidentiality and anonymity in their responses.
Acknowledgments
The authors would like to thank the participating students and lecturers from the business programmes in Selangor for their valuable contributions to this study. Special appreciation is also extended to the administrative staff for their assistance during data collection.
Conflicts of Interest
The authors declare that there is no conflict of interest.
Patents:
This research did not result in any patents.
Transparency
The authors confirm that the manuscript is an honest, accurate, and transparent account of the study; that no vital features of the study have been omitted; and that any discrepancies from the study as planned have been explained. This study followed all ethical practices during writing.
References
- K. H. Idris Sazali, N. Z. Abu, A. Harith, A. Z. Azmi, M. H. Ishak, F. Anuar, and N. N. S. Nik Azuar, “The influence of green marketing on consumer purchasing behaviour among Millennials group in Klang Valley, Malaysia,” Int. J. Acad. Res. Econ. Manag. Sci., vol. 12, no. 3, pp. 120–132, 2023. [CrossRef]
- N. A. Abdul, M. A. Ibrahim, and H. A. Manan, “Effects of Digital Customer Experience on Malaysian Millennials E-Loyalty: Examining the Premium Fashion Brands Online Stores,” Sustain. Bus. Soc. Emerg. Econ., vol. 4, no. 3, pp. 693–706, 2022. [CrossRef]
- N. Sarkis, N. Jabbour Al Maalouf, E. Saliba, and J. Azizi, “The impact of augmented reality within the fashion industry on purchase decisions, customer engagement, and brand loyalty,” Int. J. Fash. Des. Technol. Educ., pp. 1–10, 2025. [CrossRef]
- N. Y. M. Siu, T. J. Zhang, and R. S.-P. Yeung, “The bright and dark sides of online customer engagement on brand love,” J. Consum. Mark., vol. 40, no. 7, pp. 957–970, 2023. [CrossRef]
- T. P. Tran, J. E. Zemanek, and M. N. Sakib, “Improving brand love through branded apps: is that possible?,” J. Mark. Anal., pp. 1–21, 2024. [CrossRef]
- J. Koivisto and J. Hamari, “The rise of motivational information systems: A review of gamification research,” Int. J. Inf. Manage., vol. 45, pp. 191–210, 2019. [CrossRef]
- N. Xi and J. Hamari, “Does gamification satisfy needs? A study on the relationship between gamification features and intrinsic need satisfaction,” Int. J. Inf. Manage., vol. 46, pp. 210–221, 2019. [CrossRef]
- A.D. Rachmadanty, A. A. Muhtar, and A. Agustina, “Examining the Impact of Gamification and Customer Experience on Customer Loyalty in E-commerce: Mediating Role of Customer Satisfaction,” J. Enterp. Dev., vol. 7, no. 1, pp. 180–191, 2025. [CrossRef]
- S. Punwatkar and M. Verghese, “Investigating the impact of gamification on customer engagement, brand loyalty and purchase intent in marketing,” J. Appl. Res. Technol., vol. 23, no. 1, pp. 94–102, 2025. [CrossRef]
- K. Desveaud, T. Mandler, and M. Eisend, “A meta-model of customer brand loyalty and its antecedents,” J. Bus. Res., vol. 176, 114589, 2024. [CrossRef]
- M. Karami, “Brand equity, brand loyalty and the mediating role of customer satisfaction: Evidence from medical cosmetics brands,” Res. J. Bus. Manage., vol. 9, no. 3, pp. 156–171, 2022. [CrossRef]
- Department of Statistics Malaysia, Current Population Estimates, Malaysia, 2021, Putrajaya, Malaysia: DOSM, 2021. [Online]. Available: https://www.dosm.gov.my/.
- S. Seyfi, T. Vo-Thanh, and M. Zaman, “Hospitality in the age of Gen Z: A critical reflection on evolving customer and workforce expectations,” Int. J. Contemp. Hosp. Manage., vol. 36, no. 13, pp. 118–134, 2024. [CrossRef]
- M. R. M. Johan, M. A. M. Syed, and H. M. Adnan, “Digital media and online buying considerations among Generation Z in Malaysia,” J. Intelek, vol. 17, no. 1, pp. 164–180, 2022. [CrossRef]
- M. A. Memon, J. H. Cheah, T. Ramayah, H. Ting, and F. Chuah, “Mediation analysis: Issues and recommendations,” J. Appl. Struct. Equ. Model., vol. 2, no. 1, pp. i–ix, 2018. [CrossRef]
- M. A. Memon, R. Salleh, M. Z. Mirza, J. H. Cheah, H. Ting, M. S. Ahmad, and A. Tariq, “Satisfaction matters: The relationships between HRM practices, work engagement and turnover intention,” Int. J. Manpow., vol. 42, no. 1, pp. 21–50, 2021. [CrossRef]
- S. U. Jung and V. Shegai, “The impact of digital marketing innovation on firm performance: Mediation by marketing capability and moderation by firm size,” Sustainability, vol. 15, no. 7, 5711, 2023. [CrossRef]
- A.Mehrabian and J. A. Russell, An Approach to Environmental Psychology. Cambridge, MA, USA: MIT Press, 1974.
- F. Caboni, V. Basile, H. Kumar, and D. Agarwal, “A holistic framework for consumer usage modes of augmented reality marketing in retailing,” Journal of Retailing and Consumer Services, vol. 80, Art. no. 103924, 2024. [CrossRef]
- C. Yuan, S. Wang, X. Yu, K. H. Kim, and H. Moon, “The influence of flow experience in the augmented reality context on psychological ownership,” International Journal of Advertising, vol. 40, no. 6, pp. 922–944, 2021. [CrossRef]
- H. L. Rhee and K. H. Lee, “Enhancing the sneakers shopping experience through virtual fitting using augmented reality,” Sustainability, vol. 13, no. 11, Art. no. 6336, 2021. [CrossRef]
- K. Prasad, A. S. Tomar, T. De, and H. Soni, “A conceptual model for building the relationship between augmented reality, experiential marketing and brand equity,” International Journal of Professional Business Review, vol. 7, no. 6, e01030, 2022. [CrossRef]
- J. Y. Zeng, Y. Xing, and C. H. Jin, “The impact of VR/AR-based consumers’ brand experience on consumer–brand relationships,” Sustainability, vol. 15, no. 9, Art. no. 7278, 2023. [CrossRef]
- T. H. Kim and H. Im, “Can augmented reality impact your self-perceptions? The malleability of the self and brand relationships in augmented reality try-on services,” Journal of Consumer Behaviour, vol. 23, no. 4, pp. 1623–1637, 2024. [CrossRef]
- P. A. Rauschnabel, V. Hüttl-Maack, A. C. Ahuvia, and K. E. Schein, “Augmented reality marketing and consumer–brand relationships: How closeness drives brand love,” Psychology & Marketing, vol. 41, no. 4, pp. 819–837, 2024. [CrossRef]
- Z. Jiang and J. Lyu, “The role of augmented reality app attributes and customer-based brand equity on consumer behavioural responses: An S-O-R framework perspective,” Journal of Product & Brand Management, vol. 33, no. 6, pp. 702–716, 2024. [CrossRef]
- M. H. W. Ho and H. F. L. Chung, “Customer engagement, customer equity and repurchase intention in mobile apps,” Journal of Business Research, vol. 121, pp. 13–21, 2020. [CrossRef]
- H. Boateng, J. P. Kosiba, D. R. Adam, K. S. Ofori, and A. F. Okoe, “Examining brand loyalty from an attachment theory perspective,” Marketing Intelligence & Planning, vol. 38, no. 4, pp. 479–494, 2020. [CrossRef]
- W. Boonsiritomachai and P. Sud-On, “Increasing purchase intention and word-of-mouth through hotel brand awareness,” Tourism and Hospitality Management, vol. 26, no. 2, pp. 265–289, 2020. [CrossRef]
- A.A. Tiwari, A. Chakraborty, and M. Maity, “Technology product coolness and its implication for brand love,” Journal of Retailing and Consumer Services, vol. 58, 102258, 2021. [CrossRef]
- J. Ahn and J. Kwon, “Examining the relative influence of multidimensional customer service relationships in the food delivery application context,” International Journal of Contemporary Hospitality Management, vol. 33, no. 3, pp. 912–928, 2021. [CrossRef]
- J. Ahn, “Impact of cognitive aspects of food mobile application on customers’ behaviour,” Current Issues in Tourism, vol. 25, no. 4, pp. 516–523, 2021. [CrossRef]
- J. Bowden and A. Mirzaei, “Consumer engagement within retail communication channels: an examination of online brand communities and digital content marketing initiatives,” European Journal of Marketing, vol. 55, no. 5, pp. 1411–1439, 2021. [CrossRef]
- C. A. Chavadi, M. Sirothiya, S. R. Menon, and V. M. R., “Modelling the Effects of Social Media–based Brand Communities on Brand Trust, Brand Equity and Consumer Response,” Vikalpa, vol. 48, no. 2, pp. 114–141, 2023. [CrossRef]
- B. D. T. M. Kamalasena and A. B. Sirisena, “The impact of online communities and e word of mouth on purchase intention of Generation Y: The mediating role of brand trust,” Sri Lanka Journal of Marketing, vol. 7, no. 1, pp. 92–116, 2021. [CrossRef]
- Z. Bao and D. Wang, “Examining consumer participation on brand microblogs in China: perspectives from elaboration likelihood model, commitment–trust theory and social presence,” Journal of Research in Interactive Marketing, vol. 15, no. 1, pp. 10–29, 2021. [CrossRef]
- S. H. W. Chuah, E. C. X. Aw, and M. L. Tseng, “The missing link in the promotion of customer engagement: the roles of brand fan page attractiveness and agility,” Internet Research, vol. 31, no. 2, pp. 587–612, 2021. [CrossRef]
- A.K. Bonus, J. Raghani, J. K. Visitacion, and M. C. Castaño, “Influencer marketing factors affecting brand awareness and brand image of start-up businesses,” Journal of Business and Management Studies, vol. 4, no. 1, pp. 189–202, 2022. [CrossRef]
- R. Huaman-Ramirez and D. Merunka, “Celebrity CEOs’ credibility, image of their brands and consumer materialism,” Journal of Consumer Marketing, vol. 38, no. 6, pp. 638–651, 2021. [CrossRef]
- C. Grădinaru, D. R. Obadă, I. A. Grădinaru, and D. C. Dabija, “Enhancing sustainable cosmetics brand purchase: a comprehensive approach based on the SOR model and the triple bottom line,” Sustainability, vol. 14, no. 21, p. 14118, 2022. [CrossRef]
- M. A. Khan, F. Alhathal, S. Alam, and S. M. Minhaj, “Importance of social networking sites and determining its impact on brand image and online shopping: an empirical study,” Sustainability, vol. 15, no. 6, p. 5129, 2023. [CrossRef]
- G. Kapuściński, N. Zhang, L. Zeng, and A. Cao, “Effects of crisis response tone and spokesperson's gender on employer attractiveness,” International Journal of Hospitality Management, vol. 94, p. 102884, 2021. [CrossRef]
- J. K. Santiago and T. Serralha, “What more influences the followers? The effect of digital influencer attractiveness, homophily and credibility on followers’ purchase intention,” Issues in Information Systems, vol. 23, no. 1, pp. 86–101, 2022. [CrossRef]
- S. D. P. Nugroho, M. Rahayu, and R. D. V. Hapsari, “The impacts of social media influencer’s credibility attributes on Gen Z purchase intention with brand image as mediation: Study on consumers of Korea cosmetic product,” International Journal of Research in Business and Social Science (2147-4478), vol. 11, no. 5, pp. 18–32, 2022. [CrossRef]
- É. Robinot, H. Boeck, and L. Trespeuch, “Consumer generated ads versus celebrity generated ads: Which is the best method to promote a brand on social media?” Journal of Promotion Management, vol. 29, no. 2, pp. 157–181, 2022. [CrossRef]
- F. A. Rizma and E. G. Marsasi, “The effect of trustworthiness to increase brand trust and purchase intention on social media promotion based on theory of persuasion in Generation Z,” Jurnal Manajemen (Edisi Elektronik), vol. 15, no. 1, pp. 61–81, 2024. [CrossRef]
- S. Ahmed, T. Islam, and A. Ghaffar, “Shaping brand loyalty through social media influencers: The mediating role of follower engagement and social attractiveness,” SAGE Open, vol. 14, no. 2, 2024. [CrossRef]
- B. Jin, G. Kim, M. Moore, and others, “Consumer store experience through virtual reality: its effect on emotional states and perceived store attractiveness,” Fashion and Textiles, vol. 8, no. 19, 2021. [CrossRef]
- A.S. Pahlevi, J. Sayono, and Y. A. L. Hermanto, “Design of a virtual tour as a solution for promoting the tourism sector in the pandemic period,” KnE Social Sciences, vol. 5, no. 6, pp. 368–374, 2021. [CrossRef]
- F. B. Escobar, O. Petit, and C. Velasco, “Virtual terroir and the premium coffee experience,” Frontiers in Psychology, vol. 12, 586983, 2021. [CrossRef]
- H. F. Lin, “Influence of virtual experience immersion, product control, and stimulation on advertising effects,” Journal of Global Information Management (JGIM), vol. 30, no. 9, pp. 1–19, 2022. [CrossRef]
- C. Yuan, S. Wang, Y. Liu, and J. W. Ma, “Factors influencing parasocial relationship in the virtual reality shopping environment: the moderating role of celebrity endorser dynamism,” Asia Pacific Journal of Marketing and Logistics, vol. 35, no. 2, pp. 398–413, 2023. [CrossRef]
- A.Uysal and A. Okumuş, “The effect of consumer-based brand authenticity on customer satisfaction and brand loyalty,” Asia Pacific Journal of Marketing and Logistics, vol. 34, no. 8, pp. 1740–1760, 2022. [CrossRef]
- D. Ke, H. Zhang, N. Yu, and others, “Who will stay with the brand after posting non-5/5 rating of purchase? An empirical study of online consumer repurchase behavior,” Information Systems and e-Business Management, vol. 19, pp. 405–437, 2021. [CrossRef]
- S. Shahid, Z. Nauman, and I. Ayyaz, “The impact of parasocial interaction on brand relationship quality: The mediating effect of brand loyalty and willingness to share personal information,” International Journal of Management Research and Emerging Sciences, vol. 13, no. 1, pp. 51–82, 2023. [CrossRef]
- B. Pardede and A. Aprianingsih, “The influence of K-pop artist as brand ambassador on affecting purchasing decision and brand loyalty (A study of Scarlett Whitening’s consumers in Indonesia),” International Journal of Management Research and Economics, vol. 1, no. 2, pp. 1–15, 2023. [CrossRef]
- J. F. Hair, G. T. M. Hult, C. M. Ringle, M. Sarstedt, and N. P. Danks, Partial Least Squares Structural Equation Modeling (PLS-SEM) Using R: A Workbook, 1st ed. Cham, Switzerland: Springer Nature, 2022.
- J. W. Creswell and J. D. Creswell, Research Design: Qualitative, Quantitative, and Mixed Methods Approaches, 6th ed. Thousand Oaks, CA, USA: Sage, 2022.
- M. Saunders, P. Lewis, and A. Thornhill, Research Methods for Business Students, 9th ed. Harlow, England: Pearson Education, 2023.
- M. Bruhn, V. Schoenmueller, and D. B. Schäfer, “Are social media replacing traditional media in terms of brand equity creation?,” Management Research Review, vol. 35, no. 9, pp. 770–790, 2012. [CrossRef]
- J. Hamari and J. Koivisto, “Why do people use gamification services?,” International Journal of Information Management, vol. 35, no. 4, pp. 419–431, 2015. [CrossRef]
- V. M. Sang and M. C. Cuong, “The influence of brand experience on brand loyalty in the electronic commerce sector: the mediating effect of brand association and brand trust,” Cogent Business & Management, vol. 12, no. 1, 2440629, 2024. [CrossRef]
- T. J. Dunn, T. Baguley, and V. Brunsden, “From alpha to omega: A practical solution to the pervasive problem of internal consistency estimation,” British Journal of Psychology, vol. 105, no. 3, pp. 399–412, 2014. [CrossRef]
- A.F. Hayes and J. J. Coutts, “Use Omega Rather than Cronbach’s Alpha for Estimating Reliability. But …,” Communication Methods and Measures, vol. 14, no. 1, pp. 1–24, 2020. [CrossRef]
- J. C. Nunnally, Psychometric Theory, 2nd ed. New York, NY, USA: McGraw-Hill, 1978.
- M. A. Memon, H. Ting, J. H. Cheah, R. Thurasamy, F. Chuah, and T. H. Cham, "Sample size for survey research: Review and recommendations," Journal of Applied Structural Equation Modeling, vol. 4, no. 2, pp. i–xx, 2020. [CrossRef]
- B. J. Calder, L. W. Phillips, and A. M. Tybout, “Designing research for application,” Journal of Consumer Research, vol. 8, no. 2, pp. 197–207, 1981. [CrossRef]
- J. Hulland, H. Baumgartner, and K. M. Smith, “Marketing survey research best practices: Evidence and recommendations from a review of JAMS articles,” Journal of the Academy of Marketing Science, vol. 46, no. 1, pp. 92–108, 2018. [CrossRef]
- C. M. Ringle, S. Wende, and J.-M. Becker, SmartPLS 4 [Computer software]. Boenningstedt, Germany: SmartPLS GmbH, 2022. [Online]. Available: https://www.smartpls.com/.
- J. F. Hair, G. T. M. J. F. Hair, G. T. M. Hult, C. M. Ringle, M. Sarstedt, and N. P. Danks, Partial Least Squares Structural Equation Modeling (PLS-SEM) Using R: A Workbook, 1st ed. Cham, Switzerland: Springer Nature, 2022.
- S. Cain, Z. Zhang, and K. Yuan, “Univariate and multivariate skewness and kurtosis for measuring nonnormality: Prevalence, influence and estimation,” Behavior Research Methods, vol. 49, no. 5, pp. 1716–1735, 2017. [CrossRef]
- J. M. Becker, J. H. Cheah, R. Gholamzade, C. M. Ringle, and M. Sarstedt, “PLS-SEM’s most wanted guidance,” International Journal of Contemporary Hospitality Management, vol. 35, no. 1, pp. 321–346, 2023. [CrossRef]
- T. Ramayah, J. Cheah, H. Ting, M. A. Memon, and M. Chuah, Partial Least Squares Structural Equation Modeling (PLS-SEM) Using SmartPLS 3.0: An Updated Guide and Practical Guide to Statistical Analysis, 2nd ed. Kuala Lumpur, Malaysia: Pearson, 2018.
- G. Shmueli, M. Sarstedt, J. F. Hair, J. H. Cheah, H. Ting, S. Vaithilingam, and C. M. Ringle, “Predictive model assessment in PLS-SEM: Guidelines for using PLSpredict,” European Journal of Marketing, vol. 53, no. 11, pp. 2322–2347, 2019. [CrossRef]
- N. Kock and G. S. Lynn, “Lateral collinearity and misleading results in variance-based SEM: An illustration and recommendations,” Journal of the Association for Information Systems, vol. 13, no. 7, pp. 546–580, 2012. [CrossRef]
- N. Kock, “Common method bias in PLS-SEM: A full collinearity assessment approach,” International Journal of e-Collaboration, vol. 11, no. 4, pp. 1–10, 2015. [CrossRef]
- C. Fornell and D. F. Larcker, “Evaluating structural equation models with unobservable variables and measurement error,” Journal of Marketing Research, vol. 18, no. 1, pp. 39–50, 1981. [CrossRef]
- W. W. Chin, “How to write up and report PLS analyses,” in Handbook of Partial Least Squares: Concepts, Methods and Applications in Marketing and Related Fields, V. Esposito Vinzi, W. W. Chin, J. Henseler, and H. Wang, Eds. Berlin, Germany: Springer, 2010, pp. 655–690. [CrossRef]
- K. J. Preacher and K. Kelley, “Effect size measures for mediation models: Quantitative strategies for communicating indirect effects,” Psychological Methods, vol. 16, no. 2, pp. 93–115, 2011. [CrossRef]
- D. A. Kenny, Mediation [Online]. Available: https://davidakenny.net/cm/mediate.htm, 2025.
Figure 1.
Research framework.
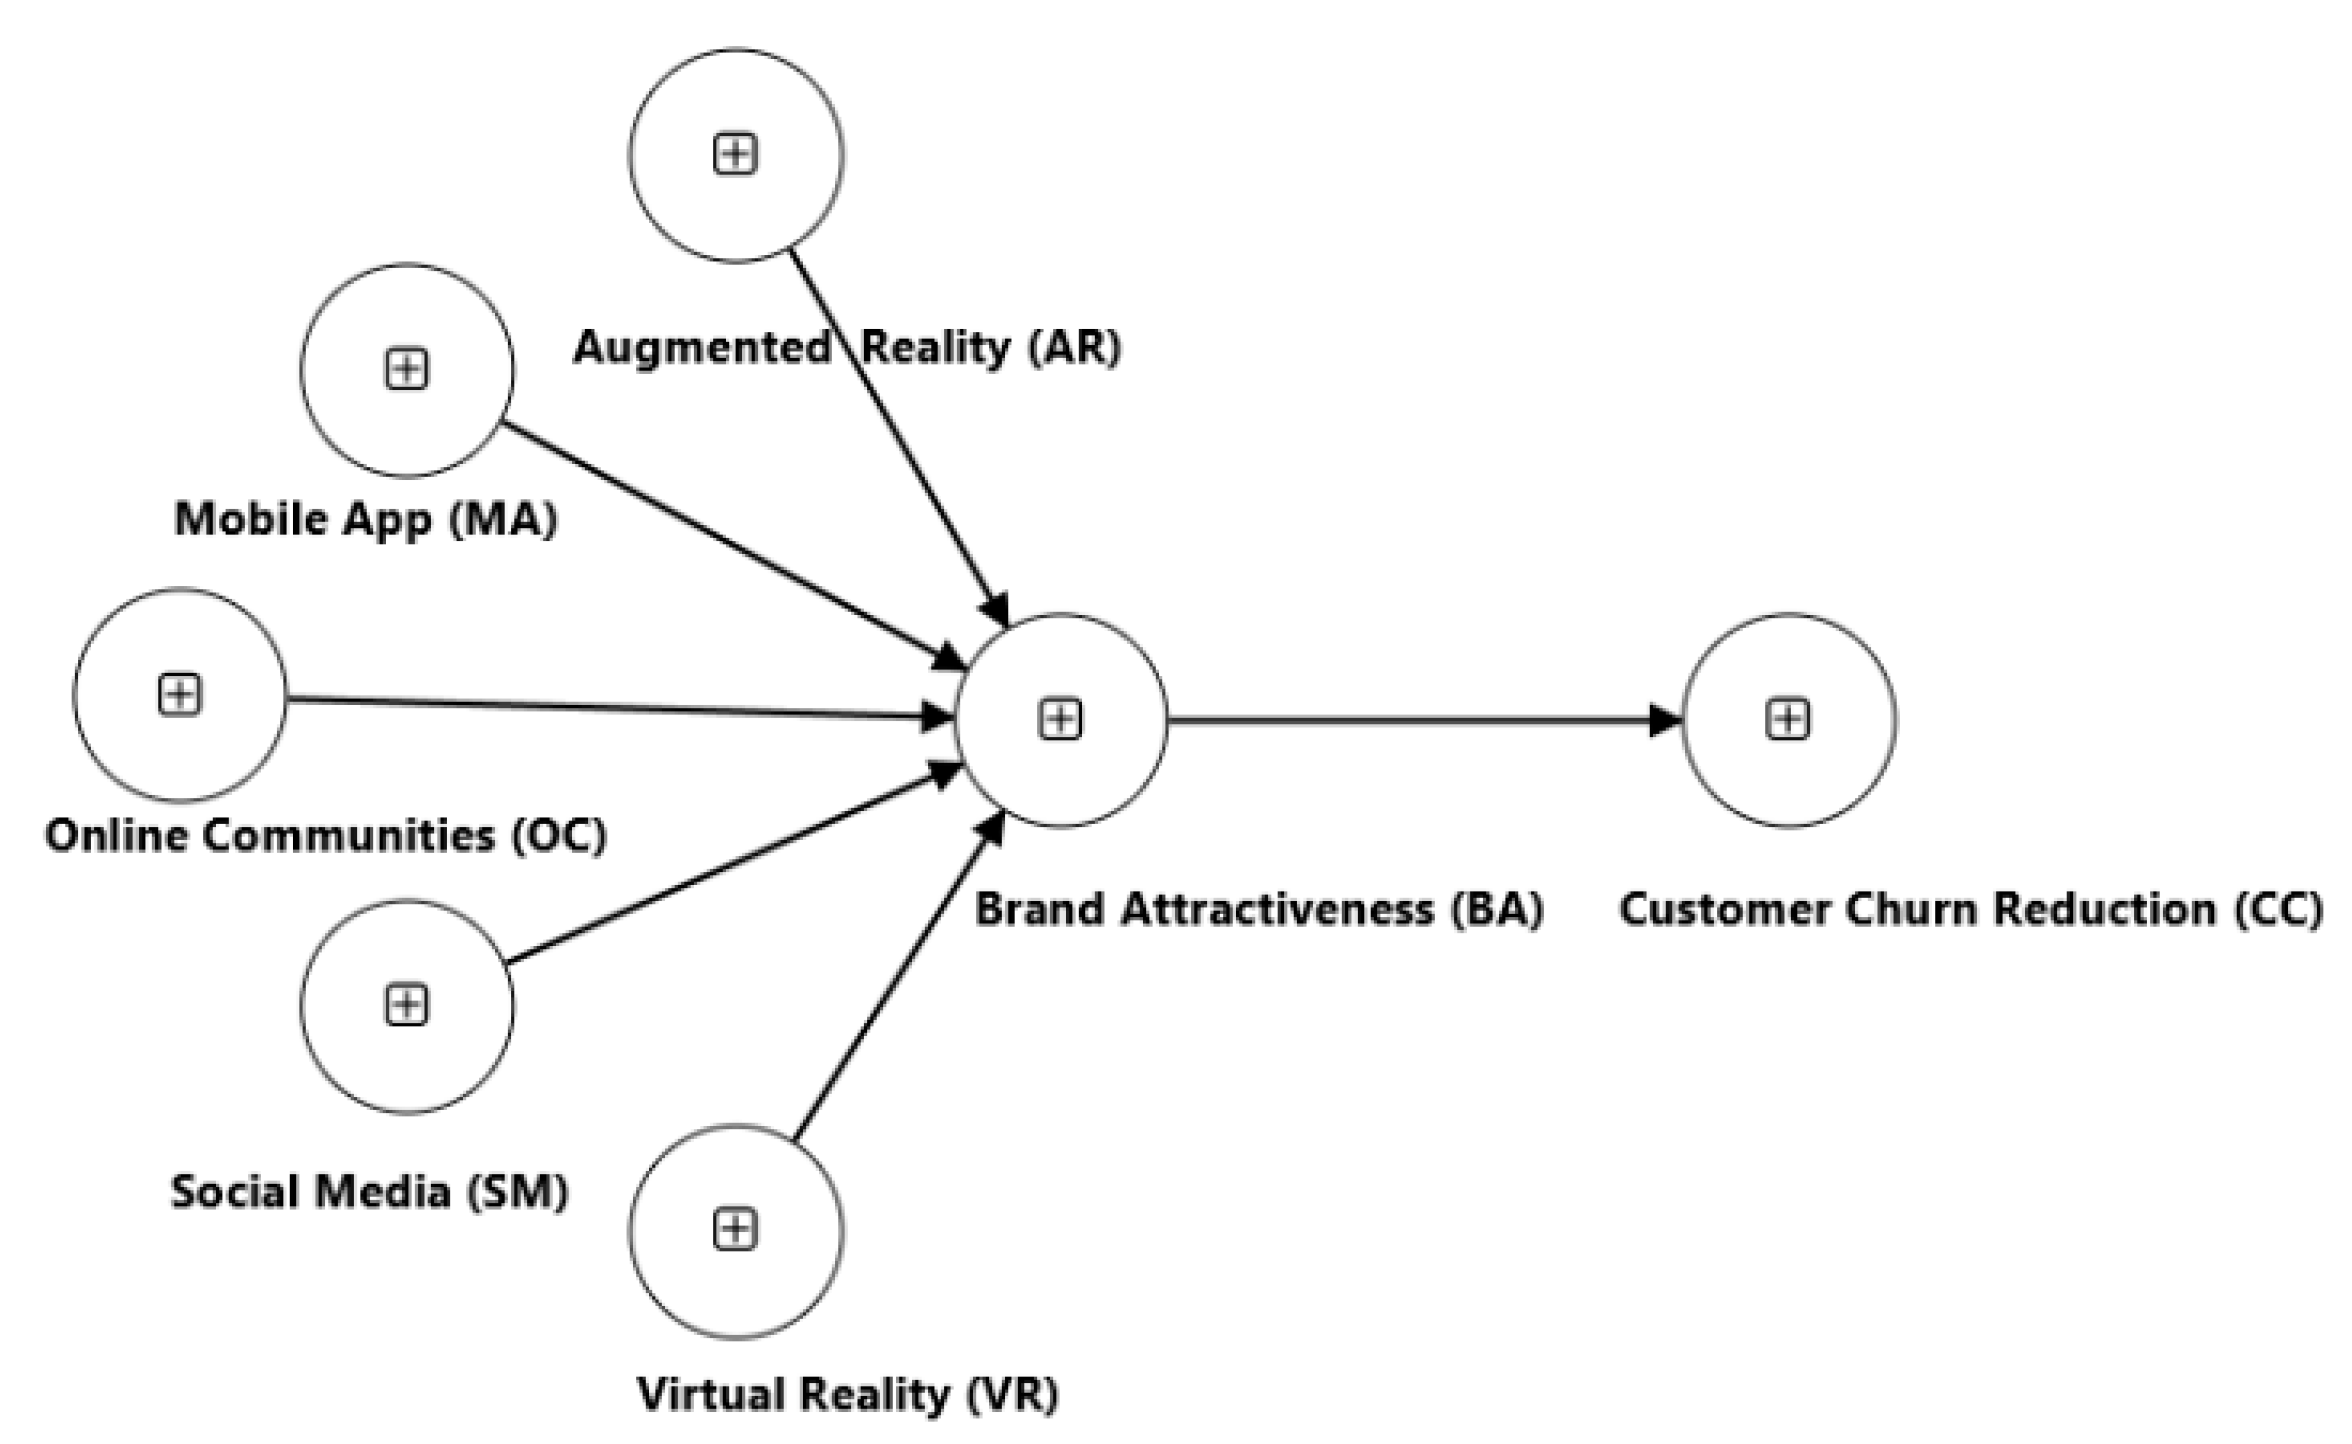
Figure 2.
Structural Model Assessment with Path Coefficients and P-value.
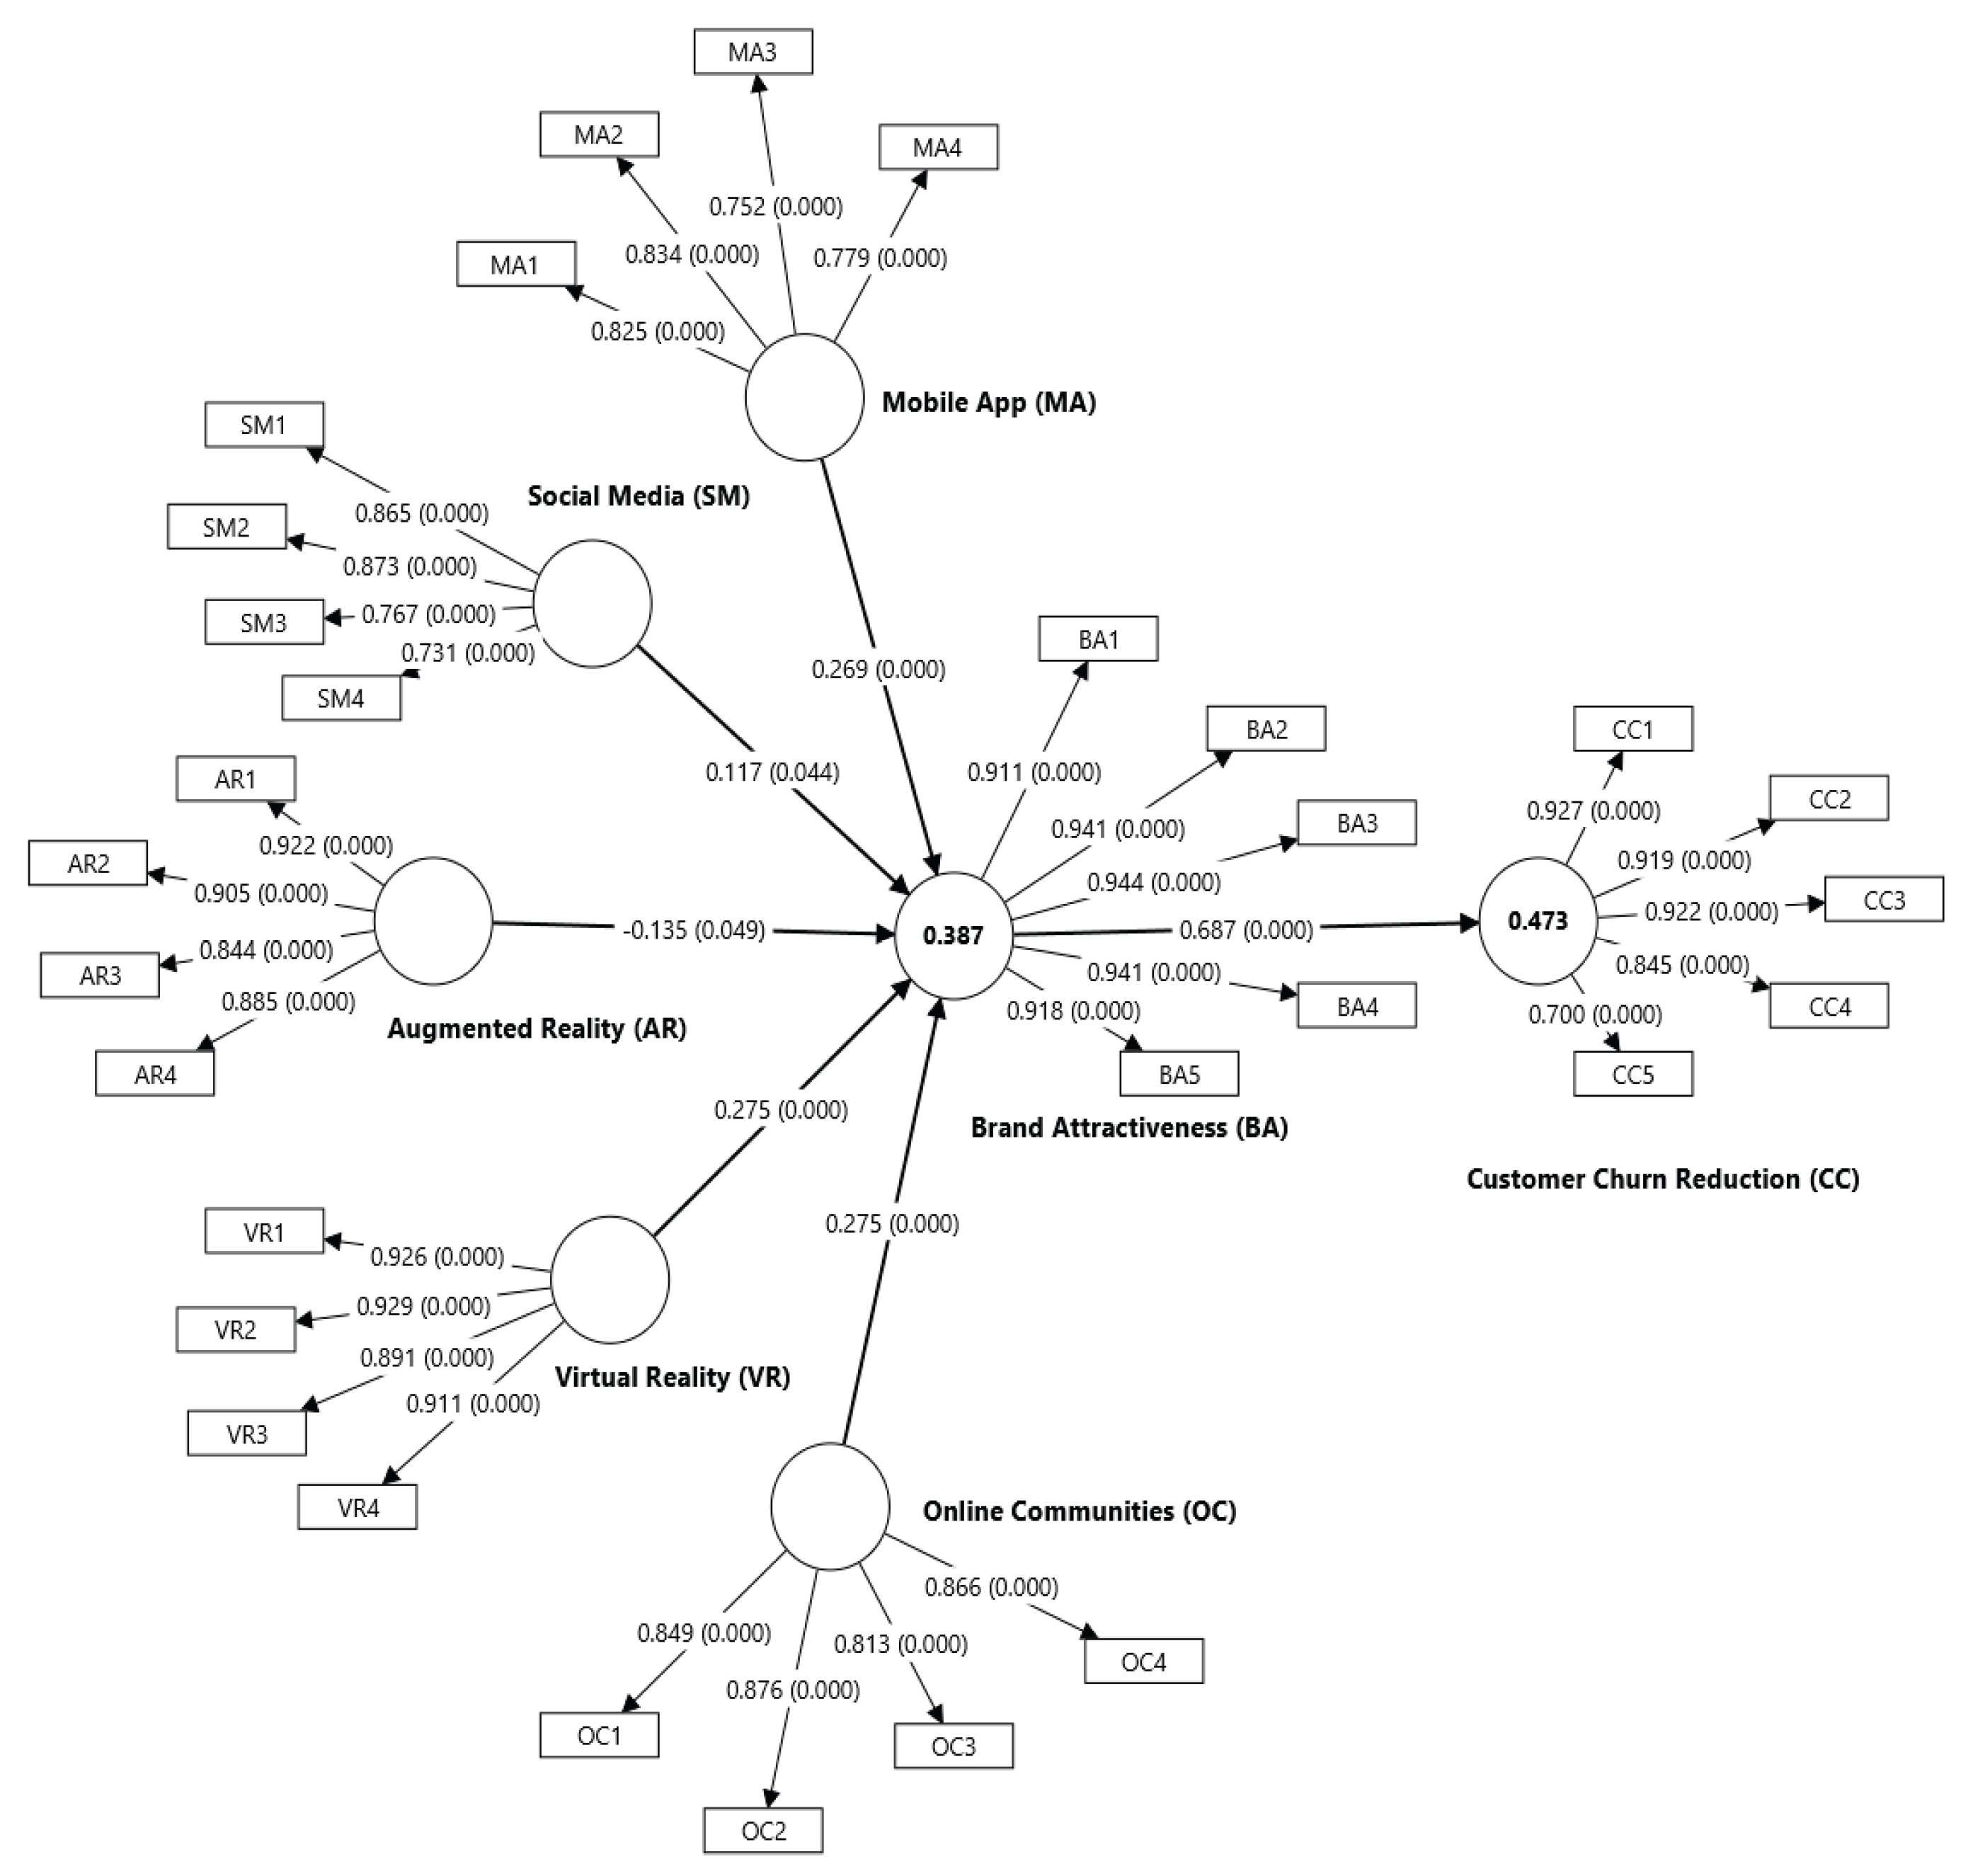

Table 1.
Full Collinearity Testing.
| AR | VR | MA | OC | SM | BA | CC |
|---|---|---|---|---|---|---|
| 3.994 | 3.763 | 1.615 | 1.836 | 1.673 | 2.409 | 2.029 |
Note: AR = Augmented Reality, VR = Virtual Reality, MA = Mobile Apps, OC = Online Communities, SM = Social Media, BA = Brand Attractiveness, CC = Customer Churn Reduction.
Table 2.
Demographic Profile.
| Demographic | Frequencies | Percentage (%) |
|---|---|---|
| Gender | ||
| Male | 162 | 52.9 |
| Female | 144 | 47.1 |
| Race | ||
| Malay | 167 | 54.6 |
| Chinese | 115 | 37.6 |
| Indian | 17 | 5.6 |
| Others | 7 | 2.3 |
| Marital Status | ||
| Single | 146 | 47.7 |
| Married | 156 | 51.0 |
| Divorces | 4 | 1.3 |
| Education Level | ||
| Secondary | 7 | 2.3 |
| Diploma | 25 | 8.2 |
| Bachelor’s degree | 157 | 51.3 |
| Master’s degree | 95 | 31.0 |
| Doctoral Degree | 22 | 7.2 |
| Monthly Personal Income | ||
| RM 2,000 or less | 15 | 4.9 |
| RM 2,001 to RM 4,000 | 57 | 18.6 |
| RM 4,001 to RM 6,000 | 89 | 29.1 |
| RM 6,001 to RM 8,000 | 53 | 17.3 |
| RM 8,001 to RM 10,000 | 39 | 12.7 |
| RM 10,001and above | 38 | 12.4 |
| No Income | 15 | 4.9 |
Table 3.
Measurement Model Assessment.
| Items | Outer Loadings | AVE | Composite Reliability |
|
|---|---|---|---|---|
| AR1 | 0.922 | 0.791 | 0.938 | |
| AR2 | 0.905 | |||
| AR3 | 0.844 | |||
| AR4 | 0.885 | |||
| MA1 | 0.825 | 0.637 | 0.875 | |
| MA2 | 0.834 | |||
| MA3 | 0.752 | |||
| MA4 | 0.779 | |||
| OC1 | 0.849 | 0.725 | 0.913 | |
| OC2 | 0.876 | |||
| OC3 | 0.813 | |||
| OC4 | 0.866 | |||
| SM1 | 0.865 | 0.659 | 0.885 | |
| SM2 | 0.873 | |||
| SM3 | 0.767 | |||
| SM4 | 0.731 | |||
| VR1 | 0.926 | 0.836 | 0.953 | |
| VR2 | 0.929 | |||
| VR3 | 0.891 | |||
| VR4 | 0.911 | |||
| BA1 | 0.911 | 0.867 | 0.970 | |
| BA2 | 0.941 | |||
| BA3 | 0.944 | |||
| BA4 | 0.941 | |||
| BA5 | 0.918 | |||
| CC1 | 0.927 | 0.751 | 0.937 | |
| CC2 | 0.919 | |||
| CC3 | 0.922 | |||
| CC4 | 0.845 | |||
| CC5 | 0.700 |
Note: AR = Augmented Reality, VR = Virtual Reality, MA = Mobile Apps, OC = Online Communities, SM = Social Media, BA = Brand Attractiveness, CC = Customer Churn Reduction.
Table 4.
Discriminant Validity (HTMT) Assessment.
| Construct | 1 | 2 | 3 | 4 | 5 | 6 | 7 |
|---|---|---|---|---|---|---|---|
| 1. AR | |||||||
| 2. BA | 0.433 | ||||||
| 3. CC | 0.386 | 0.729 | |||||
| 4. MA | 0.533 | 0.543 | 0.534 | ||||
| 5. OC | 0.595 | 0.553 | 0.415 | 0.466 | |||
| 6. SM | 0.496 | 0.480 | 0.436 | 0.592 | 0.647 | ||
| 7. VR | 0.918 | 0.463 | 0.334 | 0.471 | 0.552 | 0.409 |
Note: AR = Augmented Reality, VR = Virtual Reality, MA = Mobile Apps, OC = Online Communities, SM = Social Media, BA = Brand Attractiveness, CC = Customer Churn Reduction.
Table 5.
Caption.
| HYPOTHESIS TESTINGHypothesis | Relationship | Std Beta | t-values | p-values | BCI LL | BCI UL | f2 | VIF | Effect Size | Results |
| H1 | AR → BA | -0.135 | 1.659 | 0.049 | -0.267 | -0.000 | 0.008 | 3.893 | No effect | Unsupport |
| H2 | MA → BA | 0.269 | 4.336 | 0.000 | 0.165 | 0.368 | 0.081 | 1.457 | Small | Support |
| H3 | OC → BA | 0.275 | 3.600 | 0.000 | 0.151 | 0.400 | 0.072 | 1.709 | Small | Support |
| H4 | SM → BA | 0.117 | 1.701 | 0.044 | 0.004 | 0.228 | 0.013 | 1.646 | No effect | Support |
| H5 | VR → BA | 0.275 | 3.438 | 0.000 | 0.140 | 0.400 | 0.034 | 3.578 | Small | Support |
| H6 | BA → CC | 0.687 | 17.690 | 0.000 | 0.611 | 0.743 | 0.896 | 1.000 | Strong | Support |
Table 6.
Caption.
| HYPOTHESIS TESTING MEDIATING EFFECTHypothesis | Relationship | Std Beta | t-values | p-values | BCI LL | BCI UL | v² | Effect Size | Results |
| H7a | AR → BA → CC | -0.093 | 1.654 | 0.049 | -0.183 | -0.000 | 0.010 | Small | Unsupport |
| H7b | MA → BA → CC | 0.185 | 3.976 | 0.000 | 0.109 | 0.261 | 0.034 | Small | Support |
| H7c | OC → BA → CC | 0.189 | 3.668 | 0.000 | 0.104 | 0.272 | 0.036 | Small | Support |
| H7d | SM → BA → CC | 0.080 | 1.654 | 0.049 | 0.003 | 0.161 | 0.006 | No effect | Support |
| H7e | VR → BA → CC | 0.189 | 3.409 | 0.000 | 0.097 | 0.278 | 0.036 | Small | Support |
Note: 1. 95% confidence interval with a bootstrapping of 10,000. 2. AR = Augmented Reality, VR = Virtual Reality, MA = Mobile Apps, OC = Online Communities, SM = Social Media, BA = Brand Attractiveness, CC = Customer Churn Reduction.
Table 7.
Caption.
| PLS PREDICTIVE ASSESSMENT | Q²predict | PLS-SEM_MAE | LM_MAE | PLS-LM_MAE |
| BA1 | 0.287 | 0.768 | 0.750 | 0.018 |
| BA2 | 0.368 | 0.759 | 0.777 | -0.018 |
| BA3 | 0.340 | 0.798 | 0.799 | -0.001 |
| BA4 | 0.287 | 0.793 | 0.803 | -0.010 |
| BA5 | 0.254 | 0.850 | 0.854 | -0.004 |
| CC1 | 0.171 | 0.964 | 0.957 | 0.007 |
| CC2 | 0.208 | 0.968 | 0.990 | -0.022 |
| CC3 | 0.174 | 0.971 | 0.951 | 0.020 |
| CC4 | 0.159 | 0.974 | 0.963 | 0.011 |
| CC5 | 0.124 | 1.032 | 1.035 | -0.003 |
Disclaimer/Publisher’s Note: The statements, opinions and data contained in all publications are solely those of the individual author(s) and contributor(s) and not of MDPI and/or the editor(s). MDPI and/or the editor(s) disclaim responsibility for any injury to people or property resulting from any ideas, methods, instructions or products referred to in the content. |
© 2025 by the authors. Licensee MDPI, Basel, Switzerland. This article is an open access article distributed under the terms and conditions of the Creative Commons Attribution (CC BY) license (http://creativecommons.org/licenses/by/4.0/).
Copyright: This open access article is published under a Creative Commons CC BY 4.0 license, which permit the free download, distribution, and reuse, provided that the author and preprint are cited in any reuse.


