Submitted:
19 August 2025
Posted:
20 August 2025
You are already at the latest version
Abstract
Background: Zero-dose children - those who have not received any routine vaccines - represent a critical challenge for achieving universal immunization coverage. This study applies the Three Delays Model to examine multilevel factors associated with zero-dose children in sub-Saharan Africa.
Methods: We analyzed data from 59,211 children aged 12-23 months across 28 sub-Saharan African countries using Demographic and Health Surveys (2016-2021). Zero-dose status was defined as not receiving the first dose of diphtheria-tetanus-pertussis vaccine. Multilevel logistic regression models examined individual-, community-, and country-level determinants guided by the Three Delays Model framework.
Results: The overall zero-dose prevalence was 10.71% (95% CI: 6.90-15.23), with substantial variation ranging from 0.43% in Rwanda to 42.29% in Chad. In the fully adjusted model, poor maternal health-seeking behavior showed the strongest association with zero-dose status (OR = 15.21, 95% CrI: 13.28-17.35). Maternal education demonstrated a clear gradient effect, with children of mothers having no formal education showing nearly doubled odds of being zero-dose (OR = 1.84, 95% CrI: 1.36-2.81). Maternal empowerment factors were significant, including lack of decision-making power (OR = 1.31, 95% CrI: 1.21-1.43) and no media access (OR = 1.28, 95% CrI: 1.18-1.39). Community illiteracy rates (OR = 1.11, 95% CrI: 1.08-1.14) and low country-level health expenditure (OR = 3.45, 95% CrI: 1.85-5.72) were associated with increased zero-dose prevalence. Substantial clustering persisted at community (42.0%) and country (19.1%) levels in the final model.
Conclusions: Zero-dose children are concentrated among the most disadvantaged populations, with maternal health-seeking behavior serving as the strongest predictor. The substantial multilevel clustering and diverse determinants identified necessitate integrated interventions addressing individual empowerment, community capacity, and health system strengthening. The marked cross-country variation demonstrates that universal vaccination coverage is achievable but requires sustained commitment to addressing underlying social determinants of health inequity.
Keywords:
Zero-dose children
; Vaccination coverage
; Multilevel analysis
; Sub-Saharan Africa
; Health equity
; Three Delays Model
; Caregiver empowerment
; Health systems
‡ Joint senior authors.
Background
Childhood immunization represents one of the most successful and cost-effective public health interventions, preventing an estimated 2-3 million deaths annually and generating substantial economic returns [1]. Despite remarkable global progress in vaccination coverage over the past decades, significant disparities persist, with the burden of unvaccinated children disproportionately concentrated in low- and middle-income countries [2]. The World Health Organization (WHO) defines "zero-dose children" as those who have not received any routine vaccines, typically measured by the absence of the first dose of diphtheria-tetanus-pertussis (DTP1) vaccine [3]. These children represent the most marginalized populations and serve as a critical indicator of health system equity and reach.
Sub-Saharan Africa bears a disproportionate burden of zero-dose children, accounting for approximately 60% of the global total despite representing only 17% of the world's population [4]. The COVID-19 pandemic has exacerbated existing vaccination inequities, with routine immunization services experiencing significant disruptions across the region [5]. The Immunization Agenda 2030 has prioritized reaching zero-dose children as a cornerstone strategy for achieving universal immunization coverage and advancing health equity [3]. However, addressing this challenge requires a comprehensive understanding of the complex multilevel factors that create and perpetuate vaccination inequities.
Traditional approaches to understanding vaccination coverage have often focused on individual-level characteristics, such as maternal education, socioeconomic status, and healthcare access [6]. While these factors remain important, emerging evidence suggests that contextual factors at community and country levels play equally critical roles in shaping vaccination outcomes [7]. The clustering of unvaccinated children within specific geographic areas and communities indicates that shared environmental, social, and structural factors contribute significantly to vaccination patterns [8].
The Three Delays Model, originally developed to understand maternal mortality, provides a comprehensive framework for examining barriers to healthcare access and utilization [9]. This model conceptualizes three critical delays: the decision to seek care (first delay), reaching care (second delay), and receiving quality care (third delay). Recent applications of this framework to childhood vaccination have demonstrated its utility in identifying multilevel barriers and informing targeted interventions [10]. The first delay encompasses factors influencing parental decision-making about vaccination, including health knowledge, cultural beliefs, and maternal empowerment. The second delay addresses barriers to accessing vaccination services, such as geographic distance, transportation costs, and service availability. The third delay focuses on the quality of care received, including provider competence, vaccine availability, and service organization [11].
Multilevel analytical approaches have gained prominence in vaccination research, recognizing that individual behaviors are embedded within community and country contexts that shape health outcomes [12]. These methods allow for simultaneous examination of individual compositional effects and contextual area effects, providing insights into how place-based factors influence health behaviors beyond individual characteristics [13]. Recent multilevel studies have revealed substantial community and country-level variation in vaccination coverage, highlighting the importance of contextual interventions alongside individual-focused strategies [14].
Despite growing recognition of multilevel influences on vaccination coverage, comprehensive analyses examining the simultaneous effects of individual, community, and country-level factors on zero-dose children in sub-Saharan Africa remain limited. Most existing studies focus on single countries or examine only individual-level determinants, limiting our understanding of the complex interplay of factors that create vaccination inequities across diverse contexts [15]. Furthermore, few studies have applied theoretical frameworks such as the Three Delays Model to systematically examine barriers to vaccination access and utilization across multiple levels.
This study addresses these knowledge gaps by conducting a comprehensive multilevel analysis of zero-dose children across sub-Saharan African countries, using the Three Delays Model as a guiding framework. Our analysis examines how individual-level factors (maternal characteristics, empowerment, and healthcare access), community-level factors (socioeconomic context and infrastructure), and country-level factors (health system characteristics and development indicators) independently and jointly influence zero-dose patterns. Understanding these multilevel determinants is essential for informing evidence-based strategies to achieve universal immunization coverage and advance health equity in sub-Saharan Africa.
Methods
Study Design
This study utilized cross-sectional data from the most recent Demographic and Health Surveys (DHS) conducted in 28 sub-Saharan African countries between 2016 and 2021. The DHS program provides nationally representative, standardized household surveys that collect comprehensive information on population, health, and nutrition indicators. These surveys are designed to provide reliable estimates at national and subnational levels, making them ideal for cross-country comparative analysis of health outcomes and their determinants [16]. The cross-sectional design allows for examination of associations between individual, community, and country-level factors and zero-dose vaccination status at a single point in time across diverse sub-Saharan African contexts.
Sampling Technique
The DHS employs a standardized multi-stage stratified cluster sampling methodology across all participating countries. The sampling frame is based on the most recent national population census in each country, ensuring representativeness of the target population. The multi-stage sampling process involves several sequential steps designed to achieve nationally representative samples while maintaining statistical efficiency.
In the first stage, each country is stratified by administrative regions and urban-rural residence to ensure adequate representation across geographic and settlement types. Primary sampling units (PSUs), typically corresponding to enumeration areas from the national census, are then selected with probability proportional to size within each stratum. Urban PSUs generally correspond to census enumeration blocks, while rural PSUs are typically defined by village boundaries or administrative units.
In the second stage, a systematic sample of households is selected from a complete household listing within each selected PSU. The household listing is conducted prior to the main survey to ensure accurate sampling frames. A fixed number of households, typically 20-30 per cluster, are selected using systematic sampling with a random start to maintain the self-weighting nature of the sample design.
In the final stage, all women of reproductive age (15-49 years) residing in selected households, or who stayed in the household the night before the survey, are eligible for interview. For this analysis, we further restricted the sample to women who had children aged 12-23 months at the time of survey, as this represents the target age group for assessing zero-dose vaccination status according to WHO recommendations.
Data Collection
Data collection for the DHS follows standardized protocols implemented consistently across all participating countries to ensure comparability and data quality. Trained field teams, consisting of supervisors, interviewers, and editors, conduct face-to-face interviews using structured questionnaires that have been extensively pilot-tested and validated across diverse cultural contexts. The DHS employs multiple standardized questionnaires designed to capture comprehensive information on demographic characteristics, reproductive health, maternal and child health, and household socioeconomic conditions. For this study, information was primarily extracted from the Women's Questionnaire, which collects detailed data on all women of reproductive age, and the Children's Questionnaire, which focuses specifically on children under five years of age. Vaccination data, the primary focus of this analysis, are collected through a dedicated immunization module within the Children's Questionnaire. Interviewers record vaccination information from multiple sources to maximize accuracy and completeness. The preferred source is the child's vaccination card or health booklet, which provides the most reliable record of vaccination dates and types. When vaccination cards are not available, interviewers rely on maternal recall, systematically asking mothers about each specific vaccine their child has received. The immunization module follows a standardized format across all countries, recording information for each recommended vaccine in the national immunization schedule. For DTP vaccines, interviewers specifically document the dates of DTP1, DTP2, and DTP3 administration, or record whether each dose was received if dates are not available. This systematic approach enables consistent classification of zero-dose status across countries with different vaccination schedules and documentation practices.
Community/Neighbourhood Definitions
We defined communities as geographical clusters based on shared primary sampling units (PSUs) within the DHS data structure. DHS sampling frames utilize the most recent national census to identify PSUs, which serve as the foundation for community-level analysis. Urban PSUs typically correspond to census enumeration blocks, while rural PSUs are generally defined by village boundaries or other recognized administrative units. This analytical unit was selected for two primary considerations. First, PSUs provide the most standardized community measure across all surveys, making them optimal for cross-regional comparative analysis [17,18]. Second, research demonstrates that DHS cluster sample sizes typically achieve adequate precision with minimal statistical bias, with cluster-based estimates showing only approximately 4% bias when using 25 women per cluster as population proxies [17,18]. Throughout this study, we use community and neighbourhood terminology interchangeably to refer to these PSU-based geographical units.
Outcome Variable
The primary outcome variable was zero-dose status among children aged 12-23 months, defined according to WHO recommendations as children who have not received the first dose of diphtheria-tetanus-pertussis (DTP1) vaccine. The outcome variable was coded as a binary indicator, where 1 represented zero-dose status (child had not received DTP1) and 0 represented vaccinated status (child had received at least DTP1). The 12-23 month age range was selected because children in this age group should have had adequate opportunity to receive DTP1 according to standard immunization schedules, while minimizing recall bias associated with older children.
Explanatory Variables
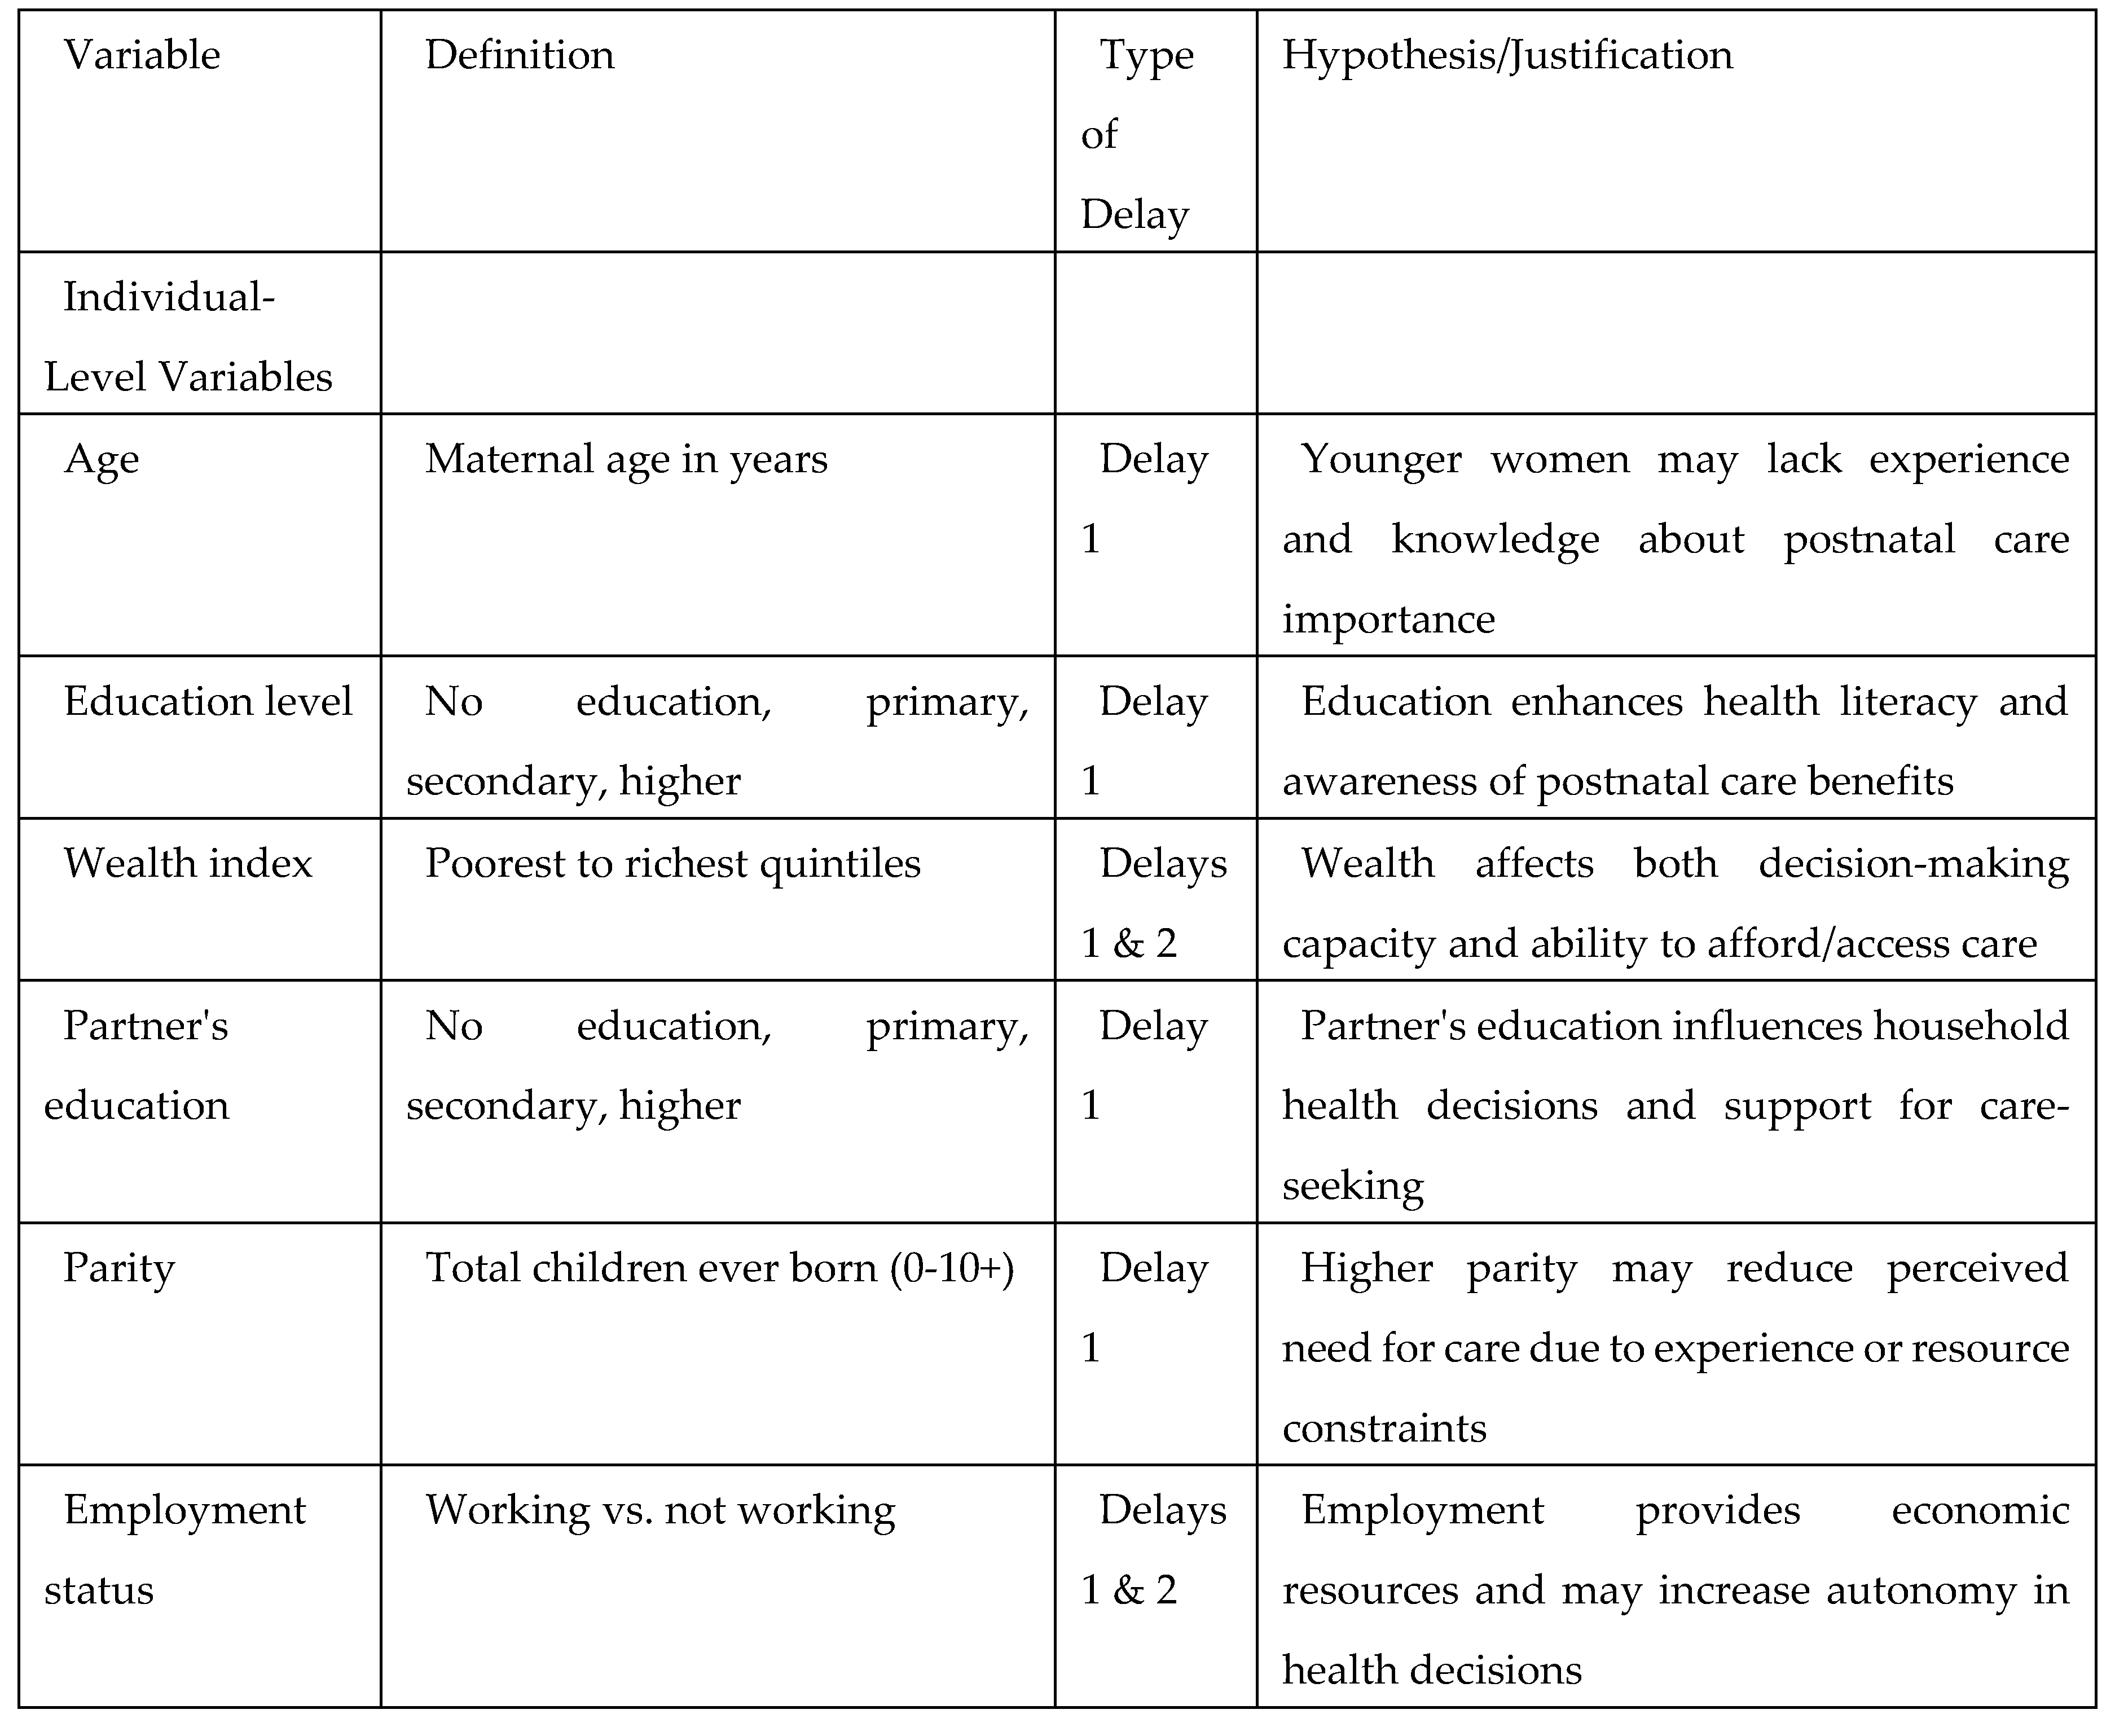
The explanatory variables were selected based on the Three Delays Model framework and existing literature demonstrating their association with childhood vaccination patterns (Table A1). Variables were categorized into individual-, community-, and country-level factors, representing the hierarchical nature of influences on vaccination outcomes.
Individual-Level Variables
Maternal characteristics included age (measured in years), education level (categorized as no education, primary, secondary, or higher education), and parity (total children ever born). Household socioeconomic status was measured using the DHS wealth index, which employs principal component analysis of household assets and living conditions to create quintiles from poorest to richest. Partner's education level was categorized similarly to maternal education (no education, primary, secondary, or higher).
Maternal empowerment was captured through multiple indicators reflecting women's autonomy and decision-making capacity. Decision-making power was assessed based on women's participation in household decisions regarding healthcare, major purchases, and family visits. Media access was measured as exposure to newspapers, radio, or television, representing access to health information. Employment status was dichotomized as working versus not working outside the home.
A composite maternal health-seeking behavior index was constructed to capture patterns of healthcare utilization during pregnancy and delivery. This index incorporated four key components: (1) possession of a health card or vaccination record (hcard), (2) receipt of antenatal care (ante), (3) delivery at a health facility (hospital), and (4) receipt of tetanus vaccination during pregnancy (tetanus). The index was created by summing the number of positive health-seeking behaviors, ranging from 0 (no health-seeking behaviors) to 4 (all health-seeking behaviors present). For analytical purposes, this was further categorized into poor/no health-seeking behavior (0-2 behaviors) versus adequate health-seeking behavior (3-4 behaviors).
Healthcare access barriers were measured through self-reported problems with money and distance in accessing healthcare services. Health insurance coverage was assessed as a binary variable indicating presence or absence of any health insurance. Household size was included as a continuous variable representing the number of household members.
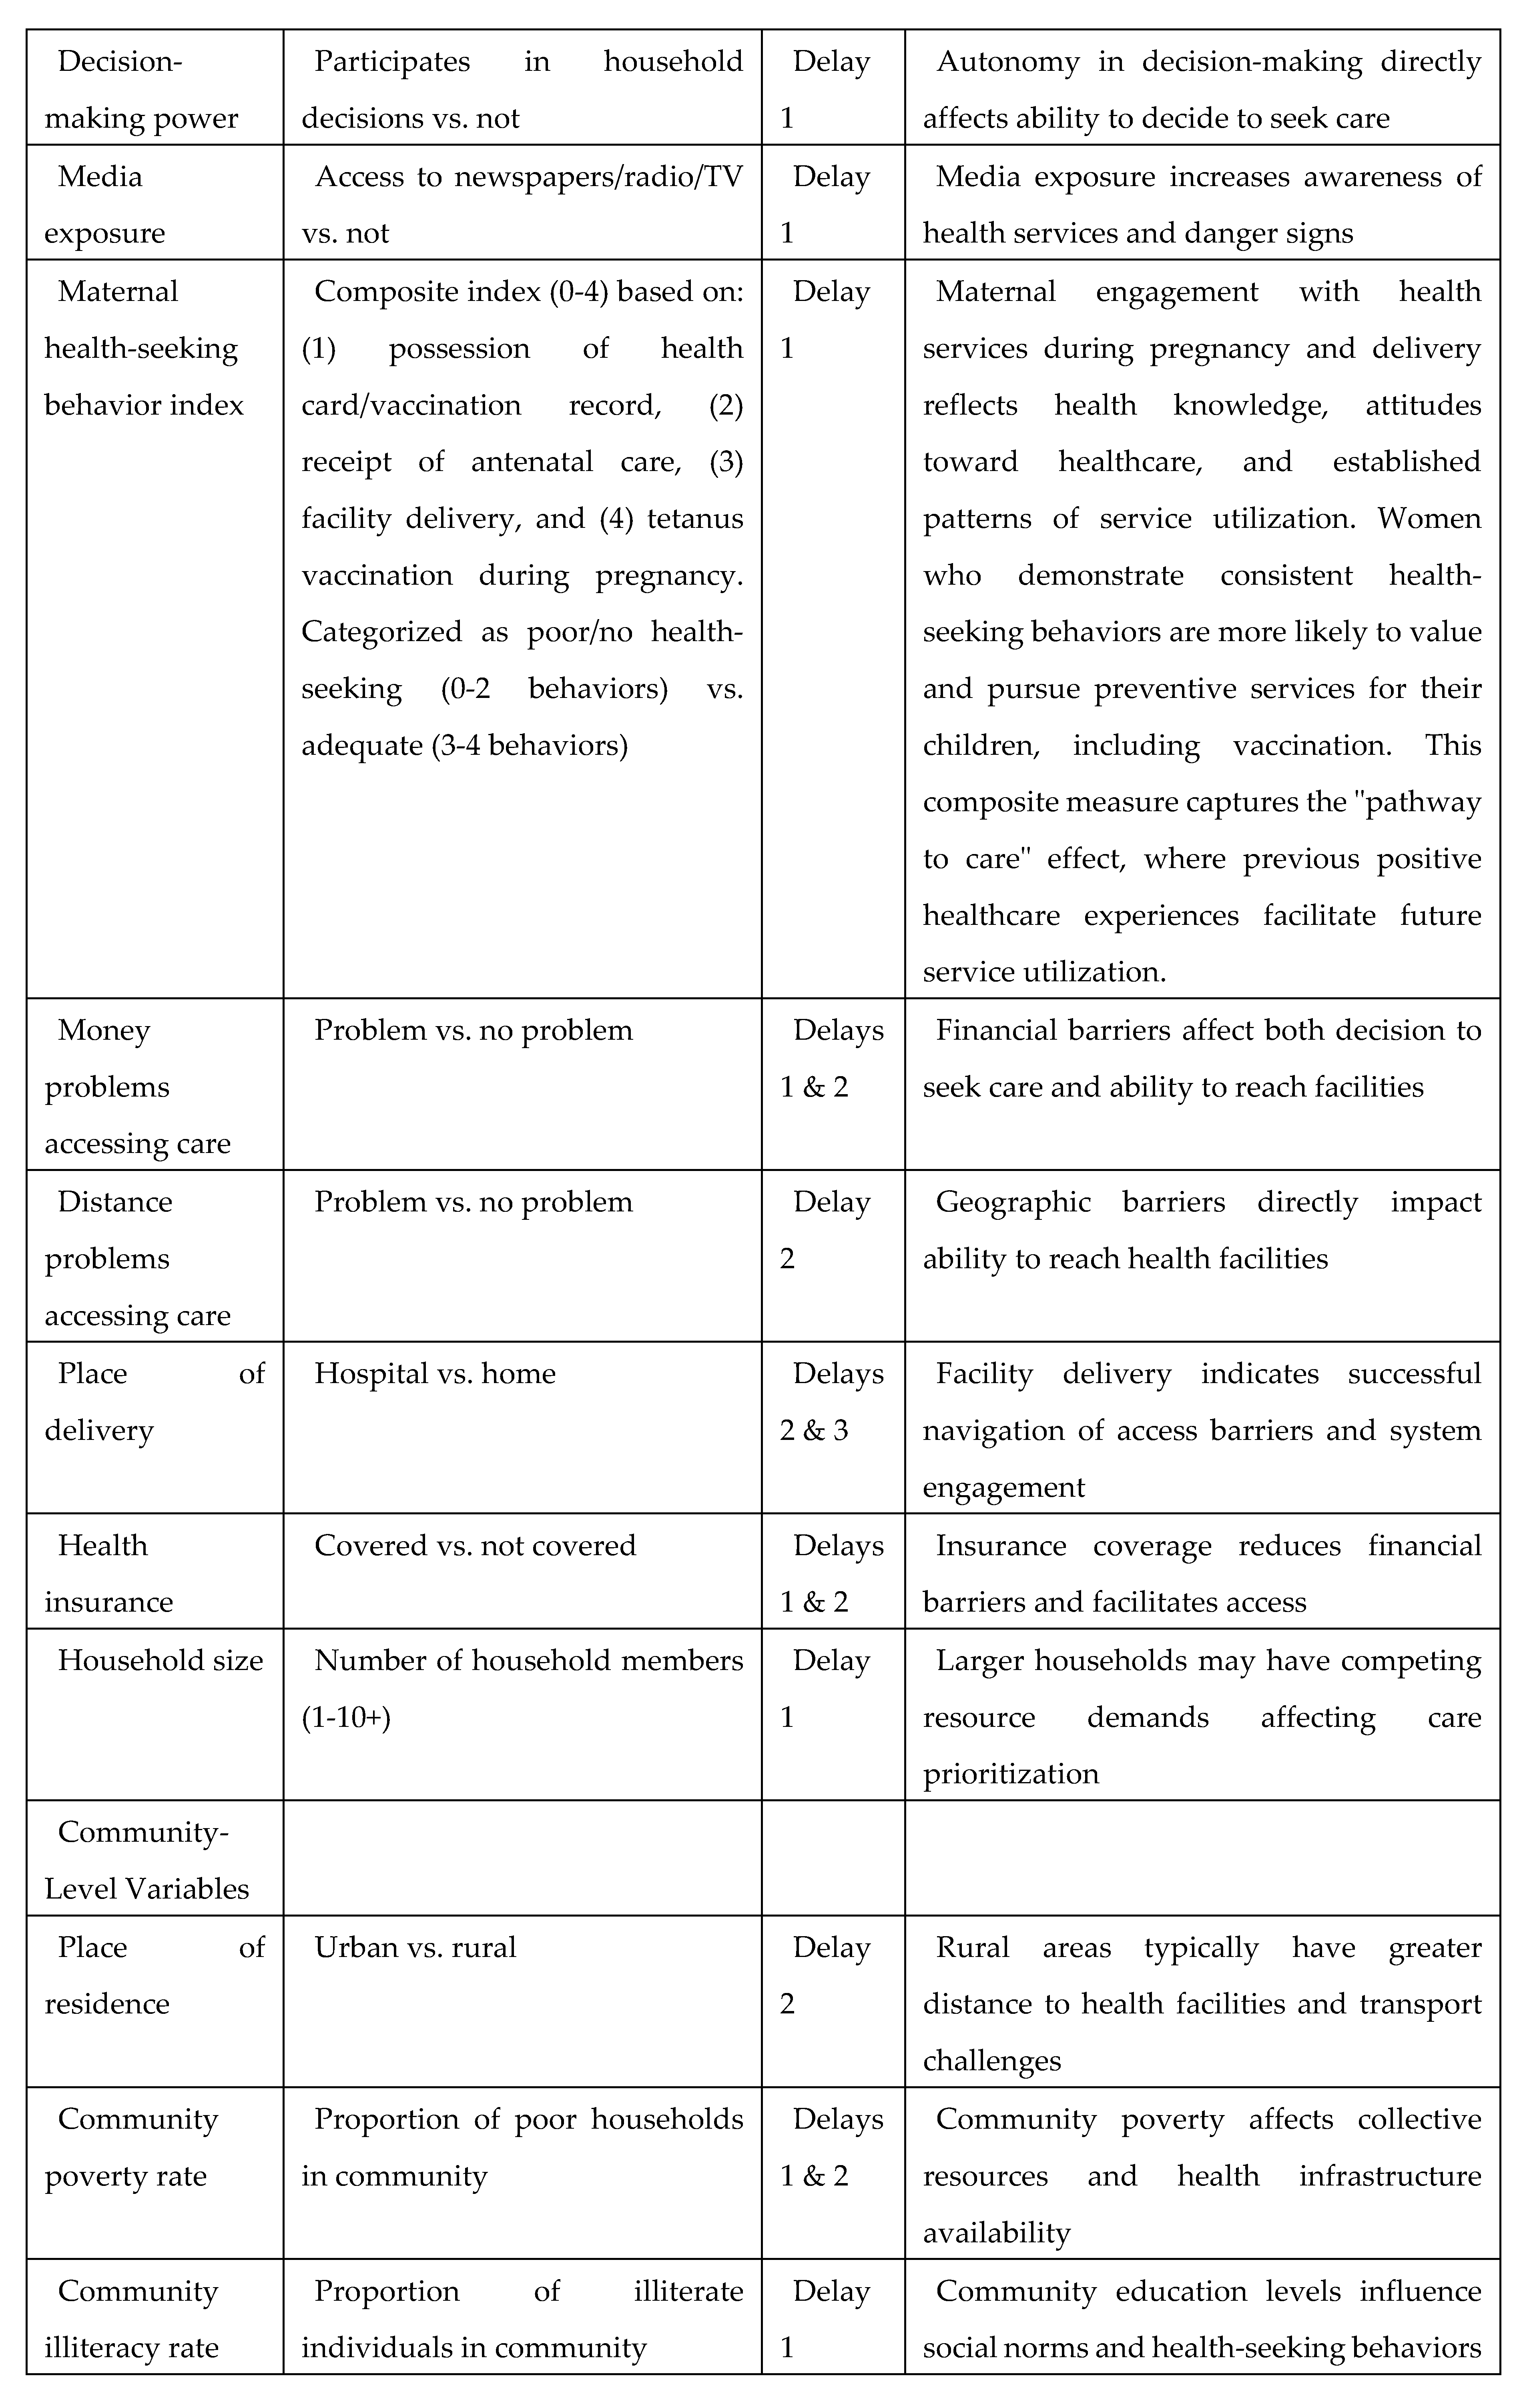
Community-Level Variables
Place of residence was categorized as urban versus rural based on DHS classification. Community-level socioeconomic indicators were calculated as the proportion of individuals within each PSU exhibiting specific characteristics. Community poverty rate represented the proportion of households in the poorest wealth quintile within each community. Community illiteracy rate was calculated as the proportion of women with no formal education within each community. Community unemployment rate represented the proportion of women not engaged in paid employment within each community. These community-level indicators were constructed by aggregating individual responses within PSUs, providing measures of neighborhood socioeconomic context that may influence vaccination behaviors through social norms, peer effects, and local resource availability.
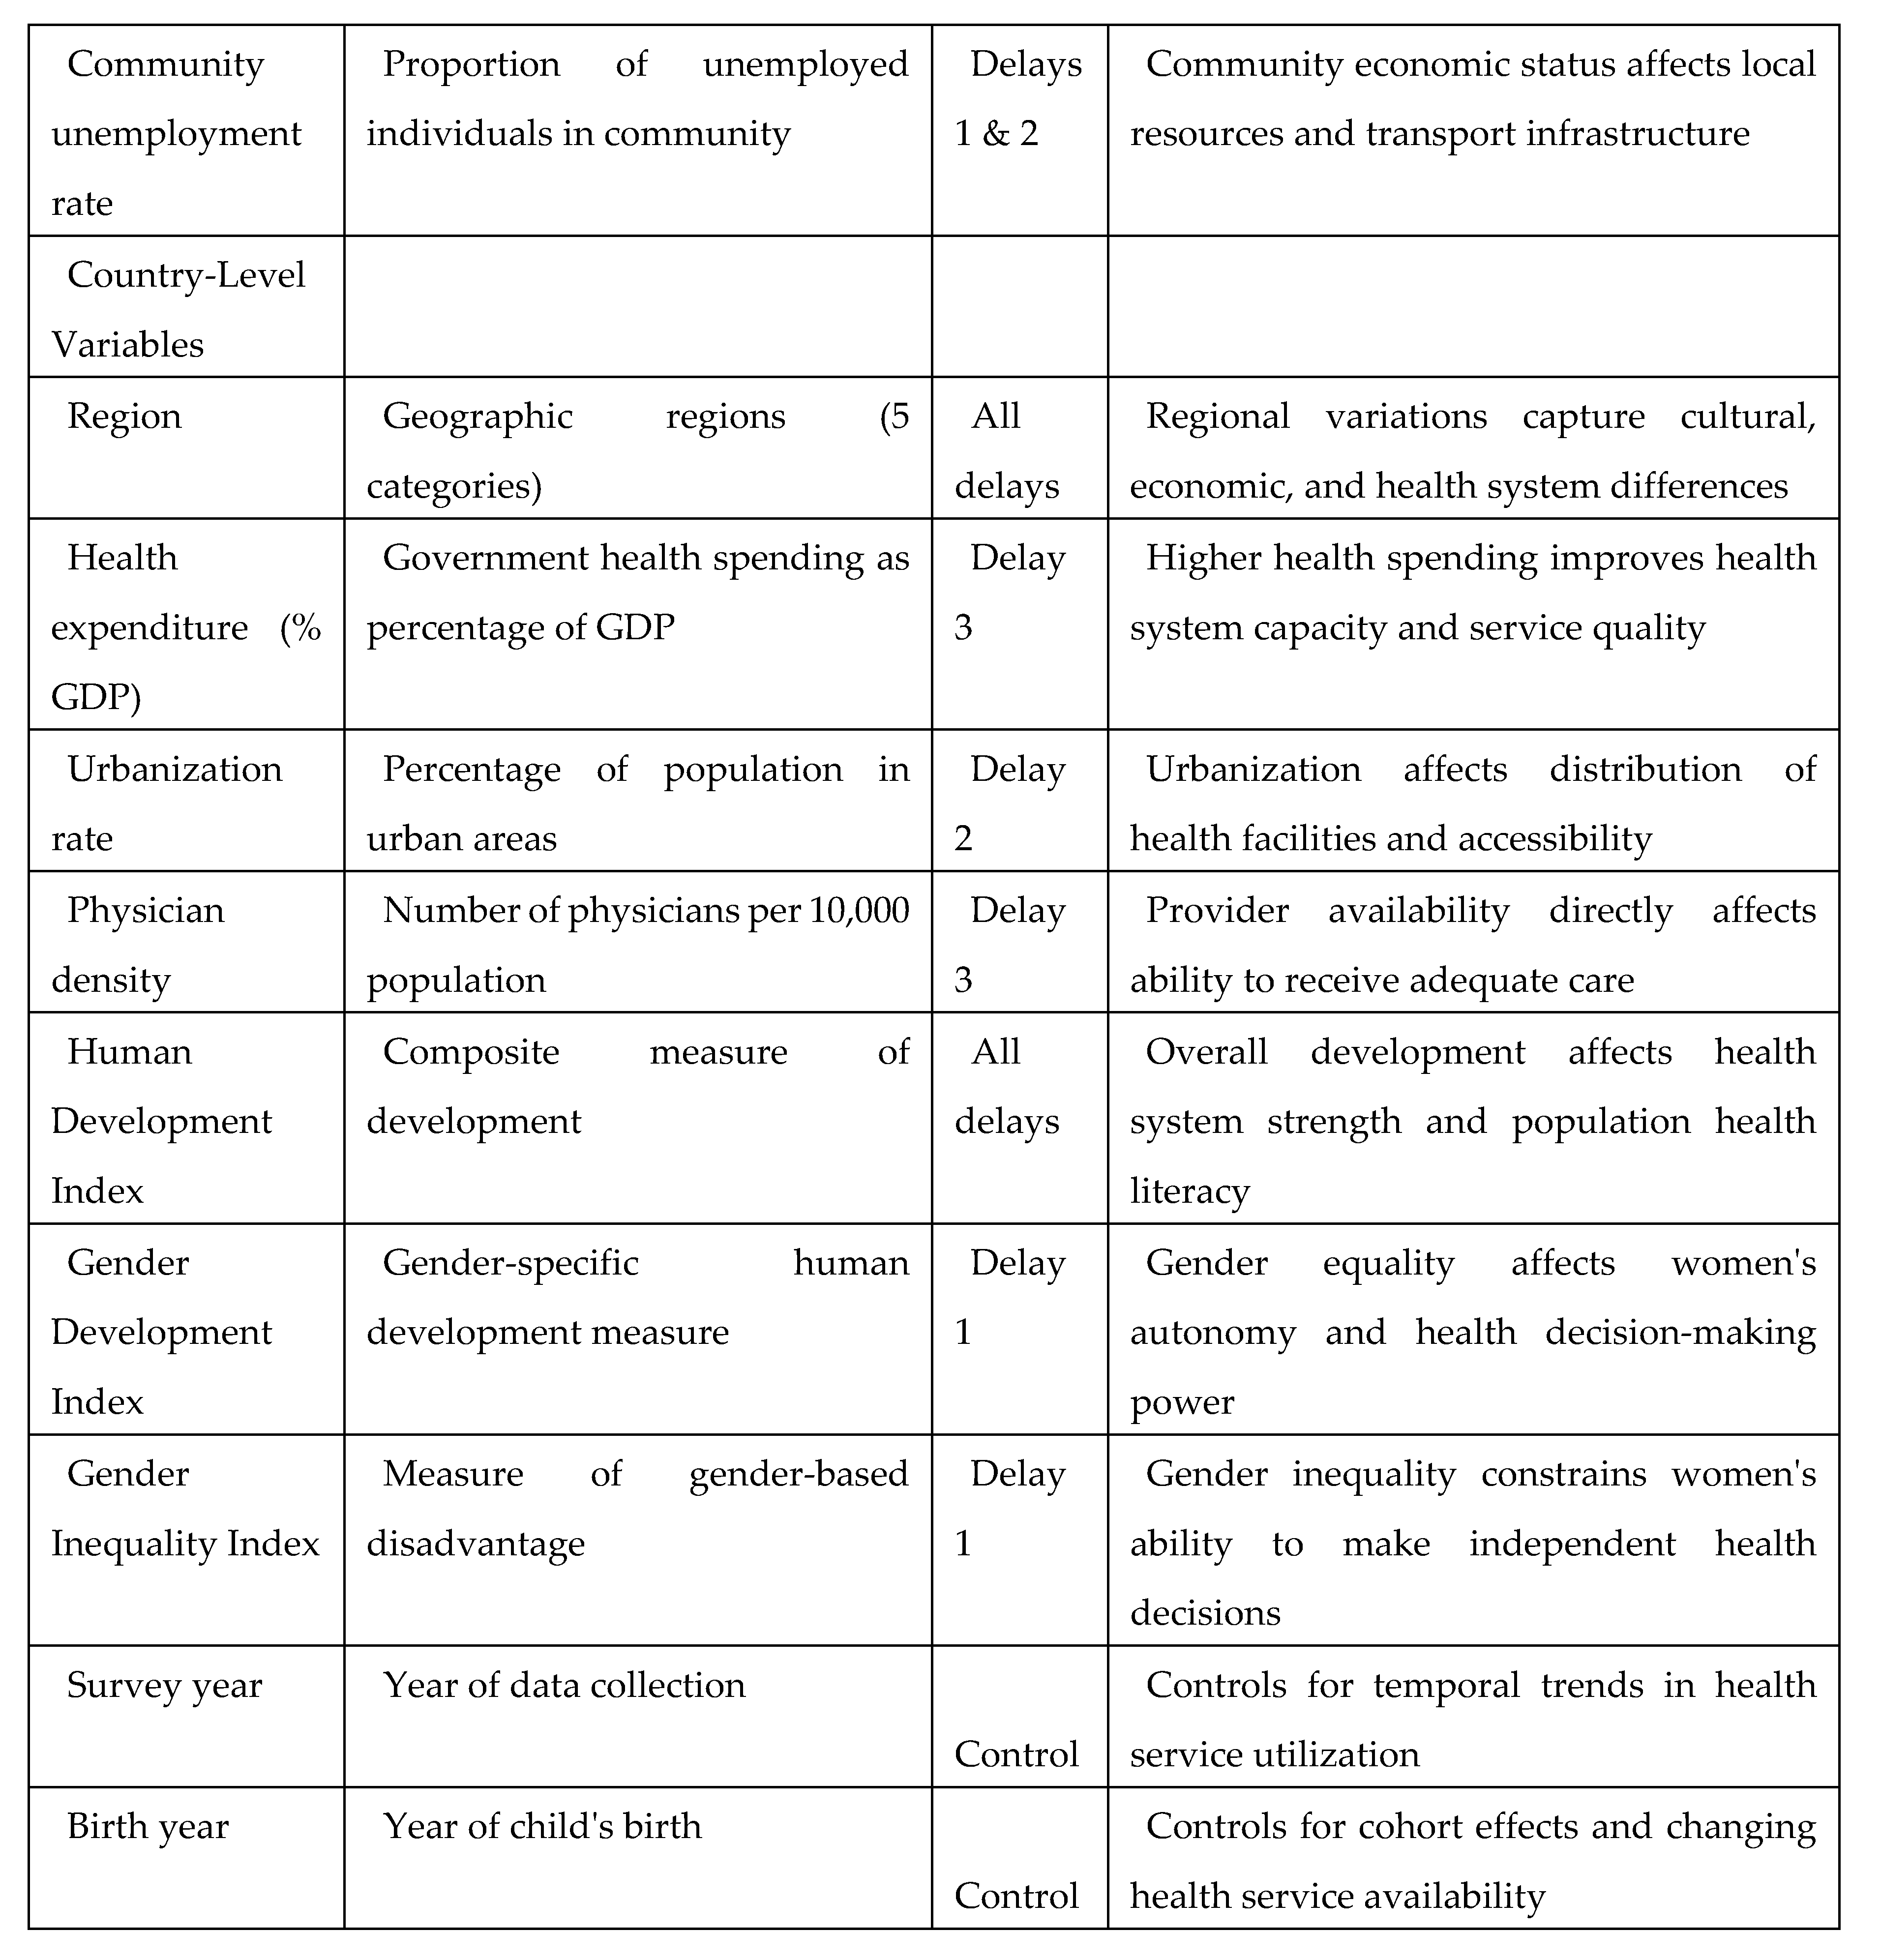
Country-Level Variables
Country-level variables encompassed health system characteristics and broader development indicators. Health system indicators included percentage of GDP spent on health expenditure and government health expenditure as a proportion of total health expenditure. Development measures included the Human Development Index (HDI), Gender Development Index (GDI), and Gender Inequality Index (GII), obtained from the United Nations Development Programme. For analytical purposes, continuous country-level variables were dichotomized using median splits to create low versus high categories, facilitating interpretation of results in policy-relevant terms. This approach allows for examination of whether countries above or below median performance levels show different patterns of zero-dose prevalence.
Temporal variables included survey year and child's birth year to control for time trends and potential cohort effects in vaccination coverage. These variables account for improvements in vaccination programs over time and ensure that associations reflect contemporaneous relationships rather than temporal changes in service availability or policies.
Statistical Analyses
Descriptive Statistics
Analysis began with pooling datasets from the 28 sub-Saharan African countries to create a single comprehensive dataset for regional analysis. The pooled dataset was weighted using DHS-provided sampling weights to adjust for complex survey design, including stratification, clustering, and differential sampling probabilities across countries. These weights ensure that estimates are representative of the target populations in each country and appropriately account for the multi-stage sampling design.
Descriptive statistics comprised frequency distributions and percentages for all categorical variables, and means with standard deviations for continuous variables, stratified by zero-dose status. To examine the distribution of zero-dose children across the three-level hierarchy, we calculated the number and percentage of zero-dose children at each level: 59,211 children (level 1) nested within 15,637 communities (level 2) across 28 countries (level 3).
Bivariate associations between each explanatory variable and zero-dose status were assessed using Chi-square tests for categorical variables and t-tests for continuous variables. Forest plots were constructed to visualize the variation in zero-dose prevalence across countries, with random-effects meta-analysis used to calculate pooled estimates and assess between-country heterogeneity using the I² statistic. All variables demonstrating significant associations (p < 0.05) in bivariate analysis were included in subsequent multilevel modeling.
Modelling Approaches
We employed multivariable logistic multilevel regression models to analyze the association between individual compositional and community and country contextual factors associated with zero-dose status. We specified a three-level model for the binary outcome of zero-dose status for children (level 1), nested within communities (level 2), living in countries (level 3).
We constructed five nested multilevel models to examine the determinants of zero-dose status across different levels of influence. The first model (Model 1) was an unconditional model without any explanatory variables, specified to decompose the amount of variance that existed between country and community levels and establish baseline clustering effects. The second model (Model 2) included only individual-level factors to assess their independent contribution. The third model (Model 3) contained only community-level factors to examine contextual effects. The fourth model (Model 4) included only country-level factors to assess macro-level influences. Finally, the fifth model (Model 5) simultaneously controlled for individual-, community-, and country-level factors, representing the full model.
This sequential modeling approach allows for assessment of how much variance at each level is explained by different categories of factors and enables examination of how contextual effects change when individual characteristics are controlled.
Fixed Effects (Measures of Association)
The results of fixed effects (measures of association) were reported as odds ratios (ORs) with their 95% credible intervals (CrIs). Bayesian statistical inference provides probability distributions for measures of association, which are summarized with 95% credible intervals rather than traditional 95% confidence intervals. A 95% credible interval can be interpreted as there being a 95% probability that the parameter takes a value in the specified range.
For categorical variables, odds ratios represent the odds of zero-dose status in each category relative to the reference category. For continuous variables, odds ratios represent the change in odds associated with a one-unit increase in the predictor variable. Statistical significance was assessed based on whether the 95% credible interval excluded 1.0, indicating evidence of association with zero-dose status.
Random Effects (Measures of Variation)
The contextual effects were measured using several indicators of clustering and variation. The variance partition coefficient (VPC) was calculated to measure similarity between children in the same community and within the same country. The VPC represents the percentage of total variance in the probability of zero-dose status that is attributable to community- and country-level factors, quantifying the degree of clustering of vaccination behaviors within these geographic units.
The median odds ratio (MOR) was calculated to quantify the extent of variation between clusters. The MOR represents the median value of the odds ratio between a child at higher risk and a child at lower risk when randomly selecting two children from different communities or countries. MOR values close to 1.0 indicate minimal clustering, while larger values indicate substantial variation between areas.
The proportional change in variance (PCV) was calculated to assess the proportion of area-level variance explained by including explanatory variables in the model, calculated as: PCV = (σ²_null - σ²_model) / σ²_null × 100%, where σ²_null is the area-level variance in the null model and σ²_model is the area-level variance in the model with covariates.
Model Fit and Specifications
All analyses were conducted using MLwiN software version 3.13, with parameters estimated using the Markov Chain Monte Carlo (MCMC) procedure. MCMC estimation was chosen over traditional maximum likelihood methods due to its superior performance with complex multilevel models and its ability to provide full Bayesian inference, including credible intervals for all parameters.
The MCMC chains were run for 50,000 iterations following a burn-in period of 5,000 iterations to ensure convergence. Convergence was assessed through visual inspection of trace plots and calculation of effective sample sizes. Multiple chains were run with different starting values to confirm consistent results across runs.
The Bayesian Deviance Information Criterion (DIC) was used to assess model fit and compare models, with lower DIC values indicating better fit to the data. The DIC balances model fit with model complexity, penalizing models with excessive parameters. Model selection was based on both statistical criteria (DIC values) and theoretical considerations regarding the relevance of included variables.
Results
Sample Characteristics
The pooled analysis included 59,211 children aged 12-23 months from Demographic and Health Surveys conducted across sub-Saharan African countries between 2015 and 2024 (Table 1). Of these children, 9,220 (15.6%) were classified as zero-dose children who had not received their first dose of DTP vaccine, while 49,991 (84.4%) had received at least one dose of DTP.
Maternal and household characteristics showed notable disparities between zero-dose and vaccinated children. Mothers of zero-dose children had substantially lower educational attainment, with 62.8% having no formal education compared to 30.1% among mothers of vaccinated children. Similarly, partners of mothers with zero-dose children demonstrated lower educational levels, with 58.3% having no education versus 29.5% in the comparison group. Household wealth index revealed a clear socioeconomic gradient, with zero-dose children disproportionately represented in the poorest quintile (34.5% vs. 20.5%) and underrepresented in the richest quintile (8.0% vs. 18.6%).
Healthcare utilization patterns differed markedly between groups. A substantial proportion of mothers with zero-dose children (41.3%) had received no antenatal care visits compared to only 6.7% of mothers whose children were vaccinated. Among those who did receive antenatal care, mothers of zero-dose children were less likely to complete the recommended four or more visits (32.0% vs. 63.9%).
Barriers to healthcare access were more prevalent among families with zero-dose children. Financial constraints were reported by 57.4% of families with zero-dose children compared to 48.0% of those with vaccinated children. Geographic barriers were similarly pronounced, with 45.5% of zero-dose families reporting distance as a problem accessing care versus 34.3% in the comparison group. Paradoxically, health insurance coverage was higher among zero-dose children (86.4% vs. 79.4%), though this may reflect country-specific insurance schemes or data collection variations.
Community and country-level factors revealed systematic disadvantages for zero-dose children. These children were predominantly from rural areas (76.6% vs. 64.7%) and resided in communities with higher poverty rates (32.6% vs. 20.9%) and illiteracy rates (59.6% vs. 32.2%). At the country level, zero-dose children lived in nations with slightly higher GDP per capita (4,360.7 vs. 3,967.3 USD) but lower health expenditure as a percentage of GDP (4.3% vs. 5.0%). Human development indicators, including the Human Development Index, Gender Development Index, and Gender Inequality Index, showed minimal variation between groups.
Variation in Zero-Dose Prevalence Across Sub-Saharan African Countries
The prevalence of zero-dose children varied substantially across the 28 sub-Saharan African countries included in the analysis, with an overall pooled prevalence of 10.71% (95% CI: 6.90-15.23) (Figure 1). This marked heterogeneity was statistically significant across all regional groupings (I² > 93% for all regions, p < 0.001), indicating considerable between-country variation that extends beyond sampling variation.
Central Africa demonstrated the highest regional burden, with a pooled prevalence of 26.64% (95% CI: 15.41-39.66). Within this region, Chad exhibited the highest zero-dose prevalence at 42.29% (95% CI: 40.55-44.04), followed by Angola at 32.96% (95% CI: 31.28-34.68). Gabon and Central African Republic showed more moderate rates at 17.78% (95% CI: 15.76-19.96) and 16.16% (95% CI: 14.55-17.88), respectively.
West Africa showed considerable internal variation with a pooled prevalence of 12.38% (95% CI: 6.34-20.07). Guinea recorded the highest prevalence in this region at 35.96% (95% CI: 33.54-38.43), followed by Nigeria at 32.46% (95% CI: 31.32-33.60) and Côte d'Ivoire at 24.31% (95% CI: 22.49-26.21). Mali demonstrated a prevalence of 20.09% (95% CI: 18.38-21.89), while Benin showed 15.14% (95% CI: 13.76-16.52). The remaining West African countries exhibited single-digit prevalences, with Gambia showing the lowest at 1.91% (95% CI: 1.32-2.69).
East Africa presented more heterogeneous patterns with a pooled prevalence of 6.49% (95% CI: 2.81-11.53). Ethiopia and Madagascar showed the highest burdens at 24.17% (95% CI: 22.33-26.07) and 22.04% (95% CI: 20.37-23.69), respectively. Mozambique recorded 15.01% (95% CI: 13.40-16.75), while Zimbabwe showed 8.57% (95% CI: 7.05-10.32). Several East African countries demonstrated remarkably low prevalences, including Rwanda at 0.43% (95% CI: 0.18-0.89), Burundi at 1.29% (95% CI: 0.91-1.79), and Zambia at 1.89% (95% CI: 1.34-2.59).
Southern Africa exhibited the lowest regional burden with a pooled prevalence of 3.46% (95% CI: 0.53-8.68), though this estimate was based on only two countries. South Africa showed a prevalence of 5.84% (95% CI: 4.27-7.89), while Lesotho demonstrated 1.65% (95% CI: 0.82-3.17).
Measures of Association (Fixed Effects Model)
The fully adjusted multilevel model (Model 5) incorporating individual-, community-, and country-level factors revealed several significant associations with zero-dose status among children aged 12-23 months in sub-Saharan Africa (Table 2).
Individual-level factors demonstrated the strongest associations with zero-dose status. The most pronounced effect was observed for poor or absent maternal health-seeking behavior, with children whose mothers had inadequate antenatal care utilization showing dramatically increased odds of being zero-dose (OR = 15.21, 95% CrI: 13.28-17.35). Maternal educational attainment exhibited a clear gradient effect, with children of mothers having no formal education showing nearly doubled odds of zero-dose status compared to those with tertiary education (OR = 1.84, 95% CrI: 1.36-2.81). Similarly, children of mothers with only primary education remained at elevated risk (OR = 1.40, 95% CrI: 1.05-2.06).
Partner education also emerged as a significant determinant, with children whose fathers/partners had no formal education showing increased odds of zero-dose status (OR = 1.44, 95% CrI: 1.17-1.72). Maternal empowerment indicators were consistently associated with vaccination outcomes, as children of mothers with no decision-making power had 31% higher odds of being zero-dose (OR = 1.31, 95% CrI: 1.21-1.43), while those with no media access showed 28% higher odds (OR = 1.28, 95% CrI: 1.18-1.39). Maternal employment status also influenced vaccination likelihood, with children of non-working mothers showing 13% higher odds of zero-dose status (OR = 1.13, 95% CrI: 1.04-1.23).
Temporal trends revealed improving vaccination coverage over time, with both survey year (OR = 0.95, 95% CrI: 0.95-0.95) and child's birth year (OR = 0.97, 95% CrI: 0.97-0.97) showing protective effects. Maternal age demonstrated a gradient relationship, with children of young adult mothers having 59% higher odds of zero-dose status compared to middle-aged/older mothers (OR = 1.59, 95% CrI: 1.34-1.89).
Community-level factors showed important associations as continuous variables. Community illiteracy rates demonstrated a significant positive association, with each unit increase in illiteracy rate associated with 11% higher odds of zero-dose status (OR = 1.11, 95% CrI: 1.08-1.14). Similarly, community unemployment rates showed a modest but significant association, with each unit increase associated with 6% higher odds of being zero-dose (OR = 1.06, 95% CrI: 1.04-1.09). Interestingly, rural residence showed no significant association in the fully adjusted model (OR = 0.91, 95% CrI: 0.80-1.01), suggesting that the rural-urban disparity observed in bivariate analyses was largely explained by other socioeconomic and health system factors. Community poverty rates showed no significant association after full adjustment.
Country-level factors revealed complex relationships with zero-dose prevalence when categorized into high versus low levels relative to median values. Children in countries with low health expenditure (below median) had substantially higher odds of zero-dose status compared to those in higher health expenditure countries (OR = 3.45, 95% CrI: 1.85-5.72), indicating that inadequate national health investment is associated with poorer vaccination coverage. Children in countries with low Gender Development Index values had nearly doubled odds of zero-dose status compared to those in countries with high gender development (OR = 1.91, 95% CrI: 1.11-3.17), suggesting that gender inequality at the national level contributes to vaccination gaps. GDP per capita categorization showed no significant association in the fully adjusted model. Human Development Index and Gender Inequality Index classifications also showed no significant associations after full adjustment.
Measures of Variations (Random Effects)
As shown in Table 2, in Model 1 (unconditional model), there was significant variation in the odds of zero-dose status across countries (σ² = 2.81, 95% CrI 1.63 to 4.72) and across communities (σ² = 2.59, 95% CrI 2.40 to 2.79). According to the intra-country and intra-community correlation coefficients, 32.4% and 62.1% of the variance in odds of zero-dose status could be attributed to country- and community-level factors, respectively.
The inclusion of explanatory variables progressively reduced the unexplained variance at both levels. Individual-level factors (Model 2) explained 46.0% of the country-level variance and 51.7% of the community-level variance. Community-level factors alone (Model 3) had moderate impact on country-level variance (27.4% explained) and substantially reduced community-level variance by 38.5%. Country-level factors (Model 4) explained 32.5% of country-level variance with minimal effect on community-level variance (0.6% explained).
From the full model (Model 5), which included individual-, community-, and country-level factors, the total explained variance was 61.6% at the country level and 49.7% at the community level. The remaining unexplained variance was 1.08 (95% CrI 0.59 to 1.91) at the country level and 1.30 (95% CrI 1.17 to 1.42) at the community level. The variance partition coefficients in the final model indicated that 19.1% and 42.0% of the remaining variance in zero-dose status could still be attributed to unmeasured country- and community-level factors, respectively.
From the full model (Model 5), it was estimated that if a child moved to another community or another country with a higher probability of zero-dose status, the median increase in their odds of being zero-dose would be 2.97 (95% CrI 2.80 to 3.12) and 2.70-fold (95% CrI 2.08 to 3.74), respectively. These substantial MOR values underscore the important role of contextual factors in shaping vaccination coverage patterns beyond individual-level characteristics.
Discussion
Main Findings
This multilevel analysis of 59,211 children aged 12-23 months from 28 sub-Saharan African countries reveals substantial variation in zero-dose prevalence and identifies critical determinants across individual, community, and country levels. The overall pooled prevalence of zero-dose children was 10.71% (95% CI: 6.90-15.23), with marked heterogeneity ranging from 0.43% in Rwanda to 42.29% in Chad. This variation underscores the complex interplay of factors influencing childhood vaccination outcomes across the region.
We found substantial evidence of geographical clustering in zero-dose vaccination behaviors. In the unconditional model, approximately 62.1% and 32.4% of the variation in zero-dose status among children in sub-Saharan Africa was conditioned by differences between communities and countries, respectively. The median odds ratios from the fully adjusted model revealed that if a child moved to another community or another country with a higher probability of zero-dose status, their odds of being zero-dose would increase by 2.97-fold and 2.70-fold, respectively.
It is intuitive that children from the same community may be more similar to each other in relation to their vaccination status than to others from different communities. This contextual phenomenon expresses itself as clustering of individual vaccination behaviors within communities and countries. The substantial community-level variance (42.0% in the final model) suggests that neighborhood characteristics create shared environments that influence vaccination-seeking behaviors through multiple pathways including social norms, peer influences, collective efficacy, and local healthcare infrastructure. The persistence of significant country-level clustering (19.1% in the final model) indicates that national policies, health system organization, and broader socioeconomic contexts continue to shape vaccination outcomes beyond individual and community characteristics.
The application of the Three Delays Model framework proved highly effective in identifying key barriers to vaccination access and utilization. Consistent with the model's first delay (decision to seek care), maternal health-seeking behavior emerged as the strongest predictor of zero-dose status, with children whose mothers had poor or no antenatal care utilization showing dramatically increased odds (OR = 15.21, 95% CrI: 13.28-17.35). This finding reinforces the critical importance of maternal engagement with health services as a gateway to childhood immunization.
The second delay (reaching care) was manifested through several significant associations. Community-level factors demonstrated clear patterns, with higher community illiteracy rates (OR = 1.11 per unit increase, 95% CrI: 1.08-1.14) and unemployment rates (OR = 1.06 per unit increase, 95% CrI: 1.04-1.09) associated with increased zero-dose prevalence. These factors likely reflect both direct barriers to accessing services and indirect effects through reduced health literacy and economic constraints. Interestingly, rural residence showed no independent association after controlling for other factors, suggesting that geographic barriers are mediated through socioeconomic and health system characteristics rather than distance alone.
Maternal empowerment emerged as a critical determinant bridging the first and second delays. Children of mothers with no decision-making power had 31% higher odds of being zero-dose (OR = 1.31, 95% CrI: 1.21-1.43), while those with no media access showed 28% higher odds (OR = 1.28, 95% CrI: 1.18-1.39). These findings highlight how women's autonomy and access to information directly influence their ability to seek and obtain healthcare services for their children.
Educational gradients were pronounced across multiple domains, reflecting the third delay (receiving quality care) and its intersection with the first two delays. Maternal education showed a clear dose-response relationship, with children of mothers having no formal education showing nearly doubled odds of zero-dose status (OR = 1.84, 95% CrI: 1.36-2.81). Partner education also demonstrated significant effects, with children whose fathers had no education showing 44% higher odds of being zero-dose (OR = 1.44, 95% CrI: 1.17-1.72). These educational effects likely operate through multiple pathways, including health knowledge, service navigation skills, and healthcare provider interactions.
The temporal analysis revealed encouraging trends, with both survey year and child's birth year showing protective effects, indicating gradual improvements in vaccination coverage over time. However, the persistence of substantial zero-dose prevalence suggests that progress remains insufficient to achieve universal coverage goals.
Country-level factors revealed complex relationships that warrant careful interpretation. The counterintuitive finding that children in countries with low health expenditure had higher odds of zero-dose status (OR = 3.45, 95% CrI: 1.85-5.72) aligns with expectations about resource allocation and health system capacity. However, the association between low Gender Development Index and increased zero-dose prevalence (OR = 1.91, 95% CrI: 1.11-3.17) suggests that broader gender inequalities at the societal level compound individual-level maternal disempowerment effects.
The multilevel analysis demonstrated that substantial clustering persists even after accounting for measured factors. The sequential model building revealed that individual-level factors explained the largest proportion of variance (46.0% at country level and 51.7% at community level), followed by community-level factors (27.4% and 38.5%, respectively) and country-level factors (32.5% and 0.6%, respectively). This pattern suggests that while contextual factors are important, household and maternal characteristics remain the primary drivers of vaccination outcomes, emphasizing the need for interventions that address both individual and structural determinants simultaneously.
Comparison with Previous Studies
Our findings align with several recent studies examining zero-dose children in sub-Saharan Africa, while revealing important nuances in the determinants of vaccination coverage. The overall zero-dose prevalence of 10.71% observed in our study falls within the range reported by other continental analyses, though comparisons are complicated by different methodological approaches and time periods. Our findings of highest prevalence in Chad (42.29%) and lowest in Rwanda (0.43%) are consistent with Bangura et al. (2020), who identified similar country-level disparities and highlighted the role of health system strengthening in Rwanda's vaccination success [19].
Our educational gradient findings align with extensive literature documenting the role of parental education in vaccination outcomes. Gram et al. (2019) reported comparable odds ratios for maternal education effects on vaccination in their systematic review of African studies, with no formal education associated with 1.8-fold higher odds of non-vaccination [20]. The significant association with partner education observed in our study extends findings by Antai (2012), who emphasized the importance of paternal characteristics in vaccination decision-making within patriarchal contexts [21].
The community-level clustering effects we observed (42.0% residual variance) are consistent with recent multilevel studies. Ntenda et al. (2019) found similar community-level variance proportions (38-45%) in their analysis of childhood vaccination in Malawi, emphasizing the role of local social norms and healthcare infrastructure [8]. However, our finding that rural residence showed no independent association after adjustment contrasts with some previous studies that reported persistent rural-urban disparities [22], suggesting that socioeconomic factors may mediate geographic effects more completely than previously recognized.
The country-level associations we identified, particularly the relationship between health expenditure and zero-dose prevalence, align with macro-level analyses by Restrepo-Méndez et al. (2016), who demonstrated that national health financing levels were inversely associated with vaccination inequities across countries [14].
Implications for Policy and Future Research
The findings from this comprehensive multilevel analysis provide critical insights for policy development and research priorities aimed at reducing zero-dose children in sub-Saharan Africa. The substantial clustering effects and multifaceted determinants identified suggest that successful interventions must adopt integrated, multi-level approaches rather than focusing on single-factor solutions.
The overwhelming importance of maternal health-seeking behavior (OR = 15.21) underscores the need for integrated maternal and child health service delivery models. Countries should prioritize strengthening antenatal care platforms as entry points for childhood vaccination. The WHO's recommendation for focused antenatal care that explicitly links maternal and child health services provides a framework for such integration. Countries with high zero-dose burdens, particularly in Central and West Africa, should consider implementing maternal health scorecards that track both antenatal care attendance and childhood vaccination initiation as linked indicators.
The pronounced educational gradients observed necessitate targeted interventions addressing health literacy and maternal empowerment. Evidence from community-based intervention studies suggests that peer education programs and women's group interventions can effectively bridge educational gaps in health knowledge [14,23]. The significant association with partner education highlights the need for male engagement strategies in vaccination programs [24] [4]. Policy frameworks should explicitly address gender dynamics in vaccination decision-making, particularly in contexts where women have limited autonomy.
The persistence of substantial community-level clustering (42.0% residual variance) indicates that place-based interventions remain essential. The association between community illiteracy and zero-dose prevalence suggests that broader education initiatives may have spillover effects on vaccination coverage, supporting arguments for intersectoral collaboration between education and health ministries.
Country-level findings reveal the critical importance of adequate health financing and gender-equitable development policies. The association between low health expenditure and increased zero-dose prevalence reinforces calls for increased domestic and international investment in health systems. Countries should prioritize reaching the Abuja Declaration target of 15% of government budgets allocated to health, with specific emphasis on primary healthcare and immunization services. The relationship between Gender Development Index and vaccination outcomes suggests that broader gender equality initiatives may have positive externalities for child health outcomes.
The substantial unexplained variance at both community and country levels (42.0% and 19.1%, respectively) highlights critical knowledge gaps requiring urgent research attention. Mixed-methods studies combining quantitative surveys with qualitative ethnographic approaches are needed to understand unmeasured community-level factors, including local health system performance, traditional beliefs, and social network influences. Implementation science research should investigate how successful vaccination programs can be adapted and scaled across diverse contexts, particularly examining the mechanisms underlying Rwanda's exceptional performance.
The complex relationship between health expenditure and vaccination outcomes requires deeper investigation through health systems research. Studies should examine the efficiency of health spending, quality of service delivery, and governance mechanisms that mediate the relationship between financial inputs and vaccination outcomes [25]. Longitudinal studies tracking countries' vaccination performance alongside health system investments could provide critical insights for optimal resource allocation.
Research is urgently needed to understand the mechanisms linking gender inequality at multiple levels to vaccination outcomes. Studies should investigate how national-level gender policies translate into household-level empowerment and healthcare decision-making [26]. Intervention research testing gender-transformative approaches to vaccination programs could provide evidence for scaling successful models.
Given the persistent rural-urban disparities in some contexts, research should investigate innovative service delivery models for hard-to-reach populations. Mobile health technologies, community health worker programs, and seasonal vaccination campaigns require rigorous evaluation to determine optimal implementation strategies. Cost-effectiveness analyses of different delivery modalities are essential for informing resource allocation decisions in resource-constrained settings.
Study Strengths and Limitations
This study presents several notable strengths that enhance the validity and generalizability of our findings. The analysis utilized a large, representative sample of 59,211 children from 28 sub-Saharan African countries, providing substantial statistical power and broad geographic coverage across diverse socioeconomic and health system contexts [16]. The use of standardized DHS methodology ensures comparability across countries and time periods, addressing concerns about data harmonization that often plague multi-country analyses.
The application of multilevel modeling represents a methodological strength, appropriately accounting for the hierarchical structure of the data and clustering effects at community and country levels. This analytical approach provides more accurate estimates of associations and variance components compared to single-level analyses, which can produce biased standard errors and misleading inferences [27]. The sequential model-building strategy allowed for systematic examination of how different levels of factors contribute to zero-dose patterns, providing insights into the relative importance of individual, community, and country-level determinants.
The theoretical framework based on the Three Delays Model provided a structured approach to variable selection and interpretation, ensuring that our analysis addressed key pathways to vaccination coverage systematically [9]. This framework has been successfully applied to various health outcomes and provides a robust foundation for understanding barriers to healthcare access and utilization [11]. The inclusion of both compositional and contextual factors at multiple levels aligns with current best practices in health services research and social epidemiology [12].
The use of recent DHS data ensures contemporary relevance of findings, capturing recent trends in vaccination coverage and health system performance. The temporal analysis examining both survey year and birth year effects provides insights into vaccination trends while controlling for potential cohort effects.
Despite these strengths, several limitations must be acknowledged when interpreting our findings. The cross-sectional design precludes causal inference, as temporal relationships between exposures and outcomes cannot be established definitively. While the associations observed are consistent with theoretical expectations and previous research, longitudinal studies would be needed to confirm causal pathways, particularly for modifiable factors such as maternal empowerment and community-level characteristics.
The DHS relies on maternal recall for vaccination status, which may introduce information bias. Studies have shown that maternal recall can underestimate vaccination coverage compared to health facility records, particularly for children without vaccination cards [28]. However, the DHS methodology has been extensively validated and remains the gold standard for population-based vaccination coverage estimates in low- and middle-income countries [29]. The binary coding of zero-dose status, while aligned with WHO definitions, may not capture the complexity of partial vaccination patterns that could provide additional insights into vaccination barriers.
The analysis was constrained by variables available in DHS datasets, potentially omitting important determinants of vaccination coverage. Key unmeasured factors may include healthcare provider characteristics, vaccine availability and stockouts, service quality, and cultural beliefs about vaccination [15]. The substantial residual variance at community and country levels (42.0% and 19.1%, respectively) suggests that important contextual factors remain unaccounted for in our models.
Finally, The aggregation of community-level variables from individual responses may not accurately reflect true community characteristics, particularly in areas with small sample sizes or high heterogeneity. Similarly, the use of median splits for country-level variables, while improving interpretability, may mask important non-linear relationships and reduce statistical power to detect associations [30].
Conclusions
This comprehensive multilevel analysis reveals that zero-dose children in sub-Saharan Africa are concentrated among the most disadvantaged populations, with substantial clustering at both community and country levels. The application of the Three Delays Model successfully identified critical barriers across the healthcare-seeking pathway, with maternal health-seeking behavior emerging as the most powerful predictor of vaccination status. The pronounced educational gradients, maternal empowerment effects, and community-level determinants underscore the multifaceted nature of vaccination inequities.
The findings demonstrate that addressing zero-dose children requires coordinated interventions spanning individual, community, and national levels. Strategies must integrate maternal and child health services, strengthen community-level health literacy and infrastructure, and ensure adequate health system financing with attention to gender equity. The substantial unexplained variance at community and country levels indicates that context-specific factors remain critically important, suggesting that one-size-fits-all approaches are unlikely to succeed.
The marked heterogeneity in zero-dose prevalence across countries, ranging from less than 1% to over 40%, demonstrates that achieving universal vaccination coverage is feasible but requires sustained commitment to health system strengthening and addressing underlying social determinants. The temporal improvements observed provide encouraging evidence that progress is possible, though current rates of improvement remain insufficient to achieve global vaccination targets.
Future efforts to eliminate zero-dose children must adopt integrated, equity-focused approaches that address the complex interplay of individual, social, and structural determinants identified in this analysis. Success will require not only strengthened vaccination programs but also broader investments in education, gender equality, and health system capacity that address the root causes of vaccination inequities in sub-Saharan Africa.
Conflict of interests
The authors declare no competing interests. The views and opinions expressed in this article are those of the authors only and do not necessarily represent those of their affiliated organisations.
Author Contributions
Conceptualisation – CSW and OAU; Methods – OAU; writing and reviewing drafts – CSW, MMBU, DN, and OAU
Funding
No funding was received for this article.
Appendix

Table A1.
Variable Definitions and Three Delays Framework Classification.
References
- Andre FE, Booy R, Bock HL, Clemens J, Datta SK, John TJ, Lee BW, Lolekha S, Peltola H, Ruff TA et al: Vaccination greatly reduces disease, disability, death and inequity worldwide. Bull World Health Organ 2008, 86(2):140-146.
- Gavi Alliance: Progress and challenges with achieving universal immunization coverage: 2019 estimates of immunization coverage. Geneva: Gavi; 2020.
- World Health Organization: Immunization Agenda 2030: a global strategy to leave no one behind. Geneva: WHO Press; 2020.
- UNICEF: The state of the world's children 2023: for every child, vaccination. New York: UNICEF; 2023.
- Causey K, Fullman N, Sorensen RJD, Galles NC, Zheng P, Aravkin A, Danovaro-Holliday MC, Martinez-Piedra R, Sodha SV, Velandia-Gonzalez MP et al: Estimating global and regional disruptions to routine childhood vaccine coverage during the COVID-19 pandemic in 2020: a modelling study. Lancet 2021, 398(10299):522-534.
- Antai D: Faith and child survival: the role of religion in childhood immunization in Nigeria. J Biosoc Sci 2009, 41(1):57-76.
- Wiysonge CS, Uthman OA, Ndumbe PM, Hussey GD: Individual and contextual factors associated with low childhood immunisation coverage in sub-Saharan Africa: a multilevel analysis. PLoS One 2012, 7(5):e37905.
- Ntenda PAM, Chuang KY, Tiruneh FN, Chuang YC: Analysis of the effects of individual and community level factors on childhood immunization in Malawi. Vaccine 2017, 35(15):1907-1917.
- Thaddeus S, Maine D: Too far to walk: maternal mortality in context. Soc Sci Med 1994, 38(8):1091-1110.
- Masters SH, Burstein R, Amofah G, Abaogye P, Kumar S, Hanlon M: Travel time to maternity care and its effect on utilization in rural Ghana: a multilevel analysis. Soc Sci Med 2013, 93:147-154.
- Gabrysch S, Campbell OM: Still too far to walk: literature review of the determinants of delivery service use. BMC Pregnancy Childbirth 2009, 9:34.
- Diez-Roux AV: Multilevel analysis in public health research. Annu Rev Public Health 2000, 21(1):171-192.
- Subramanian SV, Jones K, Kaddour A, Krieger N: Revisiting Robinson: the perils of individualistic and ecologic fallacy. Int J Epidemiol 2009, 38(2):342-360; author reply 370-343.
- Restrepo-Mendez MC, Barros AJ, Wong KL, Johnson HL, Pariyo G, Franca GV, Wehrmeister FC, Victora CG: Inequalities in full immunization coverage: trends in low- and middle-income countries. Bull World Health Organ 2016, 94(11):794-805B.
- Phillips DE, Dieleman JL, Lim SS, Shearer J: Determinants of effective vaccine coverage in low and middle-income countries: a systematic review and interpretive synthesis. BMC Health Serv Res 2017, 17(1):681.
- Corsi DJ, Neuman M, Finlay JE, Subramanian SV: Demographic and health surveys: a profile. Int J Epidemiol 2012, 41(6):1602-1613.
- Aliaga A, Ren R: Optimal sample sizes for two-stage cluster sampling in demographic and health surveys. DHS Working Papers No. 30. Calverton, Maryland: ORC Macro; 2006.
- Kravdal Ø: A simulation-based assessment of the bias produced when using averages from small DHS clusters as contextual variables in multilevel models. Demographic Research 2006, 15(1):1-20.
- Bangura JB, Xiao S, Qiu D, Ouyang F, Chen L: Barriers to childhood immunization in sub-Saharan Africa: A systematic review. BMC Public Health 2020, 20(1):1108.
- Gram L, Soremekun S, ten Asbroek A, Manu A, O'Leary M, Hill Z, Danso S, Amenga-Etego S, Owusu-Agyei S, Kirkwood BR: Socio-economic determinants and inequities in coverage and timeliness of early childhood immunisation in rural Ghana. Trop Med Int Health 2014, 19(7):802-811.
- Antai D: Gender inequities, relationship power, and childhood immunization uptake in Nigeria: a population-based cross-sectional study. Int J Infect Dis 2012, 16(2):e136-145.
- Adedokun ST, Uthman OA, Adekanmbi VT, Wiysonge CS: Incomplete childhood immunization in Nigeria: a multilevel analysis of individual and contextual factors. BMC Public Health 2017, 17(1):236.
- Prost A, Colbourn T, Seward N, Azad K, Coomarasamy A, Copas A, Houweling TA, Fottrell E, Kuddus A, Lewycka S et al: Women's groups practising participatory learning and action to improve maternal and newborn health in low-resource settings: a systematic review and meta-analysis. Lancet 2013, 381(9879):1736-1746.
- Tokhi M, Comrie-Thomson L, Davis J, Portela A, Chersich M, Luchters S: Involving men to improve maternal and newborn health: A systematic review of the effectiveness of interventions. PLoS One 2018, 13(1):e0191620.
- Hanson K, Ranson MK, Oliveira-Cruz V, Mills A: Expanding access to priority health interventions: a framework for understanding the constraints to scaling-up. Journal of International Development 2003, 15(1):1-14.
- Heise L, Greene ME, Opper N, Stavropoulou M, Harper C, Nascimento M, Zewdie D, Gender Equality N, Health Steering C: Gender inequality and restrictive gender norms: framing the challenges to health. Lancet 2019, 393(10189):2440-2454.
- Goldstein H: Multilevel Statistical Models: Wiley; 2010.
- Miles M, Ryman TK, Dietz V, Zell E, Luman ET: Validity of vaccination cards and parental recall to estimate vaccination coverage: a systematic review of the literature. Vaccine 2013, 31(12):1560-1568.
- Cutts FT, Izurieta HS, Rhoda DA: Measuring coverage in MNCH: design, implementation, and interpretation challenges associated with tracking vaccination coverage using household surveys. PLoS Med 2013, 10(5):e1001404.
- MacCallum RC, Zhang S, Preacher KJ, Rucker DD: On the practice of dichotomization of quantitative variables. Psychol Methods 2002, 7(1):19-40.
Figure 1.
Variations in Zero-dose Children Across Countries.
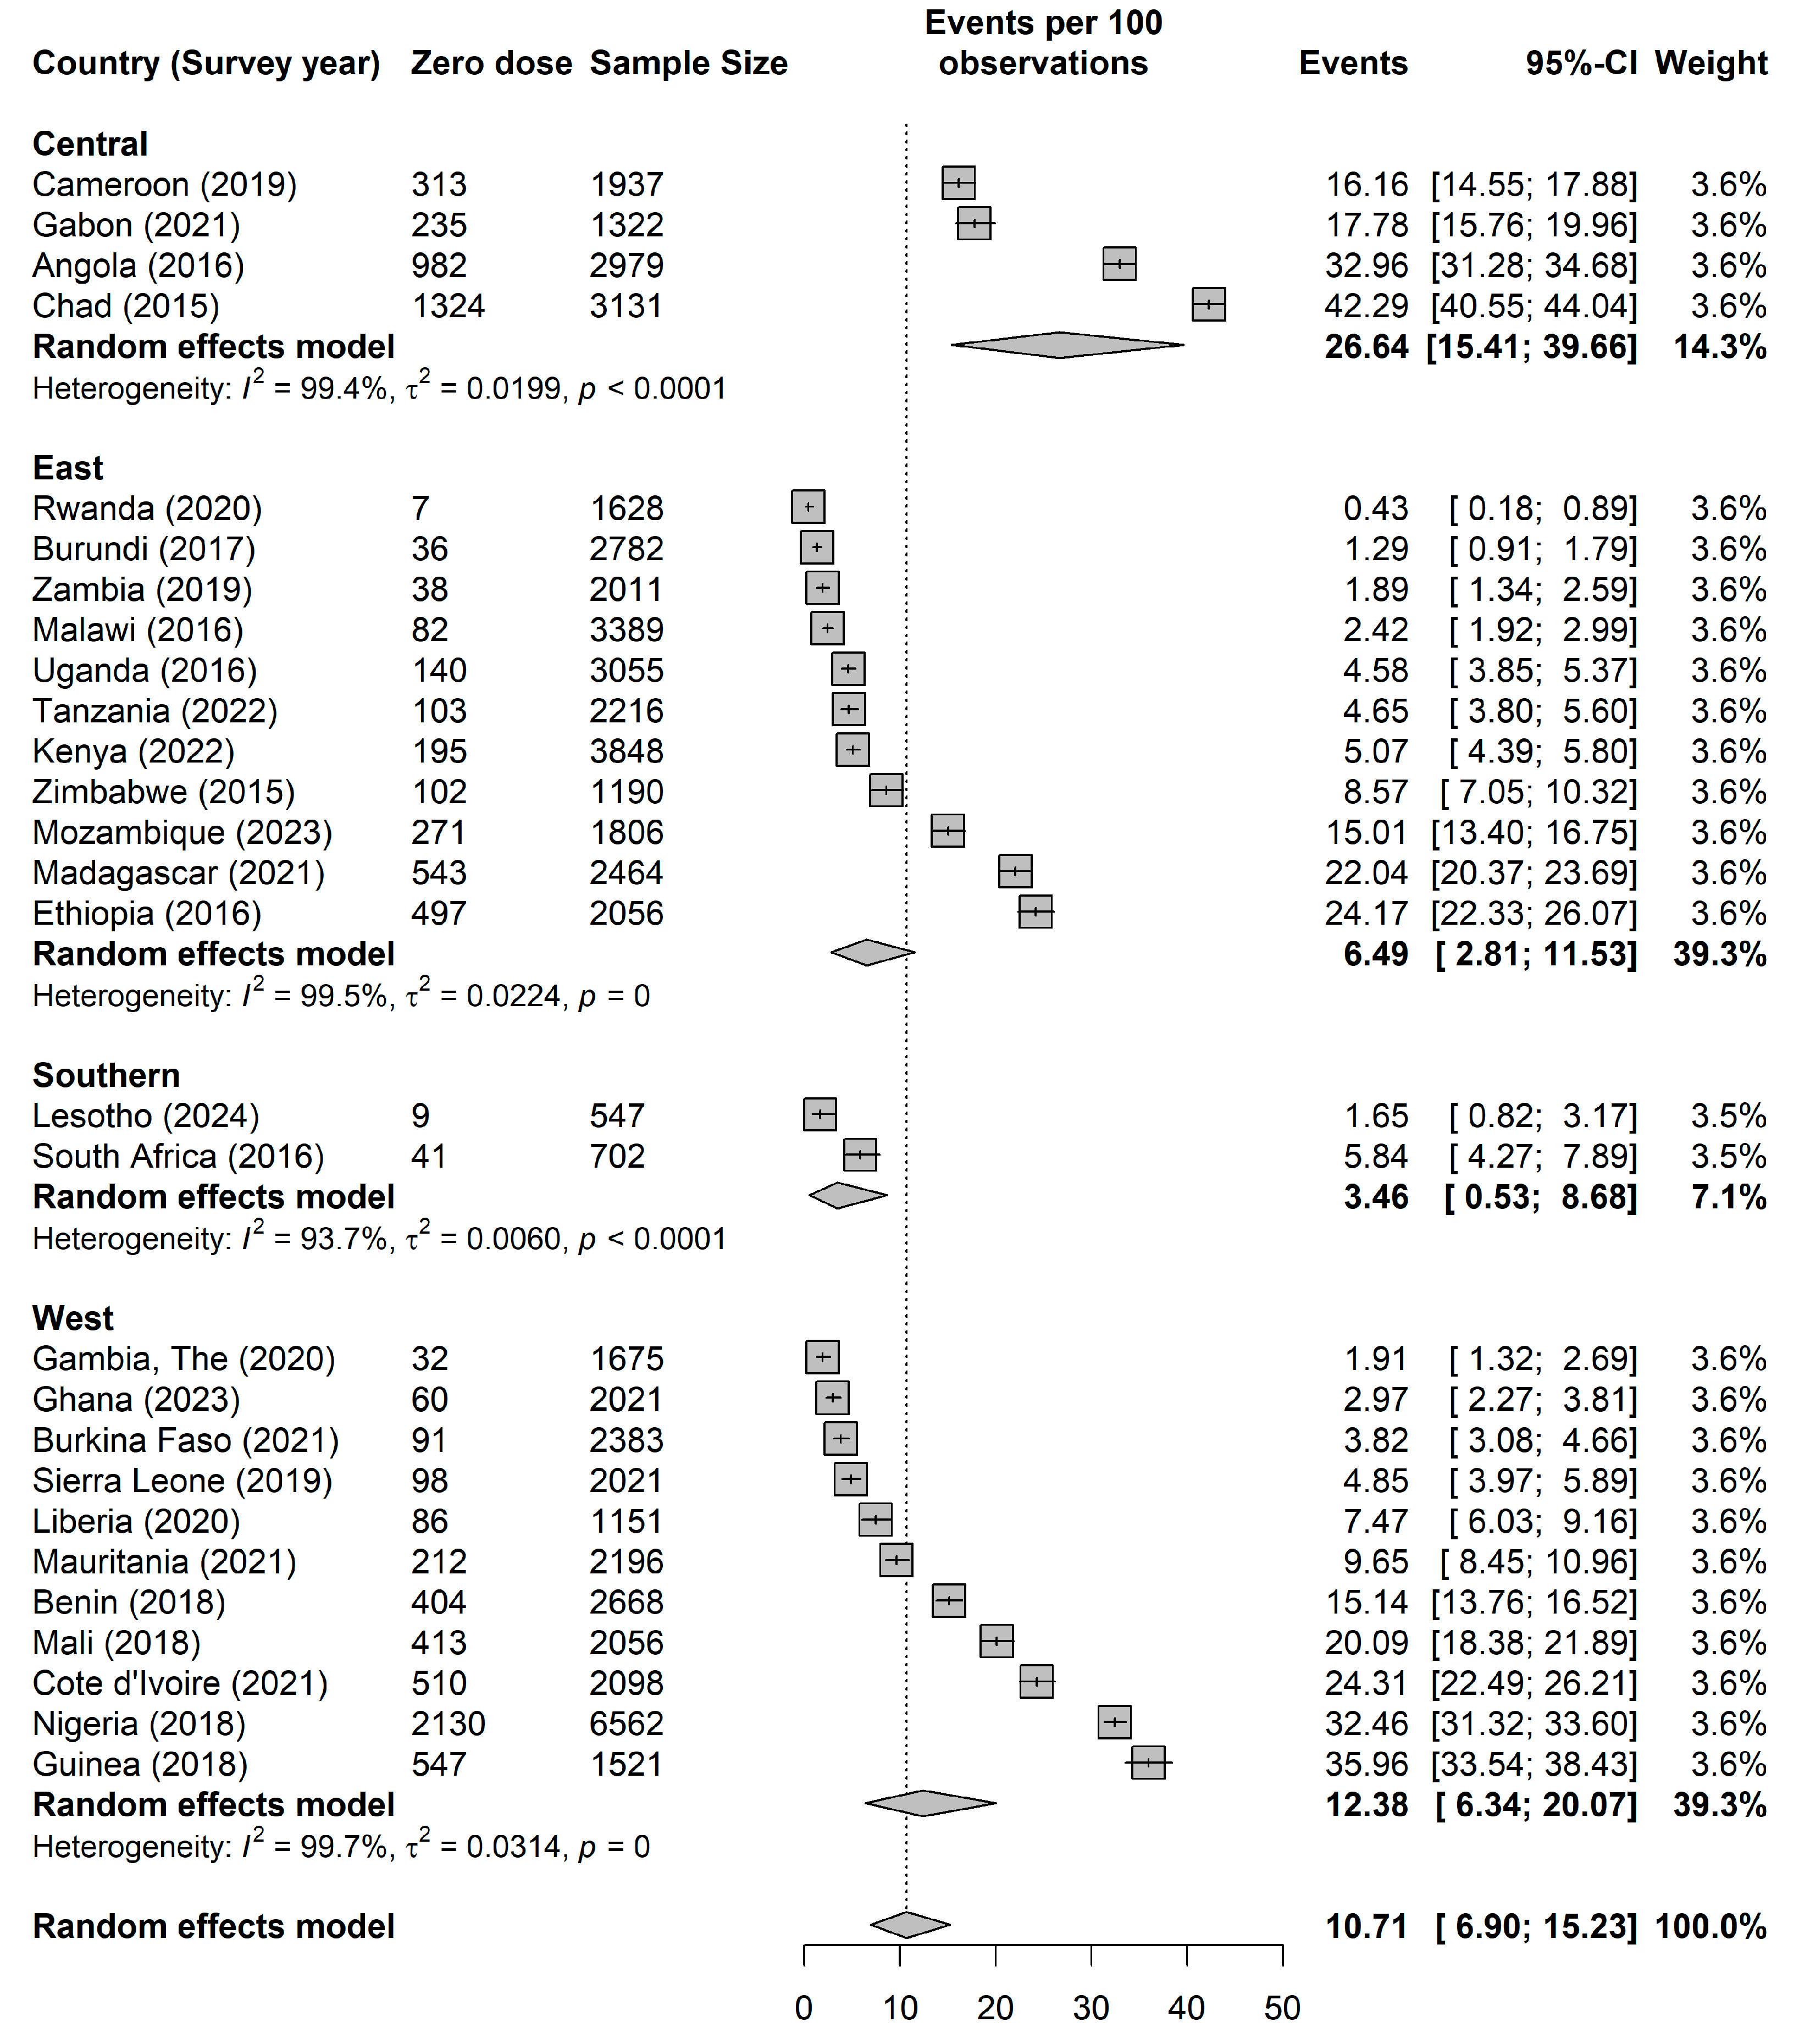
Table 1.
Summary of pooled sample characteristics of the Demographic and Health Surveys data in sub-Saharan Africa.
Table 1.
Summary of pooled sample characteristics of the Demographic and Health Surveys data in sub-Saharan Africa.
| Zero dose | |||
| No | Yes | Total | |
| N | 49,991 (84.4%) | 9,220 (15.6%) | 59,211 (100.0%) |
| Survey year | 2019 [2017 2021] | 2018 [2016 2020] | 2018 [2016 2021] |
| Birth year | 2017 [2,015 2,020] | 2,017 [2,014 2,018] | 2,017 [2,015 2,019] |
| Maternal age | |||
| Young Adult | 16,578 (33.2%) | 3,220 (34.9%) | 19,797 (33.4%) |
| Adult | 30,177 (60.4%) | 5,324 (57.7%) | 35,501 (60.0%) |
| Middle-Aged /Older Adult | 3,236 (6.5%) | 676 (7.3%) | 3,912 (6.6%) |
| Maternal age | |||
| no education | 15,041 (30.1%) | 5,791 (62.8%) | 20,832 (35.2%) |
| primary | 17,442 (34.9%) | 2,079 (22.5%) | 19,520 (33.0%) |
| secondary | 14,708 (29.4%) | 1,197 (13.0%) | 15,905 (26.9%) |
| higher | 2,800 (5.6%) | 153 (1.7%) | 2,954 (5.0%) |
| Wealth index | |||
| poorest | 10,227 (20.5%) | 3,185 (34.5%) | 13,412 (22.7%) |
| poorer | 10,324 (20.7%) | 2,400 (26.0%) | 12,724 (21.5%) |
| middle | 10,215 (20.4%) | 1,705 (18.5%) | 11,920 (20.1%) |
| richer | 9,919 (19.8%) | 1,189 (12.9%) | 11,108 (18.8%) |
| richest | 9,305 (18.6%) | 741 (8.0%) | 10,046 (17.0%) |
| husband/partner's education level | |||
| no education | 12,094 (29.5%) | 4,627 (58.3%) | 16,721 (34.1%) |
| primary | 12,673 (30.9%) | 1,712 (21.6%) | 14,385 (29.4%) |
| secondary | 12,381 (30.1%) | 1,303 (16.4%) | 13,684 (27.9%) |
| higher | 3,917 (9.5%) | 288 (3.6%) | 4,205 (8.6%) |
| Antenatal visits | |||
| no visit | 3,233 (6.7%) | 3,638 (41.3%) | 6,871 (12.1%) |
| lessthan4 | 14,075 (29.3%) | 2,350 (26.7%) | 16,425 (28.9%) |
| 4 or more | 30,695 (63.9%) | 2,820 (32.0%) | 33,515 (59.0%) |
| Parity | |||
| 1 | 11,426 (22.9%) | 1,502 (16.3%) | 12,928 (21.8%) |
| 2 | 10,328 (20.7%) | 1,639 (17.8%) | 11,967 (20.2%) |
| 3 | 8,412 (16.8%) | 1,462 (15.9%) | 9,874 (16.7%) |
| 4 | 6,422 (12.8%) | 1,135 (12.3%) | 7,558 (12.8%) |
| 5 | 4,616 (9.2%) | 1,030 (11.2%) | 5,646 (9.5%) |
| 6 | 3,390 (6.8%) | 792 (8.6%) | 4,182 (7.1%) |
| 7 | 2,360 (4.7%) | 593 (6.4%) | 2,954 (5.0%) |
| 8 | 1,459 (2.9%) | 438 (4.8%) | 1,897 (3.2%) |
| 9 | 790 (1.6%) | 269 (2.9%) | 1,059 (1.8%) |
| 10 | 786 (1.6%) | 360 (3.9%) | 1,146 (1.9%) |
| Not working | |||
| 0 | 31,171 (62.4%) | 4,967 (53.9%) | 36,139 (61.0%) |
| 1 | 18,819 (37.6%) | 4,252 (46.1%) | 23,072 (39.0%) |
| No decision-making power | |||
| 0 | 32,902 (65.8%) | 5,022 (54.5%) | 37,924 (64.0%) |
| 1 | 17,089 (34.2%) | 4,197 (45.5%) | 21,286 (36.0%) |
| nomedia | |||
| 0 | 33,253 (66.5%) | 3,890 (42.2%) | 37,143 (62.7%) |
| 1 | 16,738 (33.5%) | 5,330 (57.8%) | 22,068 (37.3%) |
| No media access | |||
| 0 | 623 (1.2%) | 2,961 (32.1%) | 3,585 (6.1%) |
| 1 | 1,453 (2.9%) | 933 (10.1%) | 2,386 (4.0%) |
| 2 | 4,712 (9.4%) | 2,152 (23.3%) | 6,864 (11.6%) |
| 3 | 15,902 (31.8%) | 2,008 (21.8%) | 17,911 (30.2%) |
| 4 | 27,300 (54.6%) | 1,165 (12.6%) | 28,465 (48.1%) |
| Household size | |||
| 1 | 89 (0.2%) | 14 (0.2%) | 104 (0.2%) |
| 2 | 856 (1.7%) | 144 (1.6%) | 1,000 (1.7%) |
| 3 | 6,312 (12.6%) | 903 (9.8%) | 7,215 (12.2%) |
| 4 | 7,987 (16.0%) | 1,288 (14.0%) | 9,275 (15.7%) |
| 5 | 7,859 (15.7%) | 1,440 (15.6%) | 9,298 (15.7%) |
| 6 | 7,163 (14.3%) | 1,186 (12.9%) | 8,349 (14.1%) |
| 7 | 5,434 (10.9%) | 1,022 (11.1%) | 6,456 (10.9%) |
| 8 | 3,990 (8.0%) | 852 (9.2%) | 4,842 (8.2%) |
| 9 | 2,718 (5.4%) | 615 (6.7%) | 3,333 (5.6%) |
| 10 | 7,583 (15.2%) | 1,756 (19.0%) | 9,339 (15.8%) |
| Money problem accessing care | |||
| No | 26,005 (52.0%) | 3,927 (42.6%) | 29,932 (50.6%) |
| Yes | 23,986 (48.0%) | 5,293 (57.4%) | 29,278 (49.4%) |
| Distance problem accessing care | |||
| No | 32,843 (65.7%) | 5,024 (54.5%) | 37,867 (64.0%) |
| Yes | 17,148 (34.3%) | 4,195 (45.5%) | 21,344 (36.0%) |
| Health insurance | |||
| No | 10,294 (20.6%) | 1,258 (13.6%) | 11,552 (19.5%) |
| Yes | 39,697 (79.4%) | 7,962 (86.4%) | 47,658 (80.5%) |
| Place of resident | |||
| Urban | 17,628 (35.3%) | 2,154 (23.4%) | 19,782 (33.4%) |
| Rural | 32,362 (64.7%) | 7,066 (76.6%) | 39,429 (66.6%) |
| Community poverty rate | 20.9 (26.6) | 32.6 (32.2) | 22.7 (27.8) |
| Community illiteracy rate | 32.2 (31.4) | 59.6 (33.7) | 36.5 (33.2) |
| Community unemployment rate | 30.2 (27.0) | 30.8 (31.3) | 30.3 (27.8) |
| Gross domestic product | 3967.3 (3199.2) | 4360.7 (3275.6) | 4028.6 (3214.4) |
| Percentage health expenditure | 5.0 (1.9) | 4.3 (1.3) | 4.9 (1.8) |
| Human development index | 0.5 (0.1) | 0.5 (0.1) | 0.5 (0.1) |
| Gender Development Index | 0.9 (0.0) | 0.9 (0.1) | 0.9 (0.0) |
| Gender Inequality Index | 0.6 (0.1) | 0.6 (0.1) | 0.6 (0.1) |
Table 2.
Individual compositional and contextual factors associated with zero-dose children.
| Variable | Model 1 | Model 2 | Model 3 | Model 4 | Model 5 |
| OR (95% CrI) | OR (95% CrI) | OR (95% CrI) | OR (95% CrI) | OR (95% CrI) | |
| Measures of associations (Fixed Effects Model) | |||||
| Individual -level factors | |||||
| Survey year | 0.95 (0.95-0.95) | 0.95 (0.95-0.95) | |||
| Birth year | 0.97 (0.97-0.97) | 0.97 (0.97-0.97) | |||
| Maternal age | |||||
| Young adult | 1.73 (1.42-2.04) | 1.59 (1.34-1.89) | |||
| Adult | 1.25 (1.07-1.44) | 1.20 (1.05-1.37) | |||
| Middle-Age/Older Adult | |||||
| Education | |||||
| No education | 2.39 (1.94-2.87) | 1.84 (1.36-2.81) | |||
| Primary | 1.53 (1.24-1.84) | 1.40 (1.05-2.06) | |||
| Secondary | 1.24 (0.99-1.50) | 1.17 (0.89-1.67) | |||
| Tertiary | |||||
| Wealth | |||||
| Poorest | 1.33 (1.13-1.57) | 1.14 (0.95-1.34) | |||
| Poorer | 1.19 (1.01-1.41) | 1.11 (0.92-1.30) | |||
| Middle | 1.18 (1.01-1.38) | 1.11 (0.94-1.28) | |||
| Richer | 0.96 (0.82-1.12) | 0.93 (0.79-1.07) | |||
| Richest | |||||
| Partner Education | |||||
| No education | 1.56 (1.28-1.94) | 1.44 (1.17-1.72) | |||
| Primary | 1.21 (1.00-1.47) | 1.27 (1.02-1.54) | |||
| Secondary | 1.04 (0.87-1.27) | 1.09 (0.90-1.29) | |||
| Tertiary | |||||
| Parity | 1.04 (1.02-1.06) | 1.04 (1.02-1.06) | |||
| Not working | 1.26 (1.16-1.37) | 1.13 (1.04-1.23) | |||
| No decision-making power | 1.33 (1.22-1.45) | 1.31 (1.21-1.43) | |||
| No media access | 1.32 (1.21-1.44) | 1.28 (1.18-1.39) | |||
| Household size | 1.00 (0.98-1.02) | 1.00 (0.98-1.02) | |||
| Money problem accessing care | 1.03 (0.94-1.13) | 1.05 (0.96-1.15) | |||
| Distance problem accessing care | 1.10 (1.01-1.20) | 1.07 (0.98-1.17) | |||
| Money problem accessing care | 2.09 (1.91-2.28) | 1.98 (1.81-2.17) | |||
| No health insurance | 1.09 (0.86-1.30) | 1.11 (0.94-1.27) | |||
| Poor / No maternal health seeking | 15.90 (13.93-18.09) | 15.21 (13.28-17.35) | |||
| Community -level factors | |||||
| Rural resident | 1.22 (1.11-1.35) | 0.91 (0.80-1.01) | |||
| Community poverty rate | 1.07 (1.06-1.09) | 1.01 (0.99-1.03) | |||
| Community illiteracy rate | 1.31 (1.28-1.33) | 1.11 (1.08-1.14) | |||
| Community unemployment rate | 1.09 (1.07-1.12) | 1.06 (1.04-1.09) | |||
| Societal -level factors | |||||
| Gross domestic product | 0.26 (0.17-0.36) | 1.26 (0.53-2.21) | |||
| Percentage health expenditure | 1.68 (1.16-2.84) | 3.45 (1.85-5.72) | |||
| Human development index | 1.81 (0.97-3.17) | 0.82 (0.42-1.82) | |||
| Gender Development Index | 7.26 (3.91-13.57) | 1.91 (1.11-3.17) | |||
| Gender Inequality Index | 1.67 (1.02-2.88) | 0.87 (0.39-1.50) | |||
| Measures of variations (random effects) | |||||
| Country-level | |||||
| Variance (95% CrI) | 2.81 (1.63-4.72) | 1.52 (0.87-2.64) | 2.04 (1.18-3.56) | 1.90 (1.05-3.30) | 1.08 (0.59-1.91) |
| VPC (%) | 32.4 (22.3-43.7) | 25.1 (16.5-36.1) | 29.5 (19.8-41.5) | 24.5 (16.5-35.2) | 19.1 (11.6-28.8) |
| MOR (95% CrI) | 4.95 (3.38-7.94) | 3.24 (2.43-4.71) | 3.91 (2.82-6.05) | 3.72 (2.66-5.65) | 2.70 (2.08-3.74) |
| Explained variance (%) | reference | 46.0 (44.1-46.8) | 27.4 (24.6-27.8) | 32.5 (30.1-35.7) | 61.6 (59.5-64.0) |
| Community-level | |||||
| Variance (95% CrI) | 2.59 (2.40-2.79) | 1.25 (1.10-1.39) | 1.59 (1.46-1.73) | 2.57 (2.38-2.78) | 1.30 (1.17-1.42) |
| VPC (%) | 62.1 (55.0-69.5) | 45.7 (37.4-55.0) | 52.5 (44.5-61.6) | 57.6 (51.0-64.9) | 42.0 (34.7-50.3) |
| MOR (95% CrI) | 4.64 (4.38-4.92) | 2.91 (2.72-3.08) | 3.33 (3.17-3.51) | 4.62 (4.36-4.91) | 2.97 (2.80-3.12) |
| Explained variance (%) | reference | 51.7 (50.2-54.2) | 38.5 (38.0-39.1) | 0.6 (0.4-0.8) | 49.7 (49.1-51.4) |
OR odds ratio, CrI
credible interval, MOR median odds ratio, VPC variance partition coefficient.
Model 1 – baseline model without any explanatory variables (unconditional
model). Model 2 – adjusted for only individual-level factors. Model 3 –
adjusted for only community-level factors. Model 4 – adjusted for only
country-level factors. Model 5 – adjusted for individual-, community-, and
country-level factors (full model).
Disclaimer/Publisher’s Note: The statements, opinions and data contained in all publications are solely those of the individual author(s) and contributor(s) and not of MDPI and/or the editor(s). MDPI and/or the editor(s) disclaim responsibility for any injury to people or property resulting from any ideas, methods, instructions or products referred to in the content. |
© 2025 by the authors. Licensee MDPI, Basel, Switzerland. This article is an open access article distributed under the terms and conditions of the Creative Commons Attribution (CC BY) license (http://creativecommons.org/licenses/by/4.0/).
Copyright: This open access article is published under a Creative Commons CC BY 4.0 license, which permit the free download, distribution, and reuse, provided that the author and preprint are cited in any reuse.


