Submitted:
18 August 2025
Posted:
20 August 2025
Read the latest preprint version here
Abstract
Settlement-relevant load combinations play a critical role in the serviceability design of buildings, particularly for structures on soils with time-dependent deformation behavior. While permanent loads must be fully considered, the contribution of variable actions de-pends on their duration relative to soil response. This study investigates appropriate set-tlement-relevant load combinations for structural design by combining literature data, numerical analysis, and parametric simulations of two structural systems (wall-type and frame-type) on different soil types. Numerical analyses in PLAXIS 3D evaluate the influ-ence of different load combinations and soil permeability on settlement distribution and load redistribution. Results show that for coarse-grained soils under drained conditions, the reduced characteristic load combination (including αn) offers a balanced, realistic, and safe choice regarding the force redistribution within the building, while for fine-grained soils the quasi-permanent combination is recommended. National Annexes from the UK and France allow further reduction through lower αn values, potentially improving design efficiency without compromising safety. Sequenced loading concepts after long-term con-solidation are negligible for settlement-relevant design but may be considered in stratified soils.
Keywords:
soil-structure interaction
; nonlinear soil modeling
; settlement relevant load combination
; FEM
; structural design
1. Introduction
Various approaches can be found in the literature regarding appropriate load assumptions for settlement analysis. Across all reviewed sources, there is consensus that permanent actions, particularly the self-weight of the structure, should be fully considered, whereas variable actions such as imposed or live loads should only be taken into account to a limited extent . In this regard, Eurocode EN 1990 provides a valuable framework through its classification of rare, frequent, and quasi-permanent load combinations, each associated with combination factors ψ0, ψ1, and ψ2. These factors account for the probability and persistence of variable actions. Based on this assumptions [1] is recomanding the quasi permanent load comabination for fine grained soils and together with [2] the frequent load combination for coarse grained soils. In [3] and [4] its suggested to take the dead load an only the permanent live load proportion into account, but its not described in detail what should be considered as permanent live load. In [5] a factor of 0.1 – 0.2 is applied on the variable loads whereas [6] suggest 0.7 as factor. Fischer [7] recommends the quasi permanent load combination in general including a quasi permanent wind component of 0.2 as settlement relvevant for slim, high buildings.
As mentioned in these sources the key factor influencing the relevance of variable loads for settlement is their duration of action relative to the time-dependent deformation behavior of the soil. In [8] this behavior is investigated related to the suggested load combinations. In drained, coarse-grained soils (e.g. sands or gravels), loads act directly as effective stresses and result in immediate deformation. In such cases, a larger share of the variable load can be assumed to contribute to settlement (Figure 1.a).
In contrast, undrained or time-dependent fine-grained soils (e.g. silts or clays) exhibit delayed deformation mechanisms such as consolidation and creep. In these materials, loads only develop significant settlement-relevant stresses after sufficient time has passed. Short-term actions are therefore generally negligible in the context of long-term settlement—except for the immediate undrained initial deformation (Figure 1.b).
To assume the overall settlement behavior in fine grained soils with low permiabilety right, a proper assumption of the permanent live loads has to be done. Live load Measurements of [9] show some deviations compared to its quasi permanent proportion within the Eurocode [10] and are given in Figure 2.
Considering cultural and regional differences, several studies from different countries – including [11,12,13,14,15]– provide extensive data on sustained live loads in office buildings. Variations between results can be attributed to cultural practices, office usage, equipment, survey methodology, time intervals, and sample sizes. Reported mean values range between 0.31 kN/m2 and 0.83 kN/m2, with an average standard deviation of about 0.40 kN/m2. A trend towards lower sustained loads with increasing floor area is evident. Peaks such as the 2.05 kN/m2 measured in a storage room are rare and highly localized. This studys are discussed in detail in [16] As illustrated in Figure 3, measured sustained loads are generally lower than the Eurocode ψ2-based design value, which may be considered in settlement-relevant load combinations and can be assumed as the lower boundary condition for loading.
The upper bound of the settlement-relevant load range is defined by the characteristic combination of live loads. Stochastic simulations of live loads in [17] and[18] demonstrate that the characteristic values prescribed in Eurocode [19] and national annexes are generally conservative, especially for office buildings and applies relatively high α-reduction factors, particularly for multiple floors, resulting in limited load reduction. In contrast, the UK National Annex [20] permits significantly lower α-values, allowing more substantial reductions with increasing number of floors, while the French annex [21] adopts intermediate values, considering differences between office- and residential buildings. These differences highlight the potential for a more differentiated and less conservative approachs, aligning better with probabilistic results without compromising safety and may be a acceptably assumption for drained coarse grained soils.
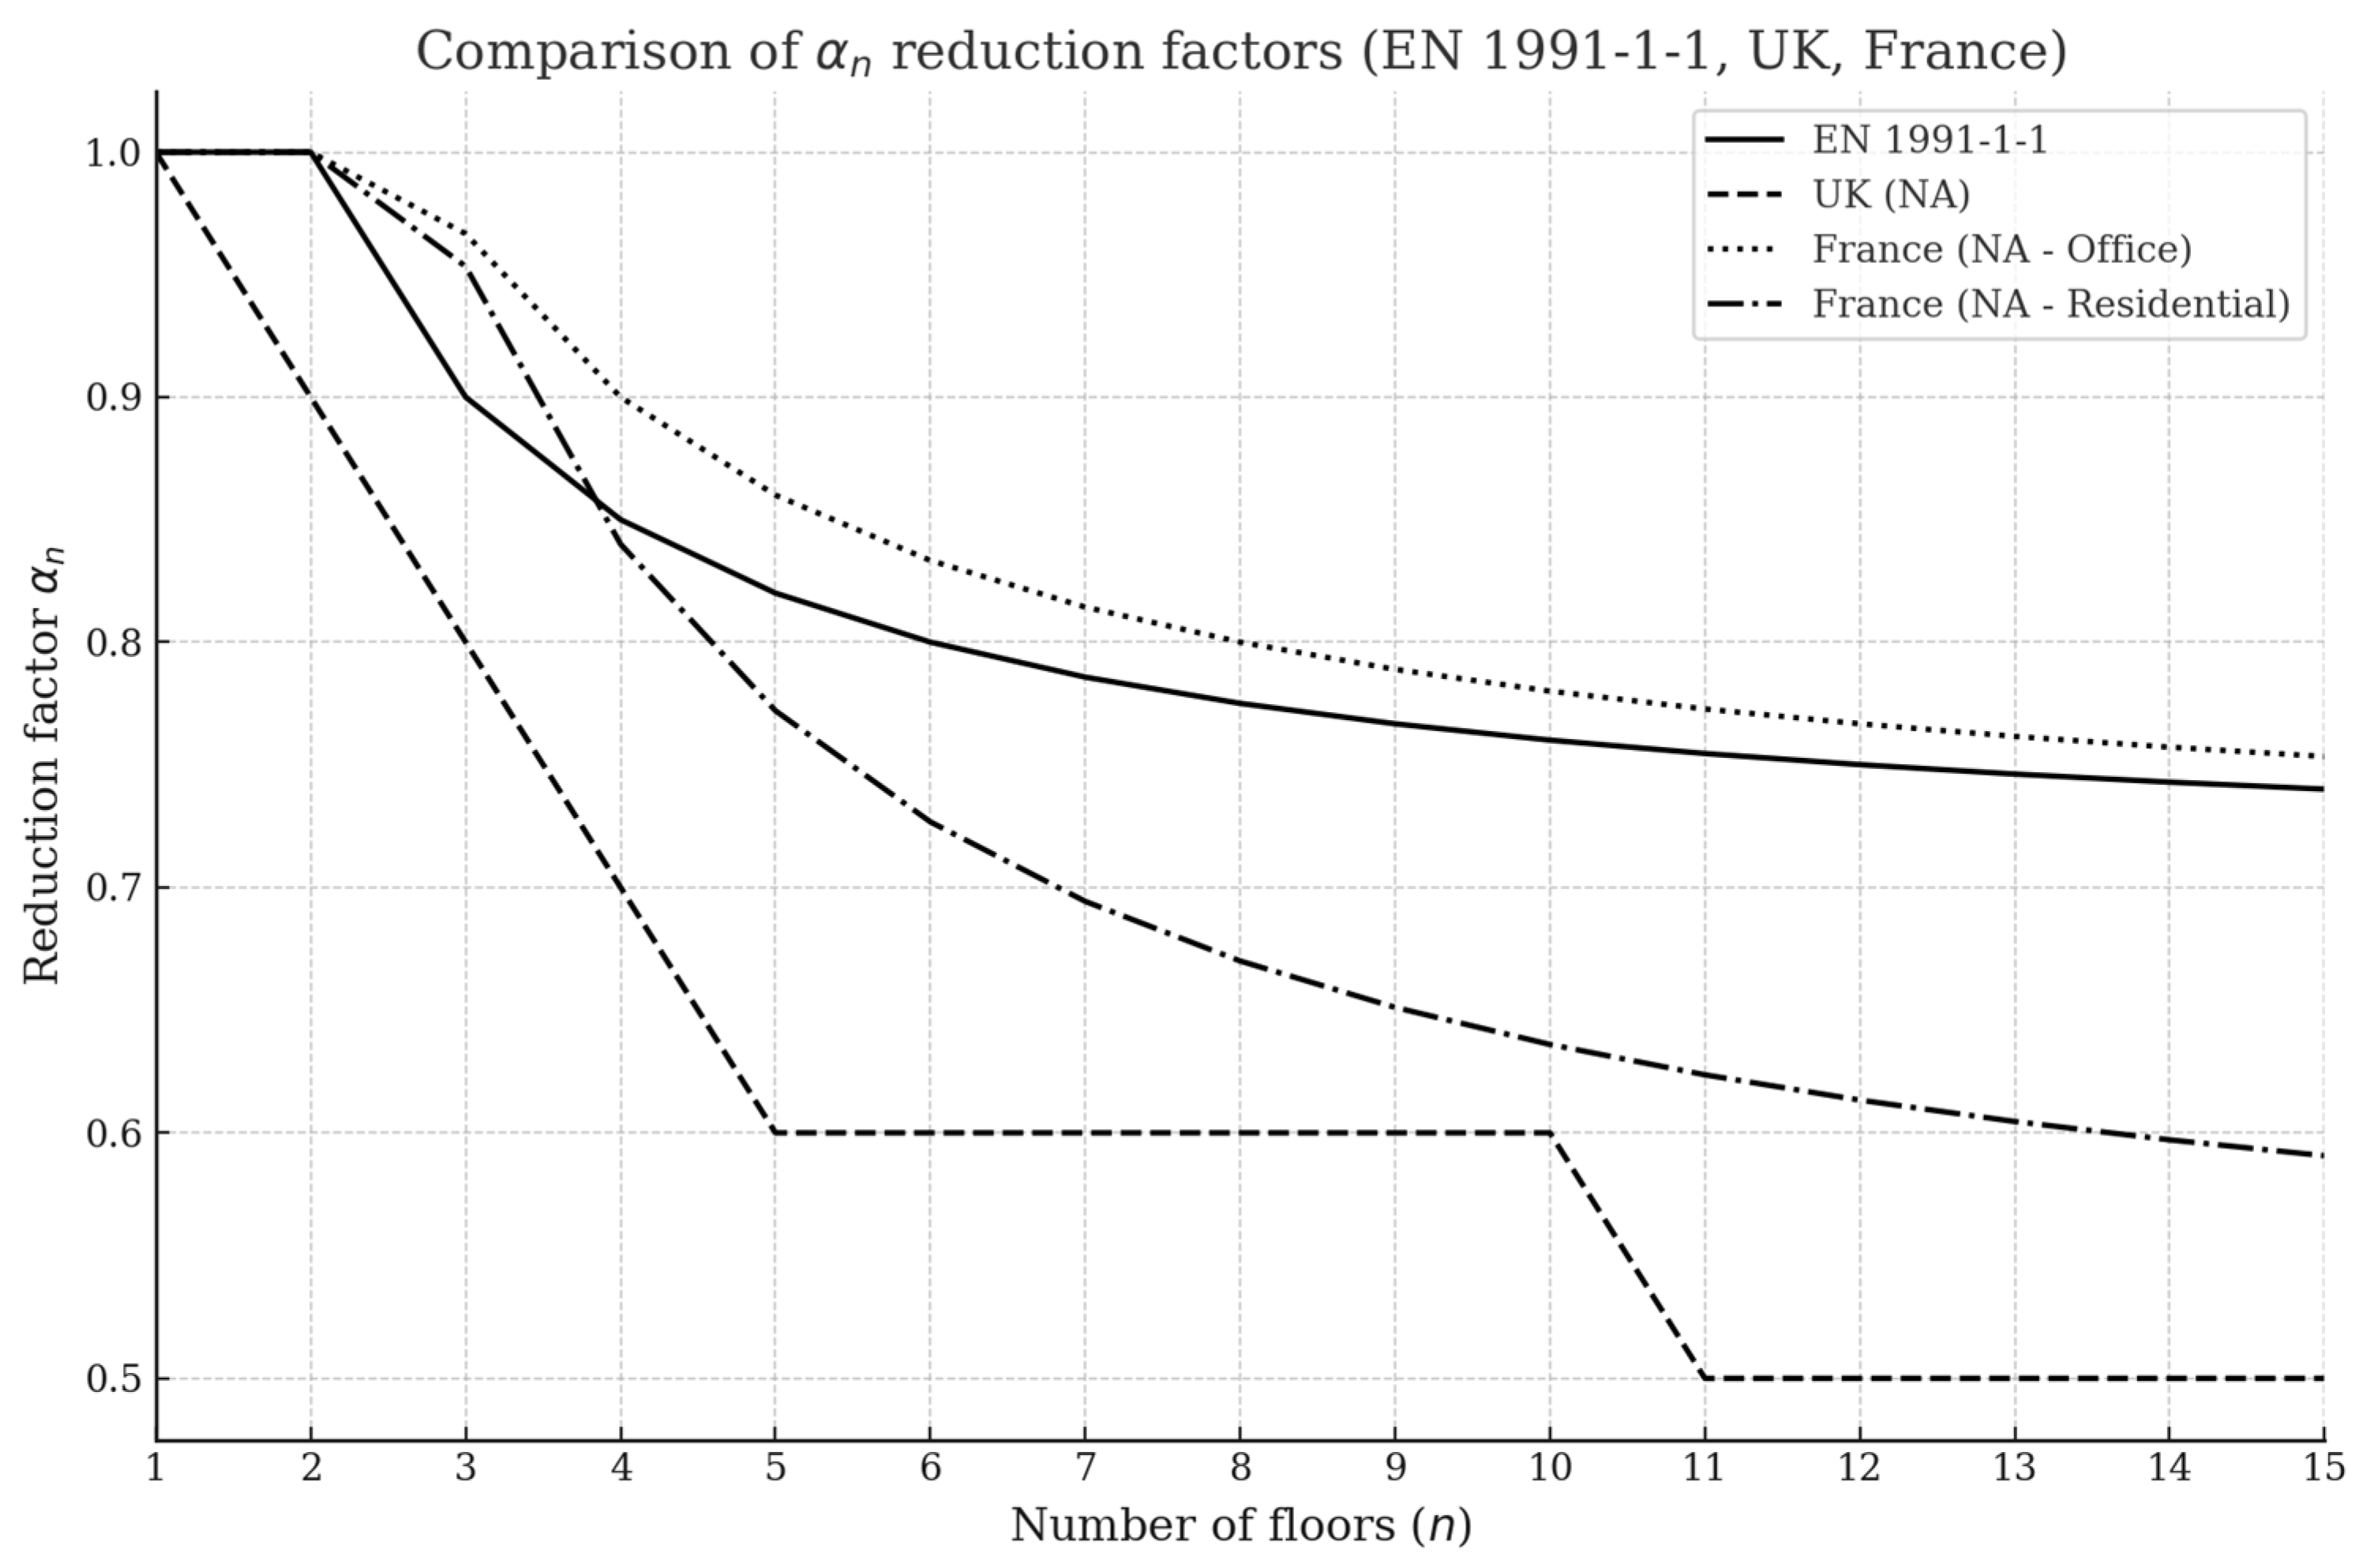
Figure 4.
Comparison of αn reduction factors according to EN 1991-1-1 and the National Annexes of the UK and France.
Figure 4.
Comparison of αn reduction factors according to EN 1991-1-1 and the National Annexes of the UK and France.
2. Materials and Methods
To evaluate the influence of structural stiffness and different building types on the load redistribution behavior two contrasting construction types are analysed:
- A relatively flexible frame-type system, and
- A relatively stiff wall-type system.
All relevant material parameters, cross-sectional dimensions, and geometric building dimensions are summarized in Table 1 and illustrated in Figure 5. These serve as the basis for the subsequent parametric analysis. The structural models and the resulting load distributions used in the geotechnical simulations were developed using the SOFiSTiK structural analysis software [22].
The geotechnical analyses are conducted using numerical simulations in PLAXIS 3D [23]. All models are defined as doubly symmetric, reducing computational effort while maintaining physical accuracy (Figure 6). Boundary conditions include:
- Fixed horizontal displacements along the model boundaries and symmetry planes,
- A fully fixed base, and
- No-flow conditions at the bottom and along symmetry planes for consolidation analyses.
Both drained and undrained conditions are investigated, including time-dependent consolidation behavior. At the contact between the basement wall and the surrounding soil, a zero-thickness interface is defined. To realistically represent shear transfer, an interface reduction factor of Rinter = 0.9 at the bottom and 0.85 at the cellar walls is applied.
The soil domain is discretized using 10-node tetrahedral elements, and advanced nonlinear constitutive soil models are employed. The superstructure is modeled using elastic plate and beam elements, representing the structural stiffness in a mechanically consistent but simplified way.
Extensive validation analyses were carried out by comparing results from the original SOFiSTiK structural model with the PLAXIS-based geotechnical reconstruction under identical boundary conditions. The resulting differential settlements differ by less than 1%, confirming that the structural stiffness representation in PLAXIS is sufficiently accurate for the purpose of this study.
To capture a broad range of soil behaviour, three representative soil types were selected: clay, silt, and sand. For each soil, a representative Hardening Soil with Small-Strain (HSS) parameter set was defined. In addition to characteristic values, upper and lower bound values were specified for key strength and permeability parameters, enabling a systematic consideration of material variability.

Table 2.
Overview table of the selected soil types for the HSS model, including upper, charakteristic and lower values for the strength and permiability parameters. HSS model parameters: = wet unit weight, = friction angle, = cohesion, = dilatancy, = Poisson’s ratio, = oedometric modulus, = secant module, = unloading/reloading module, = stiffness exponent, = shear modulus for small deformations, = limit for small shear strains, = reference pressure 100 kN/m2.
| Soiltype |
[kN/m3] |
[kN/m3] |
[m/s] |
[°] |
[kN/m2] |
[°] |
[-] |
[kN/m2] |
[kN/m2] |
[kN/m2] |
[-] |
[kN/m2] |
[-] |
[-] |
|---|---|---|---|---|---|---|---|---|---|---|---|---|---|---|
| Clay | 20.5 | 21 | 10-10 | 28 | 2 | 0 | 0.2 | 4 000 | 7 000 | 30 000 | 1.0 | 50 000 | 2x10⁻⁴ | 0.53 |
| Silt | 19.0 | 20 | 10-8 | 29 | 2 | 0 | 0.2 | 12 000 | 16 000 | 47 000 | 0.7 | 78 300 | 1x10⁻⁴ | 0.51 |
| Sand | 17.5 | 20 | 10-4 | 36 | 0 | 6 | 0.2 | 30 000 | 30 000 | 90 000 | 0.5 | 150 000 | 1x10⁻⁴ | 0.41 |
To assess the influence of different load combinations on load redistribution and their relevance in structural design, Table 3 summarizes the variable live loads considered. The example refers to Category B2 – Offices according to EN 1991-1, with a characteristic load qc = 4.2 kN/m and n = 15 floors. The reductions according to αn and the application of ψ-factors for frequent and quasi-permanent combinations are shown.
Table 3.
Variable load depending on load combination and number of floors (n = 15).
| Load combination | Formula | Result |
| Charakteristic | ||
| Charakteristic reduced by | ||
| Frequent | ||
| Quasi-permanent |
To ensure a comprehensive and consistent comparison between the structural models, several key parameters are evaluated. As illustrated in Figure 7, these include the normal forces in the outer and inner columns as well as in the core, providing insight into how force redistribution occurs within the structure. In addition, the maximum bending moment beneath the core and the field moment in the middle span are monitored to identify any relevant changes in the fundamental design forces of the foundation slab. Finally, the overall settlement behavior is assessed, including the maximum settlement at the center of the structure and the minimum settlement at the outer corner, to determine whether the structural response remains within realistic limits.
Generative AI has been used in this study for redesigning graphics, extended literature research and data collection as well as for rewriting and summarizing explicit parts in this study.
3. Settlement Relevant Load Combination
3.1. Load Redistribution Depending on Load Combination
A common and recommended approach for considering the influence of settlements on the structural behavior is to first determine the settlement distribution using an appropriate geotechnical program that accounts for the complex, nonlinear behavior of soil. The resulting settlements are then imposed on the structural foundation elements. This prescribed deformation leads to a redistribution of internal forces within the structure—typically from the areas with larger settlements (often the center) toward the less affected zones (usually the edges).
In addition to other important factors of soil-structure interaction—such as the structural stiffness modeling or the construction sequence—the magnitude and type of the applied loading has a significant influence on the overall settlement behavior. This study aims to identify which load combination should be considered as settlement-relevant for structural design purposes.
To this end, four different load combinations are applied, each representing a plausible range of loading as defined in Eurocode:
- the quasi-permanent combination,
- the frequent combination,
- the characteristic combination with partial reduction factor αa
- the characteristic combination
The settlement distributions resulting from these combinations are evaluated in terms of their impact on internal force redistribution, focusing on selected structural elements. The analysis examines how different load levels influence the restraining effect and the resulting settlement behavior.
To explore the influence of structural stiffness on load redistribution, two representative building types are analyzed: a comparatively stiff wall-type structure and a more flexible frame-type structure. Each building is placed on three different soil types—sand, silt, and clay—under drained conditions. This allows for a comparison of how soil type and stiffness influence the load redistribution triggered by settlements.
For each case, the selected load combination is first applied to a model with fully fixed supports to establish a reference load distribution. Subsequently, the same combination is used in the geotechnical model to simulate the resulting settlements and analyze their impact on structural behavior.
Figure 8 presents the total normal force acting on three representative structural members—the inner column, outer column, and the outer core edge—under various load combinations and soil conditions.
The grey bars represent the reference case, calculated using a fully fixed model without soil-structure interaction. As expected, the normal force in these members increases with the load level, reflecting the unaltered internal force distribution.
When bedding is considered, however, the results show a clear redistribution of internal forces caused by differential settlements. In general, loads are redistributed from the inner column, located in the more heavily settled central area, toward the outer column and the core edge, which are less affected by settlement and typically stiffer. This redistribution pattern is especially pronounced in the stiffer wall-type structure, where differential settlements induce stronger internal force shifts.
Regarding soil type, the redistribution becomes more significant in softer soils, particularly in silt and clay. The greater deformability of these soils leads to increased differential settlements, thereby amplifying the structural response.
An additional observation from the figure is that stiff elements, such as the core edge in the frame-type structure, attract a disproportionately high share of restraining forces. This indicates that in flexible structures, local stiffness variations (e.g., stiff core vs. flexible frame) enhance the settlement-induced redistribution more strongly than in generally stiff systems.
In all members, the total normal force increases with higher load combinations. However, the relative contribution of restraining forces behaves differently depending on structural stiffness, soil type, and member location as shown in Figure 9.
For the inner column, a significant share of the total force is relieved due to settlement-induced redistribution in the wall-type structure, ranging between 37% and 45%, depending on the load combination and subsoil. In contrast, the frame-type structure, being more flexible, shows a much lower restraining effect—only 10% to 13% of the total force is relieved due to settlement-induced restraint.
Across all soil types, the variation of restraining ratio due to load combination is relatively small. For the wall-type on sand, the restraining share increases from 37% (quasi-permanent) to 41% (characteristic), a difference of 4%. In silt, this range narrows to 3%, and in clay, to just 1%, indicating that with softer soils, the relative effect of load level on restraint becomes less pronounced.
In the outer column, the restraining component is positive, reflecting additional loading due to the outward redistribution of forces. The wall-type structure again exhibits stronger restraint, with restraining shares from 69% to 88%, whereas the frame-type structure shows a much smaller increase of only 20% to 26%. Also here, the influence of load combination decreases with softer soils: for the wall-type on sand, the restraining force increases by 6% across load combinations, while in clay, the difference drops to 3%. For the frame-type, the total variation remains around 2%, confirming the lower sensitivity of flexible systems.
The core’s outer edge shows high restraining effects in both structural types. Interestingly, the restraining share is even higher in the flexible frame-type structure, with values ranging from 33% to 54%, compared to 26% to 38% in the stiffer wall-type structure. This suggests that local stiffness—even within a globally flexible system—can attract significant restraining forces when differential settlements occur.
Moreover, the range of restraining variation across load combinations is largest in the core region. While the wall-type shows a moderate variation of about 4%, the frame-type exhibits higher sensitivity (8%), especially on clay, where the restraining share increases from 46% (quasi-permanent) to 50% (frequent) and slightly decreases to 48% (characteristic). This could potentially be explained by plastic deformation effects in the outer clay regions, which may reduce differential settlements locally and balance loads at higher load levels.
Figure 10 illustrates the comparison of maximum and differential settlements under various load combinations, normalized with respect to the characteristic load combination. The grey bars represent the maximum settlement Smax, while the yellow bars show the maximum differential settlement (ΔS). Both are expressed as a percentage of the values resulting from the characteristic load combination (defined as 100%).
The results indicate a substantial reduction in settlement when the quasi-permanent load combination is applied. For maximum settlements, the quasi-permanent load case on sand leads to values of approximately 73% in the wall-type structure and 71% in the frame-type structure, compared to the characteristic case. This behavior is consistent across all soil types.
A similar trend is observed for differential settlements. The quasi-permanent combination results in about 77% of the characteristic ΔS in the wall-type structure and 73% in the frame-type structure. These findings emphasize that load level has a major impact not only on absolute but also on relative (differential) settlements. Notably, this effect appears largely independent of structural stiffness and soil type, suggesting that the choice of load combination has a dominant influence on settlement magnitudes in general.
Figure 11 shows the influence of settlements—particularly differential settlements—on the distribution of bending moments within the foundation slab. As expected, the variation in maximum and minimum bending moments correlates with the behavior observed in the previous figure on settlements, indicating a direct link between soil-induced deformations and internal structural forces.
The maximum bending moments (M11,max) in the core region consistently follow the increasing load level. For both structural types, values start at around 80% (relative to the characteristic load combination) under quasi-permanent loading and increase proportionally with the applied load combination, independent of soil type. This confirms that bending moment magnitudes are primarily governed by the load level and are less sensitive to soil stiffness in this context.
The minimum bending moments (M11,min) observed in the slab field, however, show more variation—both between structural types and across soil conditions. For example, in sand, the wall-type structure reaches 70% of the characteristic moment under quasi-permanent loading, whereas the more flexible frame-type structure shows only 59%. For the frame-type structure, a clear trend with soil stiffness is visible: 59% in sand, 67% in silt, and 73% in clay.
This indicates that foundation elements of flexible structures react more sensitively to differential settlements, especially in stiffer soils, where the moment distribution shows larger relative deviations from the characteristic loading case.
3.2. Influence of Permiabilety on Settlement Relevant Load Combinaiton
As outlined in the introduction, for soils with low permeability and present groundwater, a certain duration of sustained loading is required to allow for volumetric deformation and thus settlement. Rapid load changes or short-term load peaks—as represented by the frequent or characteristic load combinations in structural design—are not sufficient to initiate significant consolidation settlements. Instead, they typically cause volume-constant shear deformations, characteristic of undrained soil behavior. Accordingly, the quasi-permanent load combination is recommended as the basis for long-term settlement analysis in such soils, particularly in undrained conditions and materials with low hydraulic conductivity.
However, an important question remains:Even if rapid load changes do not induce volumetric settlement, do they still cause a significant change in internal stress states or force redistributions within the structure that should be considered in the design?
To address this, an additional case study was carried out for the wall-type building. The following two scenarios were compared:
- Time-consolidated settlement case, simulating 30 years of continuous quasi-permanent loading, representing realistic long-term conditions in cohesive soils.
- Sequenced loading case, where a sudden short-term application of the reduced characteristic load combination (including α) was imposed for one day, after 30 years of consolidation due to quasi-permanent loading.
This comparison enables an evaluation of whether short-term load variations, still trigger relevant structural responses—particularly in terms of load redistribution and internal force changes—that should be accounted for in design.
Figure 12 shows that when considering time-dependent settlement behavior, the restraining effect in structural elements increases. For silt, the transition from quasi-permanent drained to quasi-permanent consolidated loading leads to an increase of approximately 2% in both the inner and outer columns and around 1% in the core.
In contrast, for clay, which exhibits much lower permeability and stronger time-dependent behavior, the restraining effect increases significantly. The inner column shows an increase of 8%, the outer column of 13%, and the core of 7%, clearly emphasizing the relevance of soil permeability and consolidation effects in long-term settlement analysis.
Looking now at the sequenced loading case—where, after long-term consolidation under quasi-permanent loading, a short-term application of the reduced characteristic load is superimposed—it becomes apparent that this temporary loading spike does not increase the restraining effect. Instead, a slight reduction in restraining forces can be observed. This is likely due to additional plastic deformations occurring under undrained conditions, which locally reduce stiffness and thus limit further redistribution.
From a structural design perspective, it would only be necessary to consider such a short-term settlement distribution—instead of the long-term quasi-permanent case—if the resulting internal force redistributions exceeded the range observed under realistic service conditions. However, this is not the case in the present study. The additional effects of sequenced loading remain within the expected variation and do not justify separate consideration in settlement-relevant design procedures.
Regarding the bending moments, the sequenced load combination results in approximately a 10% higher maximum bending moment in the foundation slab and a 9% higher field moment in silt. In nearly impermeable clay, this difference decreases to about 8% for the maximum moment and 5% for the field moment.
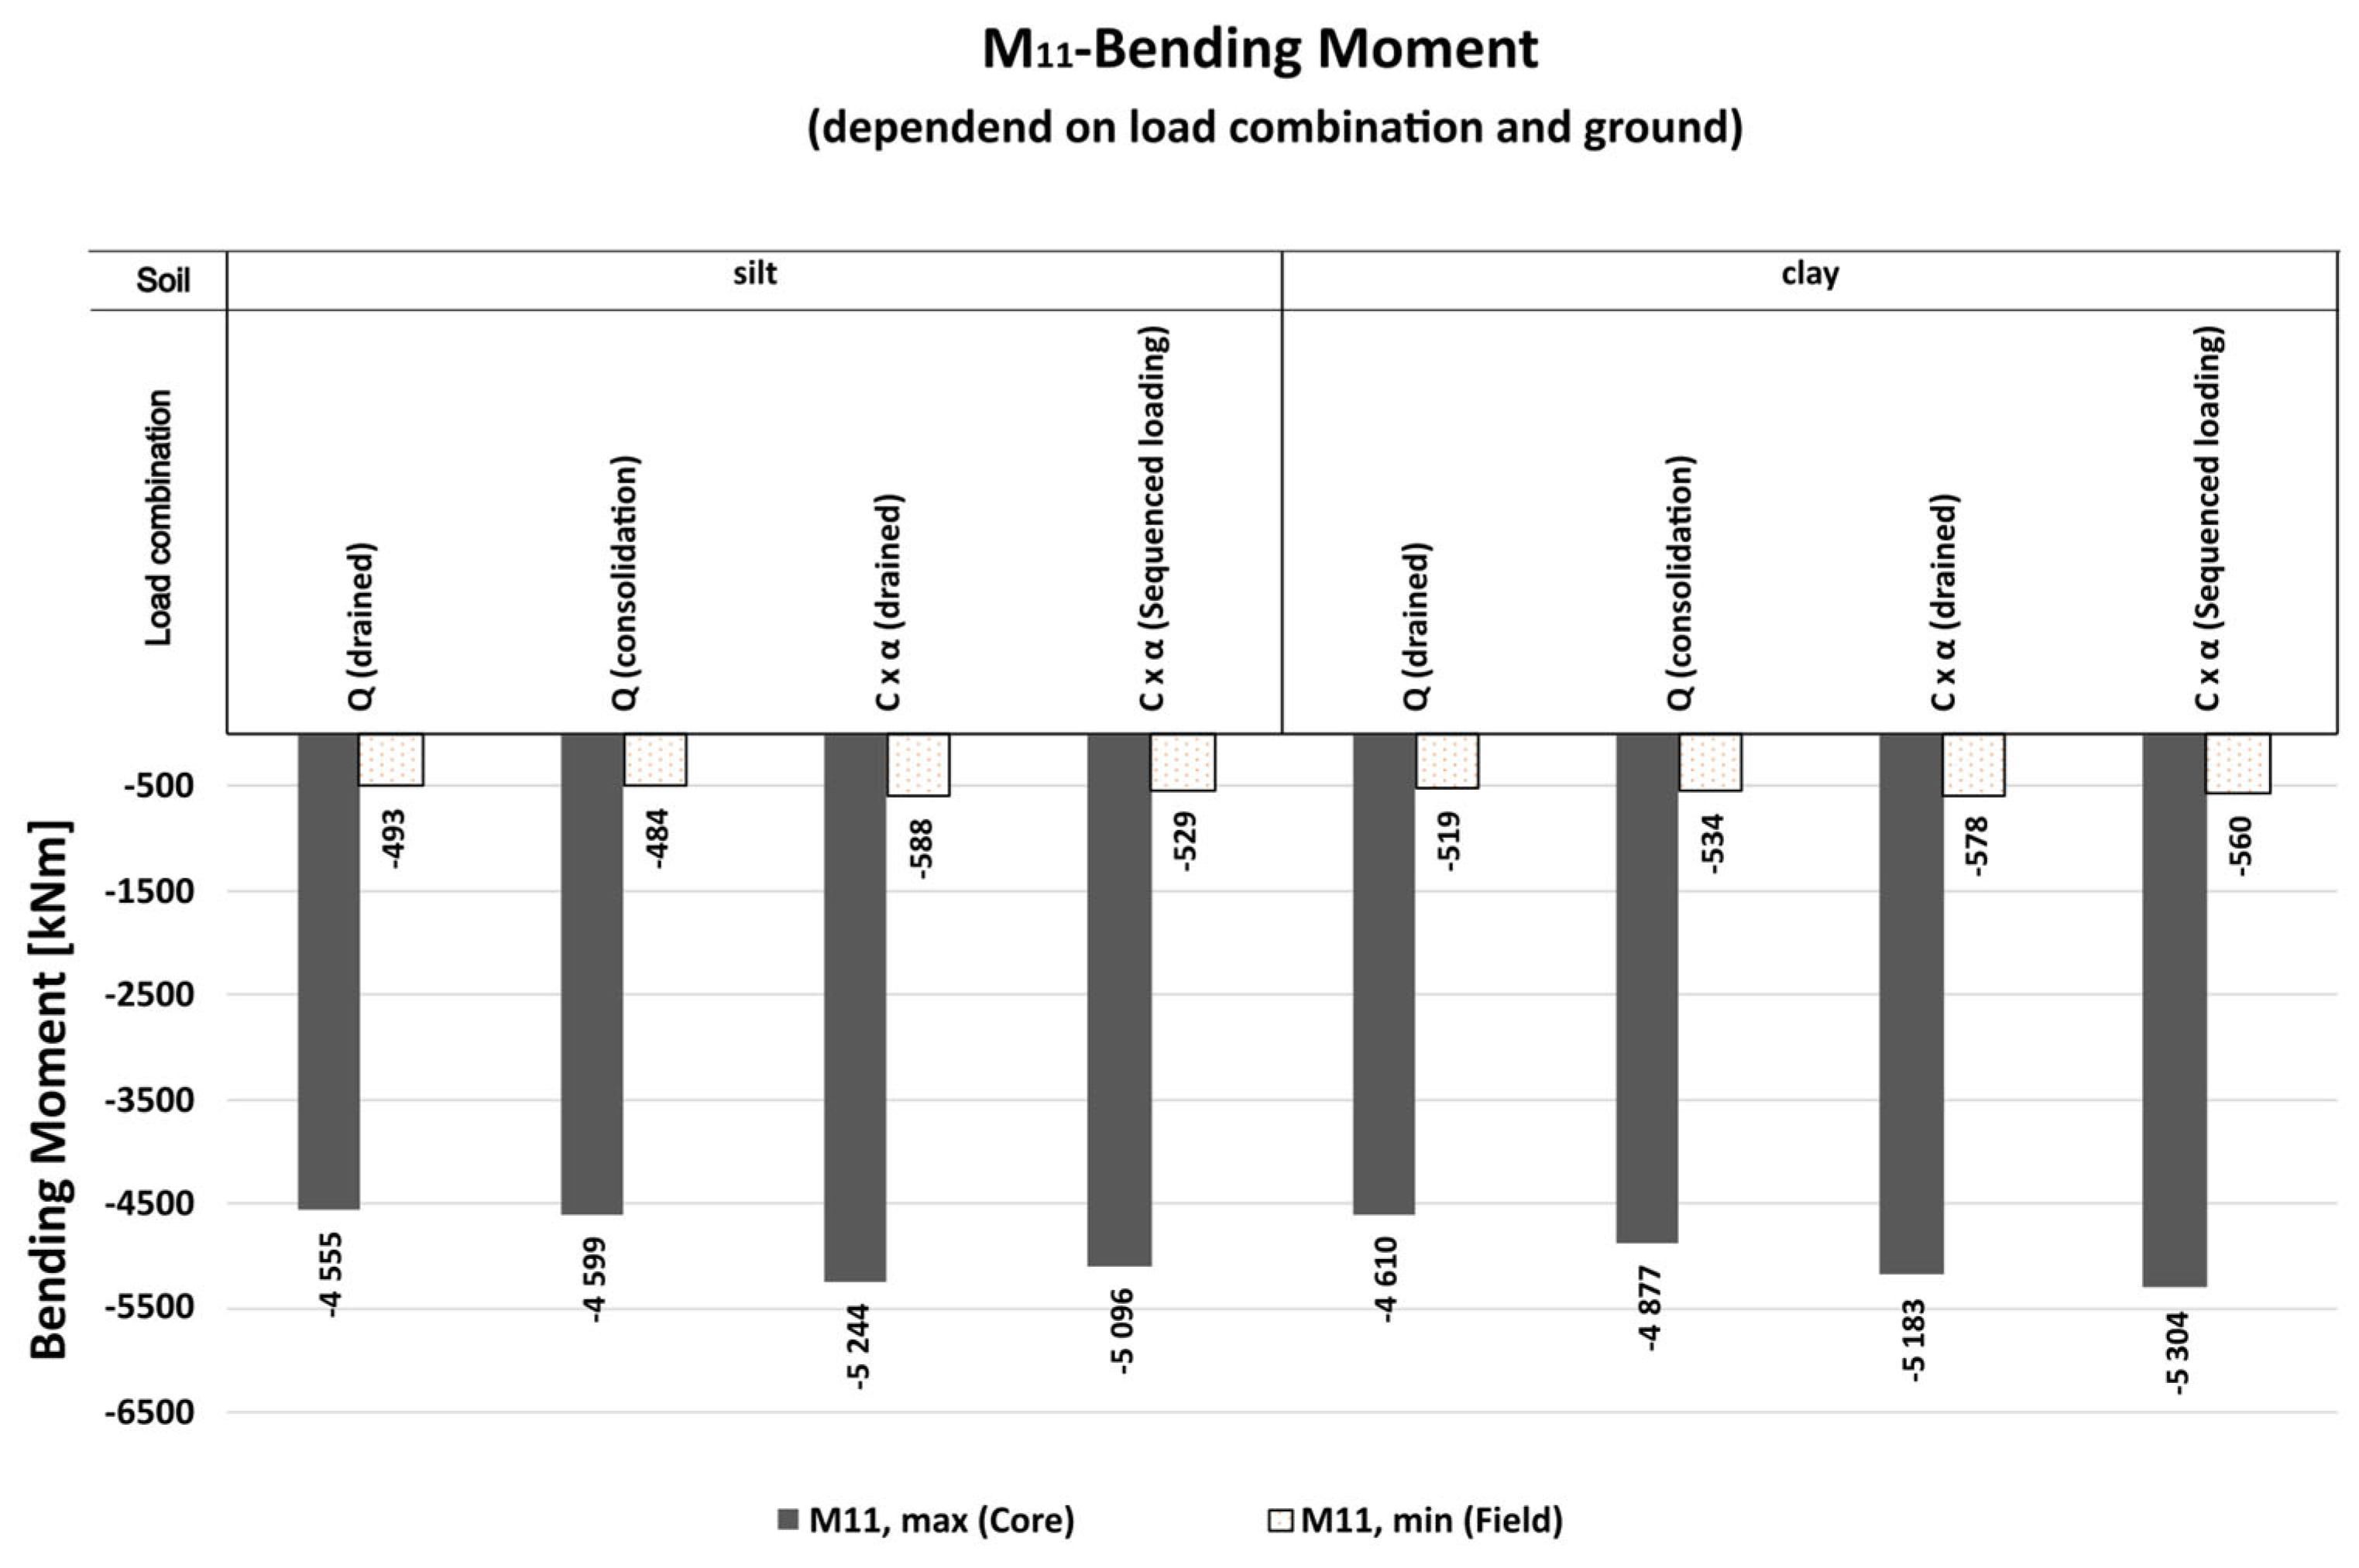
Figure 13.
Bending moments M11 in the foundation slab for different load combinations and soil types (silt and clay) considering time effects. The moments are taken from the Gauss point closest to the investigated location, as shown in Figure 7.
Figure 13.
Bending moments M11 in the foundation slab for different load combinations and soil types (silt and clay) considering time effects. The moments are taken from the Gauss point closest to the investigated location, as shown in Figure 7.
5. Conclusions
Based on the presented results, it can be concluded that the stiffer the structure, the more significant the force redistribution due to settlements becomes, and thus the more important it is to consider bedding effects. Conversely, softer soils lead to higher absolute restraining forces, although the variation in restraining ratio between different load combinations is smaller in soft soils compared to stiff ones. Stiff structural elements, such as cores, experience particularly high restraining effects—especially when embedded in flexible structures and supported on soft soils.
As discussed in the introduction, the characteristic load combination is generally conservative and should be reduced using the floor reduction factor α, reflecting the statistical probability of simultaneous maximum loads. On the other hand, the quasi-permanent combination represents a realistic lower boundary and should, based on both measurements and theoretical reasoning, not be further reduced.
For practical design purposes, it is recommended to apply settlement loading through a single representative settlement distribution. This distribution should serve as a best estimate of the actual deformations expected during service life. The key question then becomes: How does this chosen settlement distribution affect the internal load redistribution when different load combinations are used in structural design?
For instance, the structural verification might use ULS (Ultimate Limit State) load combinations, while the structure is subjected to settlement deformations based on a different load case (e.g., the reduced characteristic combination). This raises the question whether the internal force distribution still remains representative under such mismatched loading assumptions.
To quantify the variation in load redistribution:
- For stiff structures, the difference in restraining ratio between quasi-permanent and reduced characteristic combinations is approximately 3%,
- For flexible structures, only about 1%,
- For stiff elements such as cores, the deviation increases to around 6%.
- More critical differences appear in bending moments:
- The maximum moments deviate by up to 10%,
The minimum field moments vary by approximately 20% in stiff soils and about 10% in soft soils between the quasi-permanent and reduced characteristic combinations.
In conclusion, when calculating settlement distributions for structural design under drained conditions in coarse-grained soils, the reduced characteristic load combination (including αn) is recommended as the most appropriate settlement-relevant load case. This approach provides a reasonable balance between structural conservatism and realistic deformation behavior, ensuring both safety and design efficiency. For further optimization, the αn -values presented in the French and British National Annexes may be considered, as they permit a greater reduction of loads while maintaining the required safety level in design.
In addition, the findings from the extended analysis regarding soil permeability and load history reinforce the importance of selecting a load combination that reflects long-term drained behavior for cohesive, low-permeability soils. It was shown that in silt, consolidation effects lead to only minor increases in restraining forces (approx. 2% in columns, 1% in the core), whereas in clay, these increases are much more pronounced (8–13% in columns, 7% in the core), confirming the significance of time-dependent settlement behavior in design.
Furthermore, the sequenced loading case, representing the short-term application of the reduced characteristic load following long-term consolidation, does not lead to increased restraining effects. On the contrary, a slight reduction was observed, likely due to the increase in plastic deformations under undrained conditions. From a design perspective, short-term load-induced settlements should therefore not be used as a basis for structural assessment. Deviations in the maximum bending moment (≈ 10%) resulting from possible short-term undrained deformations should be accounted for in the design through safety factors, rather than by considering this short-term, non-representative settlement distribution.
Such a sequenced loading approach may be reasonable in cases where no dominant drainage behavior can be clearly assigned within the settlement-relevant depth—such as in stratified soils with alternating sand and clay layers. In such scenarios, the overall settlement behavior results from the combination of rapidly responding permeable zones and slowly consolidating low-permeability layers.
To derive a representative and design-relevant settlement distribution in these cases, it may be advisable to:
- Perform a consolidation analysis under the quasi-permanent load combination to capture the long-term behavior of cohesive, low-permeability layers, and
- Impose a short-term reduced characteristic load to account for the immediate response of the more permeable zones.
This approach allows for a more realistic approximation of actual settlement shapes, especially in heterogeneous subsoil conditions, and can help to derive a structurally relevant settlement distribution for use in design.
Acknowledgments
This study was conducted within the framework of the collective research project Agile Structural Design for Resource-Responsible Construction, funded by the Austrian Research Promotion Agency (FFG) under project number FO999913808, and supported by the TU Graz Open Access Publishing Fund.
References
- Karl Josef Witt. Grundbau-Taschenbuch, Teil 3: Gründungen und Geotechnische Bauwerke. ger ; eng. 8th edition. Grundbau-Taschenbuch. Newark: Wilhelm Ernst Sohn Verlag für Architektur und Technische, 2018. isbn: 9783433031537.
- Wendehorst Bautechnische zahlentafeln. Ger. 2021.
- Conrad Boley u. a. Handbuch Geotechnik: Grundlagen - Anwendungen - Praxiserfahrungen. ger ; eng. 2., vollst. uberarb. Aufl. 2019 edition. Wiesbaden: Springer Fachmedien Wiesbaden GmbH, 2019. isbn: 9783658030544.
- Carola Vogt-Breyer Hans-Henning Schmidt Roland F. Buchmaier. Grundlagen der Geotechnik. Springer Vieweg Wiesbaden, 2014.
- Thomas J Krapfenbauer. Bautabellen : ein Lehr- und Handbuch für das Bauwesen unter Berücksichtigung der österreichischen Baunormung in Verbindung mit den Eurocodes. ger. 19. Aufl.. 2013. isbn: 9783710028724.
- Dirk Schlicke u. a. »Statische Analyse und Bemessung von Gebäuden mittels 3D-Gesamtmodellen«. In: 2024 BetonKalender. John Wiley Sons, Ltd, 2023. Kap. VIII, S. 505–571.
- Daniel Fischer. Interaktion zwischen Baugrund und Bauwerk - Zulässige Setzungsdifferenz Setzungsdifferenzen sowie Beanspruchungen von Bauwerk und Gründung -. ger. Heft 21.Schriftreihe Geotechnik. 2009.
- Resch J., Konzept zur setzungsrelevanten Lastfallkombination unter Berücksichtigung der Bauphasen und der Boden-Bauwerk Interaktion, Masterthesis, Institut für Betonbau, Technische Universität Graz, 2025.
- Rackwitz, R. (1998). Einwirkungen auf Bauwerke. In: Der Ingenieurbau; Band 8: Tragwerkszuverlässigkeit, Einwirkungen, S. 73 – 408, Verlag Ernst & Sohn, Berlin.
- EN 1990:2013 - Grundlagen der Tragwerksplanung. Austrian Standards Institute. 2013.
- Kumar, S. (2002). Live loads in office buildings: point-in-time load intensity. Building and environment, 37(1), 79-89. [CrossRef]
- Ruiz, S. E., & Soriano, A. (1997). Design live loads for office buildings in Mexico and the United States. Journal of Structural Engineering, 123(6), 816-822. [CrossRef]
- Choi, E. C. C. (1992). LIVE LOAD IN OFFICE BUILDINGS. POINT-IN-TIME LOAD INTENSITY OF ROOMS. Proceedings of the Institution of Civil Engineers-Structures and Buildings, 94(3), 299-306.
- Culver, C. G. (1976). Survey results for fire loads and live loads in office buildings.
- Mitchell, G. R., & Woodgate, R. W. (1971). Floor loadings in office buildings: the results of a survey. Watford, UK: Building Research Station.
- Smit, G., & Clayton, C. (2013). The Behaviour of Modern Flexible Framed Structures Un dergoing Differential Settlements. In Proceedings of the 5th International Young Geotechnical Engineers' Conference (pp. 285-288). IOS Press.
- MÜLLER, Dominik; TRAN, Ngoc Linh; GRAUBNER, Carl-Alexander. Stochastische Simulation der Nutzlasten in Gebäuden. 2018.
- HONFI, Daniel. Serviceability floor loads. Structural safety, 2014, 50. Jg., S. 27-38. [CrossRef]
- EN 1991-1-1:2011 - Einwirkungen auf Tragwerke. Austrian Standards Institute. 2011.
- BS NA EN 1991-1-1: UK National Annex to Eurocode 1. Actions on structures. General actions. Densities, self-weight.
- imposed loads for buildings, 2002.
- NF P 06-111-2: Annexe nationale à la NF EN 1991-1-1 — Eurocode 1 «Actions sur les structures» — Partie 1-1 : Actions générales — Poids volumiques, poids propres, charges d’exploitation des bâtiments», 2004.
- Sofistik.
- BRINKGREVE, R., ENGIN, E., & SWOLFS, W. (2013). PLAXIS 3D 2023 REFERENCE manual. Delft, Netherlands.
Figure 1.
Settlement development over time for different load combinations in (a) coarse-grained soil (kf=10−3) and (b) fine-grained soil (kf=10−8). The curves compare settlements under self-weight during construction, characteristic, frequent, and quasi-permanent load combinations.
Figure 1.
Settlement development over time for different load combinations in (a) coarse-grained soil (kf=10−3) and (b) fine-grained soil (kf=10−8). The curves compare settlements under self-weight during construction, characteristic, frequent, and quasi-permanent load combinations.
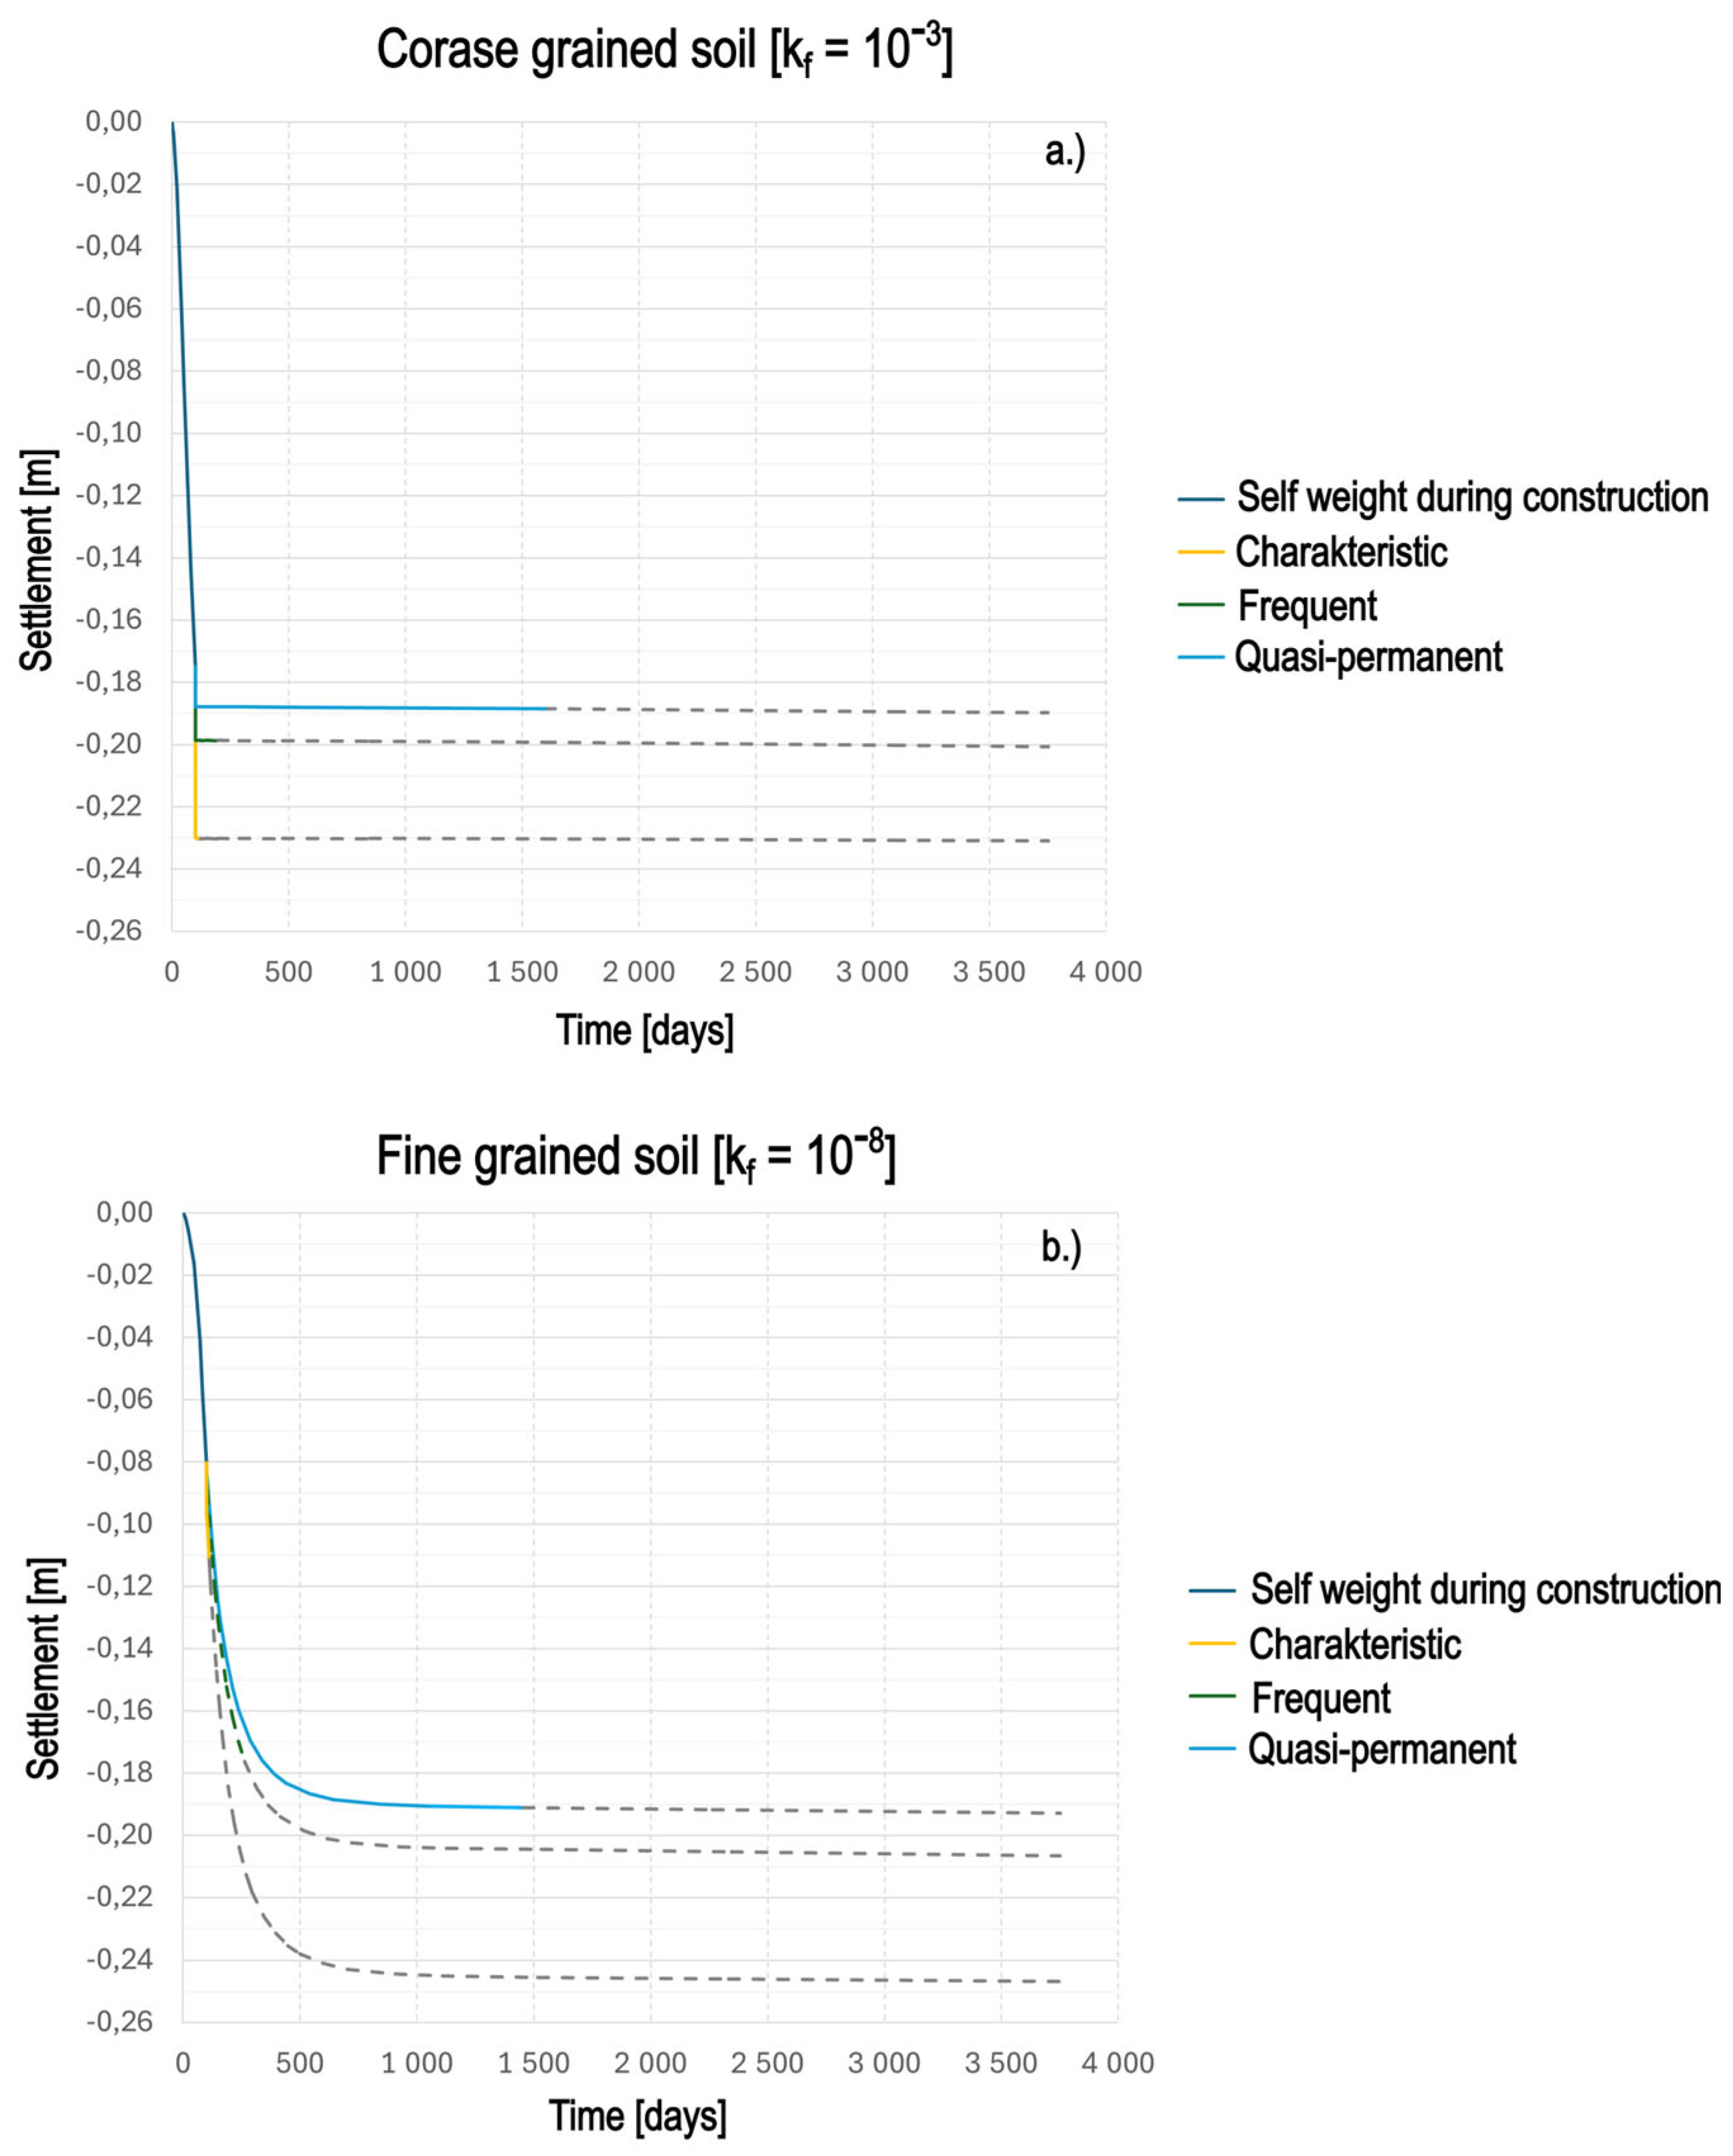
Figure 2.
Comparison of measured mean sustained live loads from various occupancy types with corresponding Eurocode Quasi-permanent values.
Figure 2.
Comparison of measured mean sustained live loads from various occupancy types with corresponding Eurocode Quasi-permanent values.
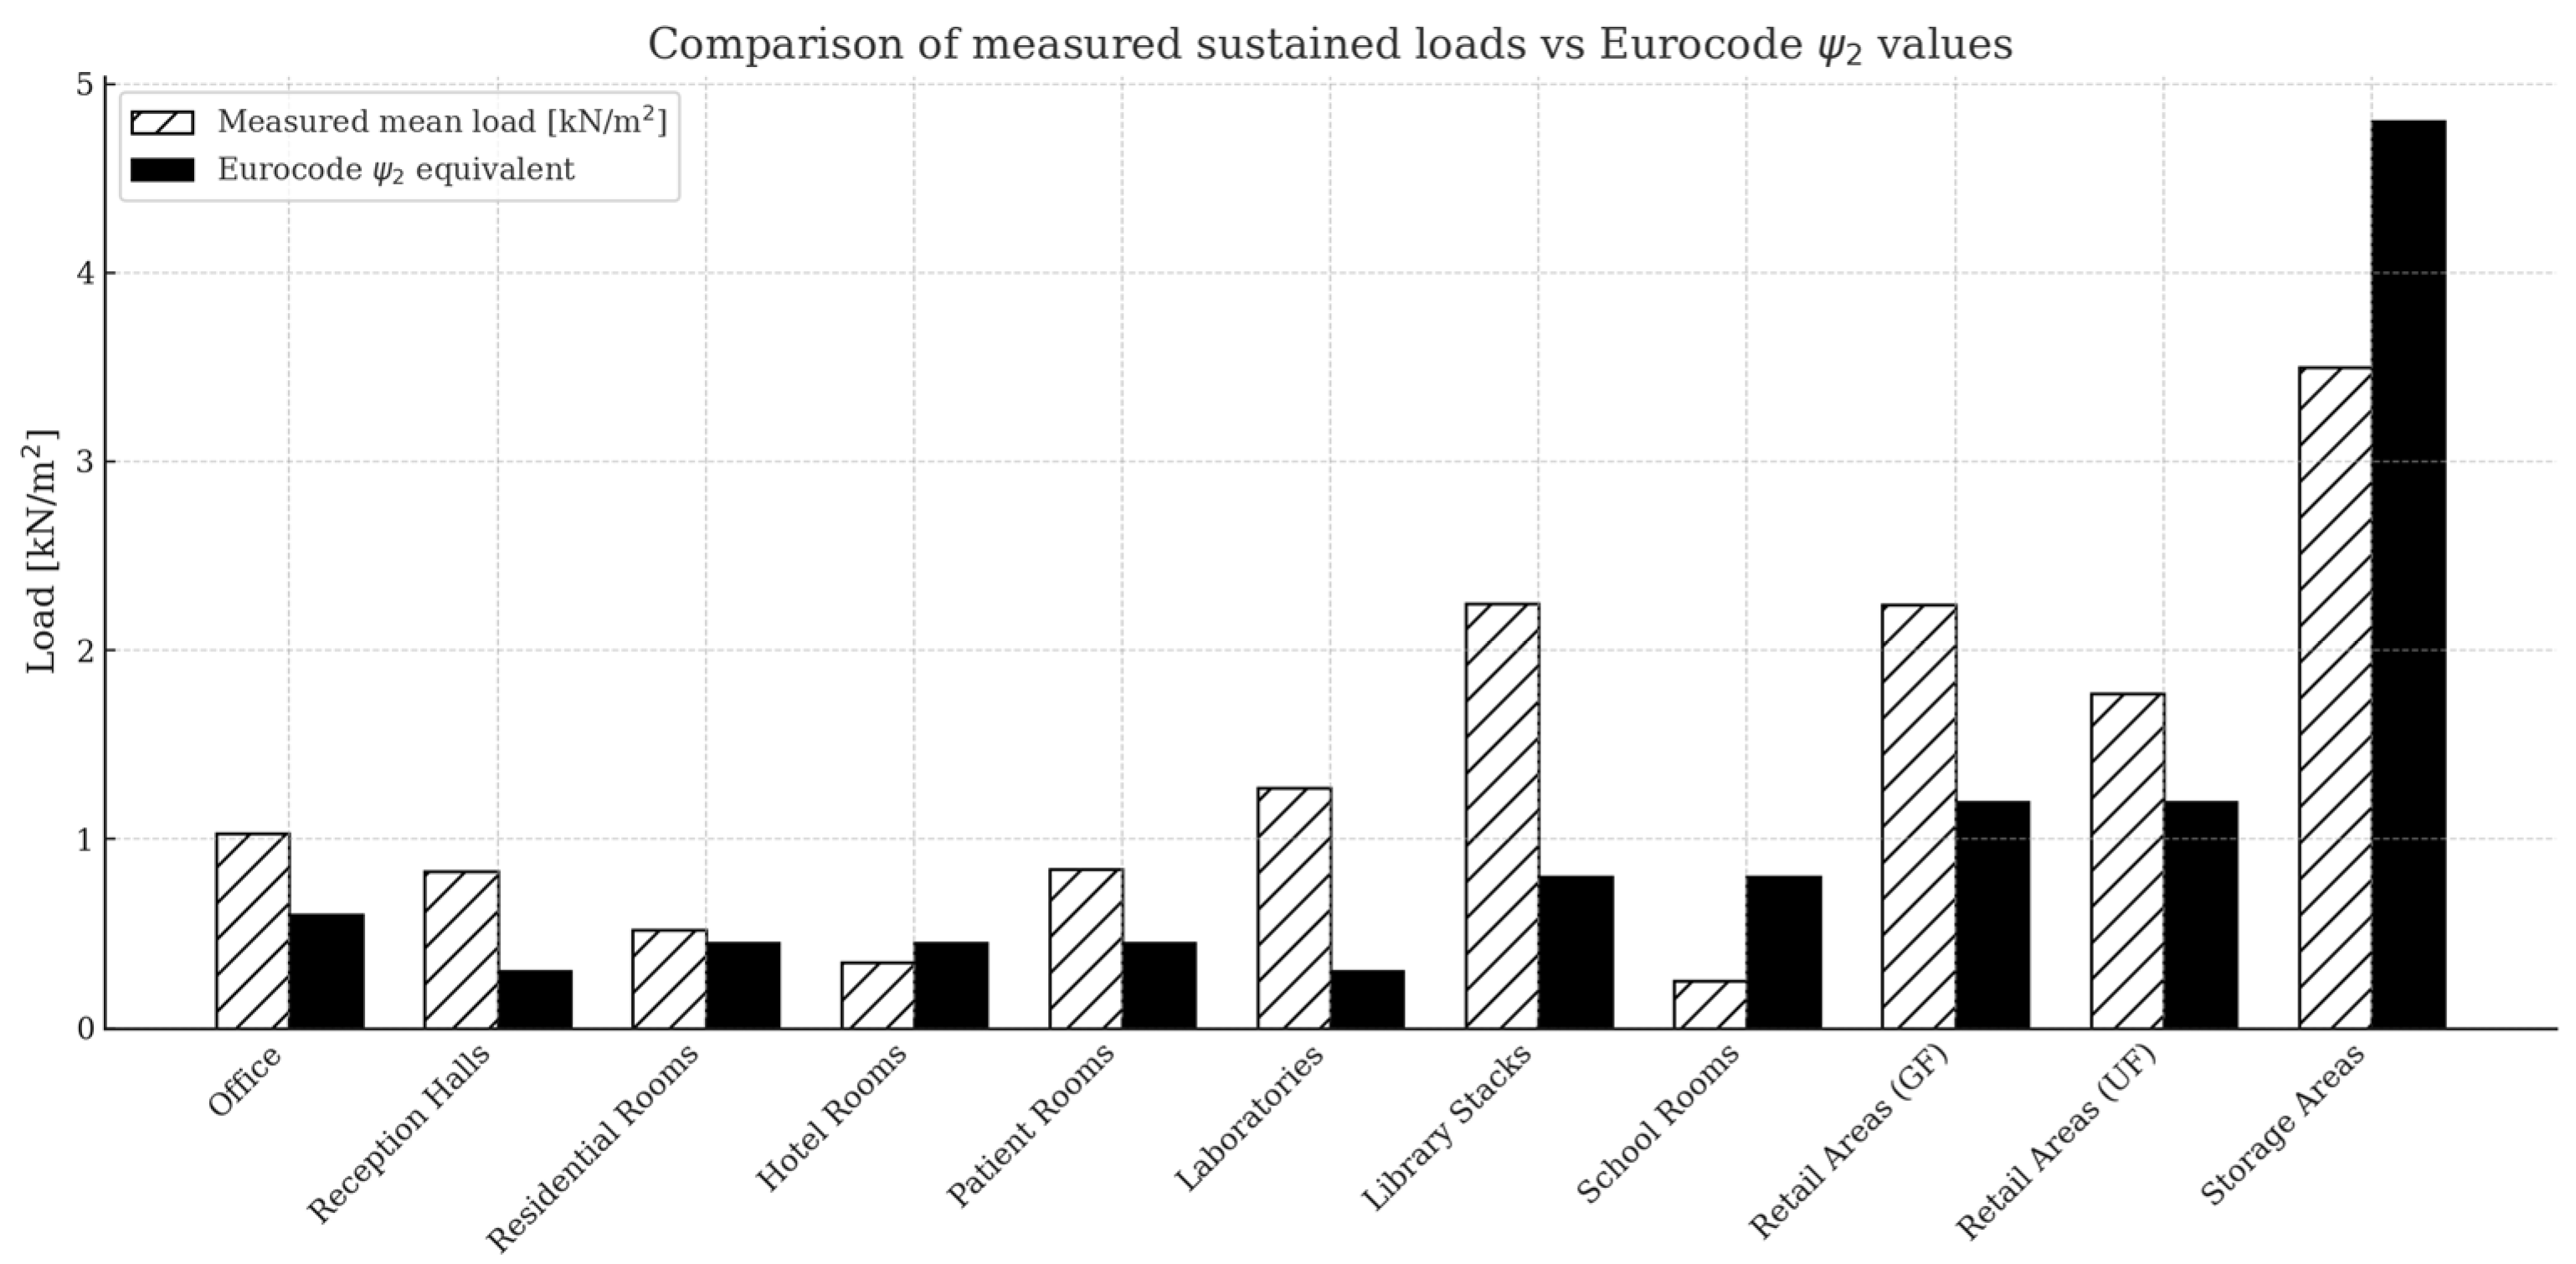
Figure 3.
Measured sustained live loads in offices from different studies and countries compared to the suggested quasi-permantent load according to Eurocode.
Figure 3.
Measured sustained live loads in offices from different studies and countries compared to the suggested quasi-permantent load according to Eurocode.
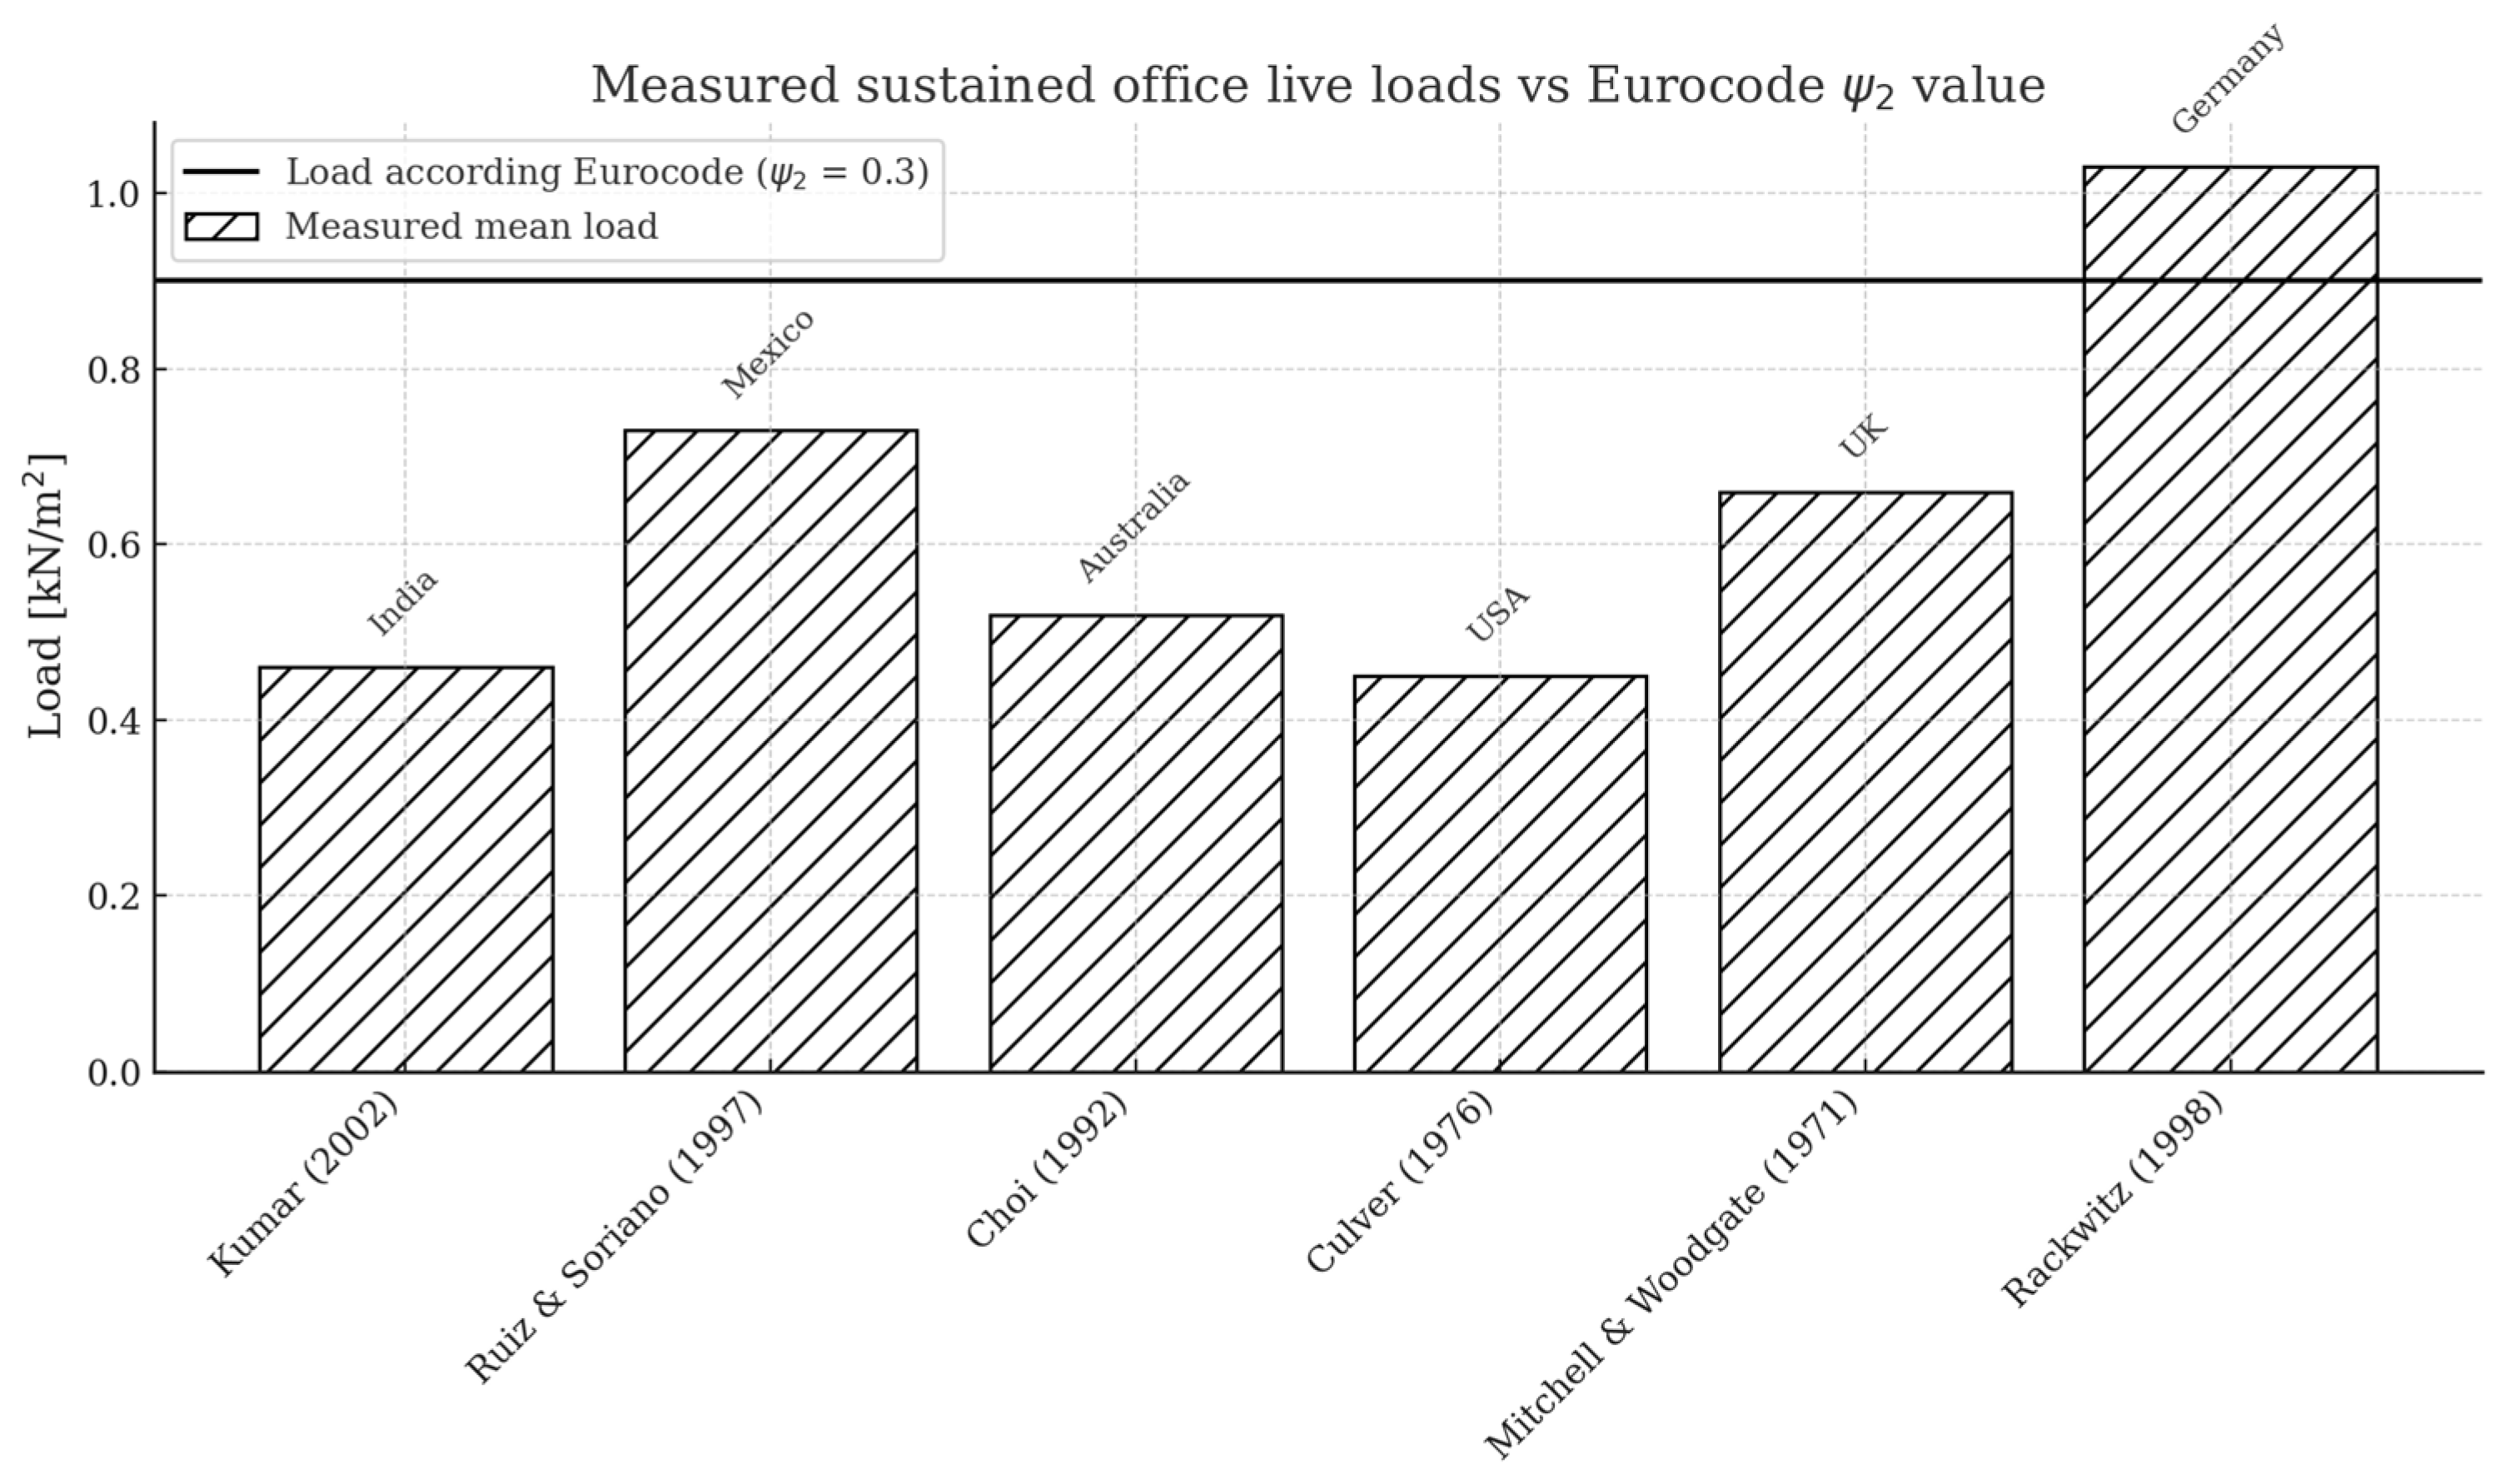
Figure 5.
Overview of the selected model variants for analysing superstructure stiffness influence. The figure contrasts frame-type and wall-type configurations, each with either small or large basements. The intermediate rows show floor layouts and elevation views. The bottom row illustrates the combined 3D models, including a wall-type variant with an intermediate soft floor. These models serve as the basis for evaluating differential settlements under varying soil conditions and structural configurations.
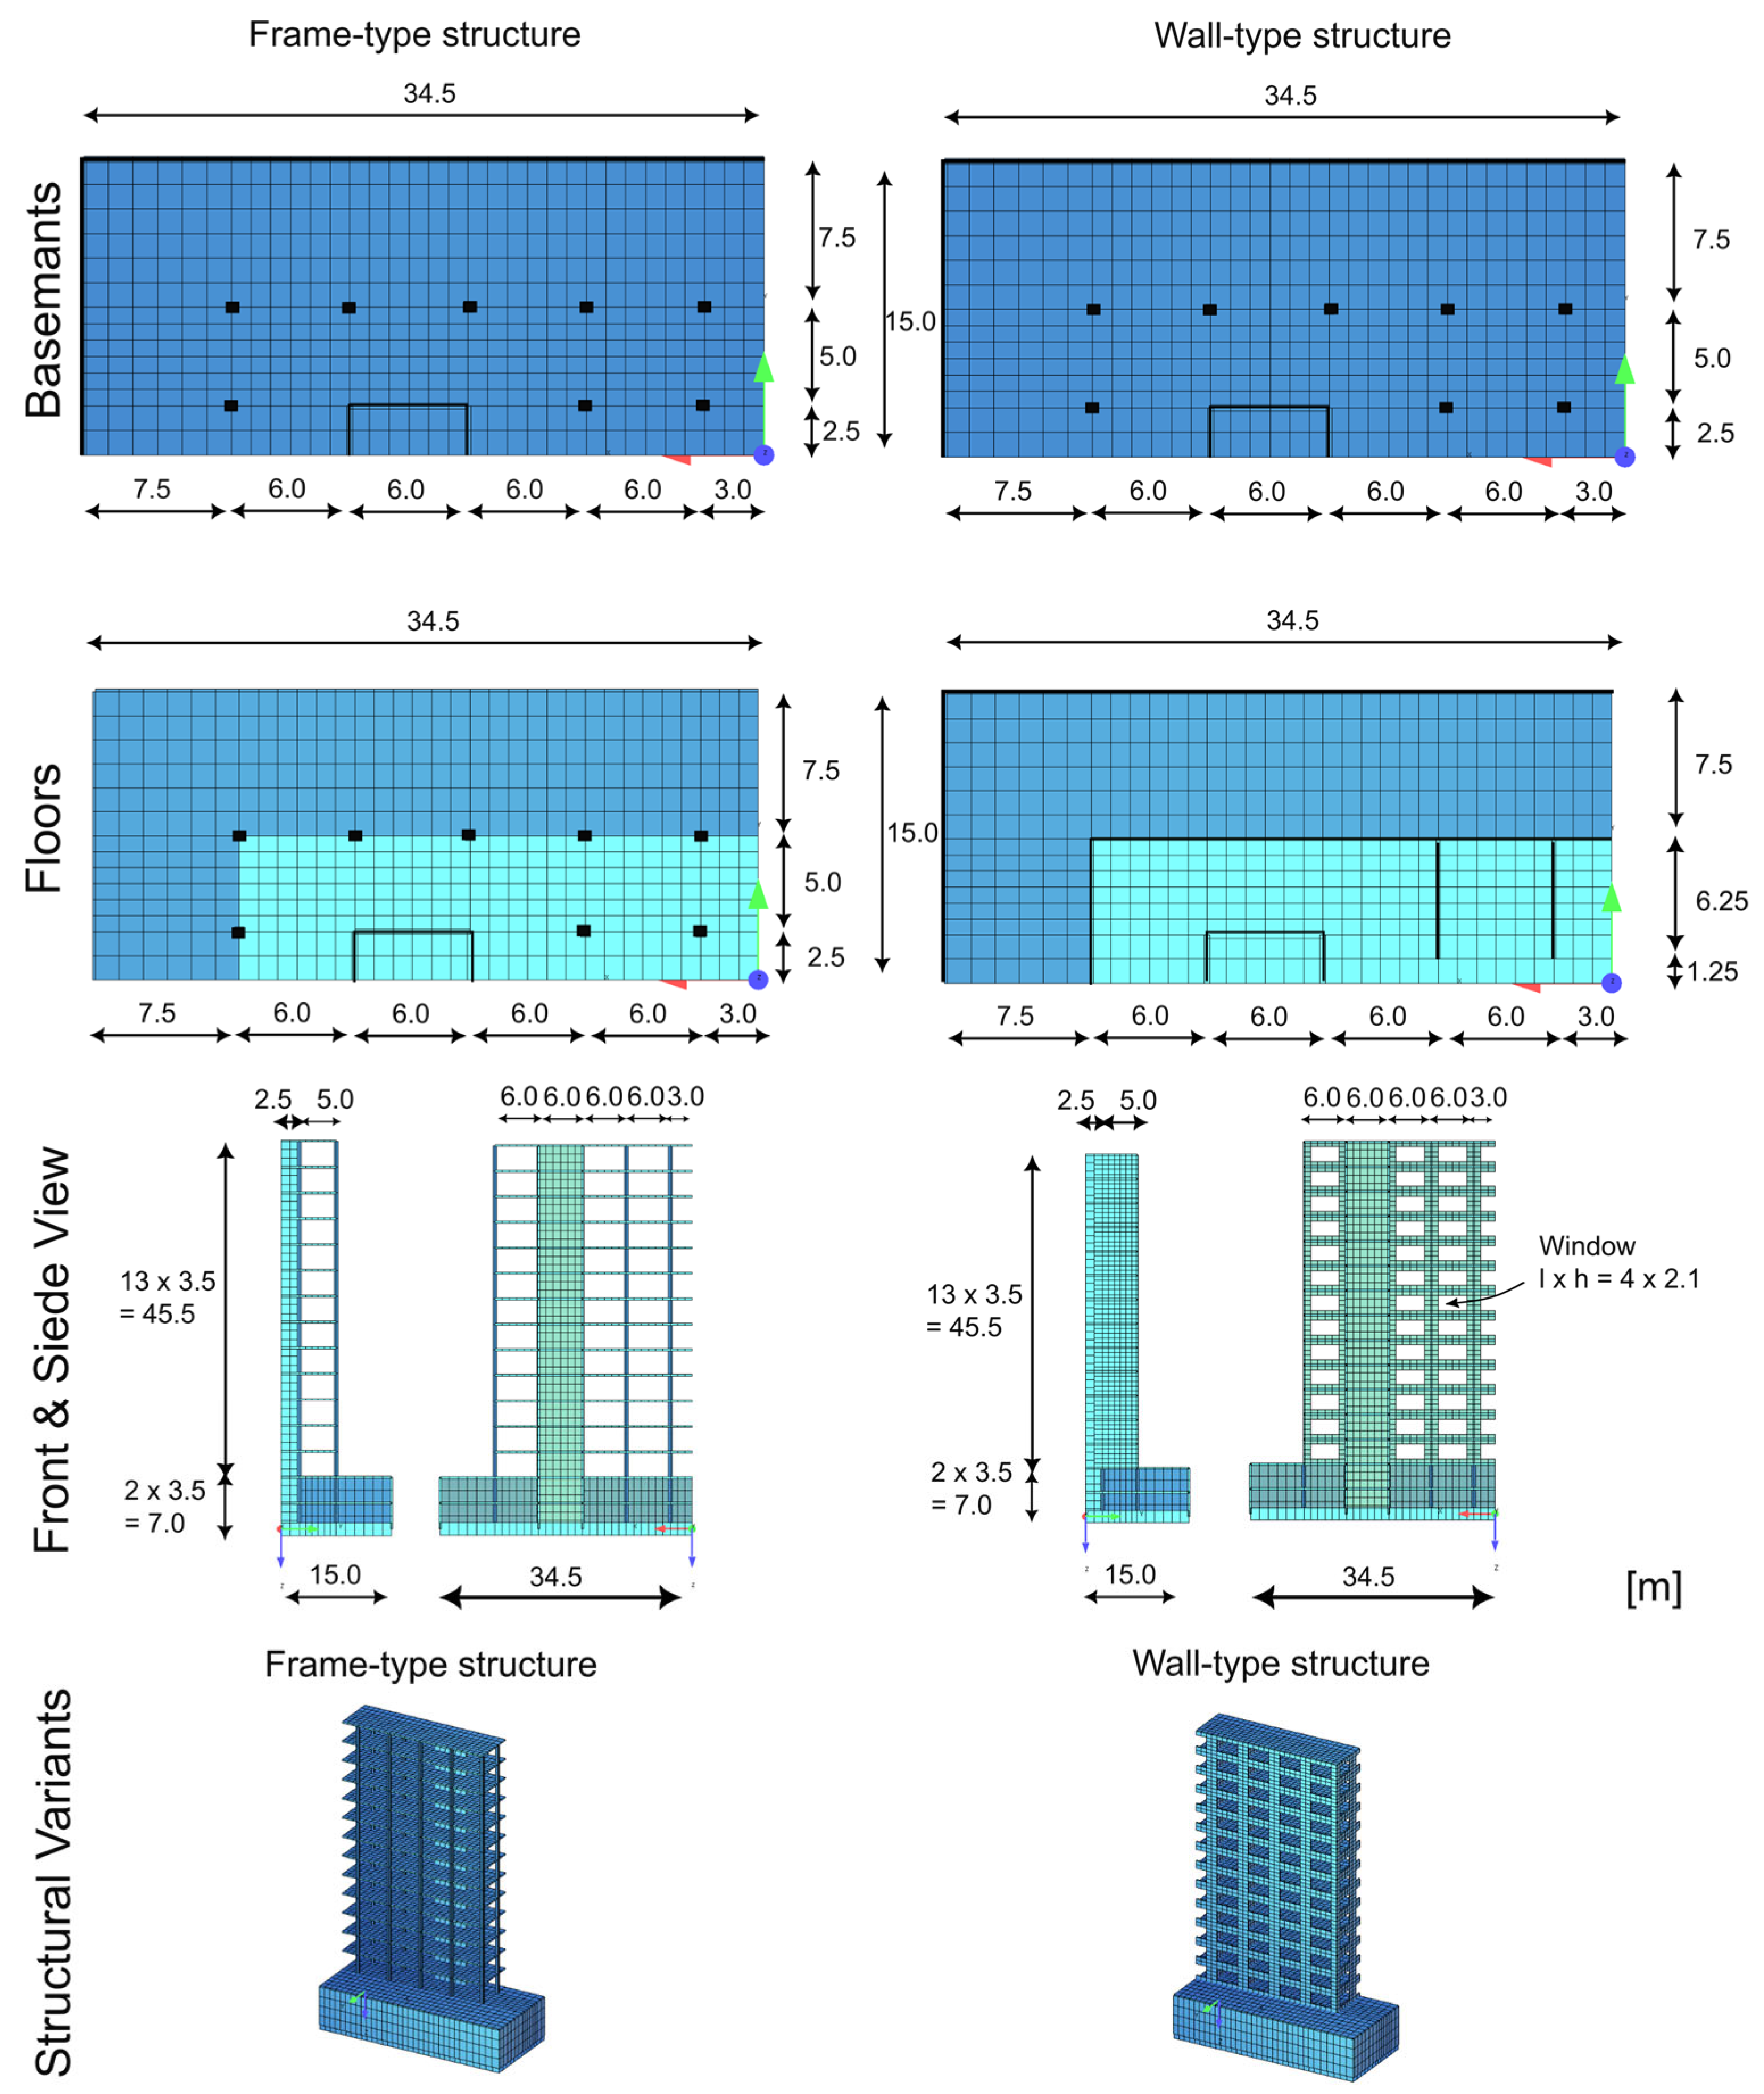
Figure 6.
Geotechnical model setup and integrated structural variants. The central domain illustrates the 3D soil continuum used in the PLAXIS simulations, including boundary conditions, symmetry planes, and groundwater table at -8 m depth. A zero-thickness interface is defined at the contact between foundation, the cellarwalls and soil. The model contains approximately 46,000 soil elements using 10-node tetrahedra elements.
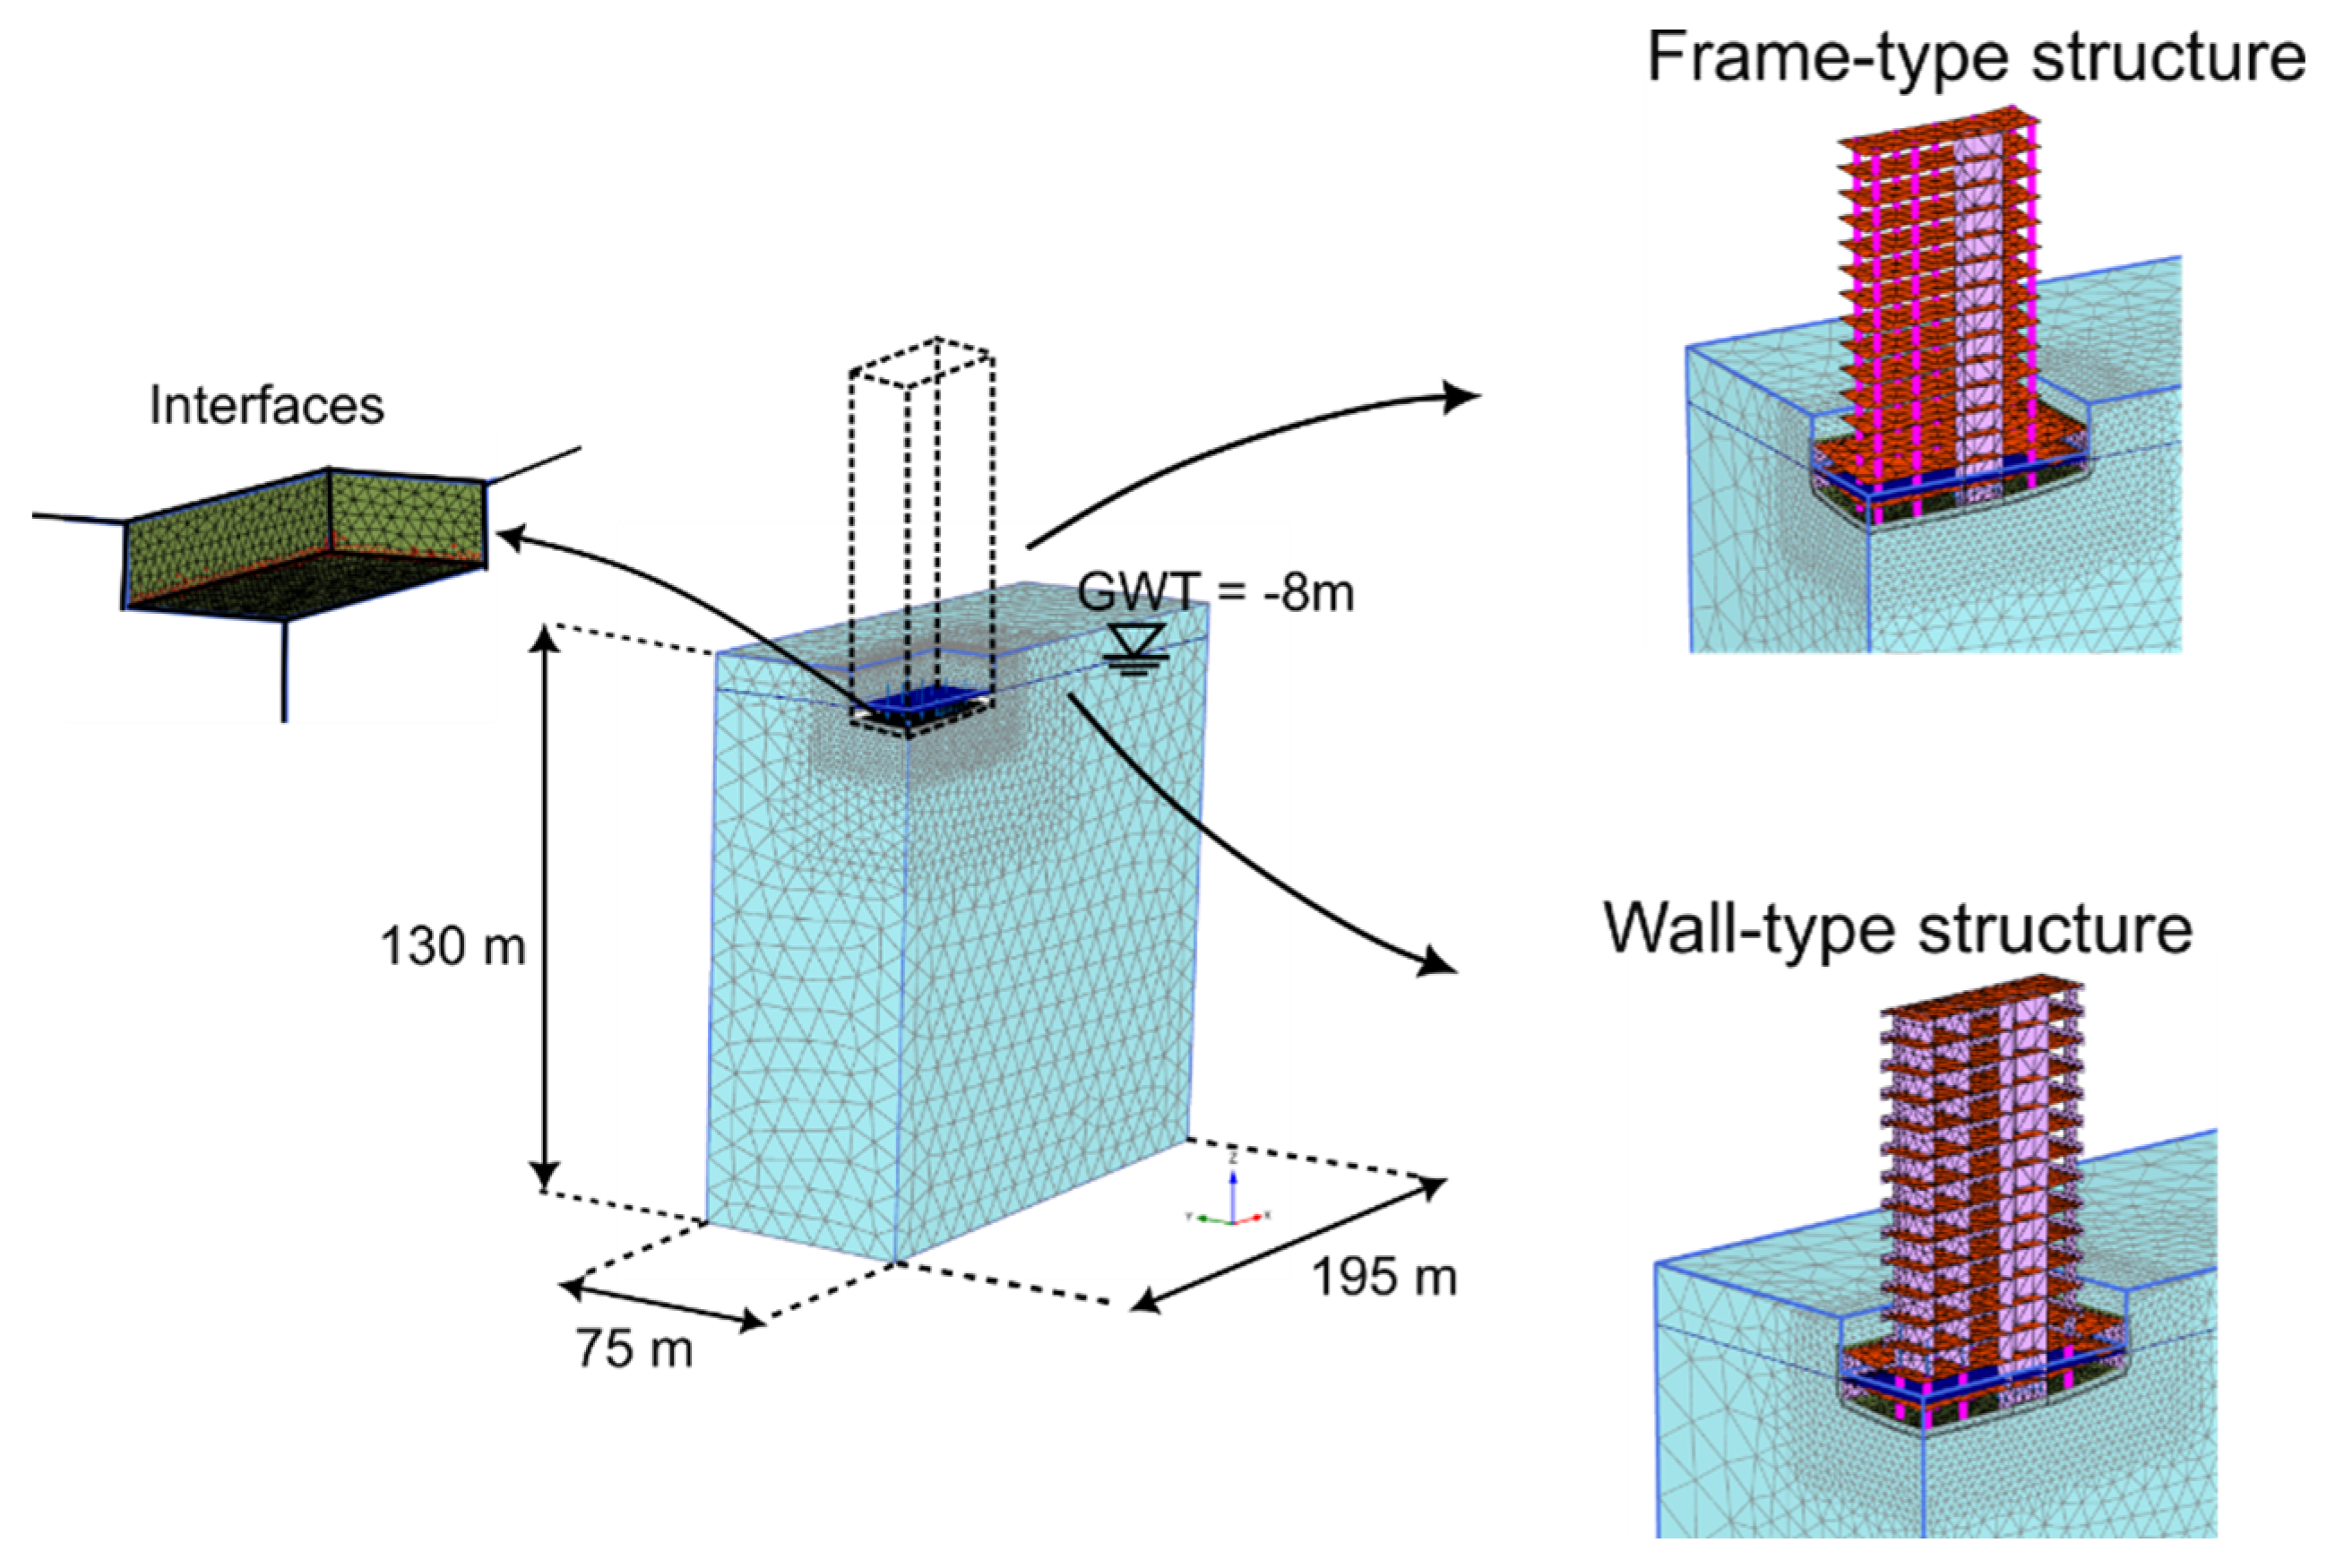
Figure 7.
Overview of evaluation parameters for comparison of structural models. Monitored values include normal forces in outer and inner columns and the core, maximum bending moment beneath the core, field moment at midspan, and settlements (maximum at center, minimum at outer corner).
Figure 7.
Overview of evaluation parameters for comparison of structural models. Monitored values include normal forces in outer and inner columns and the core, maximum bending moment beneath the core, field moment at midspan, and settlements (maximum at center, minimum at outer corner).
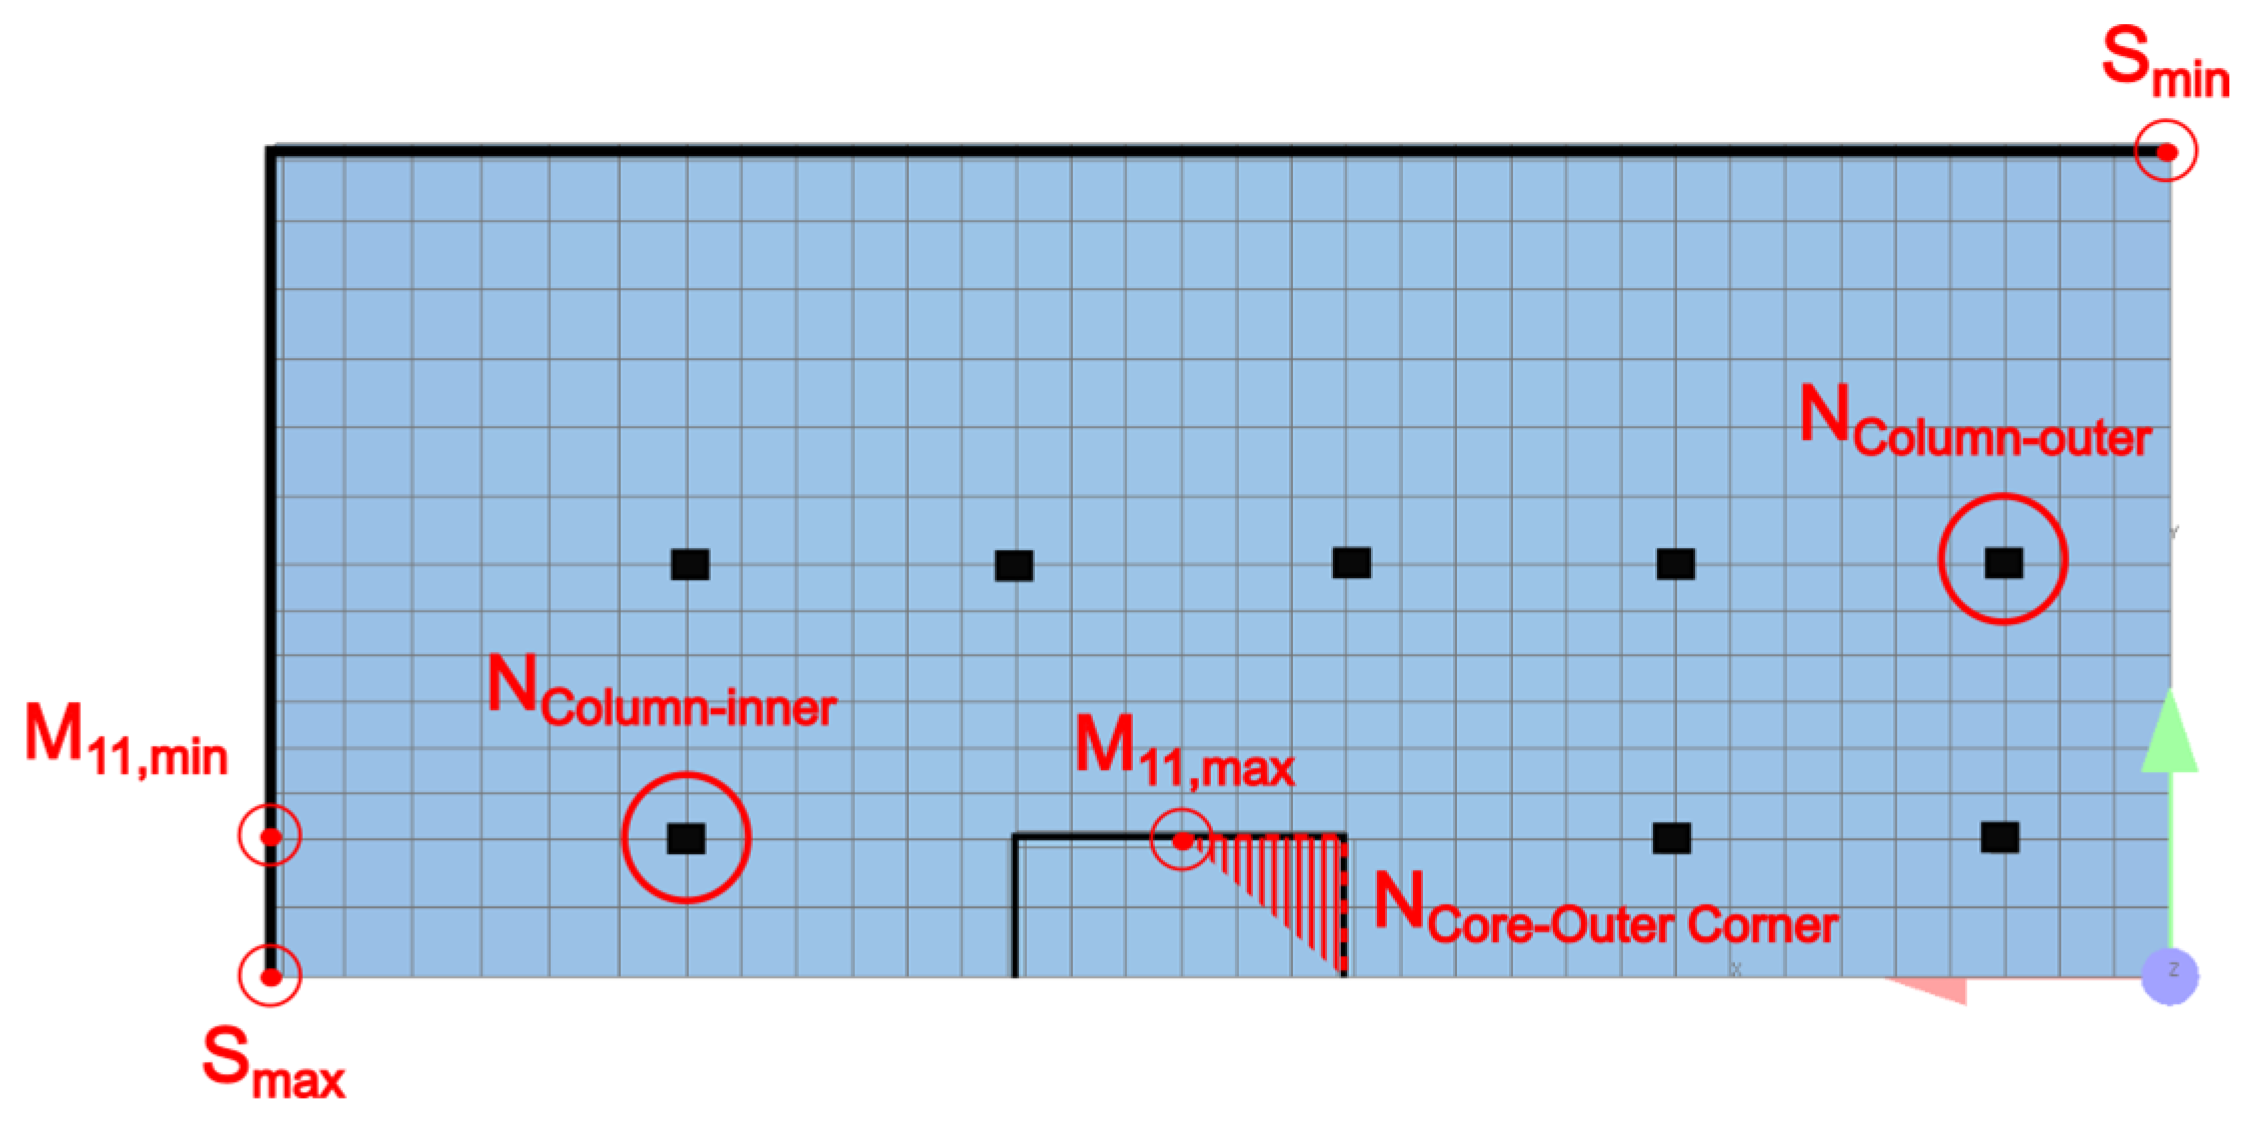
Figure 8.
Total normal force in selected structural members (inner column, outer column, outer core edge) under various load combinations and soil types for a Wall-type and Frame-type structure. The grey bars represent the reference case with fully fixed supports (no settlements). Colored bars show results for different bedding conditions (sand, silt, clay).
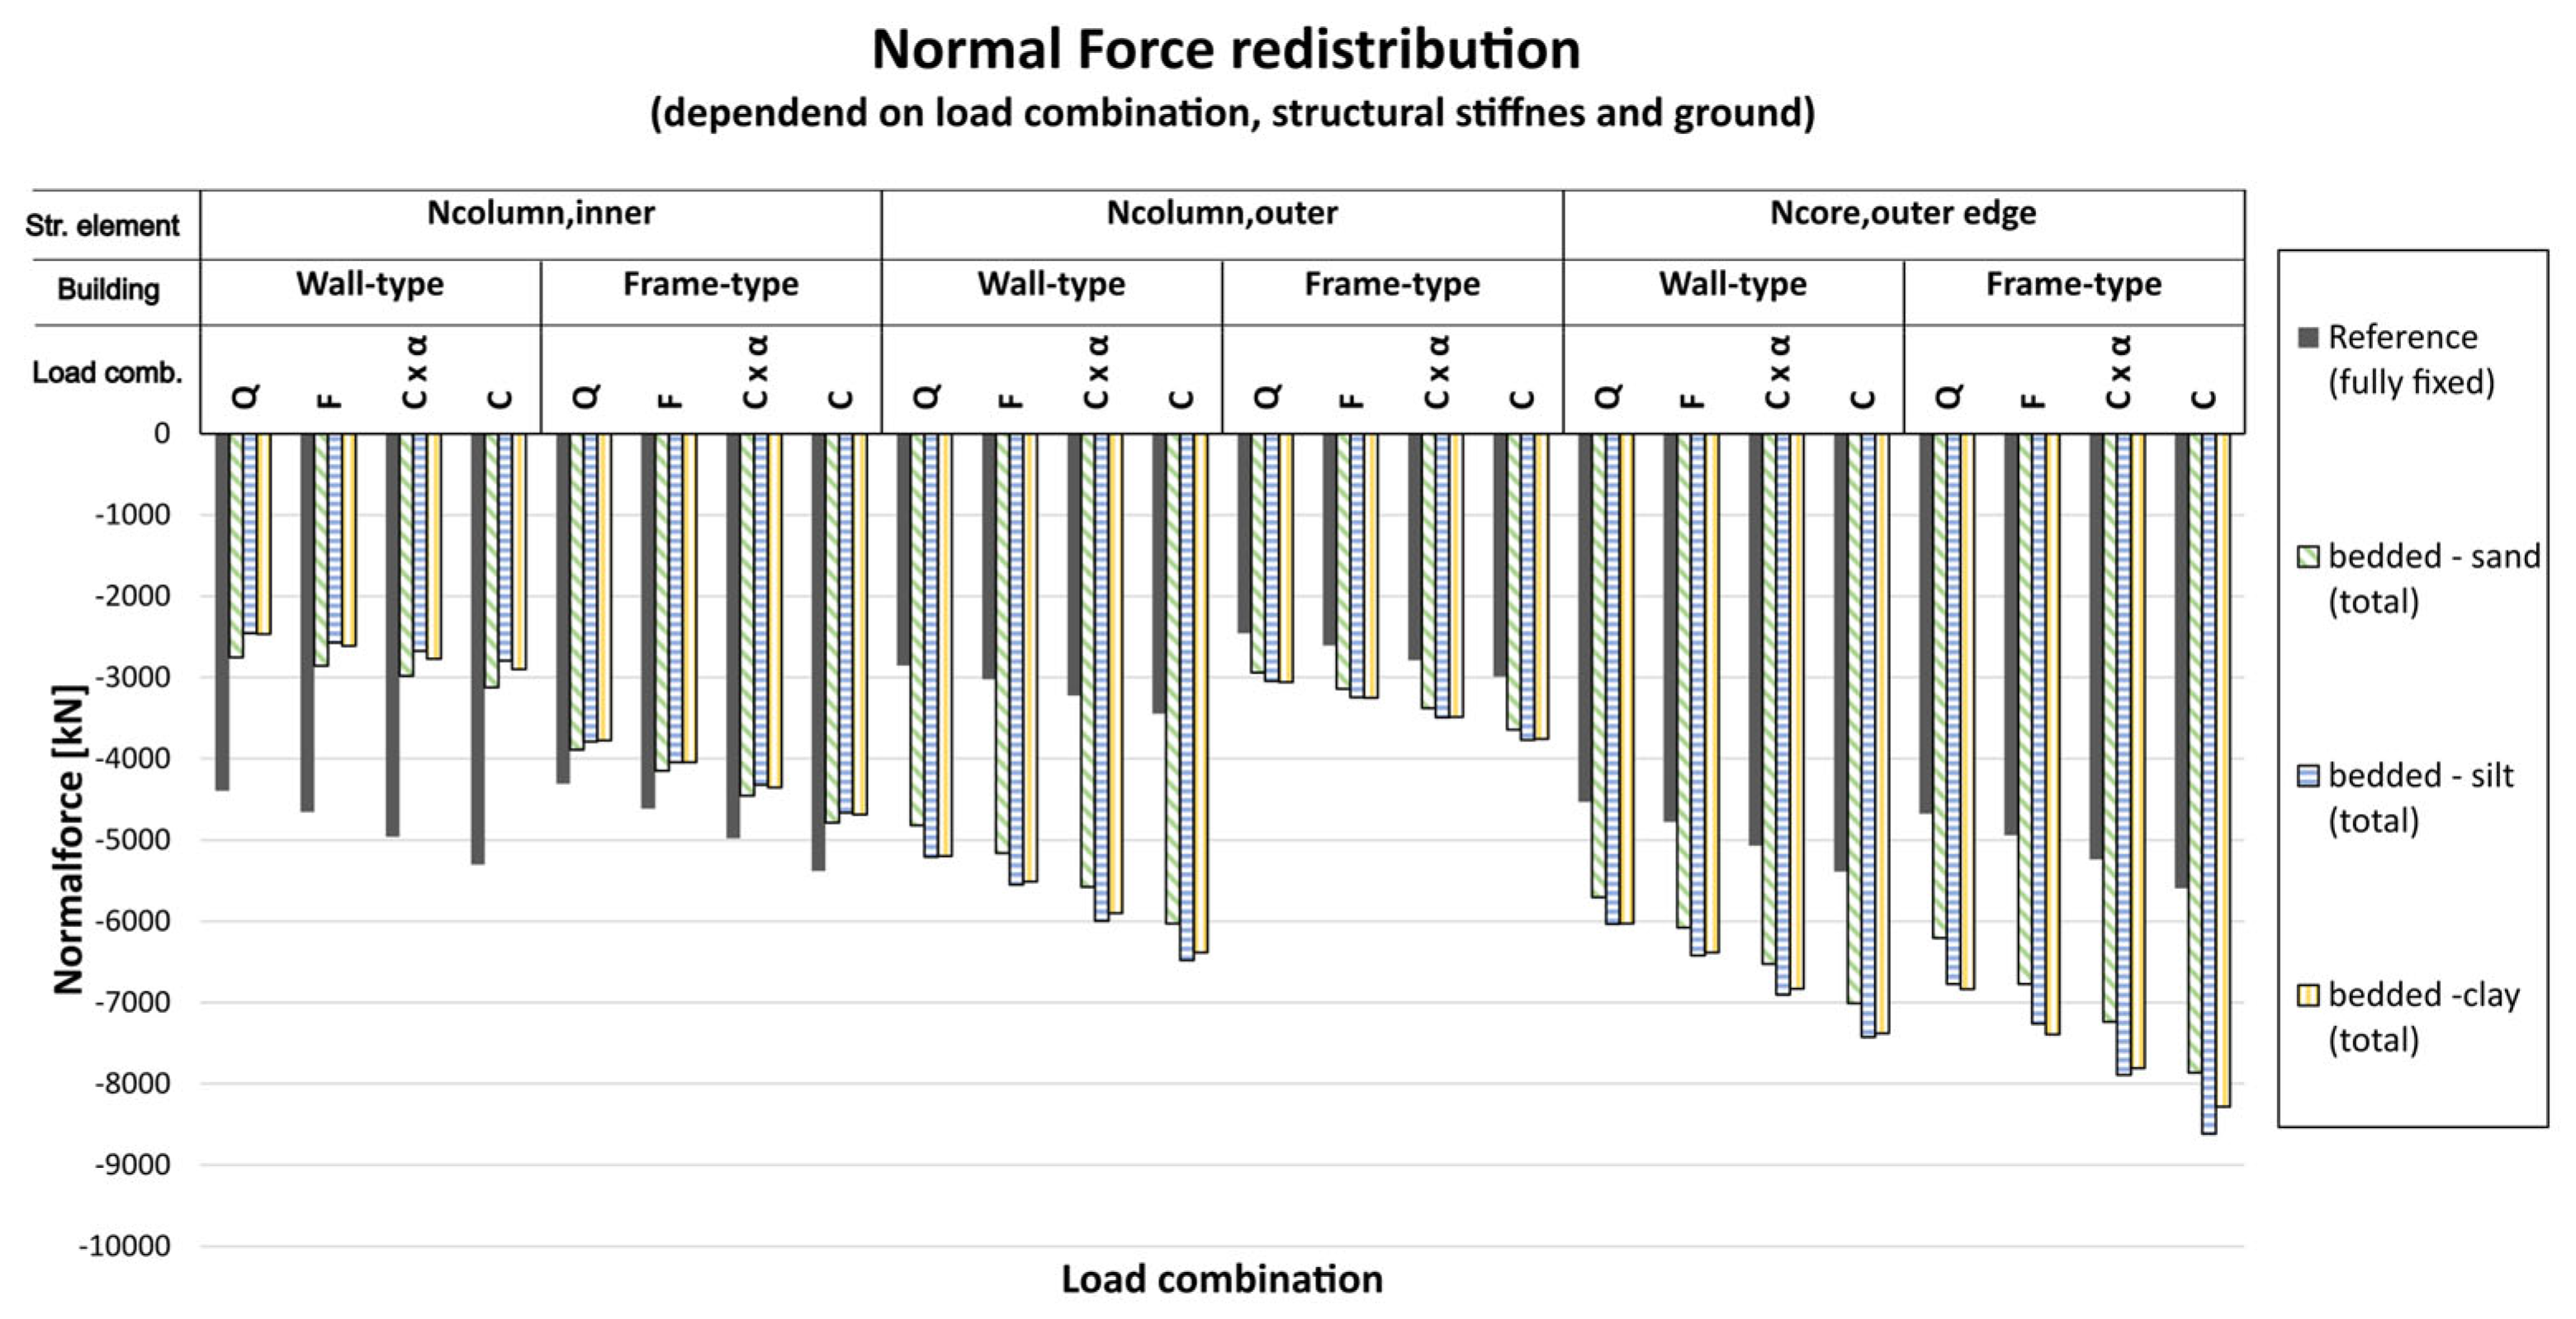
Figure 9.
Relative share of settlement-induced restraining forces in selected structural members (inner column, outer column, core outer edge) under various load combinations and soil conditions. The grey bars represent the load-induced normal force (normalized to the reference case), while the colored hatching indicates the restraining component due to differential settlements. In the inner column (top), restraint leads to force relief, whereas in the outer column (middle) and core edge (bottom), the redistributed forces act as additional loading.
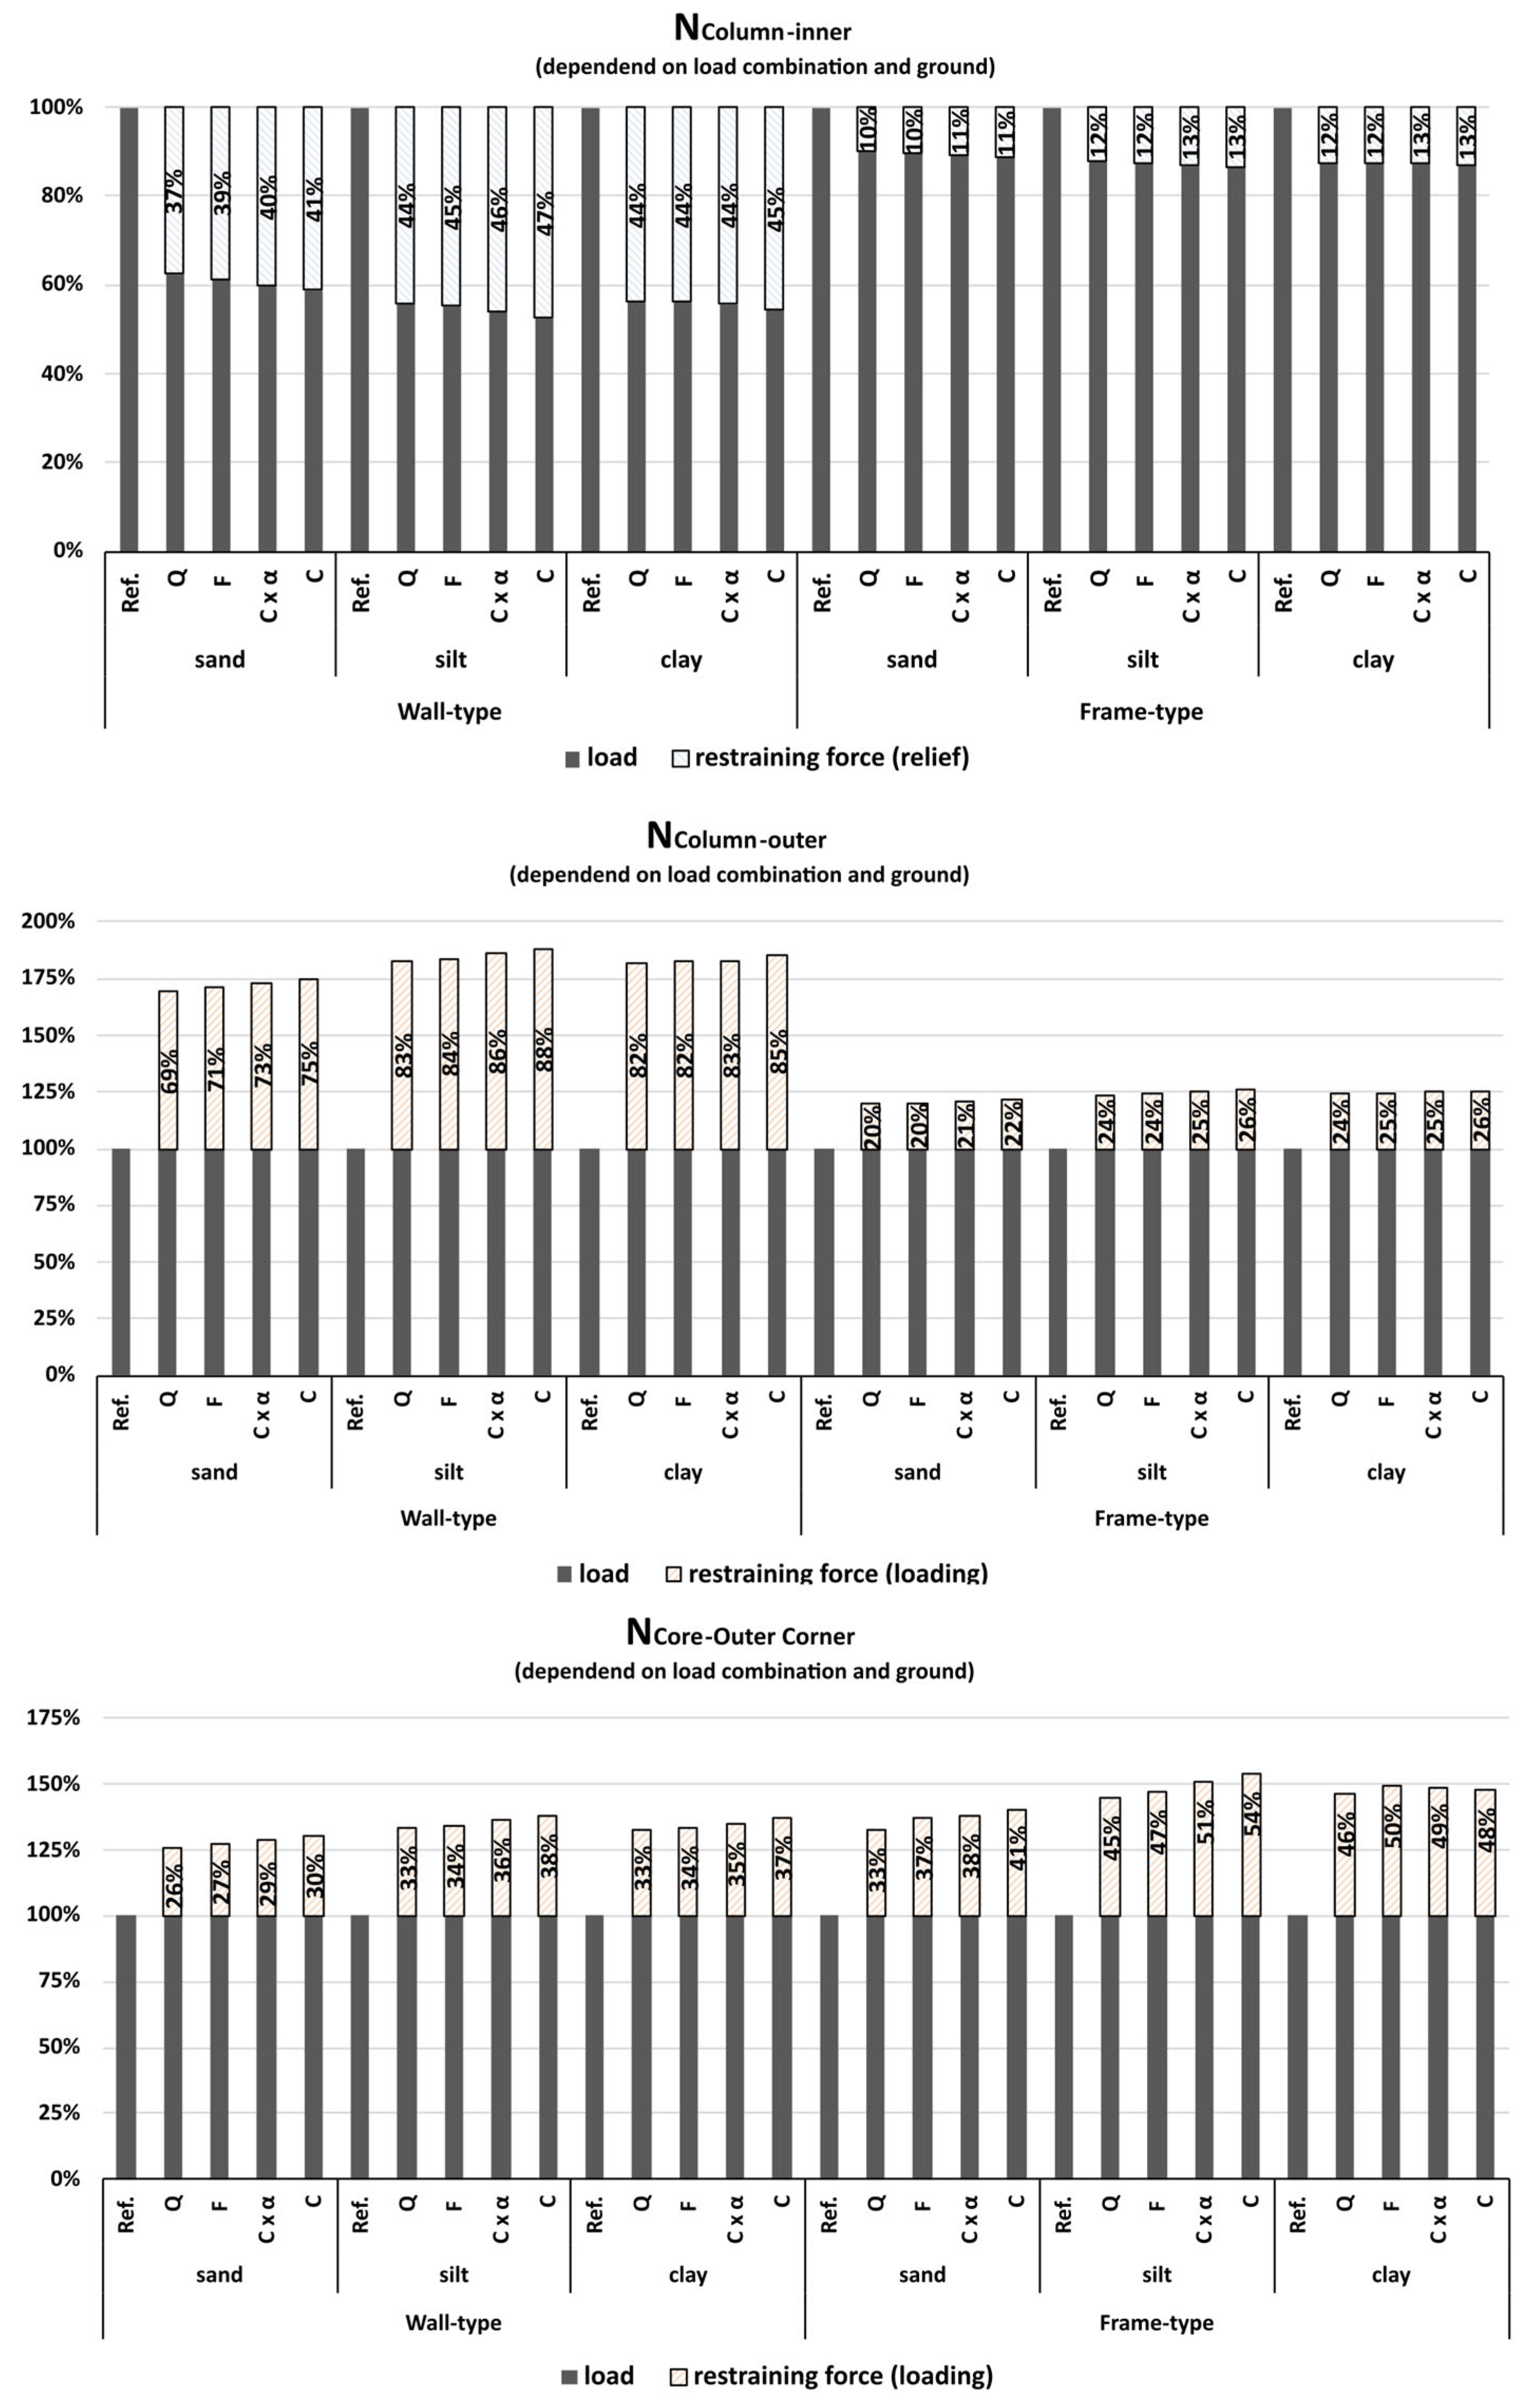
Figure 10.
Normalized maximum settlement (Smax) and differential settlement (ΔS) for various load combinations, soil types, and structural systems.
Figure 10.
Normalized maximum settlement (Smax) and differential settlement (ΔS) for various load combinations, soil types, and structural systems.
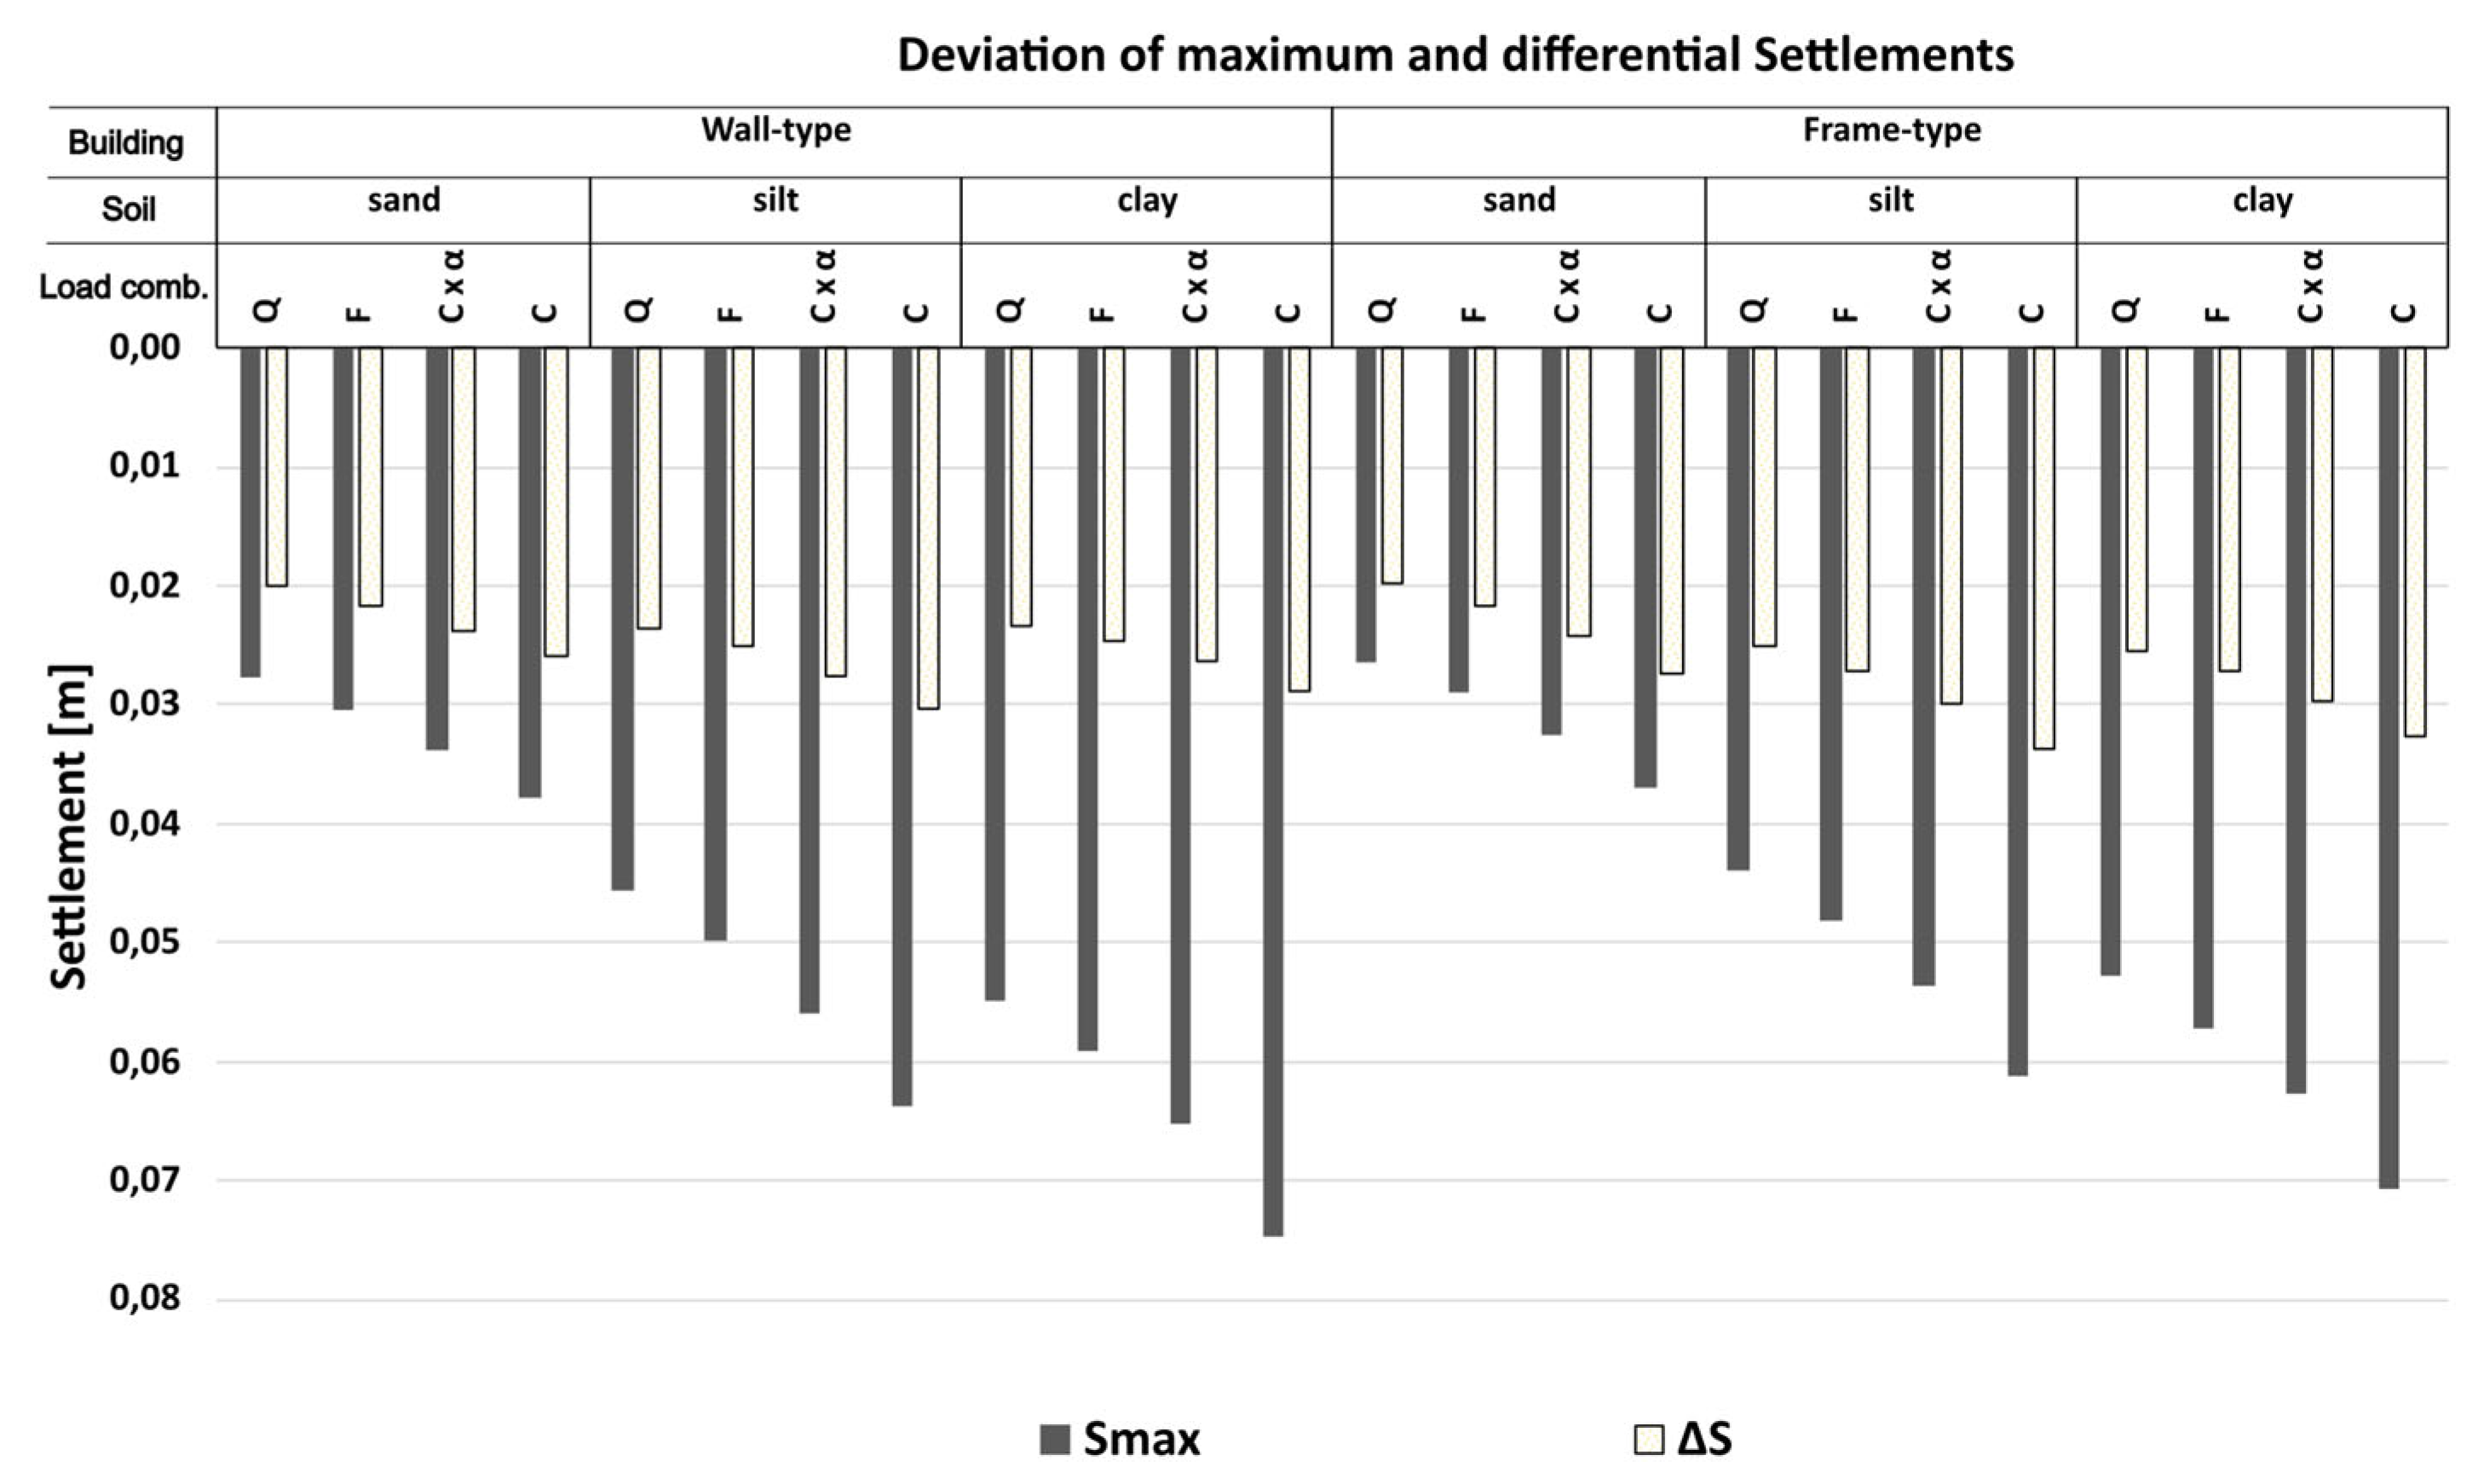
Figure 11.
Normalized maximum and minimum bending moments (M11) in the foundation slab under different load combinations, soil types, and structural systems. The dark grey bars show the maximum bending moment in the core region, while the orange bars represent the minimum moment in the slab field. The moments are taken from the Gauss point closest to the investigated location, as shown in Figure 7.
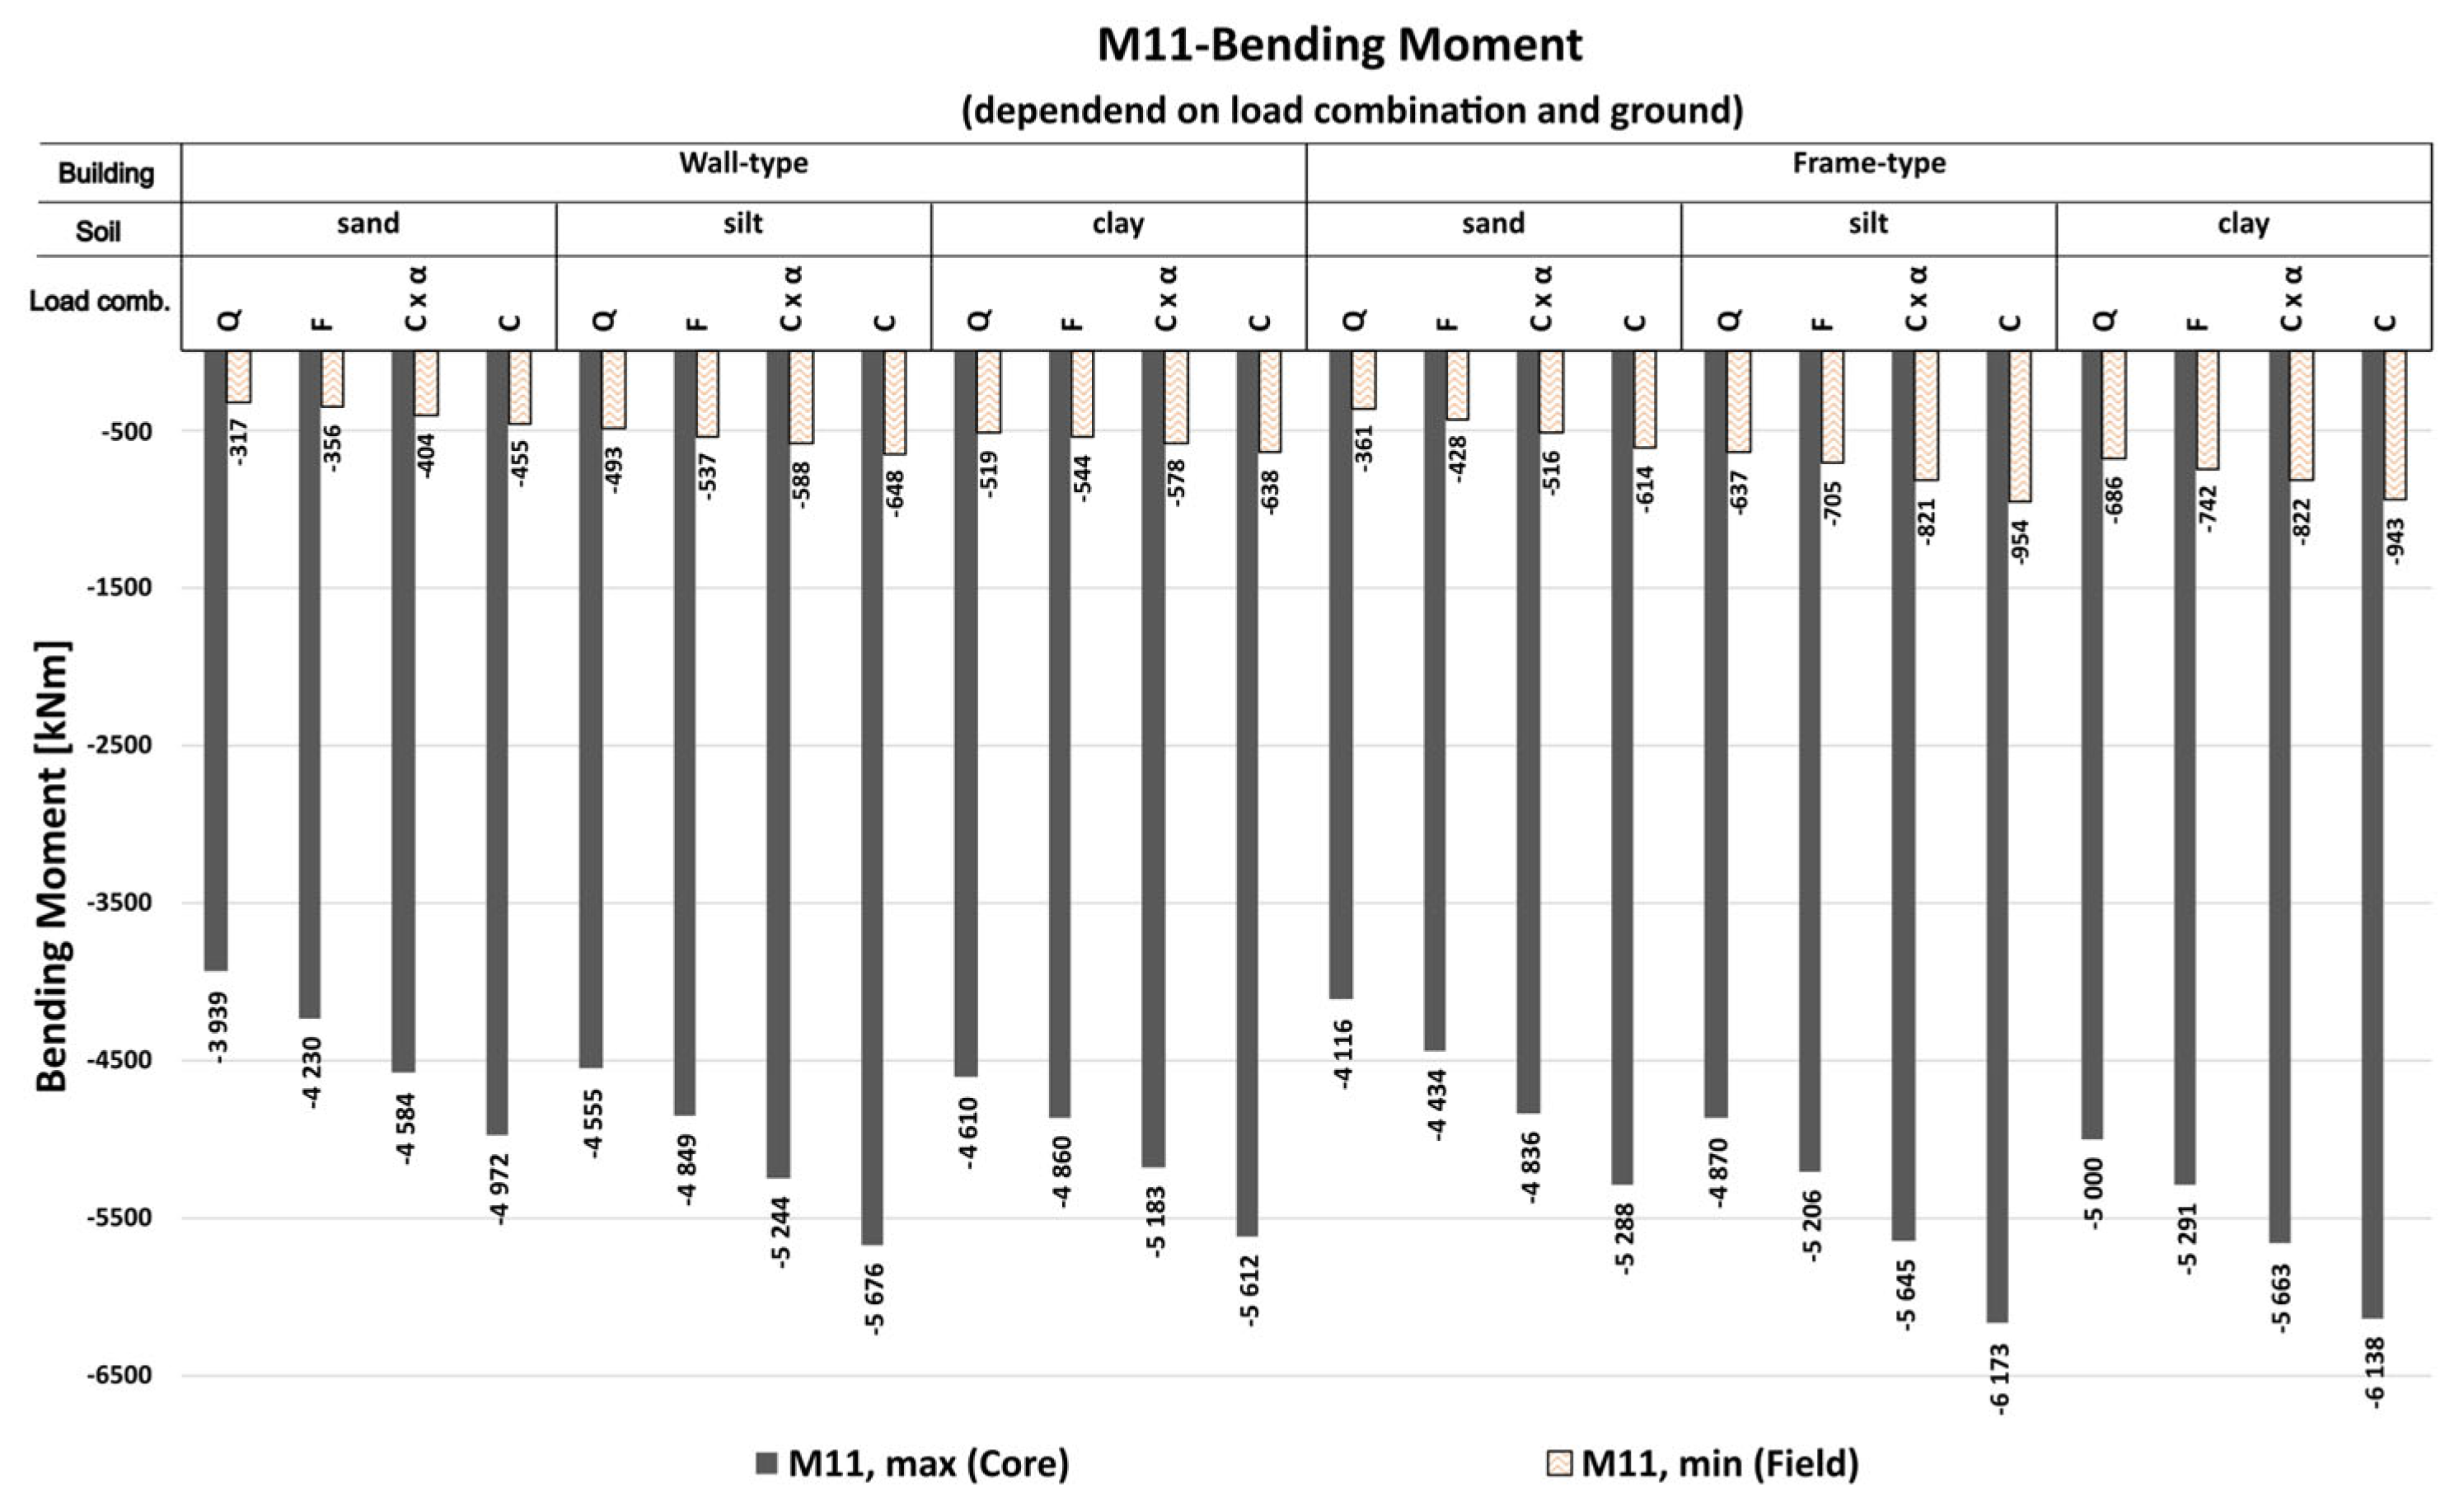
Figure 12.
Relative load and restraining force components in selected structural elements (inner column, outer column, core outer corner) under various loading scenarios and soil conditions. The figure compares results for drained quasi-permanent loading, long-term consolidation, and sequenced loading (short-term application of reduced characteristic load after consolidation) on silt and clay. Grey bars represent the load-induced portion; hatched areas indicate the restraining component—acting as load relief (blue) or additional loading (red).
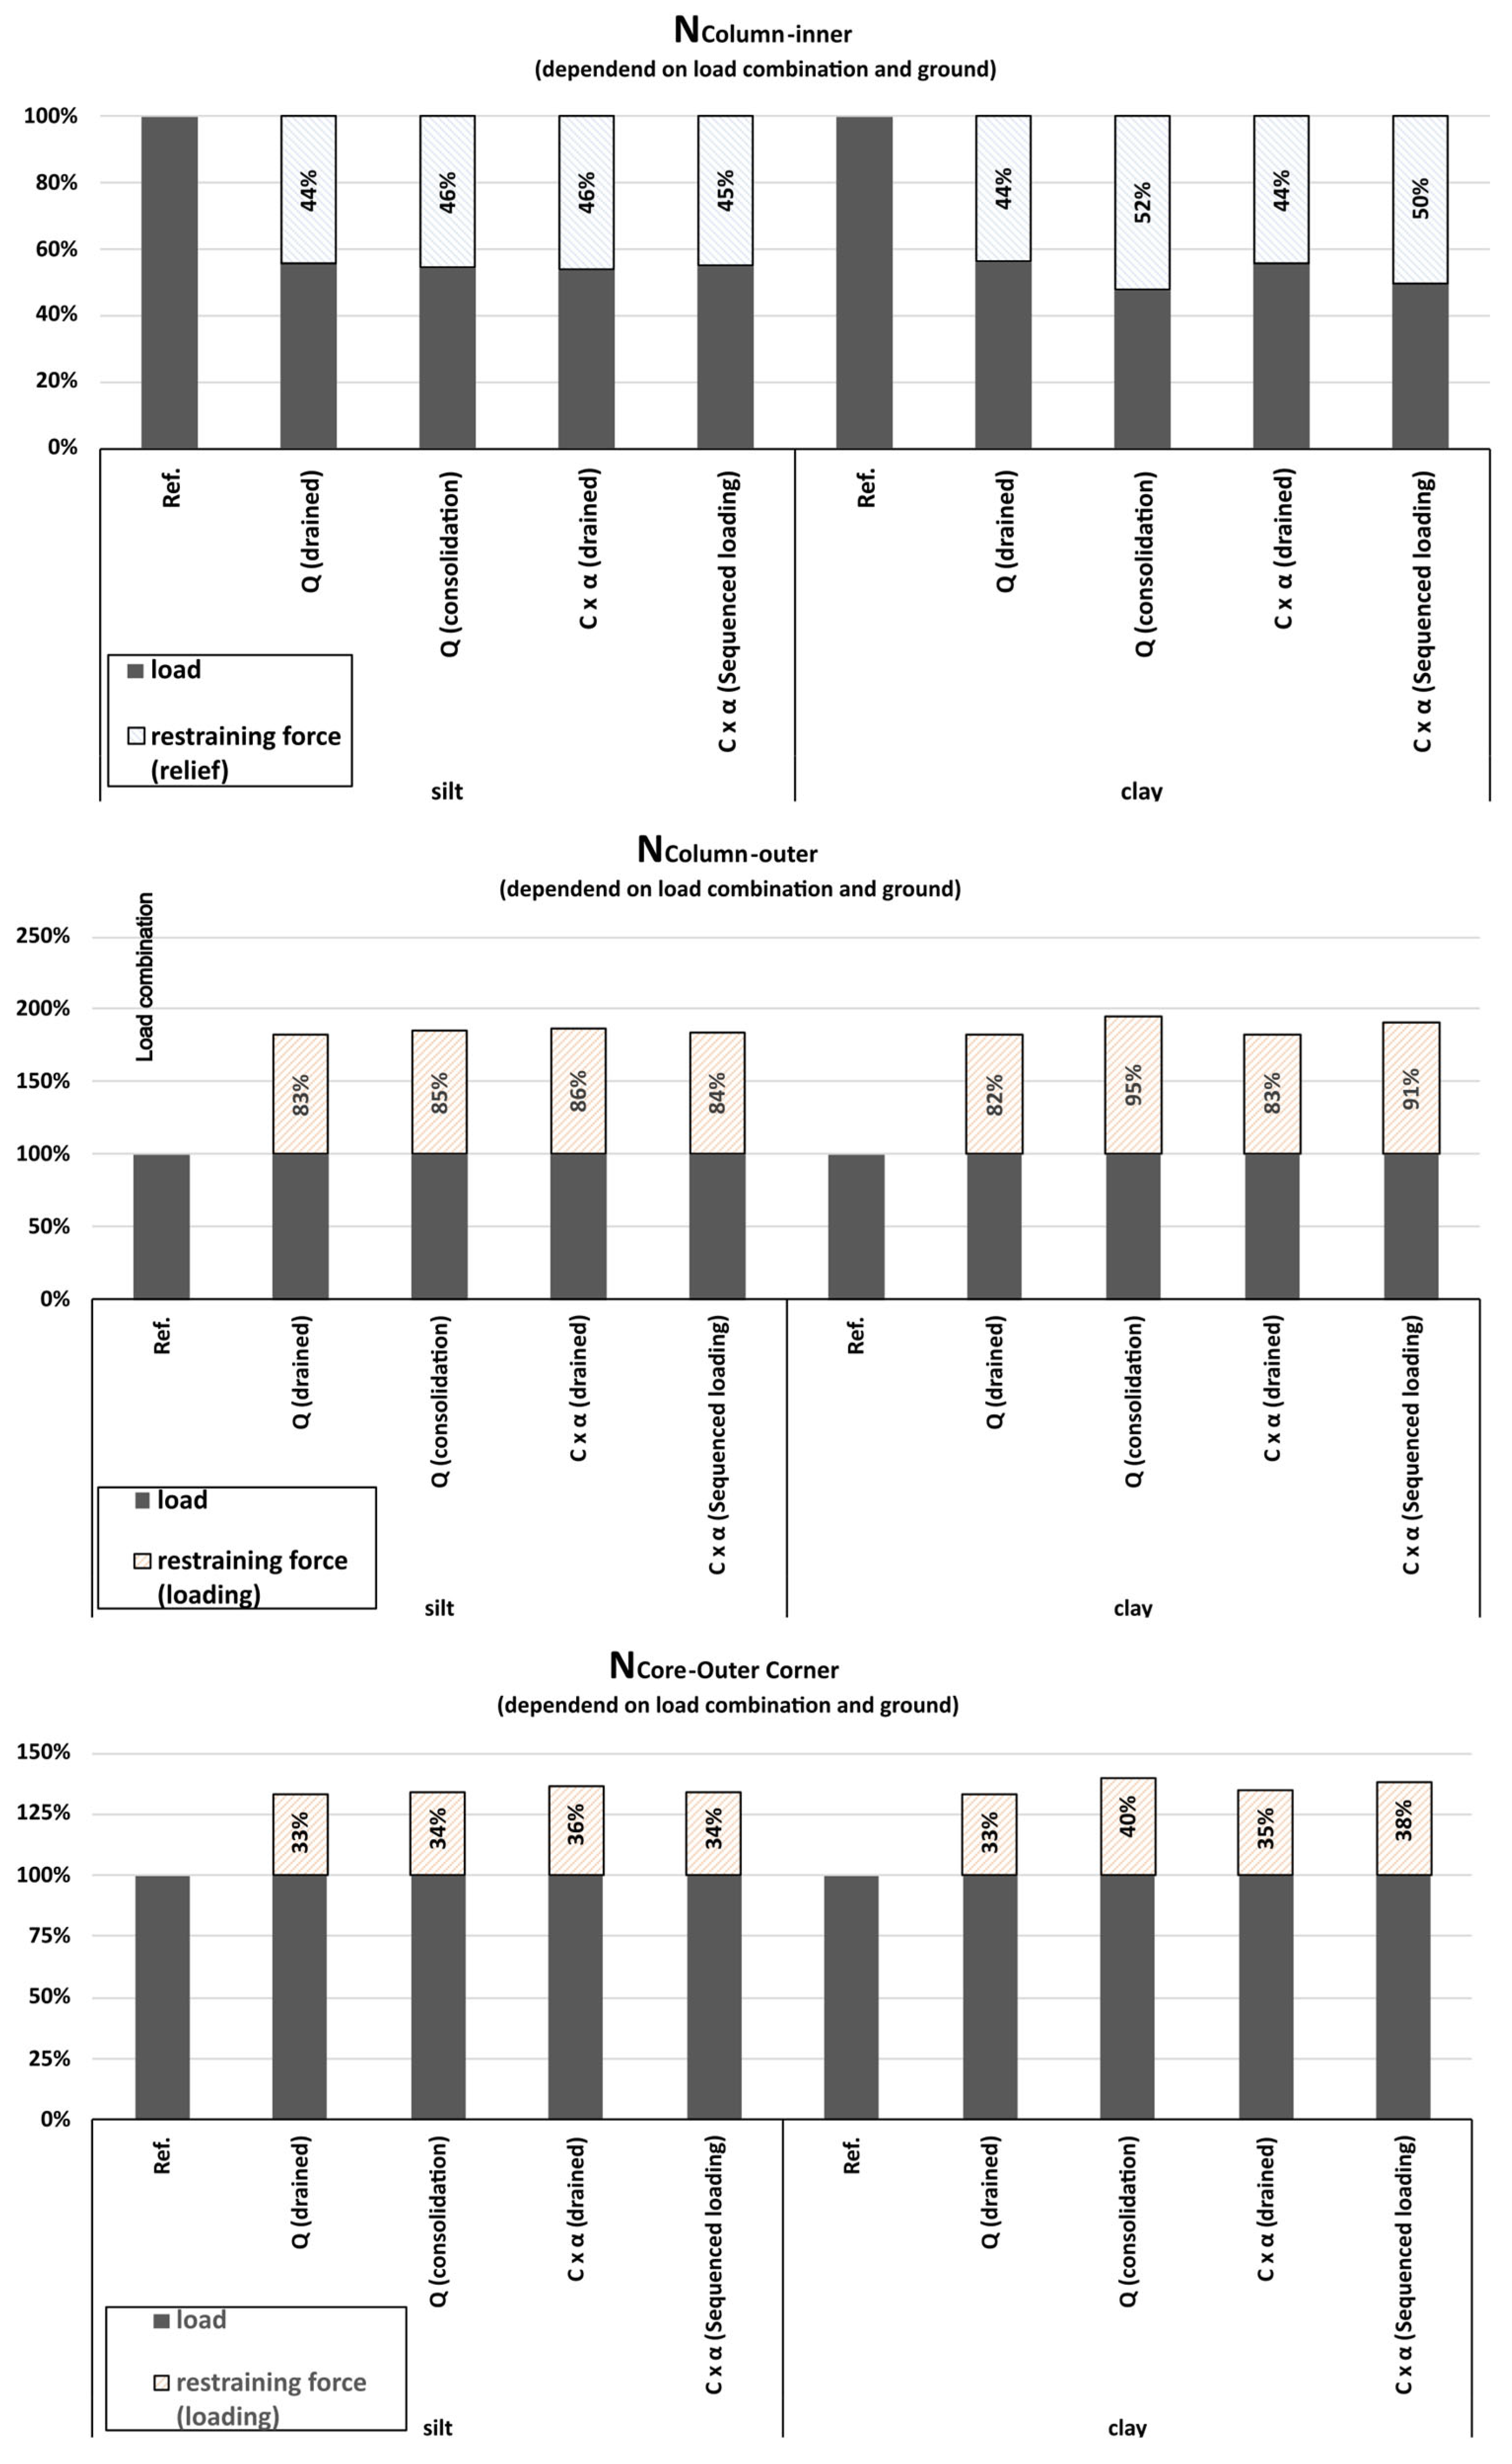
Table 1.
Overview table for thickness of structural components and material properties.
| Structural component | Material properties | |||
|---|---|---|---|---|
|
Foundation slab Floor slab Columns Exterior and interior walls Basement and core walls |
1.75 m 0.28 m 0.50 m 0.20 m 0.30 m |
Poisson's ratio Elastic modulus Concrete Flooring Facade |
0.2 m 30 000 MPa 25 kN/m3 2 kN/m3 3.5 kN/m |
|
Disclaimer/Publisher’s Note: The statements, opinions and data contained in all publications are solely those of the individual author(s) and contributor(s) and not of MDPI and/or the editor(s). MDPI and/or the editor(s) disclaim responsibility for any injury to people or property resulting from any ideas, methods, instructions or products referred to in the content. |
© 2025 by the authors. Licensee MDPI, Basel, Switzerland. This article is an open access article distributed under the terms and conditions of the Creative Commons Attribution (CC BY) license (http://creativecommons.org/licenses/by/4.0/).
Copyright: This open access article is published under a Creative Commons CC BY 4.0 license, which permit the free download, distribution, and reuse, provided that the author and preprint are cited in any reuse.


