Submitted:
18 August 2025
Posted:
19 August 2025
You are already at the latest version
Abstract
Newborn screening is a public health program designed to detect severe inherited disorders in newborns within the first days of a baby’s life. This study assessed the influence of quality pro-cesses in NBS laboratories through testing NBS panels, including GALT, TSH, G6PD, Leu, Met, Phe, C5, C6, C8, C10, C14, and C14:1, under 4˚C, 20˚C, and -50˚C for two months. Results found that sam-ples can be stored at -50°C to maintain stability for most parameters in the NBS panel. The study shows methionine is recognized for its low stability among amino acids at room temperature and GALT among enzymes under all conditions. Moreover, different storage conditions might apply de-pending on the tested analyte of the NBS panel. Therefore, improving the quality process of the NBS laboratory can prevent false positive results and enable the re-use of samples after a period.
Keywords:
newborn screening
; DBS stability
; quality control
; post-analytical phase
; laboratory quality management
; DBS storage
; temperature
1. Introduction
Newborn screening is a field that can screen newborn babies for inherited disorders, allowing early detection and intervention to reduce the impact of these conditions [1]. Newborn screening has recently been implemented as a public health strategy in many developed countries to help detect inherited disorders early and implement strategies for inborn metabolic abnormalities in newborn infants [2]. The newborn screening tests can be performed by using a dry blood spot card (DBS), which is a filter card that requires a low amount of blood, 4-6 drops, from an infant’s heel after the first 24 hours of the baby’s life, to develop the screening process [3]. It is essential to mention that using DBS samples instead of whole blood provides advantages such as simplified sample collection, transportation, and storage [4]. Because of the dry form of the samples, the risk of degradation during transport compared to whole blood is reduced, which requires proper storage conditions to maintain the integrity [4]. Proper storage conditions are necessary to maintain integrity and decrease infection and biohazard risks in the dry state [4]. DBS can screen multiple disorders and is easily used for re-testing samples if stored correctly [3]. The drying process can impact the stability of the sample; if it is not well dried, it will negatively affect the sample results [5]. Time is critical to maintaining the stability of the DBS samples, depending on the tested analyte; however, temperature, humidity, expired filter card, and intense light exposure can also impact the samples’ stability [5]. A Study found that the stability of the DBS sample will be decreased as the duration between sample collection and testing is increased [6]. Moreover, a suitable storage condition for samples will maintain the stability of the DBS card and simplify the re-evaluation of the sample [3].
The panel of metabolic disorders in newborn babies has several parameters, and because of the variations in the stability of these substances, samples need to have a specific transportation method and storage conditions to avoid false positives or false negative results [7]. Quality control in laboratories is necessary to ensure the accuracy and reliability of patient results [8]. Improving the quality of the pre-analytical phase can prevent rejection from wrong sample collection, bad transportation conditions, or poor receiving methods [9]. In the analytical phase, samples should be performed at laboratory room temperature as soon as they are received and not exceed the turnaround time (24-48 hours) to avoid sample instability [5]. However, improving the quality of the post-analytical phase ensures valid and accurate actual positive results of the DBS card in case of re-testing the sample [5]. Good storage conditions of the DBS cards will maintain the high quality and accuracy of sample test results [5].
The biological viscosity of the sample, the transportation condition (temperature and time), and the amount of blood applied in the filter card can impact the quality of the DBS sample [5]. According to the US Newborn Screening Sample Collection Guidelines, the ideal time for collecting a sample from an infant is between 24 and 48 hours after birth. The sample should be correctly labeled, shipped to the laboratory, and tested within 24 hours of the sample collection [10]. However, the American College of Medical Genetics and Genomics (ACMG) recommended that the acceptable range of transportation time for a satisfactory result from the DBS sample is to arrive in the laboratory within 3 days since collection [6]. Another study mentioned that the drying time is crucial because leftover moisture encourages bacterial growth or mold formation and changes the extraction process [11]. Because of this, it is highly recommended that a desiccant and humidity/temperature monitor device be added to ensure that the surrounding environment is not changed during transportation, reducing the potential for infection linked to samples [11]. Moreover, the humidity and temperature of the samples need to be close to laboratory room temperature by placing the samples in an ice box with dry ice [12]. Researchers also recommended punching the DBS card from the center or near the outer edge during the analytical phase for optimal analyte concentrations [5].
This study aims to examine the impact of post-analytical phase on the stability of dry blood spots DBS specimens for twelve analytes (GALT, G6PD, TSH, Leu, Met, Phe, C5, C6, C8, C10, C14 and C14:1) under different conditions (laboratory room temperature 20°C, refrigerator 4°C, and deep freezer -50°C) over 2 months at controlled laboratory humidity 30% to 50% using QSIGHT LC/MSMS and GSP methods at the PHA in Saudi Arabia. It was hypothesized that more accurate results would be found with samples tested within 24-72 hours since sample collection, and samples would be more stable if stored at -50°C for a longer time than the other conditions. The findings of this experiment determine the optimum sample transportation condition and the sample storage method.
2. Materials and Methods
2.1. Data Collection
Dry blood samples DBS, which are from the revvity company were designed to support accurate and reliable results, were collected by nurses from different hospitals around Saudi Arabia by taking a few blood drops from the baby’s heel during the first 24-48 hours of the baby’s life and applied to the DBS filter card to fill up the whole five circles. The blood was allowed to be saturated well from both sides of the filter card and left to dry at room temperature for 3-4 hours to avoid sample rejection. All babies’ information must be written in the DBS demographics section before sending the sample.
2.2. Shipment and Receiving Samples at Public Health Authority
Samples were sealed in a biohazard bag and placed in a sample shipping box with dry ice and a temperature monitor device to maintain the sample condition at room temperature between 15-25˚C. The shipment duration usually takes 24-72 hours from sample collection until it arrives at PHA. Upon arrival at PHA, the samples were received, and all demographics written on the card were confirmed with the data entered in the LIS.
2.3. Experimental Design
Samples were initially run at room temperature for the initial laboratory screening. This study collected 211 known results samples after the initial run to test 12 different analytes. For confidentiality purposes, each sample was given a new lab and barcode number. Each DBS card has five full blood circles; three circles were used in this study, and the remaining were saved for future laboratory use. These circles were cut, labeled, and stored under controlled temperatures (20°C, 4°C, and -50°C) and humidity between 30-50% with one desiccant sachet for moisture prevention. Each condition was monitored and recorded by a temperature monitor device. The test was re-run as duplicate spots after 3 days, 7 days, 14 days, 30 days, and 60 days from the initial run over 2 months (10 spots in total for each disease).
The amino acid, organic acid, and fatty acid oxidation analytes (Leu, Met, Phe, C5, C6, C8, C10, C14, and C14:1) were screened using the QSIGHT LC/MSMS method. In contrast, the hormones (TSH) and enzymes (GALT and G6PD) were screened using the Genetic Screening Processor GSP method.
2.4. Statistical Considerations
The statistical analysis starts with estimating descriptive measures like mean, standard deviation, minimum, and maximum. Line graphs are drawn, and the percentage change in stability during follow-up has been calculated separately for each condition for all the study parameters (GALT, TSH, G6PD, LEU, MET, PHE, C5, C6, C8, C10, C14, and C14.1).
One-way ANOVA (Analysis of Variance) was performed to test the mean percentage change in the stability of the dry blood spot during follow-up at a particular condition for the study parameters. The significance level is 5%, and the highly significant level is 1%. Microsoft Excel 365 is used for graph performance and data summaries, and IBM SPSS Statistics 30.0 is used for data analysis.
Some GALT and G6PD samples were excluded from the research due to results below the instrument’s lower limit, as indicated by the less-than sign (<), making them unsuitable for calculation.
2.5. Ethical Consideration
This experiment does not intervene with patients, so no human harm exists. The patient’s biodata is not required (all specimens are used for research purposes), so no patient consent is needed, and laboratory center data confidentiality was obtained from the Institutional Review Board (Public Health Authority Saudi Arabia, IRB NO: PHA-IRB-A077-2024).
3. Results
There are 211 known result DBS samples that were stored under different conditions (4˚C, 20˚C, and -50˚C) over 60 days. These samples were tested to determine the stability of each parameter of the NBS panel. Each run was compared with the initial run in the laboratory.
Figure 1 provides an estimated summary of the average means measuring the stability score of the GALT enzyme in dry blood spots at different temperatures over time. The stability score decreased significantly when stored at room temperature compared to refrigeration or freezing conditions. Figure 1 also presents the results of the one-way ANOVA test for the GALT enzyme. This statistical test evaluates significant differences in the mean percentage change of the stability score of dry blood spots at various time points under different conditions. The percentage change from the initial stability score at room temperature on days 0, 3, 7, 14, 30, and 60 are recorded as 100%, 82.76%, 76.83%, 66.08%, 61.94%, and 24.266%, respectively. There was a notable reduction in the stability score, with the percentage change under refrigerator storage decreasing from 100% on day 0 to 87.55%, 84.58%, 79.21%, 77.15%, and 76.59% on days 3, 7, 14, 30, and 60. This indicates a significant decline in stability over time at refrigerator temperature. At freezer temperature, the estimated values ranged from 100% initially to 88.54% on day 3, 88.85% on day 7, 83.79% on day 14, 88.19% on day 30, and 95.60% on day 60. The test concludes that there is a highly significant difference in the percentage change (P<0.001) in the stability scores of dry blood spots across all conditions.
Figure 2 above shows the estimated percentage change observed for the G6PD enzyme at room temperature: 86.88%, 82.71%, and 83.60% compared to the initial run on day 0, which was 100%. The observed refrigerator temperatures were 100%, 86.46%, 84.18%, 88.96%, 85.59%, and 83.01%, respectively. Freezer temperature was 86.25%, 86.75%, 91.05%, 89.89%, and 90.57%. The overall analysis revealed a significant reduction in the stability score at room temperature (P value = 0.002 < 0.05), whereas conditions at the refrigerator (P value = 0.204 > 0.05) and freezer (P value = 0.380 > 0.05) were not significant. Figure 2 also shows a substantial decrease in the percentage stability score at room temperature (blue line). However, the percentage changes significantly at refrigerator and freezing conditions by the end of 60 days. Based on the three conditions, it can be concluded that a stability difference at room temperature has been observed.
The summary presents the average stability score of the TSH hormone in dry blood spots at various temperatures over time, as shown in Figure 3 above. On days 3rd, 7th, 30th, and 60th, the scores were 99.11%, 98.78%, 92.96%, 89.04%, and 91.35%, respectively, compared to the initial run 100%. At refrigerator temperature, the values were 109.11%, 100%, 93.24%, 94.20%, and 103.89%. At freezer temperature, they were 100% on day 0, then they changed to 94.87%, 93.05%, 92.94%, 95.07%, and 102.36% over time. The percentage change in DBS stability scores in all three conditions showed no significant difference (P > 0.05). It was found that there was a minor variation in the percentage stability of DBS of TSH under all three conditions, and statistical analysis indicated that the changes were not significant. Based on the three conditions, it is concluded that at room temperature, a slight difference in stability has been observed.
As a summary from Figure 4 above, it shows that the stability at room temperature was 100% on day 0, 99.53% on the 3rd day, 99.73% on the 7th day, 95.28% on the 14th day, 98.52% on the 30th day, and 94.67% on the 60th day. At refrigerator temperature, the values were changed from 100% to 102.58%, 103.20%, 100.76%, 103.78%, and 129.14%, and at freezer temperature, they were changed from 100% to 99.97%, 103.85%, 192.95%, 103.40%, and 105.17%. In all three conditions, there was no significant difference in the percentage change of the Leucine analyte in the stability score, as the P value was greater than 0.05. It was indicated that up to the 30th day of follow-up, there was no significant difference in the percentage change in the stability of Leucine amino acid in the DBS card. However, a sudden spike in the refrigerator temperature on the 60th day was statistically insignificant. Observing the three conditions, it is concluded that there is only a marginal difference in stability at room temperature.
In Figure 5, the estimated percentage change in stability from the initial point to the 60th day at room temperature shows reductions from 100% to 98.68%, 98.87%, 95.85%, 93.34%, and 88.04%. Meanwhile, the refrigerator temperature was 102.91%, 103.84%, 103.75%, 102.21%, and 100.59% compared to 100% in the initial run, while it was 101.33%, 104.05%, 105.87%, 103.08%, and 105.52% at freezing temperature. However, there is no significant P-value difference in the percentage change of the stability score observed at refrigerator and freezing temperatures (>0.05). At the same time, there is a highly significant difference at room temperature (0.001<0.05). It was found that there was a substantial decrease in the percentage stability score at room temperature after the 14th day of sample extraction. No change was observed under all conditions. Upon examining the three conditions, it was noted that a bordering stability difference was present at room temperature.
Phenylalanine stability was found to decrease significantly by 101.17%, 102.17%, 95.68%, 94.16%, and 94.68% from the initial point of 100% to the 60th day at room temperature, as shown in Figure 6 above. Meanwhile, the refrigerator temperature was 104.92%, 106.92%, 100.80%, 100.30%, and 100.51%, resulting in a significant difference from the initial run. At freezing temperature, the values were 102.29%, 106.79%, 101.62%, 99.90%, and 103.30%. However, there is no significant difference in the percentage change of the stability score observed at freezing temperature, as the P>0.05. After considering the three conditions, it can be concluded that a slight stability difference has been observed at room temperature.
Figure 7 shows a significant change in stability in room temperature from day 0 to the 60th day, with increases from 100% to 117.56%, 114.57%, 104.15%, 110.17%, and 119.17% (P < 0.05). Whereas, at the refrigerator temperature, the values were 121.67%, 116.85%, 108.80%, 111.60%, and 107.82%, and at freezing temperature, they were 114.59%, 115.41%, 111.70%, 115.21%, and 120.83%, compared to the initial point 100% and both found to have P > 0.05. However, there is no significant difference in the percentage change of the stability score observed at refrigerator and freezing temperatures. Figure 7 also shows a considerable fluctuation in the percentage change in stability at room temperature at every follow-up. Refrigerator and freezing conditions show little difference until day 30. Following 30 days of sample extraction, the data indicated a marked decrease in stability at refrigerator temperature (orange line) and an increase under freezer conditions (green line). A marginal difference in stability was observed at room and refrigerator temperatures.
The estimated percentage change in stability from the initial point at room temperature showed a highly significant variance from 100% to 112.75%, 106.26%, 106.07%, 98.66%, and 101.35% as shown in Figure 8. In the interim, the refrigerator temperature was 116.88%, 109.65%, 109.01%, 101.68%, and 85.61%, whereas at freezing temperature, it was 114.83%, 111.29%, 110.08%, 105.30%, and 109.67%. However, there is no significant difference in the percentage change of the stability score observed at refrigerator and freezing temperatures. It was found that the stability of C6 remains nearly unchanged until the 30th day under all conditions. However, after 30 days, it observes a sudden decrease in refrigerator temperature. A statistically significant difference is observed at room temperature, as indicated by a P value < 0.05. The stability remains almost unchanged across all three conditions.
Figure 9 demonstrates the estimated percentage change in C8 stability recorded as 109.74%, 108.44%, 101.67%, 104.11%, and 105.29%. However, the refrigerator temperature was 113.60%, 110.53%, 105.80%, 106.80%, and 90.63%. At freezing temperature, the values were 109.93%, 111.44%, 106.49%, 107.92%, and 110.21% compared to 100% in the initial run. In all three conditions, there is no significant difference in the percentage change of the stability score of the DBS. The percentage change of the stability score of C8 remained the same until the 30th day of follow-up. After 30 days, a slight decrease in stability at the refrigerator temperature was observed. However, statistically, there is no significant difference in all three conditions. Considering the three conditions, it was found that there was a slight difference in stability between room temperature and refrigerator temperature.
In Figure 10, the average percentage change in stability of C10 at room temperature was significantly different from 100% to 107.70%, 106.73%, 101.26%, 92.13%, and 95.06%. The percentage change in stability of C10 at the refrigerator temperature was 111.79%, 109.87%, 105.30%, 97.89 %, and 86.06%, resulting in a significant difference. At freezing temperature, the values were 107.92%, 109.47%, 107.75%, 102.37%, and 98.80%. However, no significant difference in the percentage change of the stability score was observed at freezing temperature. After 30 days of follow-up, the percentage change in the stability of the DBS significantly fluctuated at room and refrigerator temperatures. Considering the three conditions, the analysis concludes that the stability score is more consistent at freezing temperatures than the other two.
In Figure 11, the estimated percentage change in C14 stability at room temperature from the initial point to the 60th day showed significant differences: 100%, 106.38%, 107.78%, 99.72%, 97.89%, and 101.42%. The refrigerator temperature was 108.36%, 109.72%, 107.02%, 103.88%, and 98.82%. At freezing temperature, the values were 107.86%, 110.97%, 106.91%, 106.31%, and 108.11%. Although there is a variation on Figure 11, statistically, there is no significant difference in the percentage change of the stability score observed at refrigerator and freezing temperatures. The percentage change in stability at room temperature fluctuates significantly with P>0.05. The stability score is more consistent at freezing than at the other two conditions.
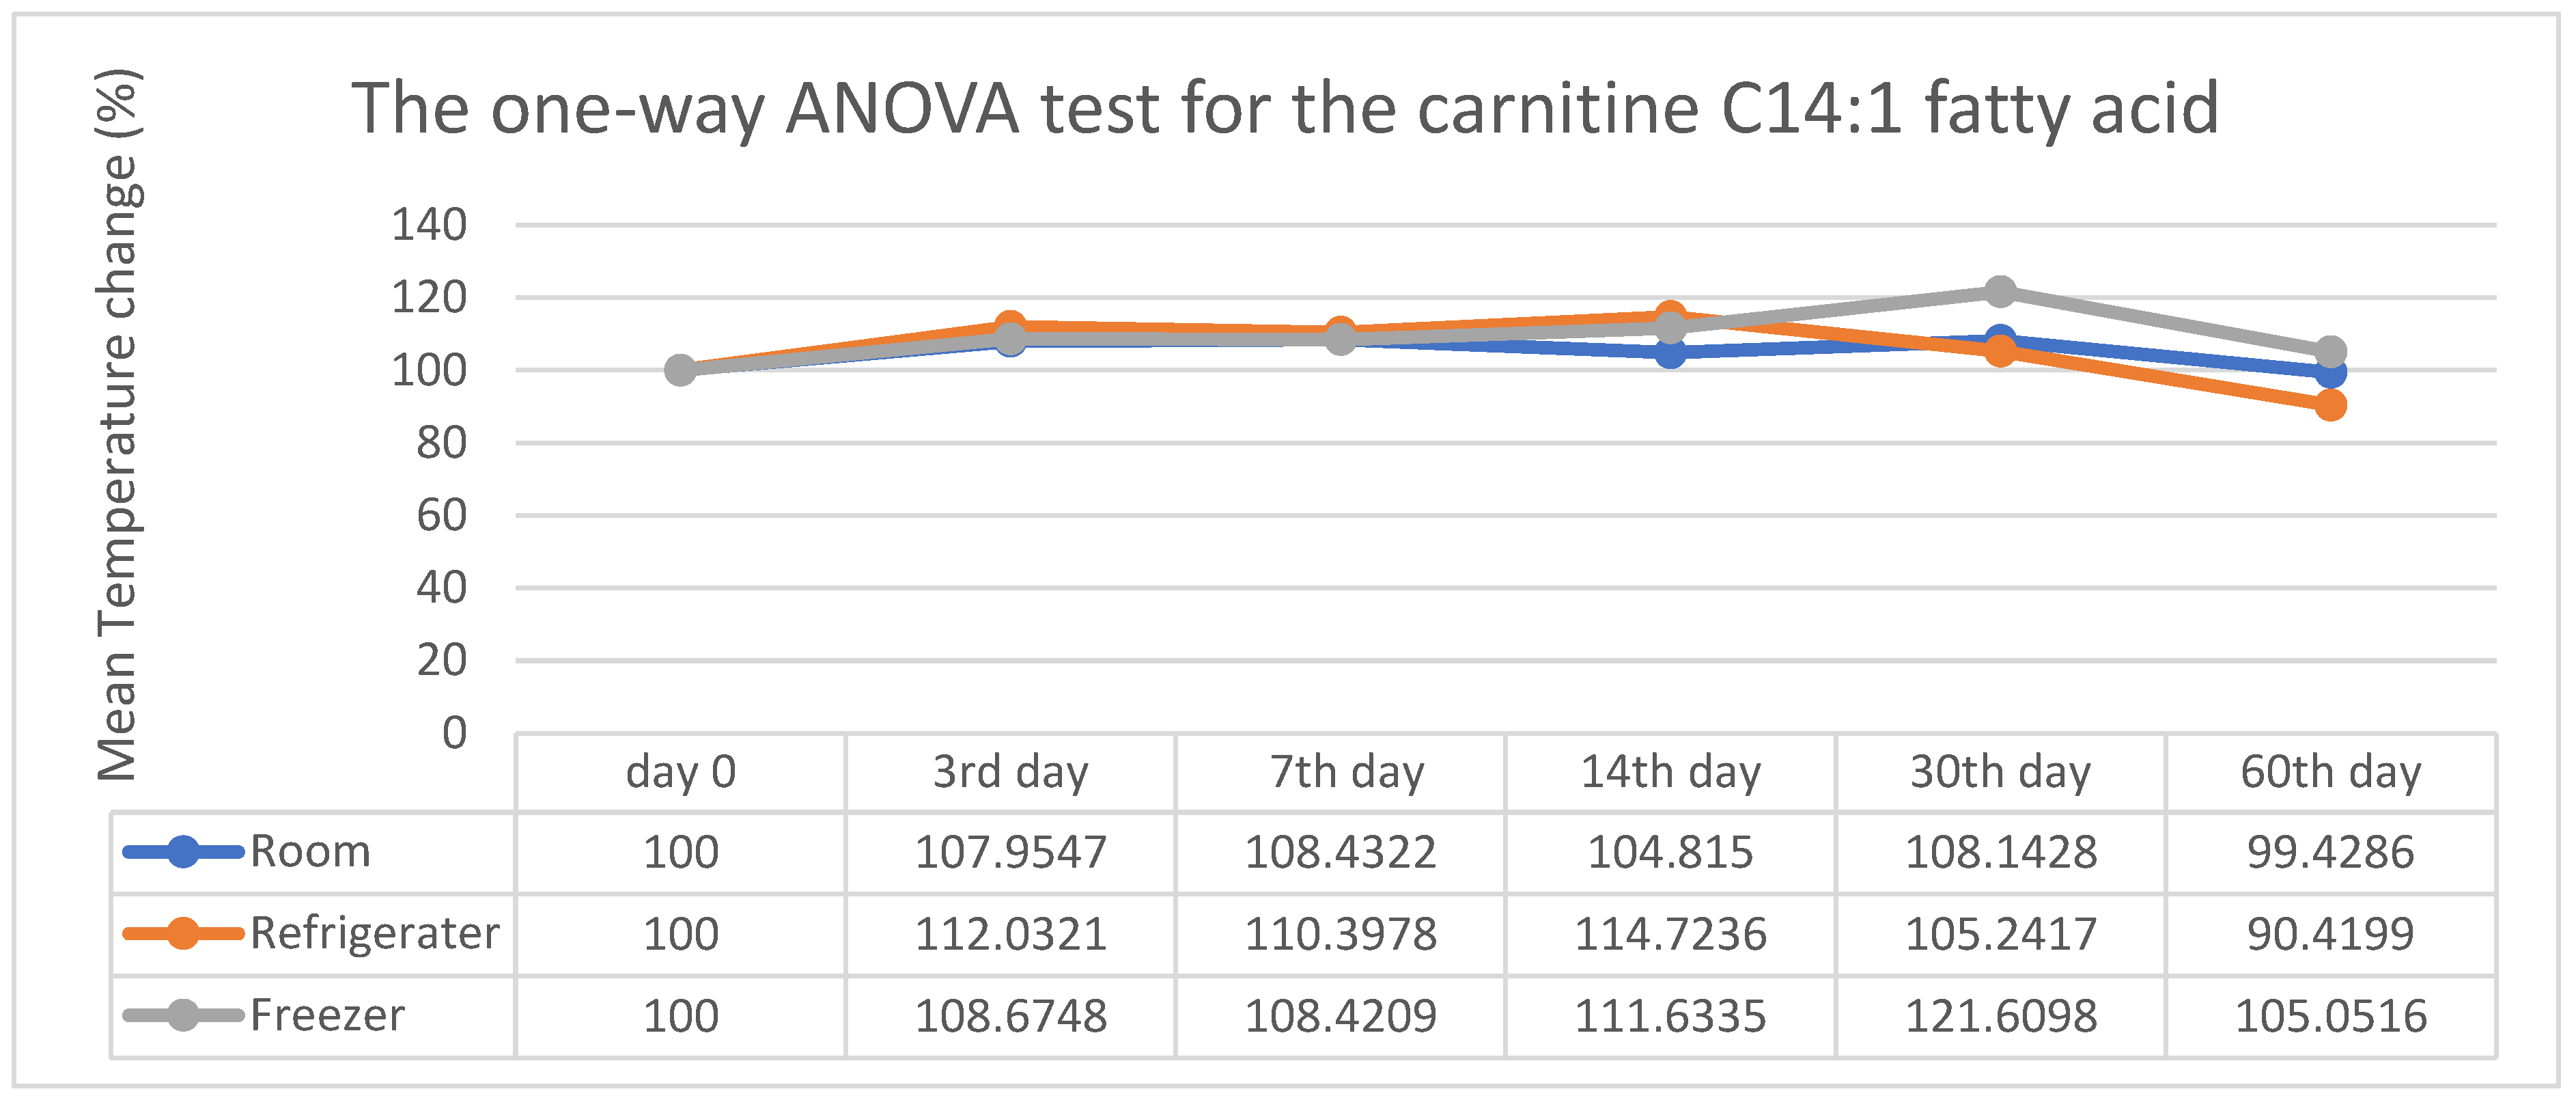
Figure 12 presents the estimated percentage change in stability of C14:1 from the initial point to the 60th day at room temperature, with observed values being 107.96%, 108.43%, 104.81%, 108.14%, and 99.42%. At the refrigerator temperature, the values were 112.03%, 110.39%, 114.72%, 105.24%, and 90.41%, whereas at freezing temperature, they were 108.67%, 108.42%, 111.63%, 121.60%, and 105.05%. However, in all three conditions, there is no significant difference in C14:1 in the percentage change of the stability score of the DBS. There was no statistically significant difference in the percentage change in stability at all three conditions. The stability score remains consistent across all three conditions, with P>0.05.
4. Discussion
Despite the newborn screening program testing different analytes that vary in their stability, not all stability conditions have been tested for a short time [7]. It was claimed that depending on the biological component, the storage duration differs, ranging from 1 week for proteins to over 1 year for amino acids stored at either -20 °C or -80 °C [11]. It is important to mention that no study regarding the stability of DBS has been published in Saudi Arabia yet. However, a study done in Bahrain showed that most of the amino acids and acylcarnitine lost their activity by 50% when exposed to high humidity >70% and high temperature > 37˚C for 8 days [7]. They found that Methionine was unstable when exposed to high temperature and humidity, whereas Leucine and Phenylalanine were the most stable among the amino acids under the same conditions [7]. It was found that phenylalanine can be stable for up to 90 days in refrigerator conditions and for 30 days at room temperature [11]. They concluded that transportation and storage of dried blood spots necessitate low humidity and low-temperature conditions [7].
In this study, the enzyme activity of GALT was significantly reduced under all conditions, with a significant level of P<0.05. These results highlight the importance of collecting blood samples and preparing DBS in a controlled, air-conditioned environment to lower false-positive results. A study revealed that the stability of enzyme activity in DBS cards can be influenced by the sample collection process, requiring the sample to dry completely at room temperature for at least 4 hours before being transported [13]. They found that the stability of enzyme activities decreased when the DBS sample dried above 24˚C and lost all activities when the DBS sample dried above 45˚C [13]. Therefore, they recommended drying the DBS sample at the ideal room temperature (20–24˚C) to maintain the enzyme activities and have an accurate result [13].
It is essential to maintain the samples’ stability during transport at a proper storage temperature until they arrive at the laboratory by adding a desiccant and a temperature monitor device to track the samples’ condition. A study in the United States tested the impact of low (<30%) and high (>50%) humidity at a specific temperature of 37˚C on the stability of 33 different analytes [14]. They found that when samples were stored for 30 days, the GALT analyte had no impact on humidity elevation [14]. After 30 days, 60% of the enzyme activity of GALT was lost under low humidity conditions, while 50% of their activity was lost when exposed to high humidity [14]. Interestingly, it was found that after 30 days of storing, TSH results in degradation when exposed to high humidity and three times more degradation when exposed to low humidity at 37˚C [14]. In contrast, another study found that phenylalanine is more stable as it lost only 6.9% of its activity at high humidity and 33.5% at low humidity conditions [15]. Minimizing humidity and temperature in the DBS transport and storage environment is crucial to maintaining sample integrity, particularly for longer transportation durations [14].
However, different enzymes in the NBS panel may have varying stabilities. This study found that the G6PD enzyme in DBS samples can be stored at room temperature with controlled humidity for up to 7 days. After that, enzyme activity declines significantly, with a P value of 0.002. It was also observed that G6PD samples can be stored at 4°C and −50°C for 60 days under controlled humidity, maintaining 90.57% and 85.96% of their initial activity, respectively. A 2017 study tested G6PD PT samples to examine the effects of humidity, time, and temperature on enzyme activity in DBS cards stored with and without desiccant. They found that when stored for 30 days at 4°C and -20°C with desiccant, enzyme activities were retained at over 90% and over 95%, respectively (Flores et al., 2017). Since enzyme activity decreases significantly after 30 days, samples should not be stored at room temperature and should be kept away from warm environments to prevent up to a 10% loss of enzyme activity (Flores et al., 2017). These results align with Freer’s observations that a 20% decrease in G6PD activity can be seen after 3 days at room temperature with low humidity (Freer, 2005). Therefore, storing specimens in high-temperature and high-humidity conditions increases the risk of false positives in G6PD enzyme screening results (Freer, 2005).
The stability of Thyroid hormone TSH samples is not affected by variations in temperature and humidity during storage over two months. However, when TSH samples were stored at room temperature for over two months, their value slightly decreased compared to those stored in refrigerators or freezers. Statistically, no significant variation was found as the P-value remained >0.05 for all conditions. Other researchers confirmed that TSH has no impact when stored at 4˚C, 25˚C, and -20˚C for up to 36 days [16]. Another paper claimed that the stability of the TSH hormone in a DBS card when stored at room temperature, refrigerator, and freezing conditions would remain stable in a DBS matrix for a minimum of 30 days, while when raising the temperature to 37˚C, samples become unstable [17]. Magalhaes et al. found that TSH in DBS samples would be stable for one month at room temperature and for two months in a refrigerator and freezing conditions; however, after one year of storage, TSH values would be significantly reduced [18]. Therefore, they recommended that the maximum storage condition for TSH is 60 days at -20˚C to avoid reducing TSH concentrations due to hormone instability [18].
Temperature, humidity, and time affect the stability of amino acids and acylcarnitine (De Jesús et al., 2015). In this study, it was found that leucine has no significant effect under all conditions. However, after 30 days of storage at room temperature, the Leu results began to increase, which is considered statistically insignificant. Additionally, a significant degradation in the stability of Methionine and a highly significant reduction in Phenylalanine amino acids were observed at room temperature over 2 months, with P-values of 0.001 and 0.002, respectively. Therefore, the drying process during the pre-analytical phase was suggested to be the main factor affecting amino acid stability on the DBS card during storage (Shimada et al., 2022).
At room temperature, the acylcarnitine C5 showed a significant decrease after 7 days and a highly significant increase after 14 days, with a P-value of 0.021. However, regarding refrigerator conditions, values decreased after 3 days but were not statistically significant, while they almost remained stable at -50˚C for 60 days with a P-value of 0.466. A study found that 20% of the initial activity of C5 would be lost when samples are stored at 37˚C with a high humidity level [14]. It was found that moisture can impact the quality of blood samples by changing extraction efficiency during the analysis of unstable analytes or speeding up their degradation [7]. These findings indicate that the degradation of acylcarnitine was significantly higher in high humidity compared to low humidity, regardless of storage temperature, contrary to the initial expectation [7].
The stability of C6, C8, and C10 was evaluated, with C10 exhibiting a slight degradation at room temperature. According to a study conducted in 2021, they claimed that acylcarnitine is stable for less than 14 days at room temperature [19]. Moreover, in this study, significant degradation in C6, C8, and C10 results was found after 30 days. days in refrigerator conditions. This is because acylcarnitine, when kept at 4˚C temperature for more than 30 days, breaks down into free carnitine and the corresponding fatty acids [20]. Because of these degradations, researchers recommended keeping acylcarnitine stored for the long term under -20˚C or -80˚C to maintain stability [21].
The C14:1 analyte was found to be stable for 60 days under all conditions, with a P-value >0.05. However, there is a significant decrease in C14 results at room temperature, with a P-value of 0.002. Although there is a slight change in the percentage of C14 at 4˚C and -50˚C after 7 days of storage, statistically, their stability has no significant impact. This is because acylcarnitine stability rises with longer carbon chain lengths. Most losses in unsaturated, hydroxylated, and dicarboxylic acylcarnitine were due to high humidity during DBS storage [14].
The limitation of this study is that some samples (GALT & G6PD) are excluded from the results because their results fall below the instrument’s detection limit. Extending the experiment beyond 60 days is recommended to assess the effects of sample stability degradation that may occur after this period. In this study, all samples were stored under controlled humidity and temperature; for future research, testing the impact of high or low humidity at a fixed temperature would be beneficial. It is advisable to follow proper sample collection and drying procedures to maintain analyte stability and ensure proper sample packaging with desiccants while monitoring temperature and humidity. Additionally, shipping samples to the laboratory within 72 hours after collection is recommended to prevent enzyme degradation. Using a temperature monitoring device, desiccants, and dry ice is strongly suggested to maintain optimal conditions. According to the Newborn Screening Quality Assurance Program (NSQAP), the NBS QC materials from the CDC should be stored at -20˚C for long-term preservation. Therefore, to enhance the post-analytical phase, it is recommended to store DBS samples in a deep freezer for long-term storage.
5. Conclusions
In conclusion, the time, humidity, and temperature during sample collection can compromise the quality of dried blood spots, emphasizing the need for proper packaging with desiccant and immediate transfer to the newborn screening laboratory. To maintain the quality of the post-analytical phase in the NBS laboratory, samples can be stored under freezing conditions, at -50˚C, to ensure stability for most analytes in the NBS panel for a long time.
6. Patents
This section is not mandatory but may be added if there are patents resulting from the work reported in this manuscript.
Author Contributions
The study is original research paper was conducted by Bashayr Alobaidan (Main corresponded author), and supervised and supported by the following Committee in charge of this study: Shoukat Ali (main academic supervisor), Huda Badr (co-supervisor, monitor and edit the NBS information as newborn screening head), Kamel Aldossary (supervisor & editor): edit the content as quality control side) Abdulwahab Binjomah (supervisor& editor): edit the content as quality control side), Arwa Nusair (data-analyst. **All authors have read and agreed to the published version of the manuscript.
Funding
This research received no external funding.
Institutional Review Board Statement
This experiment does not intervene with patients, so no human harm exists. The patient’s biodata is not required (all specimens are used for research purposes), so no patient consent is needed, and laboratory center data confidentiality was obtained from the Institutional Review Board (Public Health Authority Saudi Arabia, IRB NO: PHA-IRB-A077-2024).
Informed Consent Statement
Not applicable, as it is not required as it did not involve humans.
Data Availability Statement
all data supporting and available in the Saudi Public Health Authority and is unavailable due to institutional privacy.
Acknowledgments
I want to express my sincere gratitude to the following individuals and organizations for their invaluable support during my master’s thesis. First and foremost, I am incredibly grateful to my thesis advisor, Dr. Kamel Aldossary, for his invaluable support throughout my research. I’m also extremely thankful to my co-supervisor, Dr. Shoukat Ali, for his insightful suggestions and encouragement over the years. His critical questions and comments pushed me to sharpen my thinking and brought greater depth to this work. I express my deepest gratitude to my supervisor, Ms Huda Badr, the Head of the Newborn Screening Laboratory, for her unwavering support, guidance, and mentorship throughout this project. Her valuable feedback, expertise, and encouragement have been instrumental in shaping the success of this work. I am grateful to the Public Health Authority for allowing me to conduct my research and generously providing resources and support. I especially want to thank Dr. Abdulwahab Binjomah, whose expertise and encouragement have been invaluable in completing this project. Thanks also to all PHA staff, whose exceptional support significantly contributed to this work. In addition, I wish to acknowledge the generous support from the Prince Naif bin Abdulaziz Health Research Center (PNHRC) for the statistical analysis of this thesis. They offered me the opportunity to conduct my research and generously provided resources and support. My appreciation extends to Dr Abdurahman Niazi for serving on my thesis committee. He provided invaluable feedback and guidance that significantly shaped this work, and I sincerely appreciate his willingness to share his knowledge and experiences. Lastly, I am profoundly grateful to all the participants in my study, whose time and willingness to share their experiences were indispensable. Thank you for your invaluable contribution.
References
- Afifi, A.M.; A Abdul-Jabbar, M. Saudi newborn screening. A national public health program: needs, costs, and challenges. 2007, 28, 1167–70.
- Mohamed, S.; Elsheikh, W.; Al-Aqeel, A.I.; Alhashem, A.M.; Alodaib, A.; Alahaideb, L.; Almashary, M.; Alharbi, F.; AlMalawi, H.; Ammari, A.; et al. Incidence of newborn screening disorders among 56632 infants in Central Saudi Arabia. Saudi Med J. 2020, 41, 703–708, . [CrossRef]
- Chace, D.H.; De Jesús, V.R.; Spitzer, A.R. Clinical Chemistry and Dried Blood Spots: Increasing Laboratory Utilization by Improved Understanding of Quantitative Challenges. Bioanalysis 2014, 6, 2791–2794, . [CrossRef]
- Li W, Lee MS, editors. Dried Blood Spots: Applications and Techniques [Internet]. 1st ed. Wiley; 2014 [cited 2024 Dec 24]. Available from: https://onlinelibrary.wiley.com/doi/book/10.1002/9781118890837.
- Zakaria, R.; Allen, K.J.; Koplin, J.J.; Roche, P.; Greaves, R.F. Advantages and Challenges of Dried Blood Spot Analysis by Mass Spectrometry Across the Total Testing Process. 2016, 27, 288–317.
- Sontag, M.K.; Miller, J.I.; McKasson, S.; Sheller, R.; Edelman, S.; Yusuf, C.; Singh, S.; Sarkar, D.; Bocchini, J.; Scott, J.; et al. Newborn screening timeliness quality improvement initiative: Impact of national recommendations and data repository. PLOS ONE 2020, 15, e0231050, . [CrossRef]
- Golbahar, J.; Altayab, D.; Carreon, E. Short-Term Stability of Amino acids and Acylcarnitines in the Dried Blood Spots Used to Screen Newborns for Metabolic Disorders. J. Med Screen. 2014, 21, 5–9, . [CrossRef]
- World Health Organization. Laboratory quality management system : handbook. Système de gestion de la qualité au laboratoire : manuel. Version 1.1. 2011;247.
- Klak, A.; Pauwels, S.; Vermeersch, P. Preanalytical considerations in therapeutic drug monitoring of immunosuppressants with dried blood spots. Diagnosis 2018, 6, 57–68, . [CrossRef]
- Massingale SP, Williams AM, Rollin DM. Newborn Screening Collection Guidelines [Internet]. ALABAMA DEPARTMENT OF PUBLIC HEALTH BUREAU OF CLINICAL LABORATORIES; 2019. 16 p. Available from: https://www.alabamapublichealth.gov/newbornscreening/assets/newbornscreeningbloodcollectionguidelines.pdf.
- Lehmann S, Delaby C, Vialaret J, Ducos J, Hirtz C. Current and future use of “dried blood spot” analyses in clinical chemistry. Clin Chem Lab Med. 2013 Oct;51(10):1897–909.
- Grüner N, Stambouli O, Ross RS. Dried Blood Spots - Preparing and Processing for Use in Immunoassays and in Molecular Techniques. JoVE. 2015 Mar 13;(97):52619.
- Supriya, M.; De, T.; Christopher, R. Effect of temperature on lysosomal enzyme activity during preparation and storage of dried blood spots. J. Clin. Lab. Anal. 2017, 32, . [CrossRef]
- Adam, B.; Hall, E.; Sternberg, M.; Lim, T.; Flores, S.; O'BRien, S.; Simms, D.; Li, L.; De Jesus, V.; Hannon, W. The stability of markers in dried-blood spots for recommended newborn screening disorders in the United States. Clin. Biochem. 2011, 44, 1445–1450, . [CrossRef]
- Borrajo GJC, Doña VV. How Long are Residual Newborn Screening Specimens Useful for Retesting when Stored in Suboptimal and Uncontrolled Conditions of Temperature and Humidity? J inborn errors metab screen. 2021;9:e20210010.
- Waite, K.V.; Maberly, G.F.; Eastman, C.J. Storage conditions and stability of thyrotropin and thyroid hormones on filter paper.. Clin. Chem. 1987, 33, 853–855, . [CrossRef]
- Coombes, E.J.; Gamlen, T.R.; Batstone, G.F. Effect of Temperature on the Stability of Thyroid Stimulating Hormone in Dried Blood Spots. Ann. Clin. Biochem. Int. J. Biochem. Lab. Med. 1983, 20, 252–253, . [CrossRef]
- Magalhães, P.K.R.; Miranda, C.H.; Vilar, F.C.; Schmidt, A.; Bittar, R.R.; Paixão, G.A.C.d.C.; Martinez, E.Z.; Maciel, L.M.Z. Effects of drying and storage conditions on the stability of TSH in blood spots. Arq. Bras. de Endocrinol. Metabol. 2018, 62, 201–204, . [CrossRef]
- Miller, M.J.; Cusmano-Ozog, K.; Oglesbee, D.; Young, S. Laboratory analysis of acylcarnitines, 2020 update: a technical standard of the American College of Medical Genetics and Genomics (ACMG). Anesthesia Analg. 2020, 23, 249–258, . [CrossRef]
- Fingerhut R, Ensenauer R, Röschinger W, Arnecke R, Olgemöller B, Roscher AA. Stability of acylcarnitines and free carnitine in dried blood samples: implications for retrospective diagnosis of inborn errors of metabolism and neonatal screening for carnitine transporter deficiency. Anal Chem. 2009 May 1;81(9):3571–5.
- van Rijt WJ, Schielen PCJI, Özer Y, Bijsterveld K, van der Sluijs FH, Derks TGJ, et al. Instability of Acylcarnitines in Stored Dried Blood Spots: The Impact on Retrospective Analysis of Biomarkers for Inborn Errors of Metabolism. Int J Neonatal Screen. 2020 Nov 2;6(4):83.
Figure 1.
Mean temperature change and One-Way ANOVA results for the GALT enzyme.
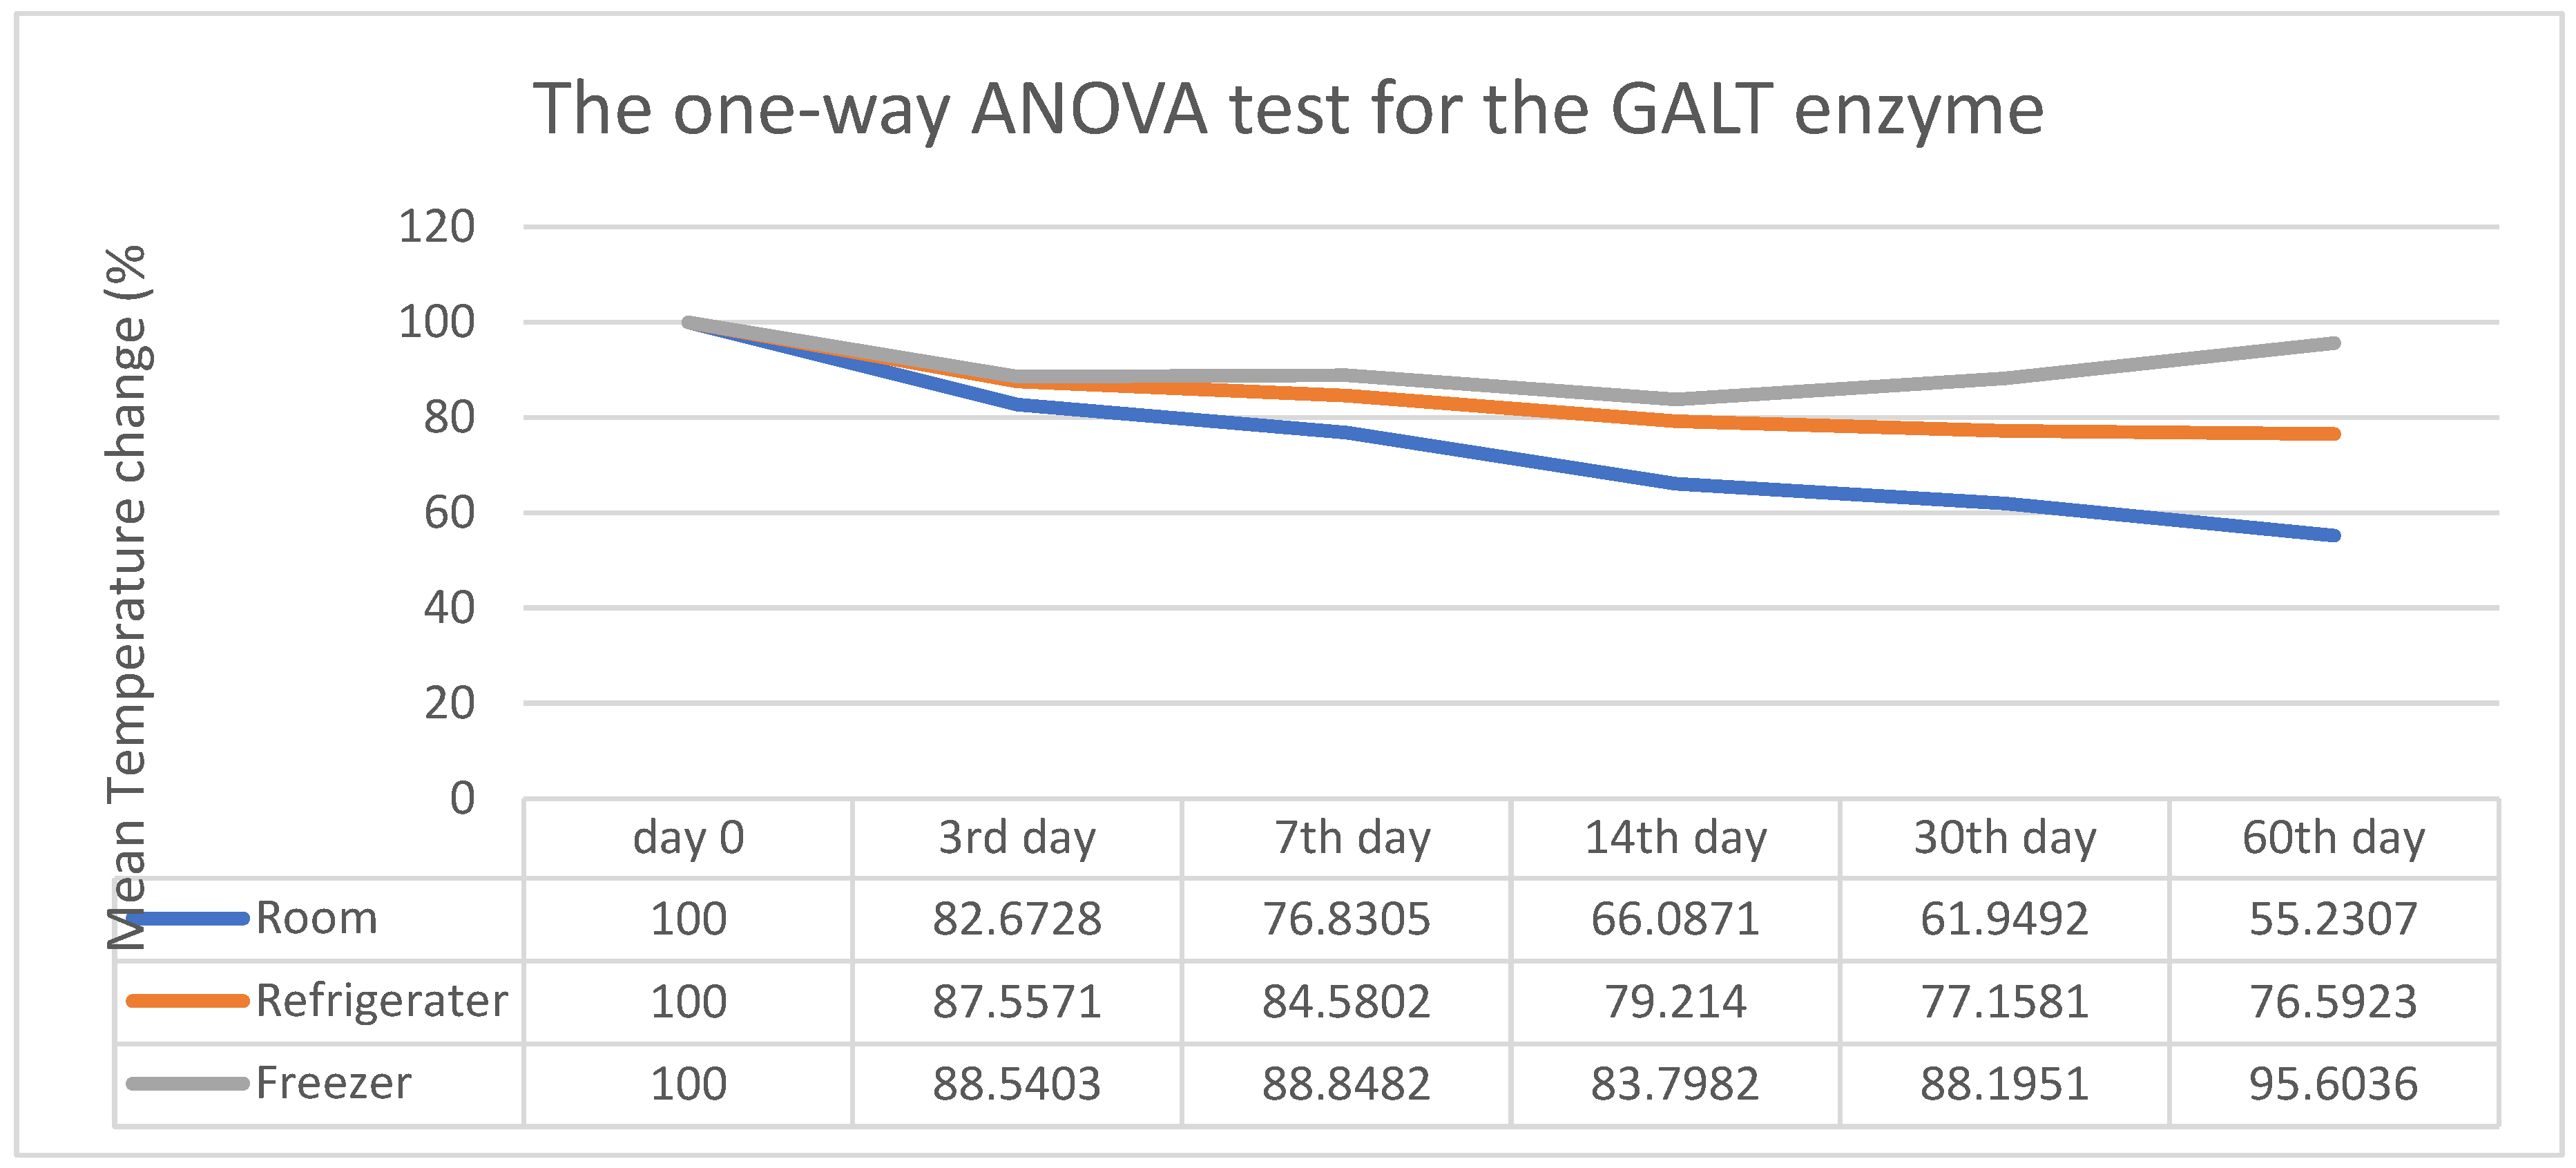
Figure 2.
Overview of mean temperature change and One-Way ANOVA results for the G6PD enzyme.
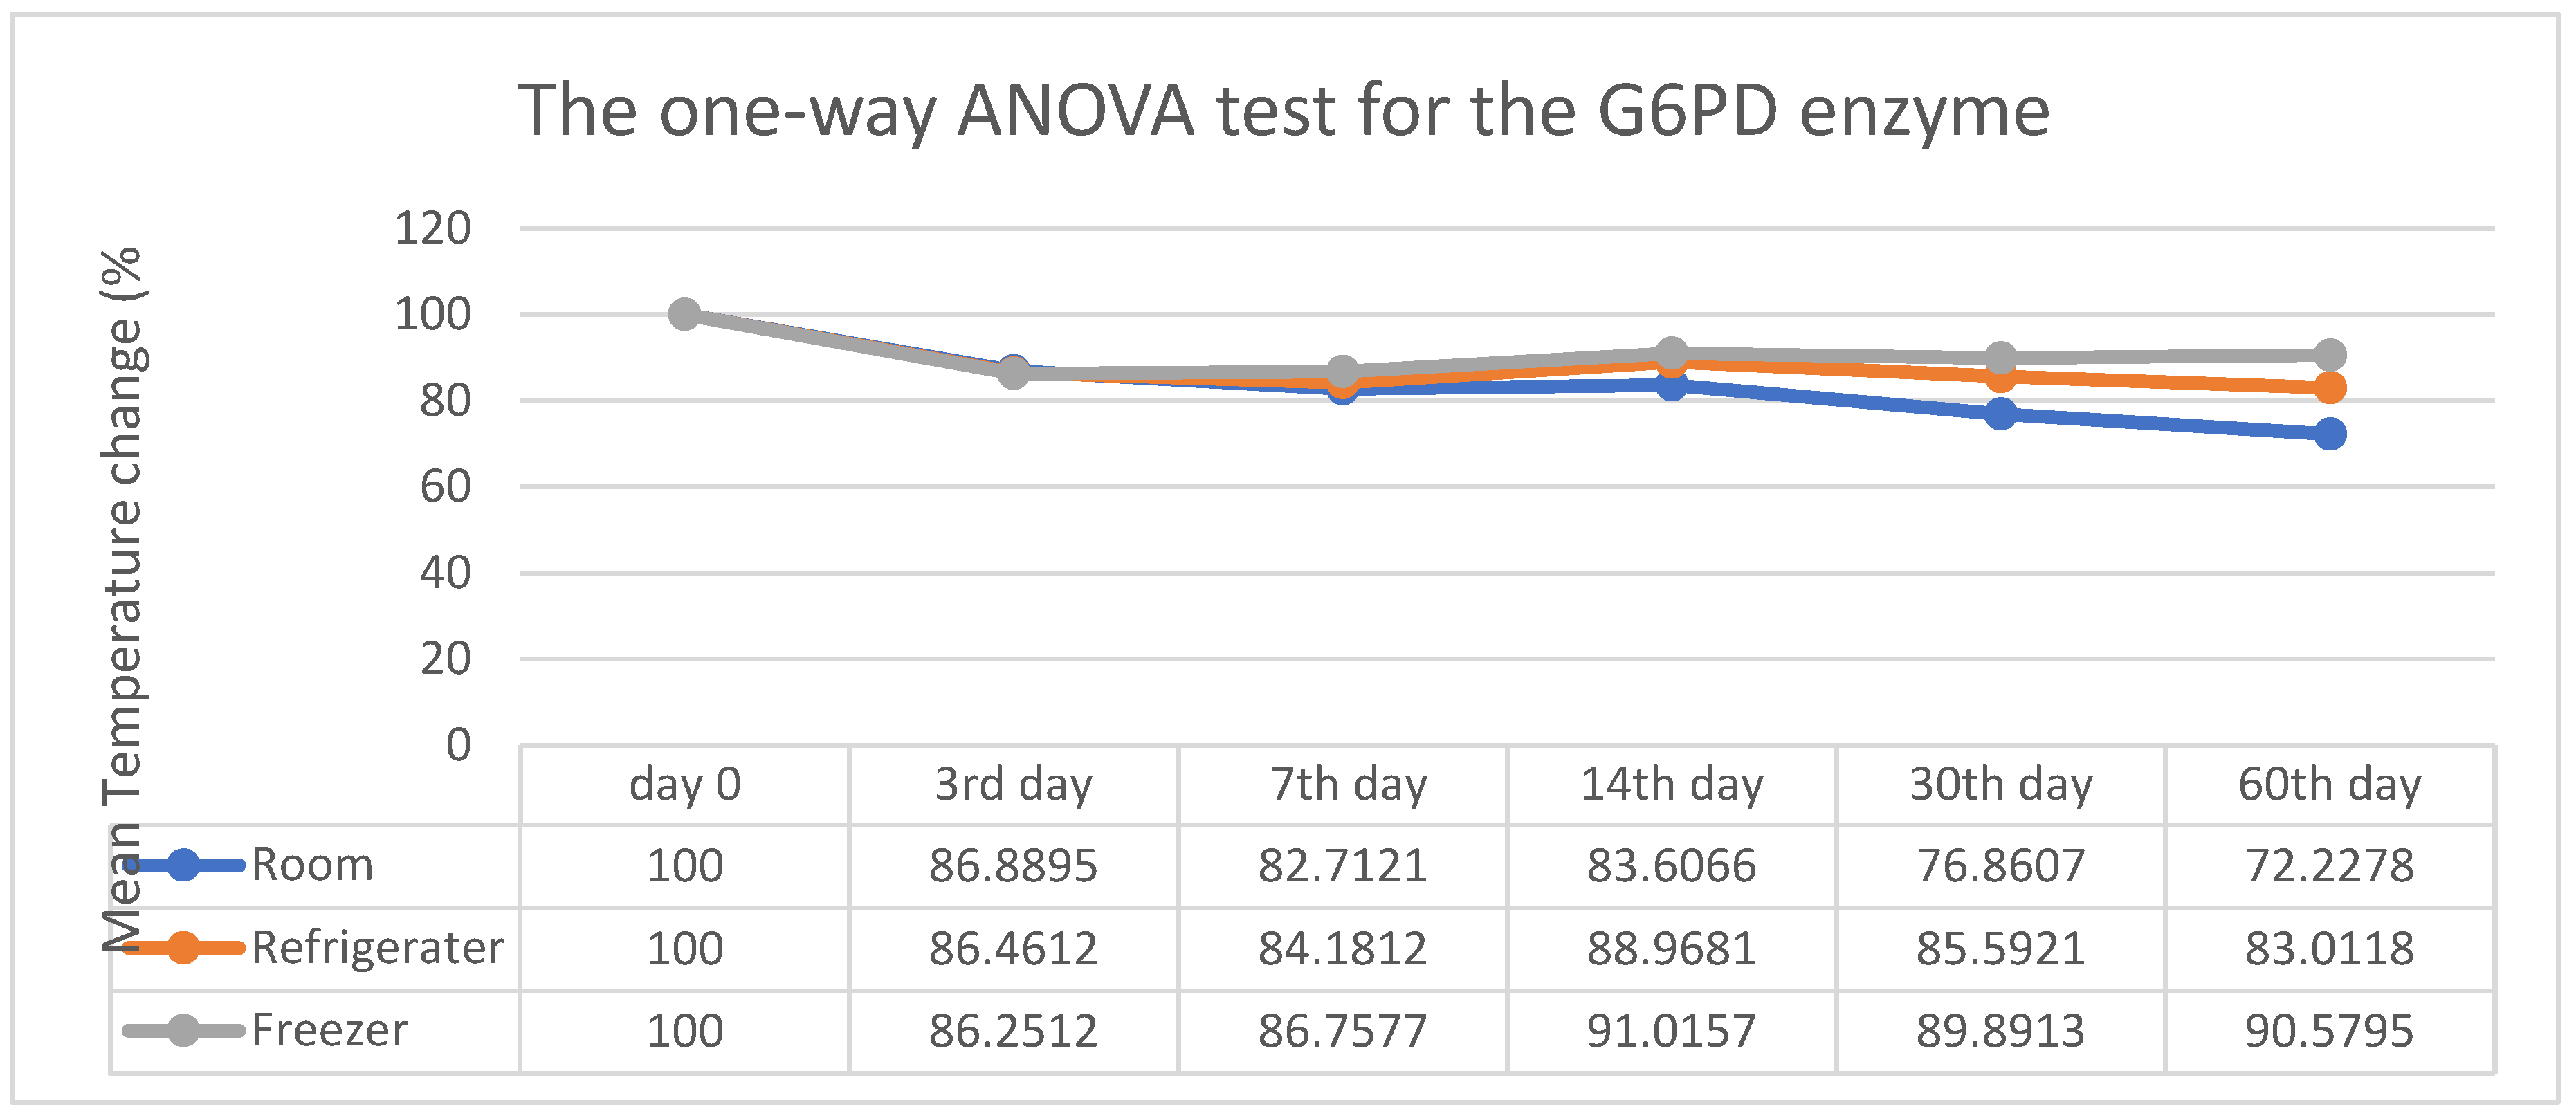
Figure 3.
Overview of the mean temperature change and results from the One-Way ANOVA conducted for TSH hormone analysis.
Figure 3.
Overview of the mean temperature change and results from the One-Way ANOVA conducted for TSH hormone analysis.
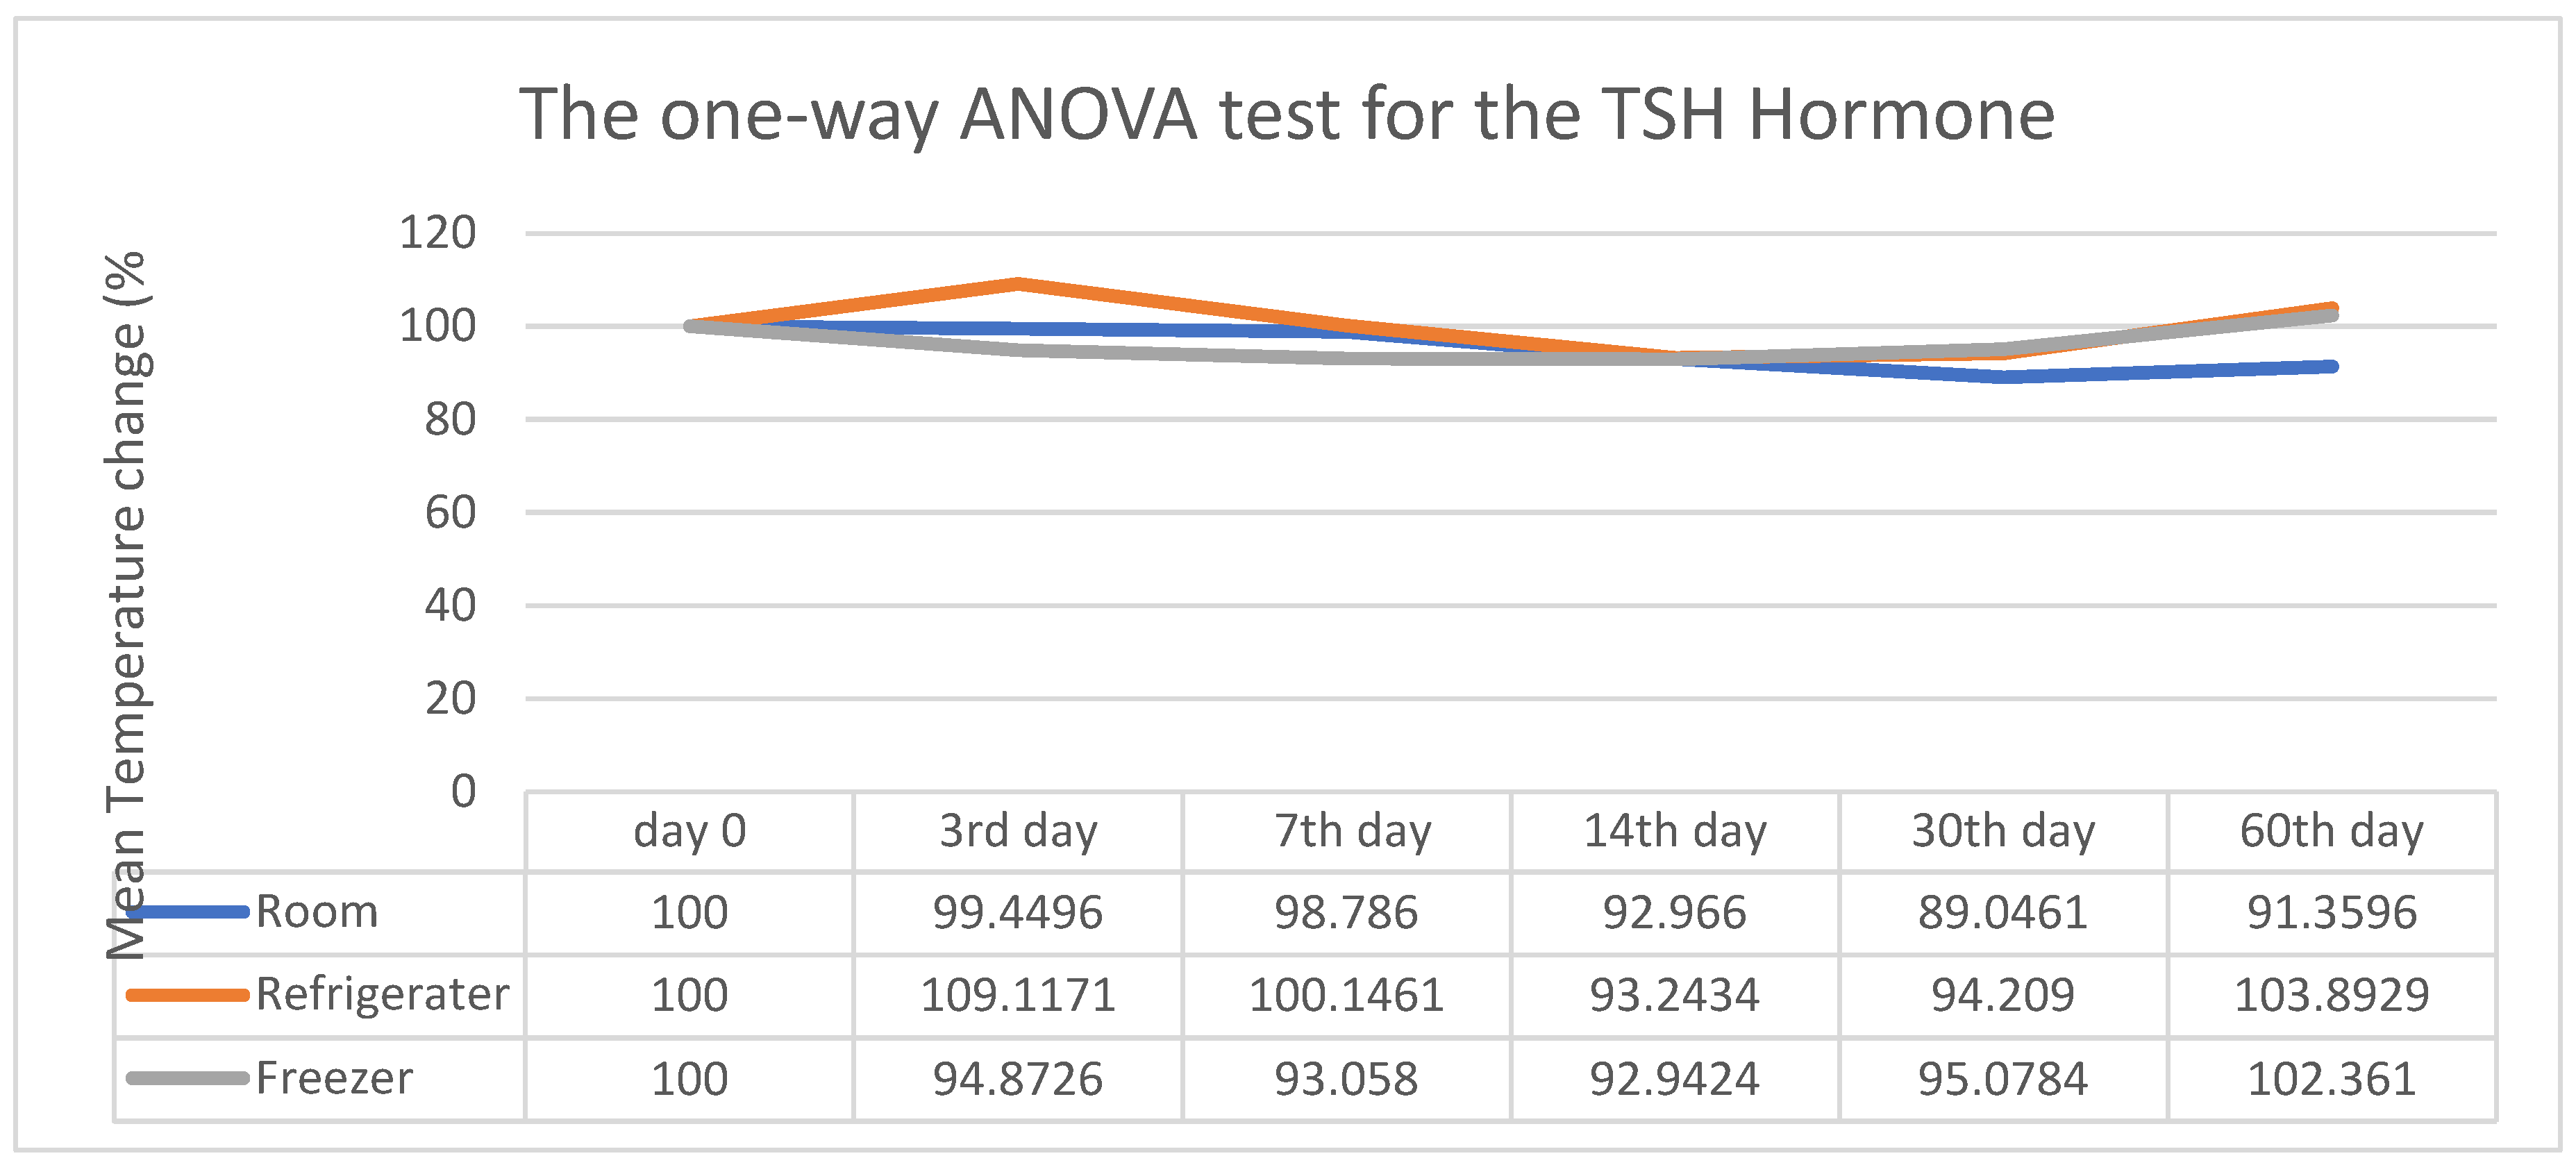
Figure 4.
Overview of the mean temperature variation and results from the One-Way ANOVA analysis for the amino acid Leucine.
Figure 4.
Overview of the mean temperature variation and results from the One-Way ANOVA analysis for the amino acid Leucine.
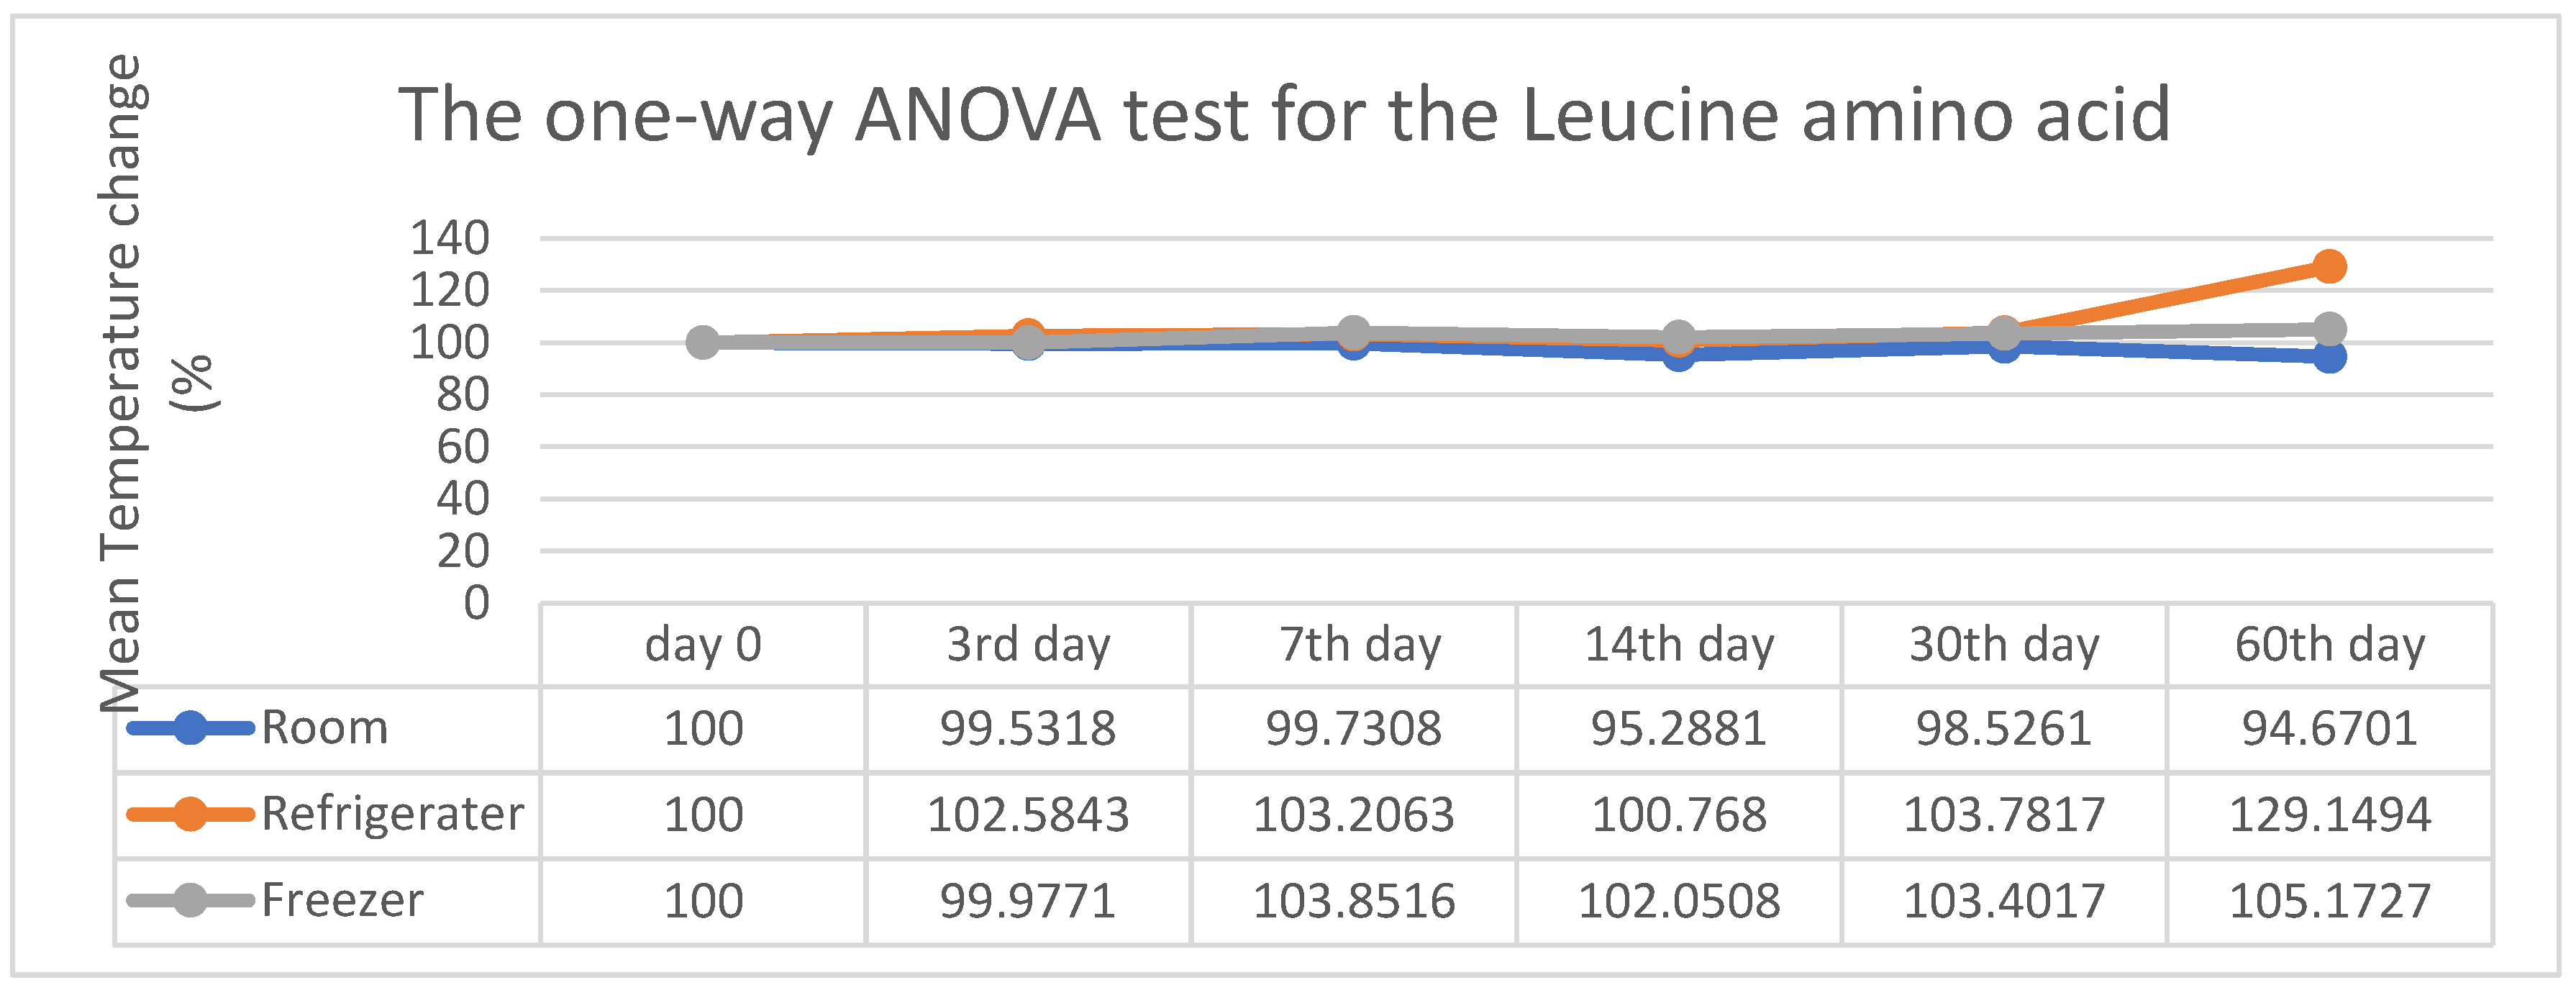
Figure 5.
Overview of the average mean temperature change and results of the One-Way ANOVA test for Methionine amino acid.
Figure 5.
Overview of the average mean temperature change and results of the One-Way ANOVA test for Methionine amino acid.
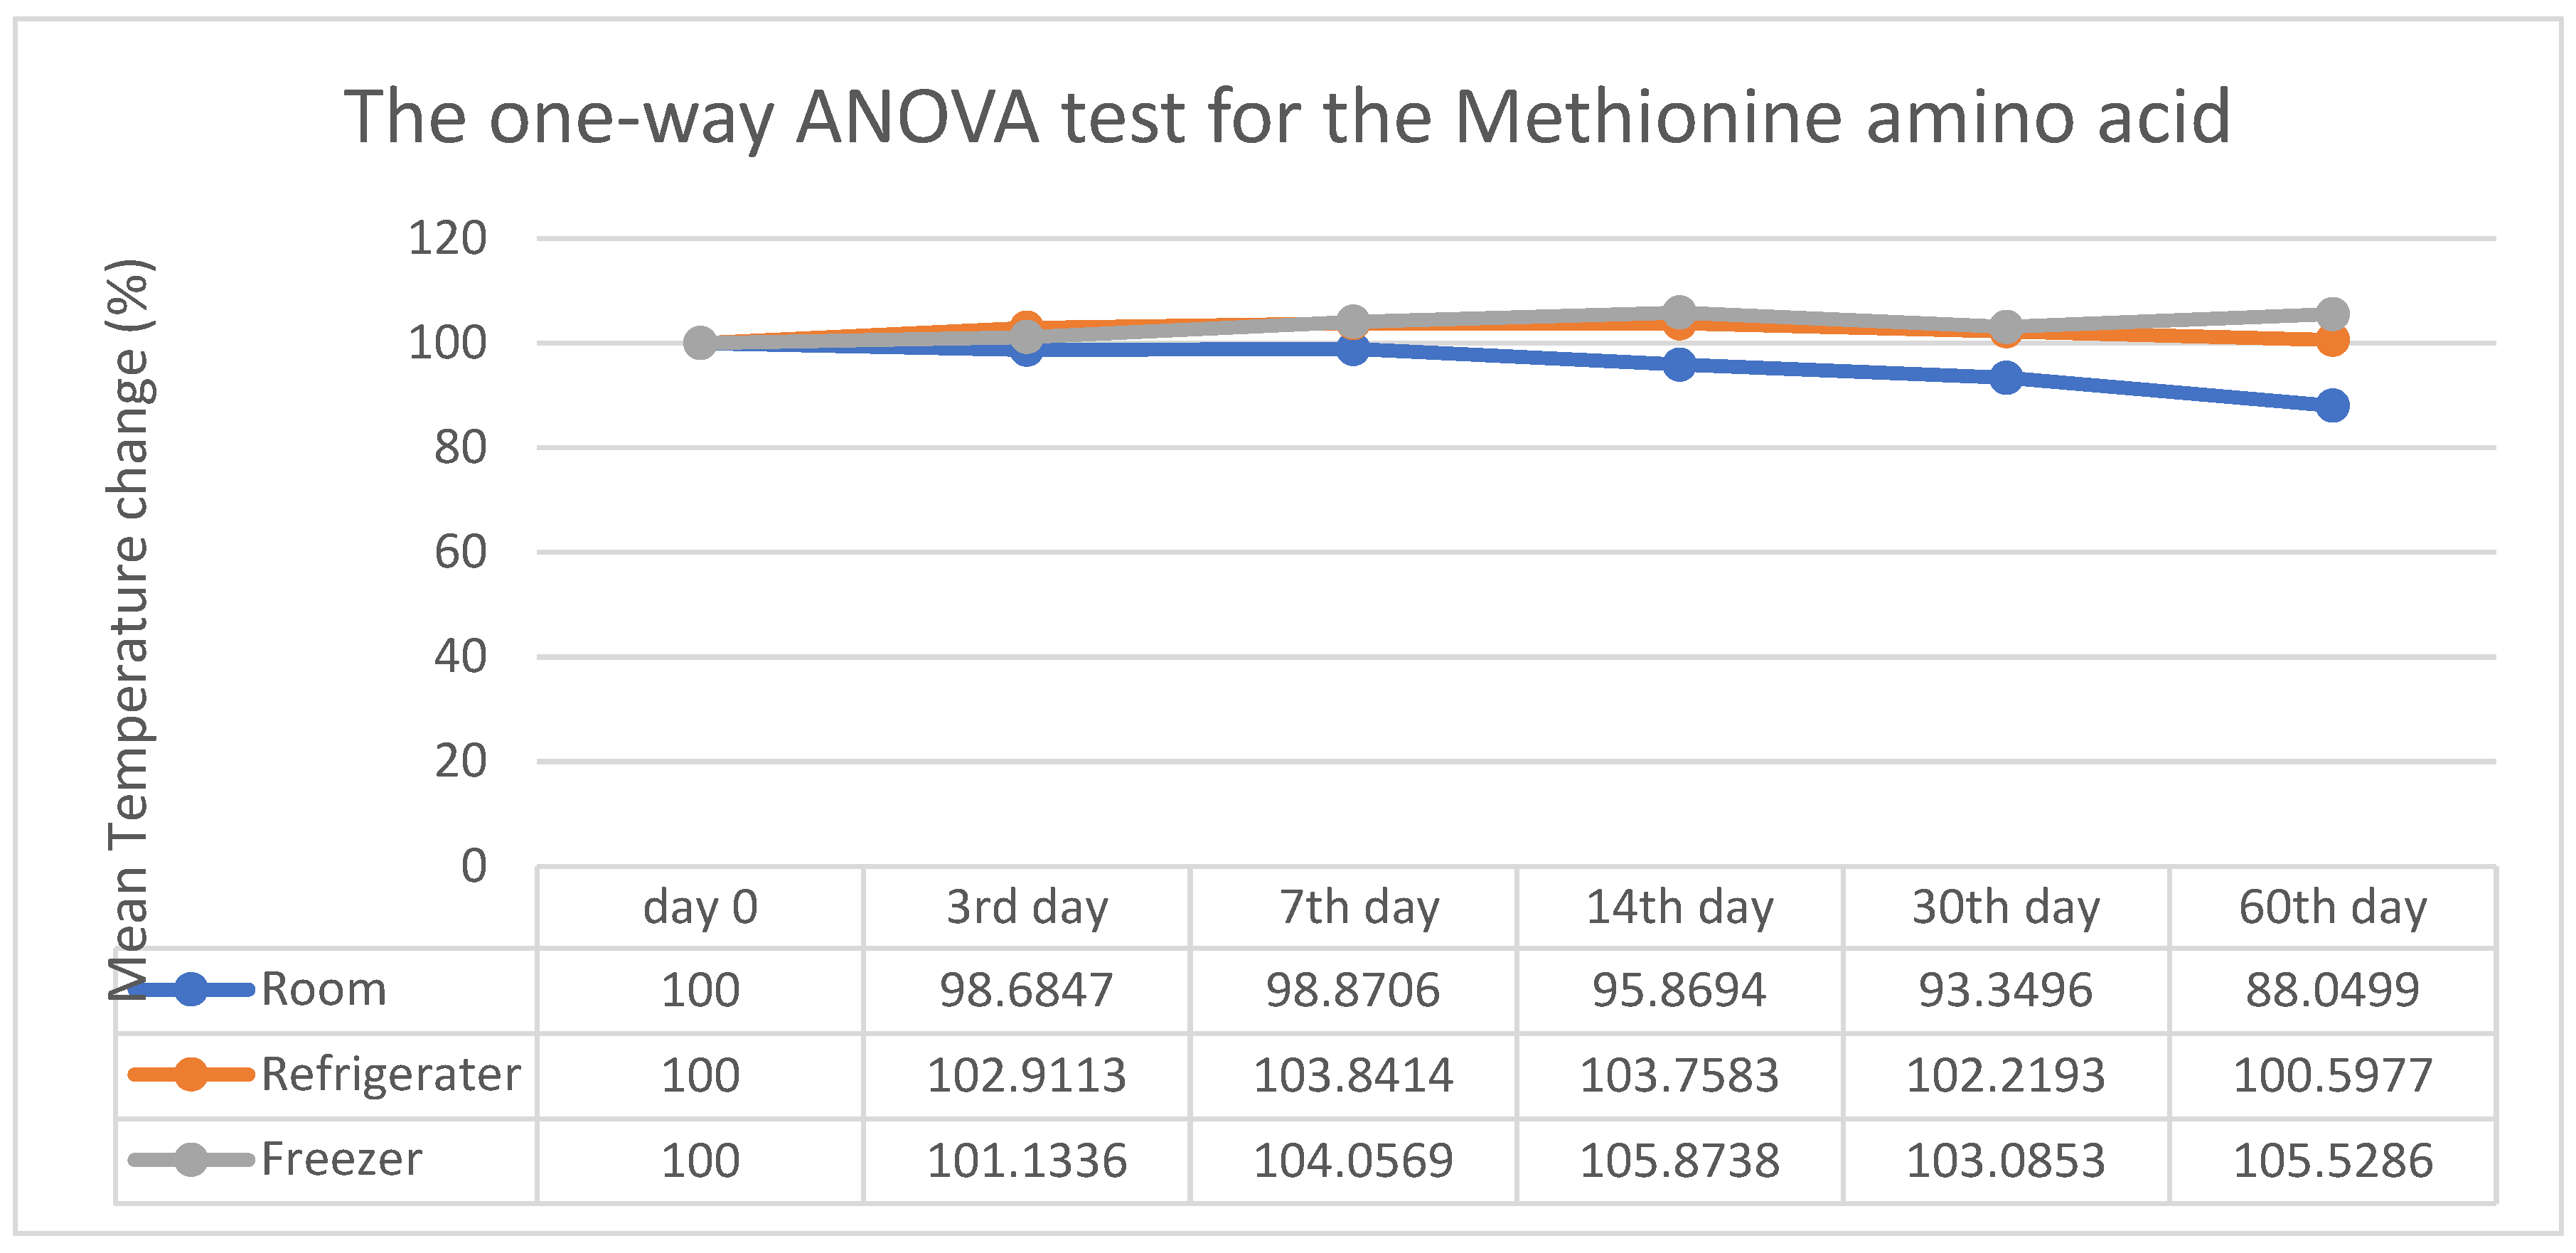
Figure 6.
Summary of the average mean temperature change and the One-Way ANOVA test for the Phenylalanine amino acid.
Figure 6.
Summary of the average mean temperature change and the One-Way ANOVA test for the Phenylalanine amino acid.
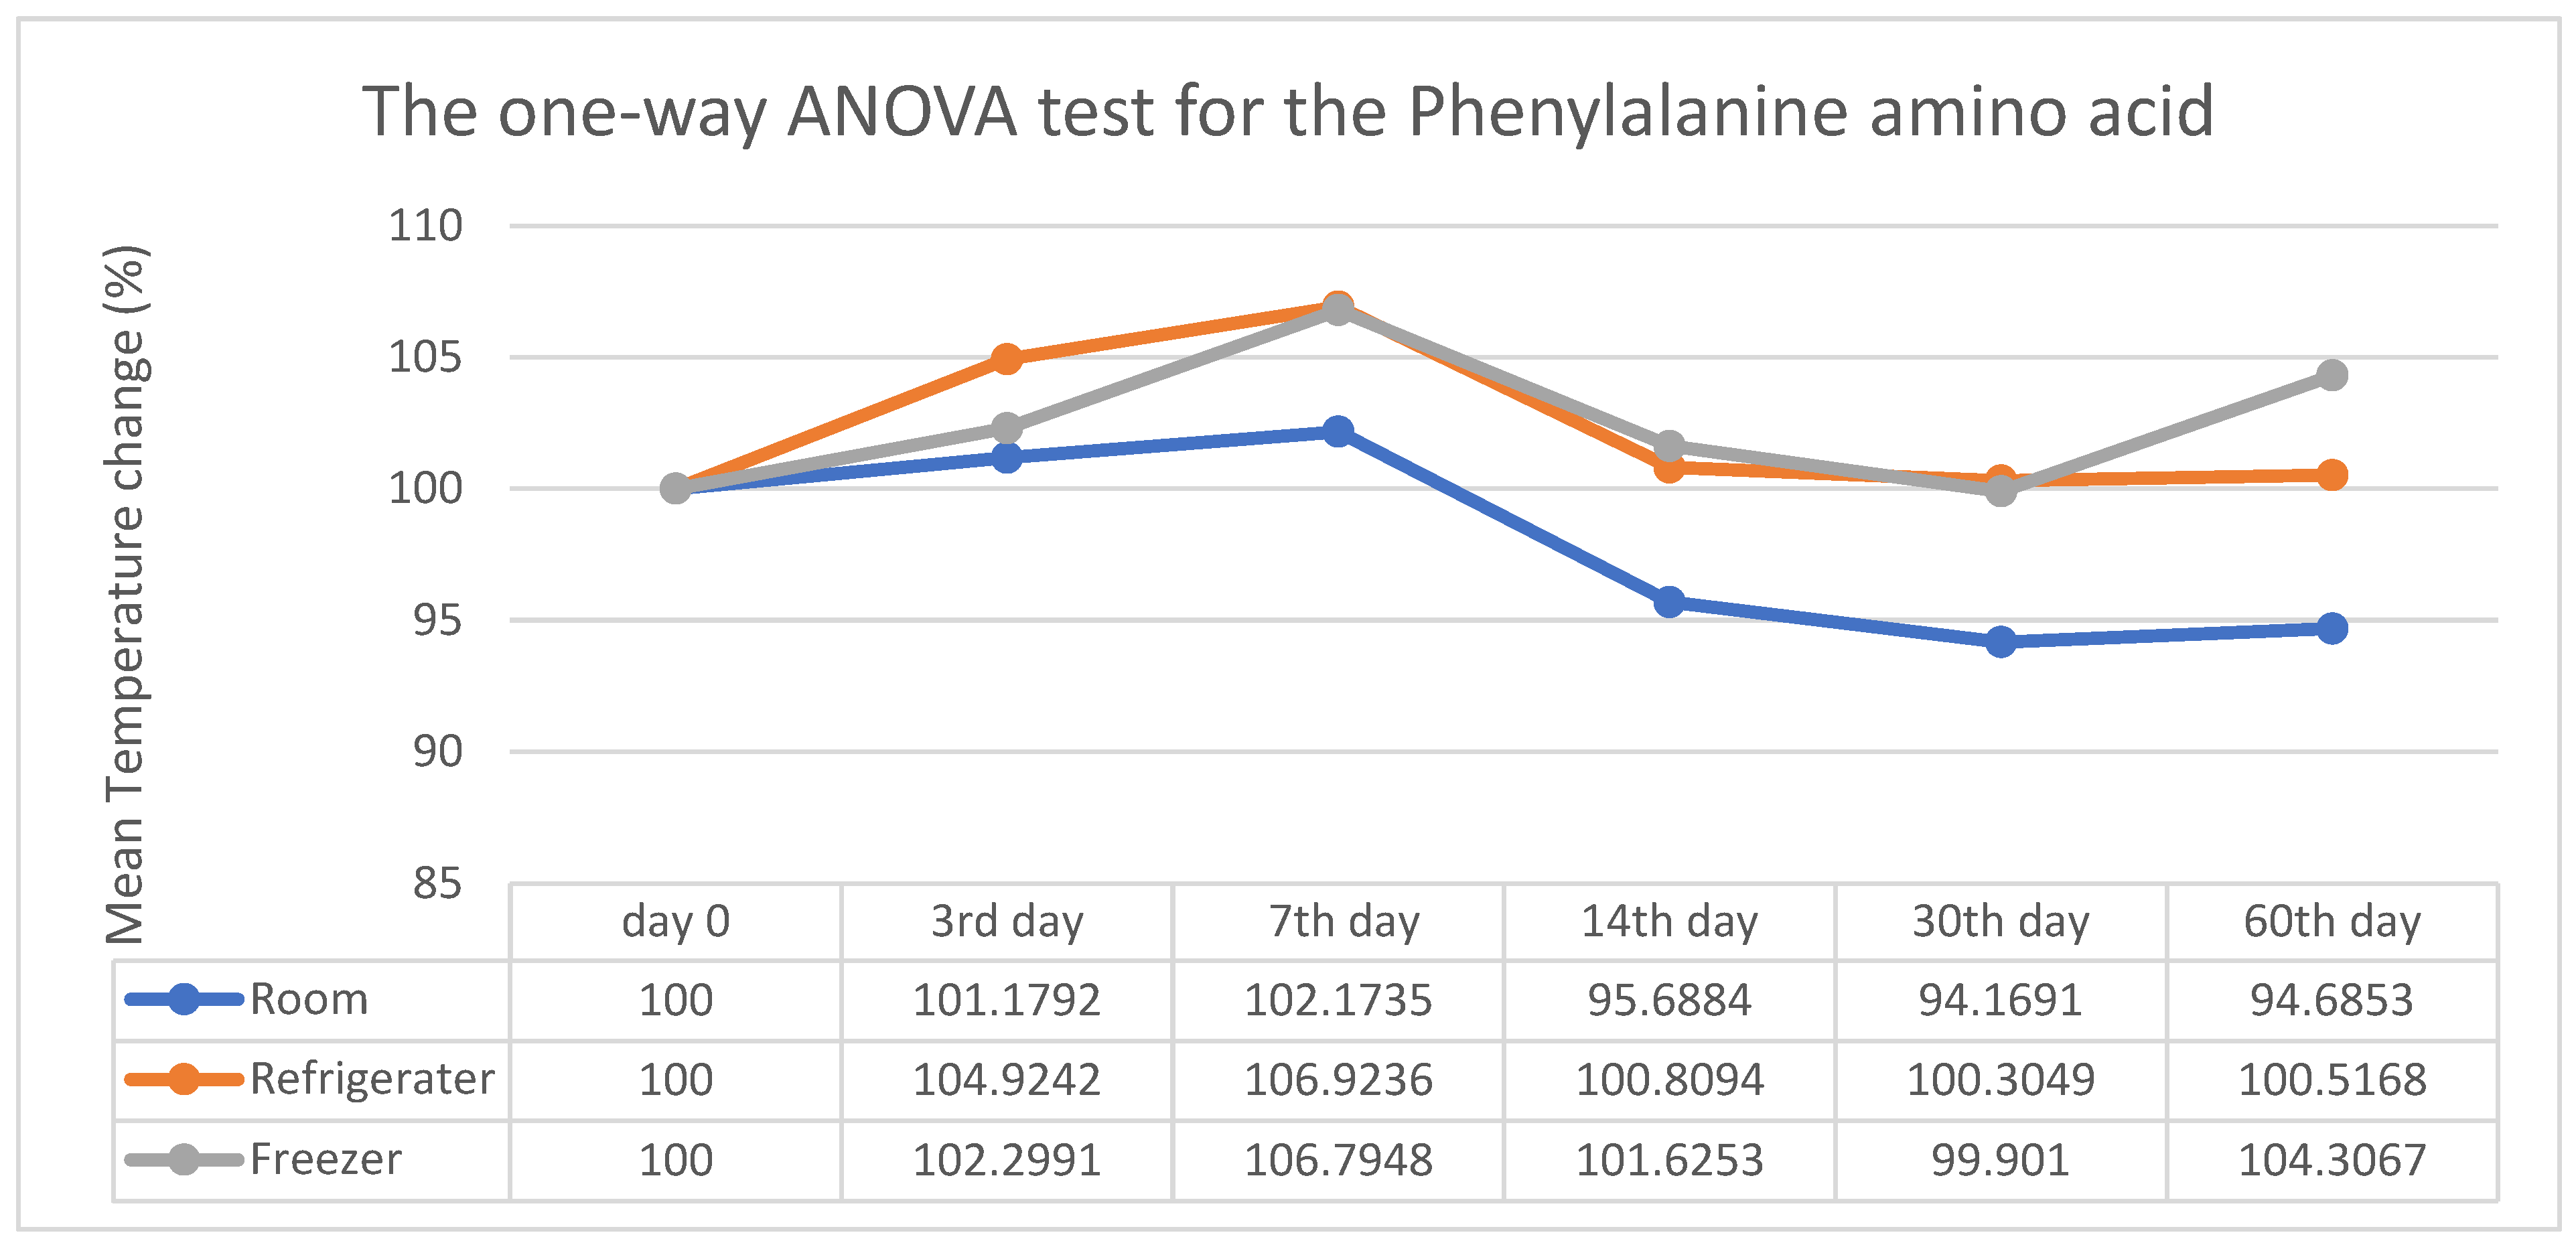
Figure 7.
Average mean temperature change and One-Way ANOVA results for carnitine C5 organic acid.
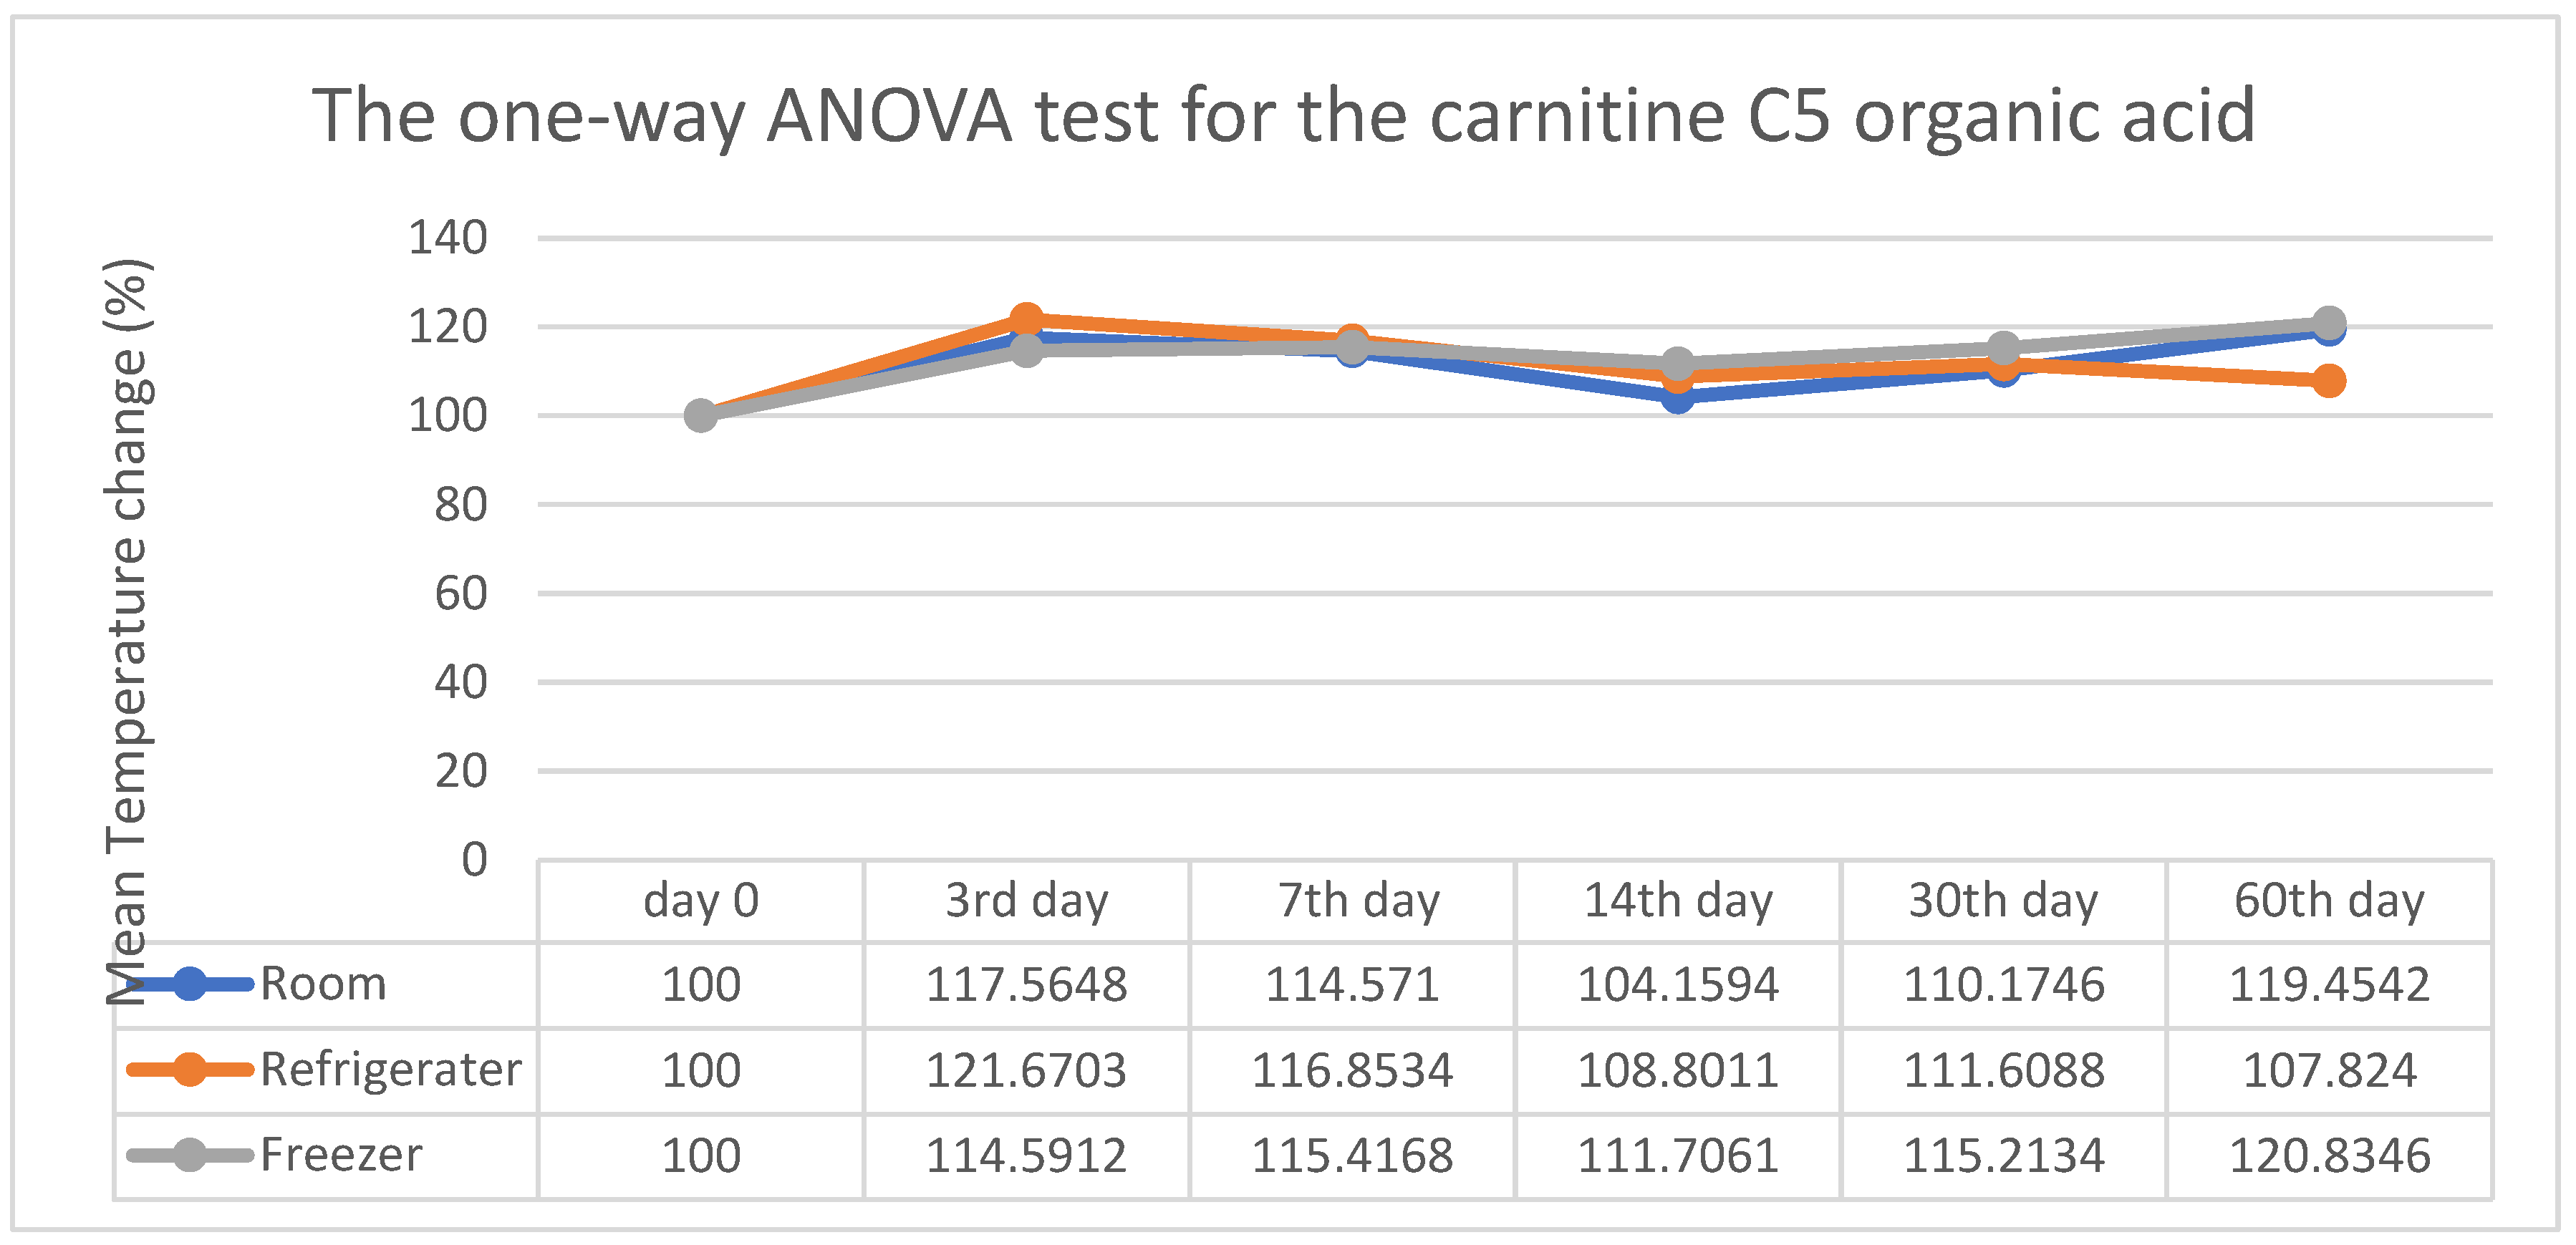
Figure 8.
Mean temperature change and One-Way ANOVA results for carnitine C6 organic acid.
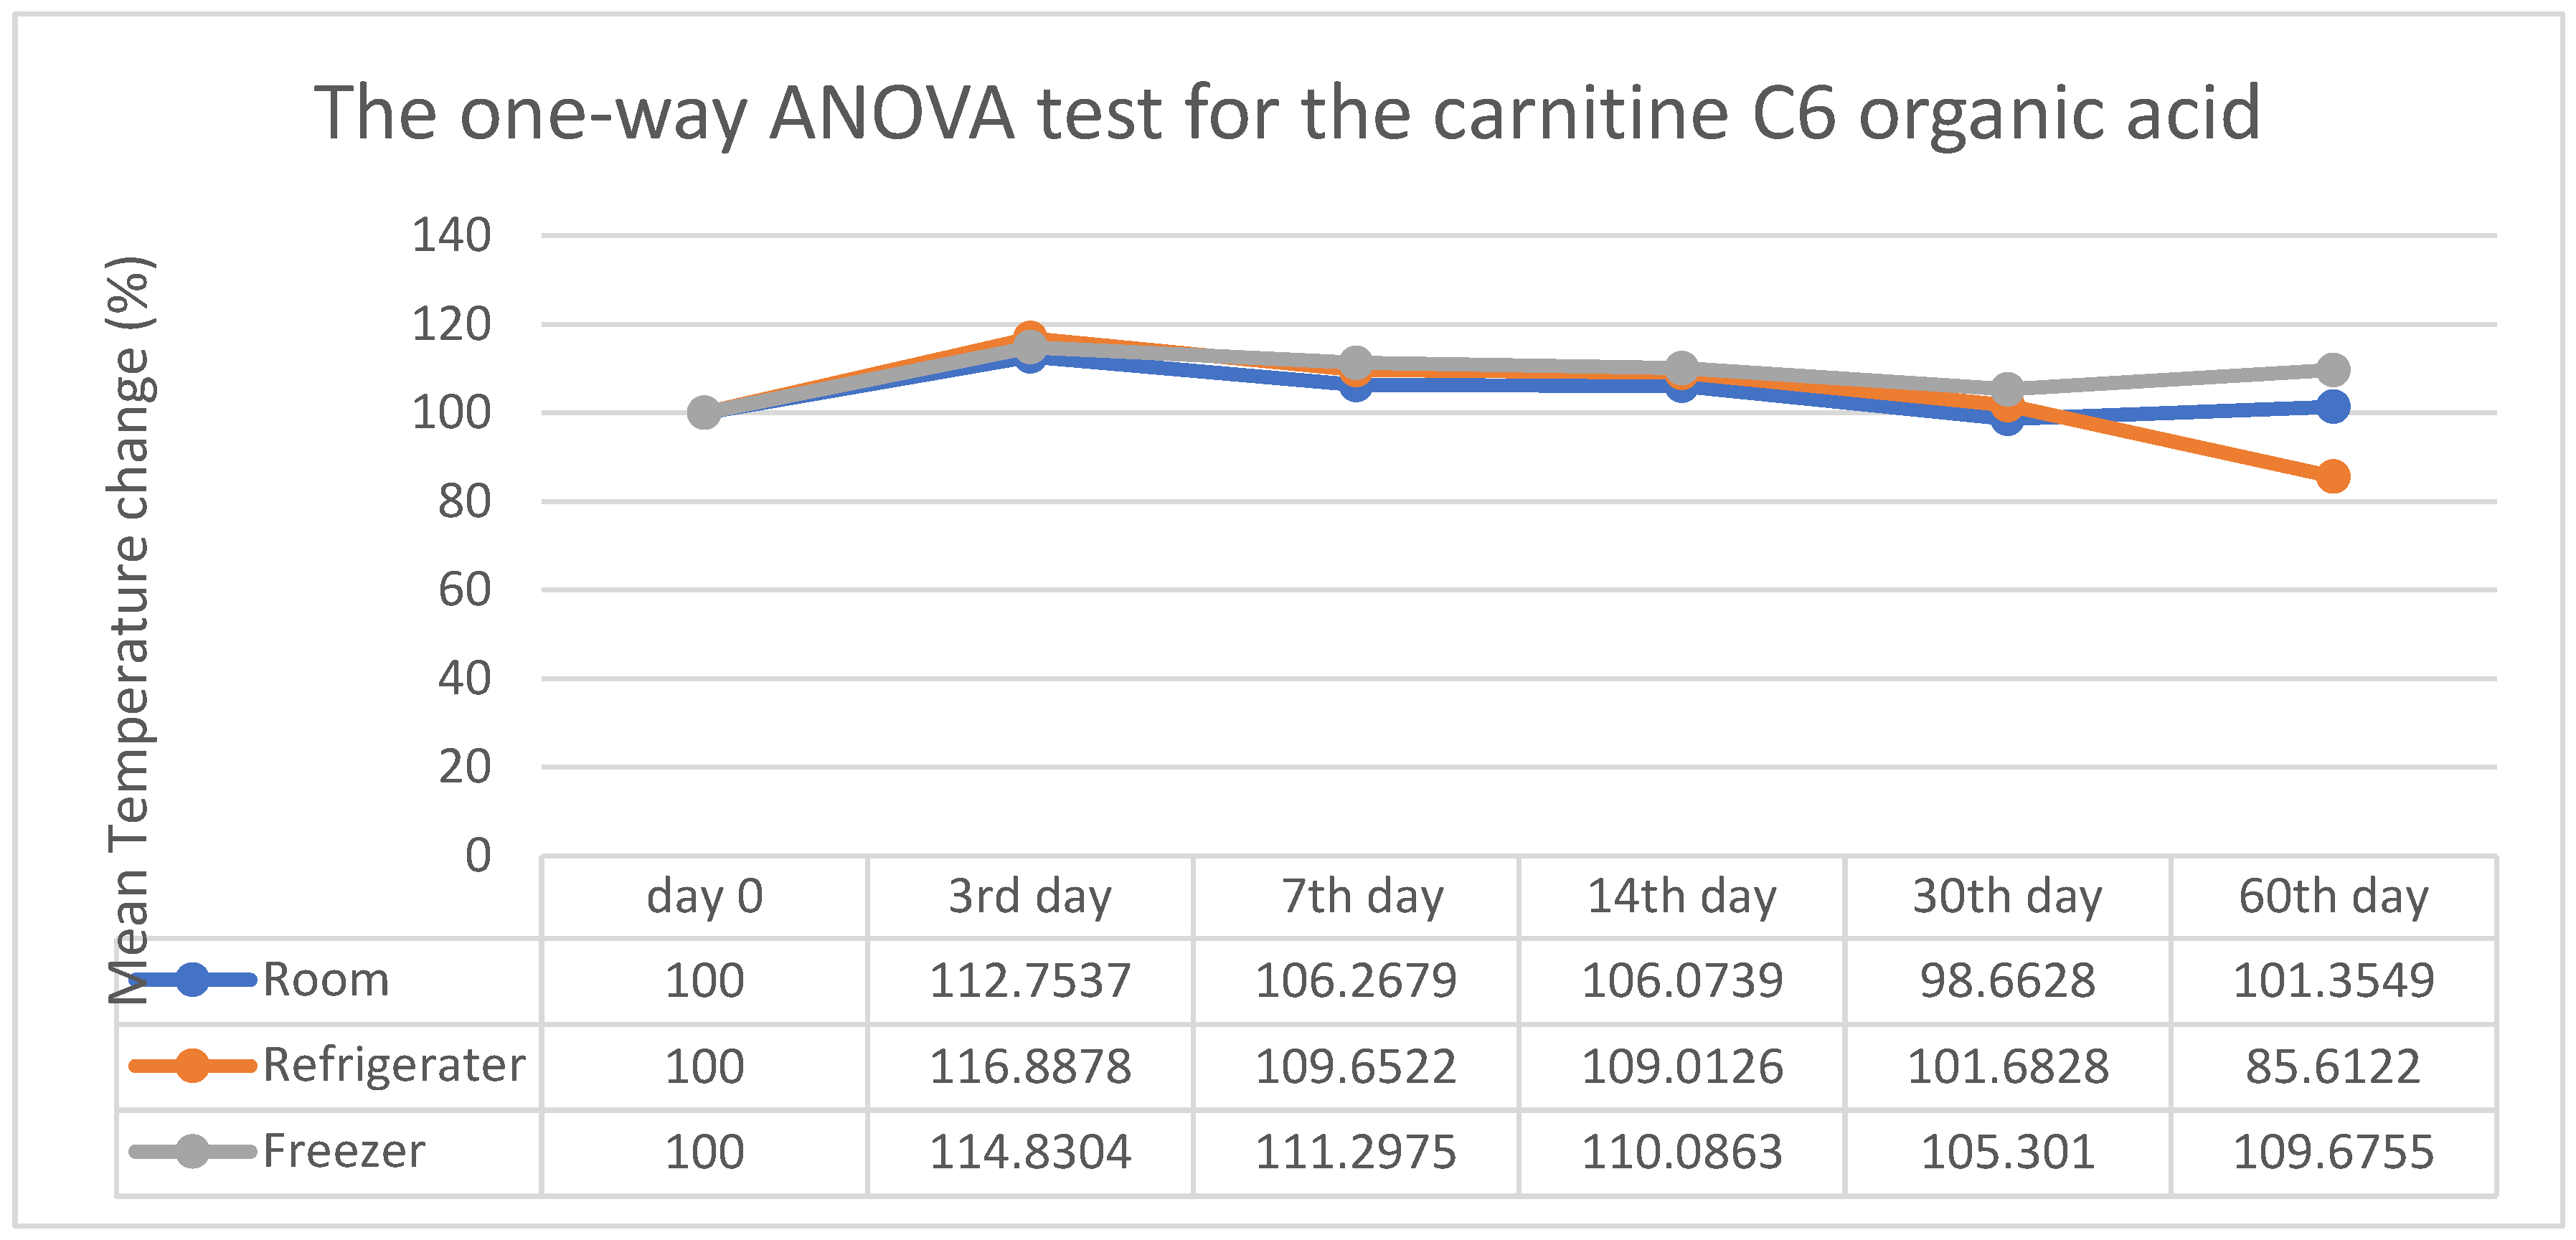
Figure 9.
Overview of the average mean temperature variation and results from the One-Way ANOVA analysis for carnitine C8 organic acid.
Figure 9.
Overview of the average mean temperature variation and results from the One-Way ANOVA analysis for carnitine C8 organic acid.
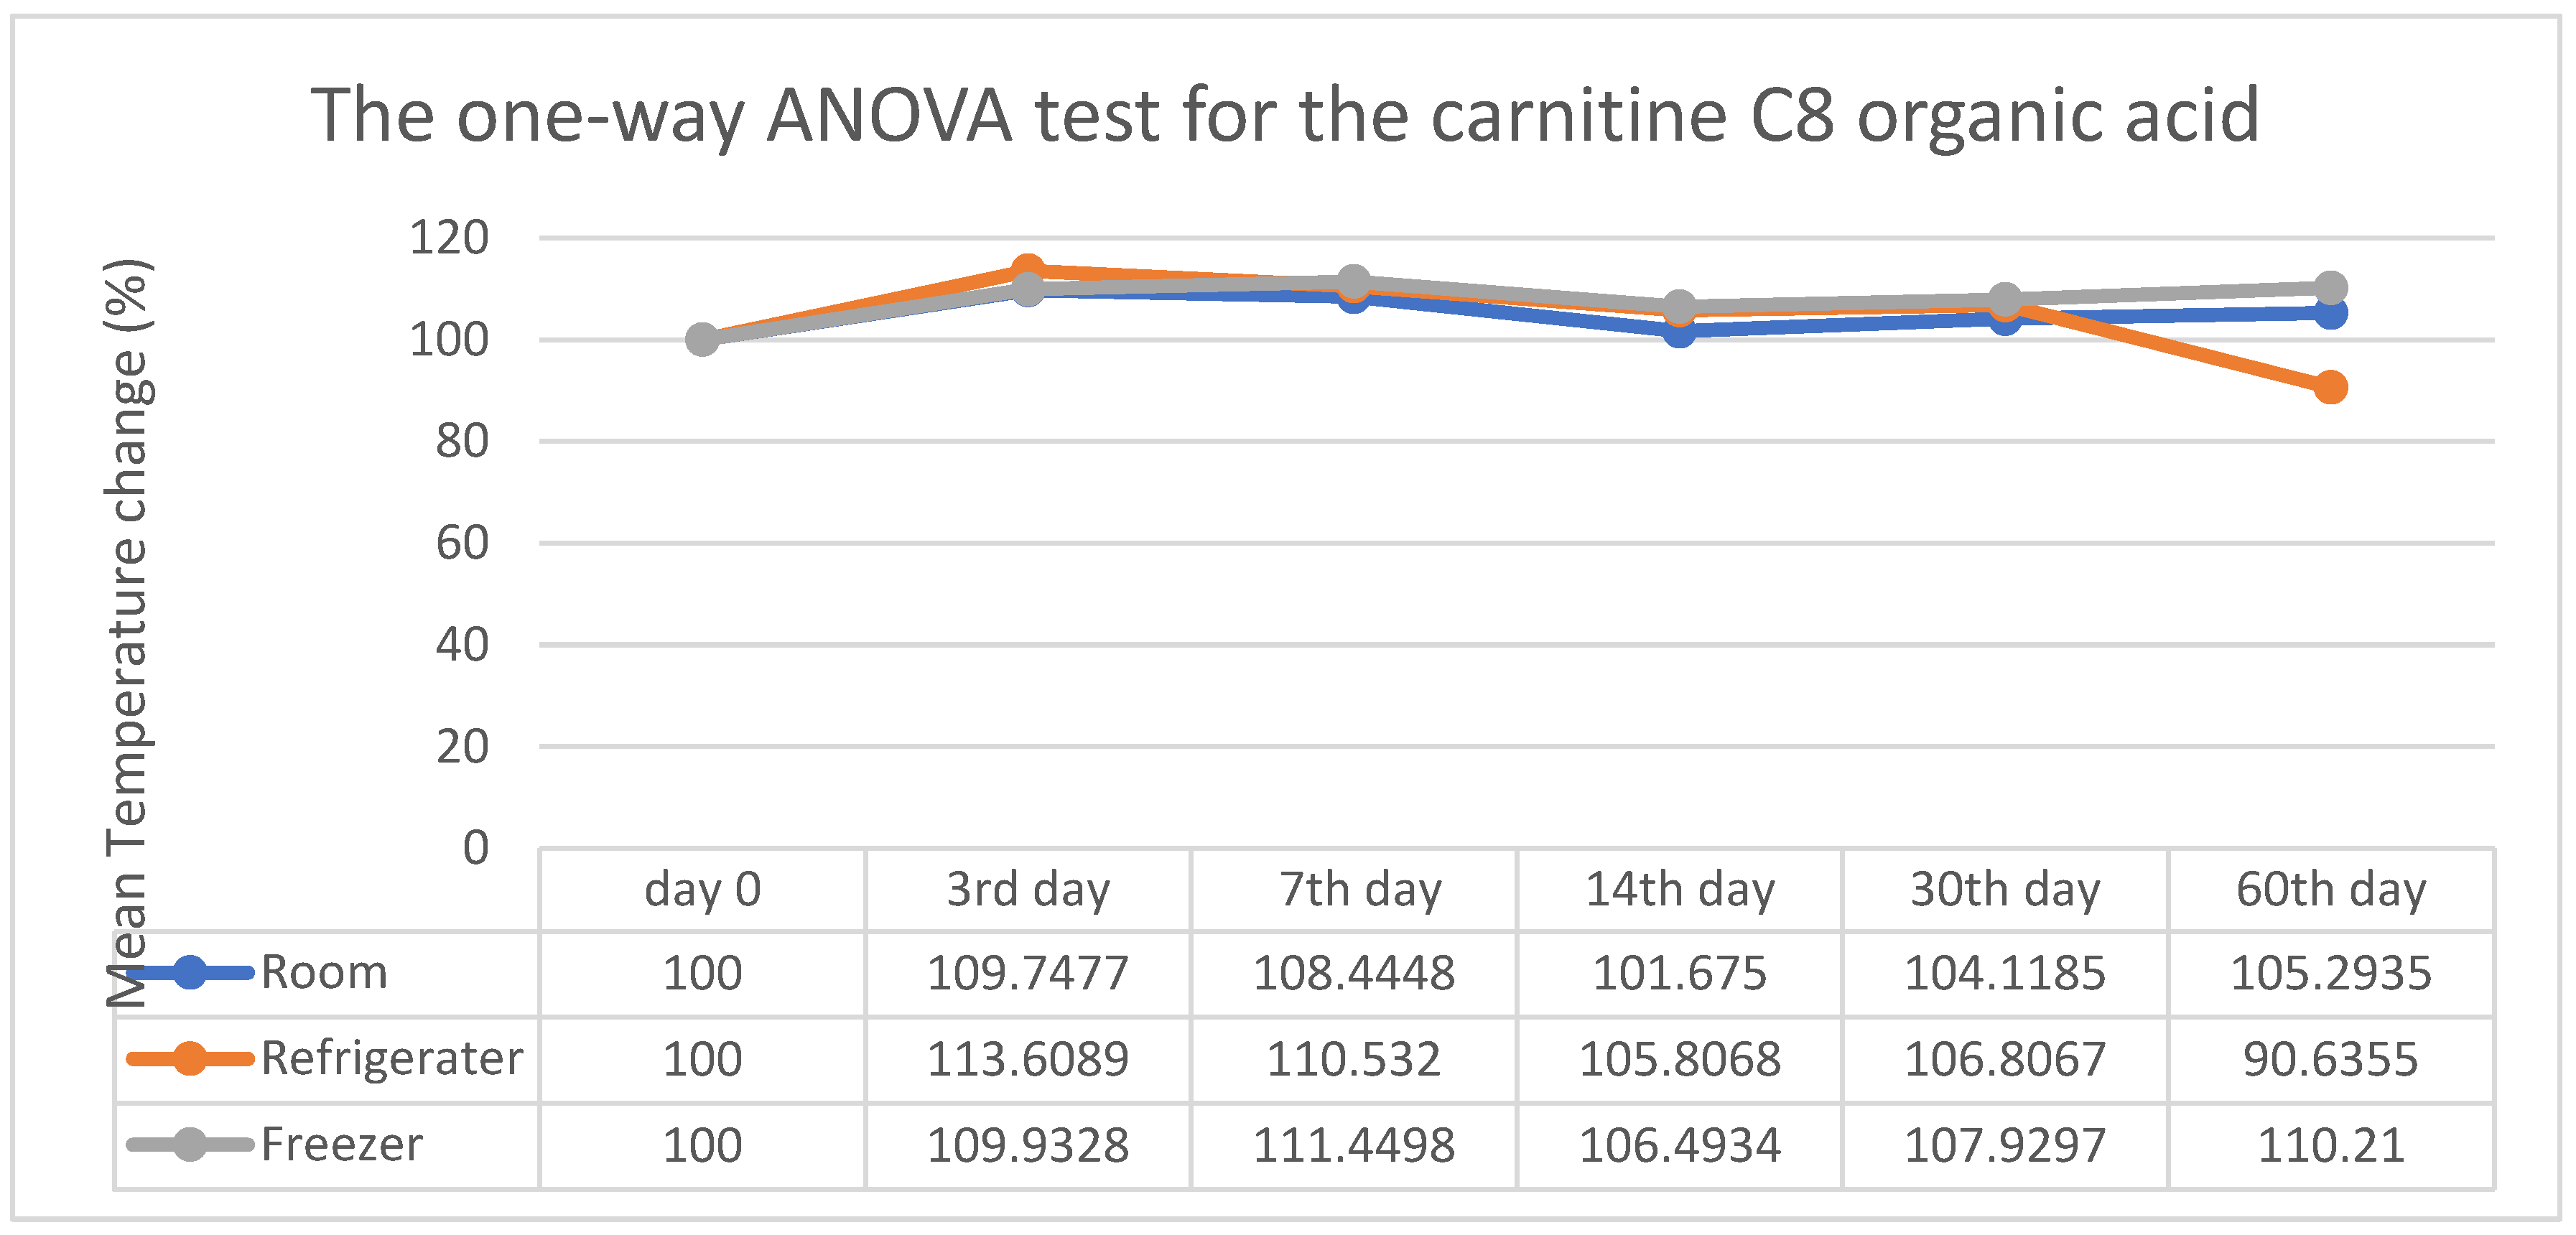
Figure 10.
Overview of the average mean temperature change and the results from the One-Way ANOVA test for carnitine C10 organic acid.
Figure 10.
Overview of the average mean temperature change and the results from the One-Way ANOVA test for carnitine C10 organic acid.
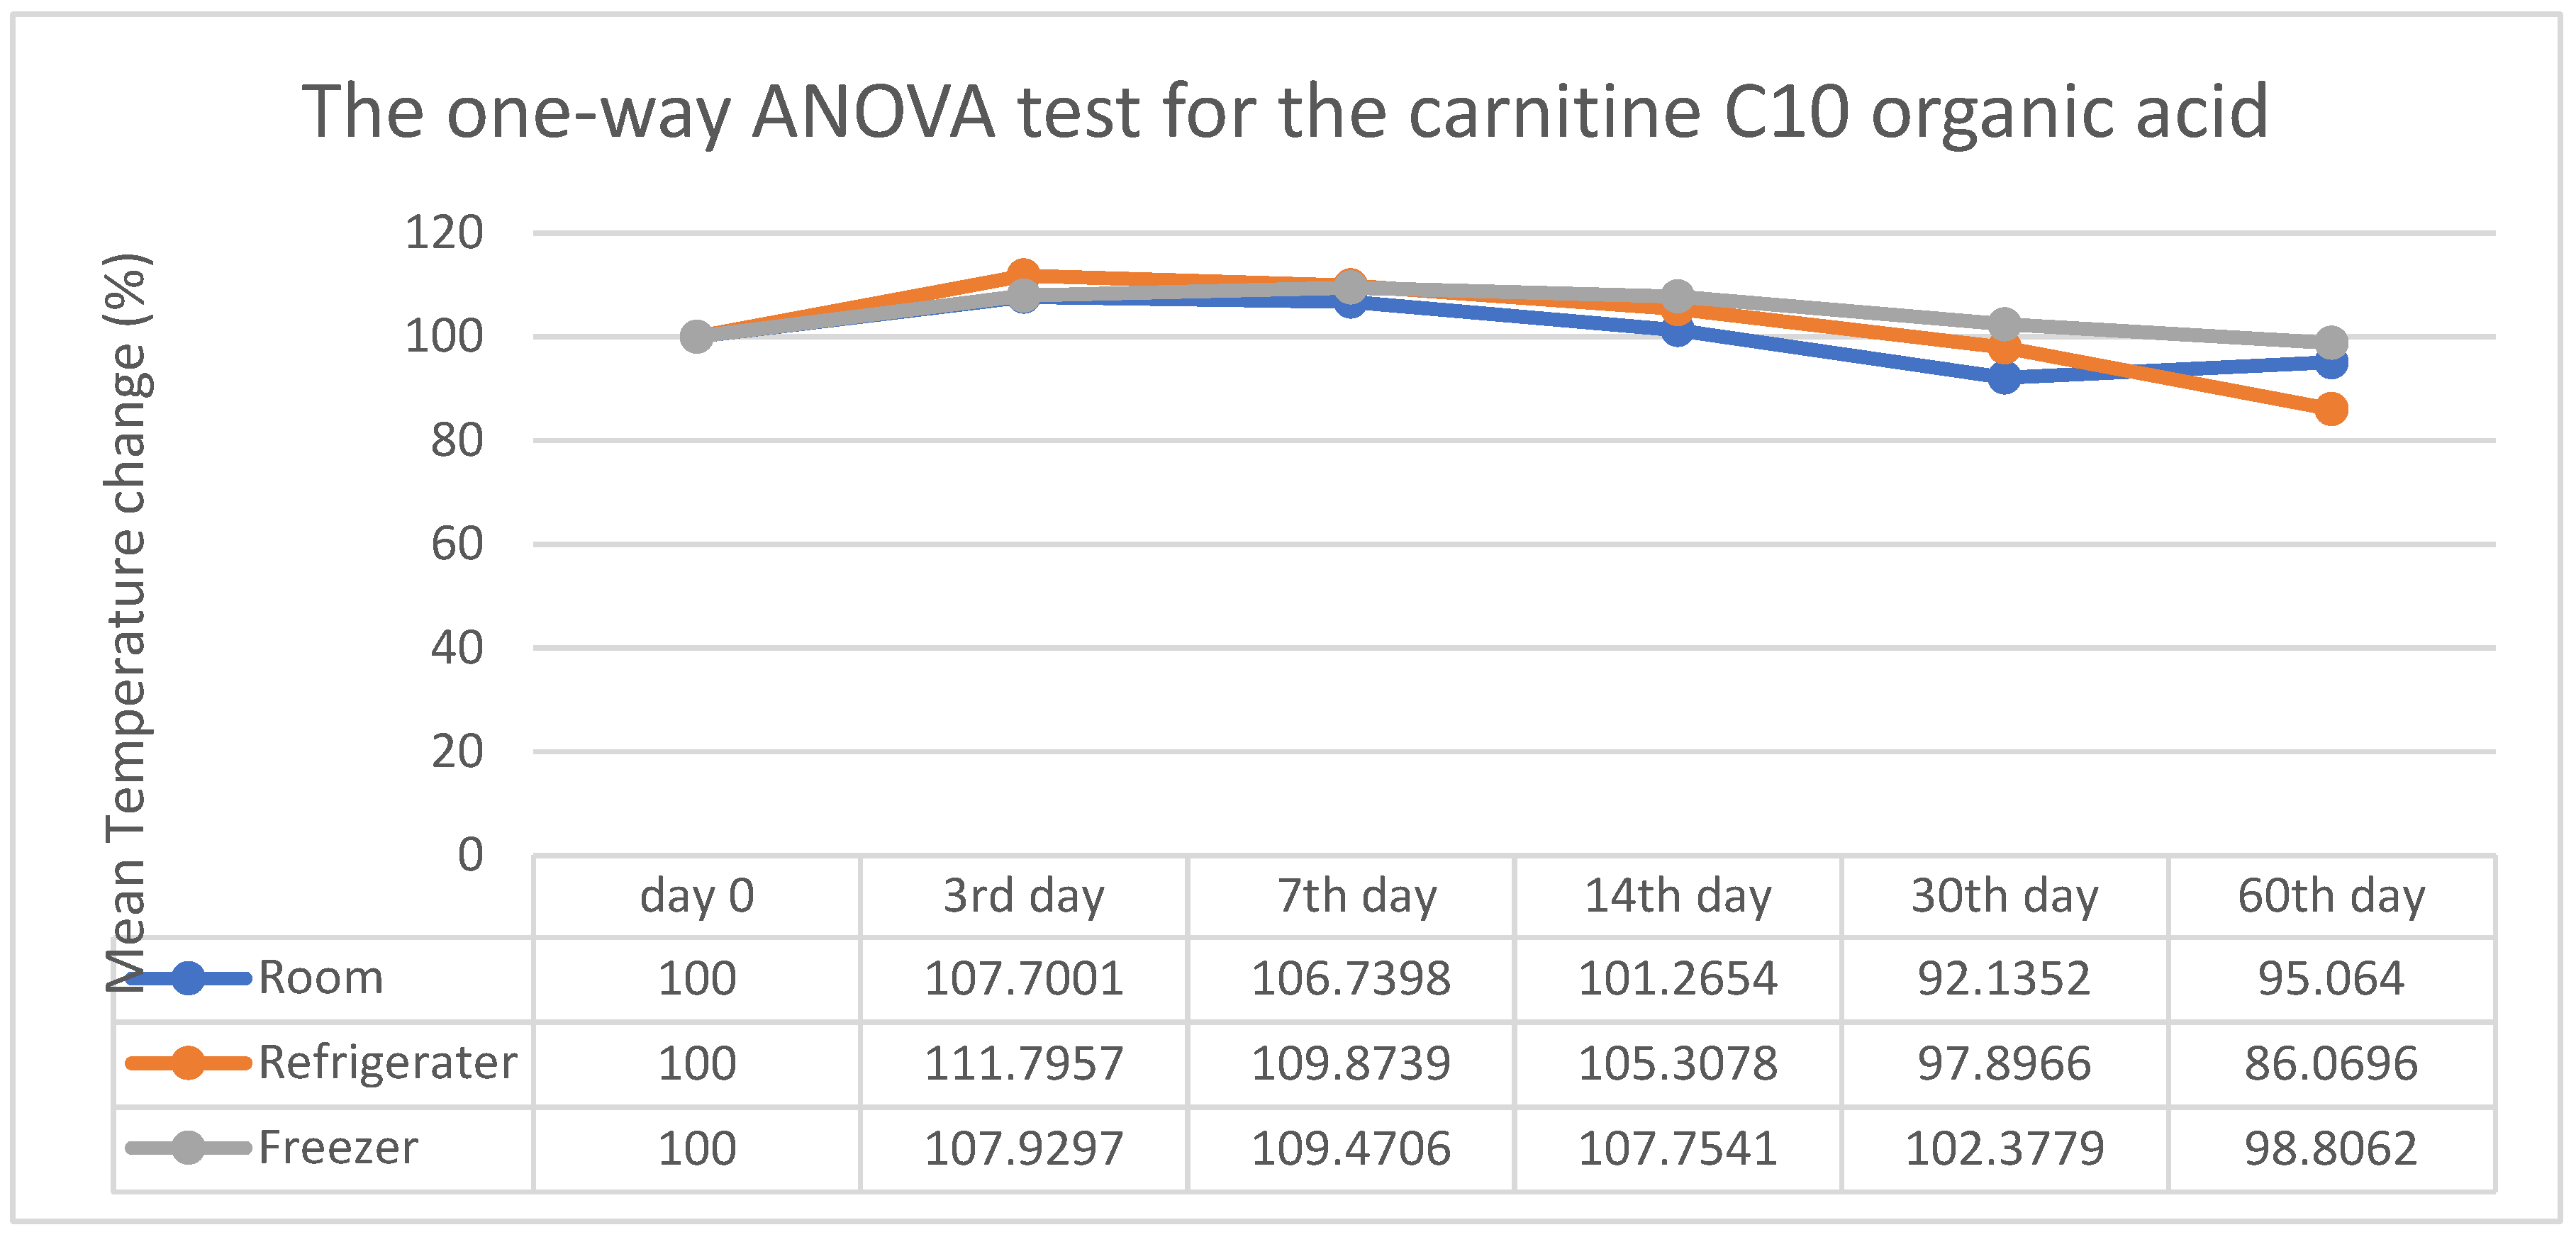
Figure 11.
Average means temperature change and One-Way ANOVA results for carnitine C14 fatty acid.
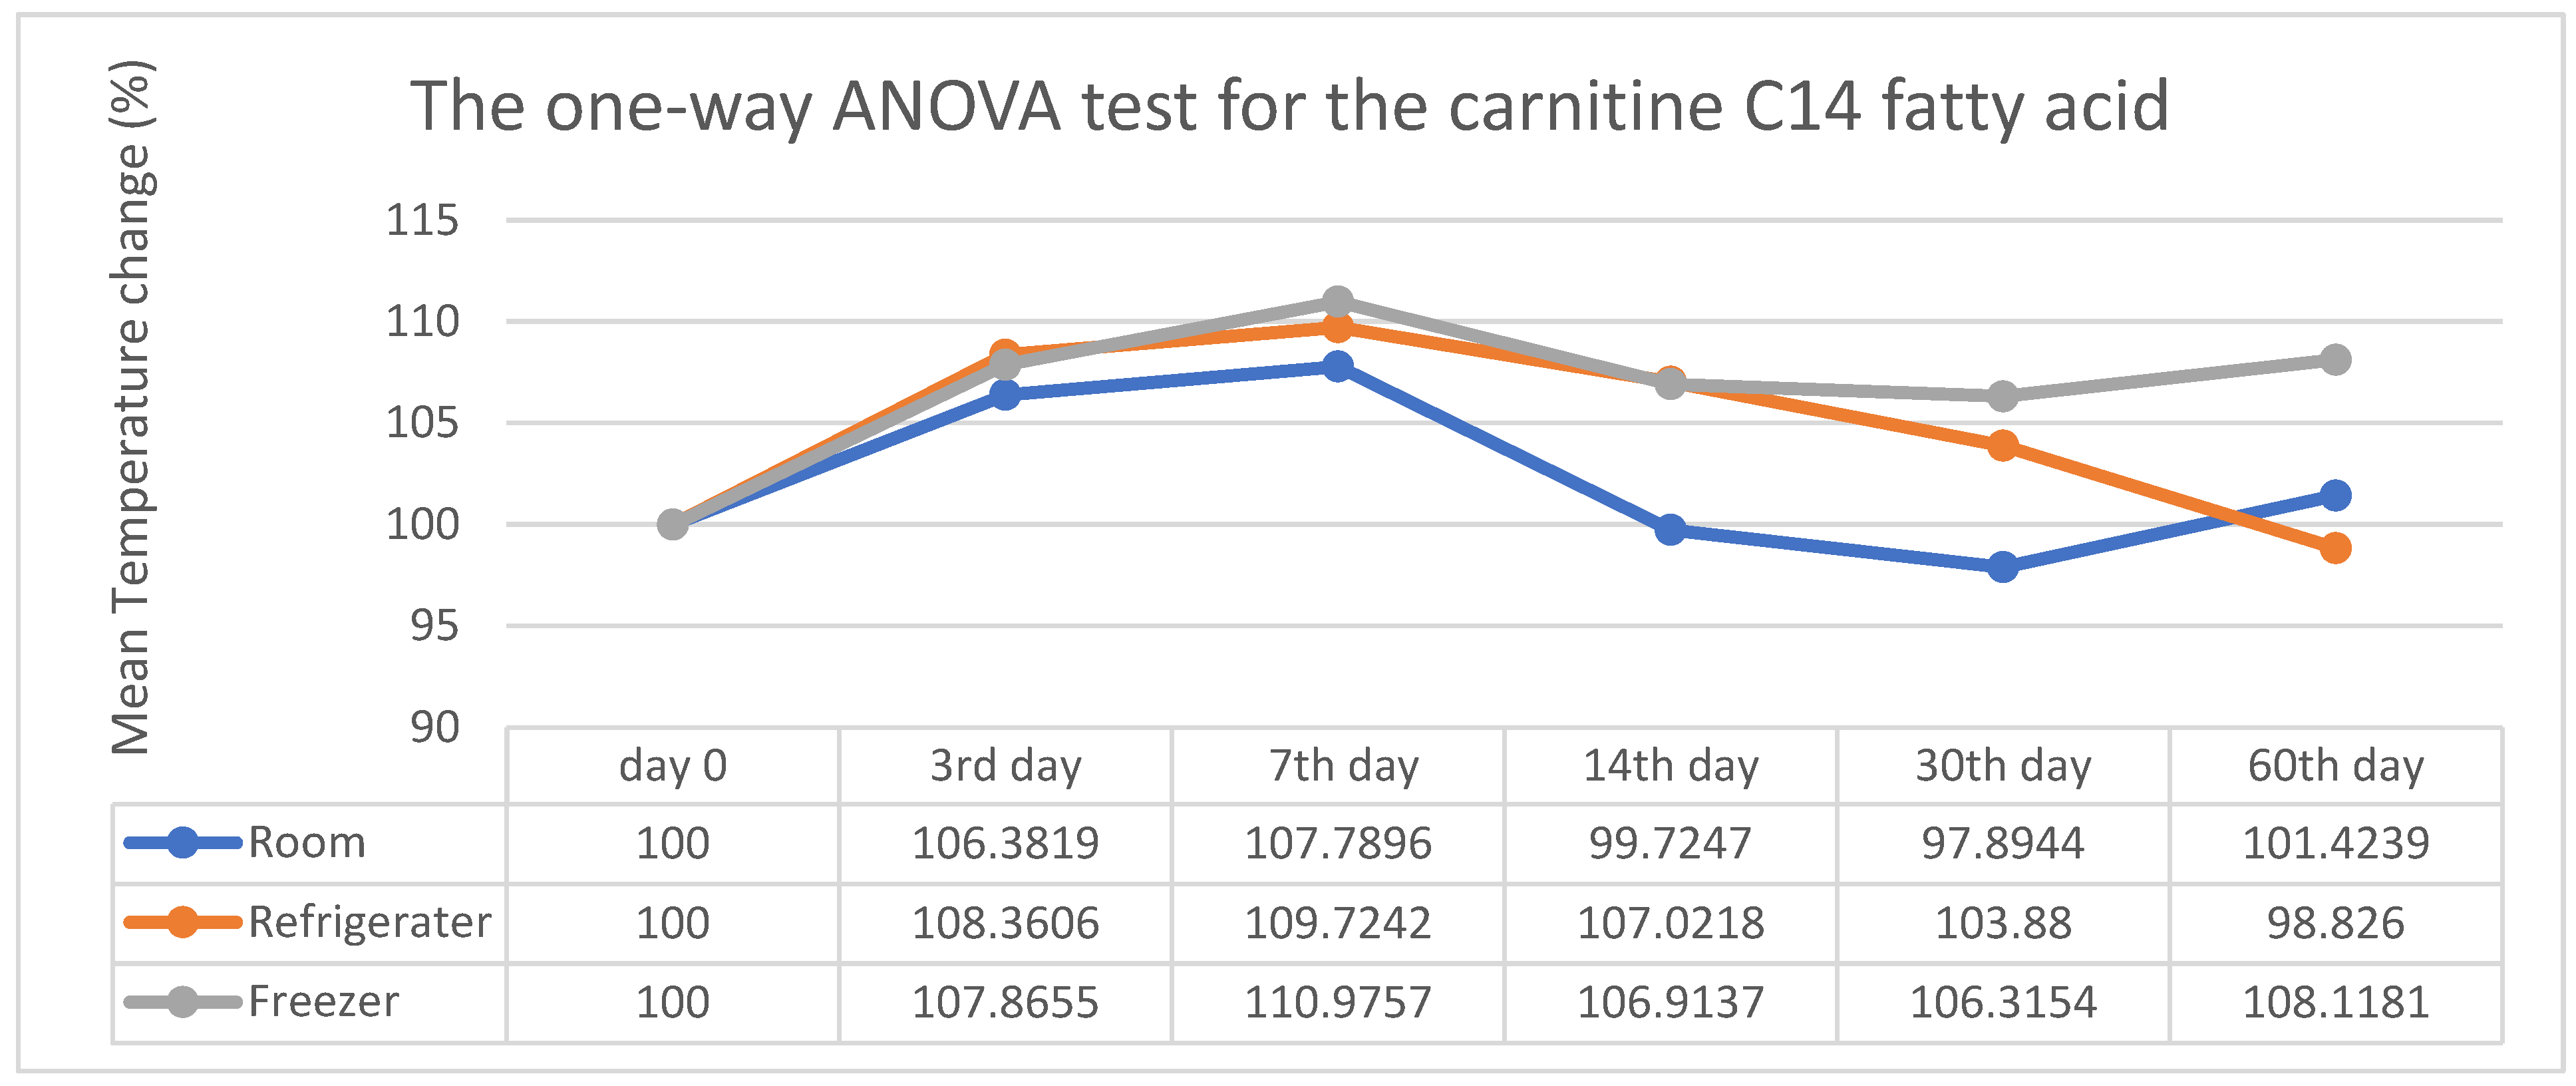
Figure 12.
Average mean temperature change and One-Way ANOVA results for carnitine C14:1 fatty acid.
Figure 12.
Average mean temperature change and One-Way ANOVA results for carnitine C14:1 fatty acid.
Disclaimer/Publisher’s Note: The statements, opinions and data contained in all publications are solely those of the individual author(s) and contributor(s) and not of MDPI and/or the editor(s). MDPI and/or the editor(s) disclaim responsibility for any injury to people or property resulting from any ideas, methods, instructions or products referred to in the content. |
© 2025 by the authors. Licensee MDPI, Basel, Switzerland. This article is an open access article distributed under the terms and conditions of the Creative Commons Attribution (CC BY) license (http://creativecommons.org/licenses/by/4.0/).
Copyright: This open access article is published under a Creative Commons CC BY 4.0 license, which permit the free download, distribution, and reuse, provided that the author and preprint are cited in any reuse.


