
Submitted:
18 August 2025
Posted:
19 August 2025
You are already at the latest version
Abstract
Ice cream is a frozen aerated dessert composed of milk solids, sugars, stabilizers, and fat—this latter being a key component in defining its structural and sensory properties. This study evaluated the influence of four fat sources—low trans vegetable fat (T1), butter (T2), UHT cream (T3), and fresh cream (T4)—on the physical and structural characteristics of ice cream, including overrun, melting resistance, texture, color, and rheology, at different stages of processing (before and after maturation). Oscillatory rheological analysis revealed predominantly elastic behavior (G′ > G″) after maturation in all samples, indicating a stable viscoelastic solid structure. Formulations containing T3 and T1 showed the highest overrun values, indicating greater air incorporation, whereas the butter-based formulation (T2) showed the lowest. Melting resistance followed the order: T3 > T4 > T2 > T1, with the UHT cream formulation exhibiting the greatest thermal stability, likely due to protein denaturation and aggregation induced by high-temperature processing. Texture analysis showed that the T1 formulation required the lowest maximum extrusion force, while T2 required the highest, reflecting an inverse correlation with overrun values. T1 also displayed the most distinct rheological profile, likely due to its specific crystallization behavior and reduced destabilization of the fat globule membrane, which favored the development of a more structured internal network. These findings demonstrate that both the source and processing of fat have a significant impact on the formation of the structural matrix and the final functional properties of ice cream. The results offer technical insights for the development of formulations tailored to specific physical characteristics, optimizing texture, stability, and performance throughout the production process.
Keywords:
ice cream
; dairy fat
; fat crystallization
; rheology
; food structure
1. Introduction
Ice cream is a widely consumed frozen food product that may or may not contain milk fat in its formulation. It is the most popular item among frozen dairy desserts, available in various versions such as conventional ice cream—defined by minimum levels of fat and milk solids, or both, according to the regulations in the country of manufacture—as well as variations with high fat content, low fat content, no added sugars, or reduced sugar content, offered in a wide range of flavors and formats [1,2]. The quality of ice cream is intrinsically associated with thermal stability during storage, since temperature fluctuations can induce the growth or recrystallization of ice crystals, impairing texture and compromising the sensory experience of the consumer [1,3].
From a food processing perspective, ice cream is a highly complex system derived from a pasteurized colloidal emulsion. During freezing, carried out under continuous agitation and air incorporation, the product acquires desirable physical and sensory characteristics, resulting from the interaction between ice crystals, partially coalesced fat globules, protein matrix, and air bubbles [2,4]. The microstructure of ice cream is strongly determined by fat crystals, which decisively influence its rheological and sensory properties. During cooling, fat crystallizes, and the formed nuclei initiate crystal growth, affecting interfacial properties and the final stability of the emulsion [1]. In this context, the use of emulsifiers and stabilizers is essential to prevent destabilization of the lipid phase, controlling interfacial tension and providing sufficient kinetic retention to maintain product stability [5,6].
The different fatty acids present in milk—short-, medium-, and long-chain—play distinct roles in ice cream characteristics, influencing everything from fat plasticity to sensory perception [7]. Buttermilk, in turn, due to its high polar lipid content, exhibits emulsifying and stabilizing properties, contributing to improved air incorporation and retention as well as emulsion stability [8,9].
Cream is a fat-rich dairy product obtained by separating the lipid phase of milk through appropriate technological methods, and it can be pasteurized or sterilized, as in Ultra High Temperature (UHT) processing, which induces structural modifications in whey proteins and influences lipid–protein interactions [10]. Butter, on the other hand, is a concentrated source of milk fat, derived from milk or cream, containing some nonfat milk solids, and presenting its own crystalline and rheological profile that affects fat network formation in ice cream [11]. Different lipid sources directly influence the sensory, rheological, and stability properties of the final product, modifying everything from mixture viscosity to melt resistance.
According to the Brazilian Collegiate Board Resolution (RDC) No. 713, dated July 1, 2022 [12], which regulates ice cream manufacturing in Brazil, the product must meet specific parameters, such as a minimum apparent density of 475 g/L, to be classified as ice cream. This regulation aims to ensure that the final product has the required quality characteristics, including the stability of both lipid and aqueous phases, which are essential for texture, palatability, and structural integrity during consumption.
Therefore, the present study aimed to investigate structural behavior changes in ice cream during the maturation stage of the mixtures and to evaluate the physical properties of the final product as a function of the use of different fat sources: low-trans vegetable fat, butter, UHT cream, and fresh cream. Through rheological analyses and physical testing, this study sought to provide an in-depth understanding of how the selection of the lipid source influences emulsion formation, product stability, and sensory attributes such as texture and melting behavior, thereby contributing to the development of ice creams with superior physical and sensory performance.
2. Materials and Methods
2.1. Ice Cream Preparation
Four formulations were produced in duplicate with different types of fat: T1—low trans vegetable fat, T2—80% butter; T3—UHT cream 17% and T4 fresh cream 25%. The ingredients used and their amounts are shown in Table 2. Whole milk powder (Itambé, Brazil), UHT cream (Itambé, Brazil), fresh cream (Fazenda, Brazil), butter (Aviação, Brazil), and refined sugar (União, Brazil) were purchased in the local market. The powdered additives were kindly provided by Clariant SA (Brazil). Maltodextrin, stabilizer, and emulsifier were supplied by Clariant S.A. (Brazil). Vegetable Trans Fat PROMULT LT (Bunge, Brazil). The influence of the maturation stage on the formulation was analyzed, and the formulations are presented in Table 1.
The glucose syrup and sucrose mixtures were diluted with approximately 30% of the total water content. The powdered milk was dissolved in the remaining water under controlled heating, ensuring that the temperature did not exceed 70°C. Subsequently, the diluted sugar solution was combined with the powdered milk to form the aqueous phase. The fat was heated separately until fully melted, after which the emulsifier was incorporated. The mixture then underwent pasteurization at 75°C for 15 minutes in a water bath.
During the process, constant homogenization was maintained using a mechanical shaker at 1200 rpm (Fisaton, Brazil). After homogenization, the mixture was transferred to a 10 L Beaker and cooled in an ice bath with continuous stirring until the temperature reached 20°C. For maturation, the mixture was sealed with plastic film and stored in a refrigerator at 10°C for 20 hours.
After maturation, the mixture was frozen and aerated in a vertical freezer (Polo Sul, model PSV 50, Brazil), with a cooling bath set at -25°C for approximately 10 minutes. The freezing process continued until the mass reached -6°C, achieving the desired texture. The product was then transferred to a plastic container with a lid and frozen for 2 hours in a freezer set to -28°C. Finally, the product was stored in a freezer at -20°C for further preservation.
2.1.1. Rheology of Mixtures
The rheological properties of the ice cream mixtures were assessed using a MARS Haake Rheometer (Thermo Electron Corporation, Germany) with oscillatory testing, and data analysis was conducted with the RheoWin3 program. Measurements were performed at 4°C, maintained by a refrigerated bath, using a polished cone-plate sensor (C35/1 Ti). All tests were conducted in triplicate.
To determine the linear viscoelasticity range, stress scans were conducted from 0.01 to 100 Pa. After establishing a fixed stress value within the linear viscoelastic region, frequency sweeps were performed over the range of 0.01 to 10 Hz to generate the mechanical spectrum. The rheological behavior was characterized by evaluating the elastic modulus (G’), the viscous modulus (G”), the ratio between these two moduli (tan δ), and the complex viscosity (η*) as a function of frequency. The mixtures were analyzed both prior to homogenization and cooling (t0) and after 4 hours of maturation at 4°C.
2.1.2. Overrun Determination
Air incorporation into the ice cream matrix, referred to as overrun, is a critical factor influencing the product’s texture, mouthfeel, and apparent density. According to the Brazilian regulation RDC No. 713/2022 [12], edible frozen desserts must present a minimum apparent density of 475 g/L. Considering that the density of the liquid mix (before aeration) typically ranges from 1.0 to 1.1 g/mL, the maximum legally acceptable overrun is approximately 110%, ensuring compliance with the minimum density requirement in the final product.
The overrun was determined by comparing the mass of a fixed volume of the mix before and after the freezing and aeration process. Specifically, a 10 mL aliquot of the liquid mix was weighed in a pre-tared container. The same procedure was conducted with the freshly aerated ice cream. The percentage of overrun was calculated using Equation 1, adapted from Clarke (2012):
2.1.3. Meltdown Behavior Test
The methodology adapted from [13] was employed to evaluate the relationship between the melting behavior of ice cream and the structural role of the fat phase, particularly the contribution of partial coalescence to network formation. Samples of 100 ± 1 g, previously stored at –20 °C, were placed on a metal grid positioned over a beaker to collect the melted portion. The test was conducted at a controlled ambient temperature of 25 ± 1 °C for 45 minutes.
The mass of the melted fraction was recorded at 5-minute intervals, and at the end of the experiment, the residual ice cream retained on the grid was quantitatively removed and weighed. From these data, melting curves were constructed for each formulation, enabling comparison of melting rates and the structural integrity imparted by different fat sources and processing conditions.
2.1.4. Colorimetric Analysis
Color measurements of the ice cream samples were performed using a ColorQuest® XE spectrophotometer (HunterLab®, USA), operating under the CIE Lab color space*, with a D65 standard illuminant and a 10° observation angle, in accordance with standardized procedures for food colorimetry. The parameters evaluated were: lightness (L*), which indicates brightness on a scale from black (0) to white (100); a*, representing the red-green axis (positive values toward red, negative toward green); and b*, representing the yellow-blue axis (positive values toward yellow, negative toward blue).
Measurements were performed in triplicate directly on the surface of the frozen samples, ensuring homogeneous sampling and minimal influence of surface melting. These data were used to evaluate potential color variations resulting from the different fat sources employed in the formulations.
2.1.5. Texture Analysis
A texture analyzer TA-XT2 (Stable Micro Systems, United Kingdom) was used to evaluate the mechanical resistance of the ice cream mass immediately after churning, at -5 °C. The back extrusion test was selected for its technical suitability in analyzing semi-solid products such as ice cream, providing reliable data on firmness and structural integrity [3]. Each formulation was tested using the AB/E back extrusion probe. Ice cream samples were placed in cylindrical containers, filling approximately two-thirds of the total volume. The probe moved downward at a constant speed of 1 mm/s, as did the pre- and post-test speeds. The probe penetrated 25 mm into the sample, and the maximum force peak required for extrusion was recorded. The results, processed using the Texture Expert software (Stable Micro Systems, United Kingdom), reflect the internal structure of the product and its resistance to deformation—key attributes for evaluating creaminess, cohesiveness, and spoonability.
The adoption of the back extrusion method is justified by its reproducibility, low sample preparation requirement, and strong correlation with sensory perception of firmness and creaminess in aerated frozen systems. These advantages make it an appropriate and widely used technique in studies involving the rheological and textural properties of ice cream and similar emulsified matrices [14].
2.1.6. Nutrition Information
The nutritional facts for the formulations were based on the Brazilian Table of Food Composition [15], with a reference value of 100 g of product. This procedure was applied to all the formulations evaluated, considering the average values of the nutritional components present in the ingredients used.
2.1.7. Statistical Analysis
ANOVA with Tukey’s comparison (p < 0.05) was used to analyze the results of this research, using MINITAB software (Minitab, USA).
3. Results
3.1. Rheology of Mixtures
Figure 1 presents the Stress Sweep (Amplitude Sweep) graphs of the samples, where the viscoelastic region can be found.
Figure 2 represents the Frequency Sweep of ice cream formulations before and after maturation. The curves can describe the behavior time-dependent on the deformation non-destructive range. High frequencies are used to maintain the quick movement in a short time. In a practical way, this can provide information about the behavior and structure of the material, as well as its stability for a long time.
Figure 3 provides information about the overrun test, which refers to the amount of air incorporated into the mixture during the manufacturing process. This air is essential for the texture, volume, and even cost of the product.
Figure 4 demonstrates the melting rate of the samples, which refers to the amount of air incorporated into the mixture during the manufacturing process. This air is essential for the texture, volume, and even cost of the product.
Table 2 presents the results of color analysis. Color is a sensory attribute that affects consumer preference. Color can indicate flavor, freshness, natural or artificial ingredients, and even influence expectations of texture and sweetness. In the ice cream industry, the fat used (usually milk or cream) tends to be white or slightly yellowish, depending on its origin. White fat is common in dairy products from animals fed on feed or in feedlots; yellowish fat appears when animals are raised on pasture, due to the presence of beta-carotene, a natural pigment found in green vegetables.

Table 2.
Color analysis—Ice creams: (T1) low trans vegetable fat, (T2) butter, (T3) UHT cream, (T4) fresh cream.
Table 2.
Color analysis—Ice creams: (T1) low trans vegetable fat, (T2) butter, (T3) UHT cream, (T4) fresh cream.
| Treatments | T1 | T2 | T3 | T4 |
| L* | 81.01 ± 0.32 a | 80.25 ± 0.81 a | 77.51 ± 0.41 b | 79.36 ± 0.24 a |
| a* | - 1.89 ± 0.02 a | - 1.88 ± 0.11 b | - 2.09 ± 0.30 c | - 1.94 ± 0.04 a |
| b* | 23,26 ± 0.13 a | 28.88 ± 0.41 b | 25.74 ± 0.60 c | 24.34 ± 0.11 a |
Figure 5 shows the texture results (hardness) of the processed ice creams. Texture affects creaminess, ease of serving and perception of quality. The fat content and type affect the texture; the more fat in the formulation, the creamier and less hard the ice cream will be. Fat also influences ice crystal formation and overrun (air incorporation). More air incorporation results in a lighter, less hard texture, while less air results in a denser, firmer ice cream.
4. Discussion
4.1. Stress Sweep (Amplitude Sweep)
As seen in Figure 1, the formulations showed inversion of the modulus around 0.5 Pa, indicating predominantly elastic behavior, particularly for formulations containing more stable fats like cocoa butter. The exception was T2, produced with butter, which exhibited a higher inversion point near 1.0 Pa. This suggests that cocoa butter, a fat with a well-defined crystalline structure, offers greater resistance to flow, providing higher and more stable viscosity under stress. This behavior aligns with observations by [16], who noted that milk fat, when used in ice cream formulations, retains predominantly elastic rheological characteristics, leading to a more stable and structured behavior.
Formulations using fresh cream and UHT cream showed lower G’ (elastic modulus) and G’’ (viscous modulus) values, reflecting the complexity of these ingredients in terms of composition and thermal behavior. Fresh cream contains a higher proportion of unsaturated lipids, making it structurally less robust at low temperatures compared to cocoa butter, which is more solid. UHT cream, due to the ultra-high temperature sterilization process, may have weakened its fat structures. The melting temperature of UHT cream, which varies widely depending on the lipids present, directly influences the rheological properties and can result in a final product with increased fluidity, especially after melting.
In the case of UHT cream, the ultra-high temperature sterilization process can cause changes in protein structures and fat globules, leading to a loss of stability at higher temperatures. This phenomenon, when observed in the rheological properties of ice cream, can result in a more fluid product that does not resist mechanical stress, such as during processing and freezing [1]. This behavior was discussed by [17], who pointed out that stabilizers present in ice cream emulsions play a crucial role in modulating rheological characteristics, controlling viscosity, and texture in the final product.
Ice water plays a fundamental role in the rheological behavior and microstructure of ice creams. The presence of solid water, i.e., ice, dictates the rigidity of the sample, which is expressed in the elastic modulus (G’). Ice creams with higher amounts of ice water tend to exhibit greater hardness and rigidity, which are crucial for ensuring proper handling during consumption and for maintaining stability over time. The formation of ice during freezing and its interaction with the lipid and protein phases of the ice cream matrix also affect the product’s microstructure, as noted by [18], who discussed the importance of this solid fraction in the product’s behavior.
The effect of ice water can also be linked to the rheological behavior of ice cream emulsions. The formation of ice and its interaction with lipid and protein phases influences not only viscosity but also texture properties. Hardness of ice cream is a critical parameter, particularly in the context of sales and consumption, where texture can be a key determinant of product acceptance. Studies by [19] suggest that modulating the amount of ice water in the system is crucial for controlling the sensory characteristics of ice cream, such as creaminess and optimal melt performance.
The crystallization of triacylglycerols (TAGs), the primary components of fats in ice cream, is a crucial phenomenon for determining the product’s structural and textural properties. The crystallization behavior of TAGs is greatly influenced by factors such as fat composition (saturated vs. unsaturated) and melting temperature. As noted by [20], trans fatty acids crystallize faster than their cis isomer counterparts, which can lead to a better structuring and formation of a more stable lipid network in products like ice cream.
The presence of unsaturated fats can modify the crystallization rate of TAGs, as discussed by [21]. The formation of smaller fat globules, which occurs with a higher content of unsaturated fatty acids, tends to result in more stable and smoother emulsions, which are desirable for ice cream products. However, controlling the crystallization rate is essential, as too rapid crystallization can lead to the formation of large ice crystals, resulting in a grainy texture.
After maturation of ice cream emulsions at low temperatures, the physical and rheological properties change due to the hydration of stabilizers. As discussed by [22], the hydration of stabilizers like guar gum, xanthan gum, or gelatin increases the viscosity of emulsions, promoting improved stability and texture during storage. The presence of emulsifiers and stabilizers, such as glycerol esters and milk proteins, can significantly influence flow and resistance properties, leading to a dynamic balance between the elastic and viscous moduli.
The different rheological behaviors observed between formulations with butter, fresh cream, and UHT cream reflect not only differences in physical properties of these ingredients but also in crystalline structures and melting/solidification processes. Saturated fats, like butter, offer greater control over texture and rheological stability, while unsaturated and processed fats, such as those in UHT cream, have a more fluid behavior, with less stability under certain conditions. Differences in crystallization properties and the stability of emulsifiers result in significant variations in final texture and behavior during handling and storage of ice cream.
4.2. Frequency Sweep
The variation in material properties with respect to strain and stress rates was investigated using an oscillatory frequency sweep test. This test demonstrates how the elastic and viscous behavior of a material oscillates, and it is possible to analyze the complex viscosity as a function of frequency, describing the total resistance to dynamic shear. In this test, the complex viscosity either increases or decreases while maintaining constant tension [23]. Based on the parameters tested, all formulations indicated that frequency could be proportionally increased with the increase in the elastic and viscous moduli, as well as the decrease in the complex viscosity curve. This suggests the subordination of the moduli to frequency, thus characterizing the viscoelastic fluid behavior, where the molecules tend to orient themselves in the direction of the applied force. Under shear stress, the material typically behaves as a pseudoplastic fluid, i.e., a non-Newtonian fluid where the viscosity decreases with increasing shear rate [23]. This behavior was observed in most samples, as reported by [20,22,24] for ice cream systems.
Among the formulations tested (Figure 2), those produced with fresh cream and UHT cream presented the lowest frequency resistance, below 1 Hz. Additionally, these formulations showed the lowest loss modulus (G’’) and storage modulus (G’), indicating a less rigid structure compared to other formulations. This suggests that the fat composition and the manufacturing process (such as the UHT treatment of UHT cream) significantly influence the rheological properties of the system. The lower G’ and G’’ values of these formulations indicate a weaker gel structure, with less resistance to deformation under applied stress.
These findings are consistent with the observations made by [16], who emphasized the structural sensitivity of ice cream mixtures based on dairy fat during the maturation phase at 4°C. At this stage, emulsions undergo structural changes due to the reorganization of fat globules and the hydration of stabilizers, which affects the elastic and viscous properties of the ice cream base. The UHT cream, for instance, can undergo significant changes in its fat globule membrane during processing, leading to a destabilized fat phase, which exhibits more fluid-like behavior under oscillatory shear tests.
It is important to note that the maturation process plays a crucial role in altering the rheological properties of ice cream formulations, as pointed out by [19,22]. During maturation, emulsifiers and stabilizers hydrate, which increases viscosity and alters the gel network. As a result, formulations with low trans-fat content exhibit higher G’ values and a more elastic behavior, while formulations with fresh cream and UHT cream, due to their weaker lipid structures and lower G’ values, may not exhibit the same level of rigidity after maturation, resulting in higher tan δ values and a behavior more dominated by viscosity. This behavior is consistent with [16], who noted that emulsions made with dairy fat exhibit a prevalence of the elastic modulus after maturation at low temperatures.
The shear-thinning behavior observed in the formulations, especially those containing fresh cream and UHT cream, suggests that these systems are well-suited for processing under high shear conditions, which are typical of ice cream production. The results from the oscillatory shear test reflect the ability of these emulsions to flow more easily under high shear stress, contributing to a smoother, creamier texture when whipped. However, the lower G’ values observed in these formulations might indicate a softer texture in the final product, which could affect the mouthfeel and structural integrity of the ice cream.
In contrast, formulations with higher fat content or more stable fat systems, such as those containing cocoa butter, exhibit higher G’ and G’’ values and complex viscosity, indicating a firmer structure, resulting in a more stable and resilient final product. This balance between elasticity and viscosity is critical to controlling the texture and stability of the product during processing and storage, ensuring high-quality ice cream with desirable sensory characteristics.
There was a significant reduction in complex viscosity at high frequencies, which caused the disaggregation of fat particles in the system. It was clear that the viscosity of the mixtures depends on the type of fat and hydrocolloids added to the formula and the size of these particles in the matrix. It was possible to verify that the ice creams produced with low trans-fat (T1) and butter (T2) were the most rigid products and had the most ice crystals among the formulations tested. Therefore, we highlight the thesis that low-trans vegetable fat suffers less membrane destabilization because it has a large amount of palmitic acid (16:0), ranging from 35 to 47%. This high level of saturated fatty acids is disadvantageous for the destabilization of fat globules, as this destabilization will be greater the more unsaturated and longer the chains of vegetable fat used in the formulation. Furthermore, mono and diacylglycerol emulsifiers can interact better through the hydrophobic region of the molecules [24].
However, formulations T2 and T3, produced with milk fat, demonstrated similar and lower values (<1) of tan δ, thus indicating the existence of a remaining microstructure. This can be attributed in part to the presence of proteins in association with stabilizers. Furthermore, the fact that these formulations achieved similar G’ values above 0.5 Hz frequency suggested that interactions between milk proteins and fat occurred to ensure a structured product. The tan δ values were below 1 at high frequencies, G’ was greater than G”, proposing that the molecules have less mobility, and the product has solid and not liquid properties. The ice cream prepared with milk fat (T2, T3, and T4) presented a lower slope of the curves, and differentiated profiles, indicating greater stability.
4.3. Overrun Determination
The calculated overrun values for the evaluated ice cream formulations are depicted in Figure 3. Overrun, defined as the volume increase due to air incorporation during freezing and whipping, is a paramount quality parameter influencing the texture, mouthfeel, and overall consumer acceptance of frozen desserts [25,26]. The extent of air incorporation is inherently dependent on the interplay between the fat globule network, milk proteins, emulsifiers, stabilizers, and ice crystal morphology, all of which modulate the viscoelastic properties and stability of the continuous phase [5,27].
Among the tested formulations, T3 (UHT cream) and T1 (low trans-fat vegetable blend) exhibited the highest overrun values, indicating superior air entrapment and retention capacities. The elevated overrun in T3 is attributable not only to the relatively stable crystalline structure of the UHT cream fat fraction but also to the intrinsic presence of hydrocolloidal stabilizers incorporated during industrial processing [28,29]. These stabilizers synergistically interact with emulsifiers and anti-crystallization agents added in the ice cream mix, enhancing the interfacial stability of fat globules and improving the viscosity of the unfrozen serum phase, which collectively promote the formation and maintenance of a cohesive partial coalescence fat network [18,19].
While total fat content remains a significant factor in determining overrun, controlled destabilization of the fat membrane during mechanical agitation is critical for partial coalescence, which stabilizes air cells within the matrix and confers elasticity to the continuous phase [20,30]. In contrast, formulation T2 (butter) presented the lowest overrun, a phenomenon consistent with its comparatively weaker fat network, as corroborated by lower values of the storage (G’) and loss moduli (G’’) in rheological frequency sweep tests (Figure 2). These rheological findings indicate diminished structural strength and elastic behavior, which compromise the product’s ability to trap and stabilize air bubbles, thus limiting overrun [12,21].
Moreover, the rheological profiles reveal a positive correlation between higher elastic modulus and increased overrun, emphasizing the role of fat-protein interactions and stabilizer systems in dictating air incorporation efficiency [1,22]. Stabilizers present in both the UHT cream and the ice cream base reduce excessive ice crystal growth by inhibiting water mobility and recrystallization, leading to a smoother texture and further aiding the stabilization of the aerated structure [14,23].
Consequently, the superior overrun observed in T3 reflects the technological advantages conferred by the integration of lipid stabilizers and complex emulsifier systems, which collectively optimize the viscoelastic properties of the ice cream matrix. This formulation strategy enhances the retention of incorporated air, improves creaminess and sensory perception, and contributes to extended shelf-life through increased storage stability [17,18]. Thus, the use of UHT cream enriched with stabilizers, in combination with a tailored rheological formulation, represents an effective approach for the production of premium ice cream products with enhanced structural and sensory qualities.
4.4. Melting Behavior
The melting behavior of ice cream constitutes a pivotal quality attribute, intimately linked to both its sensory perception and physicochemical stability, as it directly reflects the microstructural integrity of the frozen matrix and the interactions among ice crystals, fat networks, and serum phases [16,18]. Figure 4 presents the cumulative melting profiles of the four formulations over a 45-minute interval under rigorously controlled ambient conditions, with initial sample masses standardized to 100 g to enable valid comparative analyses of absolute melt loss and temporal melting kinetics [1].
Formulation T1, incorporating low-trans vegetable fat, exhibited the highest melting rate, losing approximately 63 g of mass (63%) over the test duration. This pronounced melt susceptibility can be ascribed to the intrinsic physicochemical characteristics of industrially modified vegetable fats, which generally display a fractionated triglyceride composition and possess less stable polymorphic crystalline structures compared to dairy fats [31]. Consequently, these fats exhibit diminished capacity for partial coalescence and the formation of an interconnected fat globule network during the freezing process, thereby compromising the mechanical rigidity and melt resistance of the ice cream matrix [18,20]. The limited formation of interglobular bridges results in a weaker three-dimensional fat network that inadequately immobilizes unfrozen water, accelerating melting kinetics [31].
Conversely, formulation T3, based on UHT cream, demonstrated the most robust melting resistance, with only about 13 g (13%) mass loss, indicating a highly cohesive and stable frozen structure. This enhanced performance is likely mediated by the denaturation of whey proteins induced during the ultra-high temperature treatment, which facilitates the formation of protein–fat aggregates [15,31]. These aggregates contribute to the reinforcement of the fat-protein matrix, effectively entrapping free water within the microstructure and mitigating phase separation during melting [14,17,31]. Additionally, the UHT process may alter emulsification dynamics, enhancing fat globule interface stability and favoring a more resilient network formation upon freezing [19,25].
The intermediate melting profiles observed for T2 (butter; ~50% melt) and T4 (fresh cream; ~46% melt) reflect their compositional and processing attributes. Butter, rich in short- and medium-chain saturated triglycerides, can form rigid crystalline networks; however, its structural contribution is highly dependent on emulsification efficiency and crystallization kinetics, factors that govern the extent of fat partial coalescence and network continuity [18]. Fresh cream, while retaining native emulsifying milk proteins such as caseins, undergoes minimal thermal treatment, which may limit protein denaturation and subsequent aggregate formation necessary for robust fat-protein network stabilization [20,22]. Moreover, variations in total solids and serum viscosity between fresh and UHT cream further influence matrix rheology and melting resistance [23,33].
Another relevant factor contributing to the superior melt resistance of T3 is its lower overrun, resulting in a denser microstructure with reduced air cell volume. The diminished air incorporation increases the thermal mass and reduces the specific surface area exposed to ambient temperature, thereby retarding heat transfer and melting rates ([14,22]. This attribute is especially desirable in premium or regionally targeted ice cream products intended for warm climates, where prolonged shape retention and slow melting are critical for consumer satisfaction and product differentiation [27,34].
In summary, the melting profiles elucidate the fundamental role of fat source composition, thermal processing, and microstructural organization in determining the melt stability of ice cream. The findings affirm that the structural functionality of protein-fat networks, modulated by ingredient characteristics and processing parameters, is paramount for controlling melting behavior, thereby influencing sensory attributes and shelf-life performance [14,35].
4.5. Color Determination
Color represents a critical sensory attribute in consumer evaluation and acceptance of ice cream products, as it establishes preliminary expectations regarding flavor profile and overall quality perception [14,36]. In this study, instrumental color measurement was conducted via reflectance colorimetry employing the CIE Lab* color space, which quantifies the three-dimensional color coordinates: lightness (L*), red-green axis (a*), and yellow-blue axis (b*), thus providing an objective and reproducible assessment of color characteristics. The resultant values are detailed in Table 2.
The consistently high L* values observed across all formulations are indicative of typical optical behavior in dairy-based colloidal systems, where the scattering of incident light is predominantly driven by fat globule dispersion and casein micelle interactions within the aqueous serum matrix [5,37]. Notably, treatment T3 (UHT cream) exhibited a statistically significant reduction in lightness (L* = 77.51), which may be attributed to the formation of early Maillard reaction products and other non-enzymatic browning intermediates during the intense thermal processing [2,27]. Such products can absorb light in the visible spectrum, leading to matrix darkening even in the absence of pronounced browning, although direct quantification of Maillard markers such as hydroxymethylfurfural (HMF) or furosine was not performed in this work [40,42]. It is therefore prudent to interpret this finding as a plausible but not definitively established effect, warranting further chemical analysis.
Concerning the a* coordinate, all formulations demonstrated slightly negative values, indicative of a subtle greenish tint. This observation aligns with previous reports on milk-based products where low-level chlorophyll derivatives and minor light scattering effects can induce such hue shifts, typically imperceptible to the human visual system [39,43]. T3 again presented the most negative a* value (-2.09), potentially reflecting microstructural modifications and pigment alterations resultant from UHT treatment, which affect light absorption and scattering [41]. However, given the low absolute magnitude and narrow variation range, these minor shifts in a* are unlikely to have a practical sensory impact without corroborating visual or spectrophotometric data.
The b* values were uniformly positive across samples, signifying a characteristic yellow coloration consistent with lipid-rich dairy matrices [41,43]. The butter-based formulation (T2) recorded the highest yellowness index (b* = 28.88), which is attributable primarily to the presence of lipophilic pigments such as β-carotene, naturally concentrated in the milk fat fraction during churning [41]. Additionally, the more intense yellow hue in T2 may be exacerbated by lower emulsification efficiency, resulting in larger fat globule clusters that enhance light absorption and reduce reflectance [14,19]. Conversely, the UHT cream sample (T3) exhibited a slightly diminished b* value (25.74), plausibly due to thermal degradation of carotenoids during the sterilization process, consistent with documented losses of these pigments under high heat [40,41].
Although pigment-specific analyses such as high-performance liquid chromatography (HPLC) or UV-Visible spectrophotometry were not incorporated in this study, the observed colorimetric trends conform to established literature concerning the impact of fat composition and thermal history on the optical properties of dairy-based frozen desserts [28,43]. It is important to acknowledge that the experimental design isolated the fat source variable; consequently, the interaction effects with other formulation components remain unexplored and merit future investigation through advanced physicochemical and sensory methodologies [22,36].
In summary, the colorimetric data indicate that fat source exerts a pronounced influence on the ice cream’s visual attributes, particularly lightness (L*) and yellowness (b*). These variations reflect intrinsic differences in lipid composition, thermal processing history, and pigment content of the raw materials. The observed light, slightly yellow-toned appearance across all formulations corresponds to consumer expectations for dairy-based frozen desserts, highlighting the strategic role of fat selection in defining the product’s final aesthetic appeal and potentially influencing market acceptance [14,41].
4.6. Texture Determination
The texture of ice cream is a pivotal quality attribute that profoundly influences consumer perception and overall product acceptability. This attribute emerges from the complex interplay among ice crystals, fat globules, air cells, and the frozen serum matrix, which collectively determine the microstructure and mechanical integrity of the product [4,14]. Instrumental texture analysis provides objective quantification of critical mechanical parameters such as firmness, cohesiveness, and resistance to deformation, which closely correlate with sensory attributes including creaminess, hardness, and melt profile [3,22]. Understanding and controlling these parameters is essential for formulating ice creams that meet both technological requirements and consumer expectations.
In this study, the extrusion test was selected to evaluate ice cream firmness or hardness due to its superior sensitivity in mimicking the consumer’s scooping action compared to the conventional cone penetration test [4,19]. Furthermore, extrusion testing engages a larger sample volume, enhancing representativeness in heterogeneous semi-solid systems such as ice cream, wherein the tridimensional structure results from the interaction between air cells, fat crystal networks, and ice crystals [22,27]. This methodological advantage allows for a more comprehensive assessment of structural nuances that critically influence rheological and sensory outcomes.
Statistical analysis revealed significant differences (p < 0.05) in firmness across formulations (Figure 5). The butter-based formulation (T2) exhibited the highest maximum extrusion force, indicative of a more rigid and mechanically robust matrix, followed sequentially by fresh cream (T4), UHT cream (T3), and vegetable fat (T1), which presented the lowest firmness values. These differences can be attributed to the distinct lipid composition and crystallization behaviors inherent to each fat source [14,25]. Butter, characterized by a high solid fat content at freezing temperatures (~–18 °C) and polymorphic fat crystallization, forms a stable crystalline network that restricts water mobility and enhances mechanical strength [4], thus reinforcing the ice cream’s structural integrity.
Additionally, the butter formulation demonstrated the lowest overrun, which correlates with increased density and fewer air-induced structural discontinuities, thereby elevating resistance to deformation [22,27]. Conversely, the vegetable fat-based formulation, although plastically stable, possesses a reduced solid fat fraction at freezer temperatures and contains emulsifiers that impede partial coalescence of fat globules, limiting the formation of aggregated fat structures essential for mechanical reinforcement [14,25]. Consequently, this formulation yields a softer texture with higher deformability under compressive forces.
Intermediate firmness values observed for UHT (T3) and fresh cream (T4) formulations likely reflect differences induced by thermal processing. UHT treatment causes protein denaturation, which can compromise fat emulsification and water retention capacity, resulting in diminished matrix stability and mechanical strength [19,29]. Fresh cream, retaining native milk proteins, promotes enhanced stabilization of the continuous phase and facilitates formation of a more cohesive fat network, thus delivering slightly higher firmness despite its lower fat content relative to butter [32].
In conclusion, the fat source fundamentally governs the mechanical and sensory characteristics of ice cream through its fatty acid profile, crystallization behavior, emulsification dynamics, and influence on air incorporation. The extrusion test proved to be a robust and discriminating analytical tool for elucidating structural variations among formulations, supporting its application in the rational design and optimization of ice cream texture tailored to consumer preferences [4,22].
4.7. Nutritional Composition
The comprehensive nutritional profiling of the ice cream formulations (T1, T2, T3, and T4), detailed in Table 3, underscores significant variability in macronutrient distribution and lipid composition, parameters that are paramount in both product development and nutritional risk assessment [19,26,46]. The precise quantification of energy content, protein, carbohydrates, total and saturated fats, alongside sodium levels, enables a multidimensional evaluation of the formulations’ nutritional quality and their alignment with dietary recommendations and public health policies [48].
Energy values were distinctly heterogeneous, with formulation T2 demonstrating the lowest caloric density (117.5 kcal/100 g), contrasted by T3’s highest caloric load (126.4 kcal/100 g). This variance reflects the differential contributions of lipid and protein fractions, the predominant macronutrients influencing energy density in frozen dairy matrices [7,18]. The carbohydrate content across samples remained generally consistent, save for T3, which exhibited a relatively elevated carbohydrate concentration (23.3 g/100 g). This anomaly is plausibly linked to the inclusion of polysaccharide-based stabilizers or other carbohydrate-rich additives, commonly utilized in UHT cream formulations to modulate rheology and shelf-life [45,49].
Protein quantification further delineated the formulations, with T3 displaying a notable increase (4.8 g/100 g) relative to the other samples (3.2–3.3 g/100 g), corroborating the elevated protein content characteristic of UHT-treated dairy creams vis-à-vis butter or plant-based fats [18,50]. The nutritional implications of heightened protein levels extend beyond caloric contribution, potentially enhancing satiety responses and supporting anabolic processes, particularly relevant for demographic groups with elevated protein requirements such as the elderly, athletes, or clinical populations [51,52]. A pronounced divergence was observed in saturated fat content, a critical determinant in cardiovascular risk modulation [48,53]. The low-trans vegetable fat-based formulation (T1) exhibited the minimal saturated fat fraction (5.2 g/100 g), consistent with lipid profiles dominated by unsaturated fatty acids prevalent in plant-derived fats [51,53]. Conversely, T4 (fresh cream) manifested the highest saturated fat concentration (27.5 g/100 g), reflective of the intrinsic fatty acid composition of full-fat dairy lipids, which include significant proportions of palmitic and myristic acids, both implicated in lipid metabolism and cardiovascular health outcomes [1,54]. Intermediate saturated fat levels in T2 (butter) and T3 (UHT cream) (7.3 and 8.3 g/100 g, respectively) reflect compositional nuances influenced by moisture content, processing modalities, and fat crystallization behavior [19] (Marangoni, 2004.
Sodium concentration also varied significantly, with T3 presenting the highest level (77.6 mg/100 g), attributable to the incorporation of salt-containing stabilizers and preservatives often added to UHT cream formulations to ensure microbiological stability and texture retention [54]. In contrast, T4’s sodium content (49.7 mg/100 g) was the lowest, aligning with its composition of minimally processed dairy devoid of additive inclusion [1,22]. Given the global emphasis on sodium reduction strategies to mitigate hypertension and cardiovascular disease risk [47,48], these findings emphasize the criticality of ingredient and process selection in product formulation.
The utilization of advanced nutritional software tools facilitated precise compositional analysis and enabled iterative formulation adjustments to meet stringent regulatory and health-oriented targets [19,55]. This methodological integration exemplifies the intersection of food science and nutritional epidemiology, addressing the contemporary challenge of balancing sensory attributes, product functionality, and health promotion [14,52]. Collectively, the comparative nutritional insights derived from these formulations substantiate the pivotal role of fat source selection in optimizing ice cream formulations for targeted consumer groups, aligning product innovation with evolving nutritional paradigms and market demands [39,56].
5. Conclusions
This study clearly demonstrated that the choice of fat source plays a crucial role in shaping the structural and physical properties of ice cream during maturation and in the final product. The different fats tested—ranging from low-trans vegetable fat to traditional dairy fats like butter and creams—uniquely influence emulsion stability, texture, and melt resistance. Ice creams formulated with low-trans vegetable fat stood out for their lighter texture and greater air incorporation, resulting in a softer, more pleasant mouthfeel. In contrast, formulations using butter and dairy creams exhibited greater firmness and melting resistance, qualities highly valued for a classic ice cream sensory experience. These findings deepen our understanding of the complex interactions between fat type and ice cream structure, paving the way for innovative formulations that combine high quality, superior physical performance, and consumer satisfaction. Ultimately, this work advances ice cream technology by offering strategic formulation options tailored to diverse market demands and sensory preferences.
Author Contributions
The following statements should be used “Conceptualization, Paulo Santos and Suzana Lannes; methodology, Paulo Santos and Suzana Lannes; validation, Paulo Santos and Suzana Lannes.; formal analysis, Paulo Santos ; investigation, Paulo Santos; resources, Suzana Lannes; data curation, Paulo Santos, Cristina Suzuki; writing—original draft preparation, Paulo Santos; writing—review and editing, , Paulo Santos, Cristina Suzuki, Suzana Lannes; visualization, Paulo Santos, Cristina Suzuki, Suzana Lannes supervision, Paulo Santos, Suzana Lannes.; project administration, Paulo Santos, Suzana Lannes; funding acquisition, Paulo Santos, Suzana Lannes. All authors have read and agreed to the published version of the manuscript.
Funding
This research received a scholarship from CNPq-National Council for Scientific and Technological Development—Brazilian Government.
Data Availability Statement
The data presented in this article will be openly available from the author upon request.
Acknowledgments
The authors are thankful for the financial support provided by CAPES- National Council for Scientific and Technological Development, CNPq-National Council for Scientific and Technological Development, and FAPESP- São Paulo State Research Support Foundation, from the Brazilian and São Paulo Governments.
Conflicts of Interest
The authors declare that there are no conflicts of interest regarding the publication of this article.
References
- Goff, H. D. Ice Cream and Frozen Desserts: product types. Encyclopedia Of Dairy Sciences, [S.l.], p. 498-503, 2022. Elsevier. Disponível em, Acesso em: [data]. [CrossRef]
- Clarke, C. The Science of Ice Cream. 2. ed. Cambridge, UK: Royal Society of Chemistry, 2012.
- Muse, M. R.; Hartel, R. W. Ice cream structural elements that affect melting rate and hardness. Journal of Dairy Science, v. 87, n. 1, p. 1–10, 2004.
- Marshall, R. T.; Goff, H. D.; Hartel, R. W. Ice Cream. 6. ed. Springer, 2003.
- Szkolnicka, K.; Dmytrow, I.; Mituniewicz-Malek, A. Buttermilk ice cream—New method for buttermilk utilization. Food Science & Nutrition, v. 8, n. 3, p. 1461-1470, 2020.
- Tharp, B. W.; et al. Basic factors affecting ice cream melting resistance. Journal of Dairy Science, v. 81, n. 1, p. 1–10, 1998.
- Fredrick, E.; Walstra, P.; Dewettinck, K. Factors governing partial coalescence in oil-in-water emulsions. Advances in Colloid and Interface Science, v. 153, n. 1–2, p. 30–42, 2010.
- Szkolnicka, K.; et al. Application of buttermilk in ice cream production: Influence on physical properties and sensory characteristics. Foods, v. 9, n. 3, p. 304, 2020.
- Sharma, R.; et al. Buttermilk: Processing, properties, and uses. Food Reviews International, v. 29, n. 3, p. 259–272, 2013.
- Deeth, H. C.; Lewis, M. J. High Temperature Processing of Milk and Milk Products. John Wiley & Sons, 2017.
- Walstra, P.; Wouters, J. T. M.; Geurts, T. J. Dairy Science and Technology. CRC Press, 2006.
- Brasil. Resolução da Diretoria Colegiada—RDC nº 713, de 1º de julho de 2022. Requisitos sanitários dos gelados comestíveis e dos preparados para gelados comestíveis. Diário Oficial da União, nº 126, 6 jul. 2022.
- Bolliger, S.; Goff, H. D.; Tharp, B. W. Correlation between colloidal properties of ice cream mix and ice cream. International Dairy Journal, v. 10, p. 303–309, 1999.
- Goff, H. D.; Hartel, R. W. Ice Cream. 7. ed. Springer, 2013. [CrossRef]
- Núcleo De Estudos E Pesquisas Em Alimentação—NEPA, UNICAMP. Tabela Brasileira De Composição De Alimentos—TACO. 4ª edição revisada e ampliada. Campinas, SP, Brasil, 2011. 161 p.
- Brazmi, A.; Launay, B.; Cuvelier, G.; Relkin, P. Impact of crystalline milk fat on rheological properties of ice cream mix emulsions during aging time at 4ºC. Journal of Texture Studies, v. 39, n. 4, p. 309–325, 2008.
- Lannes, S. C. S. Rheology as a Tool for Food Development. In: TORRES PÉREZ, M. D. (Org.). Advances in rheology research. Hauppauge, USA: Nova Science Publishers, 2017. v. 1, p. 289–308.
- Santos, P. H. S.; Lannes, S. C. S. Application of organogel like structured system as an alternative for reducing saturated fatty acid and replacing fat in milk ice cream. Journal of Food Processing and Preservation, v. 1, p. 2022; 00: e16932, 2022. [Google Scholar]
- Patmore, J. V.; Goff, H. D.; Fernandes, S. Cryo-gelation of galactomannans in ice cream model systems. Food Hydrocolloids, v. 17, p. 161–169, 2003.
- Freire, D. O.; Wu, B. Q.; Hartel, R. W. Effects of structural attributes on the rheological properties of ice cream and melted ice cream. Journal Of Food Science, v. 85, n. 11, p. 3885–3898, 2020. [CrossRef]
- Bugeat, S.; Perez, J.; Briard-Bion, V.; Pradel, P.; Ferlay, A.; Bourgaux, C.; Lopez, C. Unsaturated fatty acid enriched vs. control milk triacylglycerols: Solid and liquid TAG phases examined by synchrotron radiation X-ray diffraction coupled with DSC. Food Research International, v. 67, p. 91–101, 2015.
- Milliatti, M. C.; Lannes, S. C. S. Impact of stabilizers on the rheological properties of ice creams. Ciência e Tecnologia de Alimentos, v. 38, p. 733–739, 2018. [CrossRef]
- Schramm, G. Rheology and Rheometry: Theoretical and Practical Foundations. Carl Hanser Verlag, 2006.
- Granger, C.; Barey, P.; Veschambre, P.; Cansell, M. Physicochemical behavior of oil-in-water emulsions: influence of milk protein mixtures, glycerol ester mixtures and fat characteristics. Colloids and Surfaces B: Biointerfaces, v. 42, p. 235–243, 2005.
- Akbari, M.; Eskandari, M. H.; Davoudi, Z. Application and functions of fat replacers in full fat ice cream: A review. Trends in Food Science & Technology, v. 86, p. 34–40, 2019. [CrossRef]
- Goff, H. D. Formation and stabilization of structure in ice cream and related products. Current Opinion in Colloid & Interface Science, v. 7, n. 5-6, p. 432–437, 2002. [CrossRef]
- Goff, H. D. Colloidal aspects of ice cream—a review. International Dairy Journal, v. 7, n. 5, p. 363–373, 1997. [CrossRef]
- Marangoni, A. G.; Garti, N. Edible oleogels: Structure and health implications. AOCS Press, 2011.
- Akalin, U. S.; Karagözlü, C.; Ünal, G. Rheological properties of reduced-fat and low-fat frozen desserts containing whey protein isolate and inulin. European Food Research and Technology, v. 227, n. 3, p. 889–895, 2008. [CrossRef]
- Al, M. , Ersoz, F.; Ozaktas, T.; Turkanoğlu-Özcelik, U.; Kucukcetin, U. Comparison of effects of transglutaminase addition to milk and ice cream mix on ice cream properties. International Dairy Journal, v. 73, n. 3, p. 578–584, 2020. [CrossRef]
- Kowalczyk, M.; Znamirowska, A.; Pawlos, M.; Buniowska, M. The Use of Olkuska Sheep Milk for the Production of Symbiotic Dairy Ice Cream. Animals, v. 12, n. 1, p. 70, 2022. [CrossRef]
- Moschopoulou, E.; Dermikos, D.; Zoidou, E. Ovine ice cream made with addition of whey protein concentrates of ovine-caprine origin. International Dairy Journal, v. 122, p. 105146, 2021. [CrossRef]
- Machado, M.; Freitas, A. C.; Pintado, M.; Gomes, A. M. Challenges in functional foods development based on bioactive lipids. In: Bioactive Lipids. Chapter 13, p. 321–337, 2023. [CrossRef]
- Vanwees, S. R.; Rankin, S. A.; Hartel, R. W. The microstructural, melting, rheological, and sensorial properties of high-overrun frozen desserts. Journal of Texture Studies, v. 51, n. 1, p. 92–100, 2020. [CrossRef]
- Soukoulis, C.; Lebesi, D.; Tzia, C. Enrichment of ice cream with dietary fibre: Effects on rheological properties, ice crystallisation and glass transition phenomena. Food Chemistry, v. 115, n. 2, p. 665–671, 2009. [CrossRef]
- Pimentel, T. C.; Oliveira, L. I. G.; Souza, R. C.; Magnani, M. Probiotic ice cream: A literature overview of the technological and sensory aspects and health properties. International Journal of Dairy Technology, v. 75, n. 1, p. 59–76, 2022. [CrossRef]
- Bala, S. M. Effect of forced convection roasting on physicochemical and antioxidant properties of whole grain maize (Zea mays L.) and optimisation of roasting conditions. 2016. Tese (Doutorado)—Stellenbosch University, Stellenbosch.
- Chung, H.-S.; et al. Changes in color parameters of corn kernels during roasting. Food Science and Biotechnology, v. 23, n. 6, p. 1829–1835, 2014.
- Goff, H. D. Formation and Stabilization of Structure in Ice Cream and Related Products. Comprehensive Reviews in Food Science and Food Safety, v. 1, n. 4, p. 108–122, 2002. [CrossRef]
- Martins, S. I. F. S.; Jongen, W. M. F.; Van Boekel, M. A. J. S. A review of Maillard reaction in food and implications to kinetic modelling. Trends in Food Science & Technology, v. 11, n. 9–10, p. 364–373, 2001. [CrossRef]
- Mcclements, D. J. Food Emulsions: Principles, Practices, and Techniques. 3rd ed. CRC Press, 2015.
- Mottram, D. S. Flavour compounds formed during the Maillard reaction. In: Thermally Generated Flavours, p. 73–91, 1994.
- Weber, F.; Hein, S. Color measurement in dairy products. In: Color in Food: Technological and Psychophysical Aspects, p. 309–328. CRC Press, 2016.
- Schramm, G. A Practical Approach to Rheology and Rheometry. 2. ed. Thermo Electron (Karlsruhe) GmbH, Karlsruhe, Germany, 2004.
- Pal, R. Rheology of simple and multiple emulsions. Current Opinion in Colloid & Interface Science, v. 16, n. 1, p. 41–60, 2011.
- Demonty, I.; et al. The effects of plant sterols on blood cholesterol levels: a meta-analysis of randomized controlled trials. British Journal of Nutrition, v. 102, n. 1, p. 84–92, 2009. [CrossRef]
- EFSA Panel on Dietetic Products, Nutrition and Allergies (NDA). Dietary reference values for nutrients: Summary report. EFSA Journal, v. 15, n. 4, e15121, 2017. [CrossRef]
- World Health Organization (WHO). Guideline: Sugars intake for adults and children. Geneva: WHO, 2015. Disponível em: https://www.who.int/publications/i/item/9789241549028. Acesso em: 12 jun. 2025.
- Thiel, A.; et al. Effect of stabilizers on the microstructure and texture of dairy products. International Dairy Journal, v. 61, p. 67–73, 2016. [CrossRef]
- Wang, Y.; et al. Protein enrichment of dairy-based desserts: Technological and nutritional aspects. Journal of Dairy Science, v. 104, n. 9, p. 9740–9753, 2021. [CrossRef]
- Liu, X.; et al. Dietary protein intake and human health. Nutrients, v. 13, n. 5, p. 1642, 2021. [CrossRef]
- Ferraz, J.; Pimenta, F. Protein intake and muscle mass preservation in aging populations: A review. Nutrients, v. 15, n. 4, p. 897, 2023. [CrossRef]
- Silva, M. S.; et al. Nutritional evaluation of dairy desserts: Macronutrient and micronutrient profiling. Journal of Food Composition and Analysis, v. 92, p. 103571, 2020. [CrossRef]
- Lopes, A. C.; et al. Influence of dairy fat sources on nutritional quality and sensory properties of ice cream. Food Science and Technology International, v. 30, n. 2, p. 123–137, 2024. [CrossRef]
- Liu, R.; et al. Application of nutrition analysis software in food product development. Food Control, v. 96, p. 74–82, 2019. [CrossRef]
- Qiu, C.; et al. Saturated fat and cardiovascular disease: An updated review. Progress in Cardiovascular Diseases, v. 70, p. 87–96, 2022. [CrossRef]
Figure 1.
Amplitude sweep determination of ice cream mixture before and after maturation. (a, c, e, and g) before maturation; (b, d, f, and h) after maturation. A and b—T1 (low trans vegetable fat), c and d—T2 (butter), e and f—T3 (UHT cream), g and h—T4 (fresh cream).
Figure 1.
Amplitude sweep determination of ice cream mixture before and after maturation. (a, c, e, and g) before maturation; (b, d, f, and h) after maturation. A and b—T1 (low trans vegetable fat), c and d—T2 (butter), e and f—T3 (UHT cream), g and h—T4 (fresh cream).
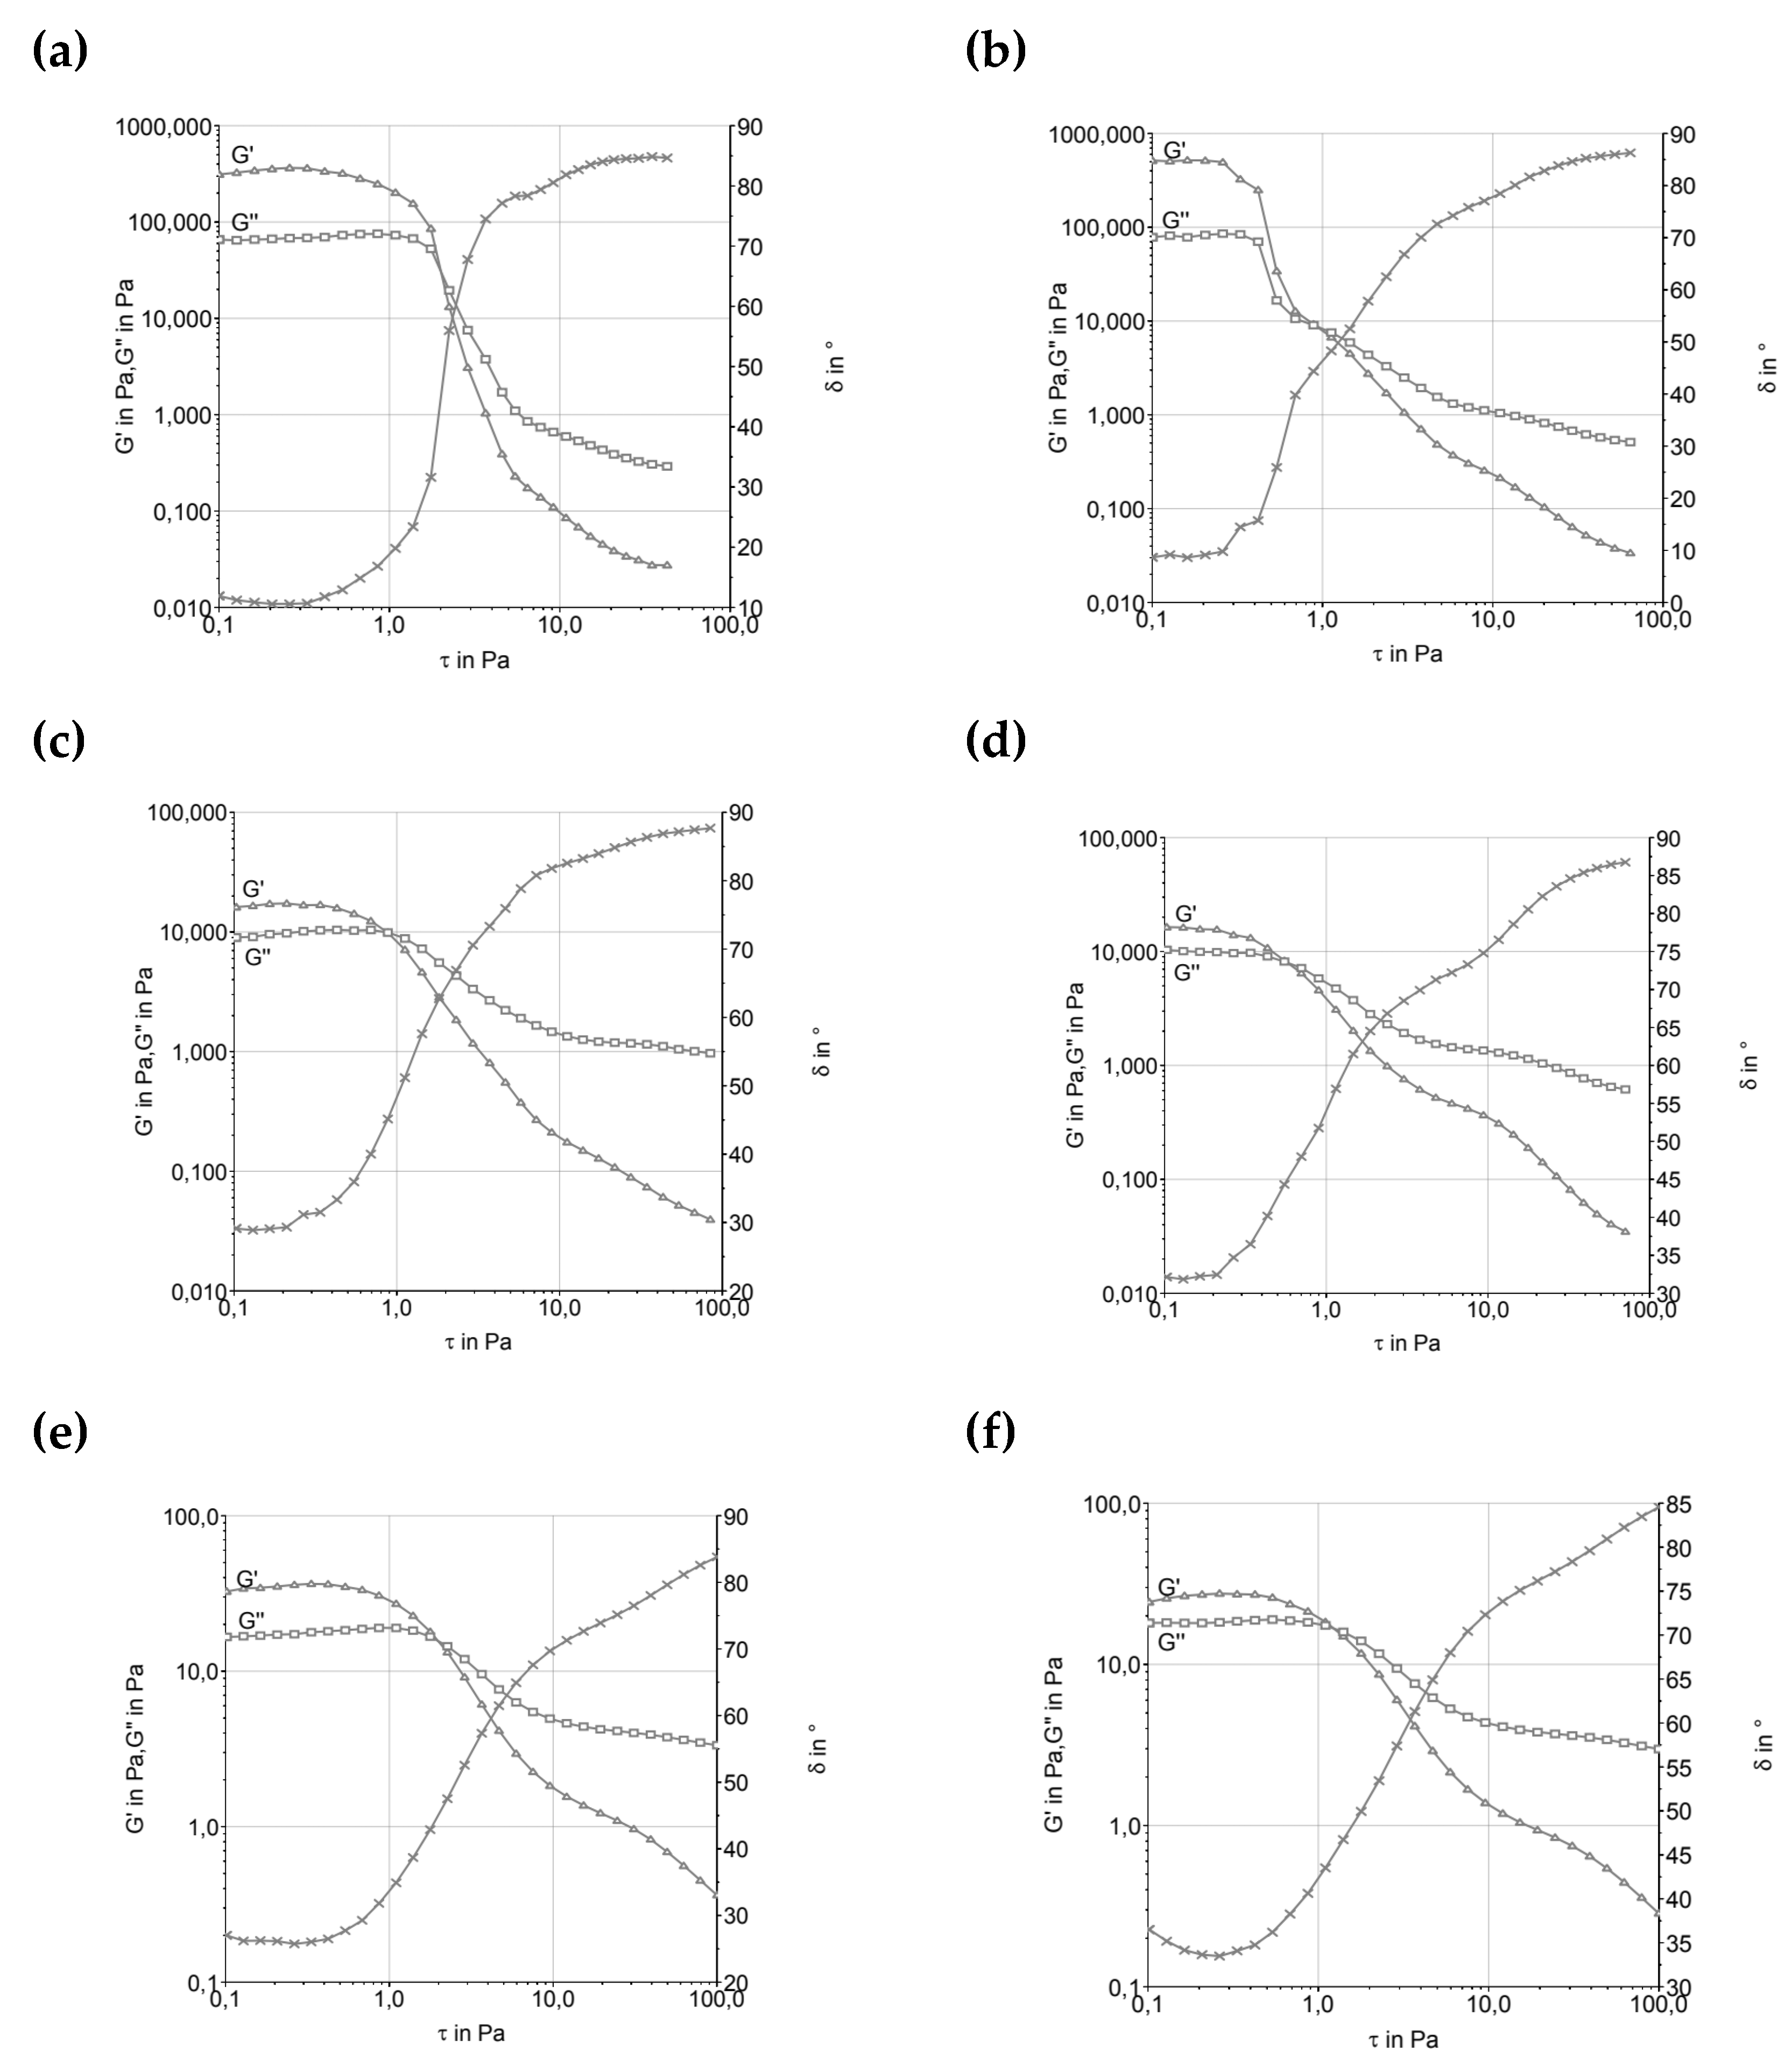
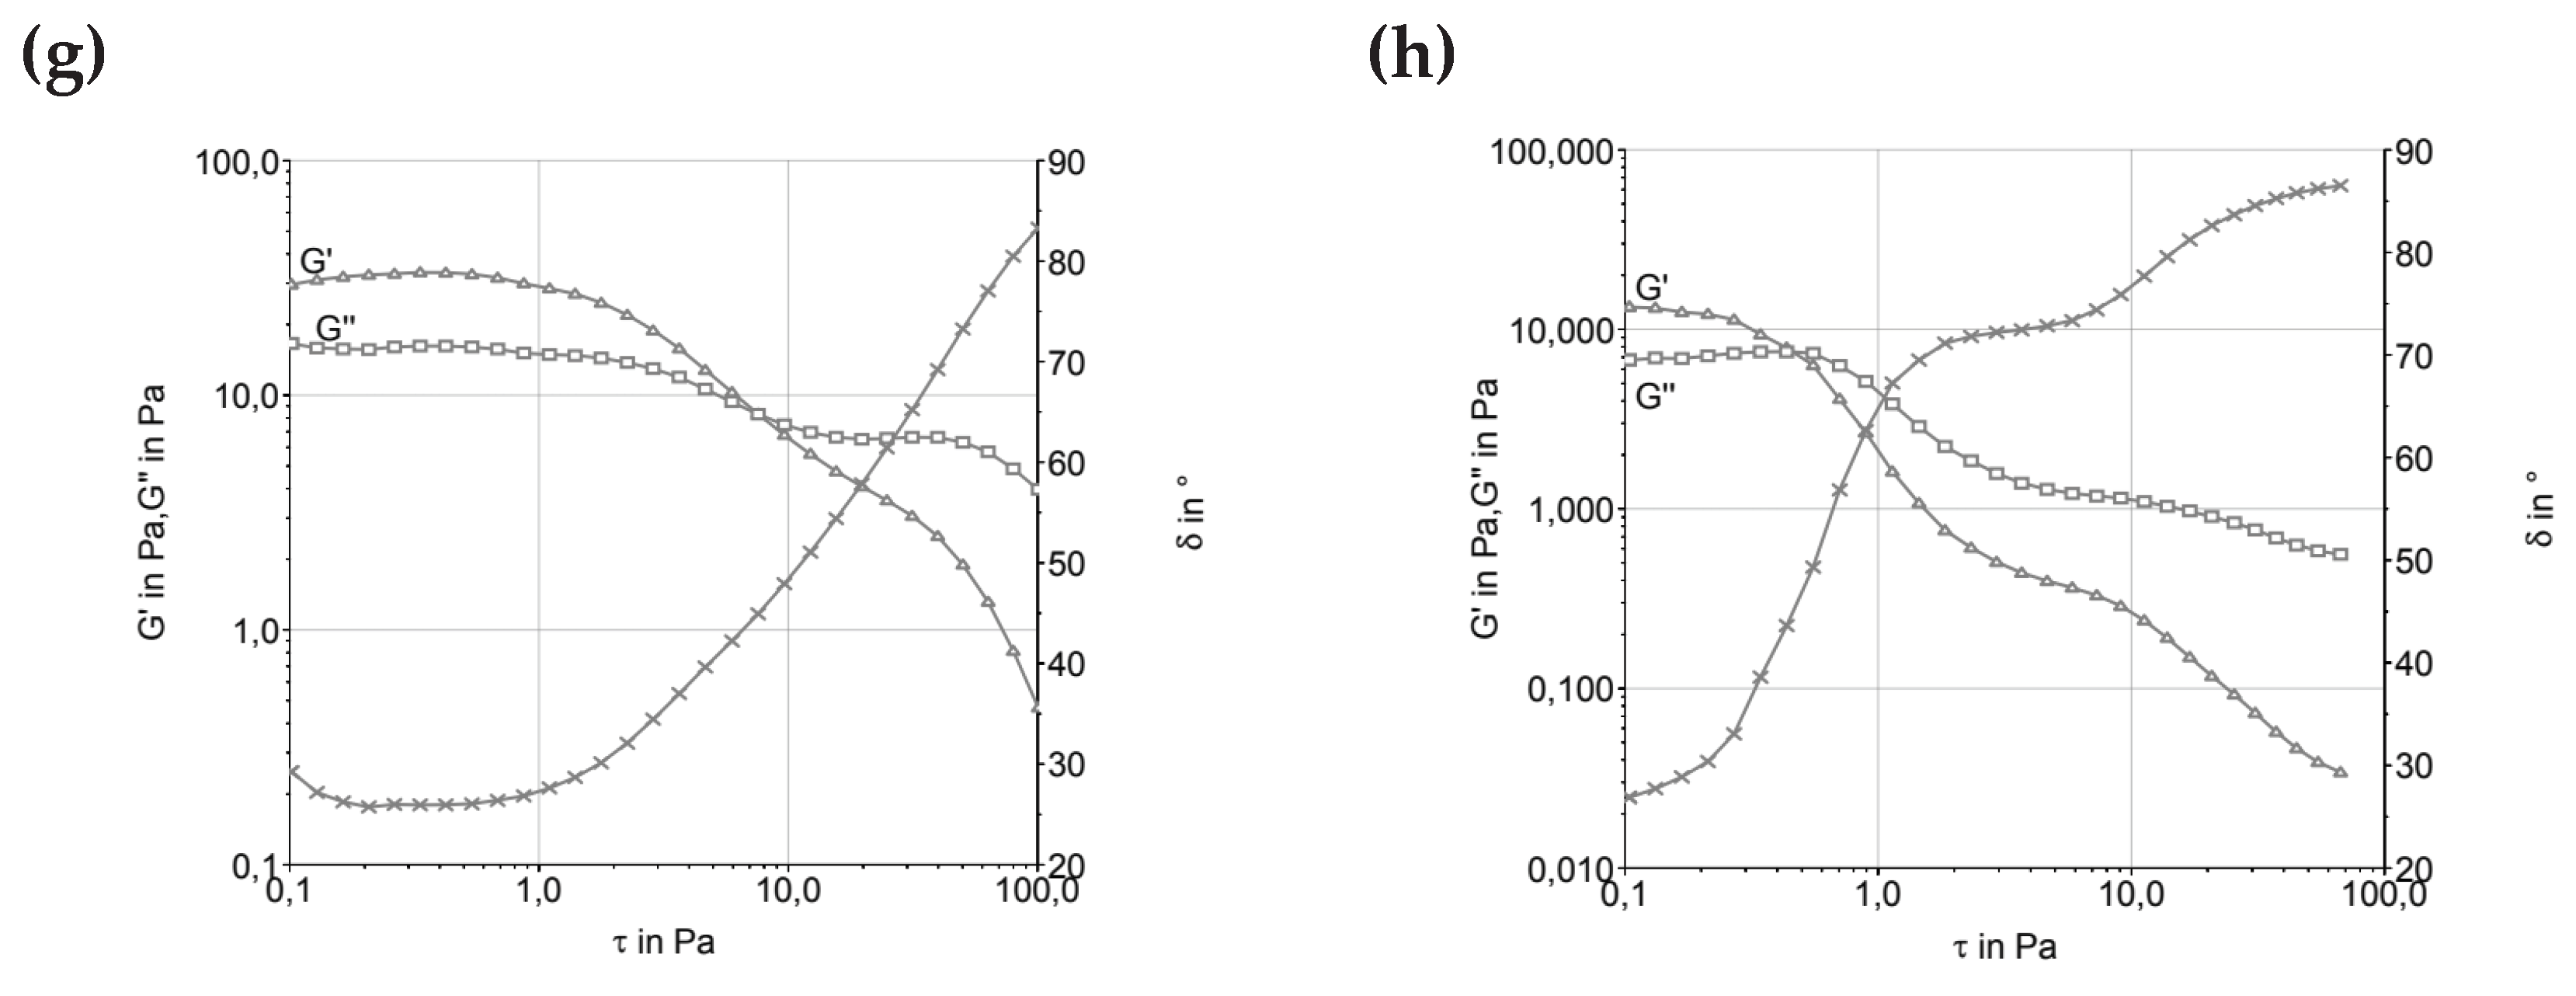
Figure 2.
Frequency sweep of ice cream formulations before and after maturation. (a, c, e, and g) before maturation; (b, d, f, and h) after maturation. A and b—T1 (low trans vegetable fat), c and d—T2 (butter), e and f—T3 (UHT cream), g and h—T4 (fresh cream).
Figure 2.
Frequency sweep of ice cream formulations before and after maturation. (a, c, e, and g) before maturation; (b, d, f, and h) after maturation. A and b—T1 (low trans vegetable fat), c and d—T2 (butter), e and f—T3 (UHT cream), g and h—T4 (fresh cream).
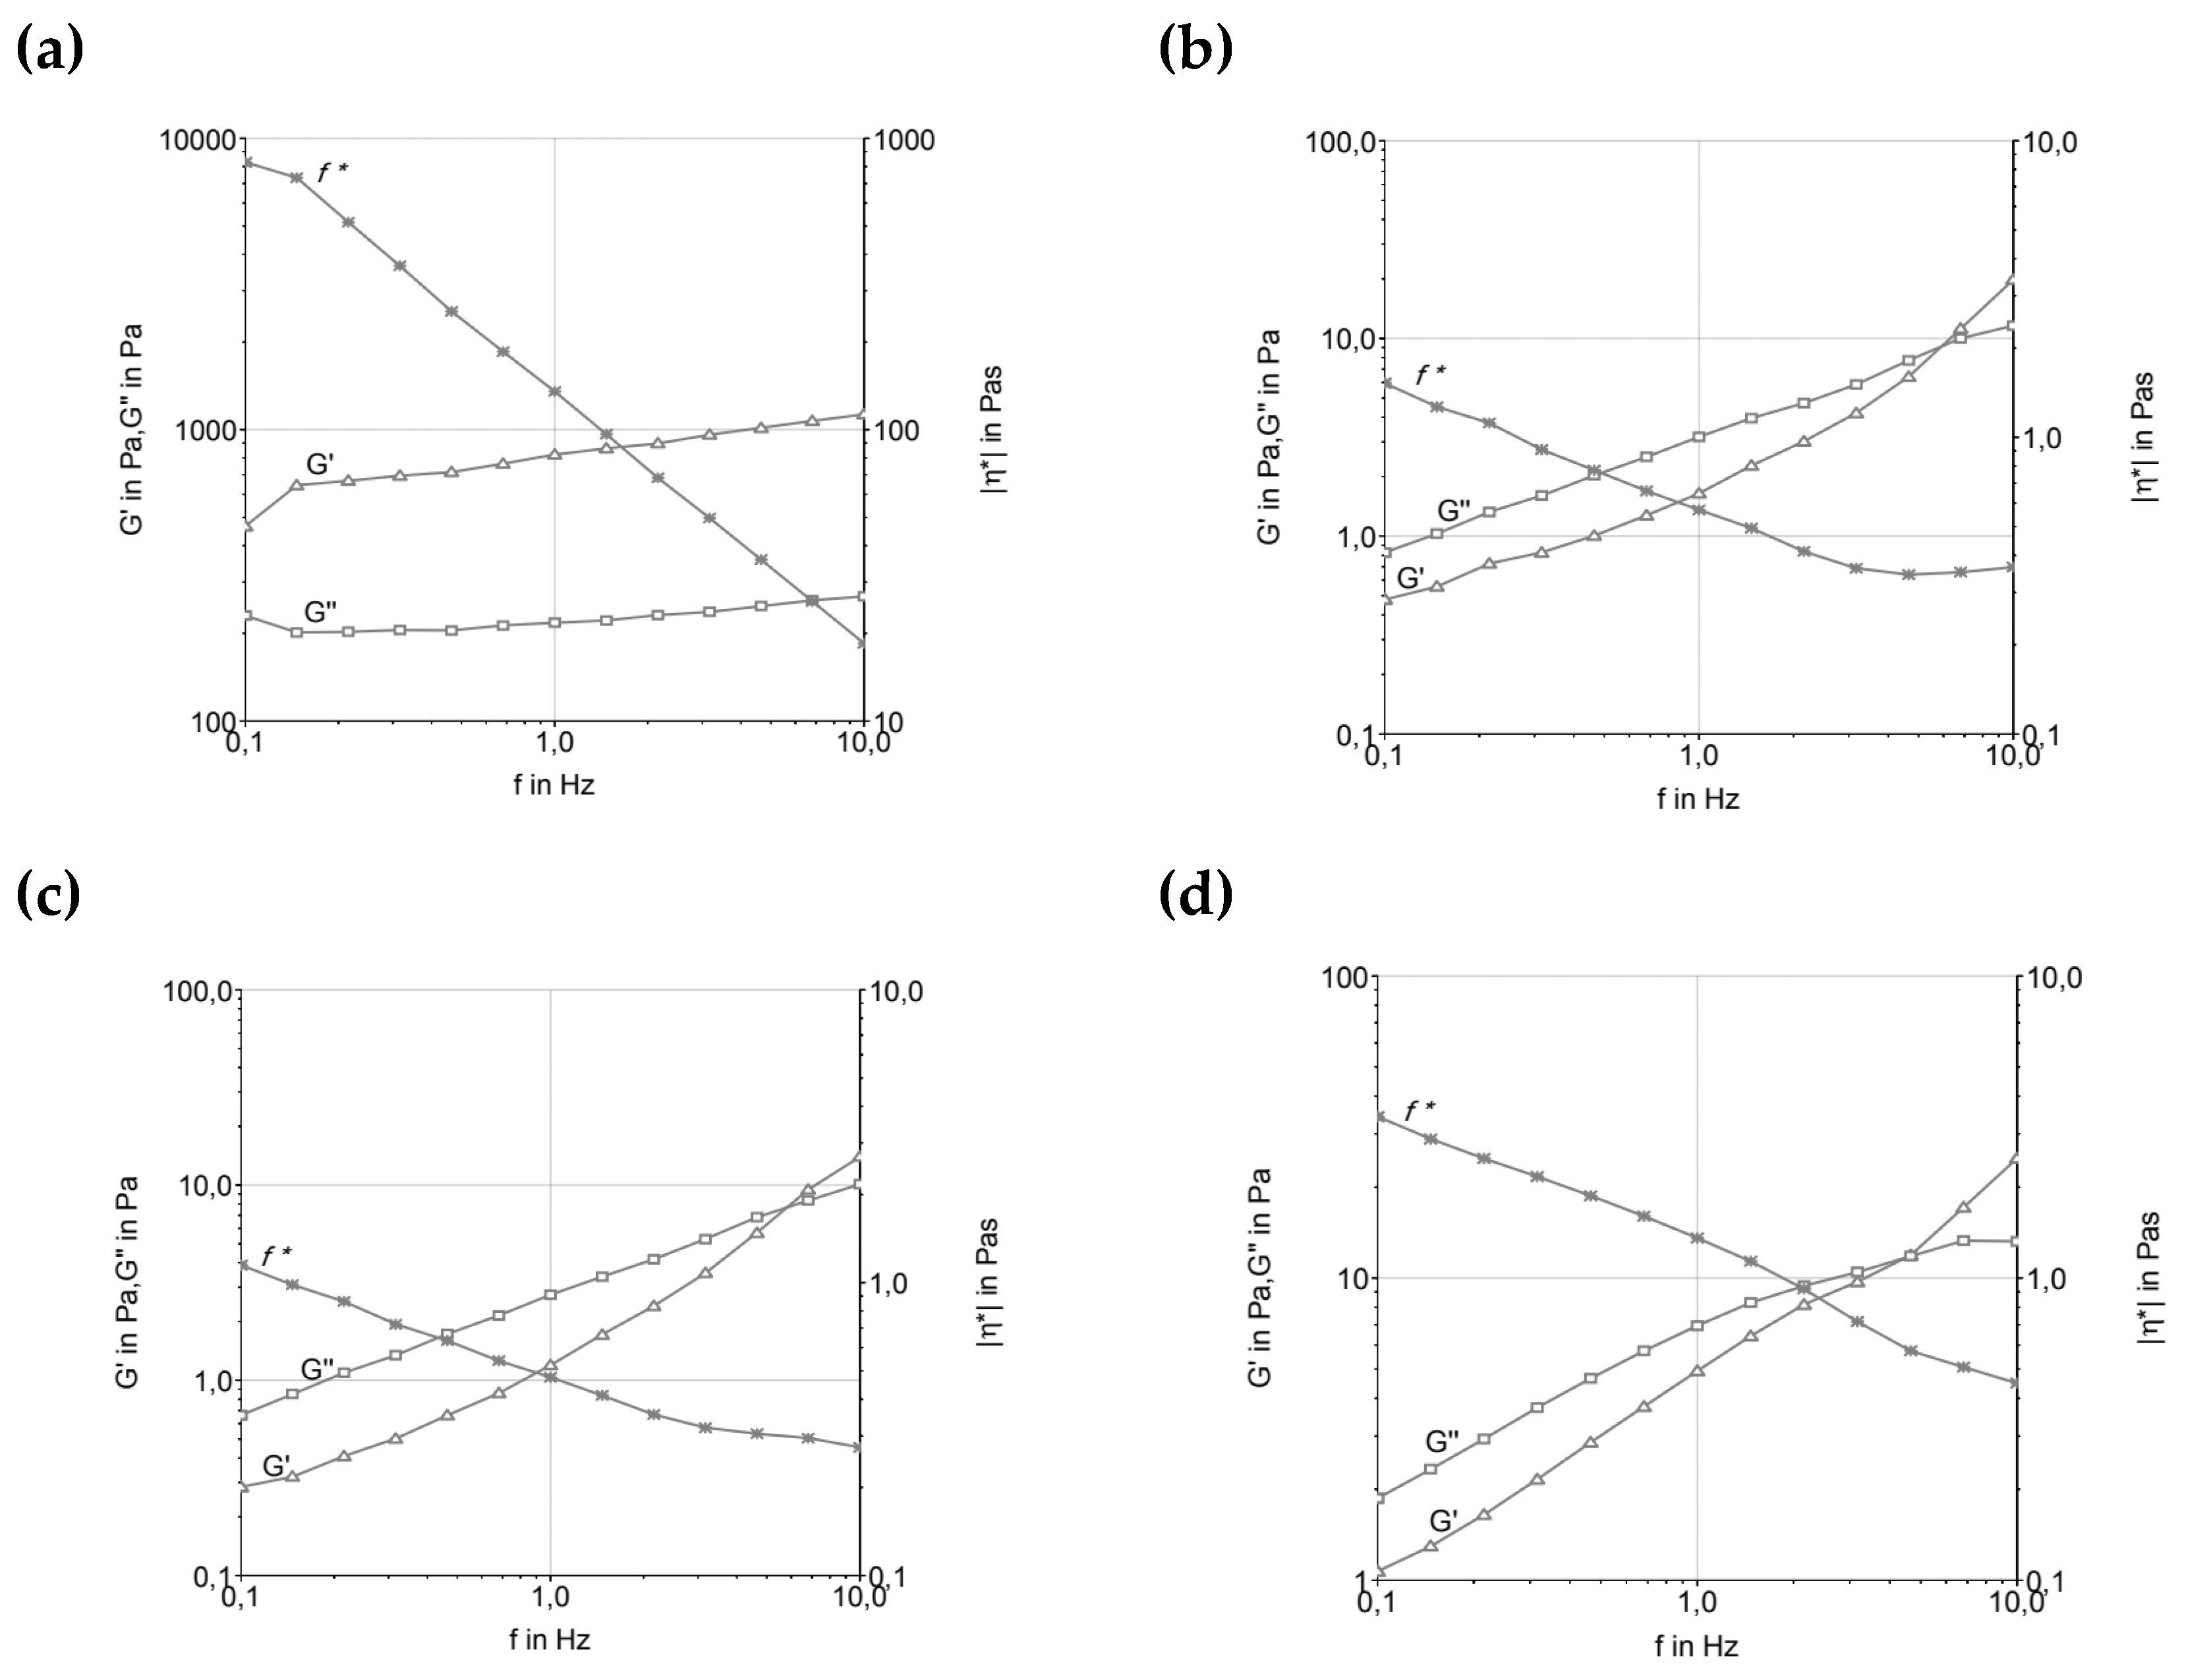
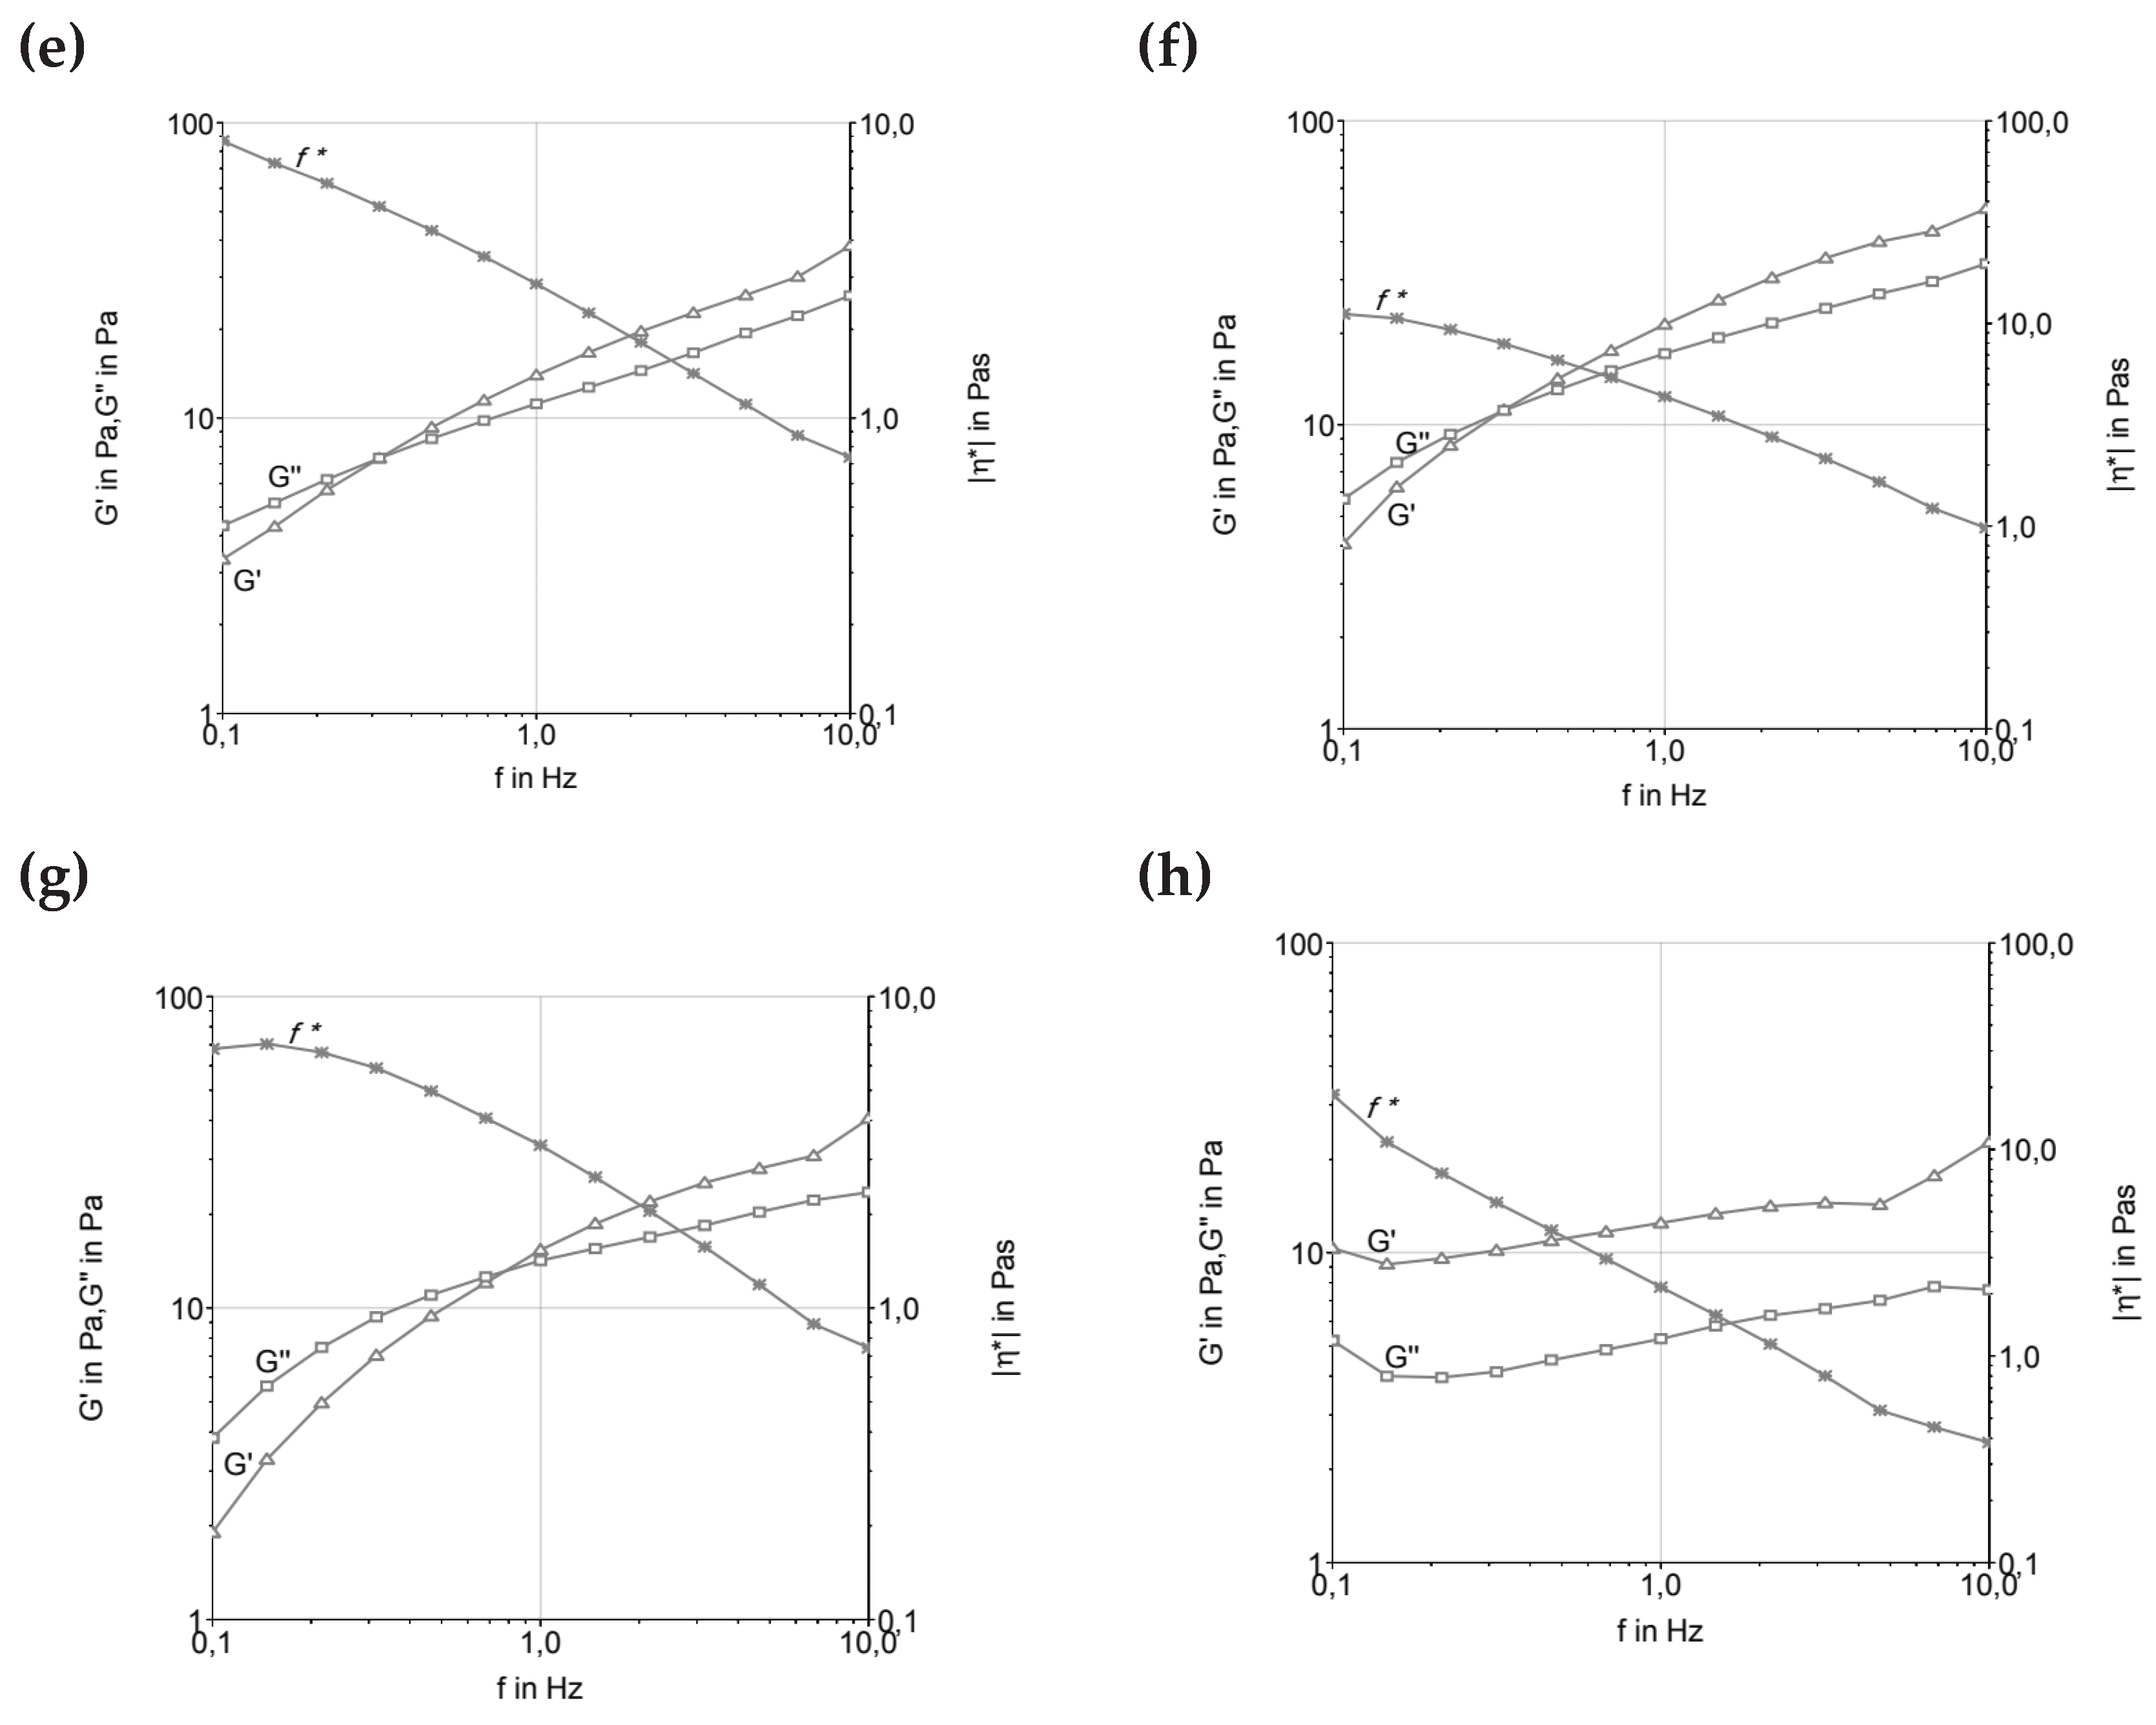
Figure 3.
Overrun percentage of the ice cream formulation—(T1) low trans vegetable fat, (T2) butter, (T3) UHT cream, (T4) fresh cream. The values in the columns that do not have the same letters are significantly different at p < 0,5 (n:3). The meaning is shown.
Figure 3.
Overrun percentage of the ice cream formulation—(T1) low trans vegetable fat, (T2) butter, (T3) UHT cream, (T4) fresh cream. The values in the columns that do not have the same letters are significantly different at p < 0,5 (n:3). The meaning is shown.
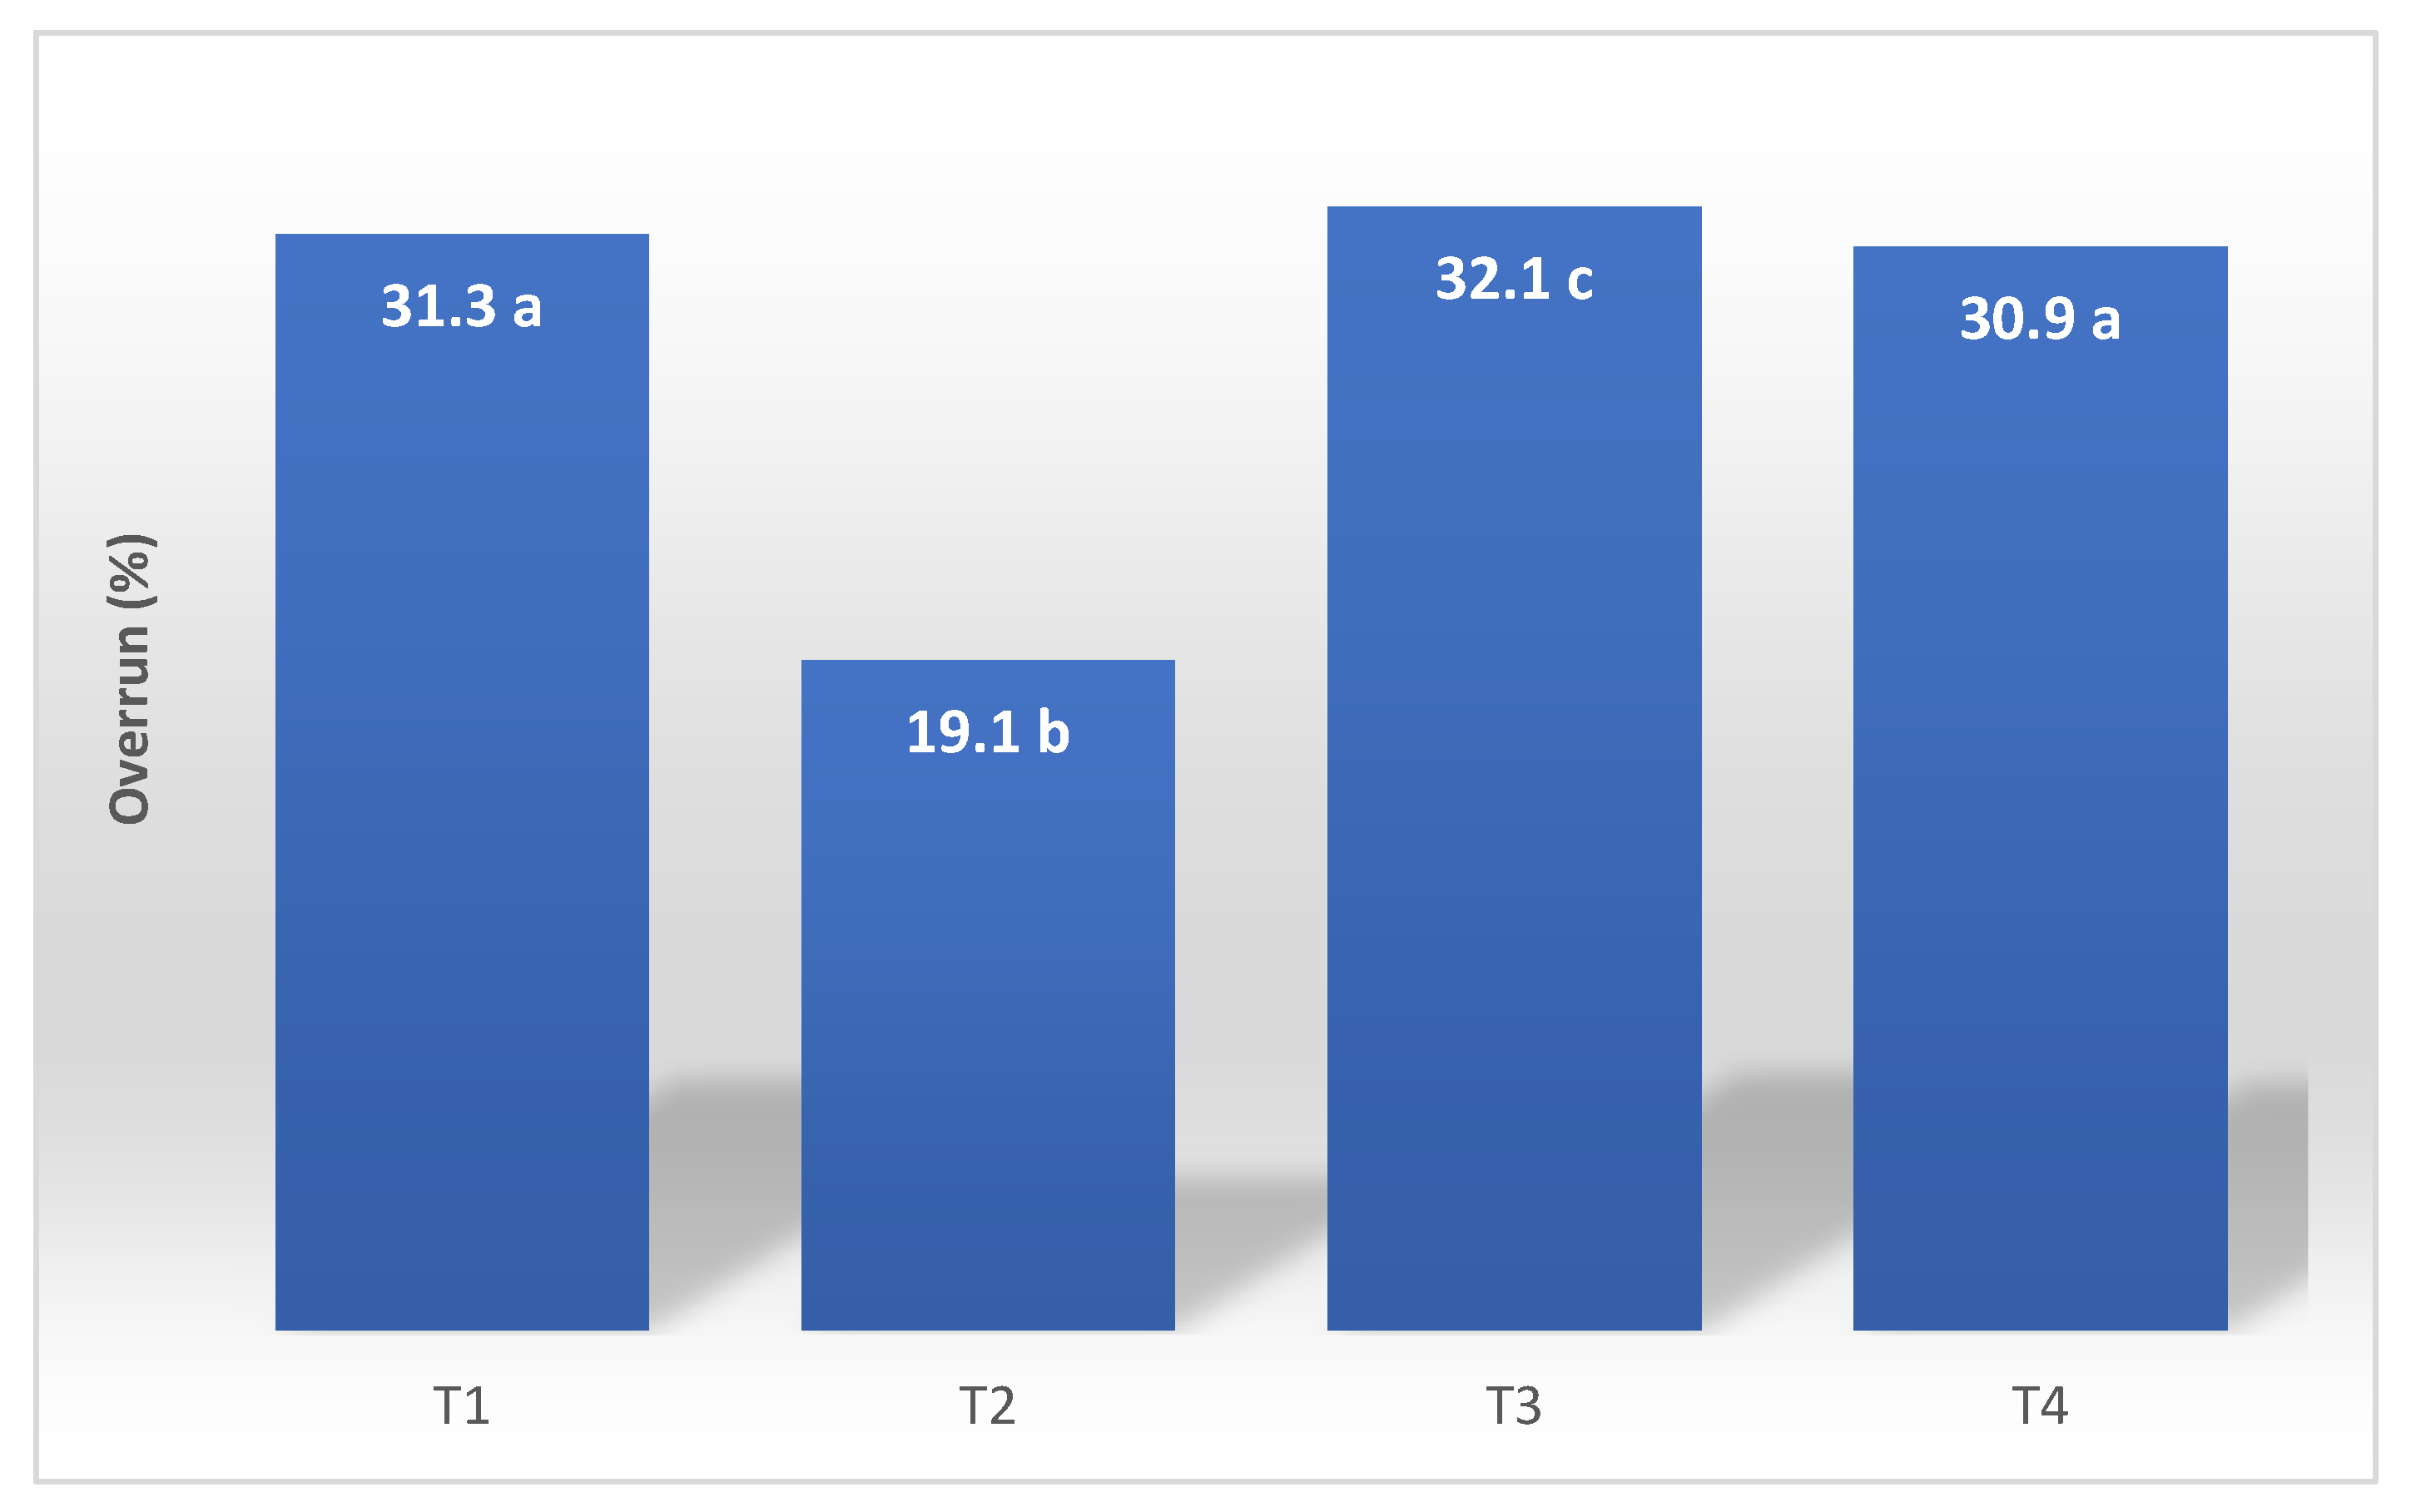
Figure 4.
The melting rate of the ice cream formulation—(T1) low trans vegetable fat, (T2) butter, (T3) UHT cream, (T4) fresh cream (n:3).
Figure 4.
The melting rate of the ice cream formulation—(T1) low trans vegetable fat, (T2) butter, (T3) UHT cream, (T4) fresh cream (n:3).
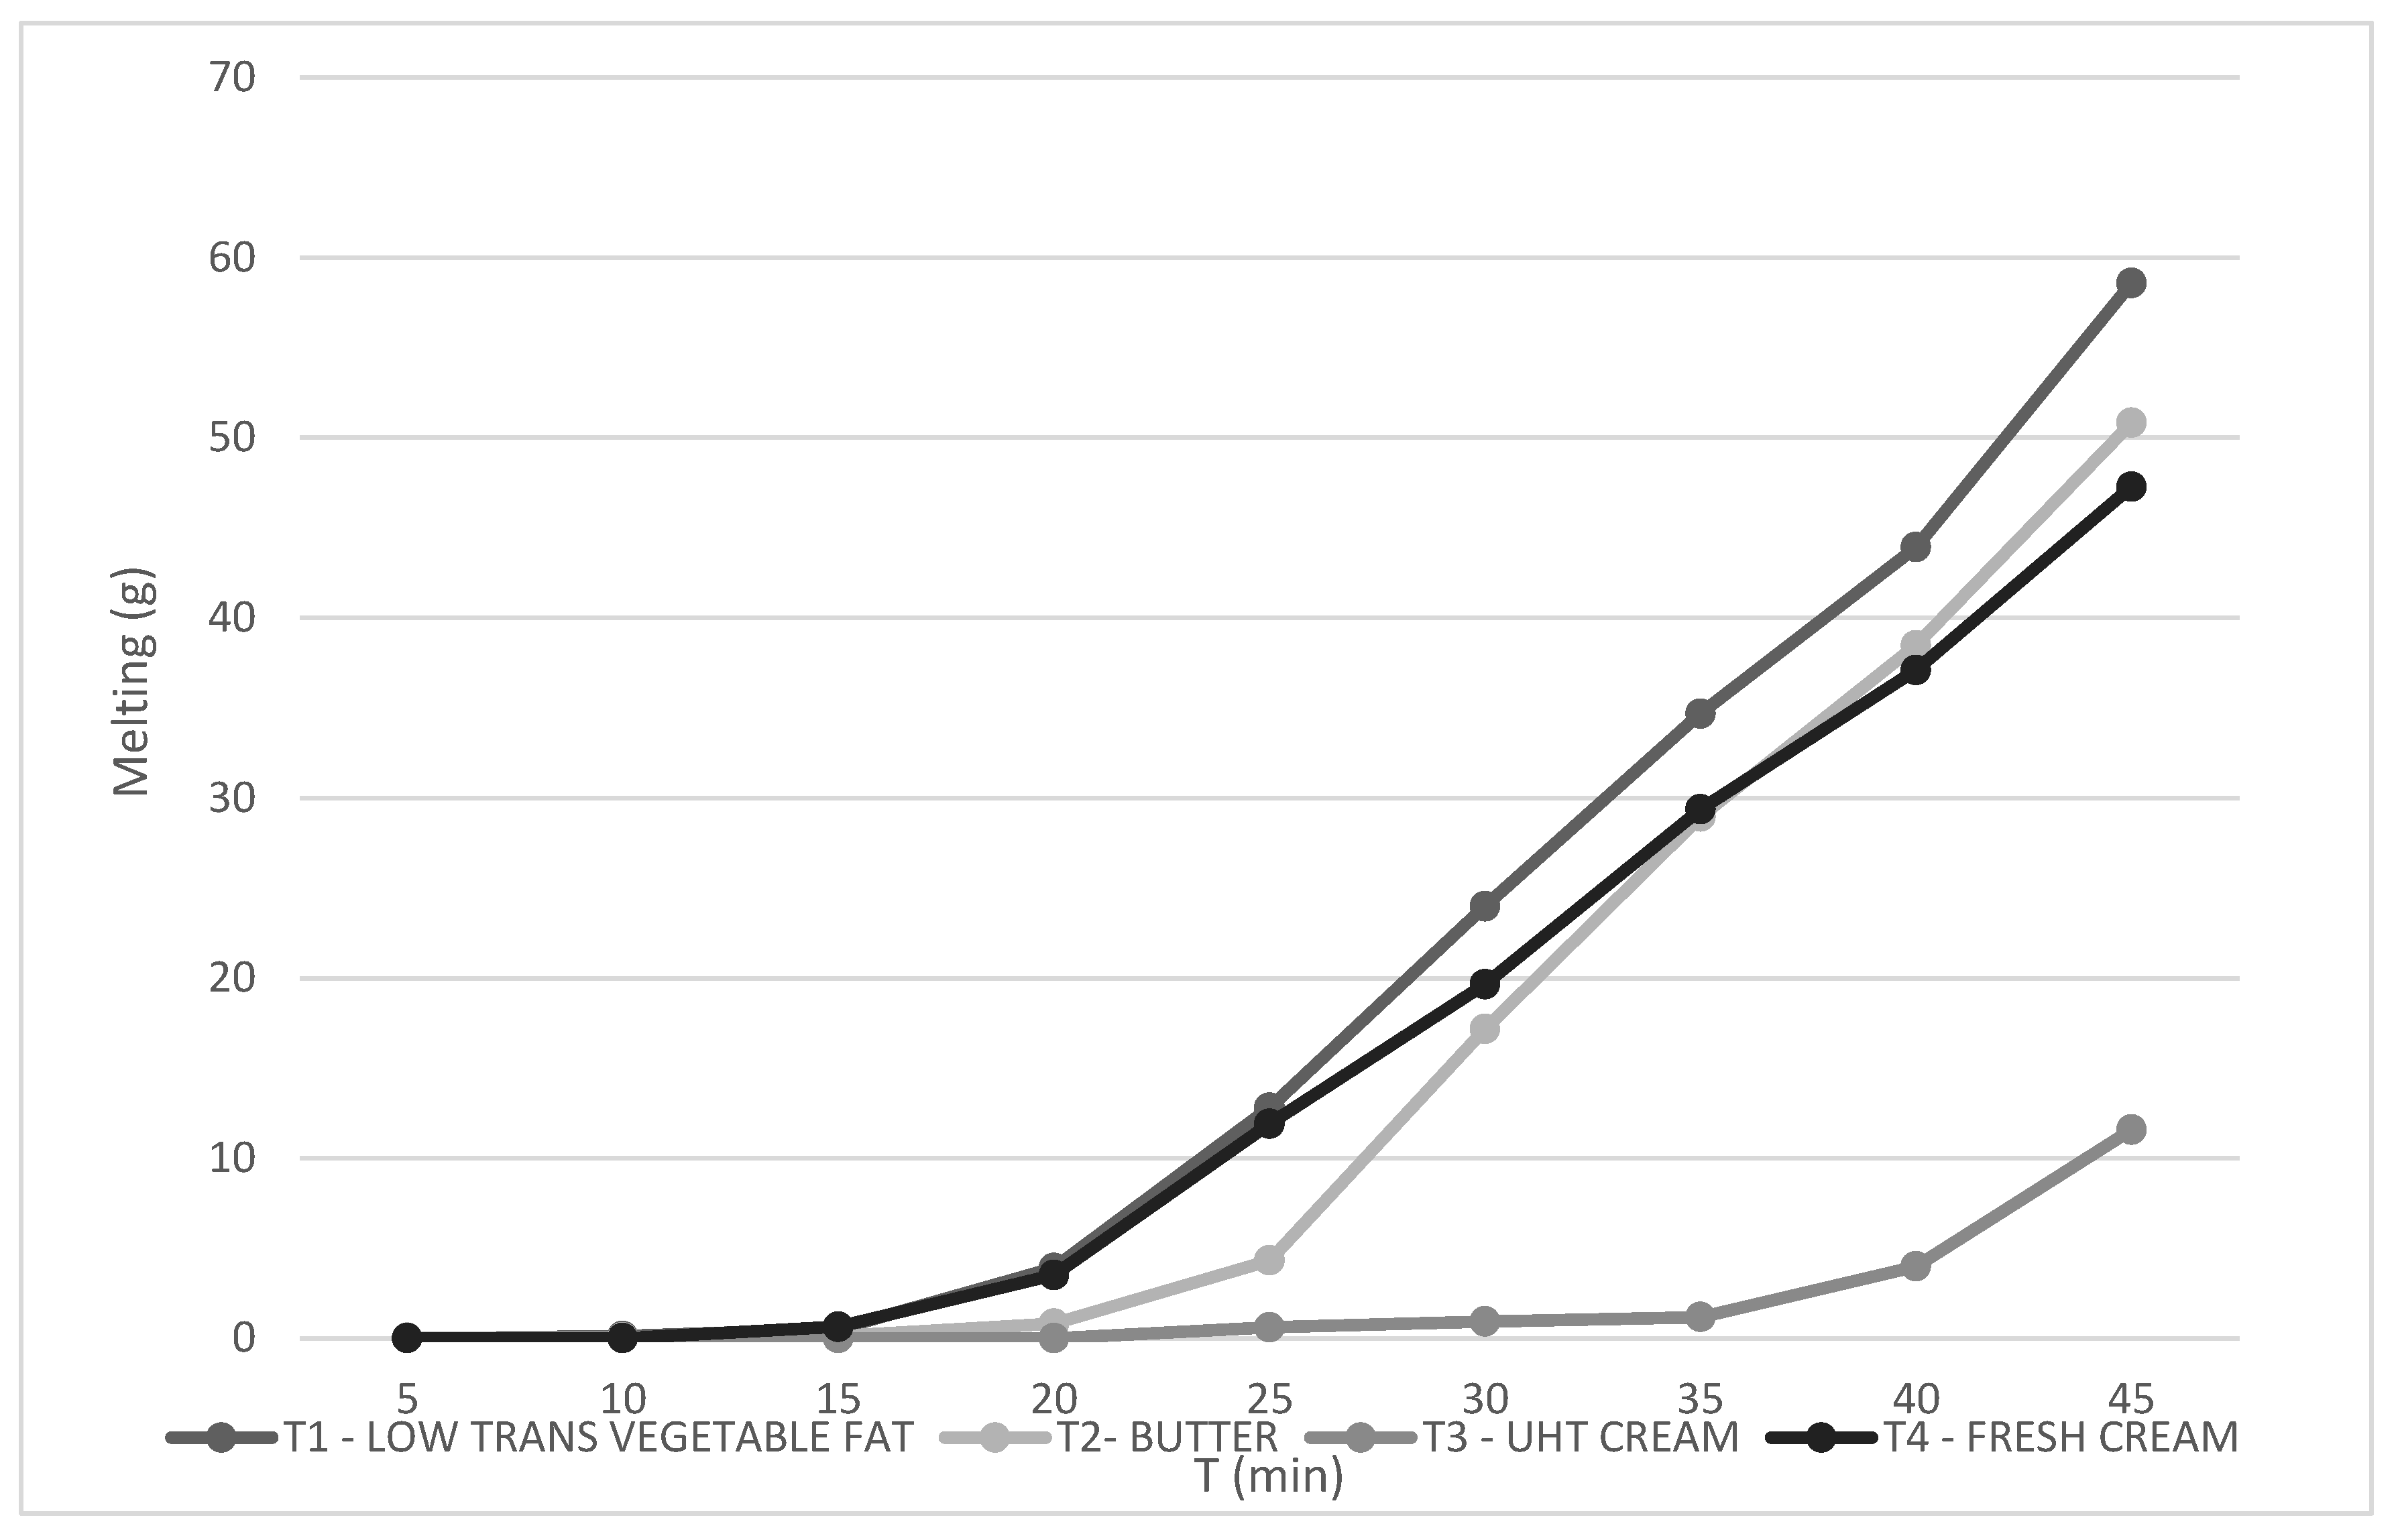
Figure 5.
(T1) low trans vegetable fat, (T2) butter, (T3) UHT cream, (T4) fresh cream. The values in the columns that do not have the same letters are significantly different at p < 0,05. Mean ± SD is shown (n:3).
Figure 5.
(T1) low trans vegetable fat, (T2) butter, (T3) UHT cream, (T4) fresh cream. The values in the columns that do not have the same letters are significantly different at p < 0,05. Mean ± SD is shown (n:3).
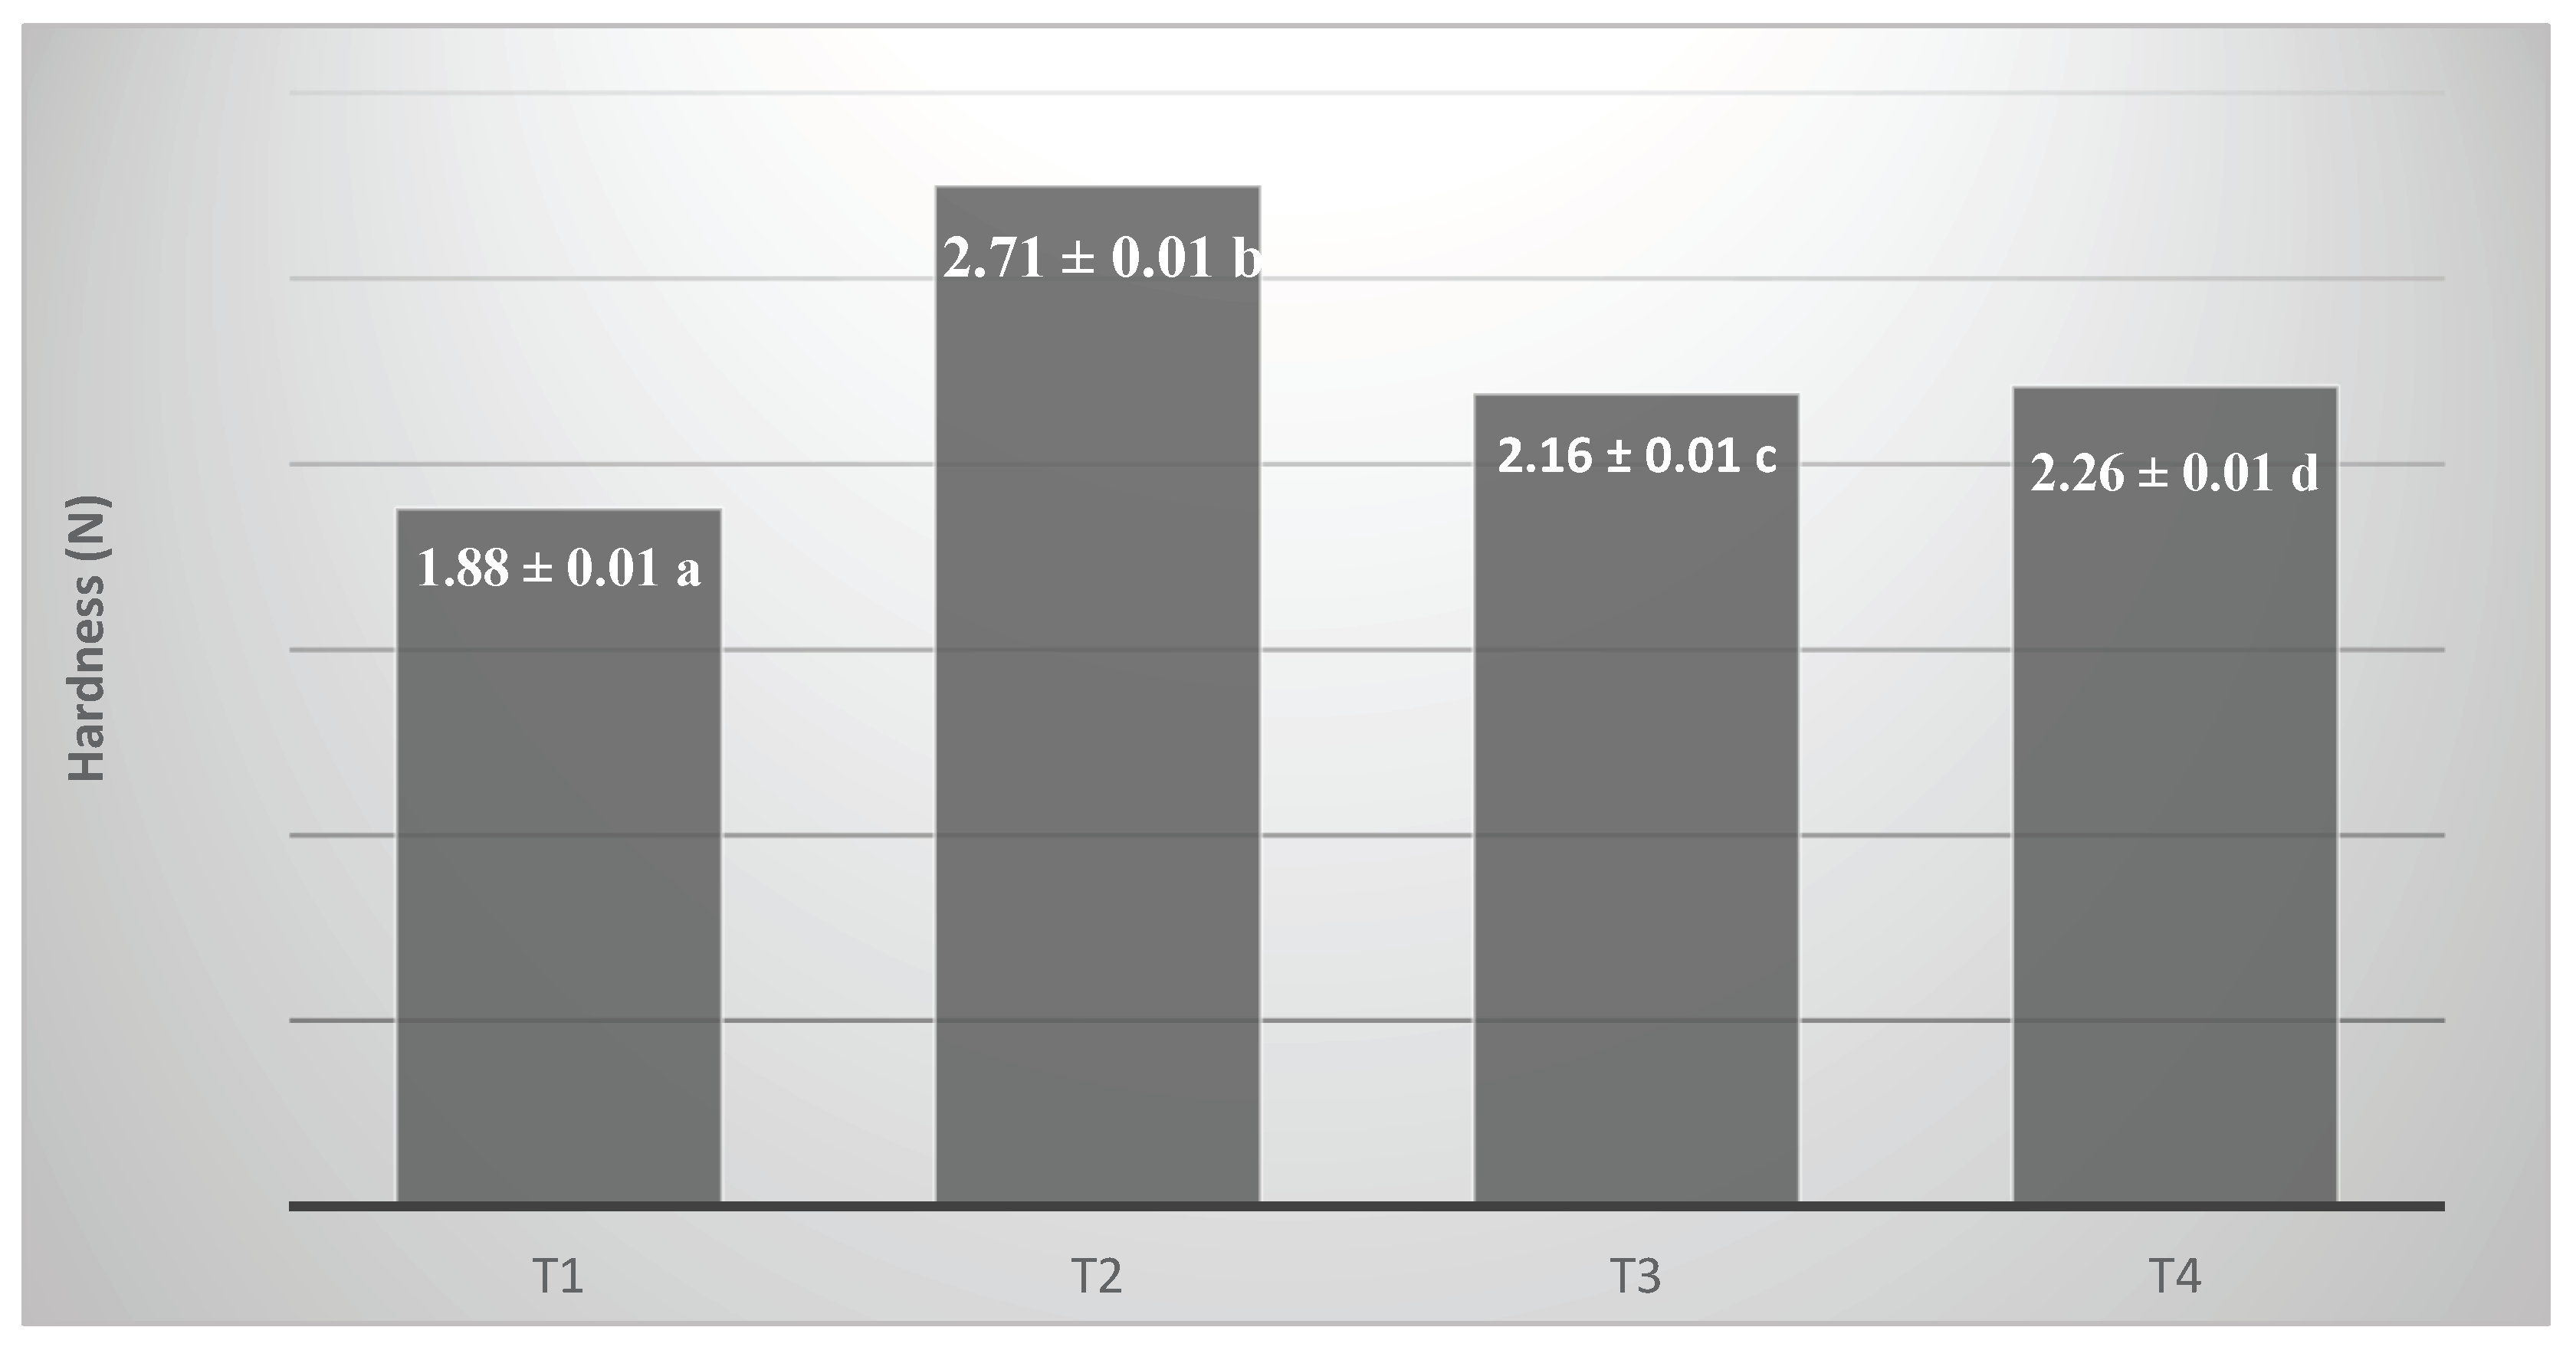
Table 1.
Ice cream formulations.
| Ingredients (%) | T1 | T2 | T3 | T4 |
| Water | 59.9 | 58.4 | 16.5 | 43.4 |
| Sucrose | 12.0 | 12.0 | 12,0 | 12.0 |
| Glucose syrup | 6.0 | 6.0 | 6.0 | 6.0 |
| Whole milk powder | 12.0 | 12.0 | 12.0 | 12.0 |
| Stabilizers and Emulsifiers | 1.3 | 1.3 | 1.3 | 1.3 |
| Low trans vegetable fat | 8.9 | - | - | - |
| Butter 80% | - | 10.3 | - | - |
| UHT cream 17% | - | - | 52.3 | - |
| Fresh cream 25% | - | - | - | 25.4 |
Note: All formulations were balanced with the same variation of fat (12.0%), non-fat milk solids (8.5%), sugar (18.0%), and total solids (39.8%). The formulations were prepared one day before to be analyzed, and they were prepared as many times as necessary for the total analysis (batch of 3 kg).
Disclaimer/Publisher’s Note: The statements, opinions and data contained in all publications are solely those of the individual author(s) and contributor(s) and not of MDPI and/or the editor(s). MDPI and/or the editor(s) disclaim responsibility for any injury to people or property resulting from any ideas, methods, instructions or products referred to in the content. |
© 2025 by the authors. Licensee MDPI, Basel, Switzerland. This article is an open access article distributed under the terms and conditions of the Creative Commons Attribution (CC BY) license (http://creativecommons.org/licenses/by/4.0/).
Copyright: This open access article is published under a Creative Commons CC BY 4.0 license, which permit the free download, distribution, and reuse, provided that the author and preprint are cited in any reuse.


