
Submitted:
18 August 2025
Posted:
19 August 2025
You are already at the latest version
Abstract
Graphene oxide(GO) contains several chemical functional groups that are attached to the graphite basal plane and can be manipulated to tailor GO for specific applications through chemical reactions. Ozonation of the graphite oxide has been noted to increase the degree of oxidation, hence increase in hydroxyl,laxtol , ester and ketone content in GO. The increase in proton conductivity is attributed to the higher content of ozonated functional groups in the basal planes and edges of the ozonated GO. Substituting hydroxyl/epoxy groups of GO with –HSO3 group enhances it activity, nano composites based on sulfonated graphene oxide (SGO) and sulfonated poly (ether sulfone)(SPES) have been noted to improve proton conductivity and ion exchange capacity . Herein is description development of novel ozonated sulfonated graphene oxide (OSGO).
Keywords:
graphene oxide
; Ozonated graphene oxide
; ozonated sulfanilic graphene oxide
; proton exchange membrane
Introduction
In recent days graphene oxide has attracted great attention in wide areas for its structural , mechanical and thermal properties which enables it to be tailored in different applications, graphite can be functionalized to convert into graphene oxide(GO) with improved properties such as large surface areas and electronic insulation which provides Graphene oxide to be used as organic filler in PEMs[Gahlot, S., et al.2014].Incorporation of Sulfanilic graphene oxide(SGO) has been noted to increase ion-exchange capacity(IEC),water retention and proton conductivity and reduced methanol permeability in proton-exchange membranes (PEMs) consisting of Sulfonated poly(ether sulfone) while maintaining thermal mechanical stability [Gahlot, S., et al.2014]. Ozonation of the graphene oxide has been noted to increase the degree of oxidation, hence increase in hydroxyl, laxtol, ester and ketone content in GO. The increase in proton conductivity is attributed to the higher content of ozonated functional groups in the basal planes and edges of the ozonated GO [Gao, W., et al 2014] Substituting hydroxyl/epoxy groups of GO with –HSO3 group enhances it activity, nano composites based on Sulfonated graphene oxide (SGO) and Sulfonated poly (ether sulfone)(SPES) have been noted to improve proton conductivity and ion exchange capacity [Gahlot, S., et al.2014]. These combined factors makes the Ozonated Sulfanilic graphene oxide a good candidate for introducing sulphur and carbon compounds in various membranes.
Instruments Materials and Methods
Instruments
Ozone machine, centrifugal machines, The UV-Vis Berkman coulter (DUR spectrophotometer), Thermo-gravimetry perkin Elmer 4000, DXR Raman microscope (thermo scientific) with 532nm laser, FTIR spectrometer (AVATAR 360, Nicolet, Madison,USA), X-ray diffraction (XRD) Cu Ka radiation (D8 advance Brunker-AXS, Germany) (°=1.5418Å), for SEM Model S-4800 field emission scanning electron microscope was used
Materials and Reagents
Graphite, NaOH, sulfanilic acid, Ice water, ozone, H2SO4, H3PO4, KMnO4, HCL, and DI water, H2O2, KBr, ethanol for use in FT-IR.
Experimental and Methodology
GO Preparation
GO was prepared according to the improved method [Marcano, D.C., et al 2010]whereby , a 0.1 mixture of concentrated H2SO4/ H3PO4 (360:40ml) was added to a mixture of graphene flakes (3.0g, 1wt equiv.) and KMnO4 (18.0g,6wt equiv), this reaction produced a light exothermic to 35-40 °C. The reaction was then heated to 50°C and stirred for 12h. after this process the reaction was cooled to room temperature and poured into ice (400mL) then 3ml H2O2 was added and the solution was washed with water for several times. And later resuspended in DI water for future use.
SGO Preparation
The SGO was prepared by sulfonation of GO through aryl diazonium reaction of sulfanilic acid [Gao, W., et al 2014] the aryl diazonium salt was prepared as follow: to a100mL beaker placed 5mL NaOH (2%) and 0.5g SA ( sulfanilic acid) and allowed SA to dissolve in warm water bath. To the above solution 0.2g NaNO2 was added at RT, after NaNO2 dissolved the mixed solution was added into 10mL ice water and 1mL of concentrated HCL under stirring, the temperature was kept at 0⁰C for 15minutes and diazonium salt was formed. Then the diazonium salt solution was added drop-wise into 71.4mL of GO (7mg/ml) and the mixed solution was stirred strongly for 4hours in an ice water bath. After centrifuging and washing with water for several times, the obtained GO-SO3- was dispersed in water and stored at room temperature for use.
OSGO Preparation
For the OSGO preparation, the O3 was passed though SGO dispersion with a mild water bath sonication for one hour. (O3 model), ozonating the SGO for extended period of more than eight hours results in loss of S-O group due to oxidation. There is a noticeable colour change to bright brown.
Characterization
UV-Vis
The UV-Vis was done using Berkman coulter (DUR spectrophotometer) 800, from 200.0nm wavelength to 800.0nm, the wavelength interval was 1.0nm while the scan speed was 1200nm/min. The temperature was 25°C.
Thermo Graphic Analysis (TGA and DTG)
Thermal stability of the samples was evaluated by thermo-gravimetry perkin Elmer 4000. TGA and DTG measurements were carried out from 25°C to 800°C at heating rate of 10˚C min-1. All the measurements were performed under dry nitrogen; analysis of individual sample weighing 1-2 mg was carried out at a constant heating rate of 10°C /min between 30-700°C. Each sample was tested in triplicate
Atmosphere with a gas flow of 20ml min-1.
Raman Spectra
Raman spectra were done by DXR Raman microscope (thermo scientific) with 532nm laser at room temperature.
Fourier Transformation Infrared (FT-IR)
Fourier transformation infrared (FT-IR) spectra of the samples were obtained between 400 and 4000cm-1 on KBr powder with FTIR spectrometer (AVATAR 360, Nicolet, Madison,USA). A minimum of 24 scans were performed.
X-Ray Diffraction (XRD)
X-ray diffraction (XRD) patterns of the samples were examined using a reflection scan with nickel filtered Cu Ka radiation (D8 advance Brunker-AXS, Germany) (°=1.5418Å).The measurements were performed at 2 Theta (degree) between 20°C and 80°C.
The scanning electron microscope (SEM)
Model S-4800 field emission scanning electron microscope was used.
Results and Discussion
GO Prepared
The photo Figure 1a shows the graphene oxide which was prepared, a homogeneous solution with no precipitating particles at the bottom showing a fully conversion of graphite, the solution appears as a dark brown in colour, upon addition of hydrogen peroxide (Figure 1b) the solution turned to brownish colour with no any particles precipitating, GO is highly hydrophilic, it attracted water upon drying, for storage the GO was suspended in DI water for later use
The UV-Vis of GO yields a distinct peak at ca.230nm, which has been assigned to various oxygen functionalities on the graphene-oxide surface[Gao, W., et al 2014] The UV-Vis for SGO and OSGO yields a peak at 232 and 264. After Ozonation a noticeable shift of
UV absorption were detected for SGO. Indicating a higher degree of oxidation for OSGO as compared to SGO.
It was observed that there was a loss of S-O group (Figure 2c)when the ozonation was extended for over 10 hours, hence for the best results it is recommended tp ozonate for one hour only.
Figure 2.
(a) UV-Vis for GO. (b) UV-Vis for SGO and OSGO. (c)
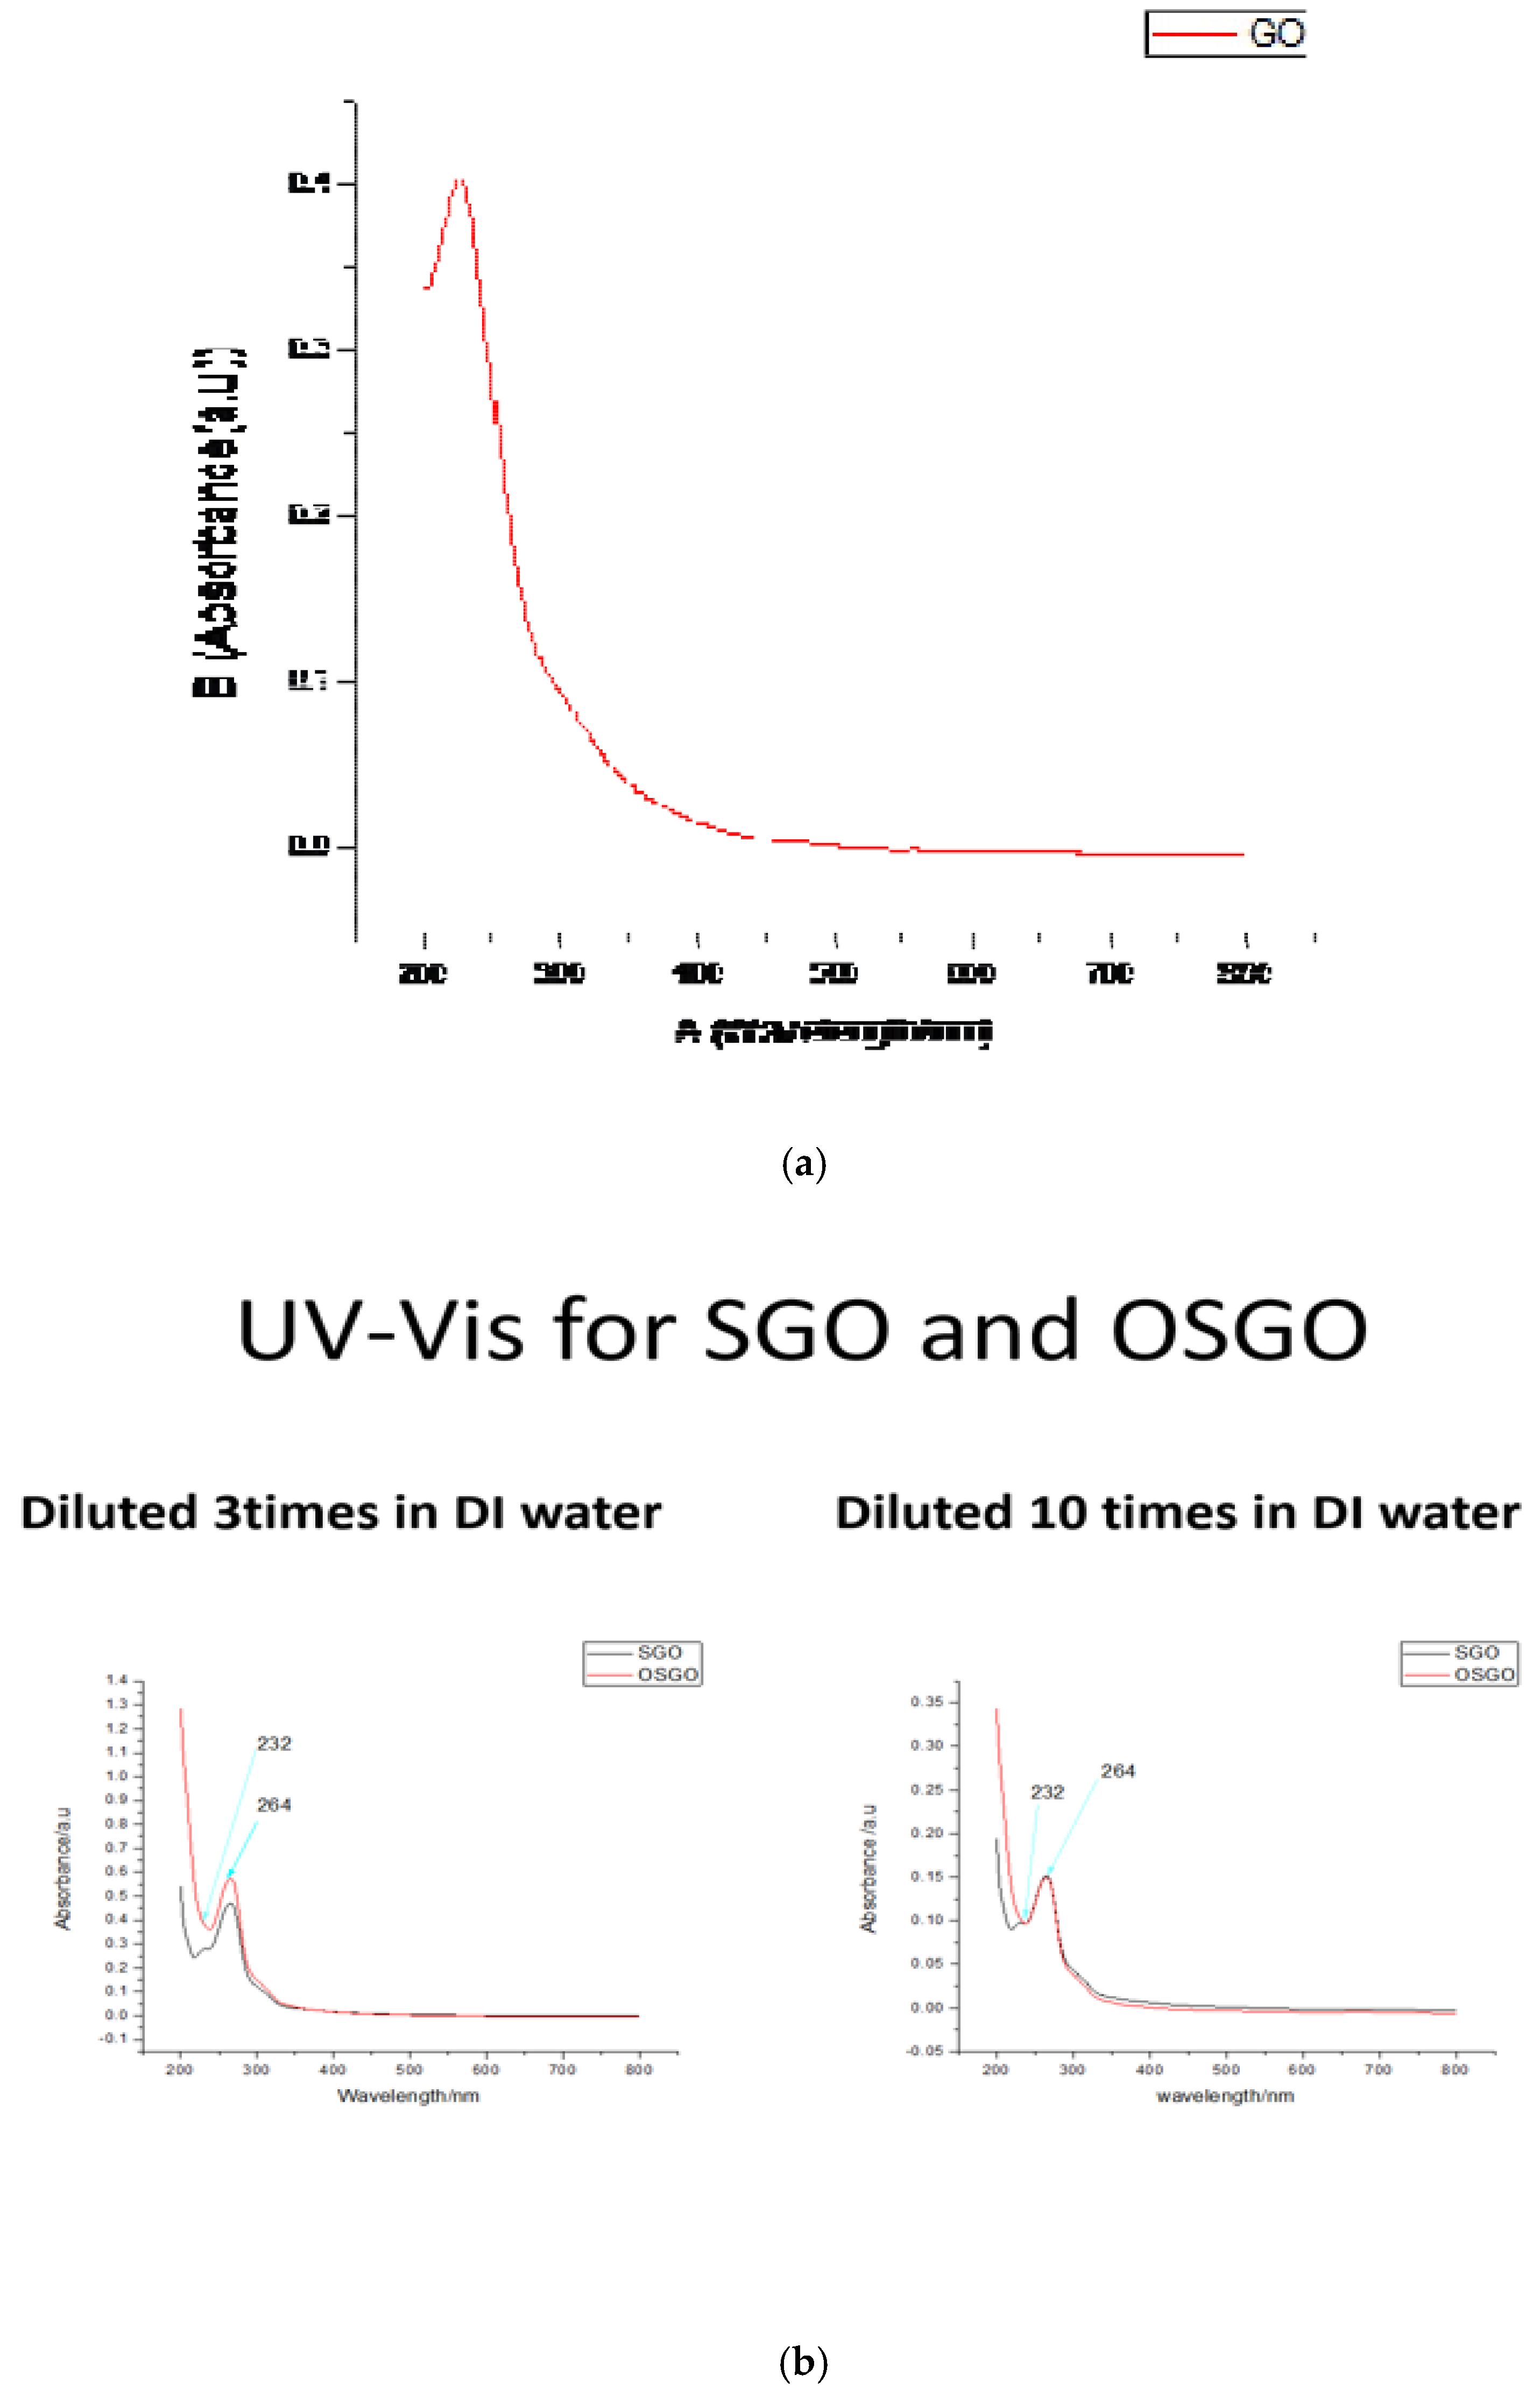
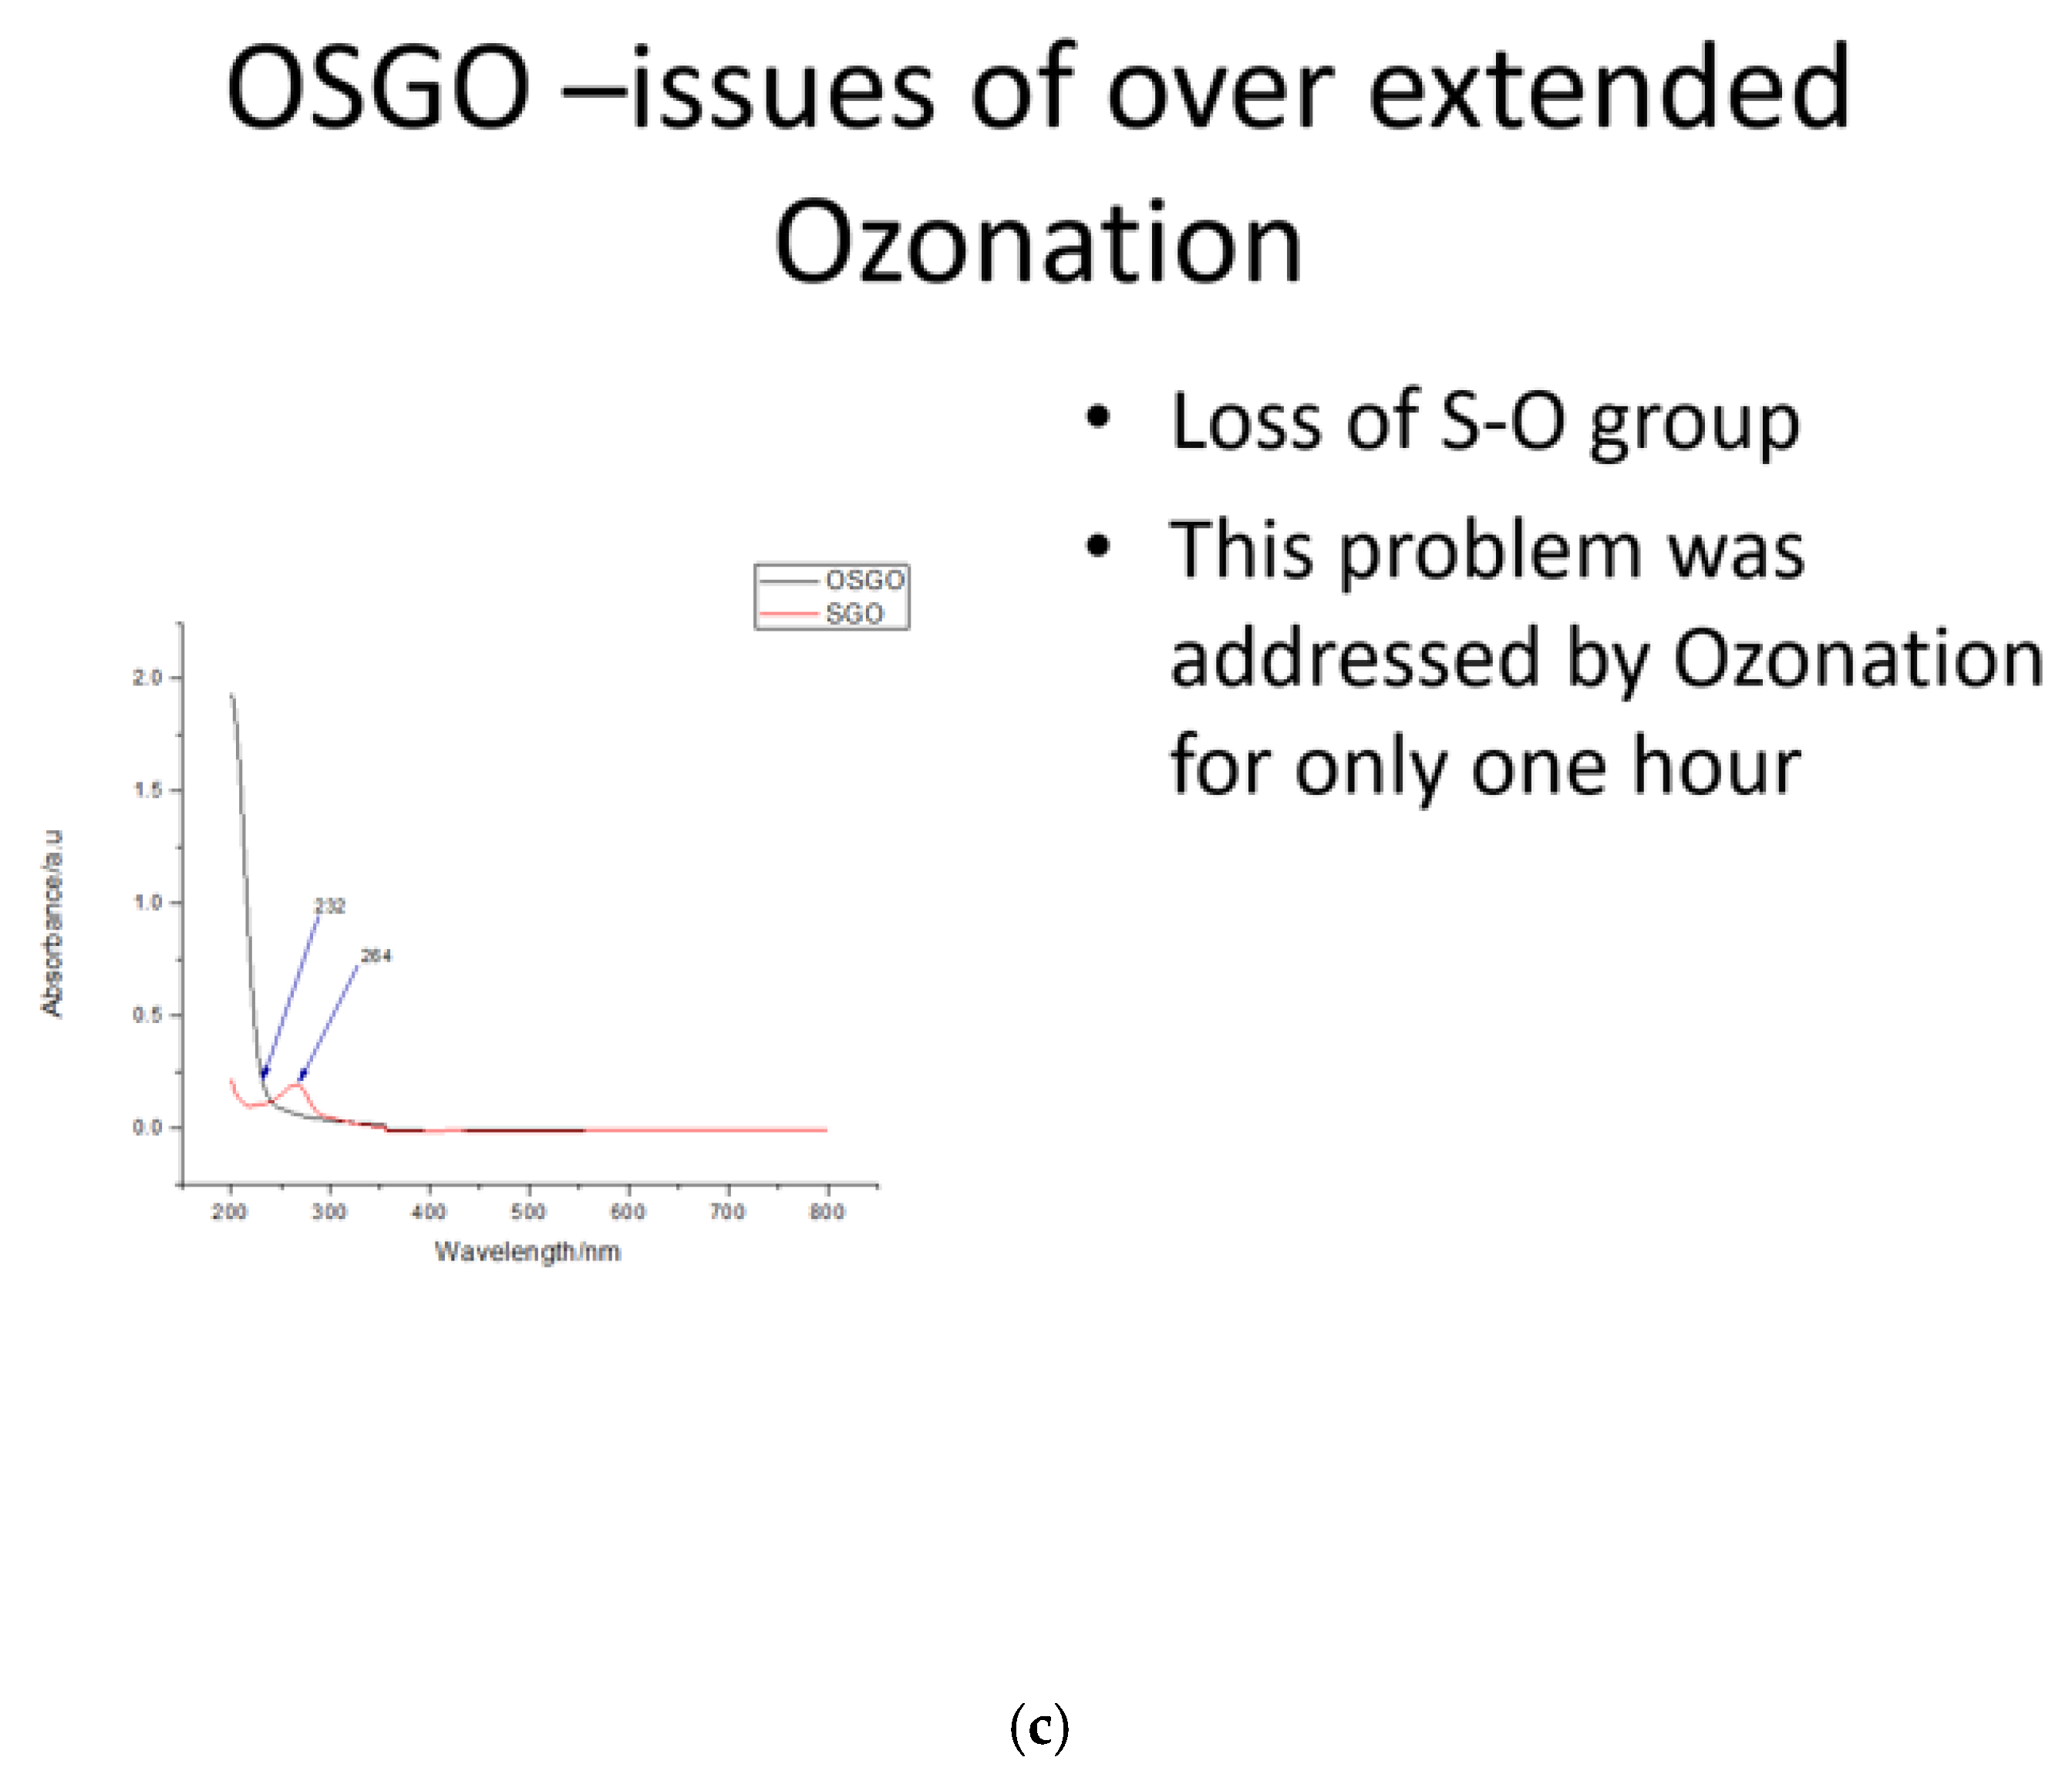
Figure 3.
(a) FT-IR spectra for OSGO. (b) FT-IR spectra for SGO. (c) FT-IR spectra for OSGO and SGO. (d) FT-IR spectra for GO, SGO and OSGO.
Figure 3.
(a) FT-IR spectra for OSGO. (b) FT-IR spectra for SGO. (c) FT-IR spectra for OSGO and SGO. (d) FT-IR spectra for GO, SGO and OSGO.
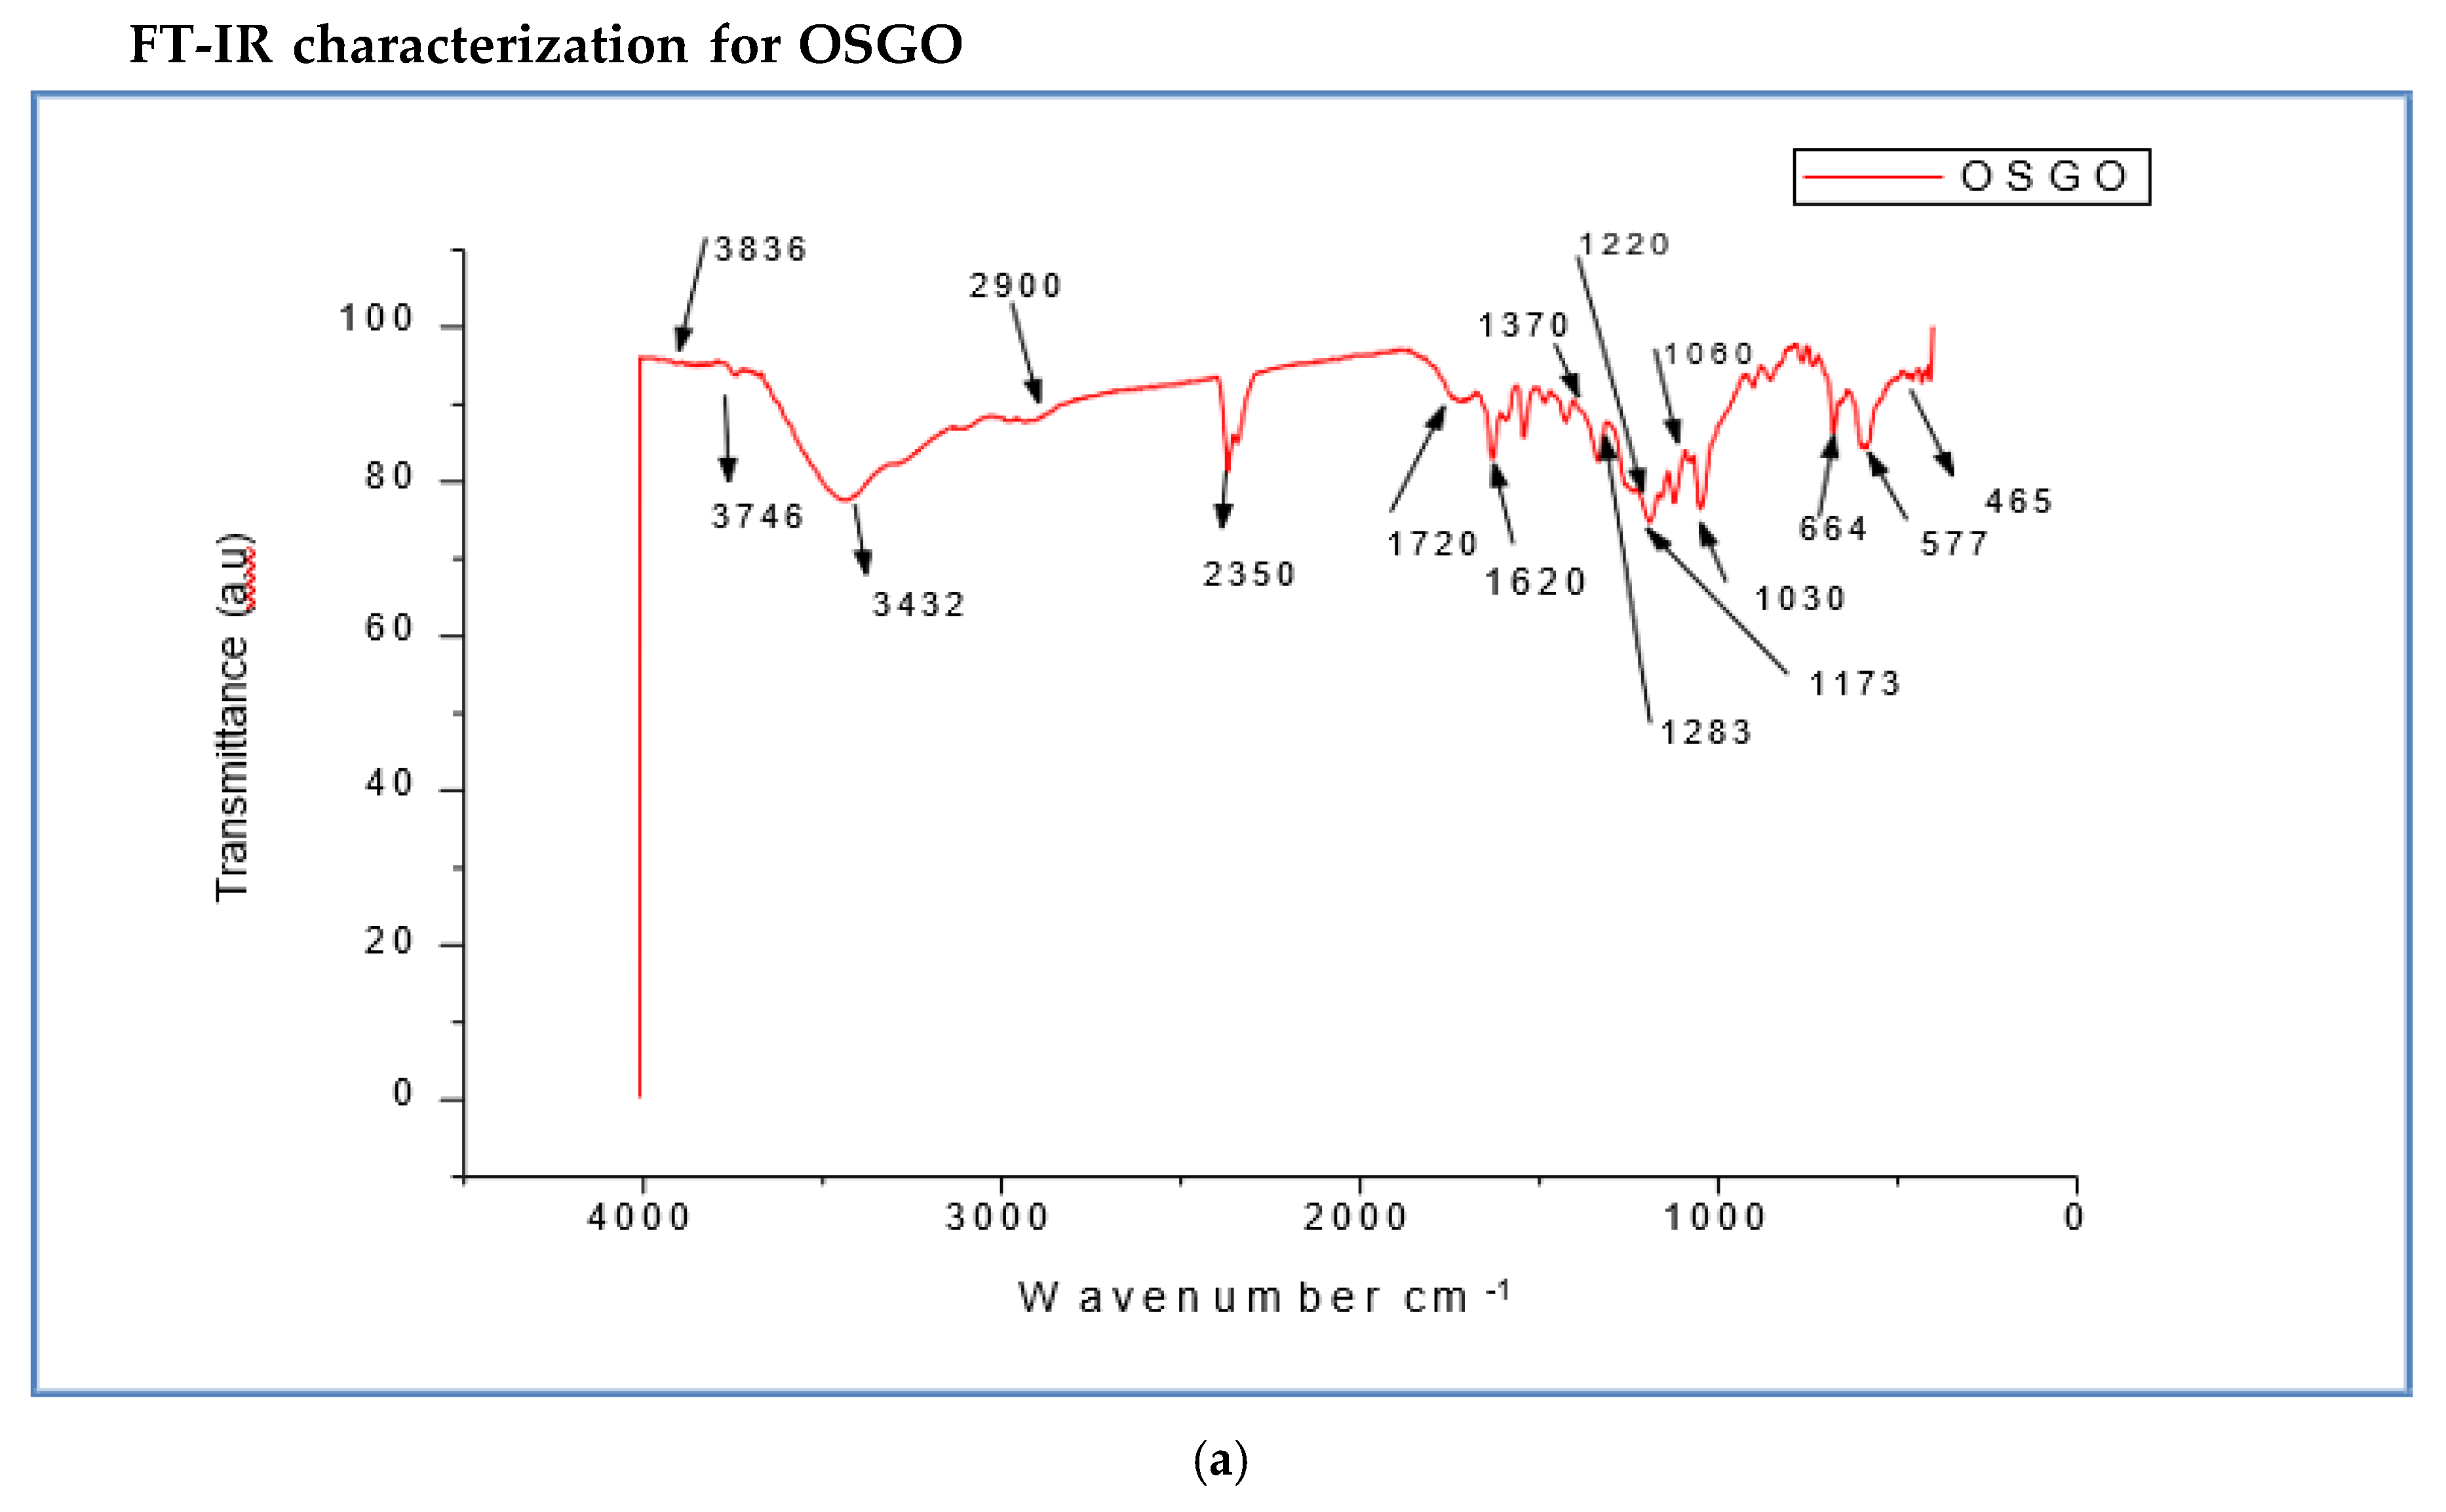
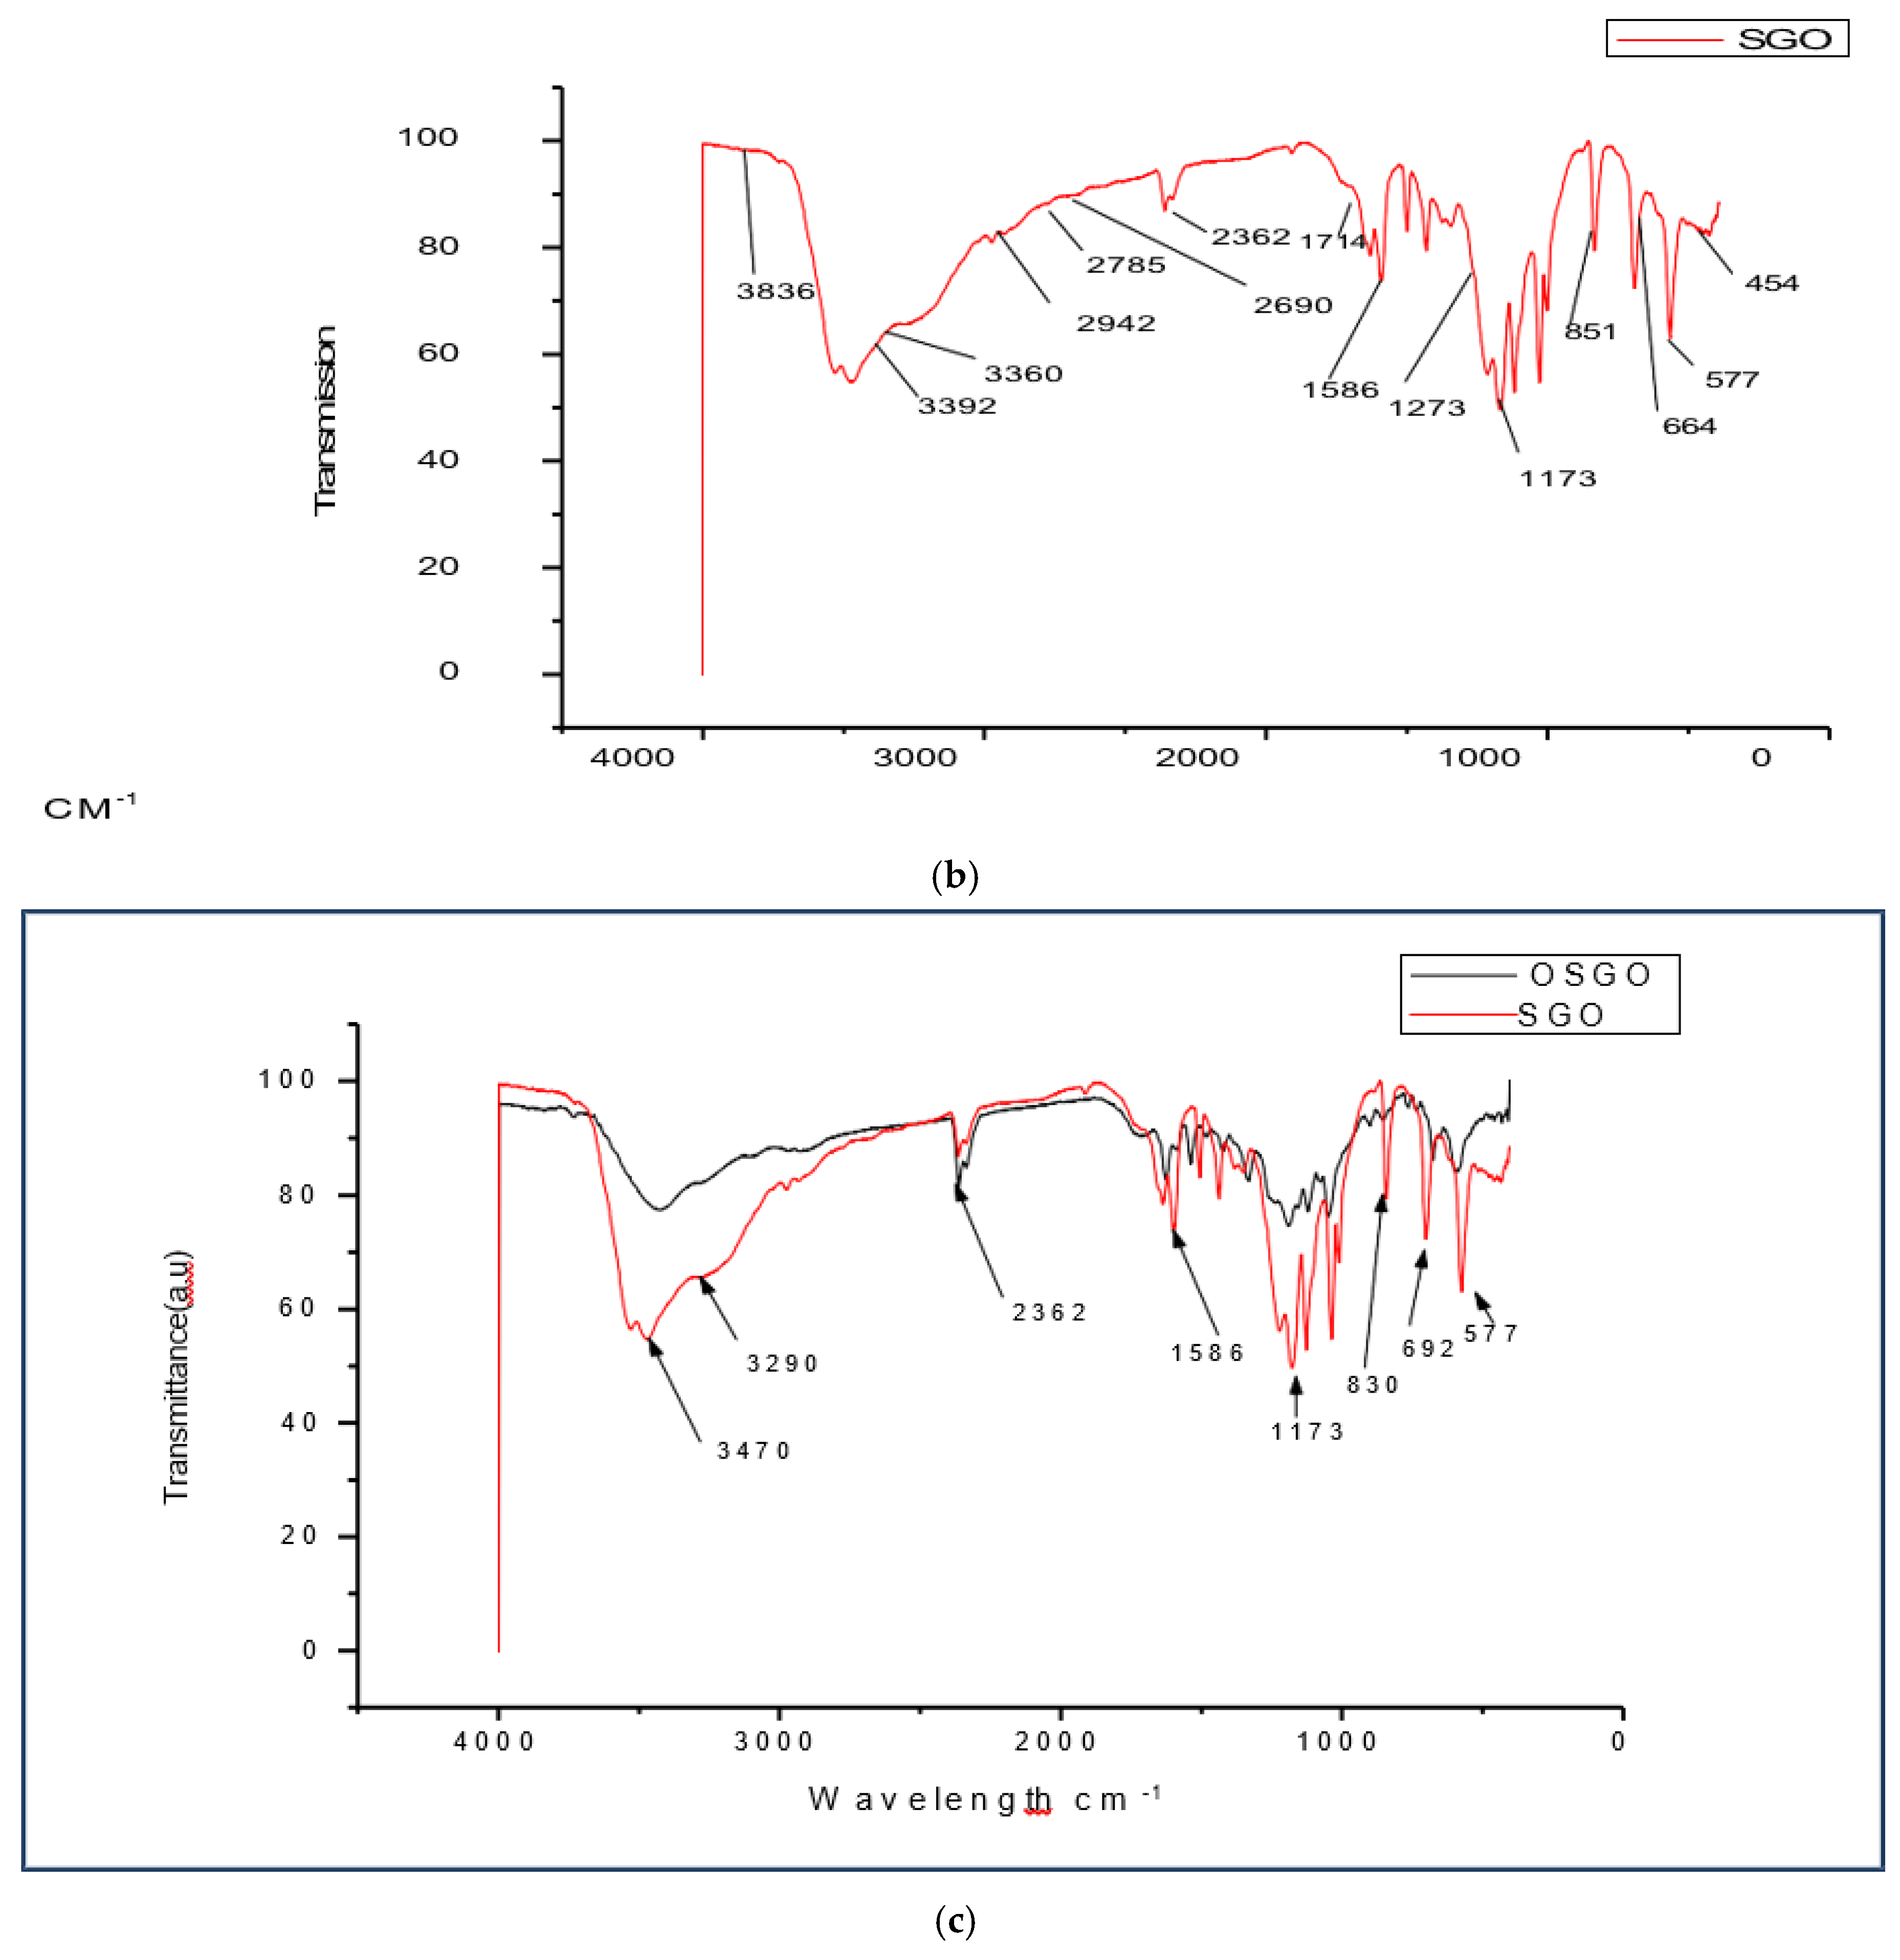
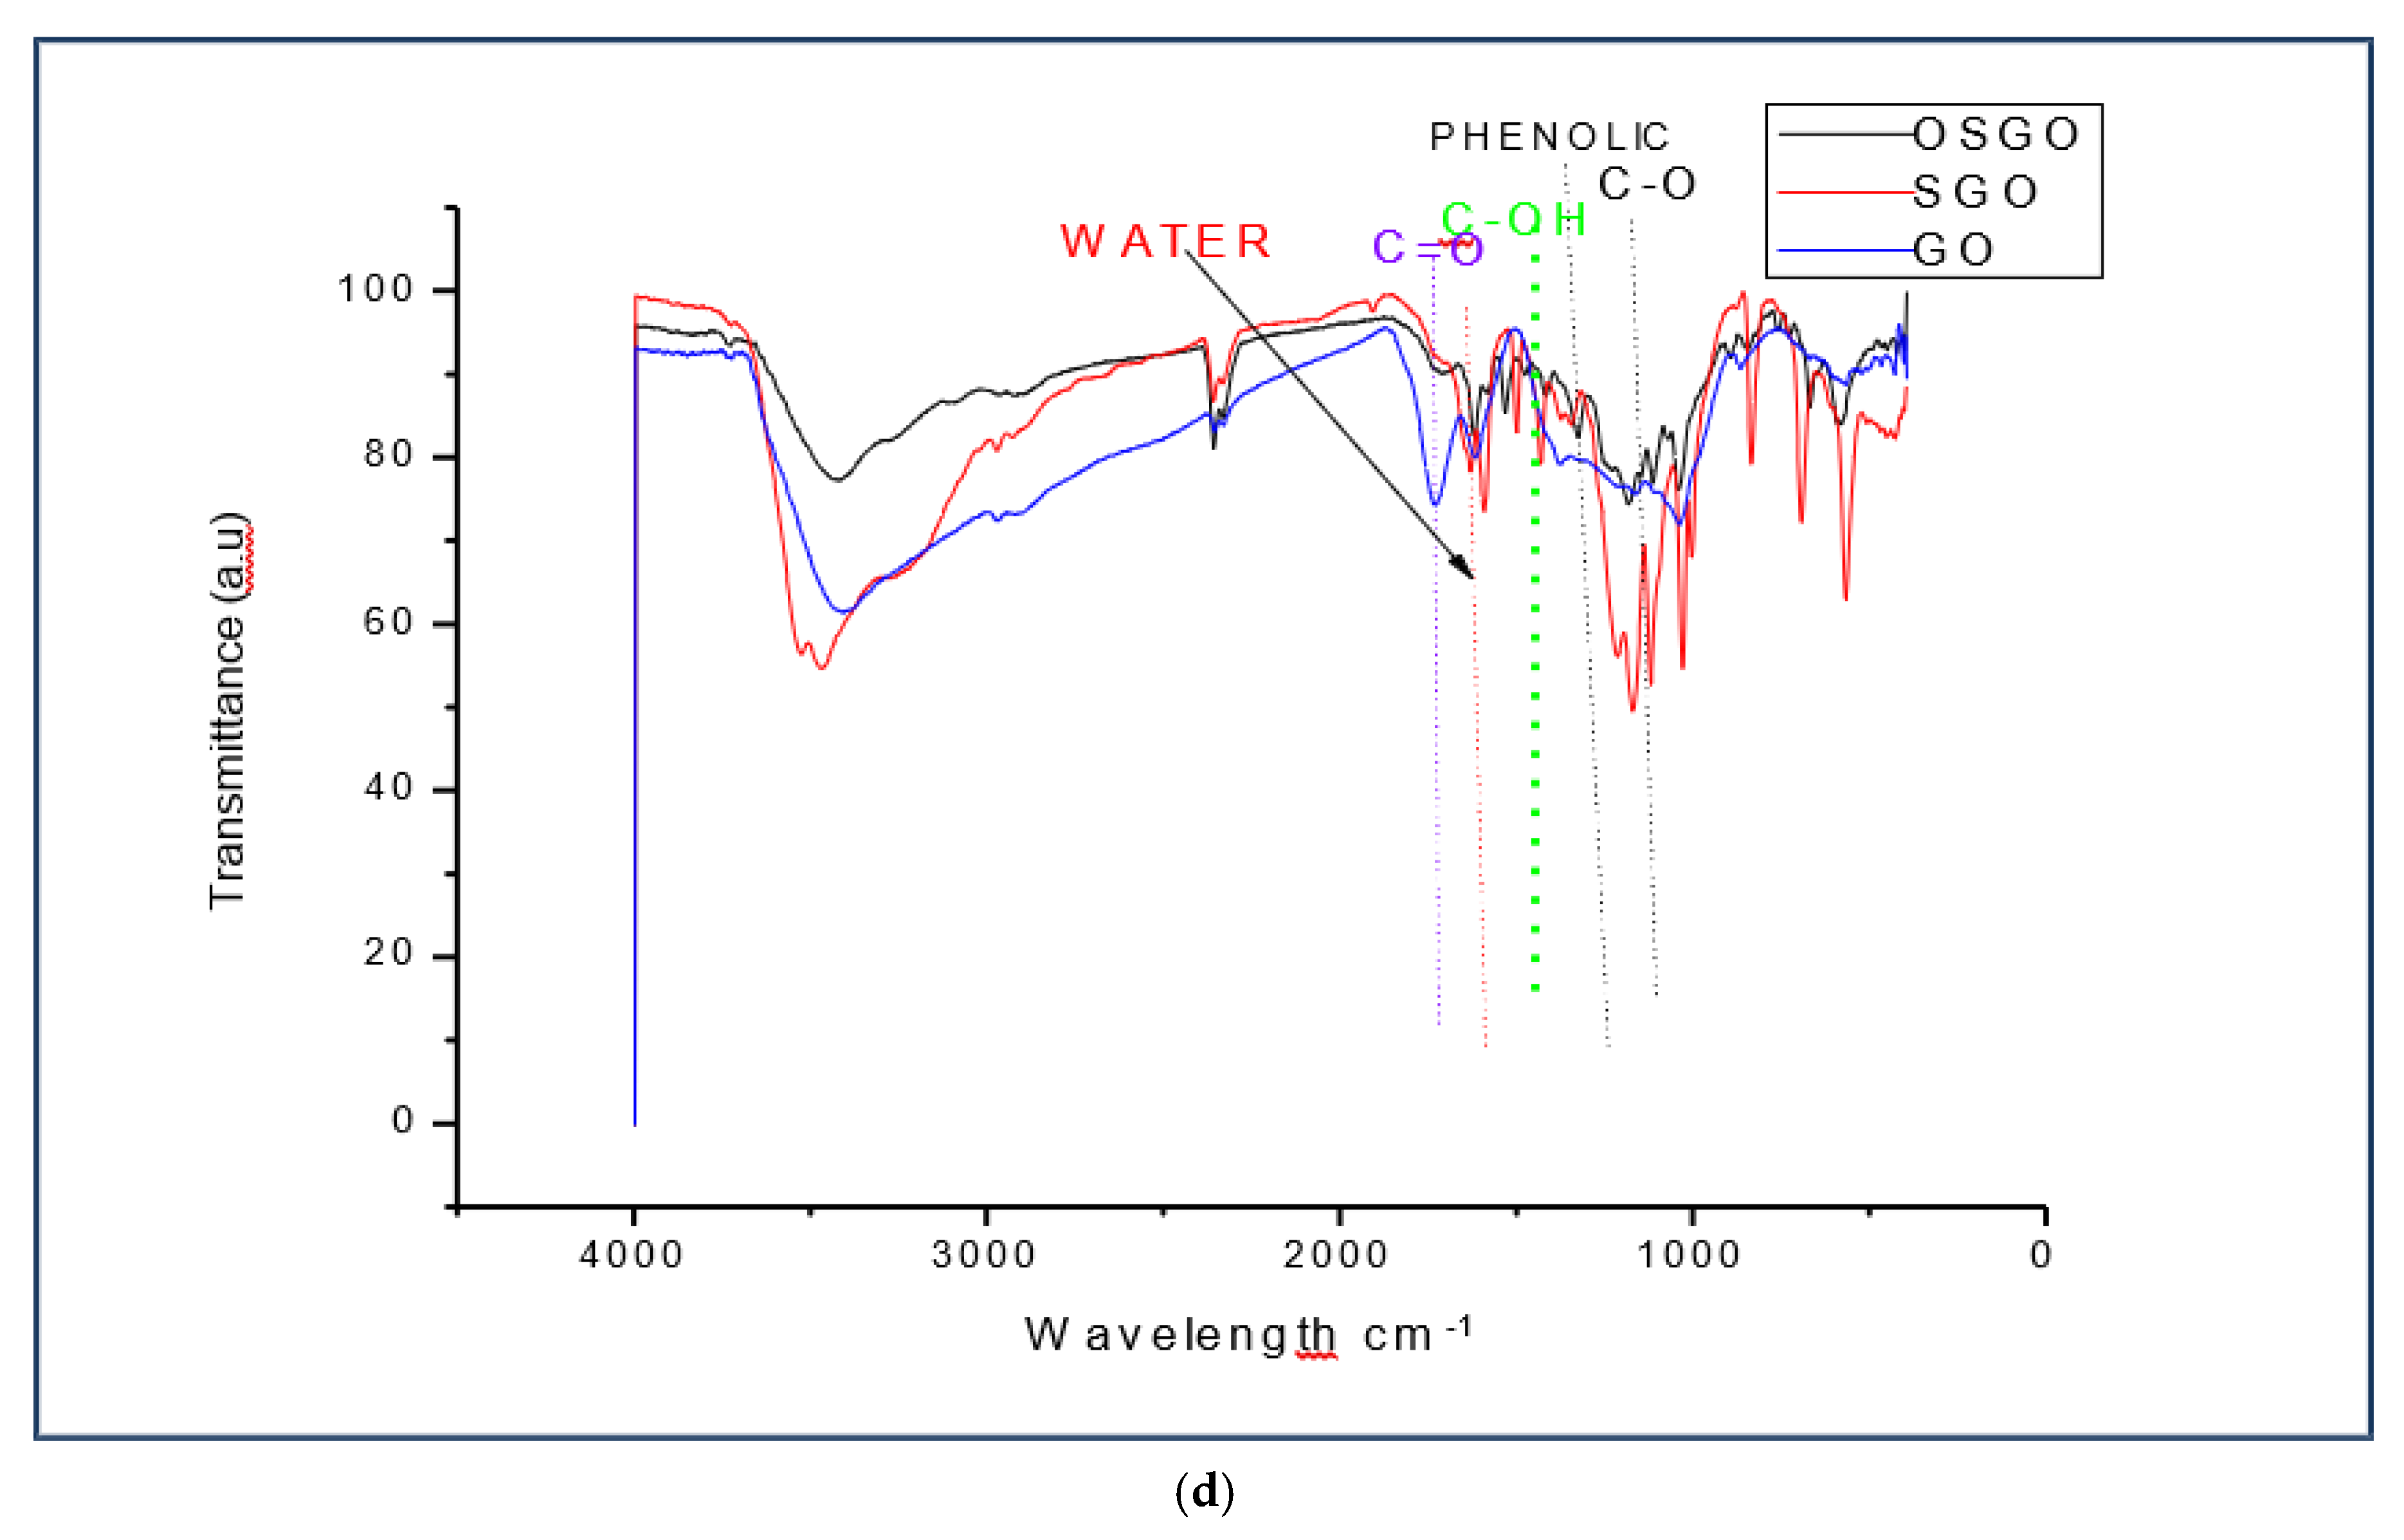
The difference between FTIR spectra for GO and SGO/OSGO is additional of a new functional group 1173 which attributes the absorption of sulfonic acid group (-SO3H). The three spectra has overlapping bands centered around 1060 cm-1(C-O), 1220cm-1 (phenolic),1370cm-1 (O-H bending in tertiary alcohols), 1620 cm-1 (O-H bending in water), and 1720 cm-1( C=O) the stretching frequency around3432 cm-1 and 3360cm-1 (O-H hydrogen bond),3392cm-1, 3290cm-1,2942 cm-1,2785 cm-1,2690 cm-1, O-H stretching (acidic group). There is also a functional group around 2350 cm-1 and 2360 cm-1in SGO and OSGO which may be attributed to absorption of CO2. There is notable increased in transmittance (a.u.) in OSGO as compared to SGO and GO.
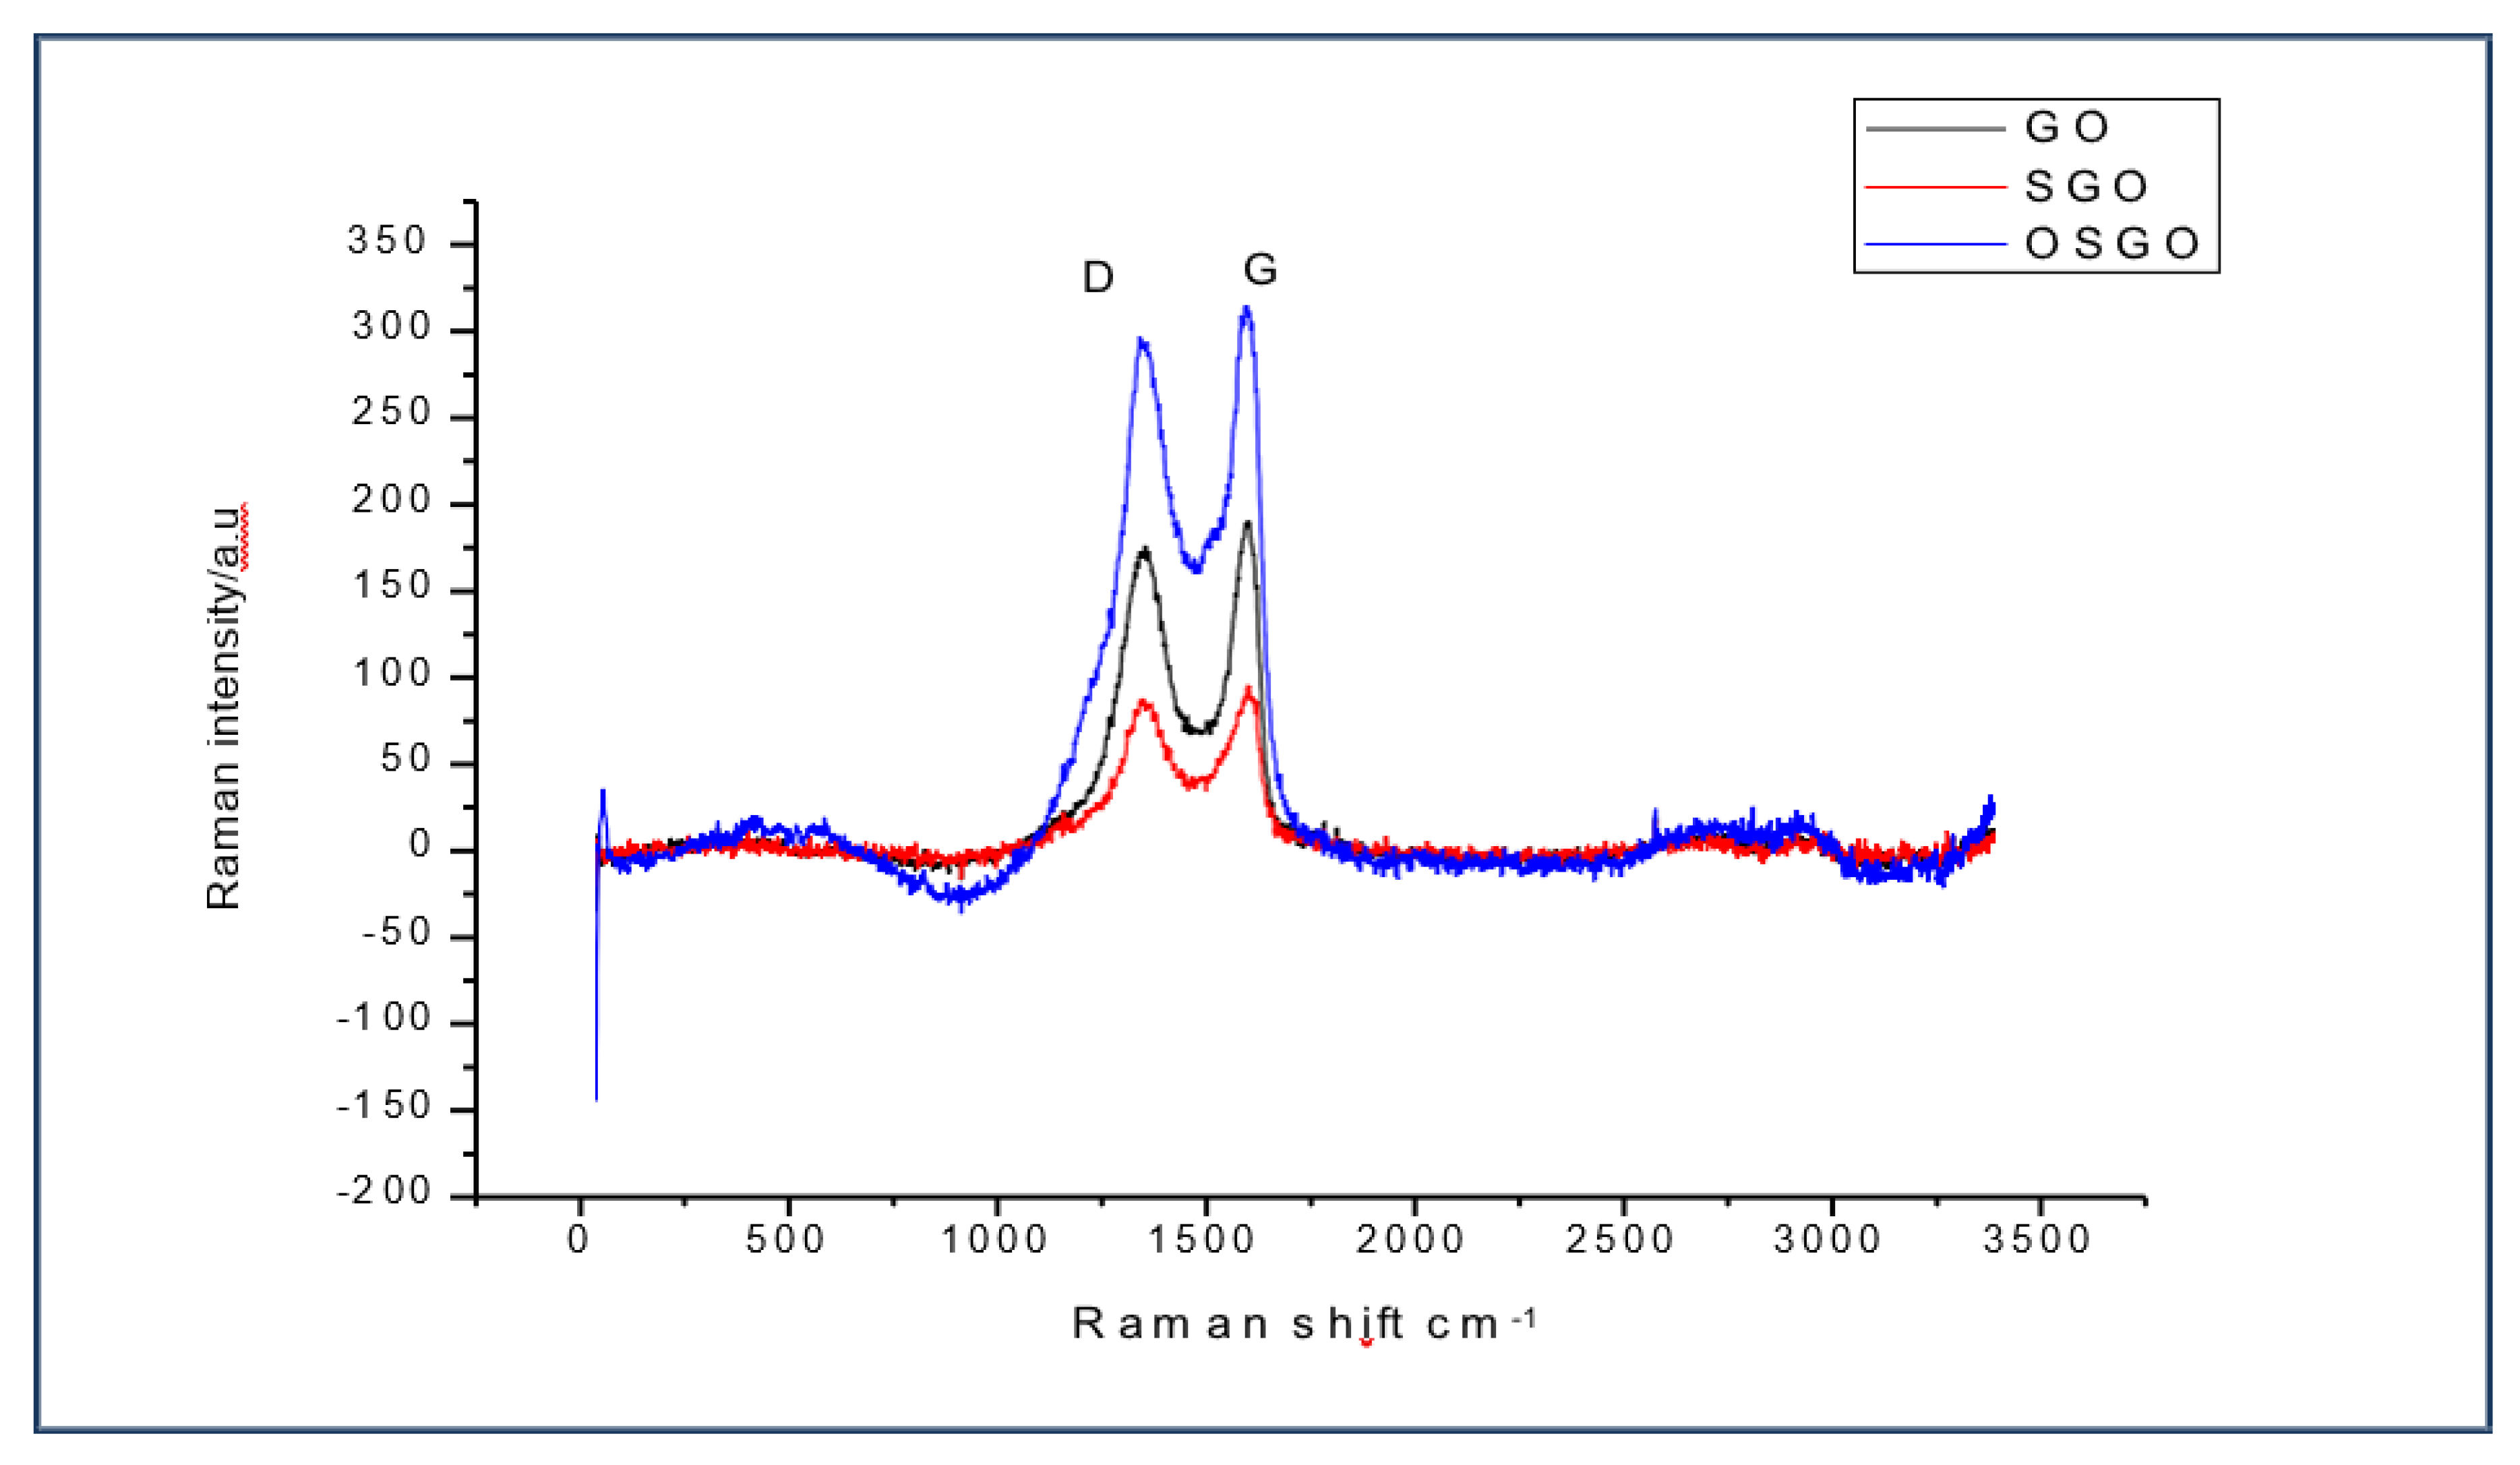
The Raman spectra shows the transformation of GO to SGO and SGO to OSGO. The ratio of the peak height ID/IG of GO(1349cm-1,1603cm-1),SGO (1346cm-1,1597cm- 1)increased significantly, while the peaks for both SGO and OSGO appears at 1346cm-1 and 1597cm-1. There is increased Raman intensity in OSGO as compared to both SGO and GO Figure 4d.
Figure 4.
(a) Raman spectra for GO, showing D peak at 1349 cm-1 and G peak at 1603 cm-1. (b) Raman spectra for SGO, showing D peak at 1346 cm-1 and G peak at 1597 cm-1. (c) Raman spectra for OSGO, showing D peak at 1346 cm-1 and G peak at 1597 cm-1, the peaks appear on the same as in SGO, with the difference only in Raman intensity (a.u). (d) Raman spectra for SGO and OSGO, showing D peak at 1346 cm-1 and G peak at 1597 cm-1, the peaks appear on the same as in SGO, with the difference only in Raman intensity (a.u).
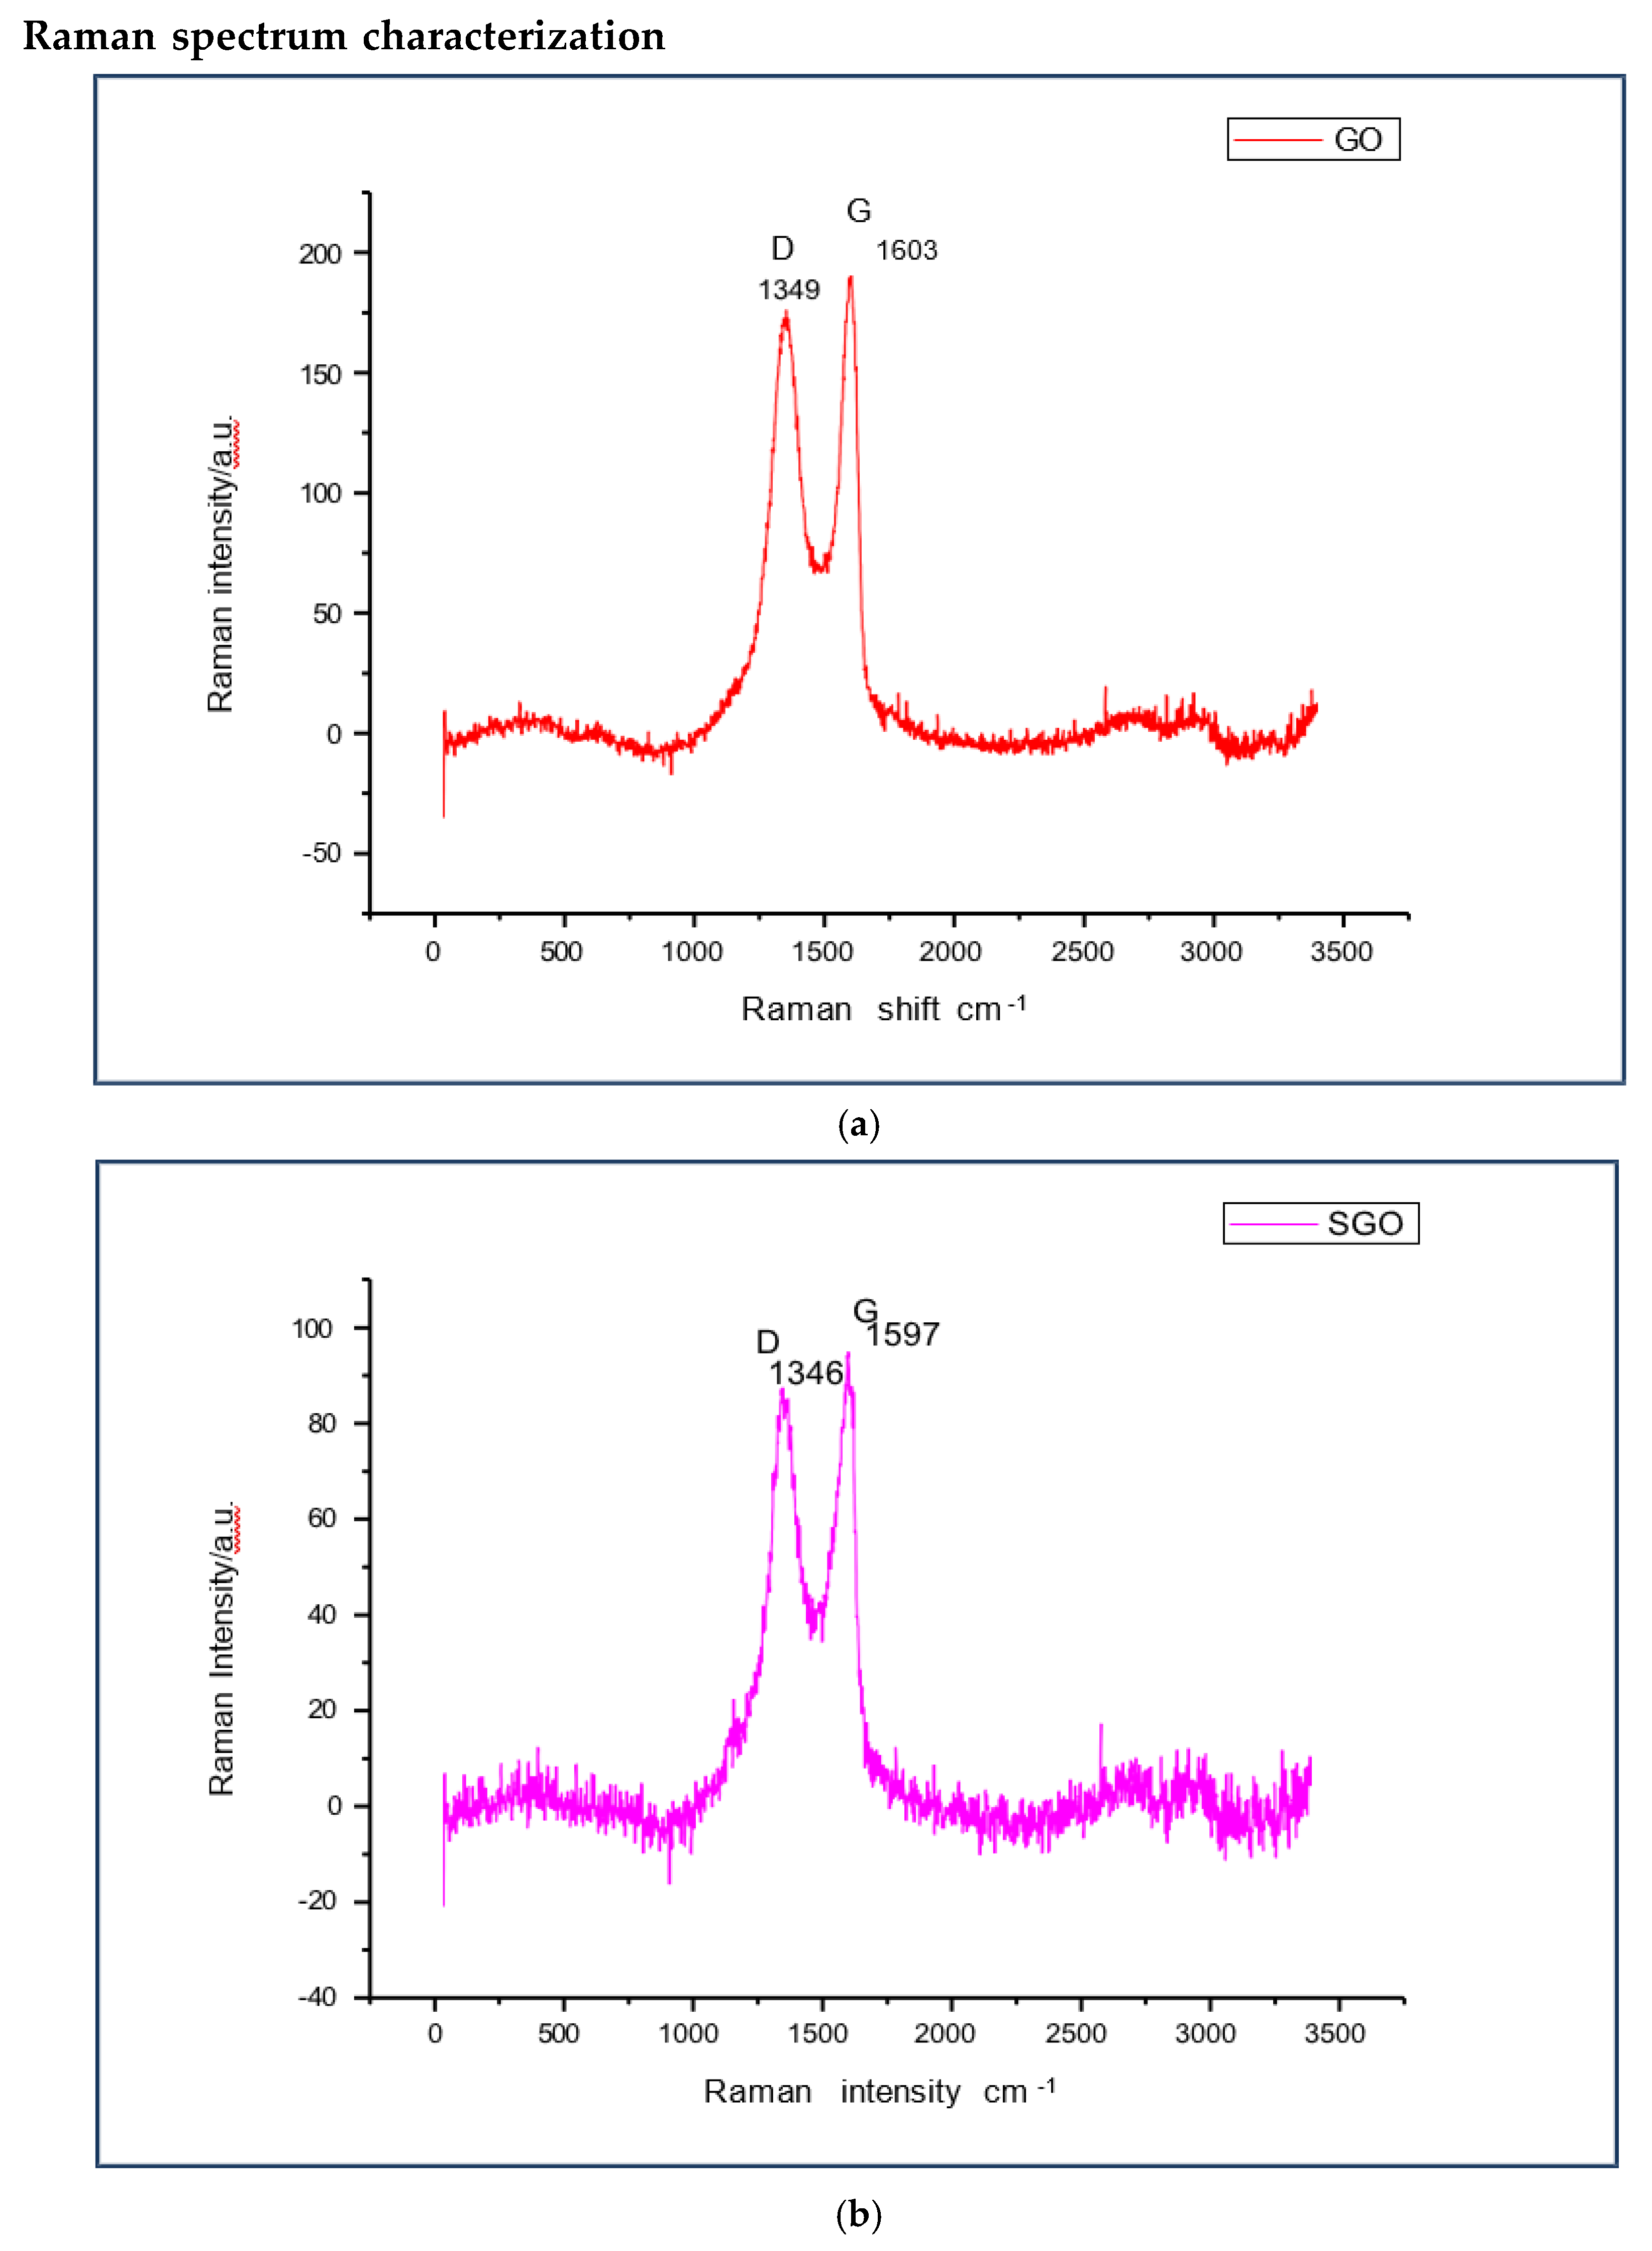
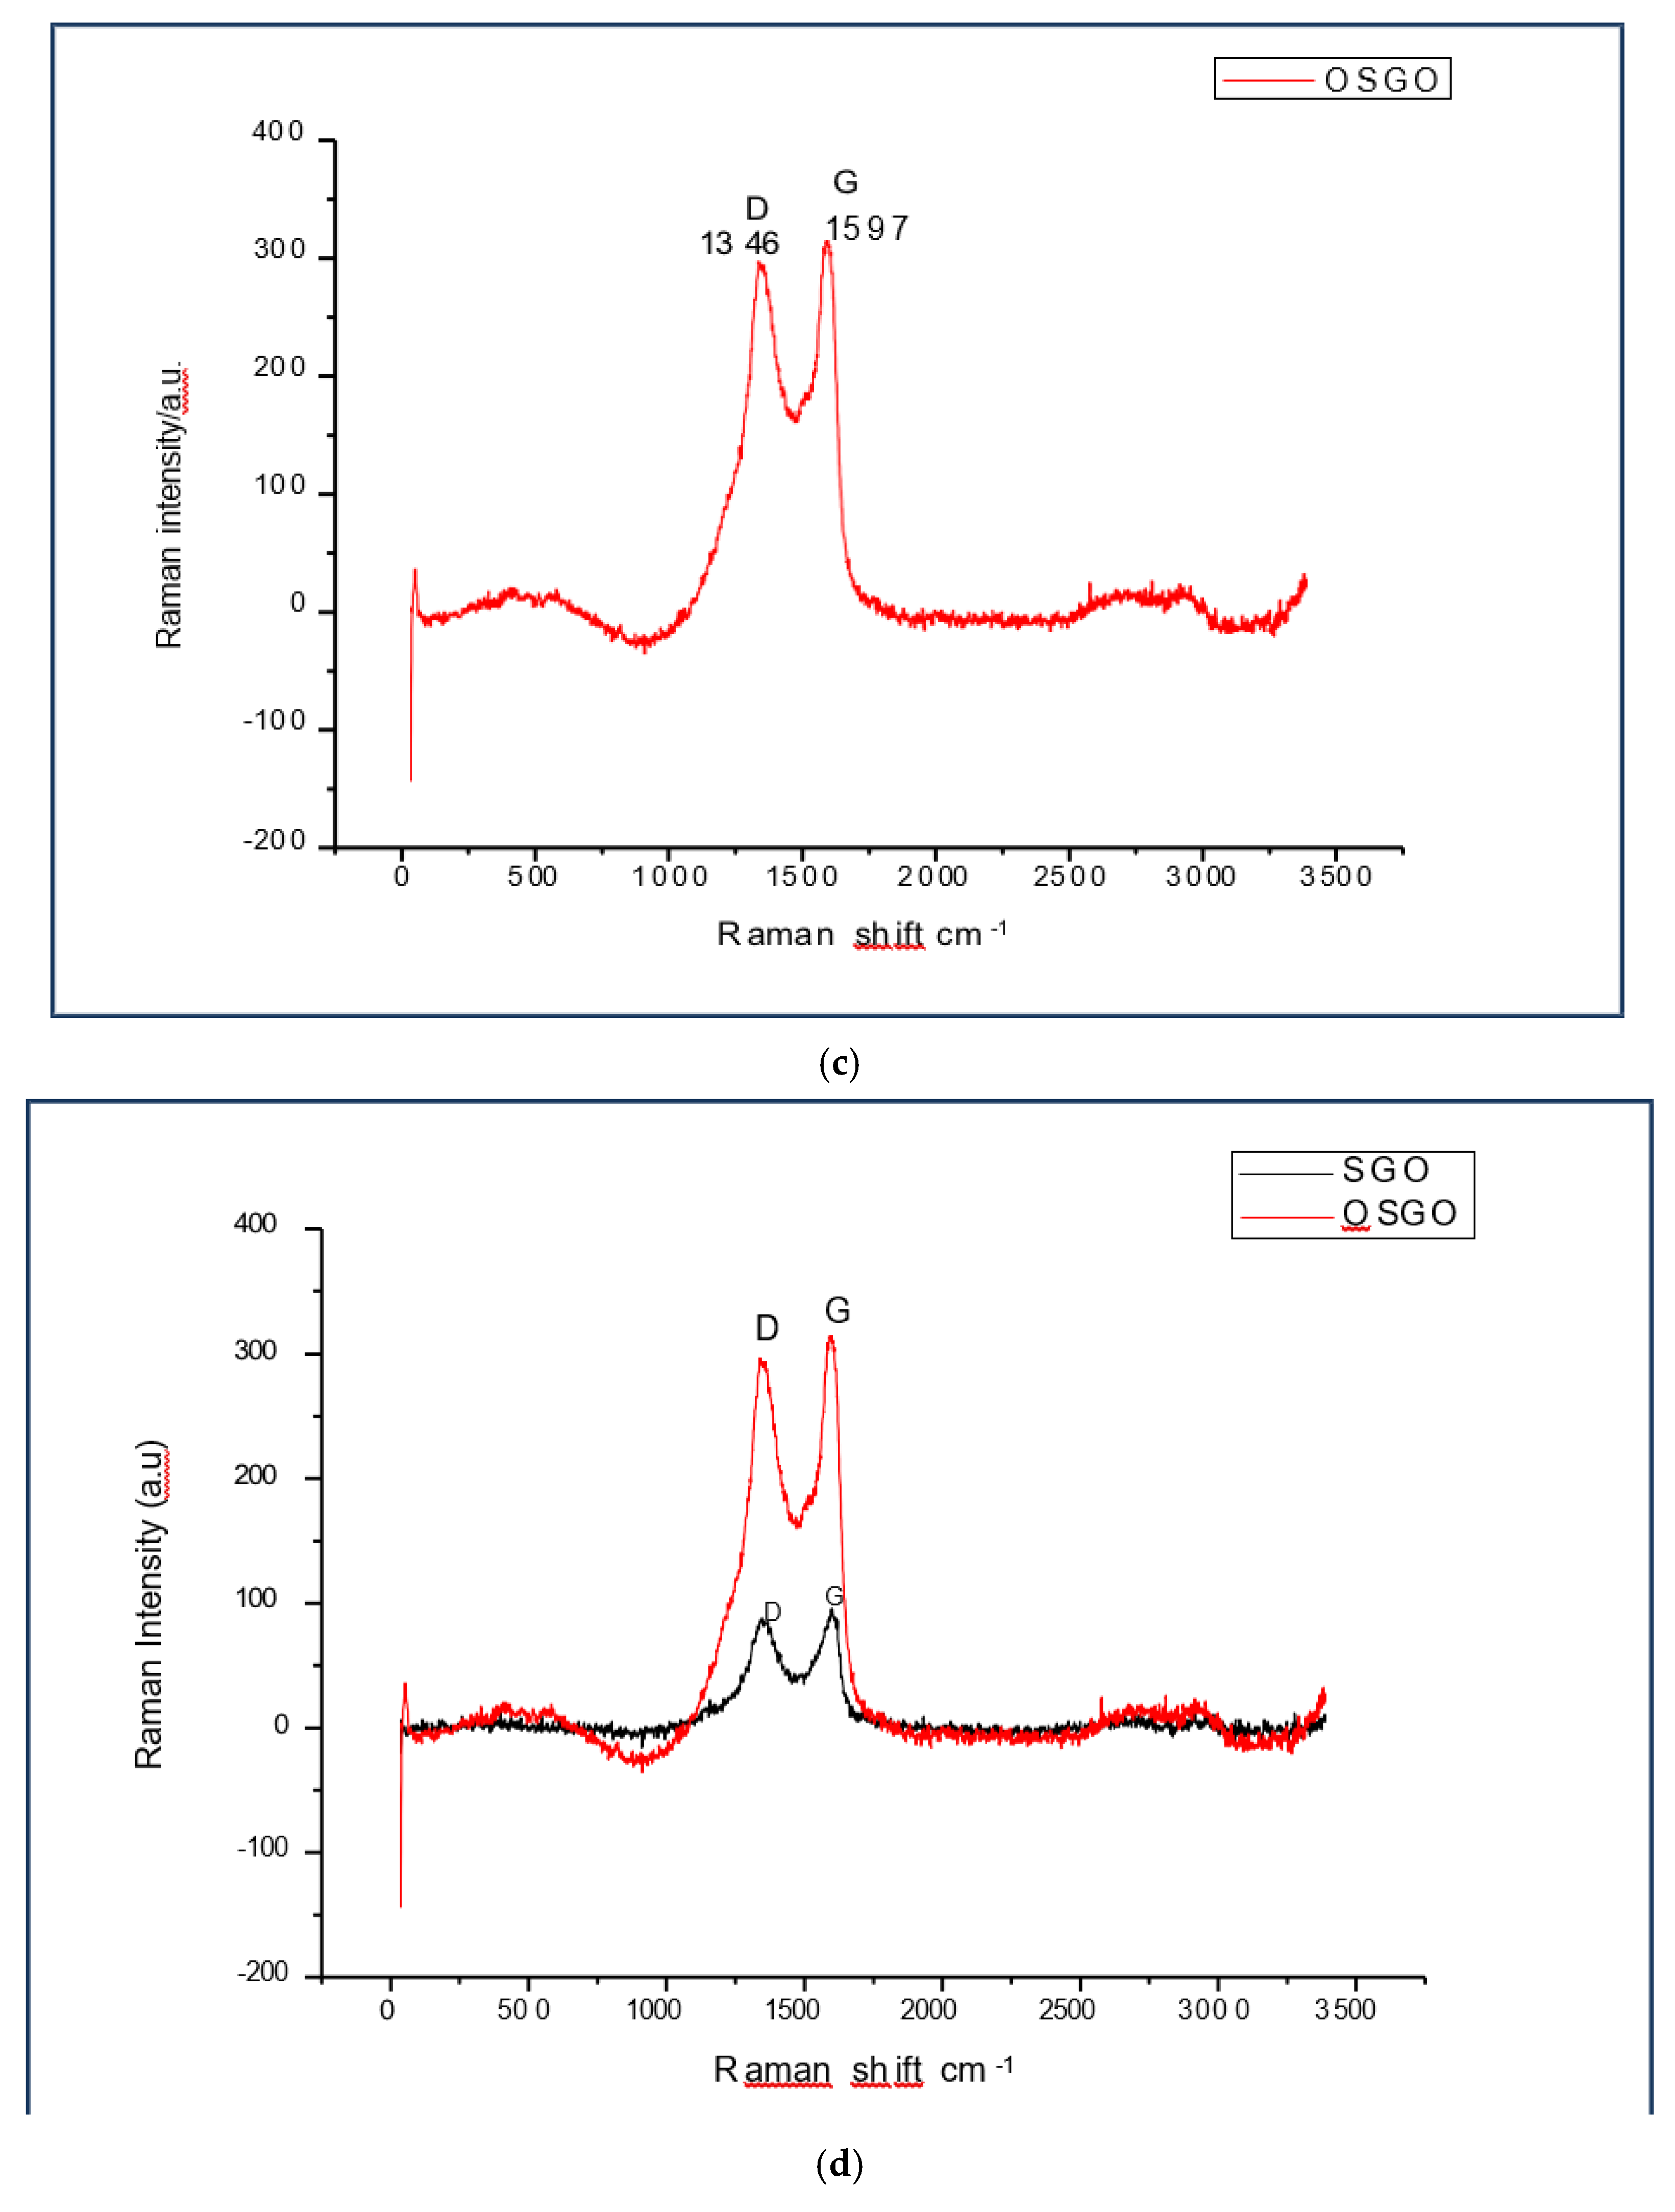
Figure 5.
(d) Raman spectra for GO, SGO and OSGO, showing the shift in raman intensity.
The TGA thermal curve was displayed a weight loss (mg) versus temperature. Based on the weight loss change as a function of temperature, each TGA curve can be divided into various regions, the first initial mass loss region occurred at 30°C (1.41 mg) to 150°C (1.40mg), from 150°C to 260°C (1.23mg). Region two which indicates major weight loss occurred from 260°C to around 340°C (0.81mg) the third region starts from 340 °C (0.81mg) to 490°C (0.66mg), another major weight loss up to temperature of 560°C (0.46mg), the last region stabilized up to 677°C (0.39mg). Weight loss below 100°C is attributed to the absorbed water. Loss of oxygen+containing functionalities such as CO and CO2 is the reason for the second weight loss between 150°C to 220°C. The weight loss at 258°C is attributed to decomposition of sulfonic acid group. Weight loss from 220°C to 400°C is due to weakening of van der Waals forces between the GO layers .
Figure 5b showing derivative of thermo gravimetric analysis, the DTG has various regions which agree with the TGA, with a major weight loss around 194⁰C, 372⁰C and 595⁰C.
XRD for the GO(Figure 6a) has the diffraction angle at 2 theta degree and interplanarspacing values as 11.9 degree and 7.4 Å respectively where as SGO(Figure 6b) peak is observed at 12.7 degree and 7.0 Å, the OSGO (Figure 6c)peak was at 13.2 degree and 6.7 Å. The interplanar spacing is caused by the partial restacking through partial restacking π−π interaction and the removal of oxygen functional groups after sulfornation [138] the shifting of SGO and OSGO film peak towards the higher 2 theta degree as compared to GO is due to addition of sulfonic acid group in SGO and OSGO (Ravikumar and K. Scottm 2012, Gahlot, S., et al., 2014) oxidation may have also contributed to shift towards 2 theta degree, a notable observation is decrease in interplanar spacing is noted in OSGO as compared to SGO and GO, where the OSGO is the least.
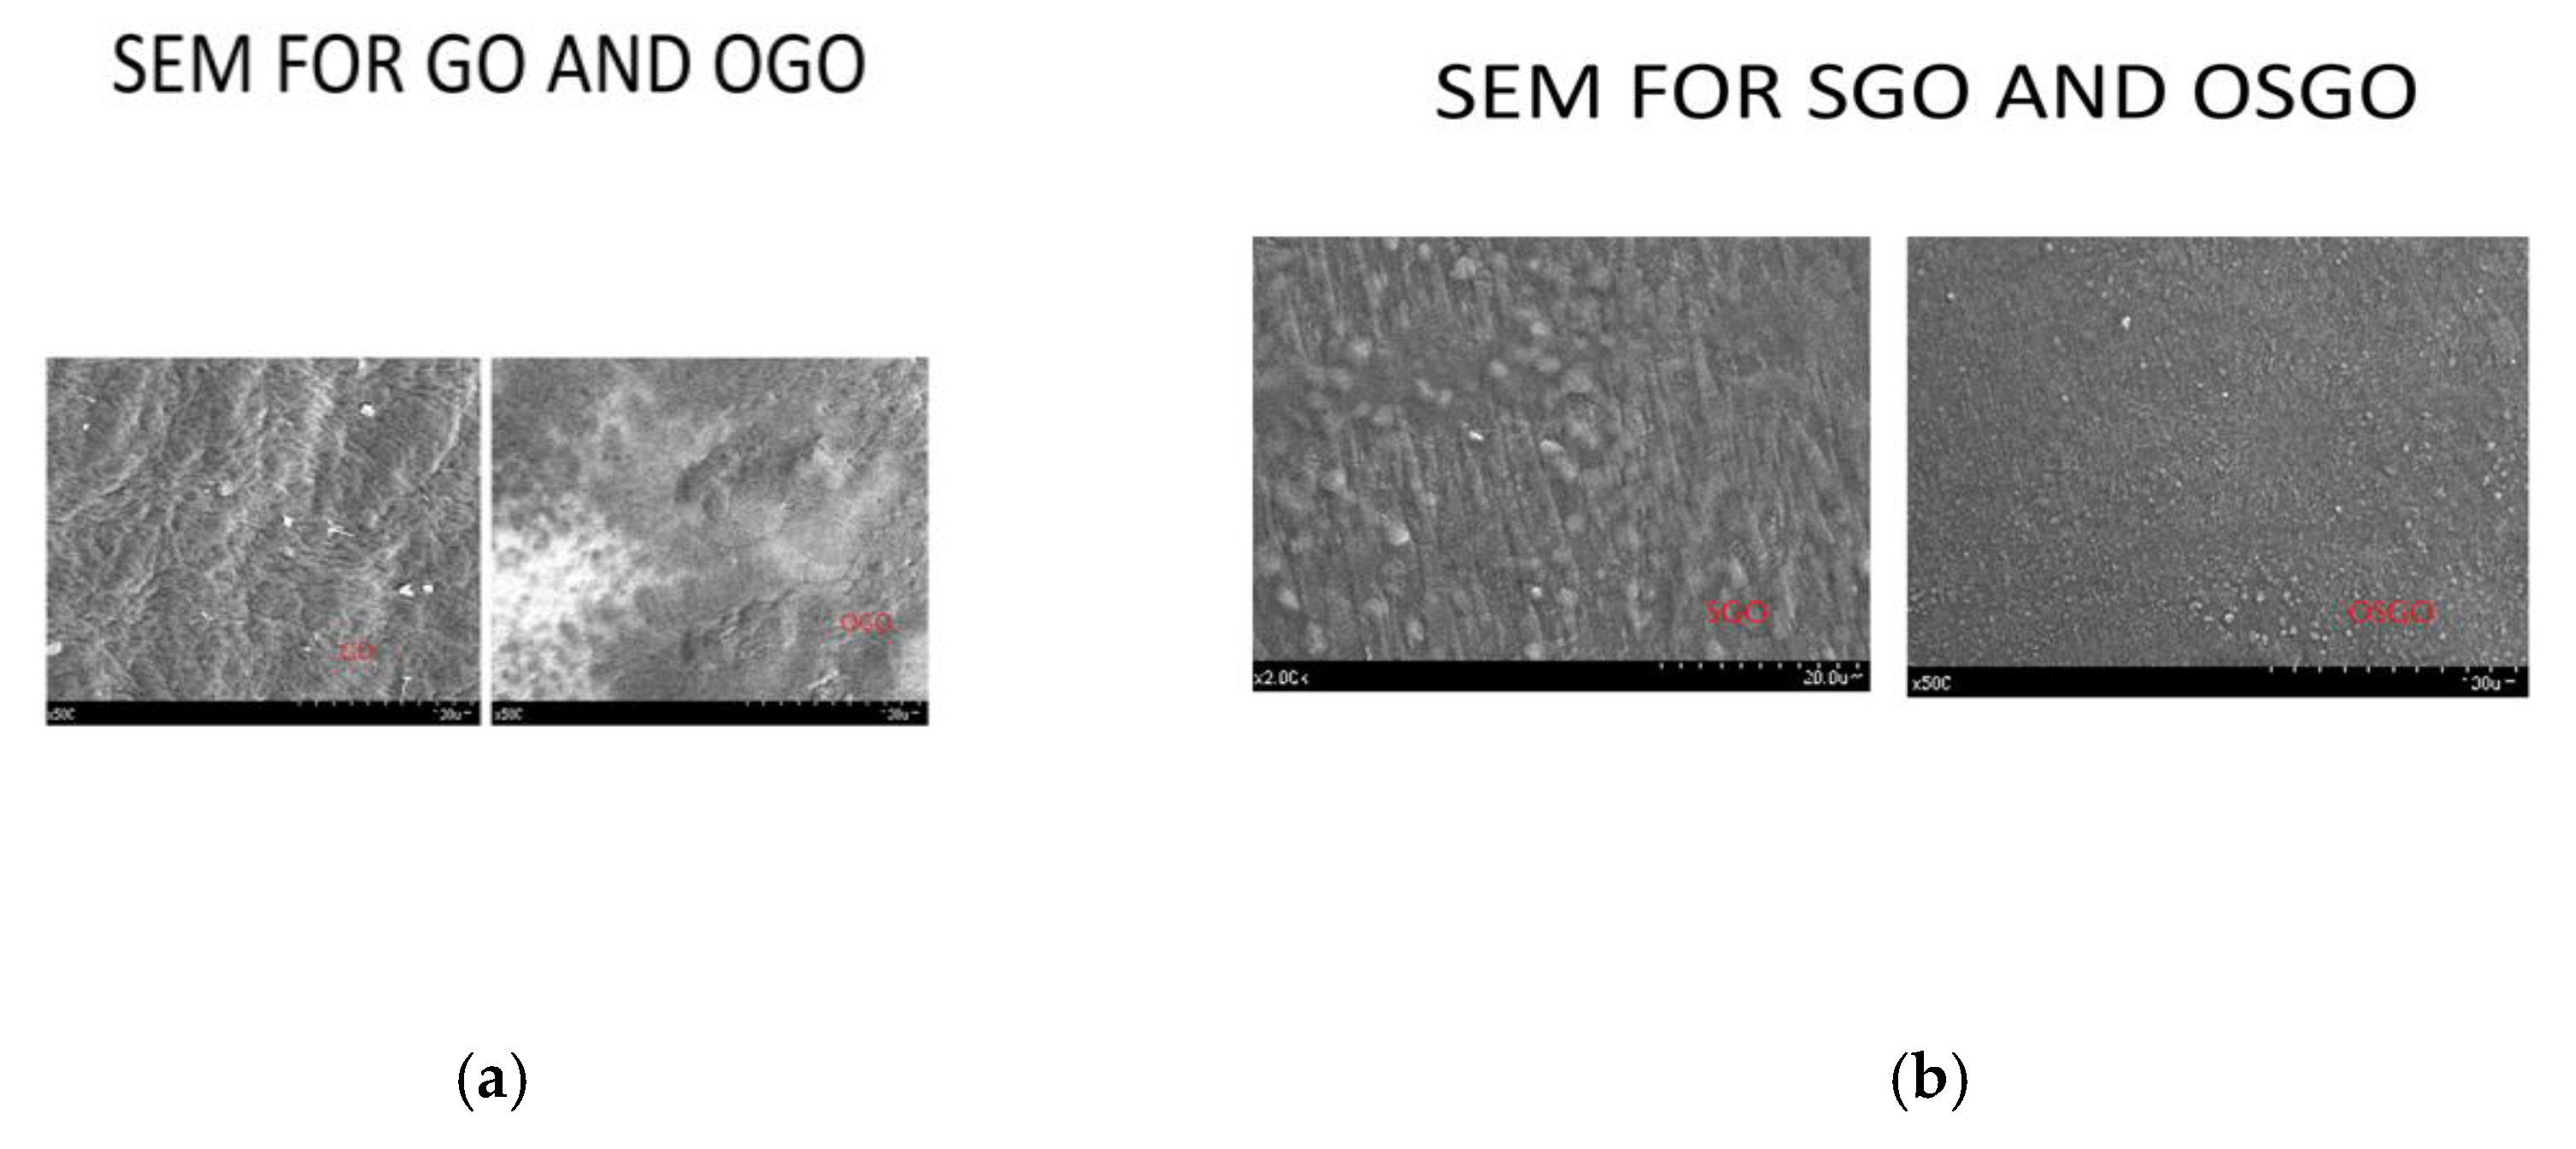
The scanning electron microscope images (Figure 7 a,b) shows complex matrix with no pores on the surface which may be a good barrier against oxygen in proton exchange membranes
Conclusion
Ozonated sulfanilic graphene oxide was developed in this experiment, the method of preparation is easy but care in needed during Ozonation stage for it was noted that much Ozonation could remove S-O group. There is a clear shift observed in UV-VIS upon Ozonation, for the FT-IR data there is no much difference in SGO and OSGO only an increased transmittance showing that the chemicals remained intact but when it compare with the GO there a noticeable addition of functional groups which attributes to the absorption of sulfonic acid group. The Raman spectra for SGO and OSGO appear at the same shift the only difference is Raman intensity where OSGO has higher Raman intensity. OSGO shows thermal stability as evidenced by the TGA and its derivative (DTG). For the XRD SGO reduced interplanar distance compared to SGO and GO. This shows there was development of novel graphene composite (OSGO). Which can find use in various applications.
References
- Ravikumar; Scott, K. Freestanding sulfonated graphene oxide paper: a new polymer electrolyte for polymer electrolyte fuel cells. Chemical Communications 2012, 48, 5584–5586. [Google Scholar] [CrossRef] [PubMed]
- Gahlot, S.; et al. SGO/SPES-Based Highly Conducting Polymer Electrolyte Membranes for Fuel Cell Application. ACS Applied Materials & Interfaces 2014, 6, 5595–5601. [Google Scholar]
- Marcano, D.C.; et al. Improved Synthesis of Graphene Oxide. ACS Nano 2010, 4, 4806–4814. [Google Scholar] [CrossRef] [PubMed]
- Gao, W.; et al. Ozonated Graphene Oxide Film as a Proton-Exchange Membrane. Angewandte Chemie International Edition 2014, 53, 3588–3593. [Google Scholar] [CrossRef] [PubMed]
Figure 1.
(a) Shows the Photo of GO and (b) Upon addition of H2O2.
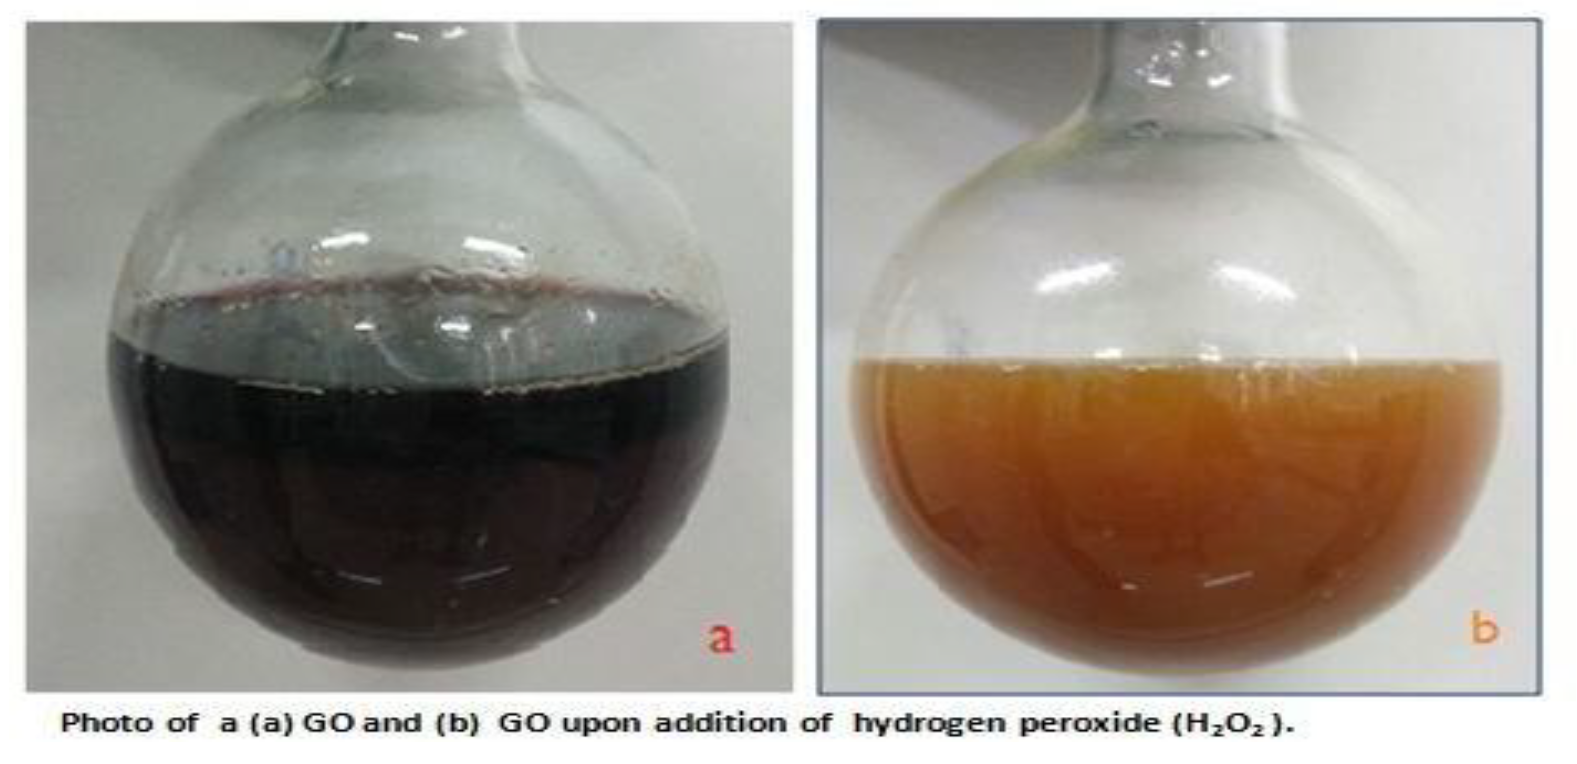
Figure 5.
(a) TGA for OSGO showing various region of weight loss with increase in temperature. (b) DTG for OSGO.
Figure 5.
(a) TGA for OSGO showing various region of weight loss with increase in temperature. (b) DTG for OSGO.
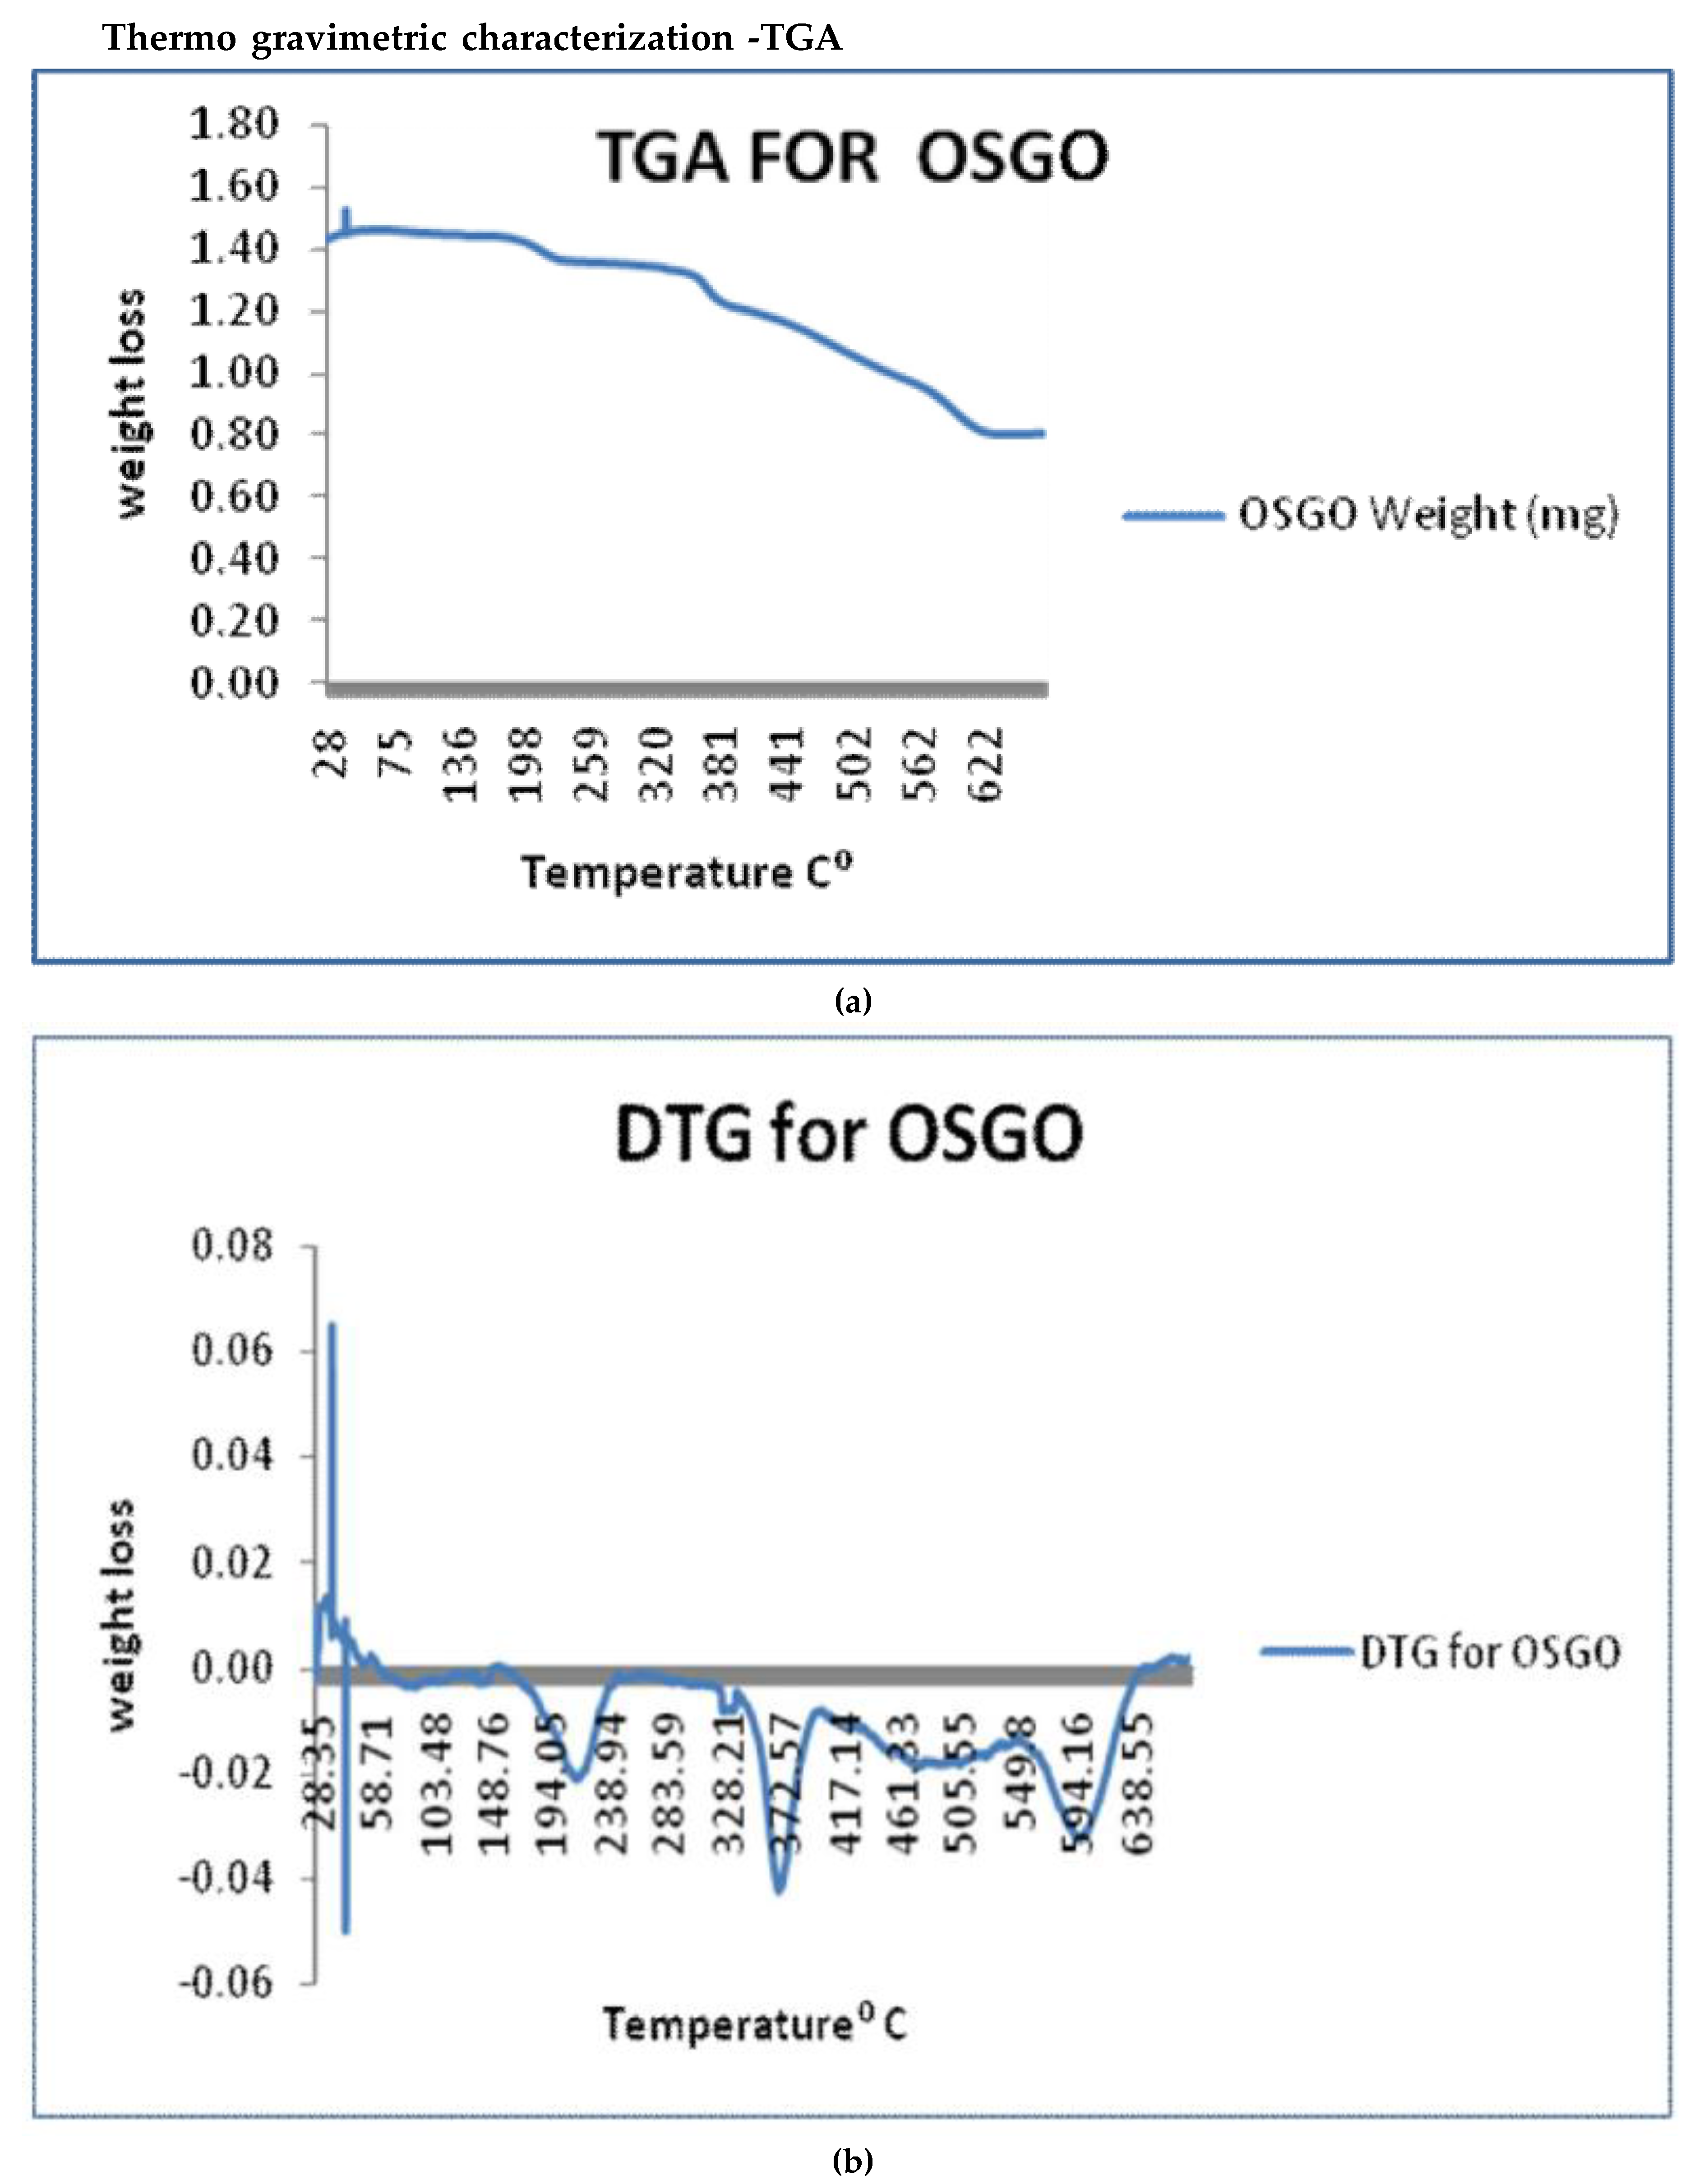
Figure 6.
(a) XRD for GO interplanar spacing values as 11.9 degree and 7.4 Å respectively. (b) XRD for SGO showing and interplanar spacing values as 12.7 degree and 7.0 Å respectively. (c) XRD for OSGO showing and interplanar spacing values as 13.2 degree and 6.7 Å respectively. (d) XRD for GO, SGO and OSGO.
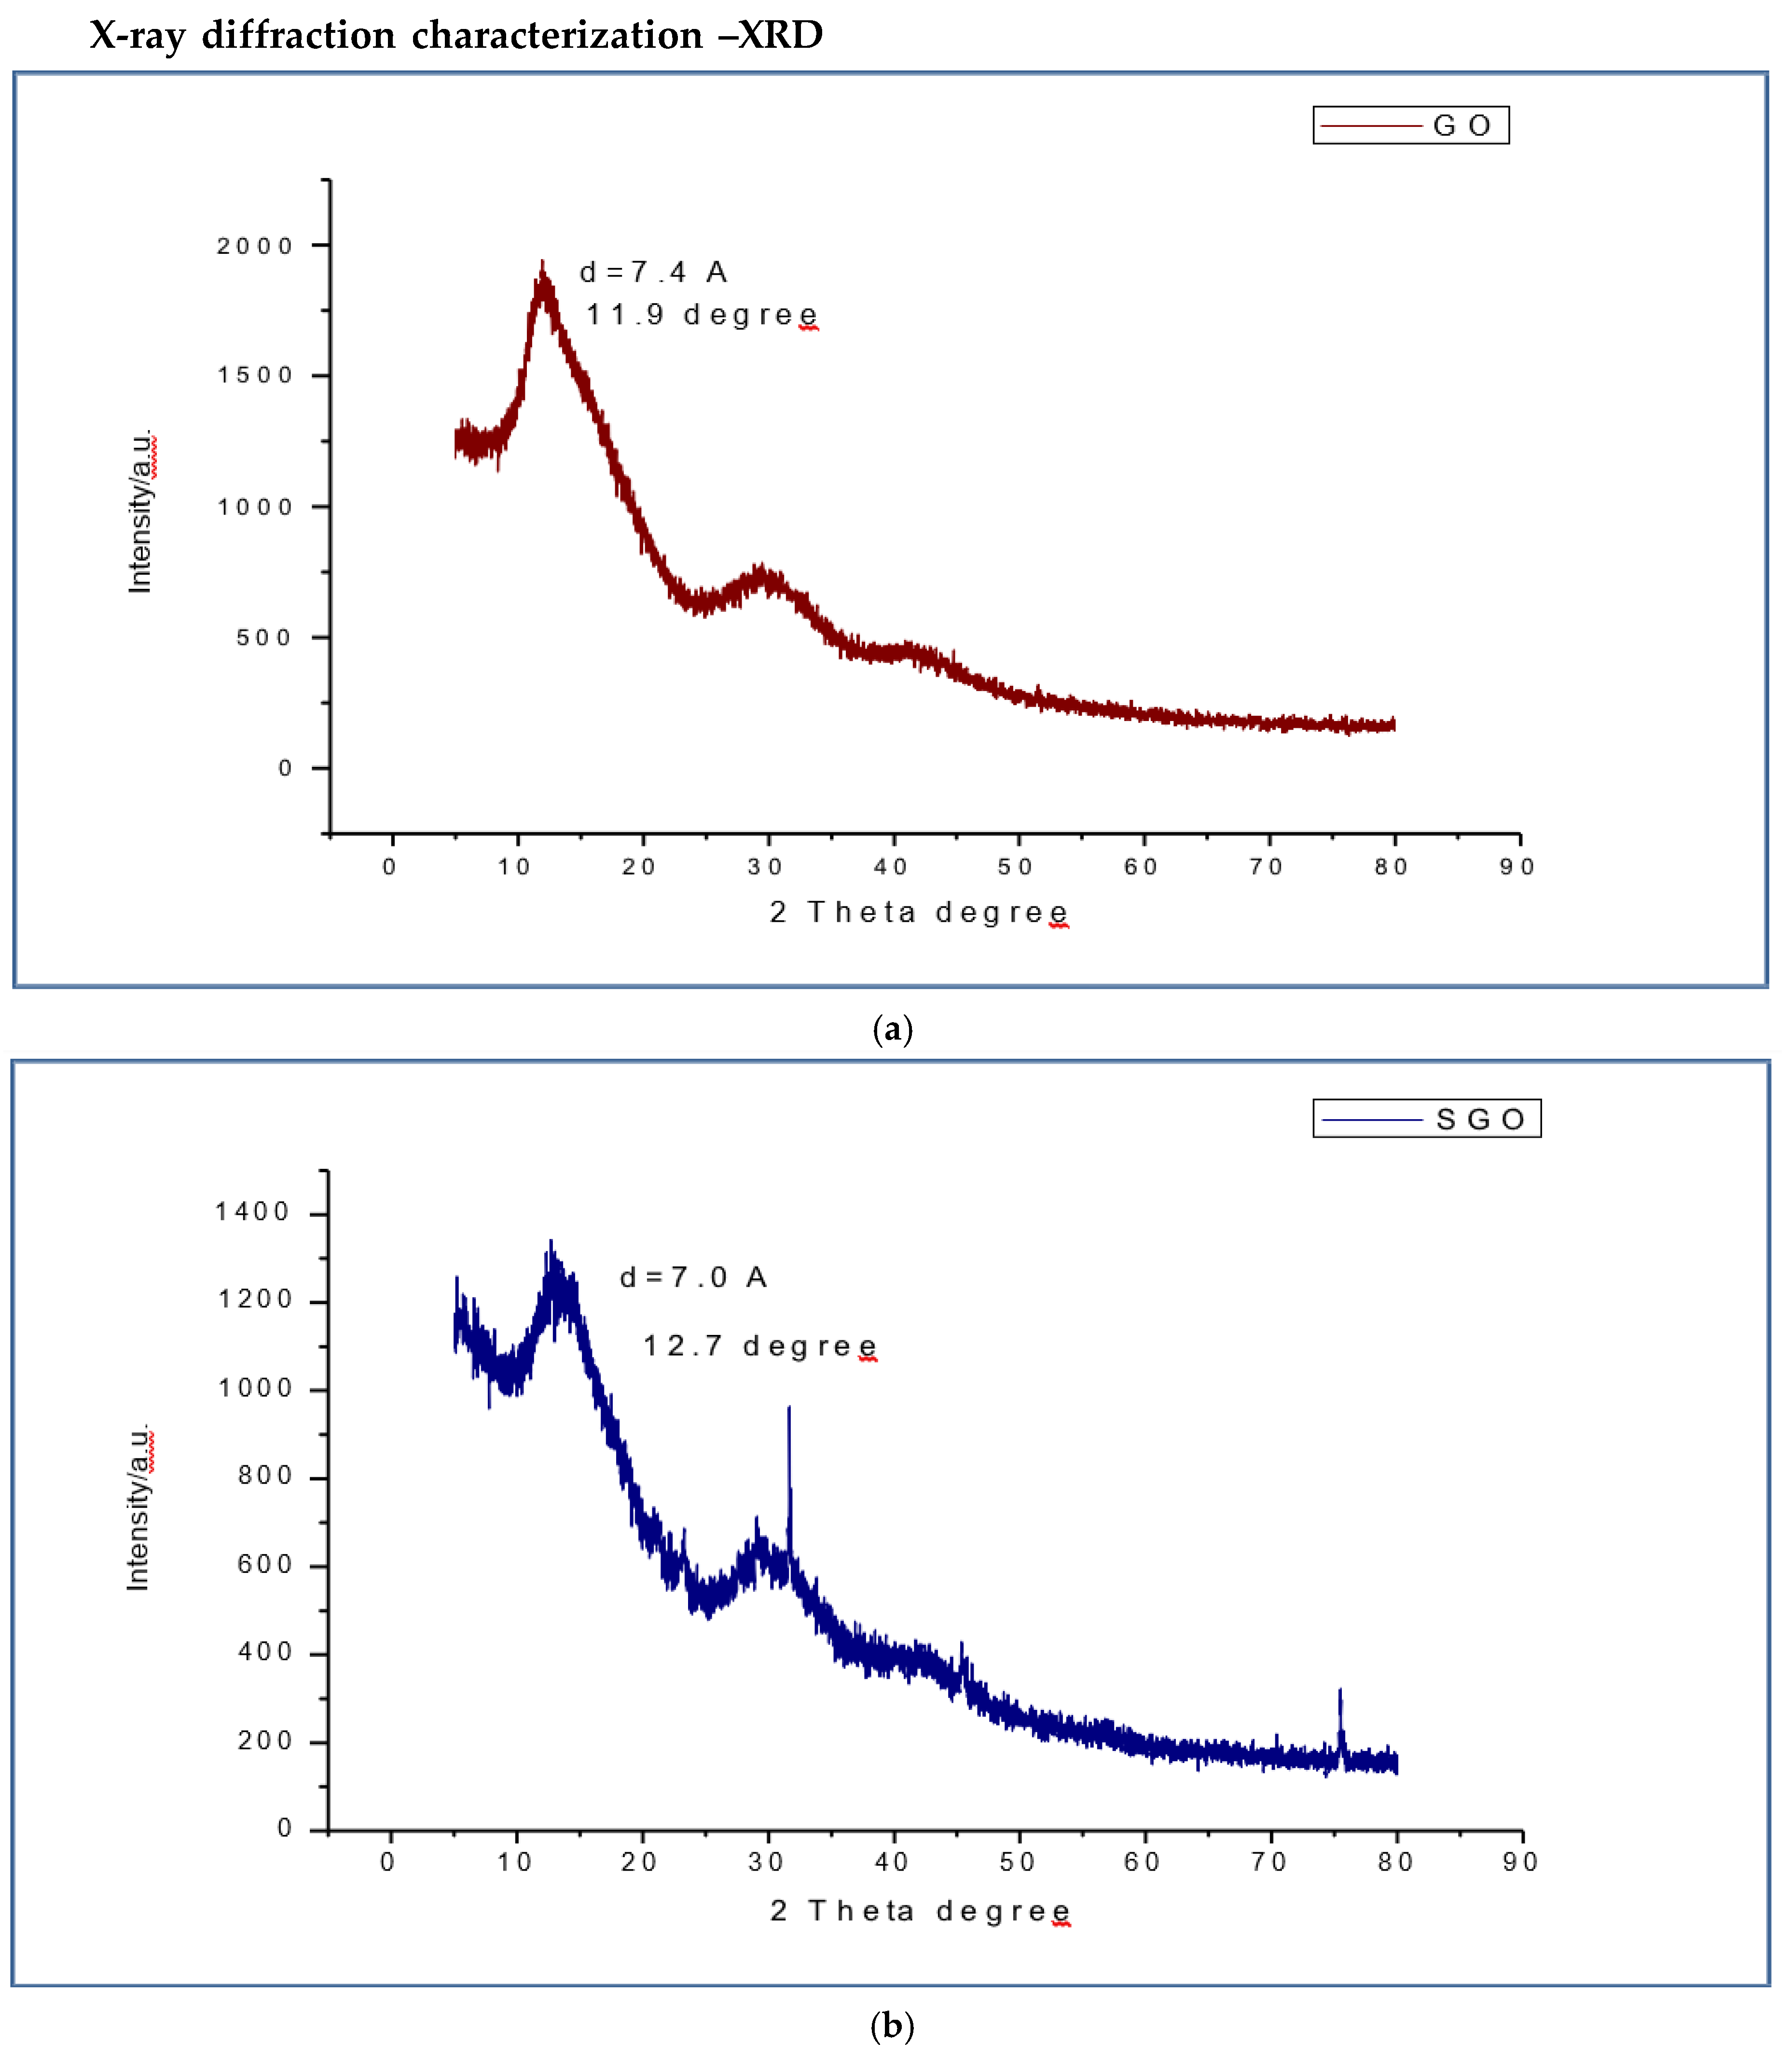
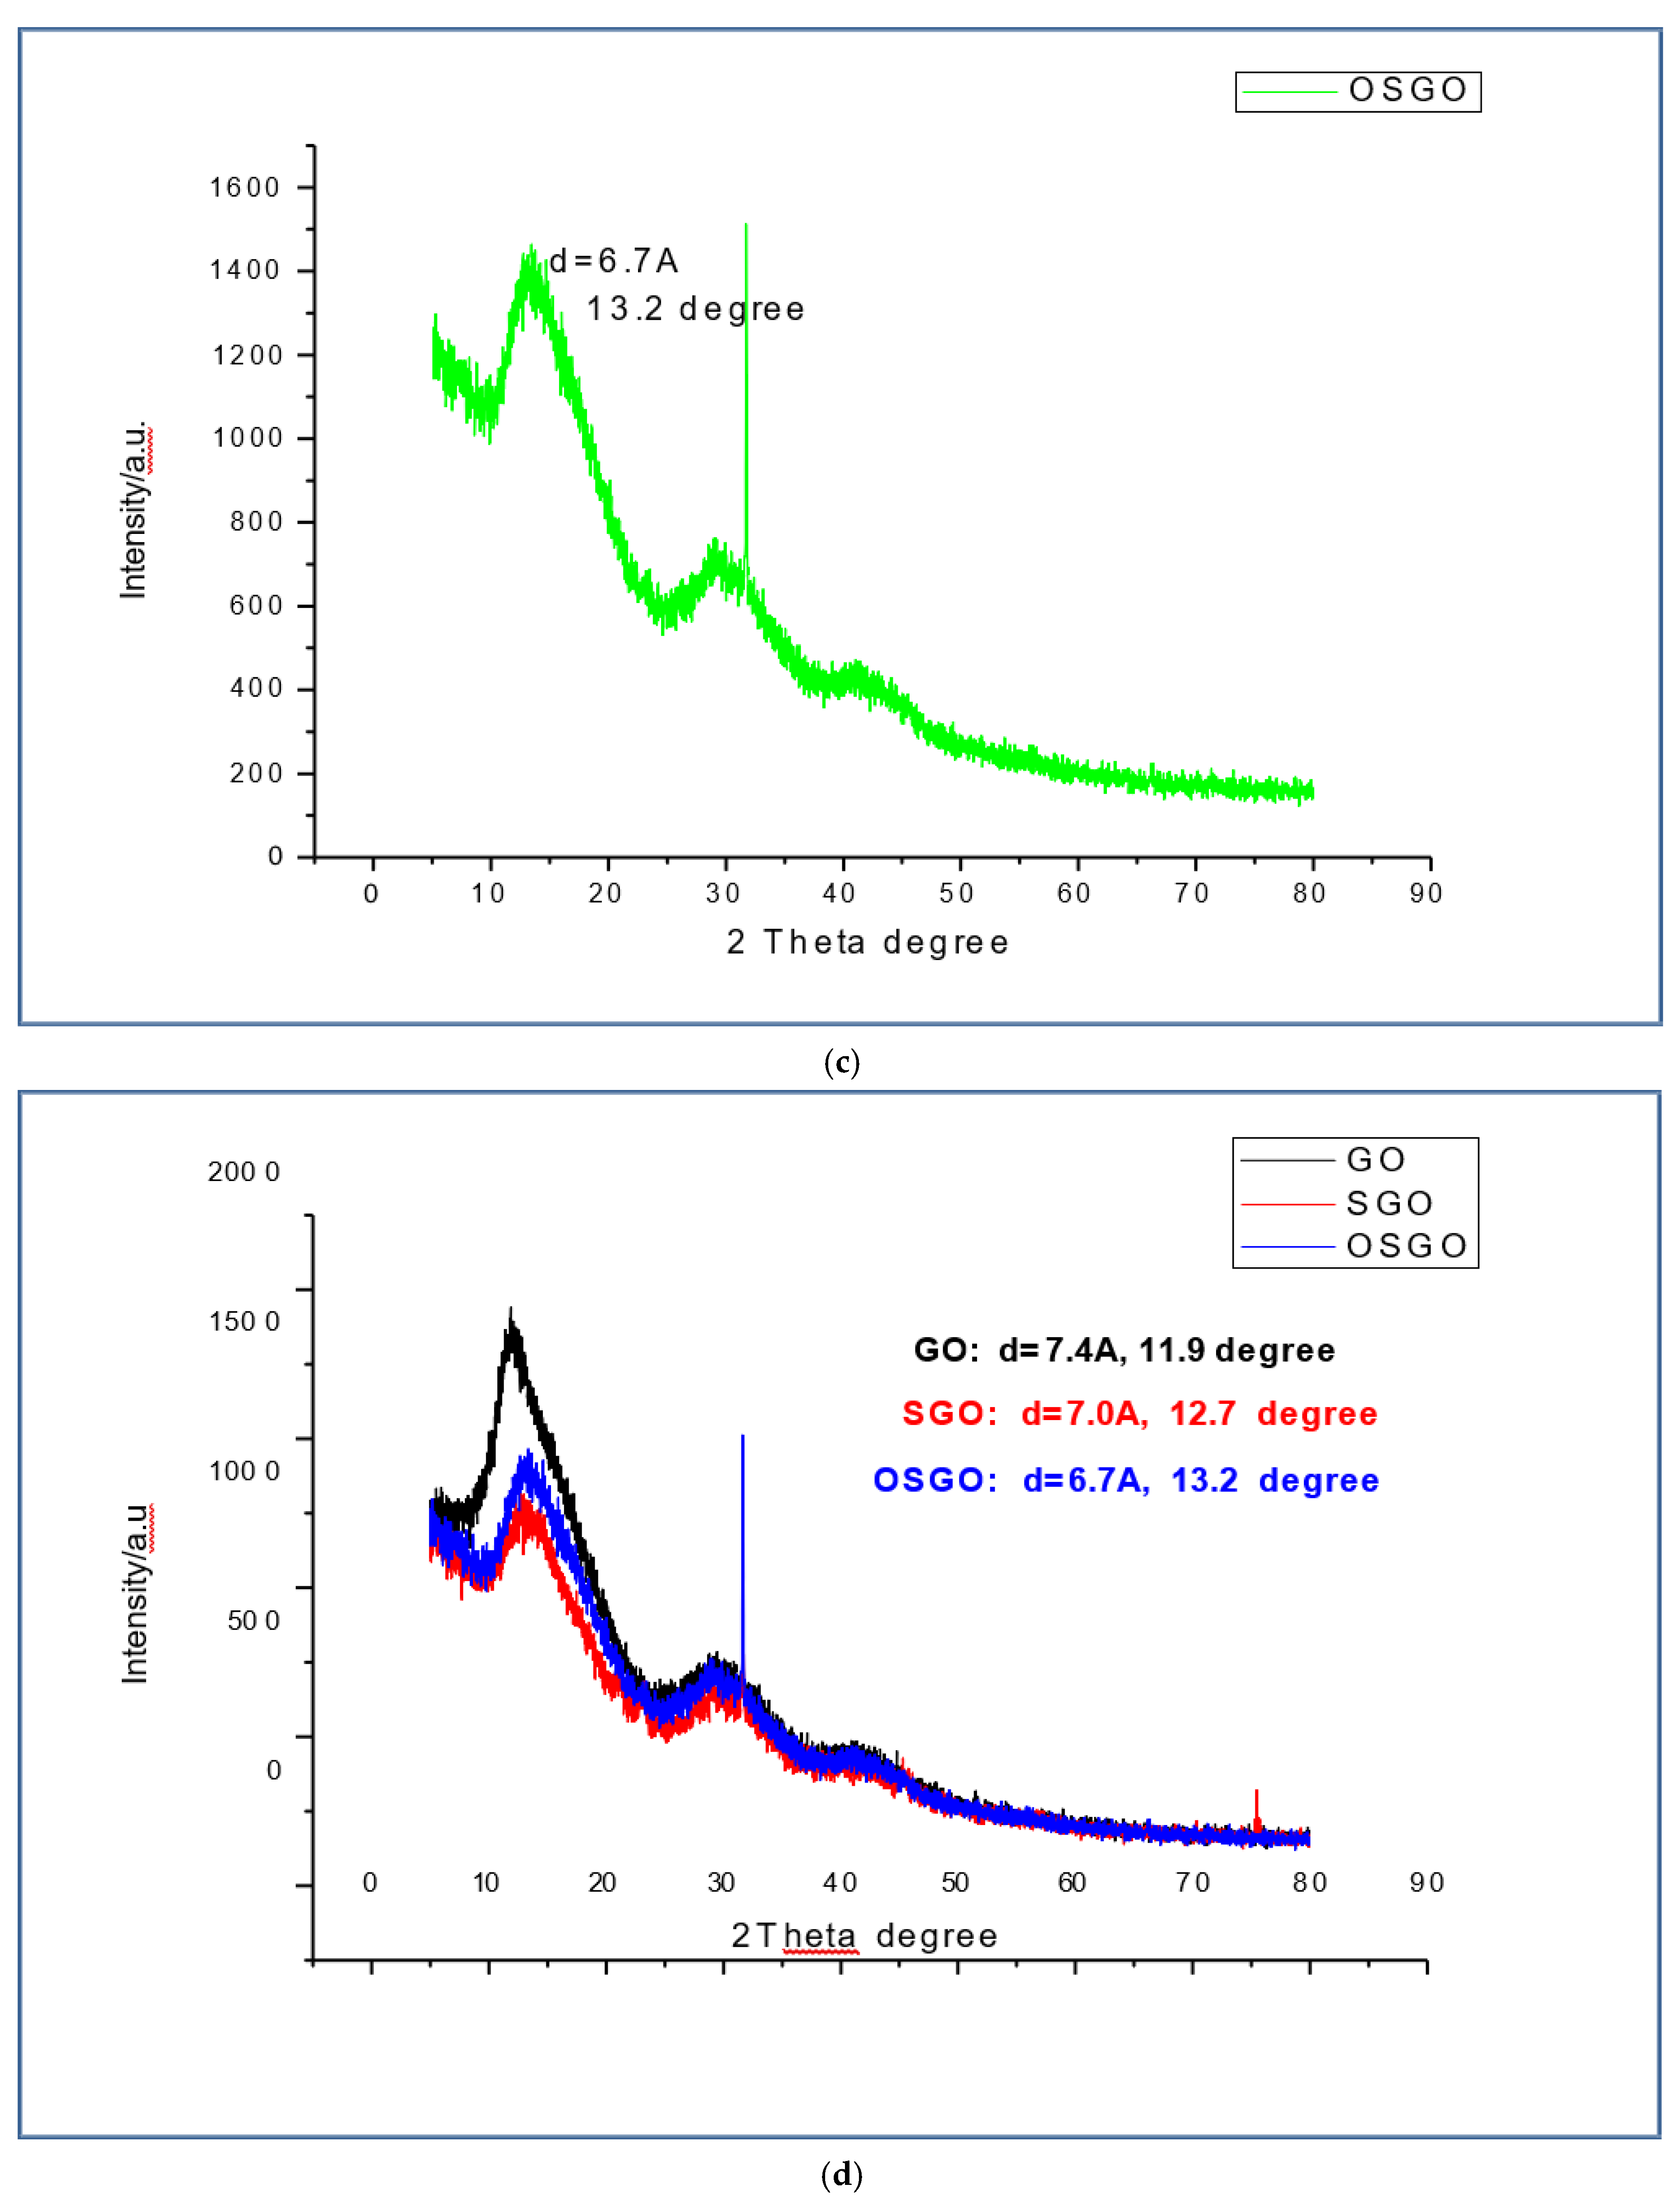
Figure 7.
Caption.
Disclaimer/Publisher’s Note: The statements, opinions and data contained in all publications are solely those of the individual author(s) and contributor(s) and not of MDPI and/or the editor(s). MDPI and/or the editor(s) disclaim responsibility for any injury to people or property resulting from any ideas, methods, instructions or products referred to in the content. |
© 2025 by the authors. Licensee MDPI, Basel, Switzerland. This article is an open access article distributed under the terms and conditions of the Creative Commons Attribution (CC BY) license (http://creativecommons.org/licenses/by/4.0/).
Copyright: This open access article is published under a Creative Commons CC BY 4.0 license, which permit the free download, distribution, and reuse, provided that the author and preprint are cited in any reuse.


