Submitted:
11 August 2025
Posted:
19 August 2025
You are already at the latest version
Abstract
Crew legality violations pose significant operational challenges for airlines. Introducing buffer times in crew flight duty periods during the planning phase can mitigate these violations but often lead to higher planning costs. This paper presents a machine learning–driven framework, coupled with a simulation-based analysis, to balance this trade-off. We develop CatBoost models that accurately predict flight delays, translating these predictions into optimal buffer time allocations within crew schedules. Our findings highlight the critical role of delay prediction profiles and conservatism levels in achieving this balance. A case study using American Airlines data demonstrates how our approach helps decision-makers identify buffer levels that minimize legality violations while controlling costs.
Keywords:
crew scheduling
; legality
; planning costs
; flight duty period
; buffers
; machine learning
1. Introduction and Motivation
One of the major challenges crew schedulers in the airline sector face is creating flight duty schedules that ensure pilots stay within legal limits throughout the day. Airlines are required to comply with stringent regulations regarding flight and duty periods, as well as rest times, as specified in Part 117 of the Code of Federal Regulations [1]. These rules aim to improve safety by minimizing pilot fatigue, but they also complicate the scheduling process, especially when flights experience delays or other operational disruptions.
In this study, we focus on the limitations of the flight duty period outlined in CFR Part 117 for unaugmented operations, which refer to flights operated by the minimum number of required crew members. Specifically, Table B of CFR Part 117 outlines the maximum allowable duty period lengths based on the start time of the duty window and the number of flight segments scheduled within that period; see Figure 1.
An important yet often overlooked aspect of this challenge is identifying a suitable buffer time within duty periods to protect the operation against potential disruptions. Inevitable flight postponements due to inclement weather, maintenance issues, and onboarding disruption, among others, can lead to an excessive number of limitations in the flight duty period that prevent crew members from fulfilling their daily schedules. Therefore, insufficient buffer allocation increases the risk that pilots exceed legally mandated duty limits, potentially resulting in significant operational disruptions, such as costly crew rescheduling, extended delays, or flight cancellations. The issue of maintaining crew legality through the integration of protective buffers to avert duty-time violations was initially addressed by Gershkoff in 1989 [2], wherein the significance of proactively managing duties that exceed limits was underscored.
Conversely, overly conservative buffer allocations can lead to suboptimal crew utilization and inefficiencies in network planning; excessive buffers restrict crew schedulers from assigning an adequate number of flight segments within a duty period, thereby hindering the effective use of available resources. Thus, examining the optimal buffer time is crucial for balancing operational resiliency and planning costs.
In this study, we propose an innovative data-driven framework for determining optimal buffer times to construct robust crew schedules that comply with duty period regulations while maintaining a low planning cost. Effective buffering requires a detailed analysis of historical flight delays, which introduce uncertainty into the crew planning process. Specifically, our goal is to determine, for any flight positioned as the final segment of a candidate duty, how many minutes should be subtracted from the allowable duty period as a buffer to mitigate the risk of delay-induced violations; If the total duration of a candidate duty, after accounting for the buffer, exceeds the allowable limit, the duty is deemed infeasible and cannot be scheduled, see Figure 2 and Figure 3 for example. Notice that adding buffers to Leg 3 in the first duty (Figure 2) reduces the available time within the maximum regulatory flight duty period, which results in creating a new duty (Figure 3) to cover the same flight, however this new duty has only two flights and hence might have higher planning costs.
To address this operational challenge, we employ advanced machine learning techniques, specifically gradient boosting models such as CatBoost, to identify high-risk flight duty scenarios. The proposed methodology predicts the delay of the final segment based on detailed flight-level characteristics and operational context, enabling the targeted insertion of buffer times within a candidate duty. For precise analysis of flight delay performance, we assemble an extensive dataset that includes operational records augmented with diverse features, such as operation month, departure station and hour, fleet type, weekday, number of boarded passengers, among others. Then, anomalies within this data are identified through an unsupervised machine learning method, Isolation Forest. Furthermore, we evaluate each feature’s impact on flight delays to pinpoint the most significant factors for focused performance enhancement. We couple our machine learning models with a simulation-based analysis which provides a guideline for selecting suitable buffering levels. This enables airline decision-makers to balance the risk of legality violations against planning costs, represented by the number of duties required to cover the scheduled flights. Our simulation scheme is based on tuning a buffer parameter, which allows users to control the level of schedule conservatism against operational uncertainty. In the results section, we present plots that illustrate the trade-off between risk and cost metrics, providing decision-makers with a tool to identify the most suitable buffering strategy based on their operational priorities. The numerical results of this work are based on published planning and operational data from American Airlines Inc. The results are encouraging, indicating that a 12% increase in planning cost investment could yield nearly a 30% reduction in legality violations.
The remainder of this paper is organized as follows. Section 2 provides a review of the related literature. Section 3 introduces the components of the analytical model developed in this work. Section 4 presents the case study and the computational experiments. Finally, Section 5 concludes the paper and discusses directions for future research.
2. Literature Review
The incorporation of buffer times into airline crew schedules as a strategy to mitigate the impact of flight delays is a well-established topic in the literature. To that end, we organize the literature as follows. First, we review studies on buffering schedules in numerous fields and mainly focus on airline-related ones, specifically buffering block and ground times. Second, we examine research addressing crew-related scheduling under uncertainty, along with the associated performance metrics. Finally, we highlight our contribution, which specifically addresses the challenges related to pilot legality.
The concept of buffer injection into schedules to enhance the robustness against uncertainty in delays is not only used for airlines (e.g., [2]), but rather several scheduling applications including project management [3,4,5,6], train scheduling [7], machine and flow shop scheduling [8]. For airline schedules, [9] proposed a stylized two-flight model for optimizing ground and flight (block-time) buffers. The model simplicity allowed the authors to present theoretical and empirical results for optimal buffers that balances such a trade-off. In a similar fashion, [10] presented a numerical analysis based on artificial data to show some important reasons why an airline should inject block-time buffers. [11] presented a stochastic integer programming framework that maximize expected profit, while ensuring two service levels of on-time performance (OTP) and completion of passenger itineraries. [12] approached the same problem as [11] but presented a deterministic multi-objective optimization model that generates ground buffers to balance the trade-off between OTP and passenger connectivity. In a similar fashion, [13] presented a Monte Carlo Simulation to model the delay profiles using historical schedules for the Scandinavian Airlines. The authors give some insights on recommending higher buffers mostly in winter times due to weather resulting delays.
Crew scheduling under uncertainty has also attracted significant attention in the literature (e.g., [14,15,16,17,18]). Building on this body of work, [19,20] further addressed the challenge of minimizing the cost of propagated delays within an integrated aircraft routing and crew pairing framework.
With the power of advanced predictive models, the use of machine learning became more relevant as inputting accurate delay predictions (translated to buffers) into scheduling problems, has also been considered in the literature. For example, [21] claim that accurate delays can help in better decision making for assigning number of crew reserves1 and flight connection time. Due to the fact that predictions might in many cases be inaccurate, a study which allows in determining the level of prediction conservatism which balances the trade-off between planning cost and operational resiliency was not conducted which is addressed in this paper. To the best of our knowledge, the specific problem of incorporating buffers to manage crew legality, balancing the trade-off between planning costs and operational costs arising from delays and duty time exceedance, has not been directly addressed in the literature. Accordingly, this paper fills this gap by introducing the following contributions:
- We introduce the concept of buffering crew duties to protect against legality violations due to inevitable flight delays.
- We develop machine learning models that identify key features which can accurately predict delays.
- We propose a simulation-based analysis that allows in balancing the trade-off between planning costs and risks of legality violations.
3. Model Development
In this section we detail our machine learning methods, that predict flight delays translated to duty buffers, which are then, integrated within a simulation scheme to balance operational resilience by ensuring crew legality, and planning costs through more efficient crew utilization. Our machine learning models utilize unsupervised and supervised learning techniques, such as Isolation Forest, CatBoost, and SHAP (SHapley Additive exPlanations) for anomaly detection, model training, and interpretability.
3.1. Data Collection and Preprocessing
Data was obtained from American Airline crew scheduling systems, encompassing a comprehensive set of operational variables, including flight schedules categorized by varying levels of operational intensity (i.e., high, moderate, and low) over a three-year period. Following initial preprocessing steps, such as handling missing values and encoding of categorical characteristics, the dataset was partitioned into training and testing subsets using an 80/20 split to facilitate model development and evaluation.
3.2. Anomaly Detection with Isolation Forest
We implement an unsupervised Isolation Forest algorithm to detect anomalous delay variances that mainly have been caused by weather or maintenance issues. Isolation Forest identifies outliers by isolating observations through recursive partitioning, making it suitable for high-dimensional operational data. Isolation Forests depend primarily on a user-defined hyperparameter known as the contamination rate, which controls the proportion of data expected to be outliers. This parameter directly influences the sensitivity of outlier detection and, by extension, reflects the decision-maker’s level of conservativeness. A higher contamination rate results in more aggressive identification and removal of outliers, thereby producing less conservative buffer estimates. In contrast, lower contamination rates retain a greater number of data points, including those arising from irregular operations, leading to more conservative buffer allocations. For this study, we consulted subject matter experts from the airline industry and adopted a contamination rate of 5%, based on their domain-specific insights and operational considerations.
3.3. Predictive Modeling with CatBoost
For predictive modeling, we employed CatBoost, a gradient boosting algorithm that is particularly effective with categorical features and small-to-medium-sized datasets. The target variable was defined as the delay in minutes. CatBoost was chosen for its native handling of categorical variables, robustness against overfitting, and high predictive performance in real-world tabular datasets.
3.4. Simulation Scheme
Given that the main purpose of this paper is to develop an approach that enables a balanced trade-off between planning costs and the risk of legality violations, this section presents a simulation scheme that allows for achieving such a balance.
It is widely acknowledged that machine learning models generally forecast the expected value of the response variable. In our case, the trained CatBoost models estimate the mean departure delay. These predictions are then translated into buffer times, which are incorporated into the crew scheduling problem to produce optimized crew duties. Specifically, the buffer level predicted for each duty serves as an input to the crew scheduling optimizer, which adjusts duty assignments accordingly. The crew scheduling optimizer, often referred to as the crew pairing optimizer, creates crew schedules that minimize inefficiency costs while covering the highest possible number of flights. As such, each predicted buffer level results in a different set of optimized duties.
First, we use published American Airlines crew duties, selected from the testing data. For simplicity, we focus on a subset of duties, originally optimized using mean buffer predictions. Second, given that our CatBoost models operate at the flight level using multiple features, we extract the final flight from each feasible duty and apply the predicted buffer to that segment. Third, to be able to study the impact of the predicted buffers, we parametrize our predictions with a parameter as follows,
Here, denotes the standard deviation of the mean predicted values from the training data our CatBoost models (see Section 4). The parameter controls the buffer levels. Increasing results in larger predicted buffers, which can help absorb operational delays and reduce legality violations. However, as mentioned earlier, higher values of require the crew scheduling optimizer to create additional duties to cover the same set of flights, leading to higher planning costs. As such, ideally, we would like to run the crew scheduling optimizer for each value of and analyze the change in the optimal crew duties. However, since running this optimization is computationally very expensive, we approximate the change in the optimal solution as follows. When the exceeds the available time between the duty time limit and the arrival of the last flight in an existing duty, that duty becomes infeasible for covering the flight (see Figure 2 and Figure 3 and the discussions therein). In what follows, we describe how we estimated the two conflicting metrics: planning cost and legality violations.
3.4.1. Metric 1: Planning Cost
The above discussion provides a foundation for estimating planning costs. However, since detailed crew-related costs are often difficult to obtain, we approximate the planning cost by the number of duties generated for each value of . This serves as a reasonable proxy, as a higher number of duties typically implies more pilots, increased idle time, more duty terminations, and higher associated costs such as lodging and logistics.
3.4.2. Metric 2: Legality Violations
To estimate the proportion of duty limit exceedance, we use actual operational delays from the testing data. For each , we compare the time between the scheduled arrival of the last flight and its actual delay. If the remaining buffer time is positive, the duty is considered intact; if negative, it is classified as a duty limit violation. We then calculate the proportion of violated duties, which we refer to as the proportion of legality violations.
The described framework is summarized in Figure 4.
The fundamental trade-off between the above mentioned metrics is summarized in what follows:
- A higher leads to increased planning costs but reduces the risk of legality violations.
- A lower results in lower planning costs but increases the risk of legality violations.
As can be seen, plays a major role in balancing this trade-off as it allows controlling cost as well as the level of conservatism of the decision-maker. We present the results of our simulation scheme in Section 4.3.1.
4. Case Study and Numerical Analysis
In this case study, we analyze the challenges faced by American Airlines in managing crew legality issues amid operational delays. We begin with an exploratory data analysis of delay patterns across various hubs, seasons, and times of day, factors that significantly impact flight operations. Next, we conduct a correlation-based analysis to identify features most strongly associated with delays. We then evaluate the performance of several machine learning models in predicting delays. Finally, we perform a simulation-driven analysis to develop buffer profiles that help airline decision-makers identify optimal trade-offs between planning costs and operational legal compliance.
In this study, we focus on American Airlines’ two primary hubs, Dallas/Fort Worth (DFW) and Charlotte (CLT), where flight volumes are the highest. At these airports, American Airlines dominates the market, operating more than 50% and 90% of all flights at DFW and CLT, respectively [22,23]. To account for seasonal variations, we develop a total of eight CatBoost models, one for each combination of airport and season. This modeling approach is motivated by several key considerations:
- (i)
- Operational consistency: Based on guidance from subject matter experts in crew planning and scheduling, operations exhibit similar patterns across seasons within each hub.
- (ii)
- Planning constraints: Crew availability varies between seasons and stations due to factors such as vacations, training schedules, and staffing policies.
- (iii)
- Modeling rationale: Grouping by station-season combinations ensures a sufficient volume of training data, which enhances model reliability and the statistical significance of predictions.
To that end, we briefly describe the utilized data for this study. First, we consider two years of operational data (2022 and 2023) for training the ML models in DFW and CLT. Further, we focus on narrow-body fleets, i.e., Boeing 737 Family and Airbus 320. The features that we study are summarized in the table below.
4.1. Data and Exploratory Analysis
Among all the features analyzed, Figure 5 presents a heatmap illustrating the correlations between departure delay and various numerical features. A prominent correlated feature is the hour of departure, which reflects the temporal distribution of flight traffic. Higher departure volumes during peak hours can lead to increased taxiway congestion and longer takeoff queues, thereby contributing to greater delays. Where as MOGT and (minimum on ground time) and scheduled turn are less correlated. It is important to note that some features could also relate to departure delays, but they are not available during the planning phase of operations. For example, features such as load factor is often not accessible at that stage. Consequently, these features were excluded from our predictive modeling to ensure relevance and practical applicability.
We now conduct a detailed analysis of the features used in our CatBoost model to understand their impact on predicting departure delays. For this purpose, we employ SHAP (SHapley Additive exPlanations), a tool that facilitates the interpretation of machine learning models. SHAP enables both local and global explanations by quantifying the contribution of each feature to individual predictions [24]. The results are presented in Figure 6 and Figure 7 which correspond to the models built for DFW-Summer and CLT-Summer, respectively. The top plots rank the features by their overall importance, while the bottom plots illustrate how each feature correlates with the model’s predicted departure delay. For numerical features, colors represent the feature values: blue indicates low values, while red indicates high values. Furthermore, each figure is divided along a vertical axis that separates the prediction to positively influencing the delay (to the right) from the negative influence (to the left), helping to identify whether each feature tends to increase or decrease the predicted delay.
First, looking at the top figures, we observe that the departure hour (DEP_HR) and the time of departure are among the most influential features in both models. The origin station of the inbound flights associated with aircraft (UPLINE_ORIGIN) also plays a significant role. This is intuitive, as departure delays often correlate with arrival delays, which are influenced by the location from which aircraft departed. This finding highlights a cascading effect of delays throughout the day. Additionally, when flights originate from spoke airports, delays tend to be more frequent due to limited resources, such as the unavailability of reserve pilots. In contrast, hub airports are typically better equipped to absorb disruptions and mitigate delays. Departure delays can also be affected by the scheduled destination (SKD_DEST) due to elements such as air traffic congestion, weather conditions, restricted runway or gate availability, and the airline’s scheduling strategies at the destination stations. Another important feature is the scheduled subfleet (SKD_SUBFLEET), which ranks highly in both models. Since the load factor is not available during the planning stage, the subfleet can serve as a proxy for passenger volume, given the fixed seating capacity associated with each subfleet. Additional relevant features include the fleet family (such as Airbus 320 or Boeing 737 Family), the day of the week, and the minimum on-ground time (MOGT). The impact of fleet family is likely linked to route specialization, as specific aircraft types are regularly assigned to routes that may be more resilient to disruptions. For example, CLT, a major hub for the Airbus 320, offers greater operational flexibility during irregular operations compared to the Boeing 737 Family, enabling more efficient recovery. The day of the week is also informative, since weekends often experience higher traffic and congestion. MOGT reflects the operational buffer between flight legs, which can influence the system’s ability to absorb delays.
Second, examining the lower panels of the figure, we focus on the departure hour feature. We observe that earlier departure times (lower values) tend to reduce the predicted delay, while later departures (higher values) are associated with increased delay predictions. This observation aligns with the findings shown in Figure 8 and Figure 9, which present a detailed analysis of the distribution of departure delays across different hours of the day at two major airports, DFW and CLT. We choose to study this feature in more detail given its prominent importance in the model’s ranking. Specifically, these figures show how departure delay variability changes across scheduled departure hours over the day. As previously mentioned, the scheduled departure hour is a critical factor influencing departure performance.
From morning until late at night, there is a noticeable rise in data variability, indicated by higher median and mean values for departure time variance, accompanied by an increased standard deviation. This pattern implies that as the day goes on, temporal fluctuations grow more significant. Therefore, Figure 8 and Figure 9 verify the importance of the scheduled departure hour in explaining flight delays.
Figure 10 shows how departure delay varies across seasons in two major airports, DFW and CLT. As seen in the Figure 10, the season is a critical factor influencing departure performance. The summer season exhibits the highest variance in departure delays, primarily due to increased flight schedules associated with peak vacation travel demand.
4.2. Evaluating the Accuracy of the CatBoost Models
This section evaluates the prediction accuracy of all trained CatBoost models, each corresponding to a specific station–season combination. We assess performance using two widely adopted metrics for regression tasks: Root Mean Square Error (RMSE) and Mean Absolute Error (MAE). The models are trained on data from 2022 and 2023, and evaluated using data from 2024. The results are presented in Figure 11, where the blue and green lines represent the models for DFW and CLT, respectively.
Several noteworthy observations can be drawn from this figure. First, the RMSE and MAE values for the DFW models range between 29–38 minutes and 17–25 minutes, respectively, while those for the CLT models range between 24–36 minutes and 14–24 minutes. The slightly higher error metrics for DFW can be attributed to its busier operational environment and greater exposure to unpredictable factors such as weather and maintenance disruptions. Second, across both hubs, predictive accuracy is highest in the fall, followed by winter, spring, and finally summer. This trend is intuitive, as summer tends to be the busiest travel season, leading to more operational disruptions. In contrast, fall and winter operations are generally smoother, with fewer irregularities. As mentioned earlier, the seasonal differences are largely driven by the increased volume of vacation and leisure travel during the summer months, which shows consistent results with Figure 10. Third, the RMSE values observed during the summer season suggest that predicted delays, used to determine the buffer times injected into crew schedules, are generally higher compared to other seasons. This indicates a greater need for schedule buffering in the summer to mitigate the elevated uncertainty in operational delays and protect crew duty exceedance. However, careful consideration is required when selecting the predicted delay values, as overestimation can lead to increased planning costs. Fortunately, machine learning models provide the flexibility to adjust predicted means based on the variability in the testing data, such as through the standard deviation. This highlights the complexity of determining optimal delay profiles, which must strike a careful balance between minimizing the risk of crew duty exceedance (i.e., maintaining crew legality) and controlling planning costs. This critical trade-off will be explored in detail in the following section.
4.3. Trade-Off Between Planning Cost and Risk
In this section, we analyze the trade-off between planning costs and the risk of legality violations. Using the simulation-based approach introduced in Section 3.4, we identify the optimal decision points that balance these competing objectives. Our study is focused on the data for each season-station combination in which each season is represented by data from a specific month, specifically, March, July, September, and December. To simplify the analysis, we focus on 425 duties per each combination, originally optimized using mean buffer predictions. In addition, we limit this analysis to a 2-leg duty and assume a uniform 8 hour-limit as a maximum allowable duty time. In this case, infeasible duties due to injected buffers are split into single-leg duties. Finally, we note that the actual flight delays are from the 2024 testing data.
4.3.1. Simulation Results
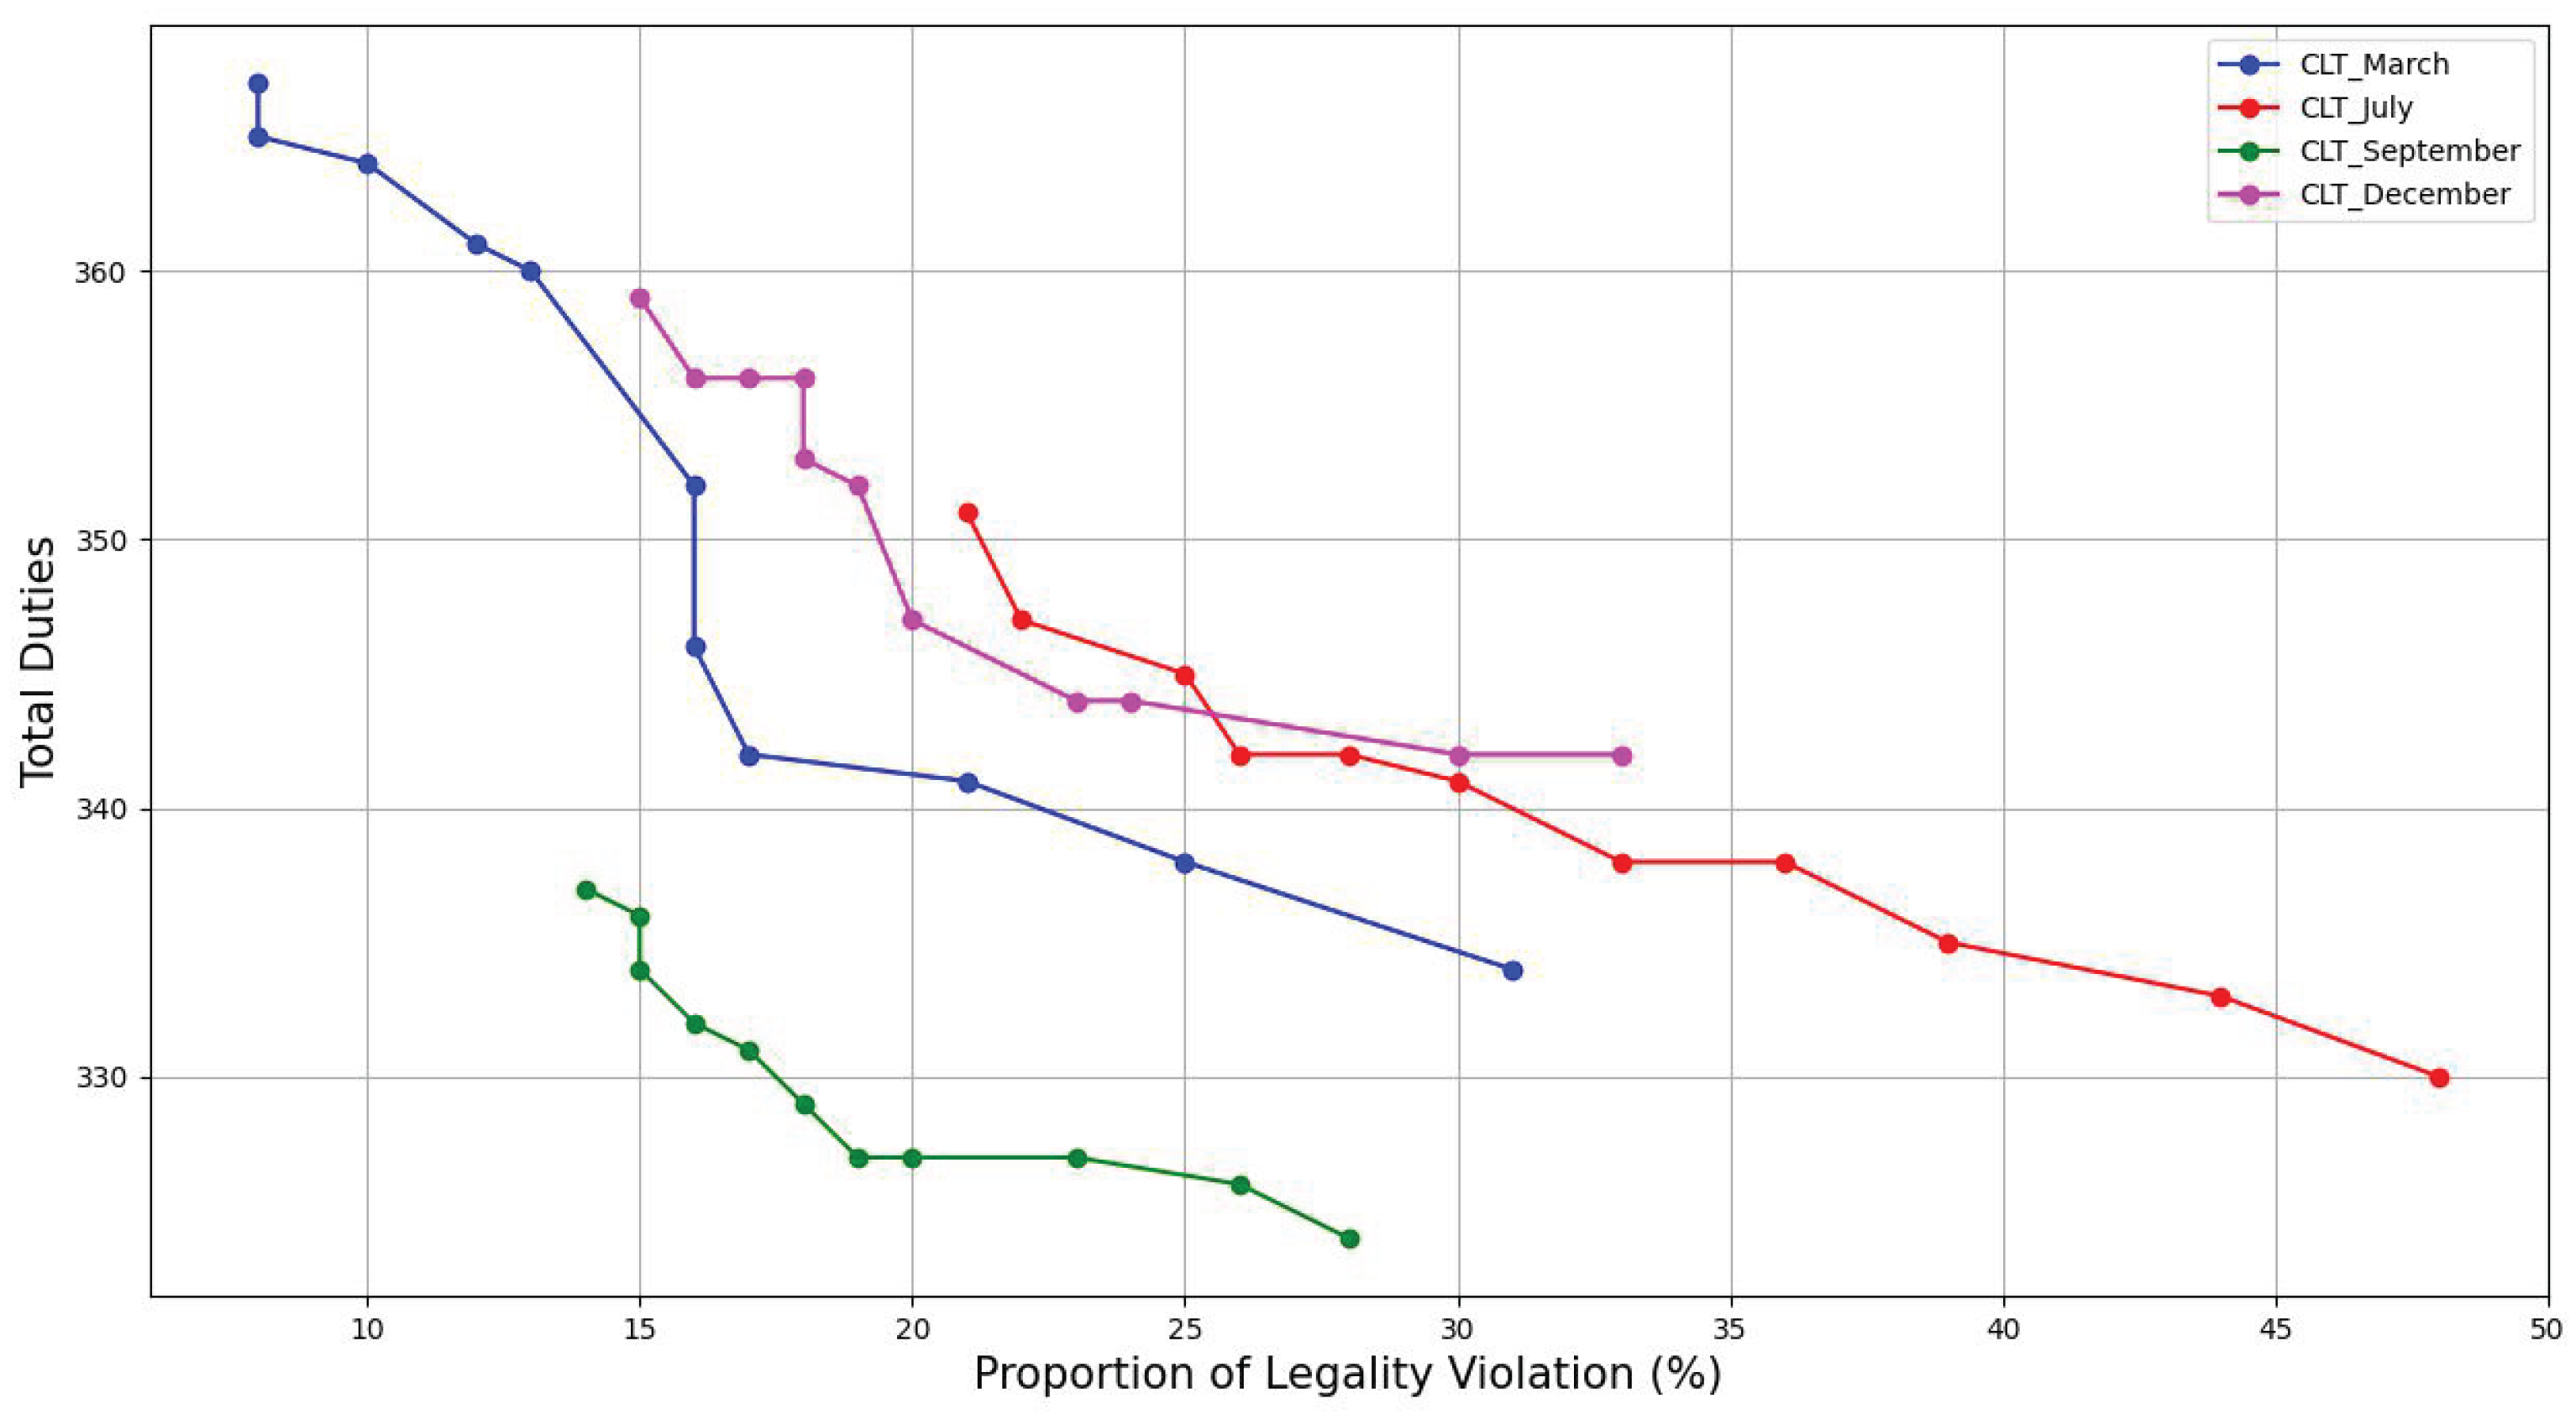
Figure 12 and Figure 13 show the trade-off curves for DFW and CLT throughout the four seasons studied. These curves illustrate how planning costs (total number of duties) vary with the risk of legality violations as changes. Several key observations can be drawn from these figures.
- July has a higher planning cost due to peak summer travel demand and frequent weather delays (e.g., thunderstorms). The July curve is smoother, which means that the trade-off curve is wide spread and gradual.
- March reflects moderate demand with relatively stable operations; its curve is steeper, showing quick shifts in the trade-off.
- September shows the lowest planning cost and sudden jumps in the trade-off curve, due to low travel volume and minimal delay risk. In September, crews can be efficiently scheduled with tight buffers without significantly increasing violations.
- December has moderate to high planning cost because of holiday travel and winter weather (e.g. snow, ice). The December curve is less smooth than July, but more smoother than March and September, reflecting moderate risk sensitivity.
- It is also evident that certain nondominant points appear along the curve. For a given legality violation, multiple planning cost values are observed. This variability can be attributed to the overestimation of buffer times allocated to duties that already possess adequate buffers to accommodate potential delays.
- These curves highlight the importance of seasonal and risk-aware scheduling to balance legality and cost.
- The trade-off curves for DFW are noticeably steeper and more distinct than those for CLT. This difference can be largely explained by the scale of operations at DFW, which serves as the main hub for American Airlines. The schedule at DFW is much more tightly packed and demanding compared to CLT, helping to explain the more pronounced trade-off patterns observed.
- July tradeoff curves, for both DFW and CLT, show that a 12% increase in planning cost investment can lead to roughly a 30% reduction in legality violations for American Airlines.
The results presented above correspond to two-legged duties, which serve as a baseline for the analysis. However, it is anticipated that the performance curves for duties involving three or four legs will exhibit a steeper gradient. This expectation arises primarily from the more stringent and compressed schedules associated with these multi-leg assignments
This framework provides a data-driven decision support tool for airline operations teams to fine-tune buffer policies and respond to the inherent uncertainties in real-world scheduling environments.
5. Conclusion and Future Directions
This study addresses the significant challenge of ensuring pilot schedule compliance with the Federal Aviation Administration’s Code of Federal Regulations Part 117 duty period regulations, a task that is further complicated by operational uncertainties such as flight delays. Achieving an optimal balance between scheduling flexibility and regulatory adherence is essential, as both inadequate and excessive buffer times can result in cost-prohibitive disruptions or inefficient utilization of crew resources.
To address this challenge, we have developed an innovative framework grounded in data-driven methodologies to leverage machine learning for the determination of optimal buffer times in flight operations. Our methodology involves the analysis of historical delay datasets along with significant features, employing gradient boosting algorithms, specifically CatBoost, and the identification of anomalies through the Isolation Forest technique. This approach facilitates the prediction of delay risks associated with the final segments in proposed duty schedules, further enabling the recommendation of specific buffer allocations. Consequently, this framework supports the design of duty periods that fulfill both legal requirements and operational efficiency standards.
Our numerical experiments investigate the challenge American Airlines encounters in handling crew legalities when operations are delayed. Focusing on the airline’s two busiest hubs, DFW and CLT, we begin with correlation-based and exploratory analyses of delay patterns across the hubs, seasons, and departure hours. To better understand the behavior of our best-performing model, we conduct a detailed analysis of the features used in our CatBoost model using SHAP (SHapley Additive exPlanations). SHAP facilitates both local and global interpretability by quantifying each feature’s contribution to individual predictions, thereby underscoring the significance of departure hour, upline flight origin, narrow-body subfleet type, and scheduled destination within the context of the prediction task.
Furthermore, we evaluated accuracy metrics, specifically RMSE and MAE, for separate CatBoost models across each station-season combination. Our analysis revealed a clear sensitivity of model performance to the airline’s operational volume, with the highest accuracy observed in CLT-Fall and the lowest in DFW-Summer. These results suggest a strong correlation between prediction accuracy and flight volume at each station-season.
Finally, we perform a simulation-driven analysis to develop buffer profiles that help decision-makers identify optimal trade-offs between planning cost and operational compliance. We proposed an adjustable buffer mechanism based on predicted delay values, allowing decision-makers to control the level of conservatism through a parameter , which specifies how many standard deviations are added to the mean predicted delay: A higher value of results in larger buffers, which reduces the available time within each duty. As a result, more duties are required to cover all flights during the planning phase. This increases the overall planning cost but leads to fewer duties at risk of violating legal constraints. For DFW and CLT across four different months, we presented Pareto charts illustrating the trade-off between the number of required duties and proportion of legality violation using actual departure delays in 2024, as the parameter varies. Our results indicate that a 12% increase in planning cost investment can result in approximately a 30% reduction in legality violations for American Airlines
This study has several limitations that also open avenues for future research. First, due to the inherent complexity of the crew pairing problem, it is challenging to directly compare planning costs with the projected costs of duty violations to identify an exact optimal buffering level. Future work could explore more sophisticated cost models or optimization frameworks that better capture this trade-off. Additionally, while our approach focused on buffering total duty time, another promising direction is to investigate buffer allocation specifically between flight legs within a duty. Such intra-duty buffering could enhance the resiliency of pairings by reducing both delays and the likelihood of legality violations. Finally, our analysis relies solely on historical data; future research could explore predictive or simulation-based approaches that estimate appropriate duty buffers for upcoming flight schedules based on expected delay patterns and structural characteristics of duties. Overall, our approach represents a meaningful advancement toward intelligent, delay-resilient crew scheduling in the airline industry, providing a foundation for future work to delve deeper into the design and optimization of buffering strategies.
Author Contributions
Conceptualization, M.S.E., M.A., A.D., and C.M.; methodology, M.S.E., H.E.H., A.D., and S.R.; software, A.D. and S.R.; validation, A.D. and S.R.; resources, A.D. and S.R.; data curation, C.M.; writing—original draft preparation, M.S.E., M.A., S.R.; writing, M.S.E., M.A., S.R.; visualization, A.D.; supervision, M.S.E. and M.A.; project administration, M.A.; literature review, M.S.E. All authors have read and agreed to the published version of the manuscript.
Funding
This research received no external funding.
Data Availability Statement
The data used in this study are proprietary and belong to American Airlines Inc. As such, they are not publicly available due to confidentiality and internal policy restrictions. Requests for access to the data may be considered on a case-by-case basis and subject to approval by the organization.
Acknowledgments
The authors would like to thank American Airlines for their leadership support in providing access to operational data and the necessary resources to conduct this research. We are especially grateful to the Operations Research and Advanced Analytics team within the IT organization, as well as the Crew Schedule Planning and Crew Optimization teams within Operations Planning and Performance, for their valuable collaboration and insights. Special thanks go to Tolou Esfandeh, Manager in Operations Research and Advanced Analytics, for her unwavering support and invaluable technical guidance throughout the course of this study.
Conflicts of Interest
The authors declare no conflicts of interest.
References
- Administration, F.A. Title 14, Chapter I, Subchapter G, Part 117 - Flight and Duty Limitations and Rest Requirements: Flightcrew Members. Electronic Code of Federal Regulations (eCFR) 2025, 14, Part–117. [Google Scholar]
- Gershkoff, I. Optimizing flight crew schedules. Interfaces 1989, 19, 29–43. [Google Scholar] [CrossRef]
- Kuchta, D. A new concept of project robust schedule–use of buffers. Procedia computer science 2014, 31, 957–965. [Google Scholar] [CrossRef]
- Ghoddousi, P.; Ansari, R.; Makui, A. An improved robust buffer allocation method for the project scheduling problem. Engineering Optimization 2017, 49, 718–731. [Google Scholar] [CrossRef]
- Liang, Y.; Cui, N.; Hu, X.; Demeulemeester, E. The integration of resource allocation and time buffering for bi-objective robust project scheduling. International Journal of Production Research 2020, 58, 3839–3854. [Google Scholar] [CrossRef]
- Van de Vonder, S.; Demeulemeester, E.; Herroelen, W.; Leus, R. The use of buffers in project management: The trade-off between stability and makespan. International Journal of production economics 2005, 97, 227–240. [Google Scholar] [CrossRef]
- Jovanović, P.; Kecman, P.; Bojović, N.; Mandić, D. Optimal allocation of buffer times to increase train schedule robustness. European Journal of Operational Research 2017, 256, 44–54. [Google Scholar] [CrossRef]
- Briskorn, D.; Leung, J.; Pinedo, M. Robust scheduling on a single machine using time buffers. IIE Transactions 2011, 43, 383–398. [Google Scholar] [CrossRef]
- Brueckner, J.K.; Czerny, A.I.; Gaggero, A.A. Airline mitigation of propagated delays via schedule buffers: Theory and empirics. Transportation Research Part E: Logistics and Transportation Review 2021, 150, 102333. [Google Scholar] [CrossRef]
- Hajko, J.; Badánik, B. Airline on-time performance management. Transportation Research Procedia 2020, 51, 82–97. [Google Scholar] [CrossRef]
- Sohoni, M.; Lee, Y.C.; Klabjan, D. Robust airline scheduling under block-time uncertainty. Transportation Science 2011, 45, 451–464. [Google Scholar] [CrossRef]
- Van Schilt, I.M.; van Kalker, J.; Lefter, I.; Kwakkel, J.H.; Verbraeck, A. Buffer scheduling for improving on-time performance and connectivity with a multi-objective simulation–optimization model: A proof of concept for the airline industry. Journal of Air Transport Management 2024, 115, 102547. [Google Scholar] [CrossRef]
- Forsberg, L.; Ström, A. An analysis of schedule buffer time for increased robustness and cost efficiency in Scandinavian Airlines traffic program, 2016.
- Schaefer, A.J.; Johnson, E.L.; Kleywegt, A.J.; Nemhauser, G.L. Airline crew scheduling under uncertainty. Transportation science 2005, 39, 340–348. [Google Scholar] [CrossRef]
- Ehrgott, M.; Ryan, D.M. Constructing robust crew schedules with bicriteria optimization. Journal of multi-criteria decision analysis 2002, 11, 139–150. [Google Scholar] [CrossRef]
- Tam, B.; Ehrgott, M.; Ryan, D.; Zakeri, G. A comparison of stochastic programming and bi-objective optimisation approaches to robust airline crew scheduling. OR Spectrum 2011, 33, 49–75. [Google Scholar] [CrossRef]
- Ionescu, L.; Kliewer, N. Increasing flexibility of airline crew schedules. Procedia-Social and Behavioral Sciences 2011, 20, 1019–1028. [Google Scholar] [CrossRef]
- Antunes, D.; Vaze, V.; Antunes, A.P. A robust pairing model for airline crew scheduling. Transportation science 2019, 53, 1751–1771. [Google Scholar] [CrossRef]
- Dunbar, M.; Froyland, G.; Wu, C.L. Robust airline schedule planning: Minimizing propagated delay in an integrated routing and crewing framework. Transportation Science 2012, 46, 204–216. [Google Scholar] [CrossRef]
- Dück, V.; Ionescu, L.; Kliewer, N.; Suhl, L. Increasing stability of crew and aircraft schedules. Transportation research part C: emerging technologies 2012, 20, 47–61. [Google Scholar] [CrossRef]
- Chung, S.H.; Ma, H.L.; Chan, H.K. Cascading delay risk of airline workforce deployments with crew pairing and schedule optimization. Risk Analysis 2017, 37, 1443–1458. [Google Scholar] [CrossRef]
- Derby, K. American Airlines Operates Largest Hub in the World, Dallas 2024. [Online; Accessed May-2025].
- Mahoney, A. Axios Charlotte 2024. [Online; Accessed May-2025].
- Lundberg, S.M.; Lee, S.I. A unified approach to interpreting model predictions. Advances in neural information processing systems 2017, 30. [Google Scholar]
| 1 | Airline decision makers often consider the option of swapping pilots and assigning reserve pilots in an effort to mitigate delays |
Figure 1.
Maximum flight duty periods by start time and number of flight segments, as defined in Table B of CFR Part 117 [1].
Figure 1.
Maximum flight duty periods by start time and number of flight segments, as defined in Table B of CFR Part 117 [1].
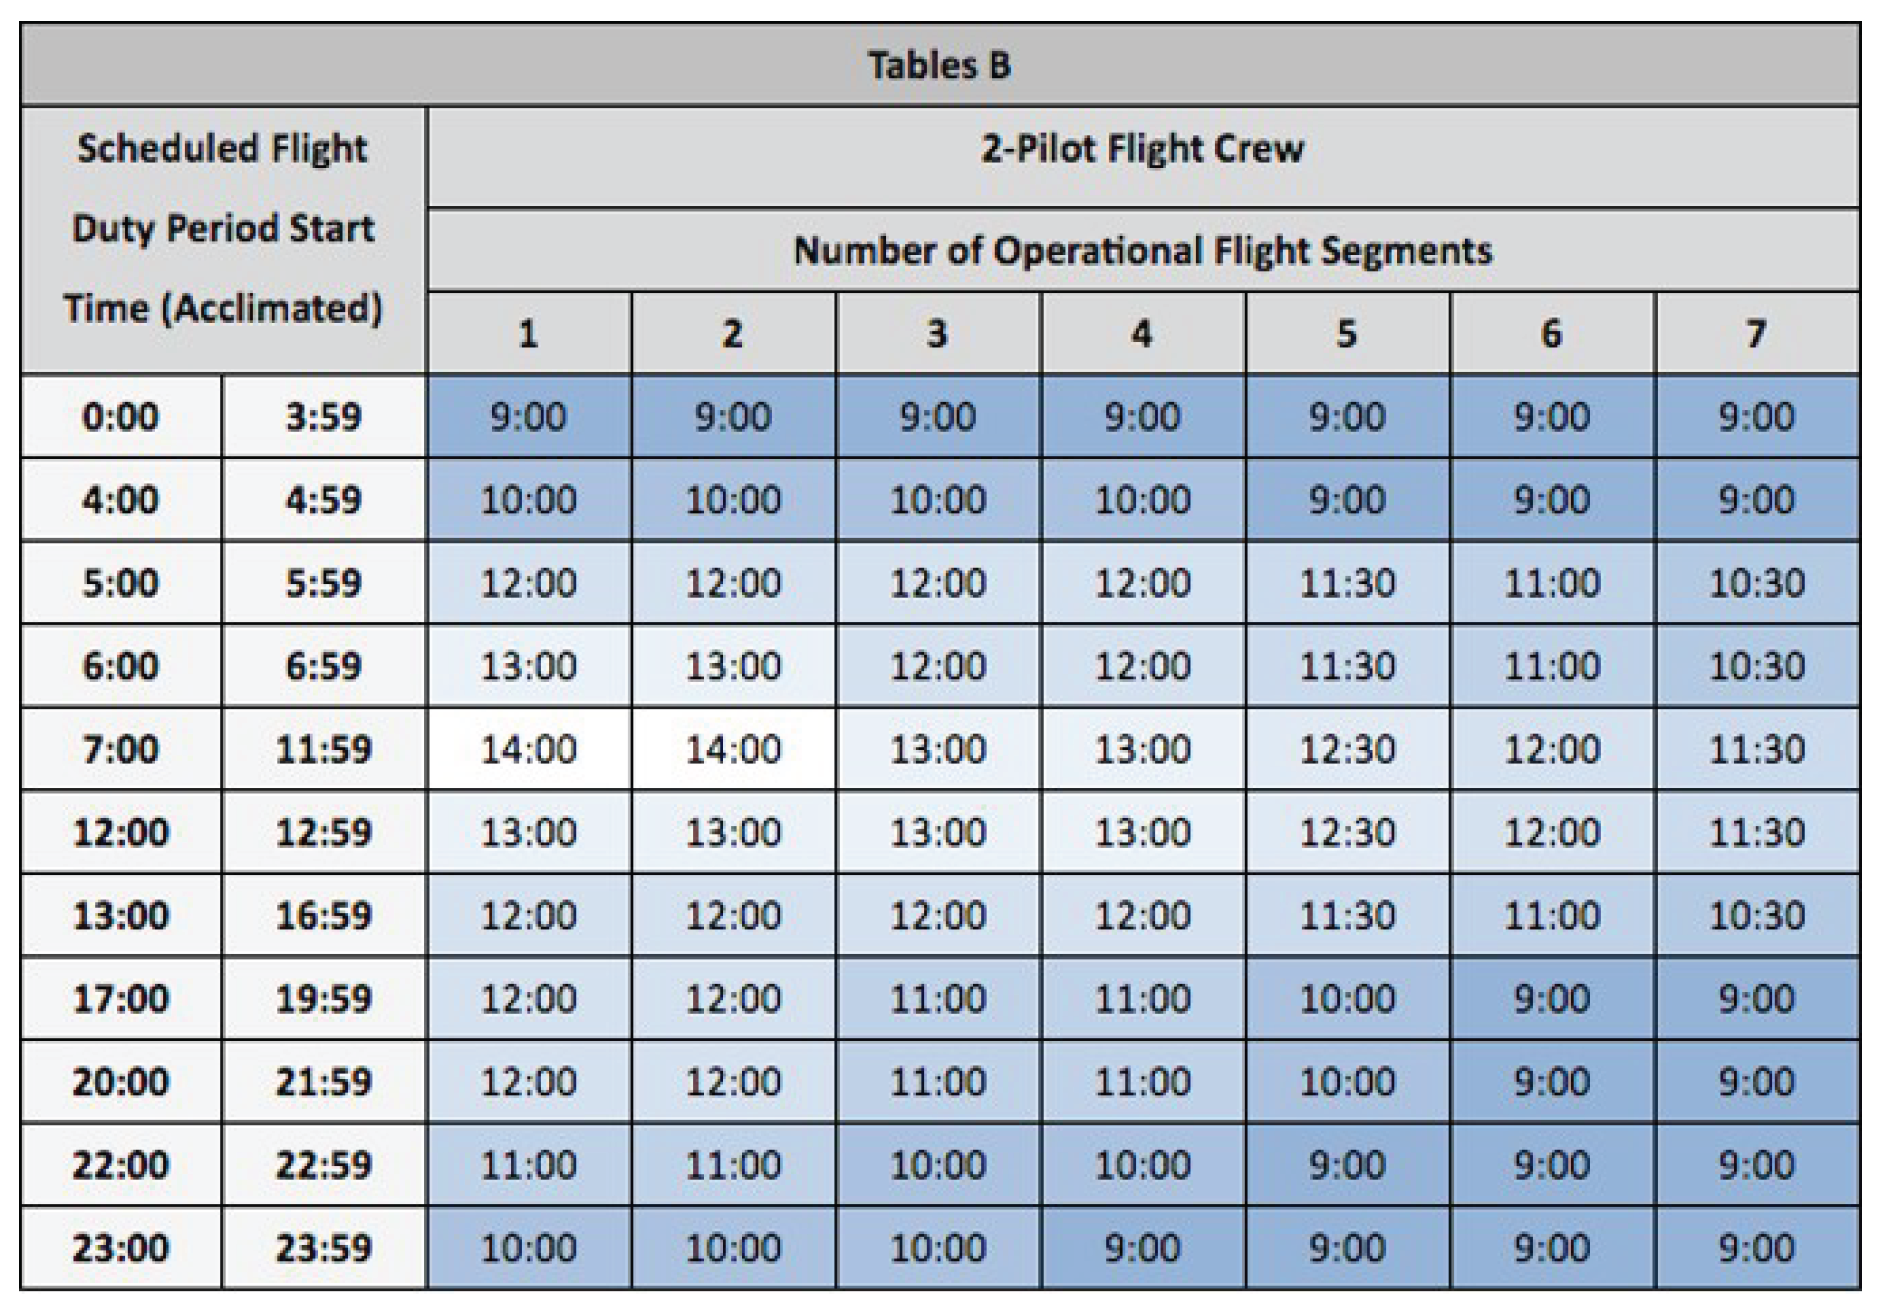
Figure 2.
The proposed buffer, given the structure of the candidate duty, renders the duty infeasible for scheduling.
Figure 2.
The proposed buffer, given the structure of the candidate duty, renders the duty infeasible for scheduling.

Figure 3.
The buffer requirement within the duty structure allows the candidate duty to be feasible for scheduling.
Figure 3.
The buffer requirement within the duty structure allows the candidate duty to be feasible for scheduling.
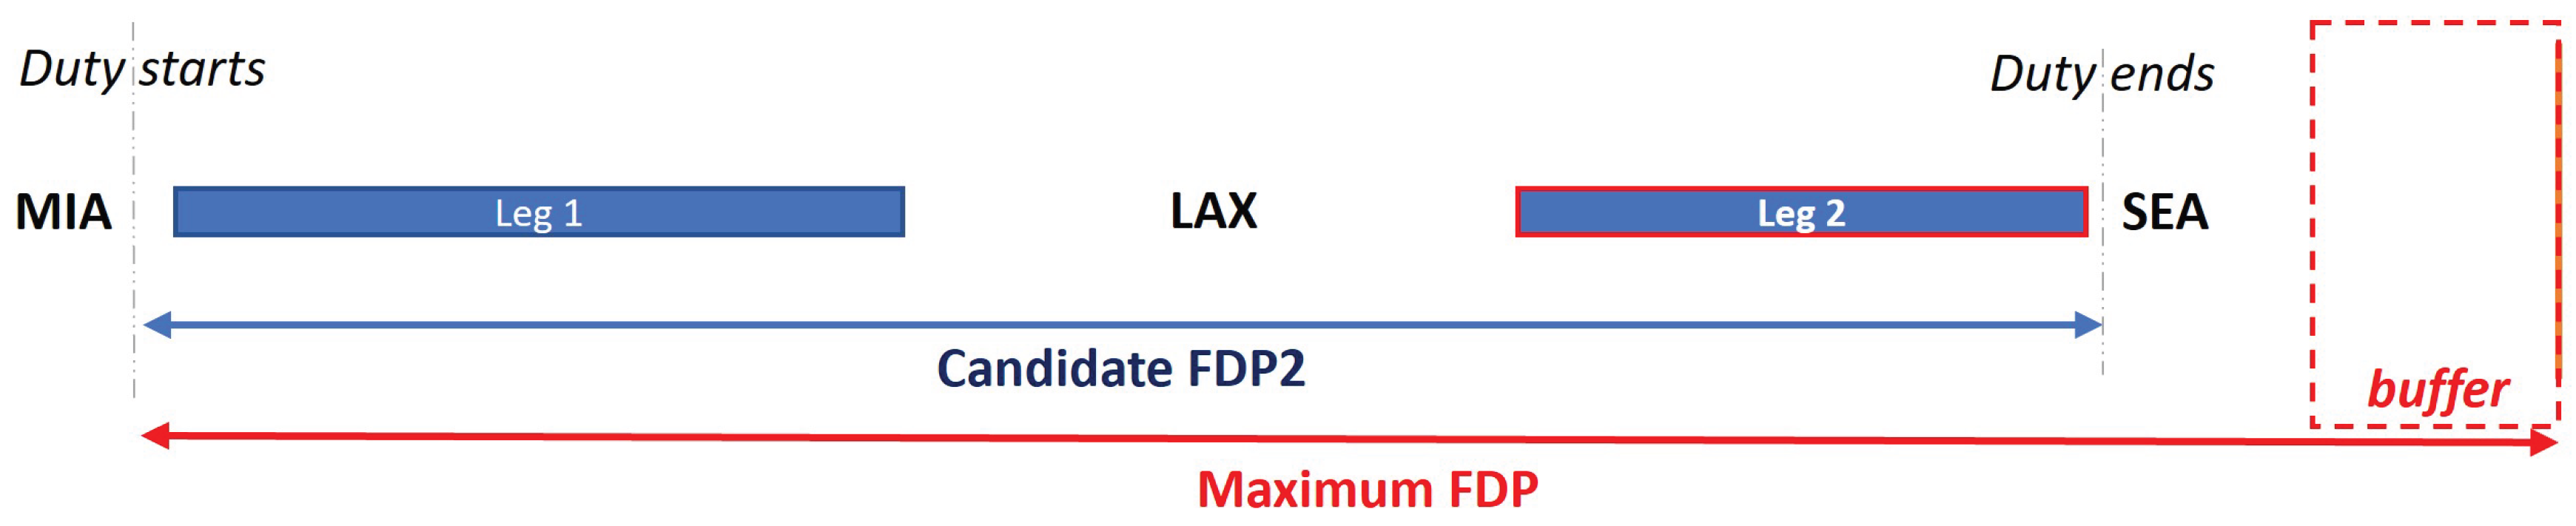
Figure 4.
Proposed framework.
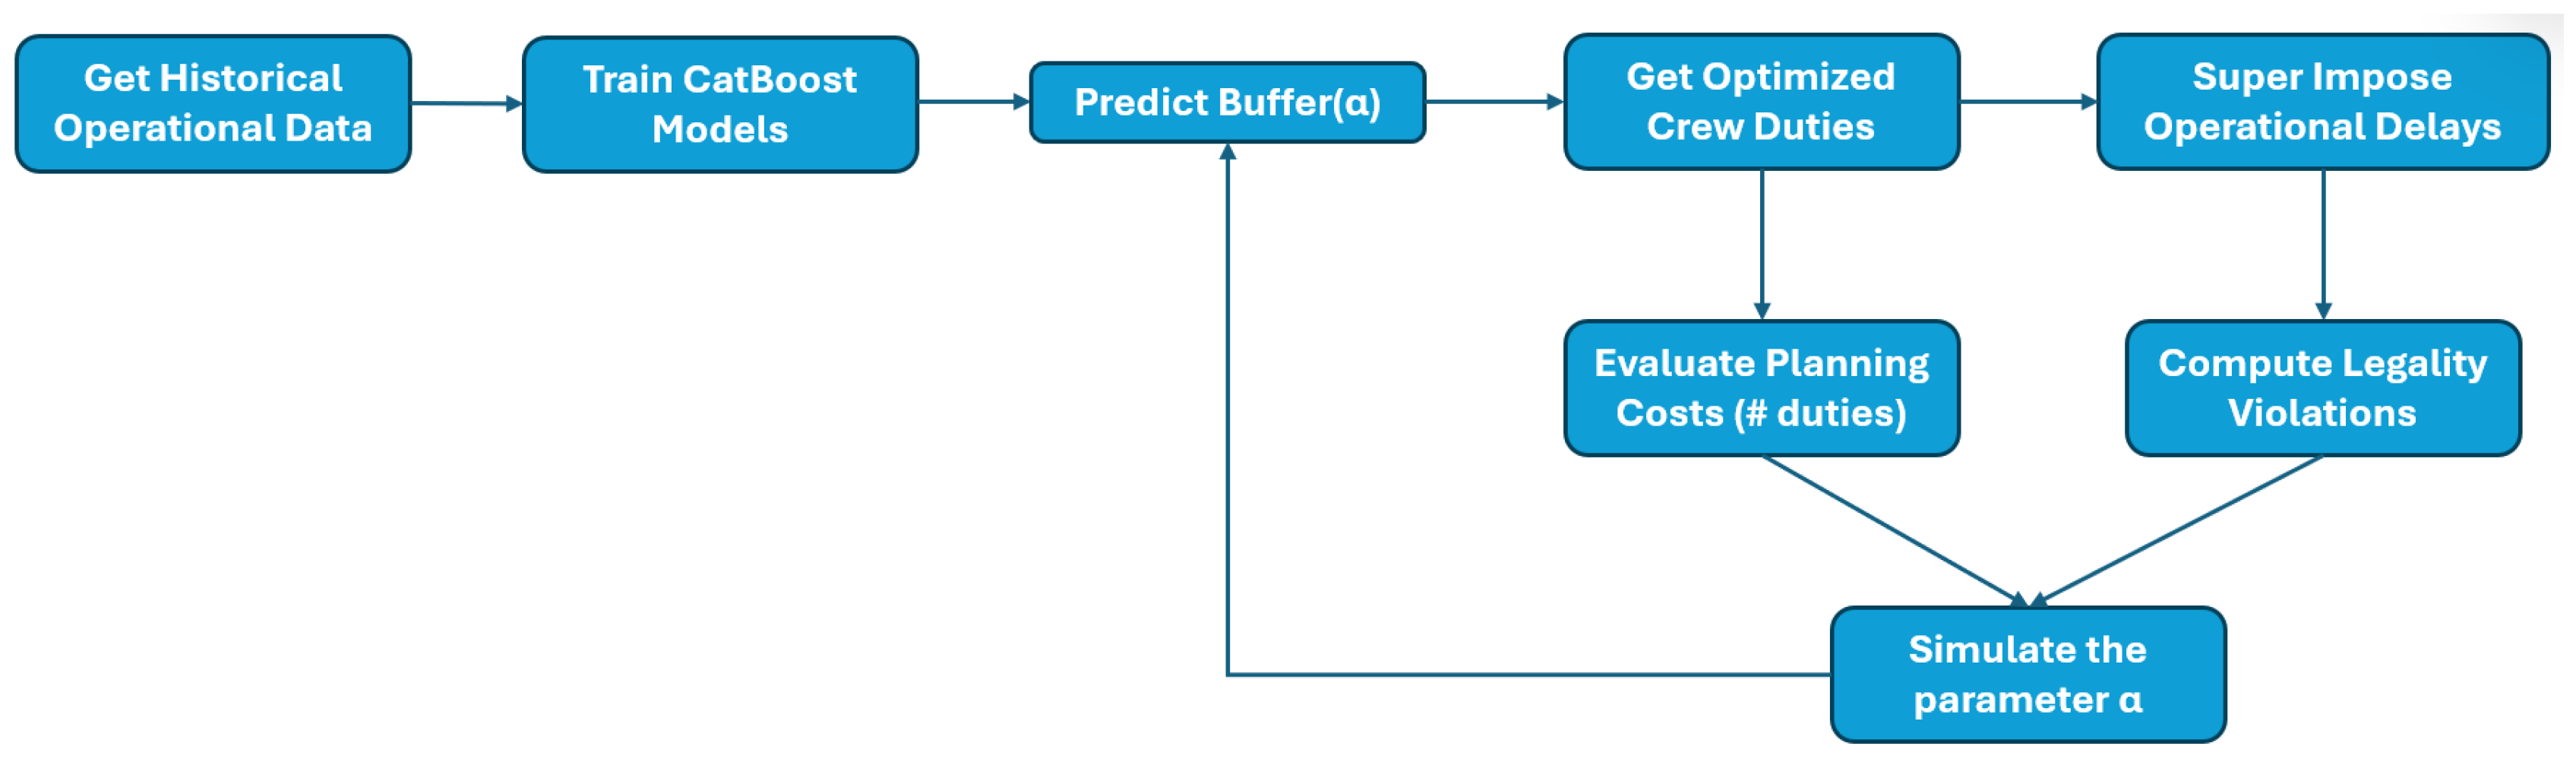
Figure 5.
Heatmap showing the correlations of departure delay with other numerical features.
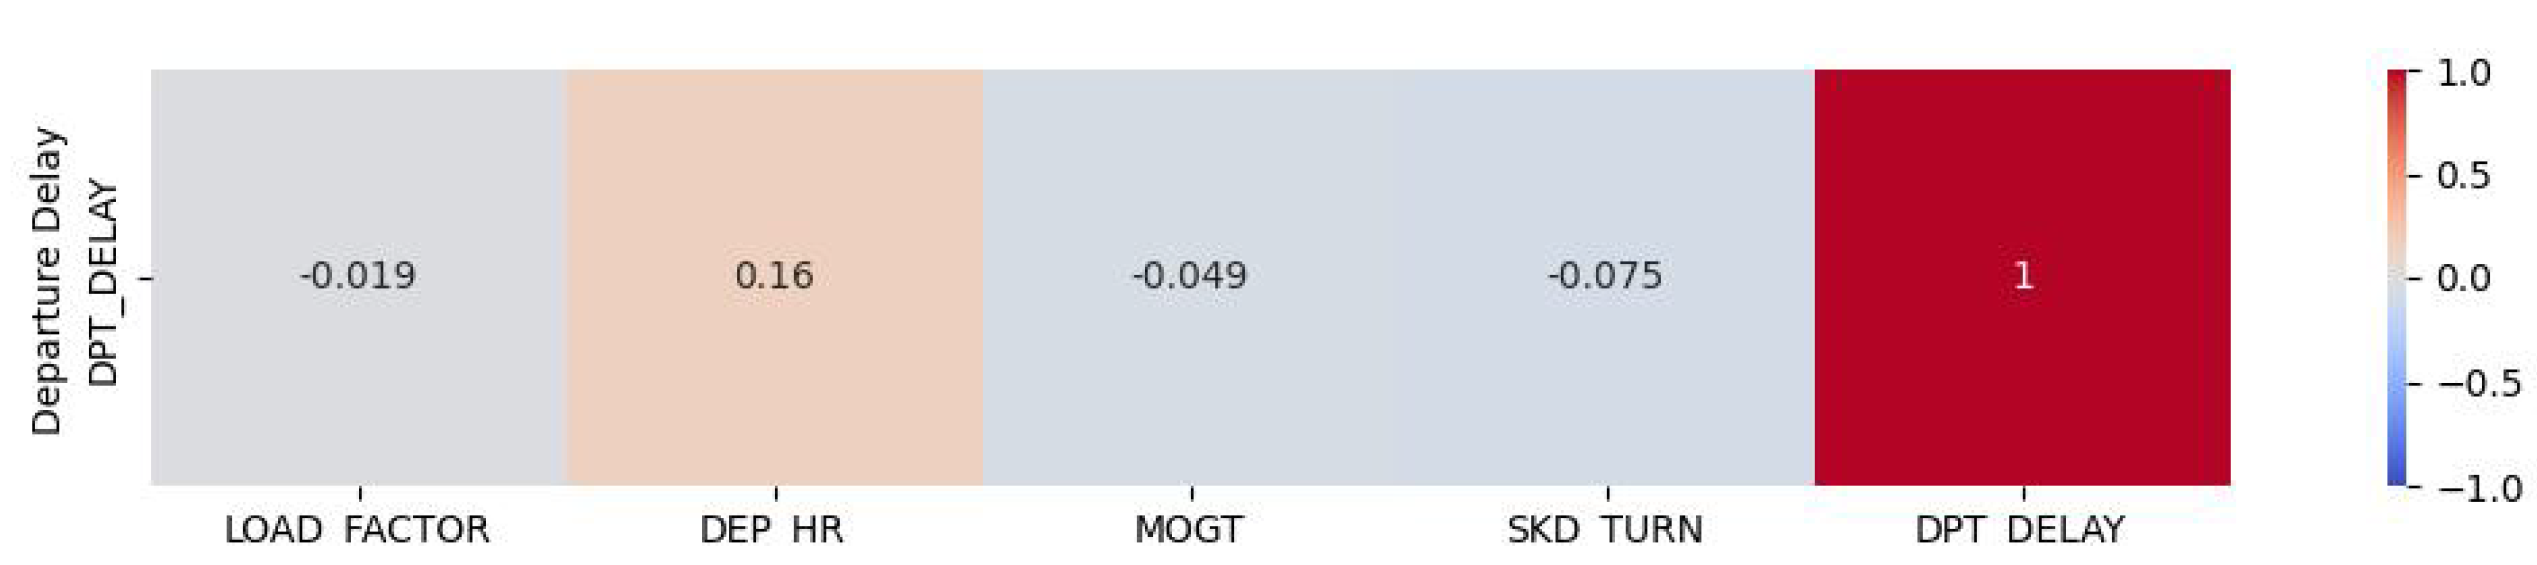
Figure 6.
DFW-Summer
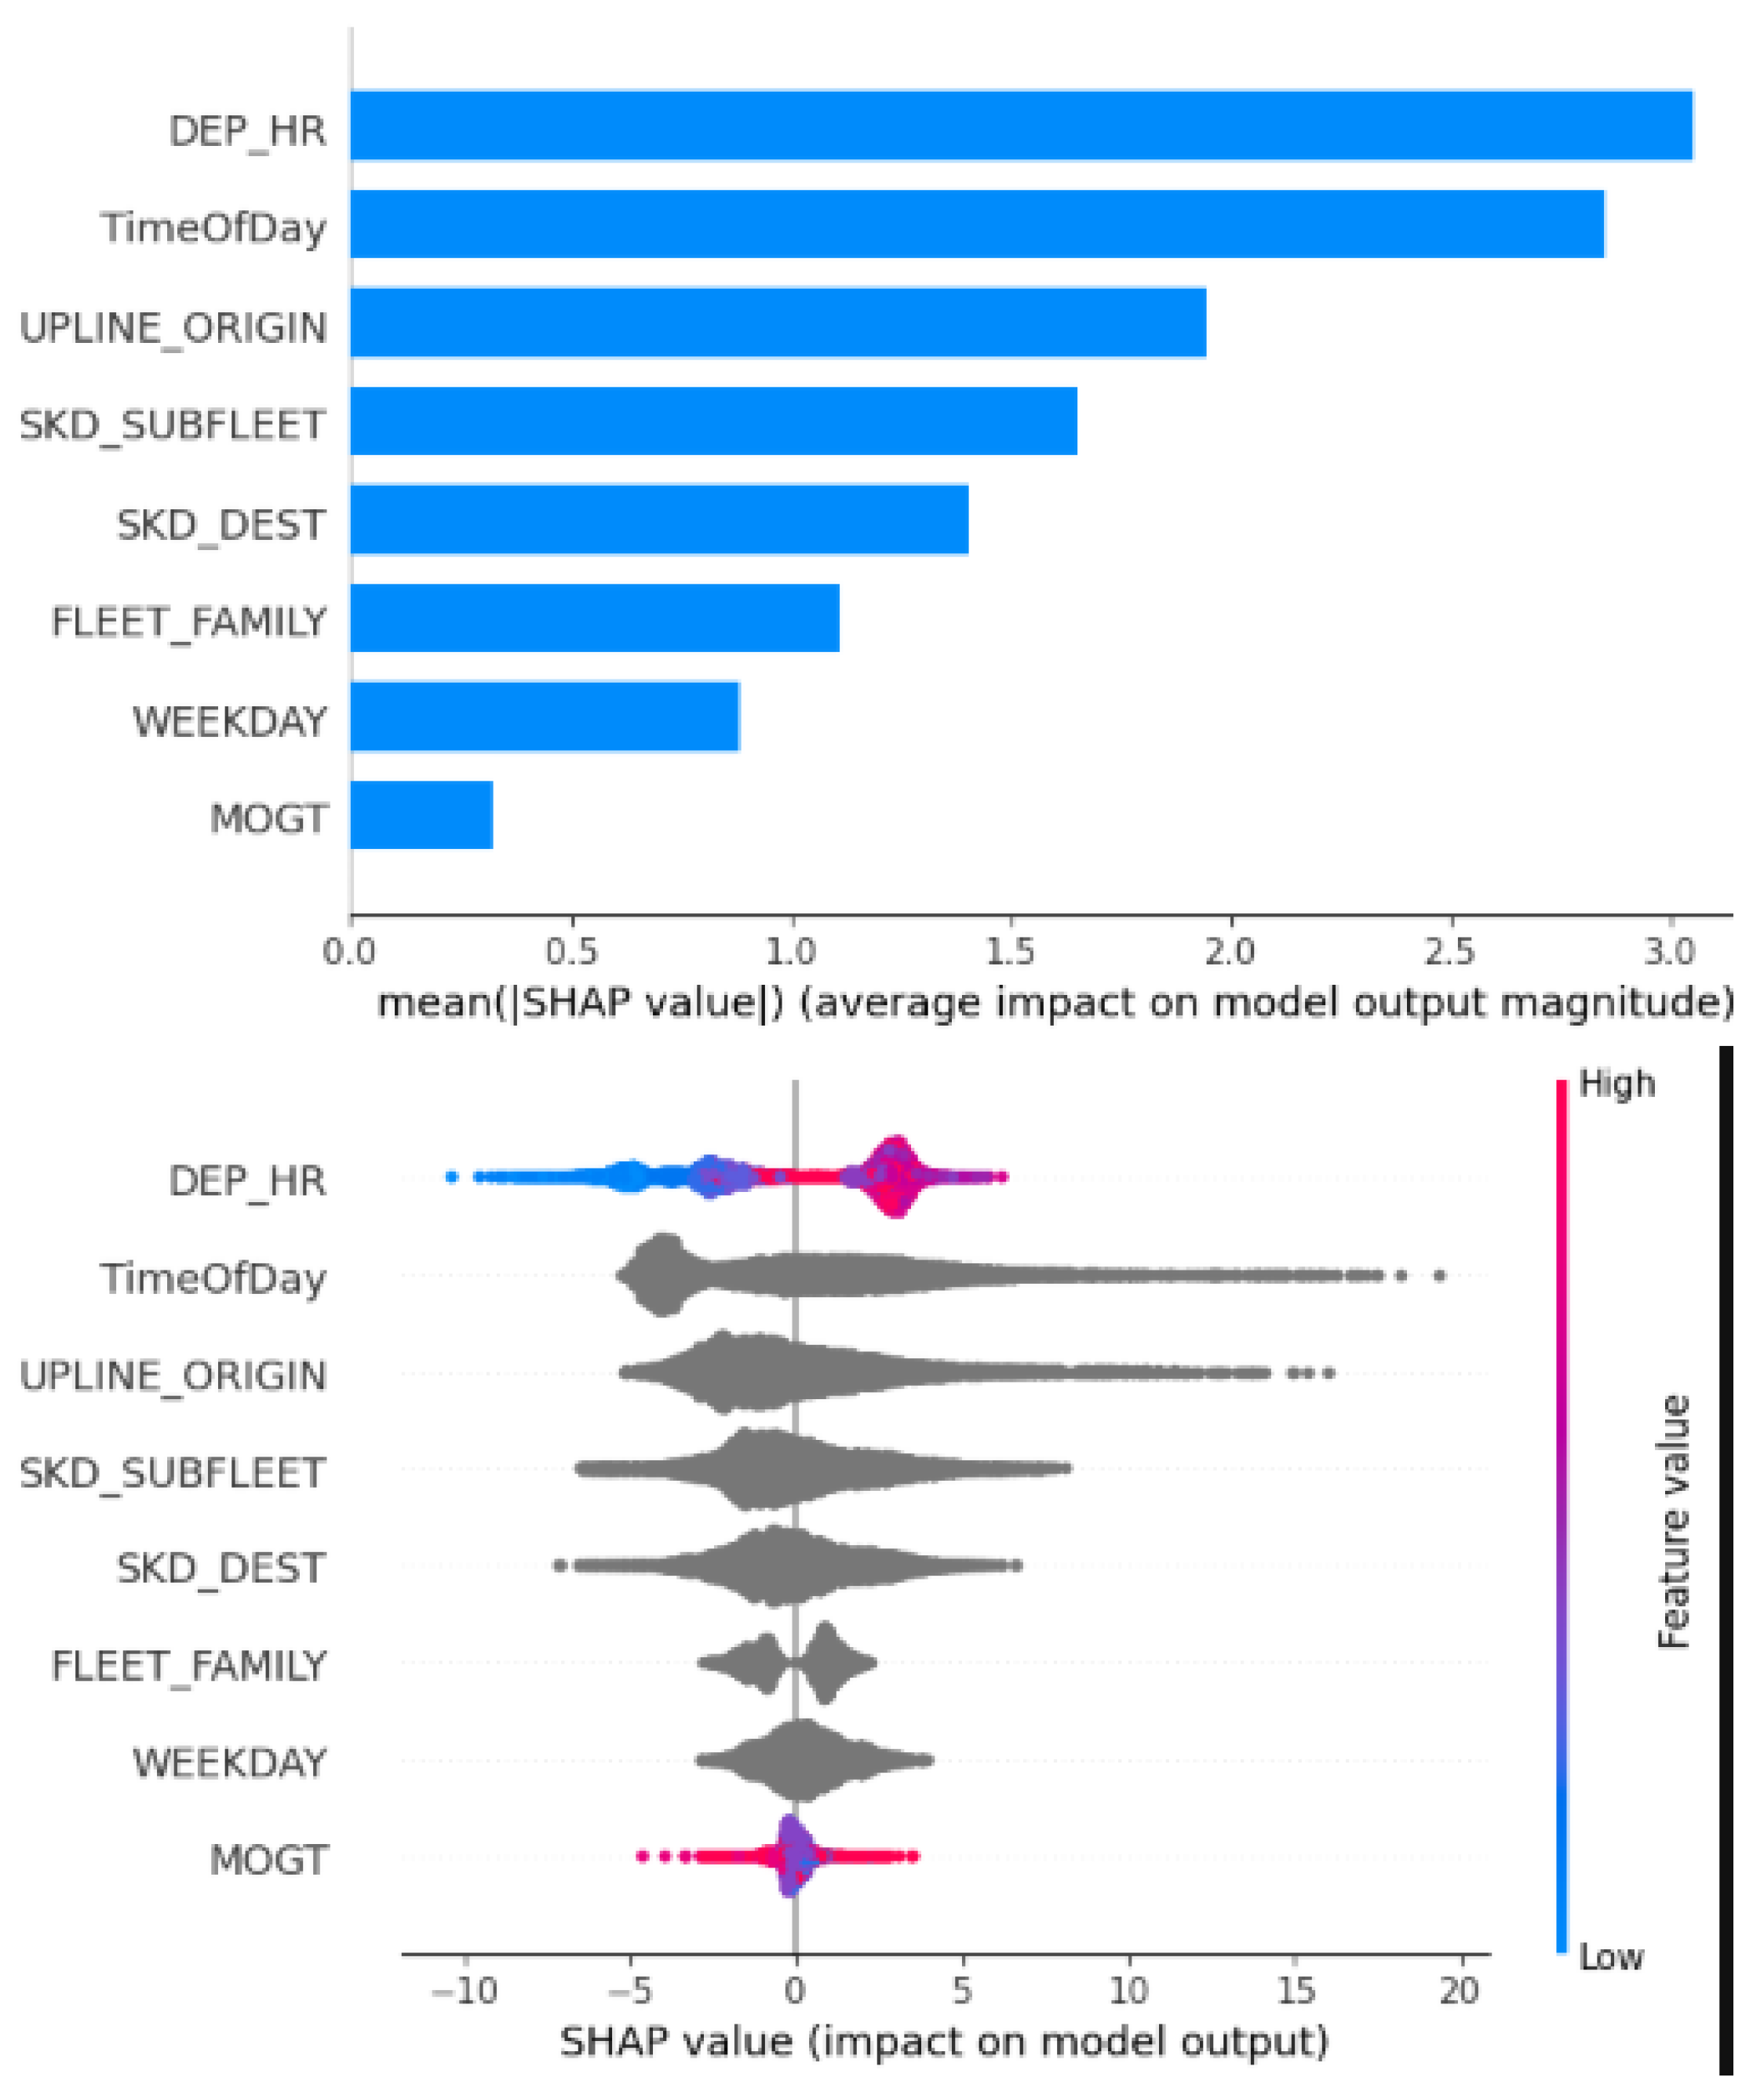
Figure 7.
CLT-Summer
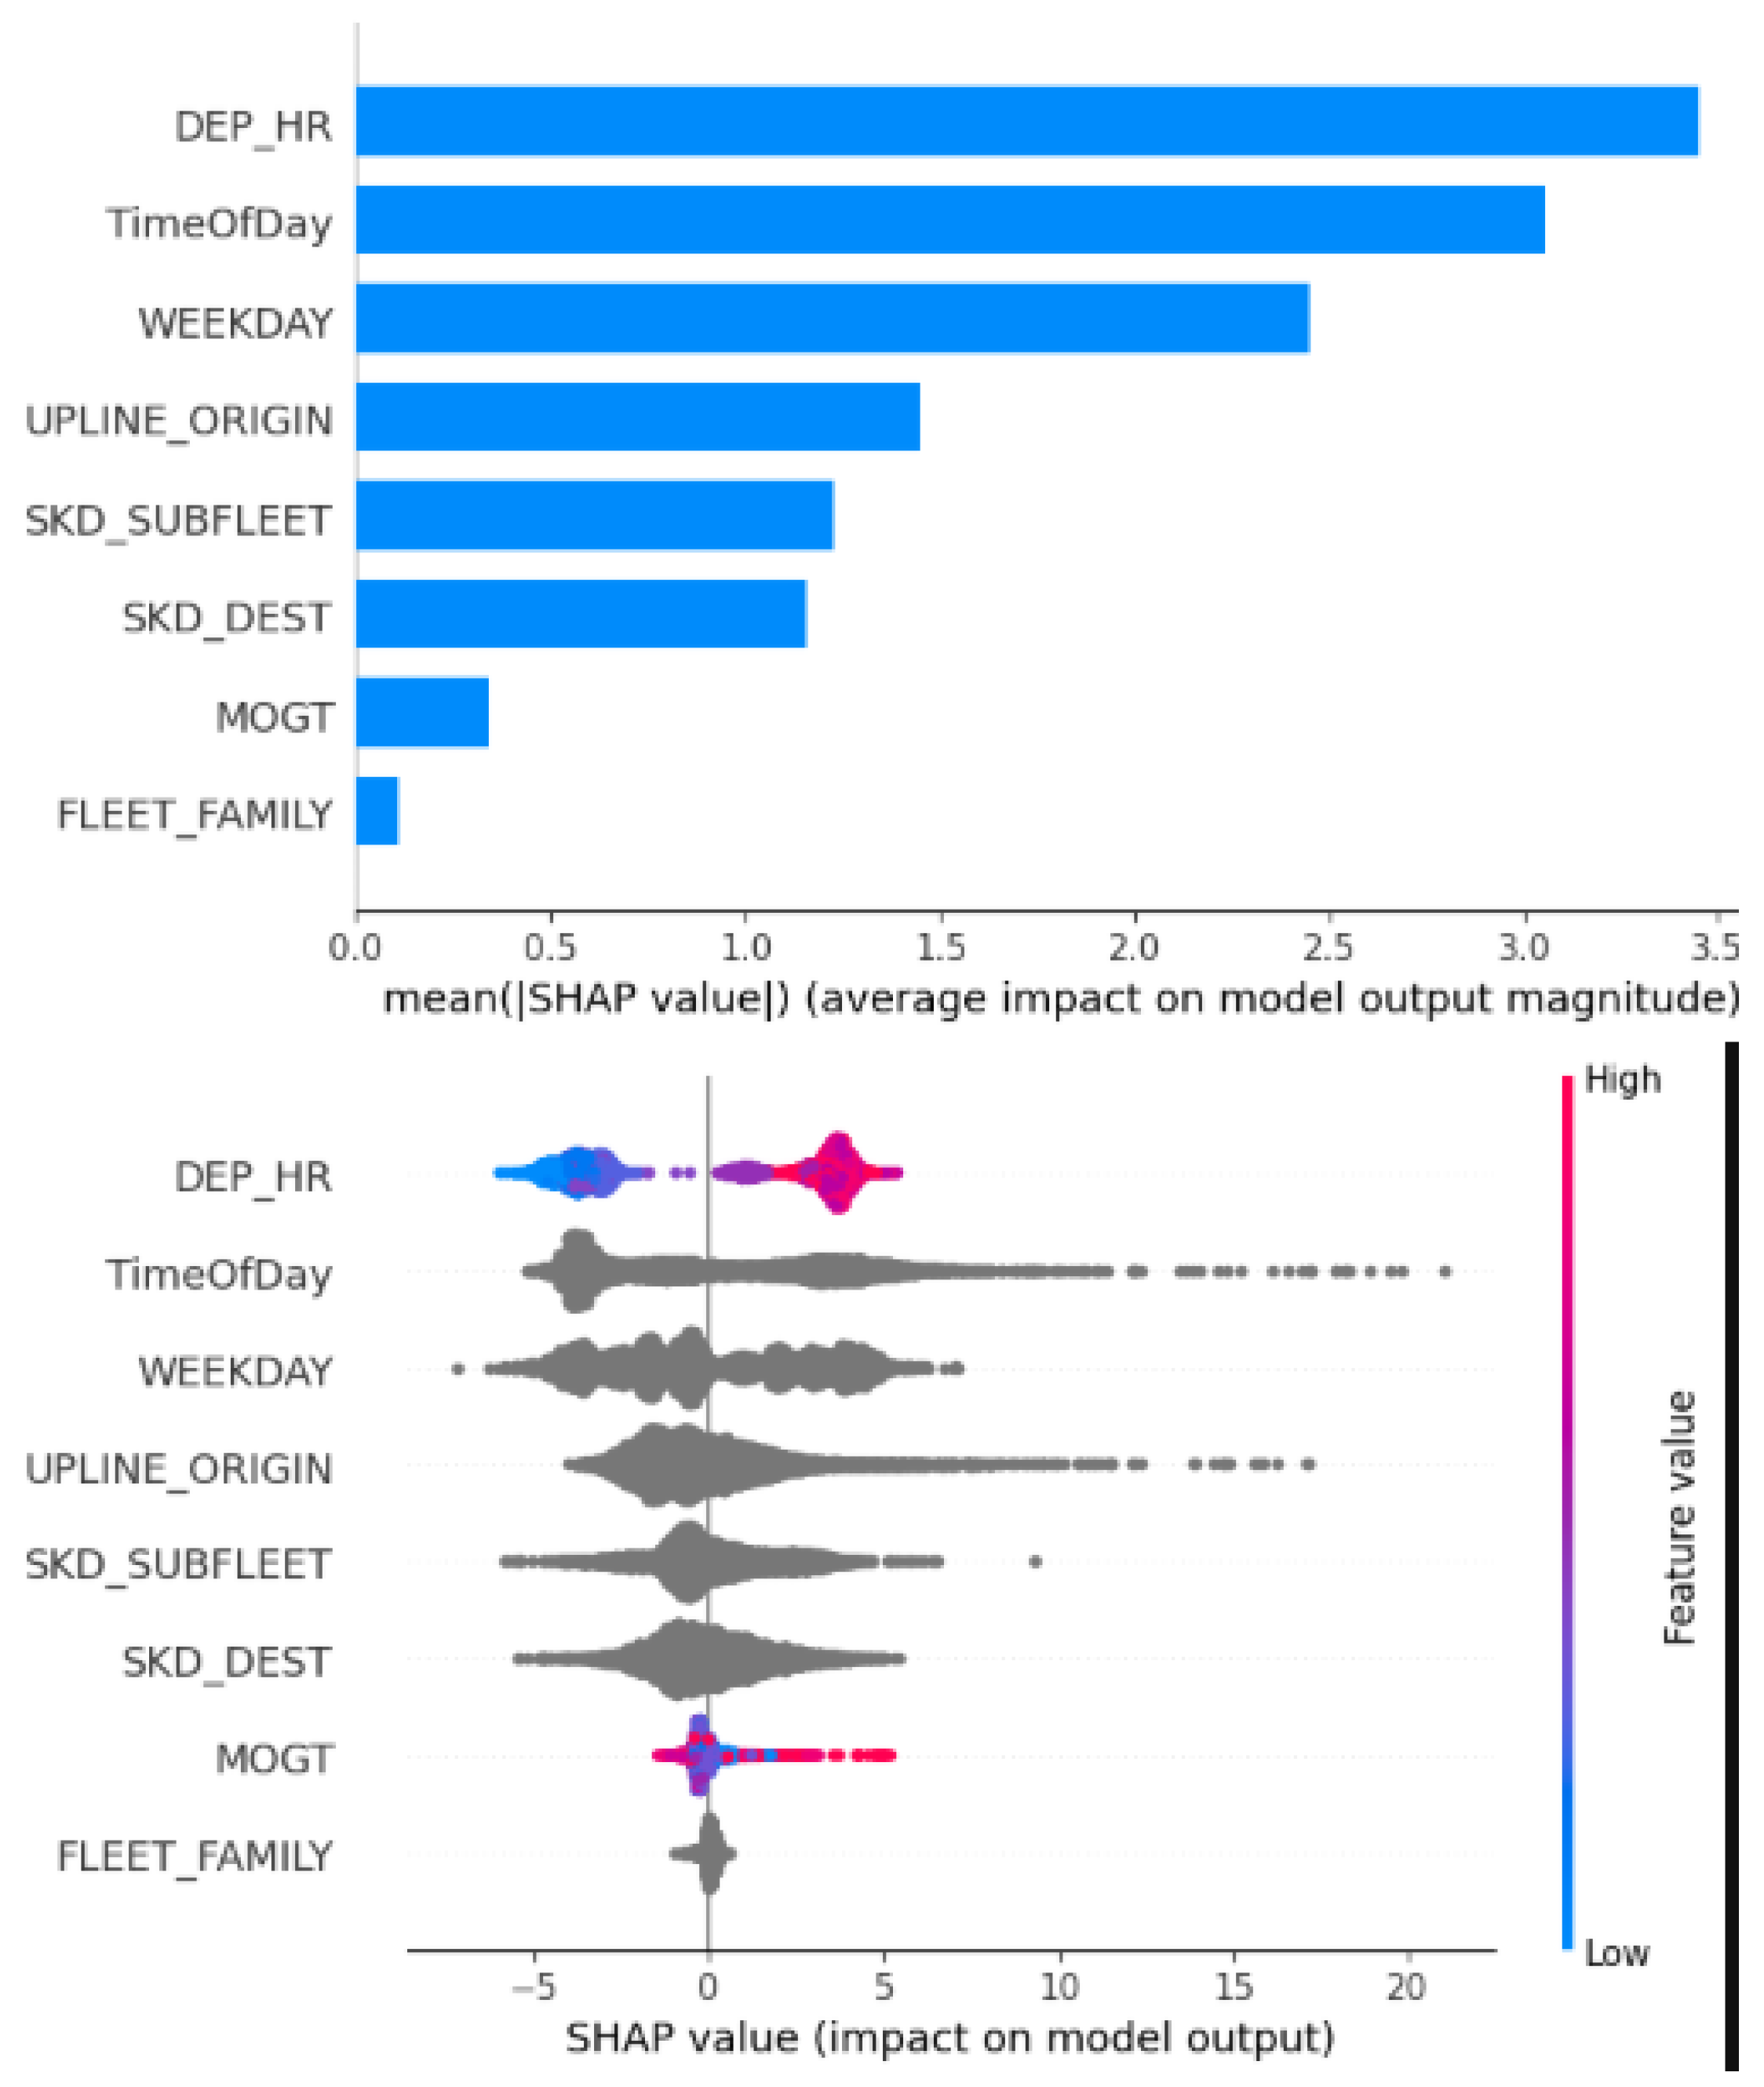
Figure 8.
Variability in flight departure delays by hour of departure at DFW.
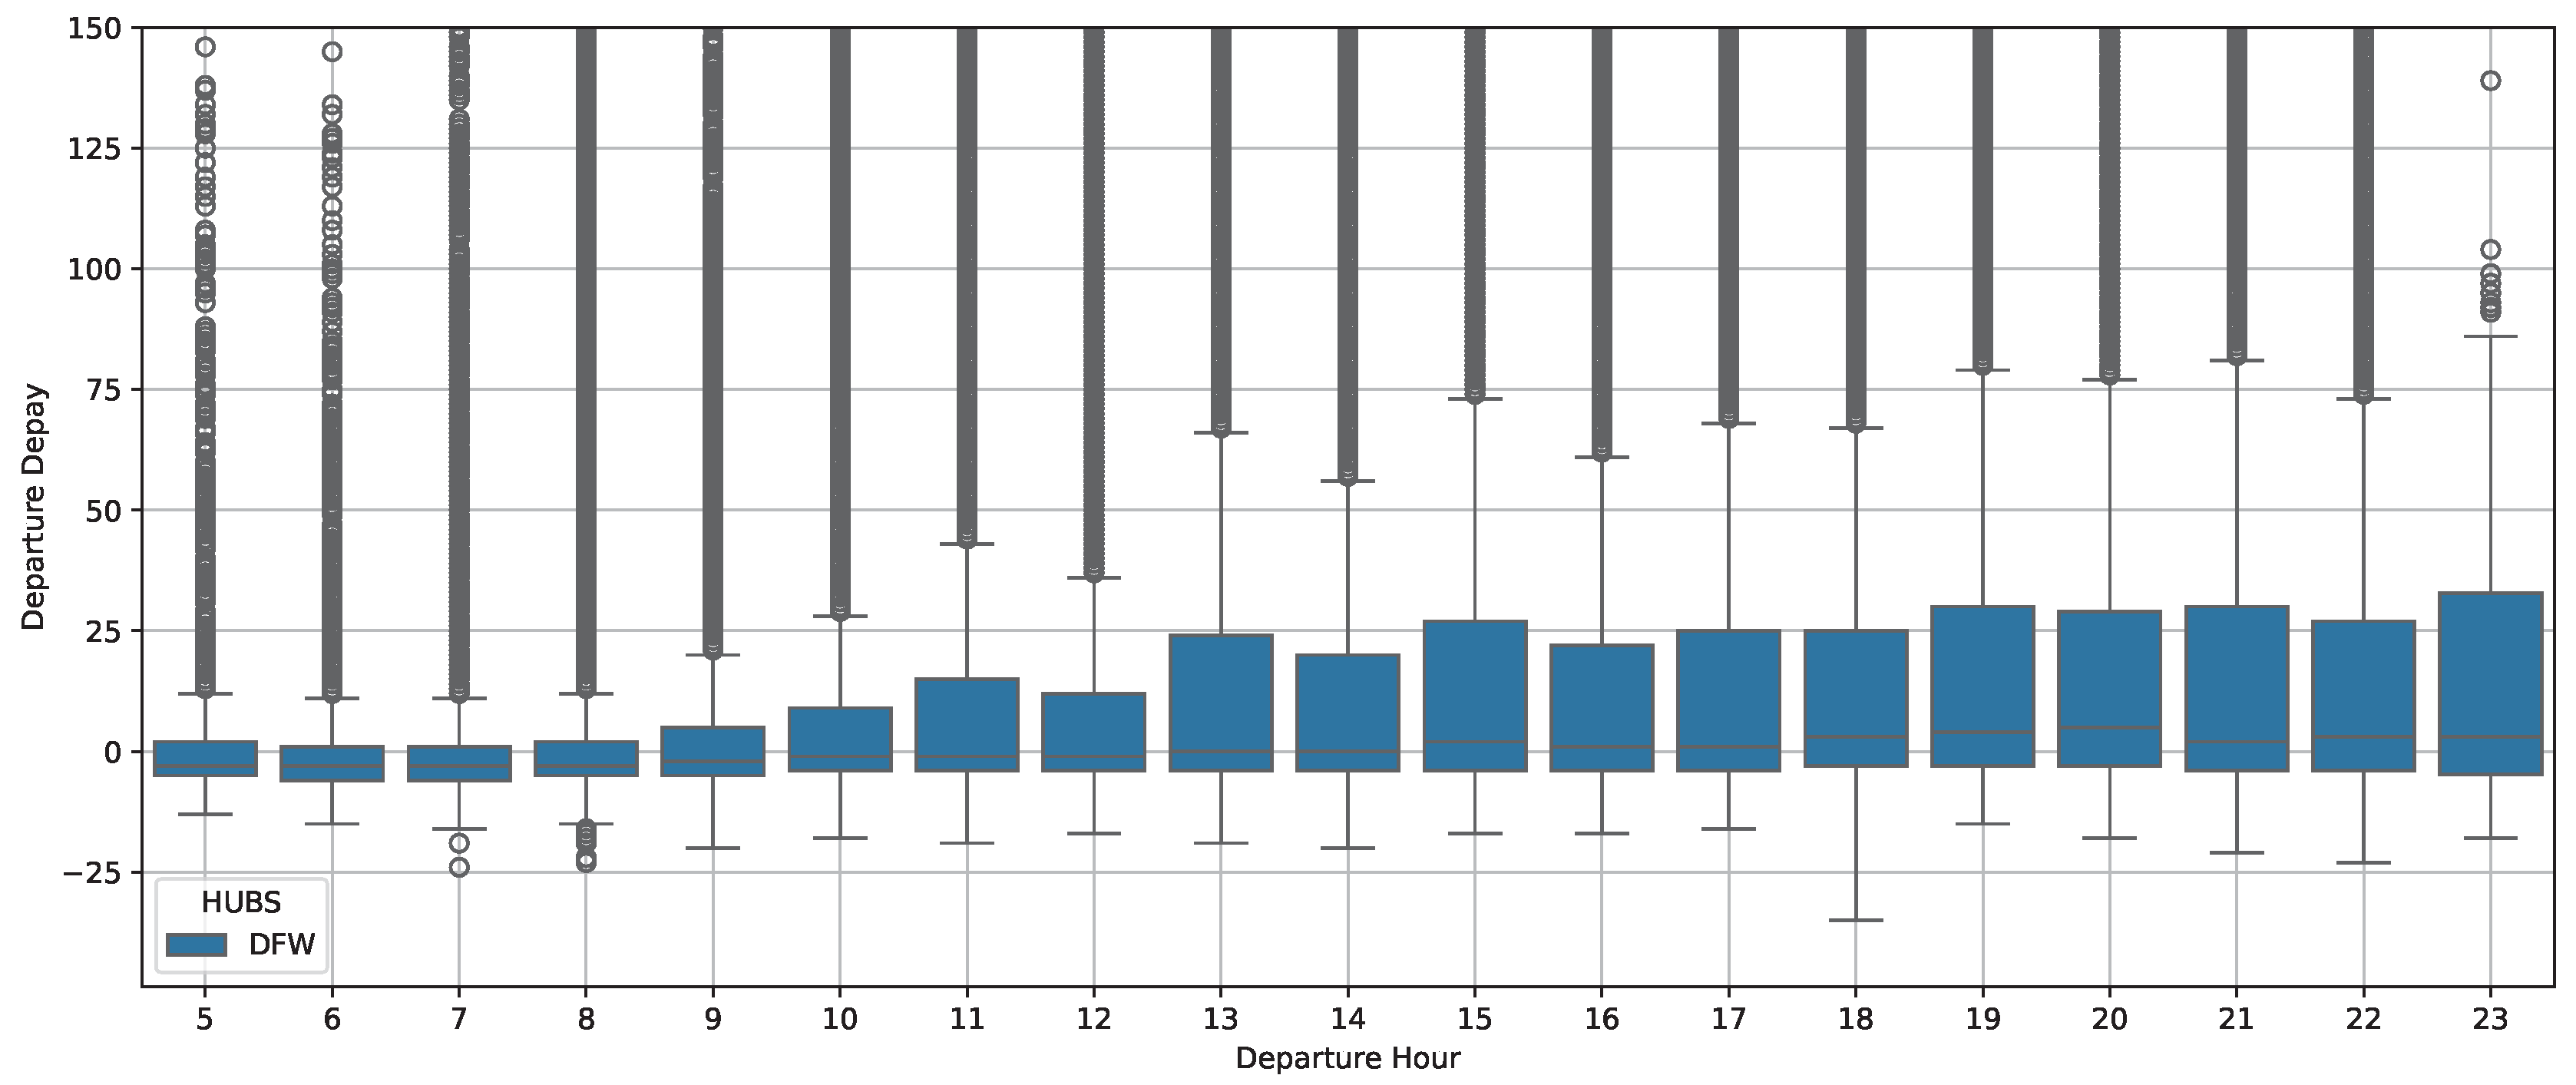
Figure 9.
Variability in flight departure delays by hour of departure at CLT.
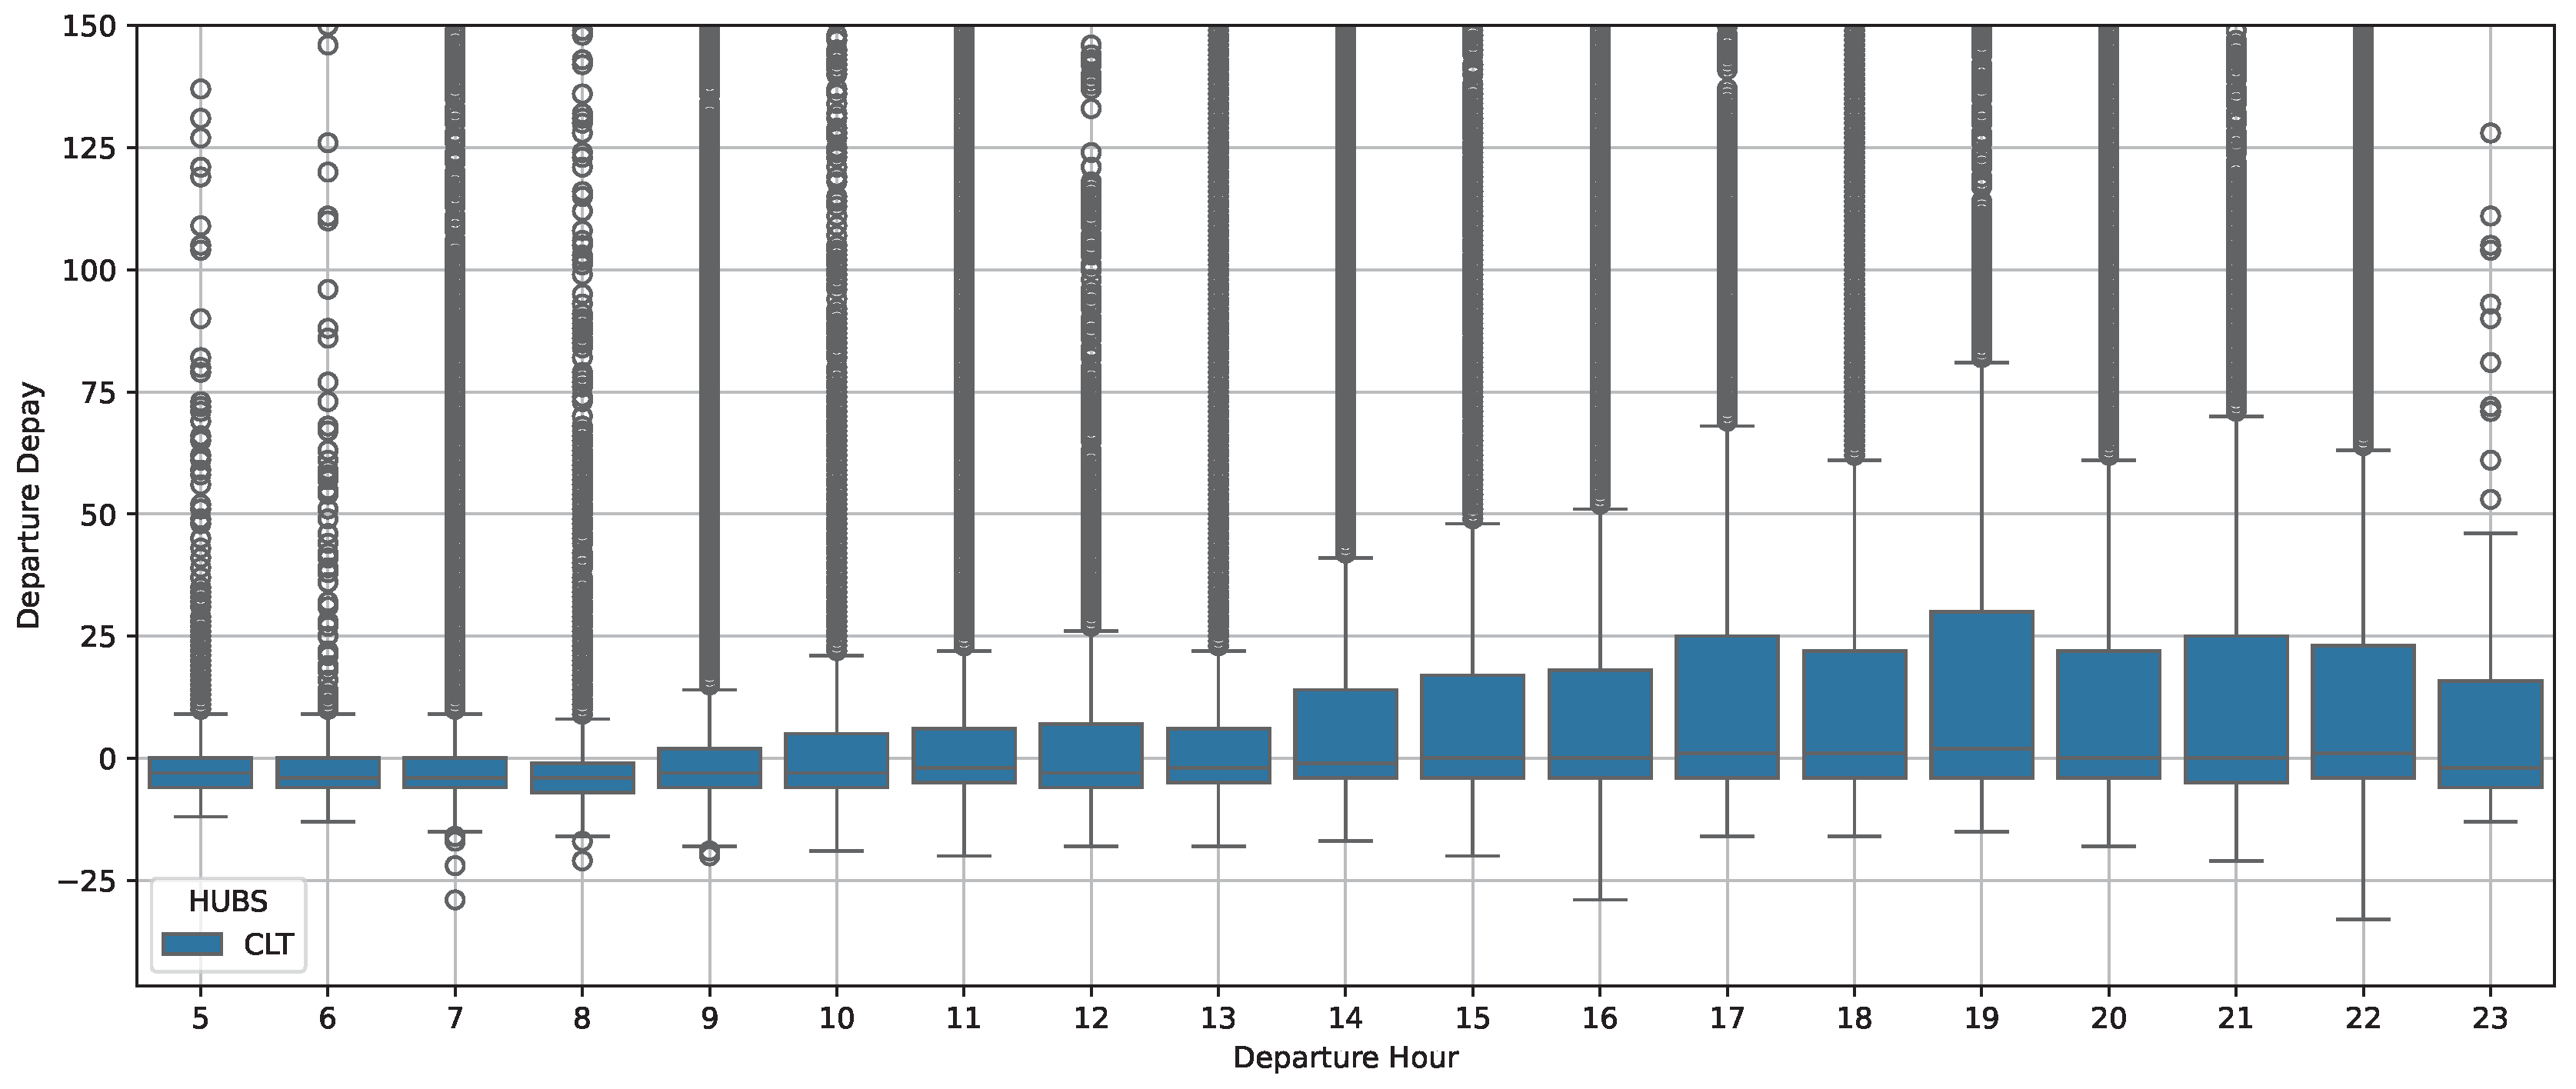
Figure 10.
Boxplot chart demonstrating departure delays by seasons at CLT and DFW
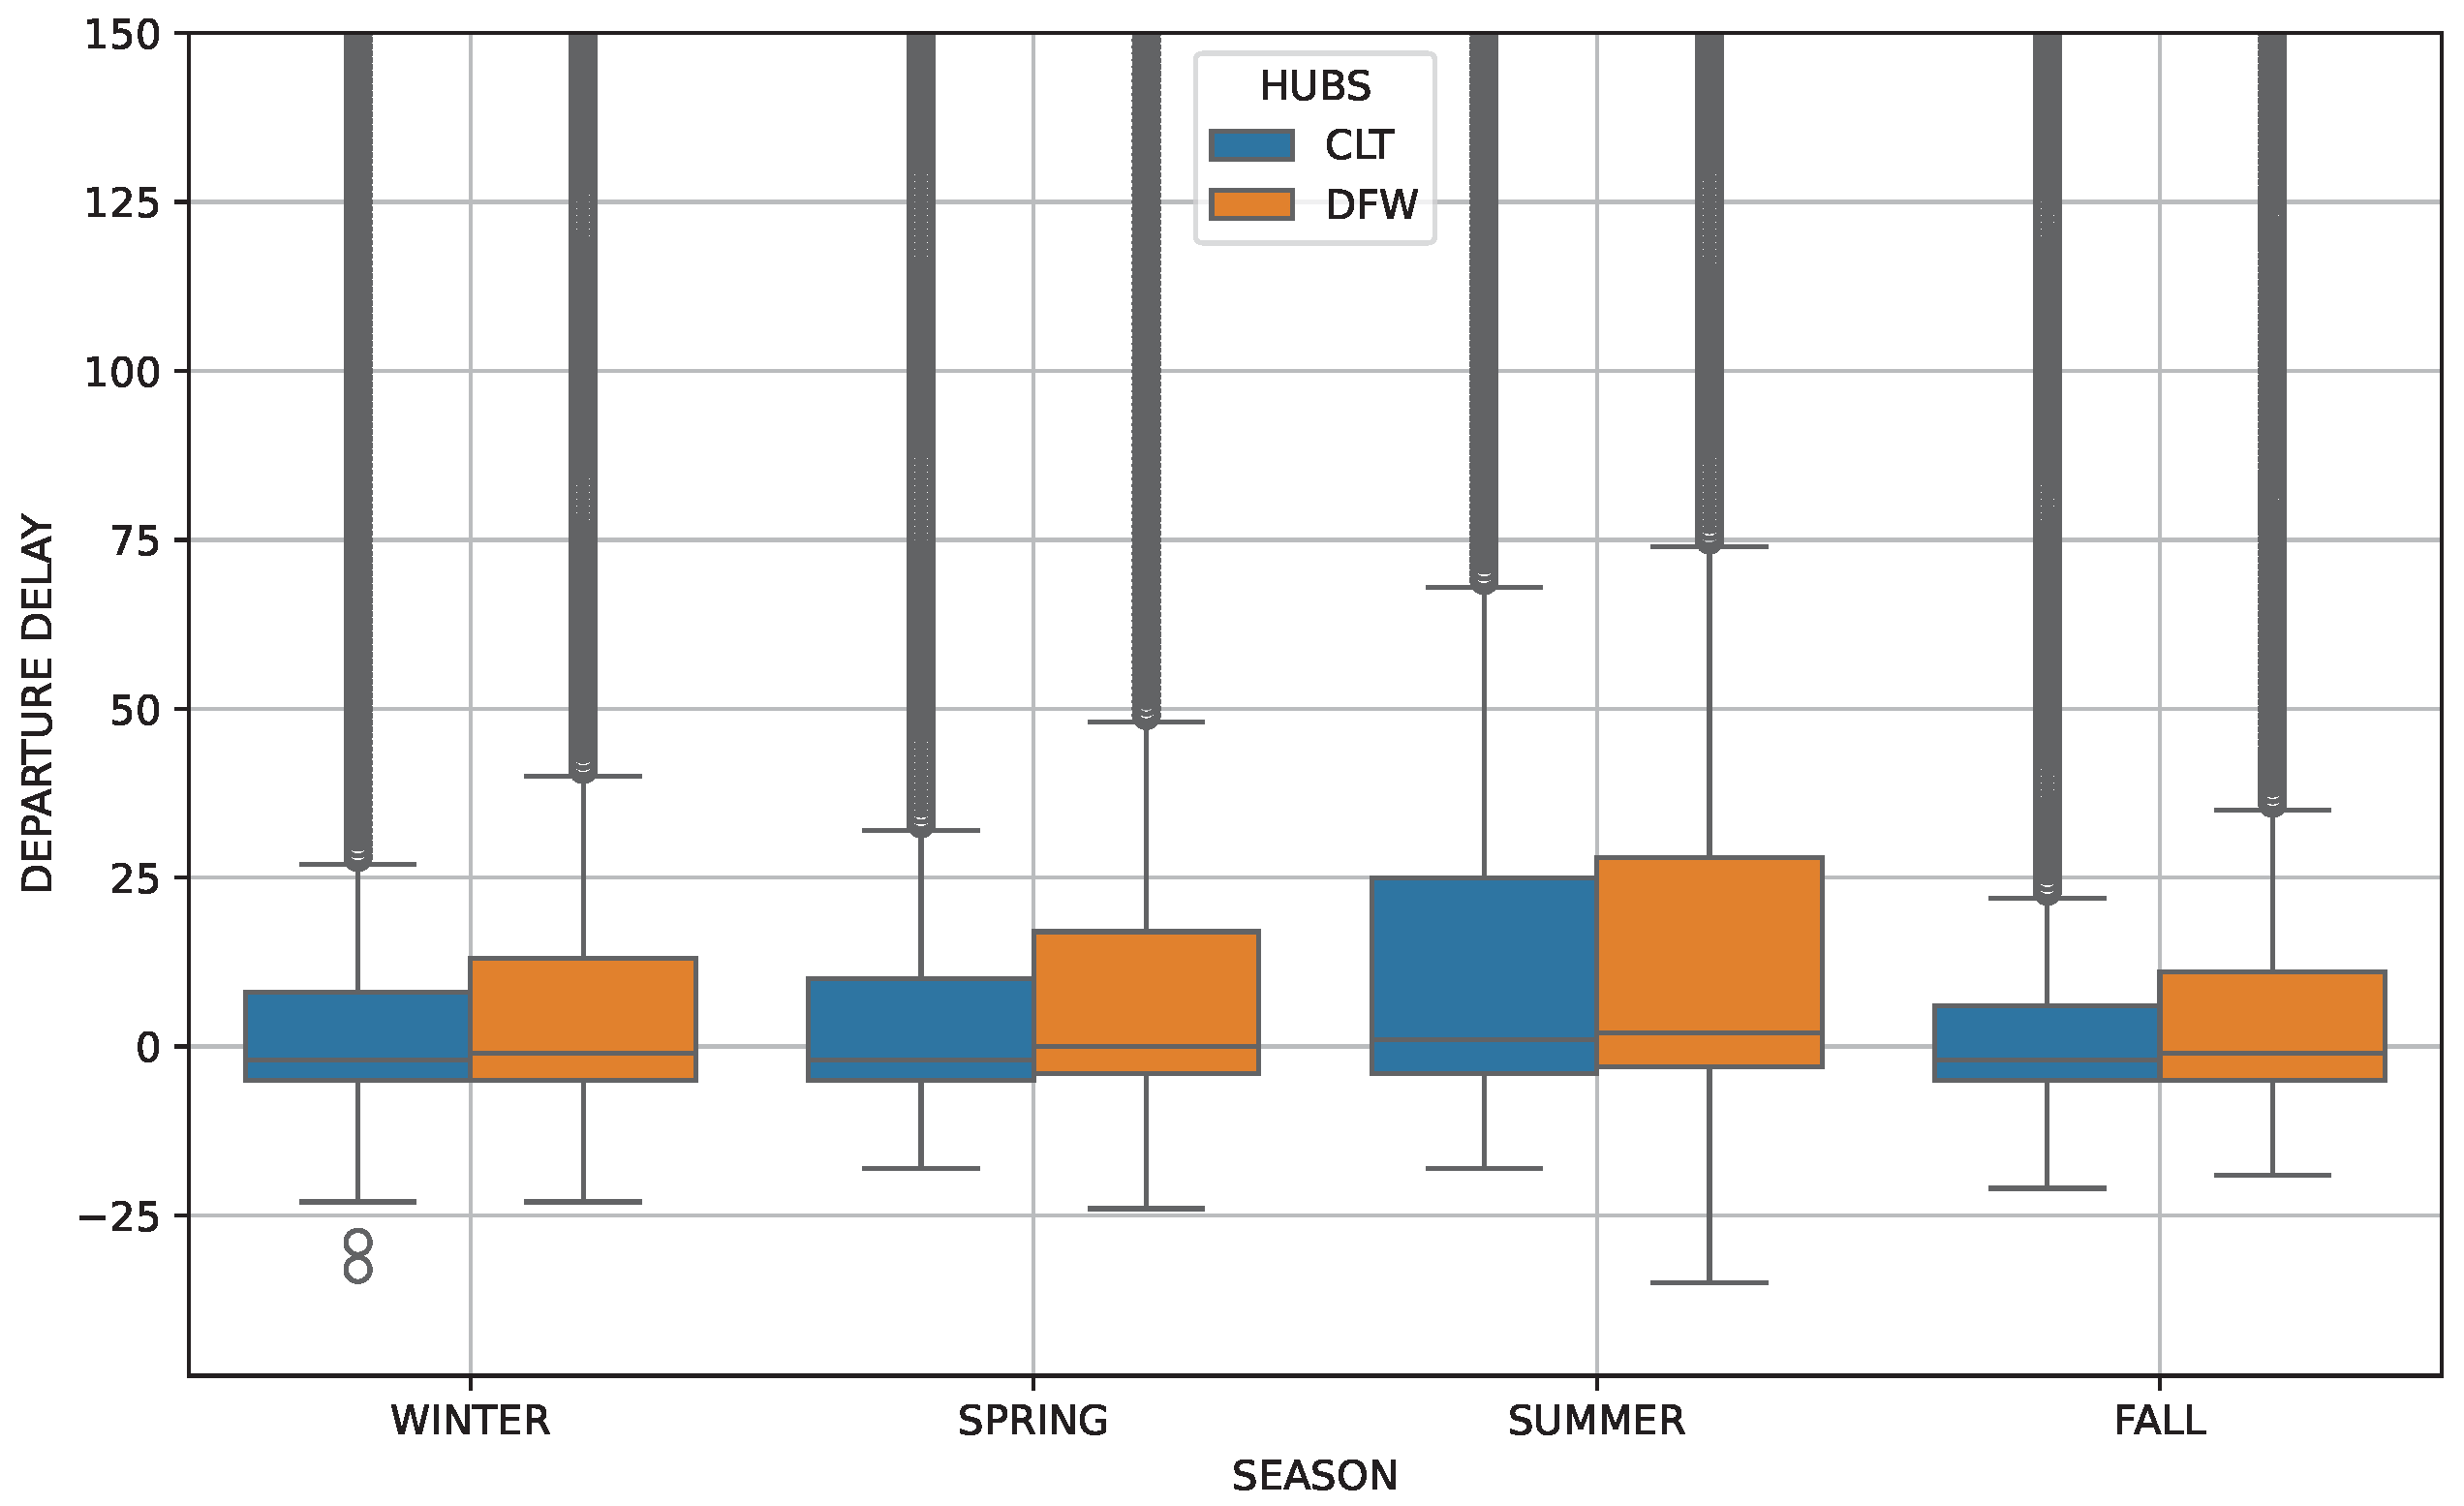
Figure 11.
RMSE and MAE of each CatBoost model tested on 2024 data.
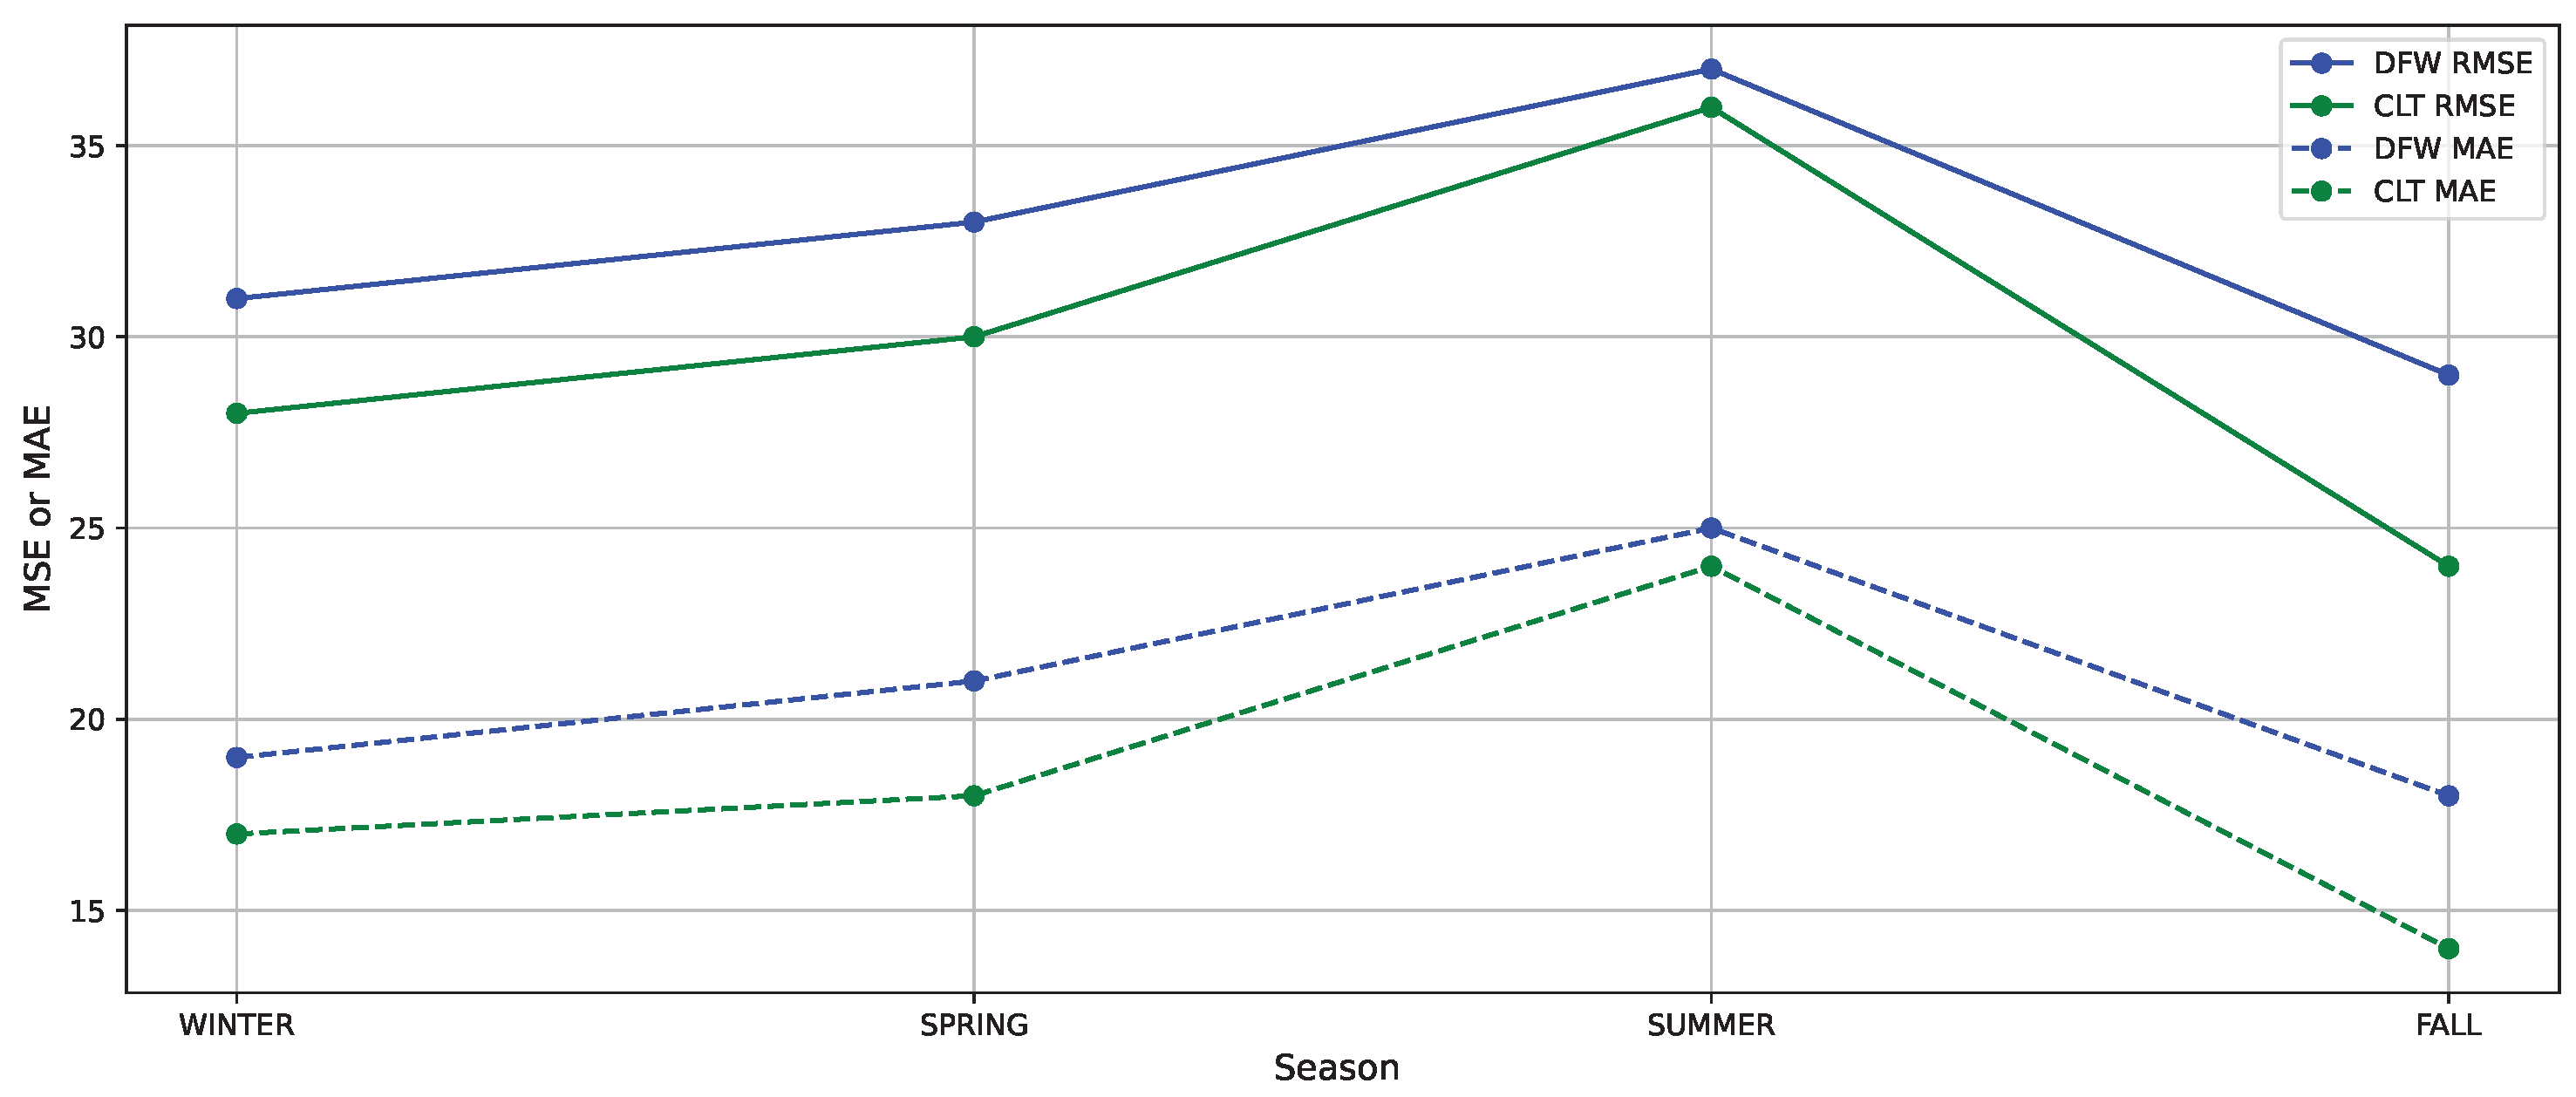
Figure 12.
trade-off curve between risk and planning cost for DFW
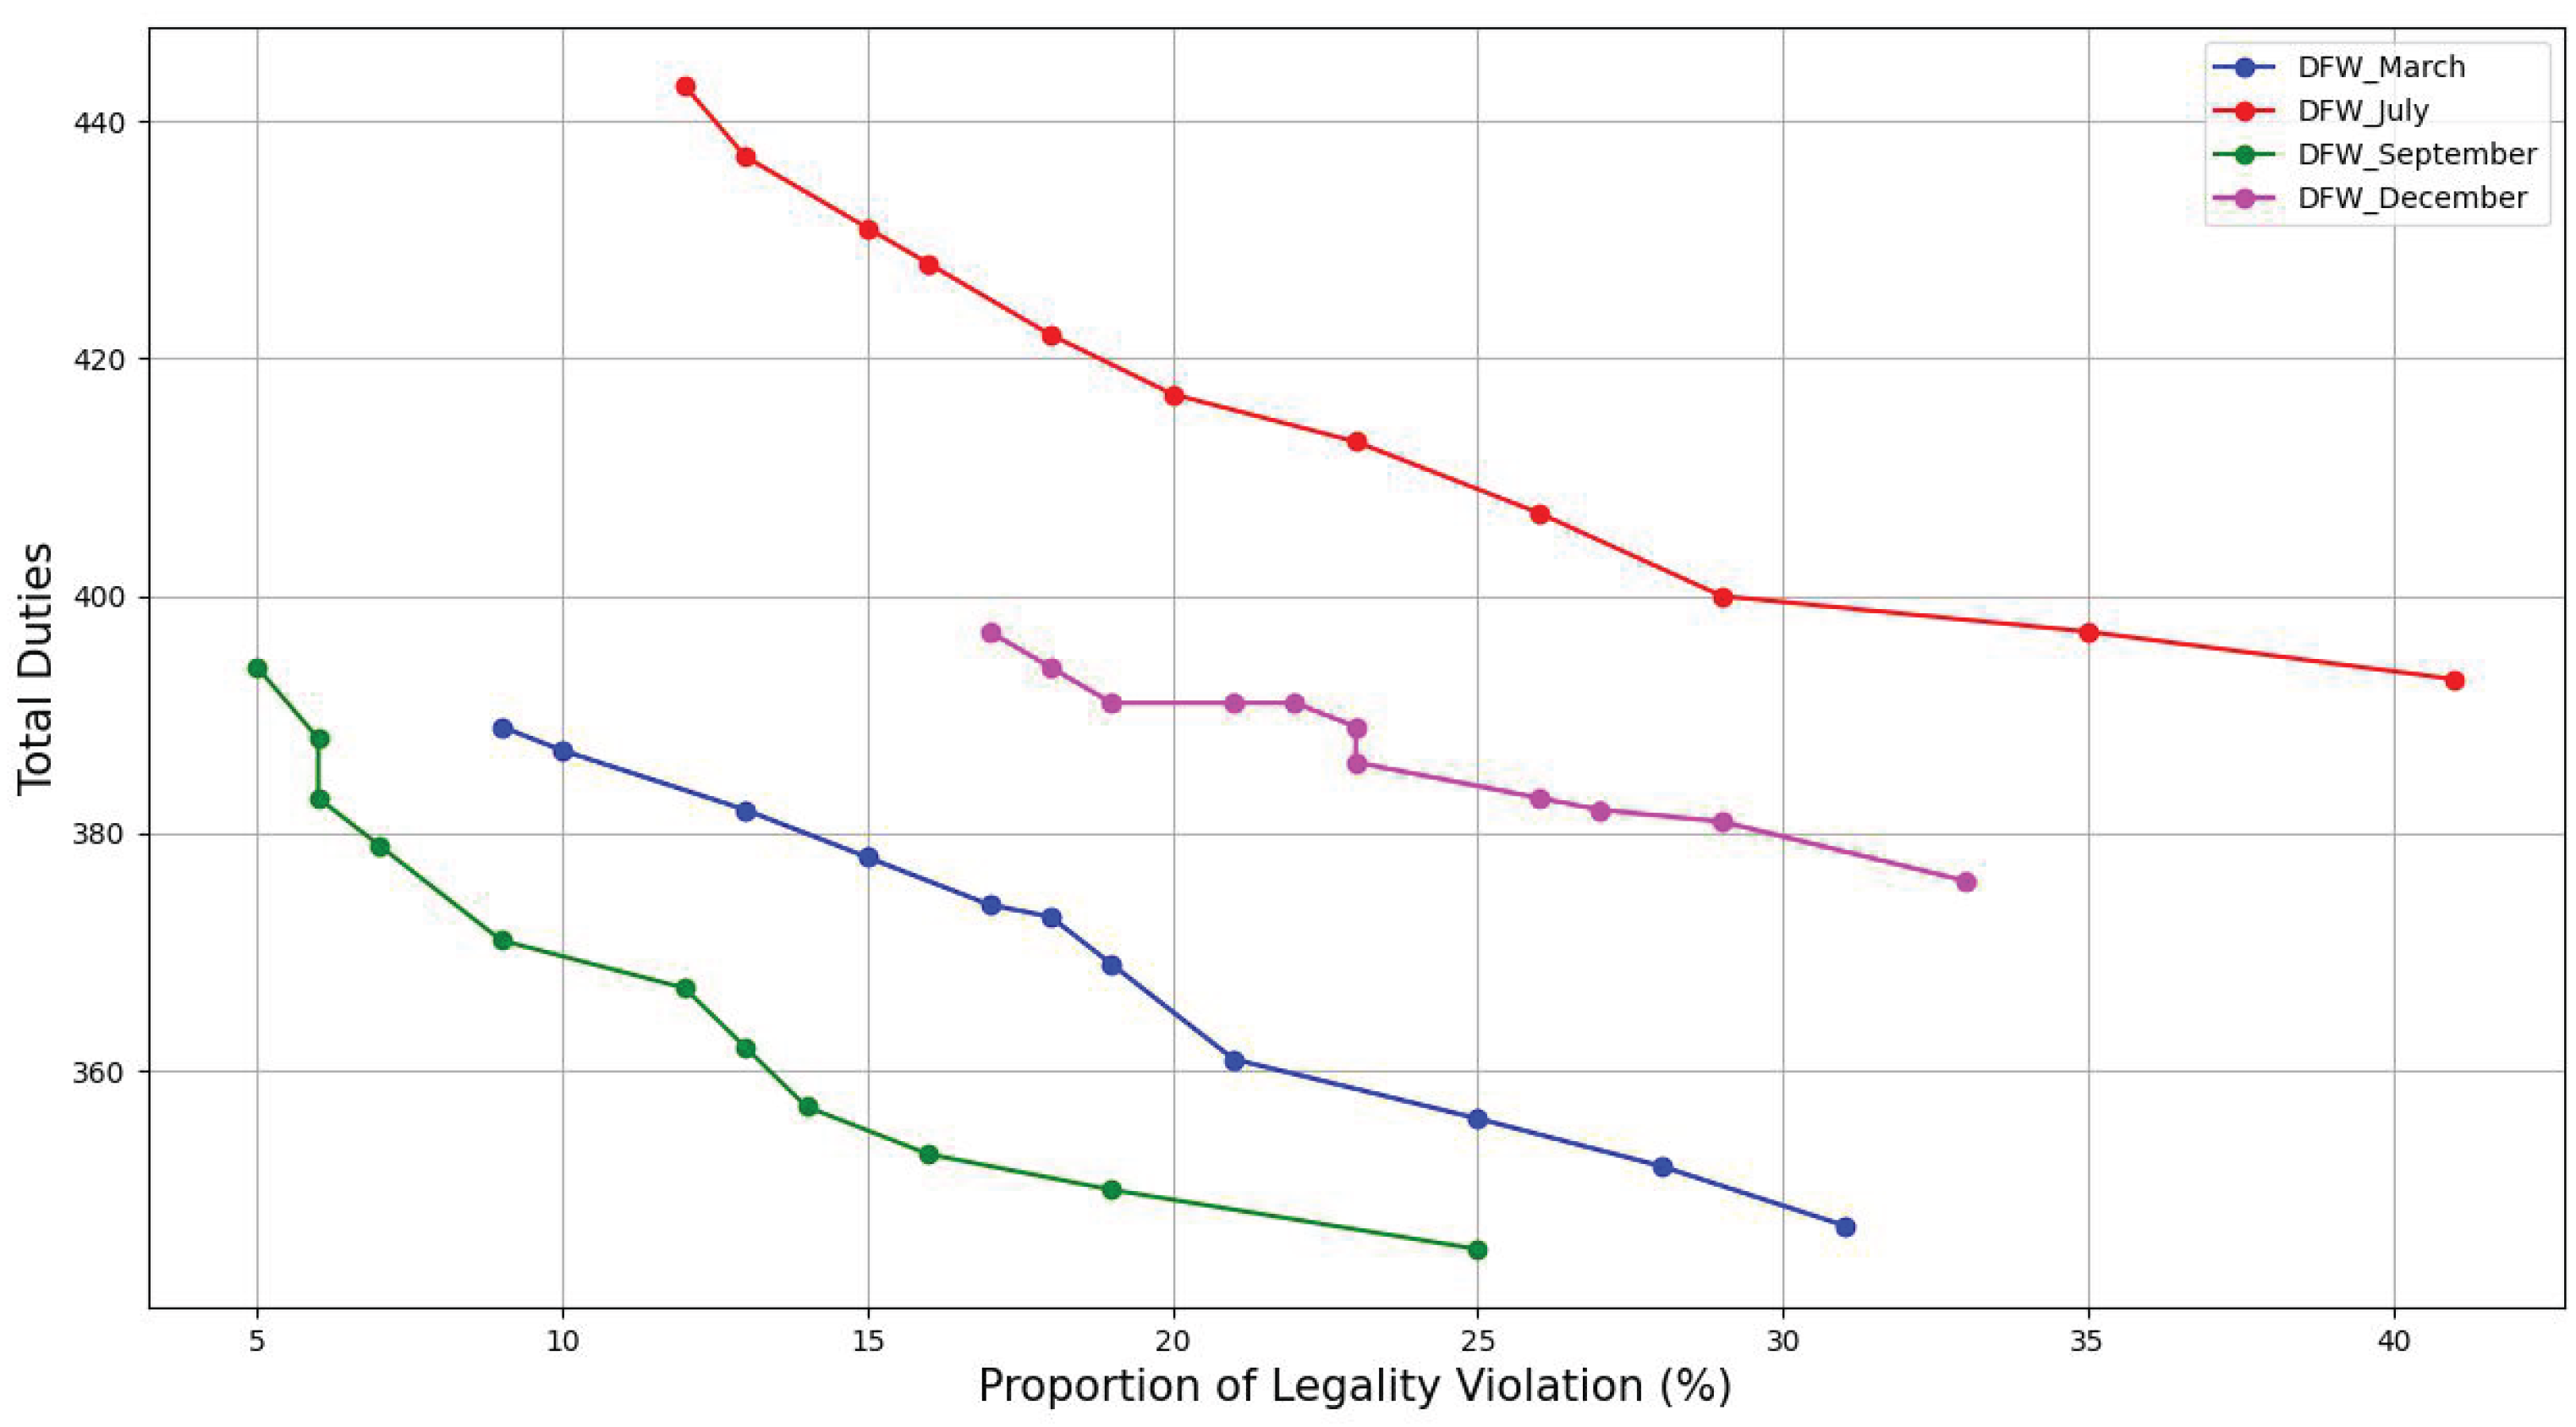
Figure 13.
trade-off curve between risk and planning cost for CLT
Disclaimer/Publisher’s Note: The statements, opinions and data contained in all publications are solely those of the individual author(s) and contributor(s) and not of MDPI and/or the editor(s). MDPI and/or the editor(s) disclaim responsibility for any injury to people or property resulting from any ideas, methods, instructions or products referred to in the content. |
© 2025 by the authors. Licensee MDPI, Basel, Switzerland. This article is an open access article distributed under the terms and conditions of the Creative Commons Attribution (CC BY) license (http://creativecommons.org/licenses/by/4.0/).
Copyright: This open access article is published under a Creative Commons CC BY 4.0 license, which permit the free download, distribution, and reuse, provided that the author and preprint are cited in any reuse.


