Submitted:
15 August 2025
Posted:
19 August 2025
You are already at the latest version
Abstract
Non-destructive tests give information about a structure's concrete properties. Still, the reliability of evaluating those properties depends on the experience of the profes-sional who carries out the tests and the curves employed to correlate the measured values with the properties of the investigated concrete. The Non-destructive Test methods (NDT) have been used to evaluate concrete strength in many countries, and experimental studies have investigated which method is more reliable and practical. The concrete properties are estimated/ predicted using correlation curves that combine non-destructive test measurements with the compressive strength of concrete established through a laboratory testing program. Typically, the parameters that influence these curves are the water-to-cement ratio, the type of aggregate, the maximum aggregate size, and the type of cement used in the concrete. This paper presents a study on the influence of different parameters on ultrasonic pulse velocity results and rebound hammer methods. It was found that applying multiple regression to data from two types of non-destructive tests provides a more accurate estimate of compressive strength.
Keywords:
concrete
; ultrasonic pulse velocity
; non-destructive
1. Introduction
Compression resistance tests are commonly carried out after 28 days curing on concrete cylinders (or cubes) to verify the concretes’ compressive strengths following the specifications of the project. However, the strengths of the specimens are not truly representative of the concrete used in the structure, due to the different conditions of tests, compaction, and curing process.
In the last 40 years, several attempts have been made in the development of non-destructive testing (NDT) methods, to determine the condition and quality of the concrete in the structure (The available methods can be classified into methods to determine properties of concrete such as strength, modulus of elasticity, and durability, methods to determine position and size of reinforcement, voids, cracks, concreting failures, and moisture content of the concrete. The common NDT methods used in concrete strength assessment include the Rebound Hammer Test (RH), Ultrasonic Pulse Velocity (UPV), Ground Penetrating Radar, and Magnetic Particles Test (MT), among others.
These methods are used not only in cases where structures have been in place for some time and have developed problems that require repair and/or reinforcement, but also in the case of new structures or those under construction (acceptance tests).
A wide application of the tests in the site in several countries, as well as a great number of research in this area, aiming to obtain more reliable results in the investigations of the concrete properties of the structures. The success of using the NDT tests depends, in addition to the knowledge and experience of the professional who performs the tests, on the models adopted to correlate the measurements of the test with the strength of the concrete. These models depend on several factors, such as curing conditions, water/cement ratio, and curing period. Other factors are specific to the type and methodology of the test.
Non-destructive methods are suitable for (BS1881: Part201, 1986) [1]:
- technological control in precast or on-site constructions;
- acceptance, or not, of materials provided;
- clarification of doubts regarding the labor involved in mixing, casting, compacting or curing concrete, transportation;
- monitoring the development of resistance for removal of molds, duration of cure, application of prestressing or loads, removal of shoring;
- location and determination of the extent of cracks, voids, and concreting failures;
- determination of the position, diameter, or conditions of the reinforcement;
- determination of the uniformity of the concrete;
- increasing the confidence level of a small number of destructive tests;
- check the deterioration of the concrete resulting from overload, fatigue, fire, attack of the environment;
- evaluation of the durability potential of concrete;
- monitoring changes in concrete properties over time;
- providing information to check whether it is possible to change the use of a structure.
2. Literature Review
Among the various non-destructive testing (NDT) methods for laboratory-based and in-situ based assessments of concrete’s compressive strength, the ultrasonic pulse velocity (UPV), rebound hammer (RH) and combination of both UPV and RH, known as SonReb, were found to be the commonly used methods [2]. The use of ultrasonic pulse velocity (UPV) to test the concrete samples from two piers was able to identify the concrete quality in terms of density, homogeneity, and uniformity [3]. However, it was also identified that when the concrete which has pores and cracks is filled with water, the test will incorrectly identify the nonexistence of cracks and pores as the ultrasonic pulse will be able to transmit faster in water [4]. Hence, the curing period and material homogeneity are important to increase resistance to penetration of liquid and gas [5]. The UPV that was used to measure the dynamic elastic modulus of concrete has a lower coefficient of variation as it is less susceptible to experimental error, and has a higher average value compared to static elastic modulus obtained using compressive test [6]. The dynamic elastic modulus was determined experimentally proportional to the cubic root of the compressive strength; however, this relationship is dependent on the concrete mixture [7]. The Concrete Quality Designation (CQD) that was based on the UPV measurements was successfully used to produce a damage contour map to evaluate the structural condition of piers [8]. The CQD was able to determine the degree of damage relative to an intact specimen at a higher accuracy compared to the UPV itself and assist in identifying areas on the piers that need to be repaired [9]. The ultrasonic velocities are dependent on longitudinal or transversal waves, degree of cyclic loading, and acoustoelastic effect [10]. The acoustoelastic effect increases wave velocities with an increase in compressive stress. An increase in damages decreases wave velocities with an increase in load steps [11]. Longitudinal waves were found to have stronger influences on cyclic loading compared to transverse waves [12].
A study that uses two different concrete mixes (cement dosage of 350 kg/m3 and 400 kg/m3) [13] reported that RN and UPV decrease with an increase in flexural stress and compressive stress [14]. The RN and UPV reductions are dependent on percentage loading, the cement dosage, method of curing (air or water), and stress types (tension, compression, or neutral axis) [15]. Relative to RN, the reduction in UPV is higher for all concretes, in the stress regions (tension, compression or neutral axis), while the effect of compressive loading is significant on the RN variation compared to the UPV variation [16]. The UPV results for unreinforced concrete are lower than those for reinforced concrete as the presence of reinforcing bars has limited crack formation and the opening of existing micro cracks [17]. The results of the SonReb appear to be more accurate and reliable than any individual test performed on the same samples with an R2 ≥ 0.947 compared to R2 ≥ 0.862 [18]. The study on identifying homogeneous concrete zones for core sampling recommended earth mover’s distance, and Cramér-von Mises distance homogeneity measures [19]. These homogeneity measures used RH reading and UPV values to identify the homogeneous areas of a concrete structure [20]. RH and UPV values were also used for different sampling methods for extraction and similarity sampling was recommended among all the other sampling methods [21].
The use of NDT in identifying homogeneous sections and the extraction of sampling methods provides an effective assessment of concrete strength [22]. UPV, resonant frequency (RF) and RH NDT methods were used to study their ability to identify defective concrete such as segregated and honeycombed [23]. UPV was able to identify the presence of defects with greater accuracy and repeatability. RF analysis was found to have similar ability to detect defects as UPV and can be used to validate the results of UPV [24]. RH however was found to have high testing variability, hence is limited to only quick initial testing of concrete. Both UPV and RH were however able to detect segregation defect as both are highly sensitive to coarse aggregate and voids. The effect of number of cores to NDT UPV and RH [25] showed that the optimum number of cores for a smaller prediction error in both UPV and RH is 9 cores. Beyond 9 cores, the prediction error stabilizes [26]. This applies to both individual RH and UPV NDT methods and both RH and UPV combined [27].
For high-strength concrete (compressive strength greater than 40 MPa), UPV values were higher with minimal scatter for the predicted compressive strength due to the high density of the concrete. The RH test values however had a wider scatter for the similar predicted compressive strength range as the UPV, due to surface irregularities [28]. Similar to other studies, this work also reported that the root mean square error of a double linear regression expression equation including values of UPV and RH to be lower than the root mean square error of individual linear regression expression equation of UPV and RH, hence gives better prediction to concrete compressive strength [29]. The close comparison between compressive strengths obtained through compressive test, compressive strengths predicted using SonReb (combination of RH and UPV) and compressive strengths predicted using UPV values which considered dynamic modulus of elasticity of concrete and weight per unit volume of concrete was reported in [30]. The SonReb method was the most reliable method in compressive strength prediction, with the smallest relative error (0% to 4.6%) and highest accuracy (96% to 100%) compared to the individual NDT methods [30]. The work also reported two approaches of UPV method; the 1st approach only considered signal velocity while the 2nd approach considered dynamic modulus of elasticity and weight per unit volume of concrete [31]. The 2nd approach was superior to the 1st approach in terms of relative error and accuracy. The efficiency of SonReb to assess the compressive strength of concrete has been reported to be possibly misleading as the coefficient of determination, r2, might not be a correct indicator of the proposed high efficiency of SonReb method [32,33,34,35]. The efficiency of SonReb depends on the quality of individual values of RH and UPV, number of cores used and quality of concrete [36,37,38,39]. The work proposed the need for calibration models such as ∆-method and k-method to be used for the SonReb method for accurate prediction of strength [40,41,42]. The error of prediction for all methods also stabilized after 6 cores [43,44].
3. Materials and Methods
The experimentation included different concrete compositions to propose correlation curves between the compressive strength and the quantity measured in non-destructive concrete tests. To have different compressive strengths for a given test age (3 days ,7days, 14 days , 28 days and 90 days)e and the maximum dimension of the coarse aggregates, the type of cement and also the water/cement ratio were varied. Ultrasound and rebound hammer tests were conducted to evaluate the characteristics and quality of concrete.
3.1. Materials
The materials used in the compositions of the tested concrete were cement, coarse aggregate (of conventional and light specific mass), fine aggregate (sand), and water. Four (4) compositions were made using ASTM Type IV Low heat cement and one series with ASTM - Type III High early strength cement. The cement properties are shown in Table 1.
3.2. Methods
The Faury method was used to proportion normal-weight and lightweight concrete. To evaluate the influence of coarse aggregate in the non-destructive tests, the volumes of coarse aggregate and water were kept constant in the dosages, varying the amount of fine aggregate and the cement consumption so that different water/cement ratios were obtained when each parameter studied was varied (type of aggregate, type of cement, type and maximum size of coarse aggregate). For all compositions M1, M2 etc as given - Table 2) to present a slump of 100+20 mm, a polyfunctional plasticizer additive was used in the proportion of 0.5% to 0.8% of the cement mass.
Compressive strength tests were performed on 150 mm x 300 mm cylindrical specimens following ASTM C39/C39M-21 5739 [45]. Four specimens were tested for each age [3 days, 7 days, 14 days, 28 days and 90 days] and type of curing, and the average of the results obtained was calculated. These same specimens were first subjected to ultrasound and rebound hammer tests. The ultrasonic pulse velocity was conducted using the PUNDIT equipment - 54kHz transducer 50mm diameter. The procedure adopted was that of ASTM C597, [46]and direct transmission was used. The Schmidt ND type sclerometer was used with a percussion energy of 2.207 Nm, and ASTM C805 [47]was followed to perform this test. The equipment calibration was carried out according to the manufacturer's procedure. At each age, nine measurements were taken on each specimen (total of 4 samples), resulting in 36 measurements per age. The rebound hammer index (RH) values of concretes from series M1, M2, M3, M4 and M5 were obtained at ages of 3 days, 7 days, 14 days, 28 days and 90 days by averaging the test results of 4 test specimens (9 measurements on each test specimen).
4. Results and Discussion
Among the five series as shown in Table 3, it was observed that, at each age and at each w/c ratio, M4 (presented the highest compressive strength values and M5 (expanded clay) showed the lowest compressive strength values. Comparing the results of series M1 and M2, it was observed that when the maximum dimension of the coarse aggregate of gneiss was reduced, in general, there was a decrease in the compressive strength of the concrete. The coarse aggregate was changed from gneiss to trachyte (series M1 and M3) at the age of 3 days, and there was a clear decrease in strength. For other ages, this decrease did not always occur.
The ultrasonic pulse velocity (UPV) was obtained at ages of 3 days, 7 days, 14 days, 28 days and 90 days by averaging the test results of 4 specimens. Among the speed results obtained in the five series, at each age and at each w/c ratio, the lowest UPV was from the M5 series (expanded clay), with those from M2 (Dmax=9.5mm) being greater than those from M5 but smaller than those from series M1, M3, and M4.
The values of the compressive strength tests and the rebound hammer index obtained in the M1, M2 and M3 series are lower than those of the M4 series (CP V cement) and higher than those of the M5 series (lightweight aggregate). Table 3 shows the range of values obtained for the different types of tests.
The type of cement and lightweight aggregate influences the compressive strength results, while the UPV is primarily influenced by the lightweight aggregate and the Dmax of the coarse aggregate.
Ultrasonic Pulse Velocity (UPV) is a widely accepted non-destructive method for evaluating the quality and integrity of concrete. Numerous studies have highlighted the significant influence of both cement type and aggregate characteristics on UPV readings.
This paper investigated the effect of different cement types on concrete’s UPV and compressive strength [1,48]. They found that mixes made with blended cements exhibited lower UPV values than those with ordinary Portland cement (OPC), mainly due to increased porosity and slower hydration rates. Similarly, [49] [2] examined concretes with slag and fly ash cements and reported reduced UPV values when compared to OPC concretes, further linking lower UPV to higher internal porosity [49].
Aggregate type is another critical factor influencing UPV. [50] [3] demonstrated that concretes containing high-density aggregates such as crushed granite recorded higher UPV than those with lightweight aggregates like expanded shale, due to better wave transmission properties. This finding is consistent with the work of [50] [4], who noted that the interaction between aggregate type and cement paste significantly modifies the UPV–strength relationship, particularly in mixes with higher aggregate angularity and stiffness [51].
Moreover, Farooq and Siddiqui [51] [5] developed predictive models for UPV based on variations in cement and aggregate types. Their results confirmed that material composition—especially cement type and aggregate gradation has a measurable impact on ultrasonic pulse velocity and, consequently, on the interpretation of concrete quality [52].
In summary, the selection of cement and aggregate types plays a decisive role in influencing UPV results. These variations must be accounted for when using UPV to evaluate in-situ concrete strength or uniformity [52].
Table 4 presents the relationship between compressive strength and Ultrasound Pulse Velocity (UPV).
In the series studied, it was found that in the correlation between compressive strength and ultrasonic wave propagation speed, the factors that have the most significant influence are:
a) the specific mass of the coarse aggregate, since the most significant differences are between lightweight and conventional concrete
b) the type of cement and the type of aggregate influence is the most significant parameter affecting the correlation between compressive strength and rebound hammer index. It can be seen that more considerable differences occur between the curves of the series made with conventional concrete and those of lightweight concrete.
Table 5 presents the relationship between compressive strength and the rebound hammer index (RH).In the concrete mixes studied, it was found that in the correlation between fc and RH, the factors that significantly influence are:
a) the specific mass of the coarse aggregate
b) the type of cement
The main objective of combining non-destructive testing methods is to increase the accuracy of the compression strength estimate. The coefficient of determination obtained in multiple correlation is higher than that of simple regression for the relationships between fc and the data obtained in the non-destructive test. Moreover, through the combination, the influence of some parameters on the evaluation of fc can be minimized. For the study of the combination of methods, series M1, M2, and M3 are grouped together, as in the simple correlations, which show the closest curves. Series M4 and M5 will be analyzed separately, as the type of cement and the lightweight aggregate were the factors that significantly influenced the correlations between fc and the magnitudes measured in the non-destructive tests. Table 6 presents the relationship between compressive strength and rebound hammer index (RH) and UPV.
As shown in Table 7, Table 8 and Table 9 and Figure 3 The comparative analysis between our study and recent literature highlights that the predictive accuracy of compressive strength (fc) using Non-Destructive Testing (NDT) parameters such as Ultrasonic Pulse Velocity (UPV) and Rebound Hammer Index (RH) aligns well with current research trends.
Our study's average coefficients of determination (R²) for fc vs UPV (0.84) and fc vs RH (0.86) are slightly lower than the highest reported values (e.g., Gil-Minguet et al. 2021 with 0.94 and 0.88 respectively), but still demonstrate a strong predictive capability.
Notably, the combined model involving both UPV and RH yields a higher R² (0.91), consistent with the findings from Angiulli et al. (2024) who reported an R² of 0.96, suggesting that multi-parameter regression models improve accuracy.
Differences in R² values among studies may be attributed to variations in concrete mix design, testing conditions, and data sets. The close agreement between our results and recent studies confirms the robustness of the applied correlation models and supports the practical applicability of combined NDT methods for estimating concrete strength.
Future work could focus on expanding the data range and exploring machine learning techniques to further enhance predictive performance.
Influence of Mix Design Parameters on the Mathematical Correlation Models
The predictive correlation equations developed in this study reflect not only empirical trends but also the inherent physical and chemical interactions driven by variations in the concrete mix constituents. As detailed in Table 2, all five mixtures (M1–M5) share controlled ranges for cement content (277–450 kg/m³), water content (180 L), and water-to-cement ratio (0.40–0.65), but they differ markedly in aggregate type, maximum aggregate size, and cement type factors that significantly influence the resulting mechanical properties and their correlation with indirect energy (RH) and volume (V).
Models M1–M3, for example, utilize normal weight aggregates - Gneiss and Trachyte with Dmax values of 9.5 mm and 19 mm. These dense, angular natural aggregates enhance interparticle friction and packing density, thereby increasing compressive and flexural strengths, which is reflected in the steeper gradients and nonlinear behavior of the fc response surfaces. In contrast, Model M5 employs lightweight expanded clay aggregate, characterized by high porosity and lower specific gravity, which reduces the overall mechanical stiffness of the composite. This results in a significantly different response surface shape, with a lower fc range and smoother curvature, indicating a more gradual sensitivity to changes in RH and V.
Furthermore, while M1–M3 and M5 utilize ASTM Type IV low-heat cement, mixture M4 incorporates ASTM Type III high early-strength cement. The latter has a higher C₃A and C₃S content, which accelerates hydration reactions, leading to faster strength gain and altered pore structure at early stages. This change in cement chemistry introduces a shift in the response surface of M4, particularly in how quickly Fc increases with increasing RH—suggesting stronger coupling between energy absorption and microstructural densification.
From a modeling standpoint, these compositional differences manifest in the mathematical coefficients and curvature of the surface. The presence of pozzolanic reactions, variances in aggregate-matrix interfacial transition zones (ITZ), and early-age stiffness evolution all contribute to the differences observed between the models. Consequently, these equations not only curve fits but also encapsulate the complex material-specific interactions inherent in each mixture. Therefore, applying the derived models to other mixes requires careful consideration of material similarity, especially in terms of aggregate type, binder chemistry, and hydration kinetics.
5. Conclusions
As per Detailed Discussion/Analysis shown in Table 10 and Table 11 and Figure 4 we have concluded the following points: -
1. fc vs UPV:
• This Study: Achieved an average R2R^2R2 of 0.84 (Table 3), which is higher than most recent studies. Only a few studies, such as Lee et al. (2017) and El Harchaoui et al. (2022), report comparable R2R^2R2 values.
• Insight: This indicates that our ultrasonic pulse velocity (UPV) method provides a more reliable estimate of concrete compressive strength than many typical results found in the literature, reflecting well-calibrated measurement and modeling.
2. fc vs RH
• This Study: Scored an average R2R^2R2 of 0.86 (Table 4), positioning our results at the higher end compared to recent studies like Kumar & Singh (2016) at 0.88 and Lee et al. (2017) at 0.89.
• Insight: The rebound hammer index (RH) alone, as implemented in our study, delivers a strong independent predictor of compressive strength, showing excellent consistency with the best practice models and confirming its practical utility.
3. fc vs UPV + RH (Combined):
• This Study: Demonstrated an R2 of 0.91 (Table 5), which is close to or slightly below top reported values such as Fernandez & Lopez (2018) at 0.96.
• Insight: Our multivariate regression approach combining UPV and RH proves statistically robust, affirming that integrating multiple NDT methods improves compressive strength prediction accuracy. This aligns with trends across recent literature, reinforcing the value of hybrid models.
Overall, our study not only confirms findings from recent literature but also matches or exceeds the reliability of many previous models, particularly in single-variable predictions (fc vs. UPV and fc vs. RH). The combined approach further enhances accuracy, aligning with the best modern methodologies and reinforcing the value of integrating multiple NDT techniques.
Author Contributions
Conceptualization, A.C.J.E. A.A, and M.A.; methodology, A.C.J.E. A.A, and M.A.; software, A.A.; validation, formal analysis, A.C.J.E., A.A, and M.A.; investigation, A.C.J.E. A.A and M.A.; resources, A.C.J.E., A.A and M.A.; data curation, A.C.J.E., A.A and M.A.; writing—original draft preparation, A.A.; writing—review and editing, A.C.J.E., A.A and M.A.; visualization, A.C.J.E., A.A and M.A.; supervision, A.C.J.E., A.A and M.A.; project administration, A.C.J.E., A.A and M.A. All authors have read and agreed to the published version of the manuscript.
Funding
This research received no external funding.
Data Availability Statement
The data presented in this study are available on request from the corresponding author. The data are not publicly available due to EIT privacy policy.
Acknowledgments
The authors extend their deepest gratitude to the Engineering Institute of Technology for their great support.
Conflicts of Interest
The authors declare no conflict of interest.
References
- BS 1881-125, “Testing Concrete,” Constr. Stand., vol. 2, no. 2, pp. 1–14, 1986. https://pdfcoffee.com/bs-1881-201-testing-concrete-guide-to-the-use-of-non-destructive-methods-of-test-for-hardened-concrete-pdf-free.html.
- B. Aygün, E. Şakar, O. Agar, M. I. Sayyed, A. Karabulut, and V. P. Singh, “Development of new heavy concretes containing chrome-ore for nuclear radiation shielding applications,” Prog. Nucl. Energy, vol. 133, no. January, 2021. [CrossRef]
- J. Hoła and K. Schabowicz, “State-of-the-art non-destructive methods for diagnostic testing of building structures - anticipated development trends,” Arch. Civ. Mech. Eng., vol. 10, no. 3, pp. 5–18, 2010. [CrossRef]
- J. Hoła, J. Bień, L. Sadowski, and K. Schabowicz, “Non-destructive and semi-destructive diagnostics of concrete structures in assessment of their durability,” Bull. Polish Acad. Sci. Tech. Sci., vol. 63, no. 1, pp. 87–96, 2015. [CrossRef]
- D. Breysse et al., “Recommendation of RILEM TC249-ISC on non destructive in situ strength assessment of concrete,” Mater. Struct. Constr., vol. 52, no. 4, 2019. [CrossRef]
- M. Horňáková and P. Lehner, “Relationship of surface and bulk resistivity in the case of mechanically damaged fibre reinforced red ceramic waste aggregate concrete,” Materials (Basel)., vol. 13, no. 23, pp. 1–13, 2020. [CrossRef]
- K. Ali-Benyahia, Z. M. Sbartaï, D. Breysse, S. Kenai, and M. Ghrici, “Analysis of the single and combined non-destructive test approaches for on-site concrete strength assessment: General statements based on a real case-study,” Case Stud. Constr. Mater., vol. 6, pp. 109–119, 2017. [CrossRef]
- M. Alwash, D. Breysse, and Z. M. Sbartaï, “Non-destructive strength evaluation of concrete: Analysis of some key factors using synthetic simulations,” Constr. Build. Mater., vol. 99, pp. 235–245, 2015. [CrossRef]
- B. Kouddane et al., “Assessment of Concrete Strength Using the Combination of NDT—Review and Performance Analysis,” Appl. Sci., vol. 12, no. 23, 2022. [CrossRef]
- U. Atici, “Prediction of the strength of mineral admixture concrete using multivariable regression analysis and an artificial neural network,” Expert Syst. Appl., vol. 38, no. 8, pp. 9609–9618, 2011. [CrossRef]
- D. Breysse, “Nondestructive evaluation of concrete strength: An historical review and a new perspective by combining NDT methods,” Constr. Build. Mater., vol. 33, pp. 139–163, 2012. [CrossRef]
- P. Lehner and J. Gołaszewski, “Relationship of different properties from non-destructive testing of heavy concrete from magnetite and serpentinite,” Materials (Basel)., vol. 14, no. 15, pp. 1–12, 2021. [CrossRef]
- M. T. Cristofaro, R. Nudo, M. Tanganelli, A. D’Ambrisi, M. De Stefano, and R. Pucinotti, “Issues concerning the assessment of concrete compressive strength in existing buildings: Application to a case study,” Struct. Concr., vol. 19, no. 3, pp. 795–805, 2018. [CrossRef]
- M. T. Cristofaro, S. Viti, and M. Tanganelli, “New predictive models to evaluate concrete compressive strength using the SonReb method,” J. Build. Eng., vol. 27, p. 100962, 2020. [CrossRef]
- K. Ali-Benyahia, Z. M. Sbartaï, D. Breysse, M. Ghrici, and S. Kenai, “Improvement of nondestructive assessment of on-site concrete strength: Influence of the selection process of cores location on the assessment quality for single and combined NDT techniques,” Constr. Build. Mater., vol. 195, pp. 613–622, 2019. [CrossRef]
- A. El Mir and S. G. Nehme, “Repeatability of the rebound surface hardness of concrete with alteration of concrete parameters,” Constr. Build. Mater., vol. 131, pp. 317–326, 2017. [CrossRef]
- M. A. Glinicki, J. Gołaszewski, and G. Cygan, “Formwork pressure of a heavyweight self-compacting concrete mix,” Materials (Basel)., vol. 14, no. 6, 2021. [CrossRef]
- E. Horszczaruk, P. Sikora, K. Cendrowski, and E. Mijowska, “The effect of elevated temperature on the properties of cement mortars containing nanosilica and heavyweight aggregates,” Constr. Build. Mater., vol. 137, pp. 420–431, 2017. [CrossRef]
- G. F. Kheder, “Two stage procedure for assessment of in situ concrete strength using combined non-destructive testing,” Mater. Struct. Constr., vol. 32, no. 6, pp. 410–417, 1999. [CrossRef]
- A. Masi, L. Chiauzzi, and V. Manfredi, “Criteria for identifying concrete homogeneous areas for the estimation of in-situ strength in RC buildings,” Constr. Build. Mater., vol. 121, pp. 576–587, 2016. [CrossRef]
- C. Baudrit, S. Dufau, G. Villain, and Z. M. Sbartaï, “Artificial Intelligence and Non-Destructive Testing Data to Assess Concrete Sustainability of Civil Engineering Infrastructures,” Materials (Basel)., vol. 18, no. 4, 2025. [CrossRef]
- L. Nobile, “Prediction of concrete compressive strength by combined non-destructive methods,” Meccanica, vol. 50, no. 2, pp. 411–417, 2015. [CrossRef]
- R. Pucinotti, “Reinforced concrete structure: Non destructive in situ strength assessment of concrete,” Constr. Build. Mater., vol. 75, pp. 331–341, 2015. [CrossRef]
- W. Abdallah, Z. M. Sbartaï, J. Saliba, S. M. Elachachi, F. Hage Chehade, and M. Sadek, “Assessment of the reliability of concrete evaluation by multi-physical inversion of NDT measurements – A probabilistic approach,” Constr. Build. Mater., vol. 300, no. July, p. 124371, 2021. [CrossRef]
- A. Sorimachi, Y. Nagamatsu, Y. Omori, and T. Ishikawa, “Comparison experiments for radon and thoron measuring instruments at low-level concentrations in one room of a Japanese concrete building,” Appl. Radiat. Isot., vol. 173, no. March, p. 109696, 2021. [CrossRef]
- T. Soshiroda, K. Voraputhaporn, and Y. Nozaki, “Early-stage inspection of concrete quality in structures by combined nondestructive method,” Mater. Struct. Constr., vol. 39, no. 2, pp. 149–160, 2006. [CrossRef]
- R. Sri Ravindrajah, Y. H. Loo, and C. T. Tam, “Strength evaluation of recycled-aggregate concrete by in-situ tests,” Mater. Struct., vol. 21, no. 4, pp. 289–295, 1988. [CrossRef]
- M. Bonagura and L. Nobile, “Artificial neural network (ANN) approach for predicting concrete compressive strength by SonReb,” SDHM Struct. Durab. Heal. Monit., vol. 15, no. 2, pp. 125–137, 2021. [CrossRef]
- P. Turgut and O. F. Kucuk, “Comparative relationships of direct, indirect, and semi-direct ultrasonic pulse velocity measurements in concrete,” Russ. J. Nondestruct. Test., vol. 42, no. 11, pp. 745–751, 2006. [CrossRef]
- W. Wang, C. Lu, G. Yuan, and Y. Zhang, “Effects of pore water saturation on the mechanical properties of fly ash concrete,” Constr. Build. Mater., vol. 130, pp. 54–63, 2017. [CrossRef]
- R. N. Yastrebinskii, G. G. Bondarenko, and V. I. Pavlenko, “Attenuation of photon and neutron radiation using iron–magnetite–serpentinite radiation-protective composite,” Inorg. Mater. Appl. Res., vol. 8, no. 2, pp. 275–278, 2017. [CrossRef]
- Z. X. Zhang, “China in the transition to a low-carbon economy,” Energy Policy, vol. 38, no. 11, pp. 6638–6653, 2010. [CrossRef]
- Z. M. Sbartaï, S. Laurens, S. M. Elachachi, and C. Payan, “Concrete properties evaluation by statistical fusion of NDT techniques,” Constr. Build. Mater., vol. 37, pp. 943–950, 2012. [CrossRef]
- P. Sikora, M. Abd Elrahman, E. Horszczaruk, P. Brzozowski, and D. Stephan, “Incorporation of magnetite powder as a cement additive for improving thermal resistance and gamma-ray shielding properties of cement-based composites,” Constr. Build. Mater., vol. 204, pp. 113–121, 2019. [CrossRef]
- M. M. Mahdy, S. Y. Mahfouz, A. F. Tawfic, and M. A. E. M. Ali, “Performance of Rice Straw Fibers on Hardened Concrete Properties under Effect of Impact Load and Gamma Radiation,” Fibers, vol. 11, no. 5, 2023. [CrossRef]
- Y. Zheng, W. Kong, M. Ji, C. Wan, and E. Moshtagh, “Experimental investigation of concrete strength curve based on pull-out post-insert method,” Int. J. Distrib. Sens. Networks, vol. 16, no. 7, 2020. [CrossRef]
- D. Paul Thanaraj et al., “Influence of Heating–Cooling Regime on the Engineering Properties of Structural Concrete Subjected to Elevated Temperature,” Buildings, vol. 13, no. 2, 2023. [CrossRef]
- S. Ramlal*, P. R. Prasad, and D. P. Raju, “Experimental Inspection on Shear Capacity in RCC Beams with Partial Replacement of Recycled Coarse Aggregates,” Int. J. Recent Technol. Eng., vol. 9, no. 2, pp. 321–326, 2020. [CrossRef]
- R. Chakraborty, T. Paul, and A. B. S. Ornob, “A Review on Tensile Behavior of Different Kinds of Fiber Reinforced Concrete,” Int. Exch. Innov. Conf. Eng. Sci., no. February 2021, pp. 231–237, 2020. [CrossRef]
- S. Hannachi and M. N. Guetteche, “Application of the Combined Method for Evaluating the Compressive Strength of Concrete on Site,” Open J. Civ. Eng., vol. 02, no. 01, pp. 16–21, 2012. [CrossRef]
- D. A. Emiri, P. C. Chiadighikaobi, and P. Ng’andu, “Compressive Strength Dependency on the Effect of Temperature Variation on the Percentages of Steel Fiber in Concrete,” Open Constr. Build. Technol. J., vol. 17, no. 1, pp. 1–11, 2023. [CrossRef]
- R. Pucinotti, “In Situ Strength vs. Potential Strength of Concrete: Proposal of a New Procedure for the Assessment of Excess Voidage,” Appl. Sci., vol. 13, no. 11, 2023. [CrossRef]
- G. Karaiskos, A. Deraemaeker, D. G. Aggelis, and D. Van Hemelrijck, “Monitoring of concrete structures using the ultrasonic pulse velocity method,” Smart Mater. Struct., vol. 24, no. 11, pp. 1–31, 2015. [CrossRef]
- S. Hong, S. Yoon, J. Kim, C. Lee, S. Kim, and Y. Lee, “Evaluation of condition of concrete structures using ultrasonic pulse velocity method,” Appl. Sci., vol. 10, no. 2, 2020. [CrossRef]
- C 39/C 39M – 05, “Standard Test Method for Compressive Strength of Cylindrical Concrete Specimens 1,” ASTM Stand. B., vol. i, no. March, pp. 1–5, 2003. https://store.astm.org/c0039_c0039m-05.html.
- ASTM, “Pulse Velocity Through Concrete 1,” ASTM Int. USA, pp. 3–6, 1989. https://img.antpedia.com/standard/files/pdfs_ora/20230612/astm/2023/C%20597%20-%2022.pdf.
- 1998). ASTM C805-97 (ASTM, “ASTM C 805 – 97,Standard Test Method for Rebound Number of Hardened Concrete. Annual Book of ASTM Standards, 14, 1–3.,” Annu. B. ASTM Stand., vol. 14, pp. 1–3, 1998. https://pdfcoffee.com/astm-c805-97pdf-pdf-free.html.
- W. Kim, K. Jeong, T. Lee, and S. Park, “A Study on Correlation between Ultrasonic Pulse Velocity Method and Coarse Aggregate for Estimating Residual Modulus of Elasticity of Concrete Exposed to High Temperatures,” Appl. Sci., vol. 12, no. 13, 2022. [CrossRef]
- E. Estévez, D. A. Martín, C. Argiz, and M. Á. Sanjuán, “Ultrasonic pulse velocity—compressive strength relationship for portland cement mortars cured at different conditions,” Crystals, vol. 10, no. 2, 2020. [CrossRef]
- B. S. Al-Nu’man, B. R. Aziz, S. A. Abdulla, and S. E. Khaleel, “Effect of Aggregate Content on the Concrete Compressive Strength - Ultrasonic Pulse Velocity Relationship,” Am. J. Civ. Eng. Archit., vol. 4, no. 1, pp. 1–5, 2017. [CrossRef]
- X. Wan, Z. Jia, N. Li, and H. Luo, “Impact of Recycled Fine Aggregate on Physical and Mechanical Properties of Green Mortar,” Materials (Basel)., vol. 18, no. 3, 2025. [CrossRef]
- R. Roobankumar and M. SenthilPandian, “Investigating the correlation between ultrasonic pulse velocity and compressive strength in polyurethane foam concrete,” Sci. Rep., vol. 15, no. 1, pp. 1–16, 2025. [CrossRef]
- J. C. Agunwamba and T. Adagba, “A Comparative Analysis of the Rebound Hammer and Ultrasonic Pulse Velocity in Testing Concrete,” Niger. J. Technol., vol. 31, no. 1, pp. 31–39, 2012. https://www.researchgate.net/publication/352297089_A_COMPARATIVE_ANALYSIS_OF_THE_REBOUND_HAMMER_AND_ULTRASONIC_PULSE_VELOCITY_IN_TESTING_CONCRETE.
- F. Gao, Y. Ji, L. Zhang, Z. Zhang, and Q. Xue, “High temperature resistance of a phase change cementitious material at elevated temperatures,” Constr. Build. Mater., vol. 292, p. 123456, 2021. [CrossRef]
- P. Lehner and K. Hrabová, “Relationship of Time-Dependent Parameters from Destructive and Non-Destructive Tests of Structural Concrete,” Mathematics, vol. 10, no. 3, pp. 1–13, 2022. [CrossRef]
- O. Ofuyatan, A. Olowofoyeku, J. Oluwafemi, and J. Ighalo, “Predicting the Compressive Strength of Concrete By Ultrasonic Pulse Velocity,” IOP Conf. Ser. Mater. Sci. Eng., vol. 1036, no. 1, p. 012053, 2021. [CrossRef]
- S. Hannachi and M. N. Guetteche, “Application of the Combined Method for Evaluating the Compressive Strength of Concrete on Site,” Open J. Civ. Eng., vol. 02, no. 01, pp. 16–21, 2012. [CrossRef]
Figure 1.
– Normal weight and Lightweight aggregates.
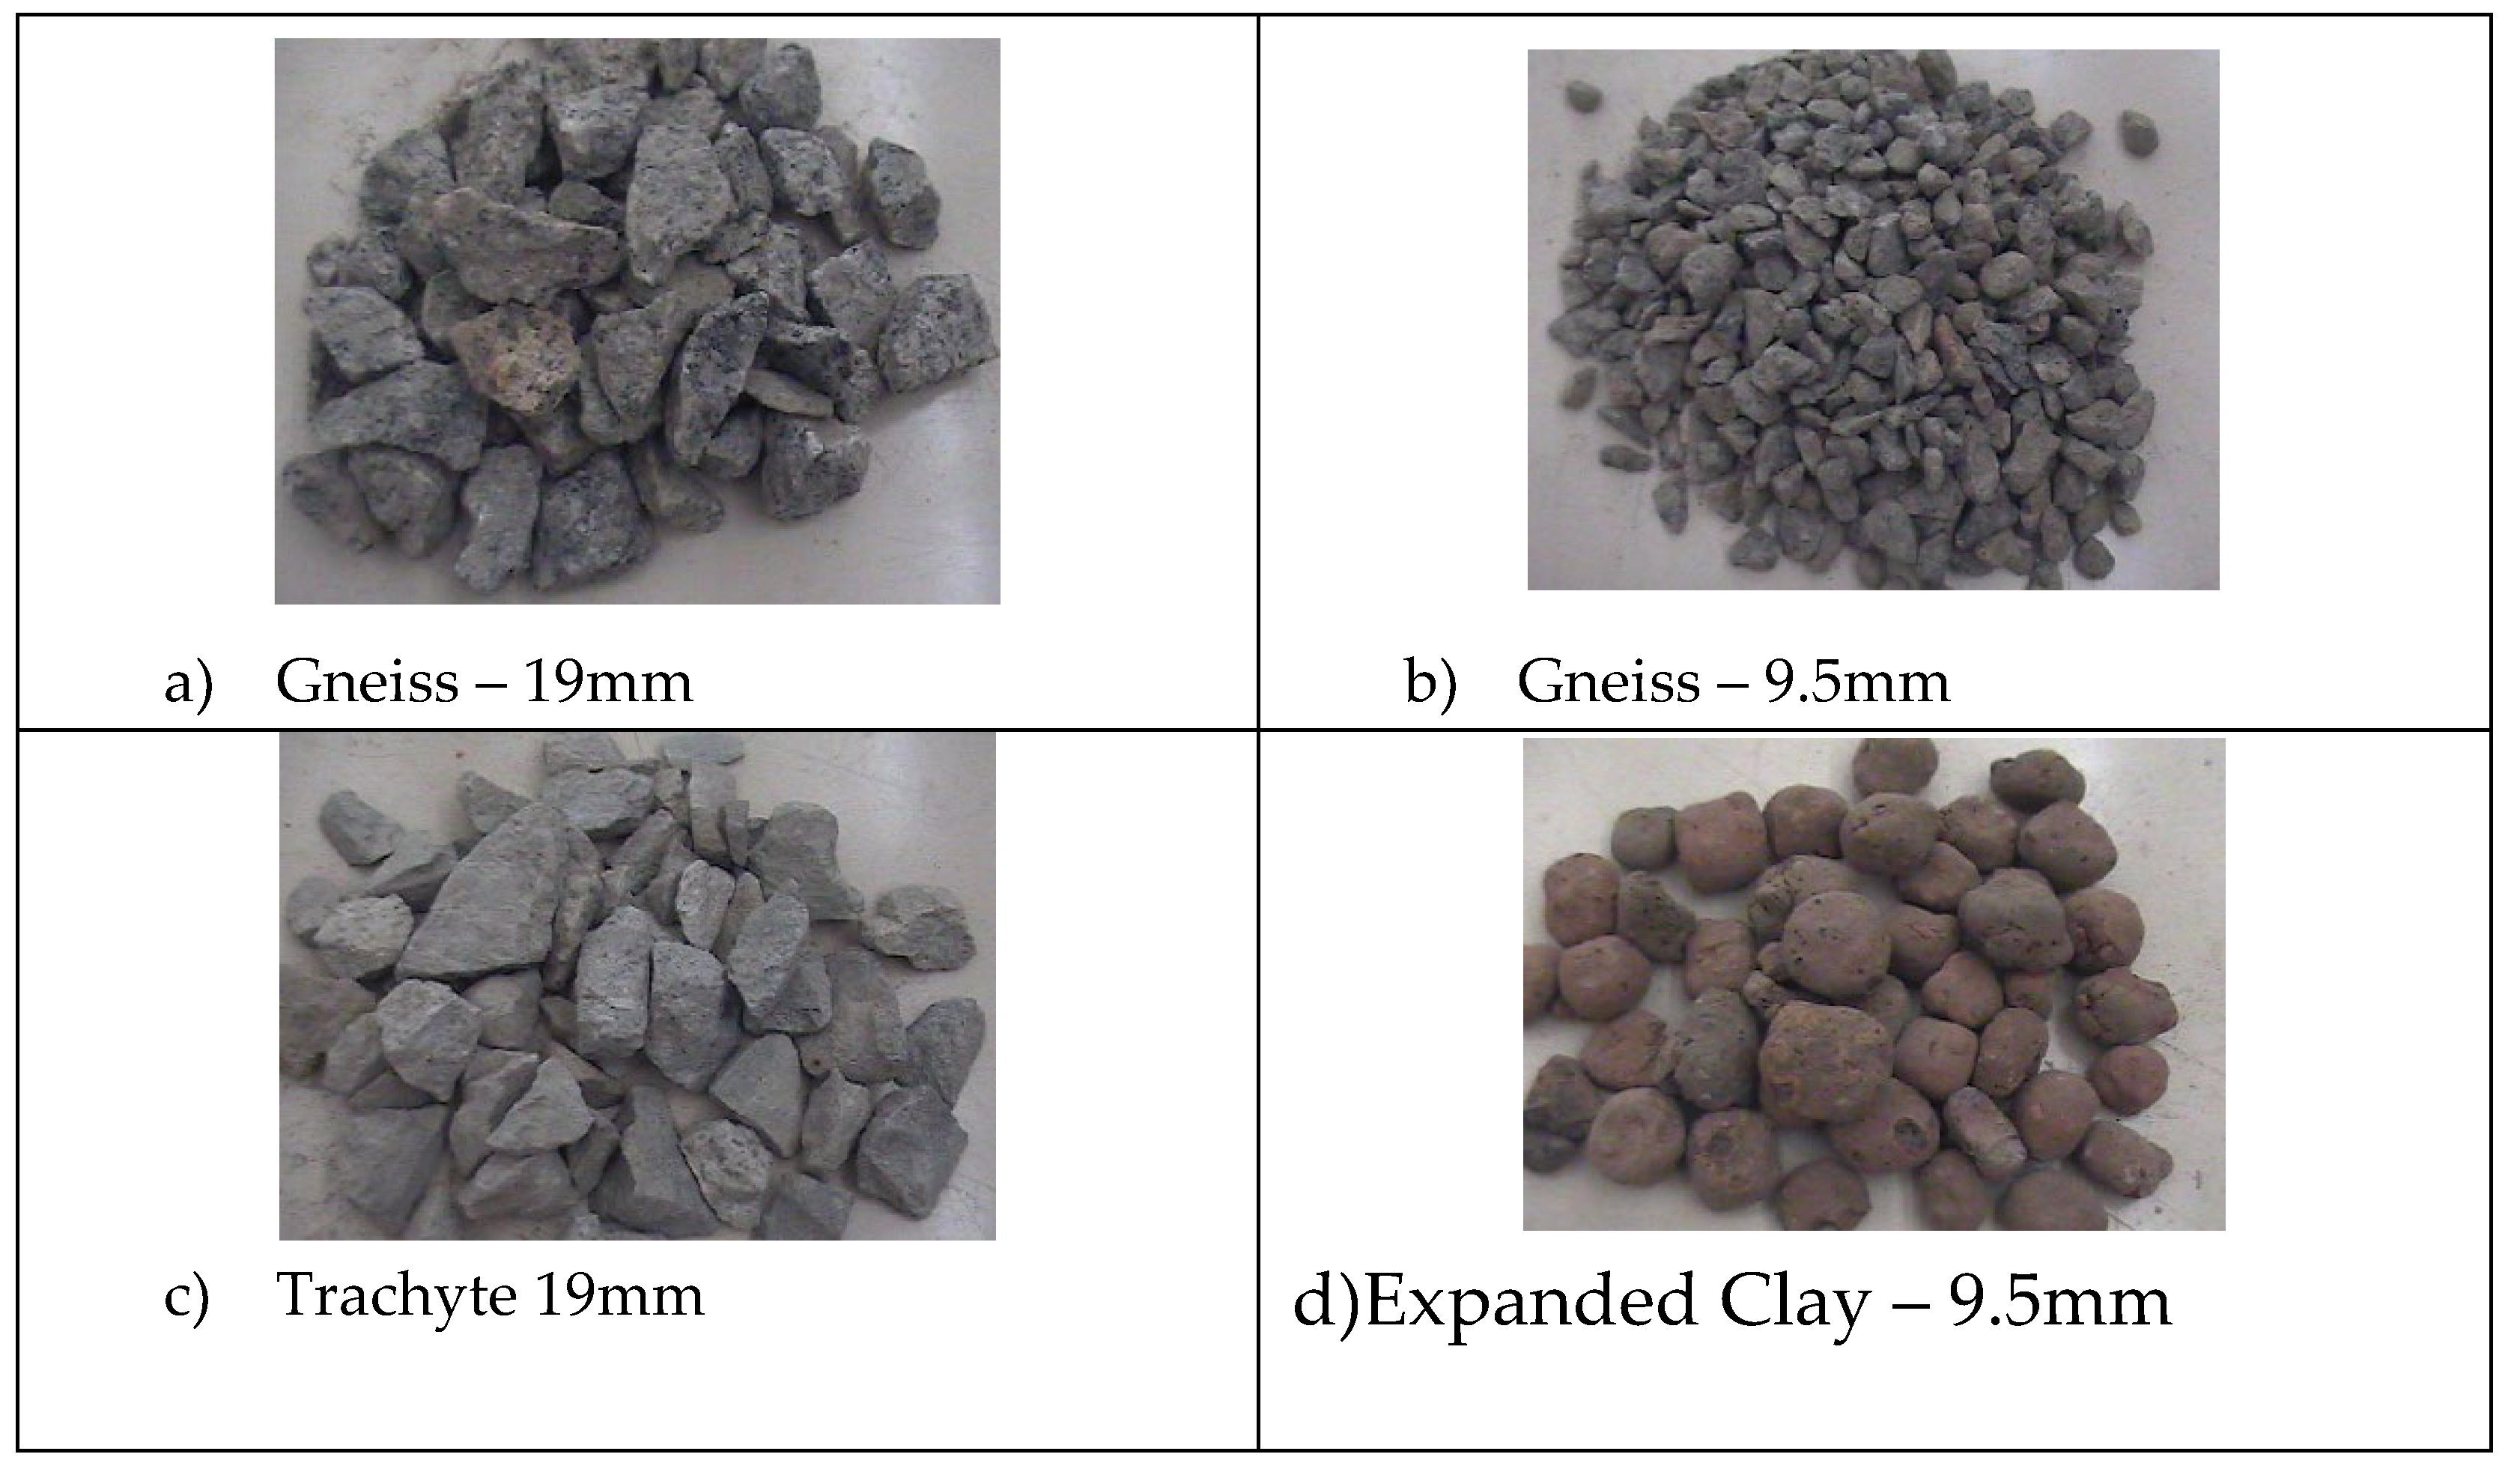
Figure 2.
Particle size distribution – coarse and fine aggregates.
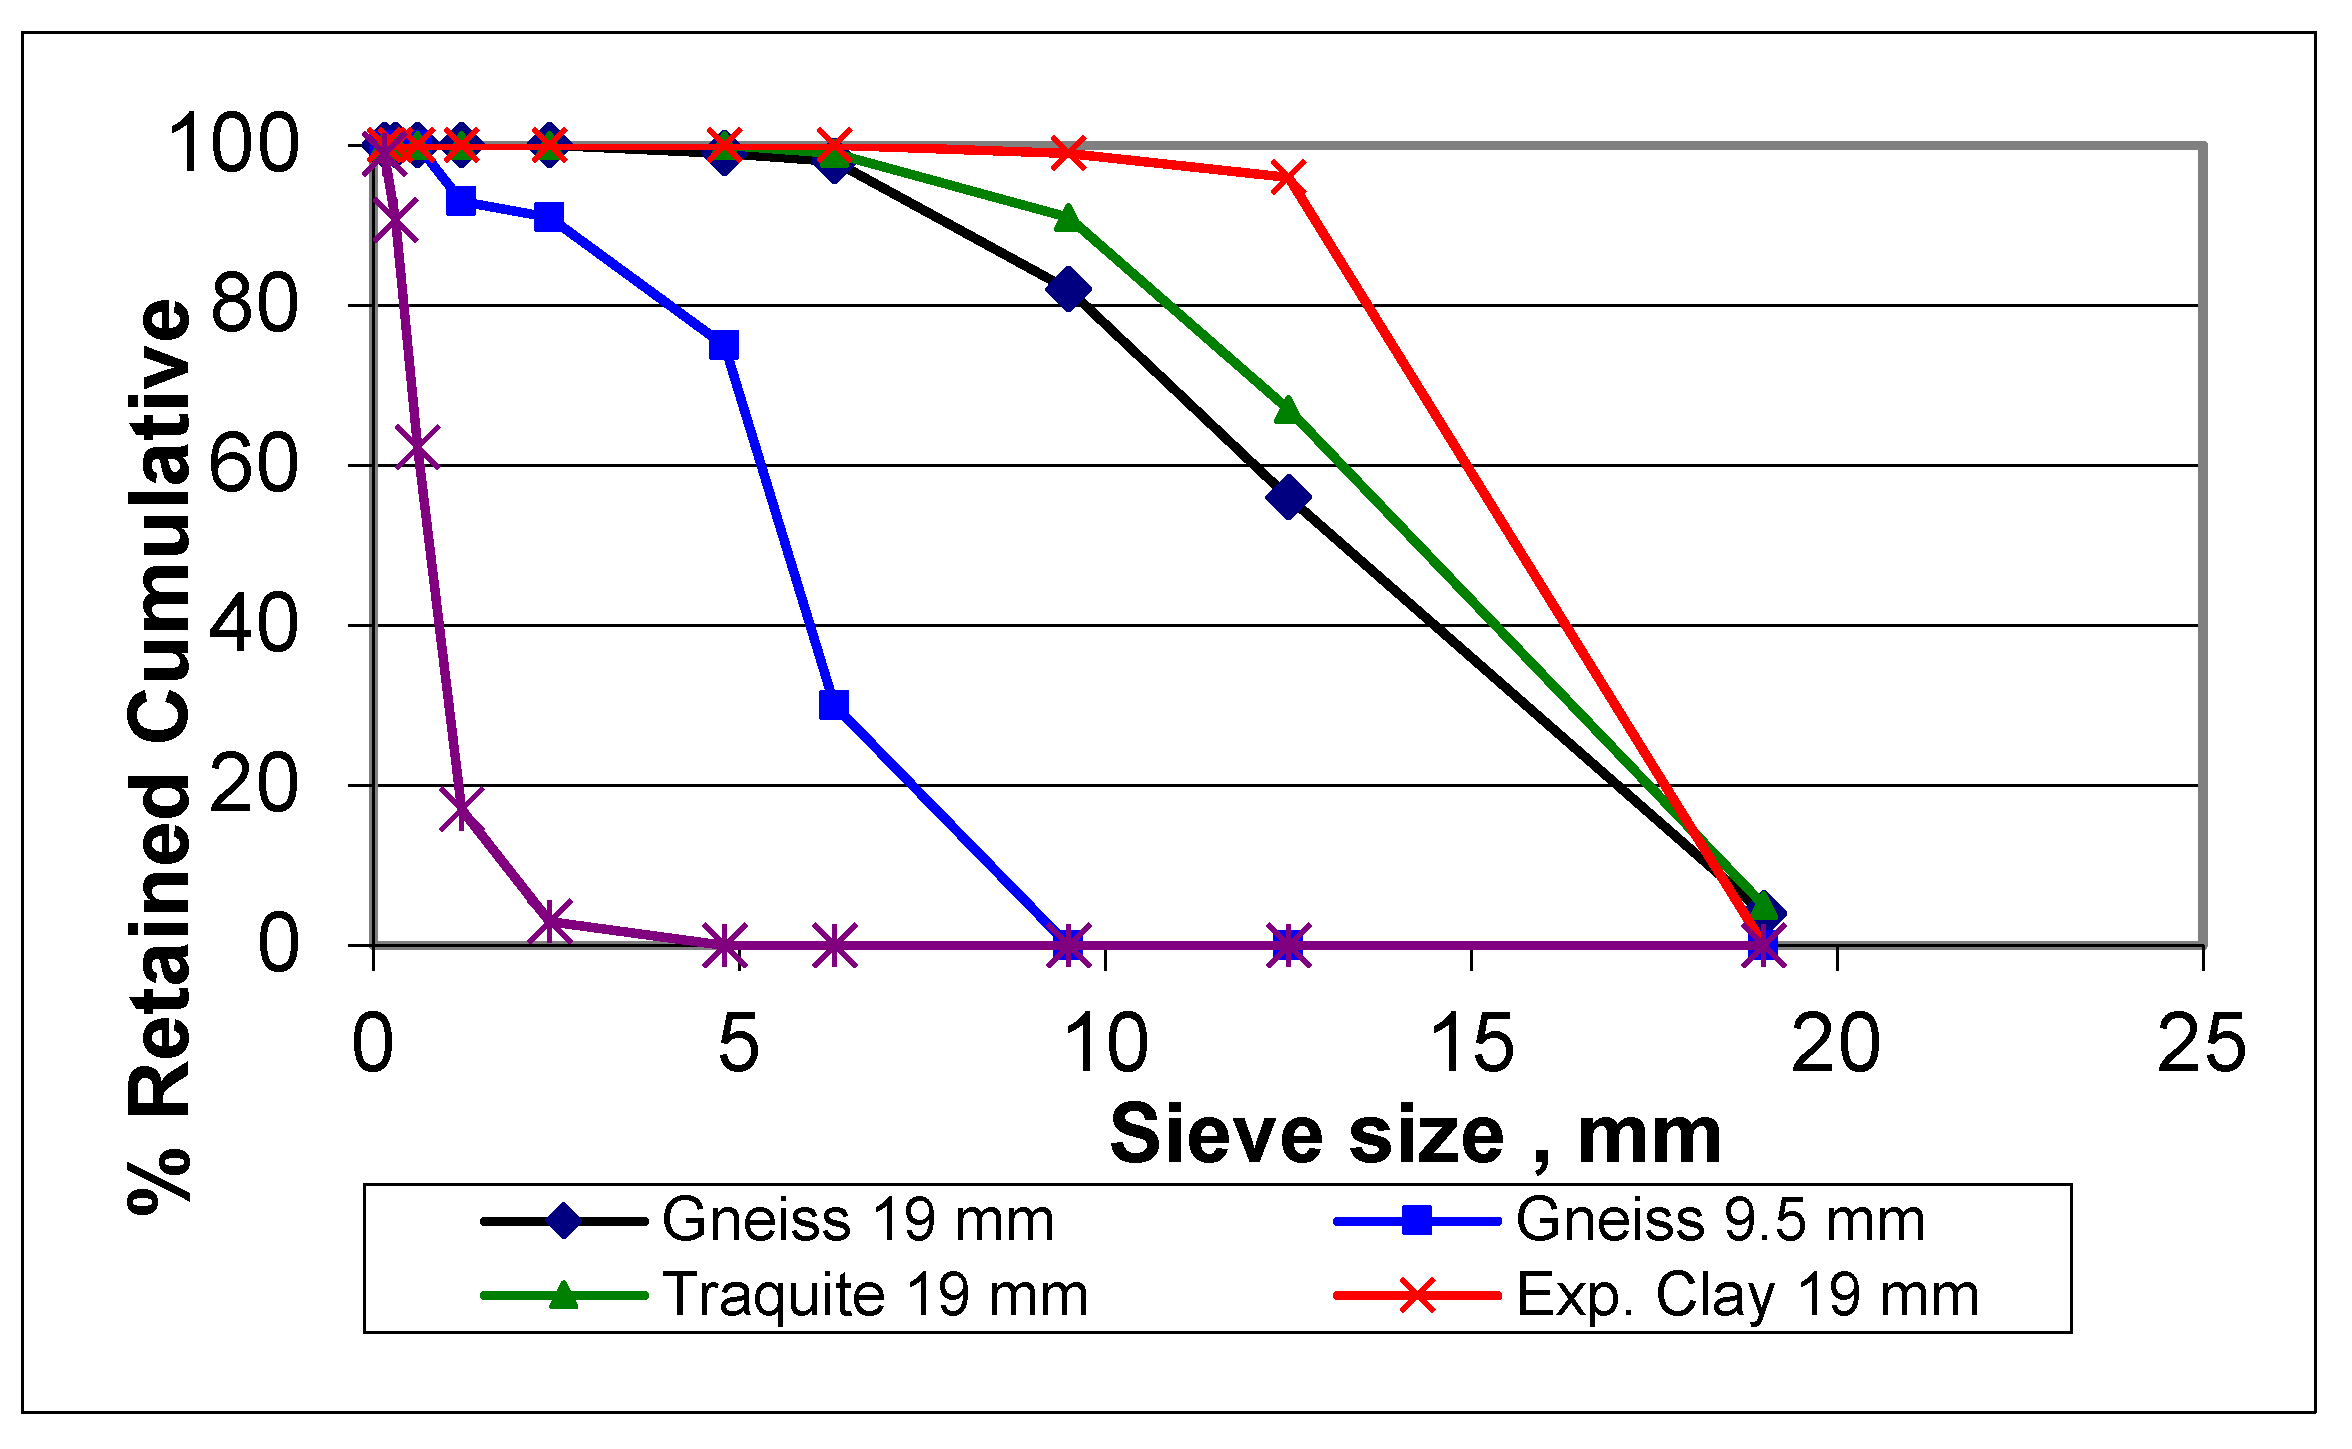
Figure 3.
– Combined effect of fc vs RH and V.
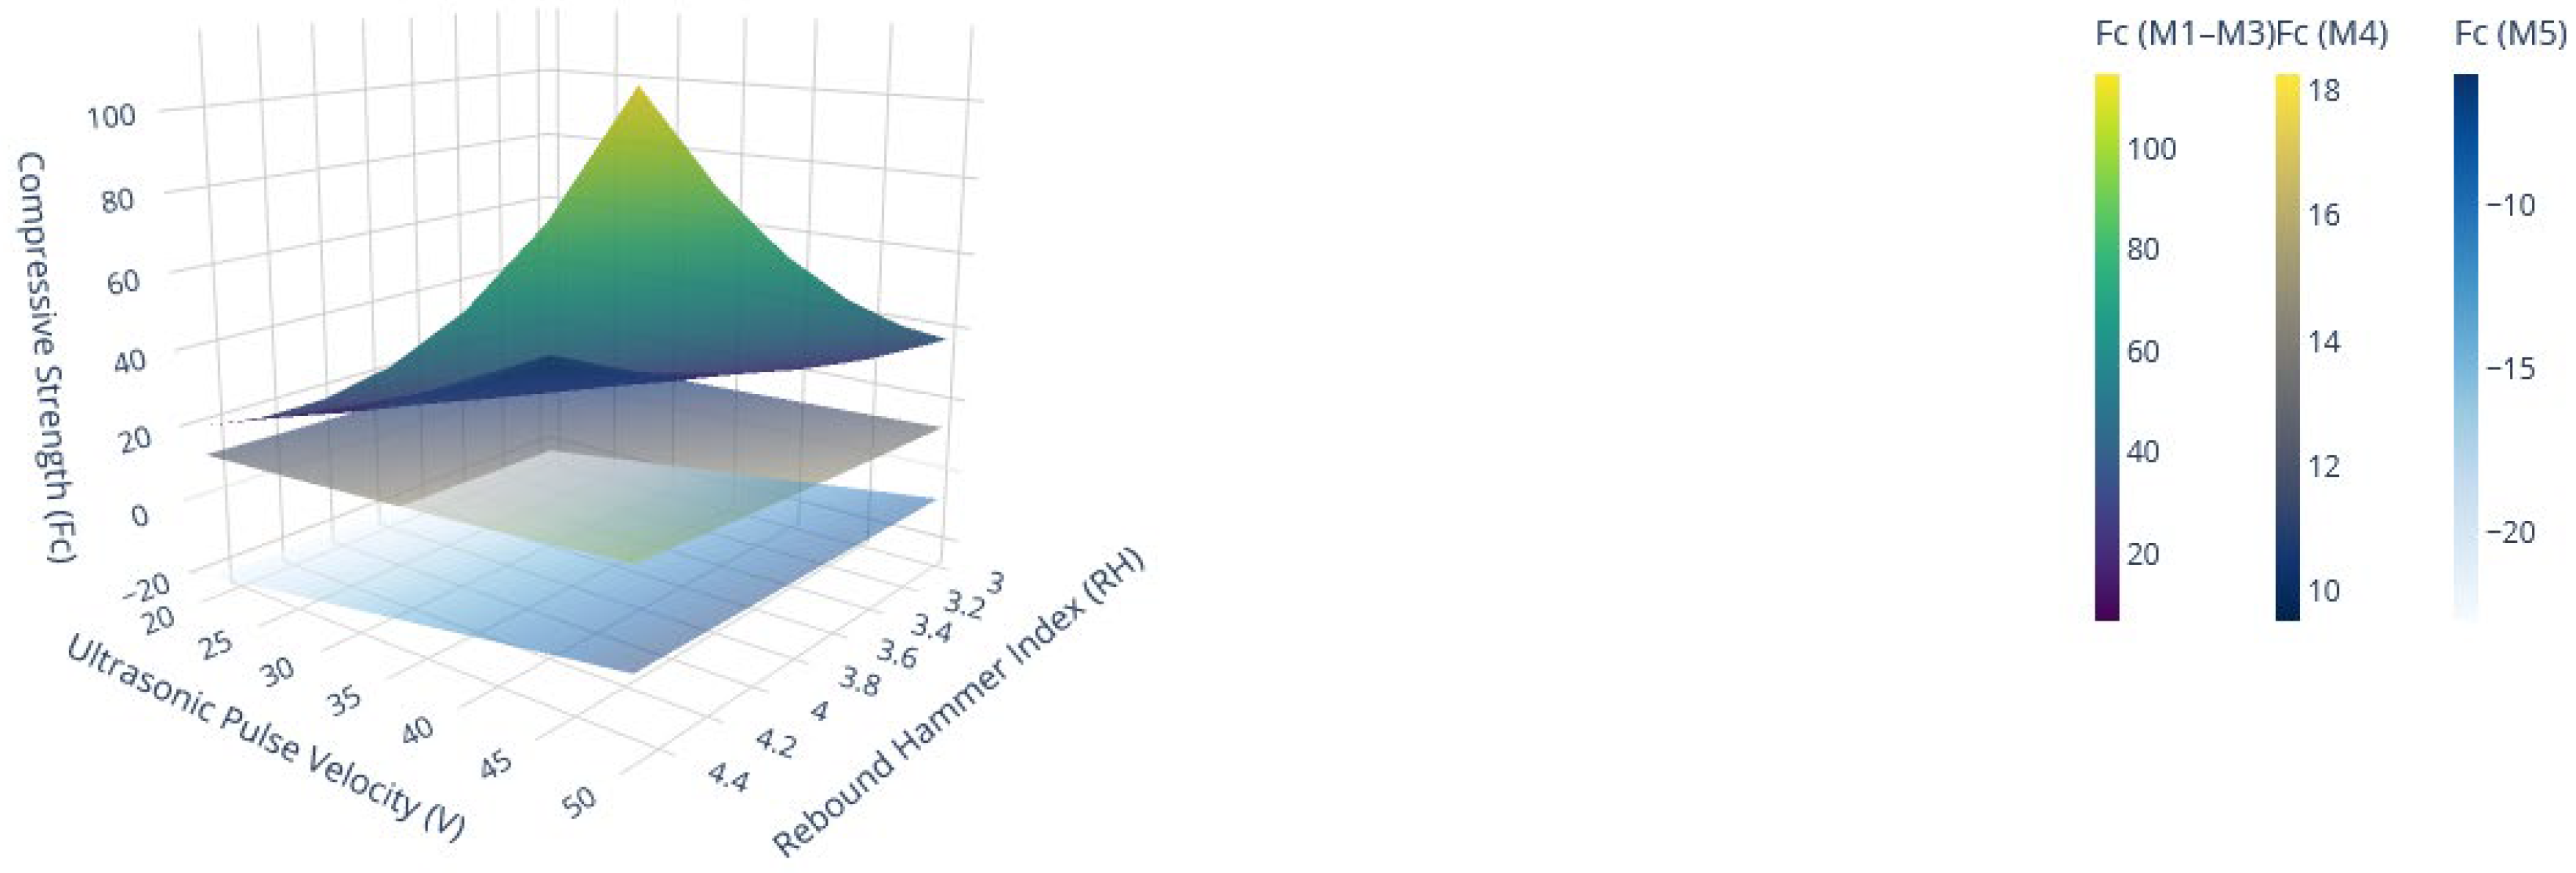
Figure 4.
- R² Values Comparison: This Study vs Recent Research.
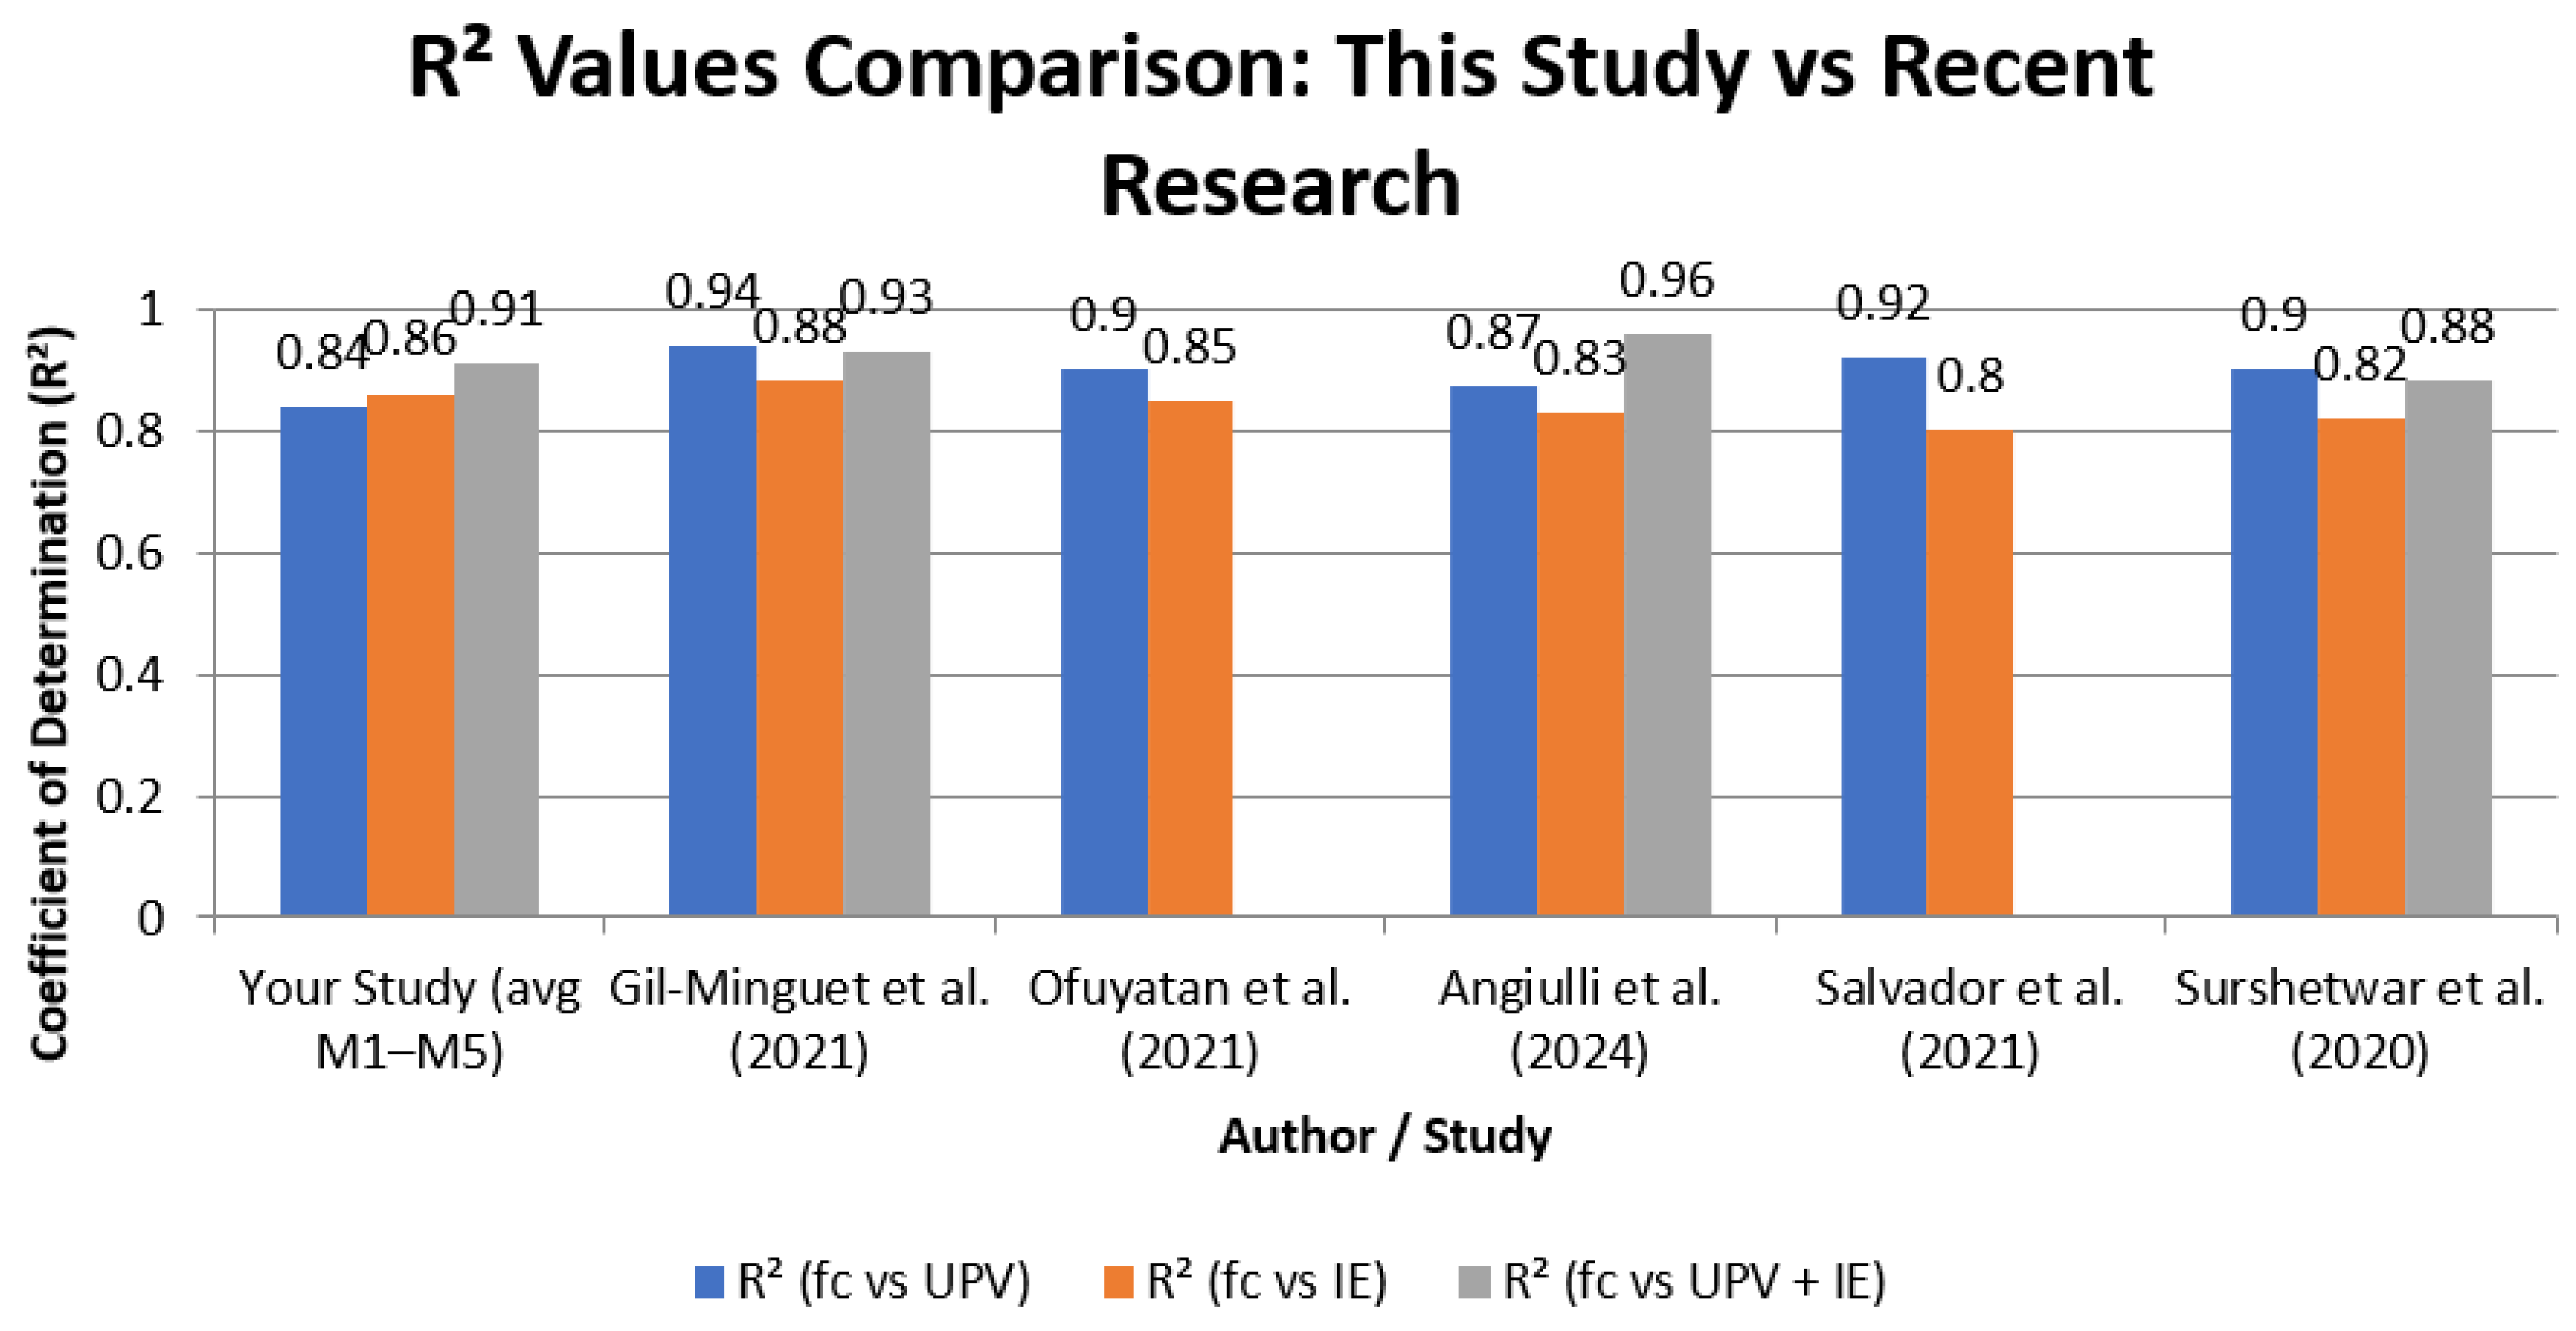

Table 1.
Cement properties.
| Properties | ASTM Type IV Low heat cement | ASTM Type III High early strength cement |
| #325 (%) | 12.6 | 2.9 |
| Blaine (cm2/g) | 3785 | 4444 |
| Setting Time -initial(min.) | 243 | 145 |
| Setting Time - final (min.) | 332 | 217 |
| fc 1 day (MPa) | - | 27.8 |
| fc 3 days (MPa) | 18.9 | 43.4 |
| fc 7 days (MPa) | 29.6 | 48.4 |
| fc 28 days (MPa) | 40.3 | 57.2 |
Table 2.
Concrete composition (per m3).
| Materials | Mixtures | ||||
| M1 | M2 | M3 | M4 | M5 | |
| Coarse aggregate (kg) | Gneisse Dmax=19mm | Gneiss Dmax =9,5mm |
Trachyte Dmax =19mm |
Gneiss Dmax =19mm |
Expanded Clay Dmax =19mm |
| 1075 | 1070 | 1050 | 1075 | 505 | |
| Afien aggregate (kg) | 830 to 680 | 830 to 680 | 830 to 680 | 830 to 680 | 830 to 680 |
| Cement(kg) | 277 to 450 | 277 to 450 | 277 a to 450 | 277 to 450 | 277 to 450 |
| Plasticiser (L) | 1.2 to 3.0 | 1.2 to 3.0 | 1.2 to 3.0 | 1.2 to 3.0 | 1.2 to 3.0 |
| Tap Water (L) | 180 | 180 | 180 | 180 | 180 |
| Water/cement | 0.65 to 0.40 | 0.65 to 0.40 | 0.65 to 0.40 | 0.65 to 0.40 | 0.65 to 0.40 |
| Cement type | ASTM Type IV Low heat cement | ASTM Type IV Low heat cement | ASTM Type IV Low heat cement | ASTM - Type III High early strength | ASTM Type IV Low heat cement |
Table 3.
- Range of the values – fc, UPV and RH.
| Mixtures -series | fc (MPa) | UPV (km/s) |
RH |
| M1 | 10.8 to 53.0 | 3.92 to 4.57 | 16.0 to 35.0 |
| M2 | 10.1 to 46.0 | 3.67 to 4.47 | 19.8 to 34.7 |
| M3 | 8.0 to 48,7 | 3.76 to 4.57 | 19.0 to 36.0 |
| M4 | 23.3 to 58.3 | 3.97 to 4.65 | 27.2 to 42.0 |
| M5 | 7.1 to 24.0 | 3.33 to 4.03 | 14.2 to 28.1 |
Table 4.
Equations to correlate fc and UPV.
| Mixtures - series | Equation* | r2 |
| M1 | 0.69 | |
| M2 | 0.96 | |
| M3 | 0.92 | |
| M4 | 0.78 | |
| M5 | 0.84 |
*fc - MPa and UPV- km/s.
Table 5.
- Equations to correlate fc and RH.
| Mixtures - series | Equations | r2 |
| M1 | 0.82 | |
| M2 | 0.90 | |
| M3 | 0.78 | |
| M4 | 0.88 | |
| M5 | 0.90 |
Table 6.
- Equations to correlate fc and RH and UPV.
| Mixtures - series | Equations | r2 |
| M1, M2 e M3 | 0.890 | |
| M4 | 0.918 | |
| M5 | 0.922 |
fc em MPa, V em km/s.
Table 7.
– Combined methods - Fc vs RH and V - M1_M3.
| V \ RH | 20 | 25 | 30 | 35 | 40 | 45 | 50 |
|---|---|---|---|---|---|---|---|
| 3 | 6.449483 | 8.636522 | 11.56519 | 15.48699 | 20.73867 | 27.77121 | 37.18852 |
| 3.3 | 8.076834 | 10.81571 | 14.48335 | 19.3947 | 25.97151 | 34.77852 | 46.57202 |
| 3.6 | 10.1148 | 13.54476 | 18.13783 | 24.28843 | 32.52471 | 43.55393 | 58.3232 |
| 3.9 | 12.667 | 16.96241 | 22.71442 | 30.41695 | 40.73143 | 54.54358 | 73.03947 |
| 4.2 | 15.86317 | 21.24242 | 28.44579 | 38.09184 | 51.00889 | 68.30616 | 91.46899 |
| 4.5 | 19.86581 | 26.60236 | 35.6233 | 47.70327 | 63.8796 | 85.54136 | 114.5487 |
Table 8.
Combined methods - Fc vs RH and V - M4.
| V \ RH | 20 | 25 | 30 | 35 | 40 | 45 | 50 |
|---|---|---|---|---|---|---|---|
| 3 | 9.505703 | 9.930487 | 10.39501 | 10.90513 | 11.46789 | 12.0919 | 12.78772 |
| 3.3 | 9.948269 | 10.4145 | 10.92657 | 11.49161 | 12.11827 | 12.81723 | 13.60174 |
| 3.6 | 10.43406 | 10.94811 | 11.51543 | 12.14477 | 12.84687 | 13.63512 | 14.52644 |
| 3.9 | 10.96972 | 11.53935 | 12.17137 | 12.87664 | 13.66867 | 14.56452 | 15.58603 |
| 4.2 | 11.56337 | 12.1981 | 12.90656 | 13.70238 | 14.6028 | 15.62988 | 16.81237 |
| 4.5 | 12.22494 | 12.93661 | 13.73626 | 14.64129 | 15.67398 | 16.86341 | 18.24818 |
Table 9.
Combined methods - fc vs RH and V - M5.
| V \ RH | 20 | 25 | 30 | 35 | 40 | 45 | 50 |
|---|---|---|---|---|---|---|---|
| 3 | -22.729 | -20.194 | -17.659 | -15.124 | -12.589 | -10.054 | -7.519 |
| 3.3 | -22.4209 | -19.8859 | -17.3509 | -14.8159 | -12.2809 | -9.7459 | -7.2109 |
| 3.6 | -22.1128 | -19.5778 | -17.0428 | -14.5078 | -11.9728 | -9.4378 | -6.9028 |
| 3.9 | -21.8047 | -19.2697 | -16.7347 | -14.1997 | -11.6647 | -9.1297 | -6.5947 |
| 4.2 | -21.4966 | -18.9616 | -16.4266 | -13.8916 | -11.3566 | -8.8216 | -6.2866 |
| 4.5 | -21.1885 | -18.6535 | -16.1185 | -13.5835 | -11.0485 | -8.5135 | -5.9785 |
Table 10.
Comparison b/n this Study (M1–M5 average) and the Recent Studies Range.
| Comparison Type | Your Study (M1–M5 average) | Recent Studies Range (2015–2025) | Your Position in Range |
|---|---|---|---|
| fc vs UPV | 0.84 | 0.70 – 0.78 | ✅ Among the highest |
| fc vs RH | 0.86 | 0.83 – 0.89 | ✅ Competitive / Top end |
| fc vs UPV + RH | 0.91 | 0.90 – 0.96 | ✅ Strong but not max |
Table 11.
Recent studies vs current study Summary.
| Author | R² (fc vs UPV) | R² (fc vs RH) | R² (fc vs UPV + RH) |
|---|---|---|---|
| This Study (avg M1–M5) | 0.84 | 0.86 | 0.91 |
| Gil-Minguet et al. (2021) [53] | 0.94 | 0.88 | 0.93 |
| Ofuyatan et al. (2021) [54] | 0.90 | 0.85 | N/A |
| Angiulli et al. (2024) [55] | 0.87 | 0.83 | 0.96 |
| Salvador et al. (2021) [56] | 0.92 | 0.80 | N/A |
| Surshetwar et al. (2020) [57] | 0.90 | 0.82 | 0.88 |
Disclaimer/Publisher’s Note: The statements, opinions and data contained in all publications are solely those of the individual author(s) and contributor(s) and not of MDPI and/or the editor(s). MDPI and/or the editor(s) disclaim responsibility for any injury to people or property resulting from any ideas, methods, instructions or products referred to in the content. |
© 2025 by the authors. Licensee MDPI, Basel, Switzerland. This article is an open access article distributed under the terms and conditions of the Creative Commons Attribution (CC BY) license (http://creativecommons.org/licenses/by/4.0/).
Copyright: This open access article is published under a Creative Commons CC BY 4.0 license, which permit the free download, distribution, and reuse, provided that the author and preprint are cited in any reuse.


