Submitted:
17 August 2025
Posted:
18 August 2025
You are already at the latest version
Abstract
Urban environments are being increasingly equipped with charging stations due 1 to the rapid proliferation of electric vehicles (EVs). The significant changes in the dynam- 2 ics of city-wide power grids resulting from the surge in EV adoption present challenges, 3 such as increased peak demand, while also providing opportunities for intelligent load 4 management and grid flexibility. A major obstacle to data-driven research and develop- 5 ment is the lack of realistic EV charging datasets, which is still restricted by data sparsity, 6 proprietary limitations, and privacy issues. This charging infrastructure is transforming 7 power grid dynamics, introducing new demands for high-resolution synthetic data to 8 support modelling, simulation, and decision-making in smart grid environments. This 9 study addresses the critical gap by developing synthetic data and evaluating multiple 10 synthetic data generation (SDG) techniques tailored explicitly for EV charging datasets. 11 We explore a range of approaches, including rule-based generation strategies informed by 12 domain expertise, as well as several machine learning–based models, such as Conditional 13 Tabular GAN (CTGAN), Conditional GAN (CGAN), Kernel Density Estimation (KDE), 14 and Variational Autoencoder (VAE). Using a real-world EV charging dataset, we evaluate 15 each method’s effectiveness using measures including KL divergence, Maximum Mean 16 Discrepancy (MMD), and Mean Absolute Percentage Error (MAPE) in order to determine 17 statistical resemblance and distributional faithfulness. The findings demonstrate that both 18 heuristic and ML-based generative models can produce realistic synthetic data with varying 19 degrees of fidelity and interoperability. In order to overcome data constraints and facili- 20 tate the creation of robust, data-driven smart grid systems, this work offers a methodical 21 methodology for creating synthetic EV charging data.
Keywords:
synthetic data
; EV charging data
; generative models
; smart grid
1. Introduction
Electric Vehicles (EVs) have emerged as a result of significant modifications to city-wide electric infrastructures in recent years. In 2018, over one million plug-in electric vehicles (EVs) were registered in Europe, and numerous charging stations were established to support this expansion. This increase offers the potential to capture EV session data and leverage it to balance demand, exploit flexibility, and develop responsive grids. Companies can utilize the data collected from charging stations to make pricing decisions, provide incentives, and comprehend consumer behavior [1]. The increasing adoption of EV charging presents both opportunities and challenges: increased loads and the ability to transfer loads, which allows for greater flexibility in smart grid (SG). Realistic EV data, which are currently limited, are necessary for the analysis of such scenarios [1]. In contrast to transmission system data, distribution-level datasets are limited due to difficulties in data gathering, privacy constraints, and security considerations. The absence of accessible distribution-level data considerably restricts the larger research community’s capacity to innovate and enhance distribution-level prediction accuracy and operational efficiency. The generation of synthetic data provides a feasible solution to address these constraints. The approach of synthetic data generation has demonstrated considerable success in computer vision, natural language processing, and healthcare. However, its utilization in smart grid research, especially for EV charging, is still insufficiently investigated [2]. As high-resolution time series data is a salient enabler for accelerating EV charging analytics and smart grid intelligence innovation, particularly at the distribution level, generating synthetic data for electric vehicles can be widely deployed for developing and evaluating data-driven learning algorithms to enhance grid operations and advance smart grid research. Charging behavior is essential and crucial for developing and assessing data-driven learning algorithms designed to improve grid operations. Researchers can address privacy and access issues by supplying realistic synthetic electric vehicle charging data, enabling the advancement and verification of advanced machine learning models [3]. This expedites innovation in smart grid technology and fosters the development of more resilient and efficient energy networks that can accommodate the increasing use of electric vehicles.
Conventional approaches to creating synthetic data via system dynamics modelling are frequently intricate, labour-intensive, and susceptible to errors, rendering them unfeasible for several real-world applications.
The generation and use of synthetic data are crucial for advancing research and development in EV charging and broader smart grid applications to address the following key challenges associated with real-world aspects:
- Data Availability: Utilities and operators rarely disclose EV charging data to protect private, legal, and competitive interests. Although the dataset is made available, some features, such as regions, stations, or periods, remain limited, which makes generalization difficult.
- Data Scale: The limited size and scope of real datasets may result in poor performance of machine learning algorithms. A large amount of data is needed to train many machine learning-based models. The size and minor issues with datasets can be addressed by generating synthetic datasets [4].
- Data Privacy: Data from EV about distribution systems includes personally identifiable information (PII). The restrictions require the use of complex techniques to anonymize the data. This makes such datasets even more challenging to make widely available.
- Supports Grid Planning and Load Forecasting: The demand for EV charging is time-dependent and dynamic; if improperly controlled, it could cause grid instability. Synthetic data helps the grid to simulate • Peak demand scenarios • Load shifting (e.g., smart scheduling) • Infrastructure stress testing (e.g., transformer loads, feeder capacities). Thus, the grid operation can be optimized before issues arise, allowing utilities to forecast future adoption scenarios.
Given the extreme variability of smart grid data, it is highly improbable that the datasets could be synthesized using a single model. Therefore, a discussion of the creation of synthetic datasets cannot be considered comprehensive until the desired datasets are precisely defined. This work focuses on datasets generally referred to as "time series data conditioned on the smart grid." We concentrate more specifically on datasets that can be represented as time series. Additionally, the smart grid under consideration should define or impact the underlying processes that generate the dataset. This suggests that our attention is not focused on data produced by natural processes, such as temperature and solar irradiance. Additionally, event-based data, such as appliance on/off times or EV plug-in and plug-out periods, is not a primary focus.
The main contributions of this paper are as follows:
- Explored various generative models to generate synthetic data for EV data defined as the SDG.
- The real-world dataset was employed by different SDGs not only for training but also to learn the distribution pattern to ensure the realistic generation of synthetic EV data.
- An analysis of various metrics has been performed to determine the statistical properties of real-world data.
- Synthetic sample generation and comparison to real-world data. We evaluate the outcomes of various models that may be implemented in the SDG.
2. Background
2.1. Data-Driven Synthetic Data Generator (SDG)
In recent years, electric grids have seen a significant increase in the number of electric vehicle (EV) charging stations. Given the extreme variability of smart grid data, it is significantly unlikely that the EV datasets could be synthesized using a single model. Therefore, without a precise specification of the intended datasets, any discussion of synthetic dataset production is lacking. We focus on various generative models, both automatic and heuristic, referred to as SDG, that are specifically designed to handle datasets that can be represented as time series. Additionally, the smart grid under consideration should define or impact the underlying processes that generate the dataset for the EV charging station. The datasets we focus on in this work are generally known as "time series data conditioned on the smart grid"; that is, event-based data, such as appliance on/off times or EV plug-in/plug-out periods [5]. In this paper, we first introduce heuristic methodologies, along with other generative models, including CTGAN, CGAN, and VAE.
Data Pre-processing: Extensive data pre-processing of the entire EV charging session dataset is a crucial step for generating synthetic data through both pre-defined and heuristic methods. The steps and types of data pre-processing here varied from individual SDG. For CGAN, VAE, and KDE-based models, each electric vehicle session is characterized by arrival time, departure time, and consumed energy. We carried out our experiments using EV charging dataset of Palo Alto (California, USA) [6], comprising 259,415 rows and 15 columns, representing individual charging sessions along with their associated attributes. Here, we consider three main features to characterize each session: (i) Starting Time (), (ii) Charging Duration, and (iii) Energy charged (KwhTotal). The formula of Ending Time is = + . Here, E represents the charging load to which the EVs are being charged. All these input features needed to be processed to run in all of the mentioned SDGs.
The data pre-processing evolve with the steps below: • Handling missing data, outlier values • Datetime parsing (StartTime, EndTime) • Interval Transformation (useful for the heuristic SDGs, e.g., 10 mins) • Convert Charging Duration to Numeric Format • Feature Engineering • Label Encoding • Scaling/Normalization
- 1) Machine Learning Approach: The primary objective of synthetic data is to supply additional training data for machine learning applications or an alternative to preserve the privacy of the original dataset. These machine-learning methods’ results don’t differentiate between real-time and synthetic time series.
- a) Conditional GAN (CGAN): Conditional GANs are becoming more and more popular because of the limitations of GANs in regulating generated data. Its conditional vector allows you to specify that a specific data class should be generated [7]. This capability is crucial when we need synthetic data of a particular class to re-balance the distribution due to limited and highly skewed data.
The conditional generator receives a random input and a condition that has been sampled beforehand. The generated sample is contrasted with a randomly selected example from the dataset that satisfies the condition and is evaluated by the conditional discriminator. Dependency relationships can be maintained using this method.
The Conditional Generative Adversarial Network (CGAN) extends the traditional GAN that incorporates conditional information [8]. In this framework, both the generator and the discriminator receive additional input in the form of conditional variables, which help steer the generator’s learning process more effectively. These conditional inputs can represent various types of information, such as class labels in image classification, specific features, or data from other sources, that help capture the underlying distribution of real data. The loss function for a conditional GAN (CGAN) is defined as
Here, denotes real data conditioned on y, and represents noise conditioned on the same input.
CGAN transitions GANs from an unsupervised to a supervised learning paradigm by integrating labels, facilitating focused data generation according to defined criteria. The overall structure of CGAN is illustrated in Figure 1. Given our objective of generating time series data aligned with different intention labels, CGAN is the core model because it can produce controlled and label-specific outputs[9].
In Conditional GANs (CGANs), the generation of synthetic data is conditioned on specific features, such as time or location, ensuring that the generated samples follow realistic and controllable distributions. In our case, since the EV charging station data is a time series by nature, the StartTime, EndTime, and ChargingTime are conditioned for this model. Our data pre-processing phase consists of two components, level and pattern. To capture the temporal evolution (e.g., how KwhTotal changes over time), the StartTime and EndTime columns of the entire time series data for each session have been split into daily vectors, denoted as ()T, where T is the index of the day. Each session is denoted by c, and both of the starting and ending time vectors are followed by the hour and then minutes, where hours from 0 to 23 are represented by () to () and the minutes vector represented by m by breaking it into six segments (10-minute bins for an hour) like 00–09 → (), 10–19 → ()...50–59 → (). Then, by extracting both hours and minutes and splitting them into distinct labels, we obtained 144 classes (24 × 6) for both StartTime and EndTime of each session. The combined classes of both StartTime and EndTime, such as and , and the ChargingTime of each session have been used as conditional vectors, followed by label encoding and normalization in particular. Thus, label encoding helped CGAN transform the discrete-time of each session into learnable discrete conditions, capturing the time-lot charging behavior of EVs.
Figure 2 displays the density distribution of the mean absolute percentage error (MAPE) for 377271.10 kWhTotal from 10:00 AM to 12:00 PM on both synthetic and real data. We note that the MAPE is 0.1301%, which provides empirical support for the statistical equivalence of both synthetic and actual data. Additionally, we observe that higher noise results in a larger variance error in the MAPE predicted using real data.
- b) Conditional Tabular GAN (CTGAN): The conditional generator receives a random input and a condition that has been sampled first as presented in Figure 3. A randomly selected example from the data collection that satisfies the criteria and is evaluated by the conditional discriminator contrasts with the generated sample [10]. This method enables the maintenance of dependency relationships. In the pre-processing phase, the DateTime features (i.e., StartTime and EndTime) of the dataset were first formatted into datetime format and then converted into decimal values.
- c) Variational Autoencoder (VAE): An unsupervised neural network known as an autoencoder compresses input data into a latent space and reassembles it into the original input. The encoder module in this network utilizes mean and variance vectors to construct the latent space, where the input sequence is encoded as a Gaussian distribution[11]. It consists of two parts: an encoder, which maps input x to latent space z, and a decoder, which reconstructs x from z, as depicted in Figure 4. Although standard autoencoders minimize reconstruction error, their latent spaces can be irregular, resulting in overfitting and poor interpolation. Variational Autoencoders (VAEs) address this by adding a regularization term—the Kullback–Leibler (KL) divergence—to the training objective, encouraging the latent space to follow a Gaussian distribution. Instead of mapping inputs directly to a point, the VAE encoder outputs mean and variance vectors and samples are drawn from the resulting distribution [12,13]. Here the data pre-processing steps for this model follow the same approach as those for CGAN, as mentioned earlier. The total VAE loss combines reconstruction loss and KL divergence, ensuring better latent space structure and more robust decoding.
- 2) Distribution Based Models: Realistic EV statistics, which are challenging to get. Besides conventional ML techniques, heuristic methods are also necessary to examine such scenarios and generate synthetic data that retains the same probabilistic density or distribution as the real dataset. Distribution-based models serve as an effective approach to generating synthetic data for electric vehicle charging stations, particularly when the objective is to mimic the statistical characteristics of actual activity without requiring intricate model structures.
- a) KDE-based Generative Model: One popular technique for estimating the underlying probability distribution of a short dataset is Kernel Density Estimation (KDE), an acronym for kernel density estimation. Kernel Density Estimation (KDE) is a popular non-parametric method for estimating the probability density function (PDF) of a dataset, especially when data is limited. It applies a kernel (typically Gaussian) to each data point to produce a smooth approximation of the underlying distribution. Synthetic samples are generated by sampling from this estimated PDF, ensuring the synthetic data closely reflects the statistical properties—such as shape and skewness—of the original dataset. This guarantees that the synthetic data statistically mirrors the original data, particularly for distributional characteristics (unimodal, multimodal, skewness, etc.). It is especially beneficial when one intends to preserve the identical statistical distribution in the synthetic dataset. Explicit density estimation and other more straightforward techniques are often used to represent limited tabular data [14,15]. When considering the probability distribution approximation from the user’s perspective, KDE offers several benefits [4]. In 1, we present a framework where the model learns the underlying probability distributions of the real data and then samples from those distributions to create new, synthetic data points. According to the findings, KDE outperforms CGAN on the same dataset and produces high-quality synthetic samples. Real datasets and samples from theoretical distributions are used to evaluate the performance of KDE.
The following is the definition of kernel density estimation:
Here n is the number of samples, h is the bandwidth that has a significant impact on estimating accuracy, and is the kernel function.
The KDE-based Generative Model has ben followed by the algorithm below in 1. To generate data through a KDE-based generative model, we followed the underlying steps of pre-processing mentioned earlier in this section by splitting the Start Time for each EV charging session into 10-minute intervals and evenly distributing the total energy (KWhTotal) across those intervals.
| Algorithm 1 Generating Synthetic EV Charging Data Using KDE. |
|
- b) Probability-based Generative Model: In this study, we propose another SDG, a heuristic model to directly "learn" the probability distribution of the real time-series EV charging data, thereby generating synthetic data. This suggests modelling arrivals and charging time using temporal statistics as well as the related electrical load (i.e., charged energy). A probabilistic method or probability density functions (PDF) has been employed here to train the real-world EV charging dataset, generating realistic data samples of EV sessions rather than using traditional machine learning models. Here, the arrival times of EVs are modelled under the assumption that their inter-arrival times adhere to an exponential distribution. The connection duration for EVs depends on their arrival time and can be characterized by a conditional probability distribution. This distribution is estimated utilizing Gaussian mixture models, and departure times can be computed by sampling connection times for electric vehicle arrivals from this distribution.
The different key aspects of the mentioned SDGs above have been presented in Table 1.
3. Synthetic Dataset Evaluation
In this section both synthetic and real datasets were empirically analyzed to provide a general understanding of the SDGs’ generation capabilities. Evaluating the quality of synthetic data is challenging because it is impossible to prove mathematical similarity. When generating synthetic data using models such as CTGAN, CGAN, VAE, or KDE, it is crucial to assess the degree to which the synthetic data aligns with the real data—both statistically and in practical applications. Here, we assess the comparative analysis of the statistical properties of synthetic energy charged from different mentioned SDGs by three prevalent metrics utilized are Mean Absolute Percentage Error (MAPE), Maximum Mean Discrepancy (MMD) and Kullback-Leibler Divergence (KL Divergent). These are statistical metrics that assess the proximity between real and synthetic KwhTotal for 100 EV session data, each emphasizing distinct facets of that similarity. Using combinedly of these provides a robust statistical validation of the quality of synthetic data.
- MAPE (Mean Absolute Percentage Error): A statistical metric called MAPE is used to evaluate the performance of regression models or forecast accuracy. In terms of percentage, it indicates the average difference between predictions and actual values.
- MMD (Maximum Mean Discrepancy): A statistical metric used to quantify the difference between two probability distributions is KL divergence. In the context of synthetic data, it measures the difference between the generated (synthetic) data distribution and the real data distribution. For two distributions P and Q, using kernel k:
- KL Divergence (Kullback–Leibler Divergence): KL divergence is a statistical measure that quantifies how one probability distribution differs from another. In the context of synthetic data, it measures how different your generated (synthetic) data distribution is from the real data distribution. For two distributions P and Q:
Based on distribution on 100 EV sessions of synthetic KwhTotal data in respect to the real KwhTotal data, the MAPE, MMD and KL Divergence of CGAN, CTGAN, VAE and synthetic KwhTotal based on 10-minute time interval for KDE-based generative models are presented respectively in Figure 5 and Figure 6 below.
Comparison between the synthetic and real data from KDE-based model illustrates the KwhTotal Per 10 minutes interval in Figure 6.
We empirically demonstrate, using statistical analysis, that the synthetic and actual samples originate from the same distribution. However, we note that EV synthetic data generation through different SDGs exhibits different stochastic values being influenced by the mechanism or algorithmic variations of the respective models. Among the mentioned models, VAE outperforms other SDGs by presenting a smaller MAPE value, indicating a reasonable similarity to the pattern of real EV charging data and thus can be assumed to exhibit significant convergence with the real data.
4. Conclusion
This study presents a comprehensive approach to generating synthetic data for electric vehicle (EV) charging session data, aiming to address the scarcity of publicly available datasets crucial for smart grid research and analysis. In this work, we conducted experiments with cutting-edge ML-based, statistical SDGs and introduced an intuitive, novel, data-driven SDG to generate a synthetic EV charging dataset. In the analysis phase, we employed three prominent statistical metrics to compare the generated KwhTotal data from respective SDGs, aiming to comprehend the extent to which the usage trends of synthetic KwhTotal converge with the real data.
The analysis from our experiments demonstrates that the generated synthetic data preserves the statistical characteristics of real-world EV charging sessions, as validated and compared by distinct statistical metrics. These synthetic samples are highly applicable for downstream applications such as load flexibility analysis, tariff optimization, and grid impact studies without compromising user privacy or proprietary data.
Importantly, the proposed SDG models and associated open-source training pipeline can be adapted to new datasets, facilitating scalable and privacy-preserving data generation across different EV deployment to predict seasonal scenarios of EV charging behavior among customers. This contributes a reusable and extensible toolkit to the community for enabling robust smart grid modeling.
In future, we intend to work on enhancing the temporal dynamics and variability captured by the models, particularly to address daily fluctuations in arrival and charging behavior. Additionally, improvements in conditional generative modeling—such as refining hybrid models to better estimate energy demand distributions may further enhance the realistic and utility of synthetic datasets for fine-grained grid simulation and forecasting.
References
- Lahariya, M.; Benoit, D.F.; Develder, C. Synthetic data generator for electric vehicle charging sessions: modeling and evaluation using real-world data. Energies 2020, 13, 4211. [Google Scholar] [CrossRef]
- Chatterjee, S.; Byun, Y.C. A synthetic data generation technique for enhancement of prediction accuracy of electric vehicles demand. Sensors 2023, 23, 594. [Google Scholar] [CrossRef]
- Zhang, C.; Kuppannagari, S.R.; Kannan, R.; Prasanna, V.K. Generative adversarial network for synthetic time series data generation in smart grids. In Proceedings of the 2018 IEEE international conference on communications, control, 2018, and computing technologies for smart grids (SmartGridComm). IEEE; pp. 1–6. [CrossRef]
- Plesovskaya, E.; Ivanov, S. An empirical analysis of KDE-based generative models on small datasets. Procedia Computer Science 2021, 193, 442–452. [Google Scholar] [CrossRef]
- Gawin, B.; Małkowski, R.; Główczewski, K.; Olszewski, M.; Tomasik, P. Dataset for Event-Based Non-Intrusive Load Monitoring Research. Journal Name 2023. [Google Scholar] [CrossRef]
- Amara-Ouali, Y. EV Charging station dataset. https://github.com/yvenn-amara/ev-load-open-data?tab=readme-ov-file. [Online]. Available).
- Zhao, Z.; Kunar, A.; Birke, R.; Chen, L.Y. Ctab-gan: Effective table data synthesizing. In Proceedings of the Asian Conference on Machine Learning. PMLR; 2021; pp. 97–112. [Google Scholar]
- Mirza, M.; Osindero, S. Conditional generative adversarial nets. arXiv preprint arXiv:1411.1784, arXiv:1411.1784 2014.
- Wang, S.; Wang, G.; Fu, Q.; Song, Y.; Liu, J. IH-TCGAN: time-series conditional generative adversarial network with improved Hausdorff distance for synthesizing intention recognition data. Entropy 2023, 25, 781. [Google Scholar] [CrossRef] [PubMed]
- Xu, L.; Skoularidou, M.; Cuesta-Infante, A.; Veeramachaneni, K. Modeling tabular data using conditional gan. Advances in neural information processing systems 2019, 32. [Google Scholar]
- Razghandi, M.; Zhou, H.; Erol-Kantarci, M.; Turgut, D. Smart home energy management: VAE-GAN synthetic dataset generator and Q-learning. IEEE Transactions on Smart Grid 2023, 15, 1562–1573. [Google Scholar] [CrossRef]
- Razghandi, M.; Zhou, H.; Erol-Kantarci, M.; Turgut, D. Variational autoencoder generative adversarial network for synthetic data generation in smart home. In Proceedings of the ICC 2022-IEEE International Conference on Communications. IEEE; 2022; pp. 4781–4786. [Google Scholar] [CrossRef]
- Yong, R. Variational Autoencoder(VAE). https://medium.com/geekculture/variational-autoencoder-vae-9b8ce5475f68. [Online]. Available: https://example.com (accessed: Apr. 26, 2025).
- Kamalov, F. Kernel density estimation based sampling for imbalanced class distribution. Information Sciences 2020, 512, 1192–1201. [Google Scholar] [CrossRef]
- Chokwitthaya, C.; Zhu, Y.; Mukhopadhyay, S.; Jafari, A. Applying the Gaussian mixture model to generate large synthetic data from a small data set. In Proceedings of the Construction Research Congress 2020. American Society of Civil Engineers Reston, VA; 2020; pp. 1251–1260. [Google Scholar]
Figure 1.
Generative Modeling: Conditional Generative Adversarial Network (CGAN).
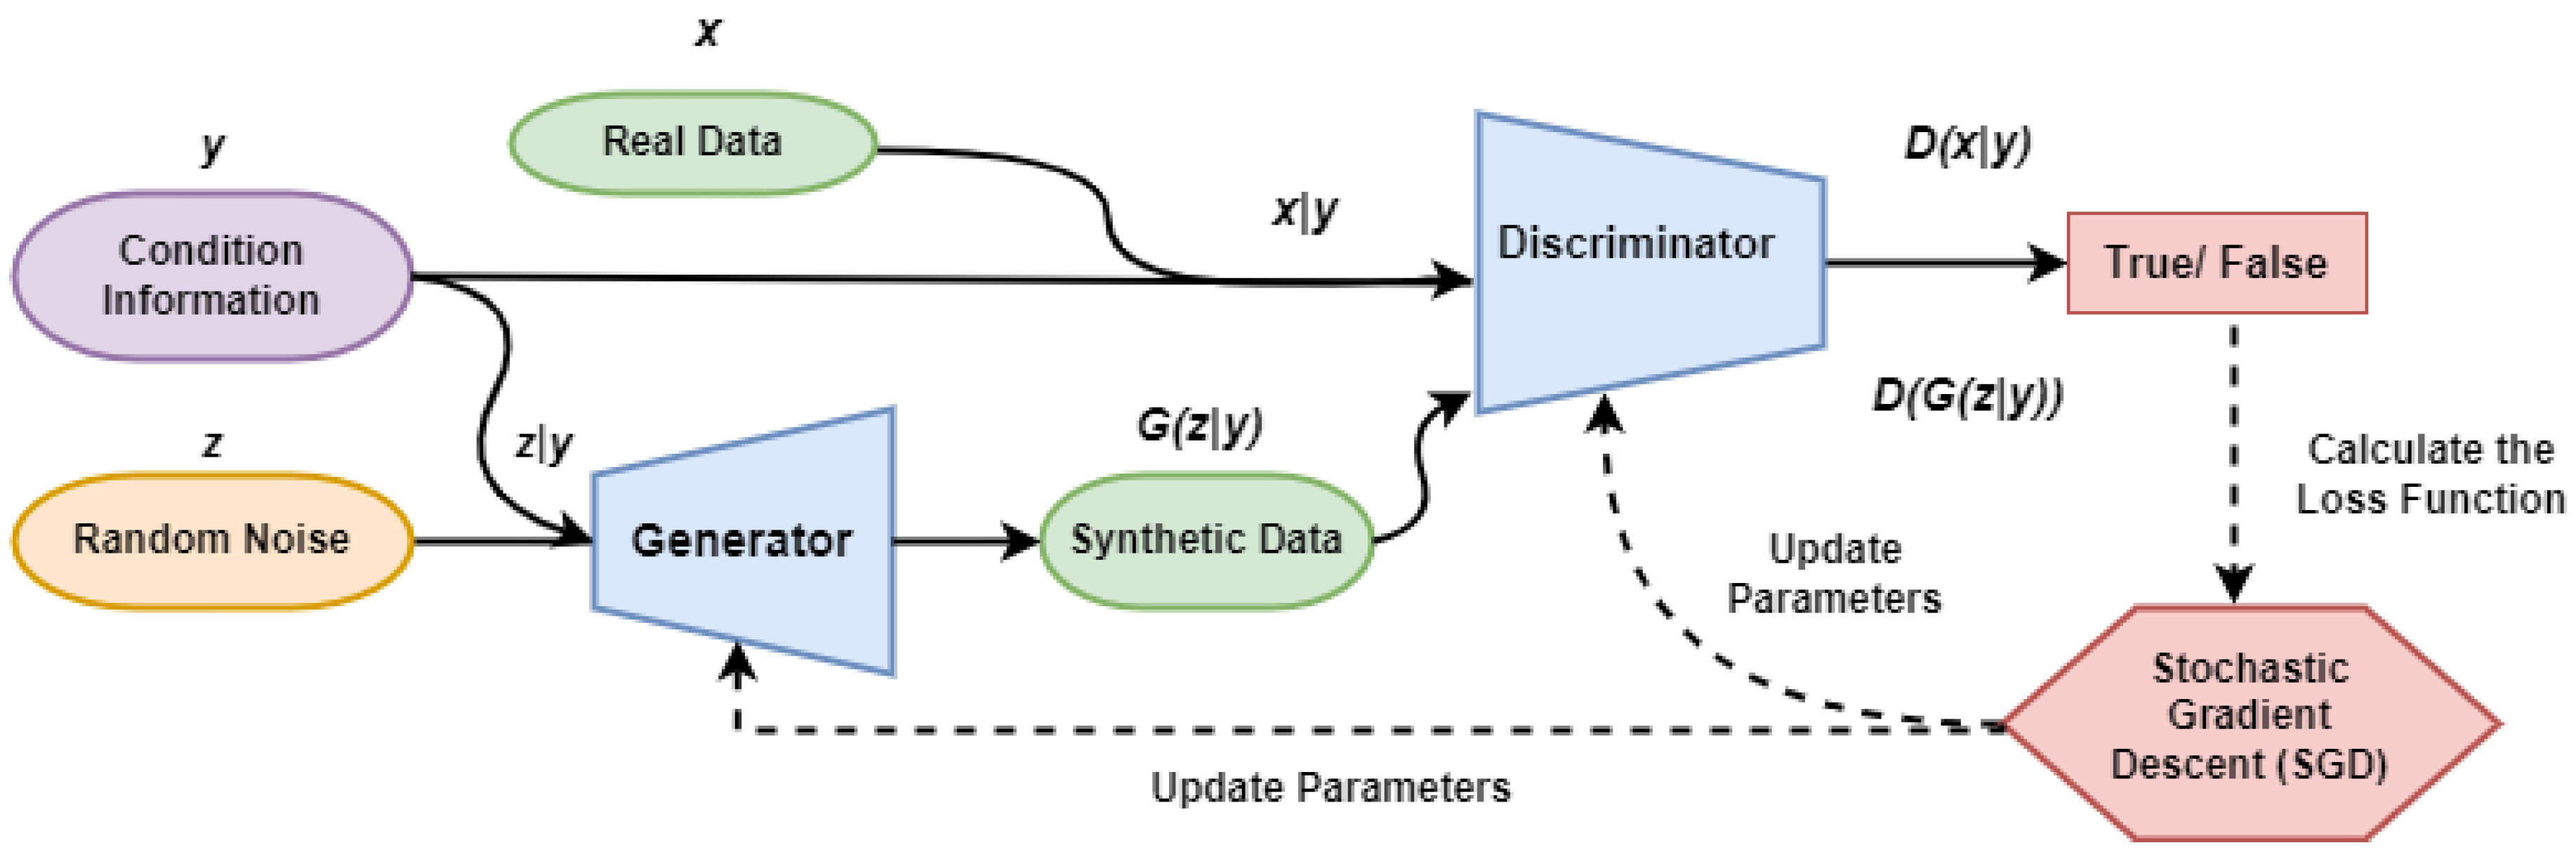
Figure 2.
Generative Modeling: Conditional Generative Adversarial Network (CGAN) [9].
Figure 2.
Generative Modeling: Conditional Generative Adversarial Network (CGAN) [9].
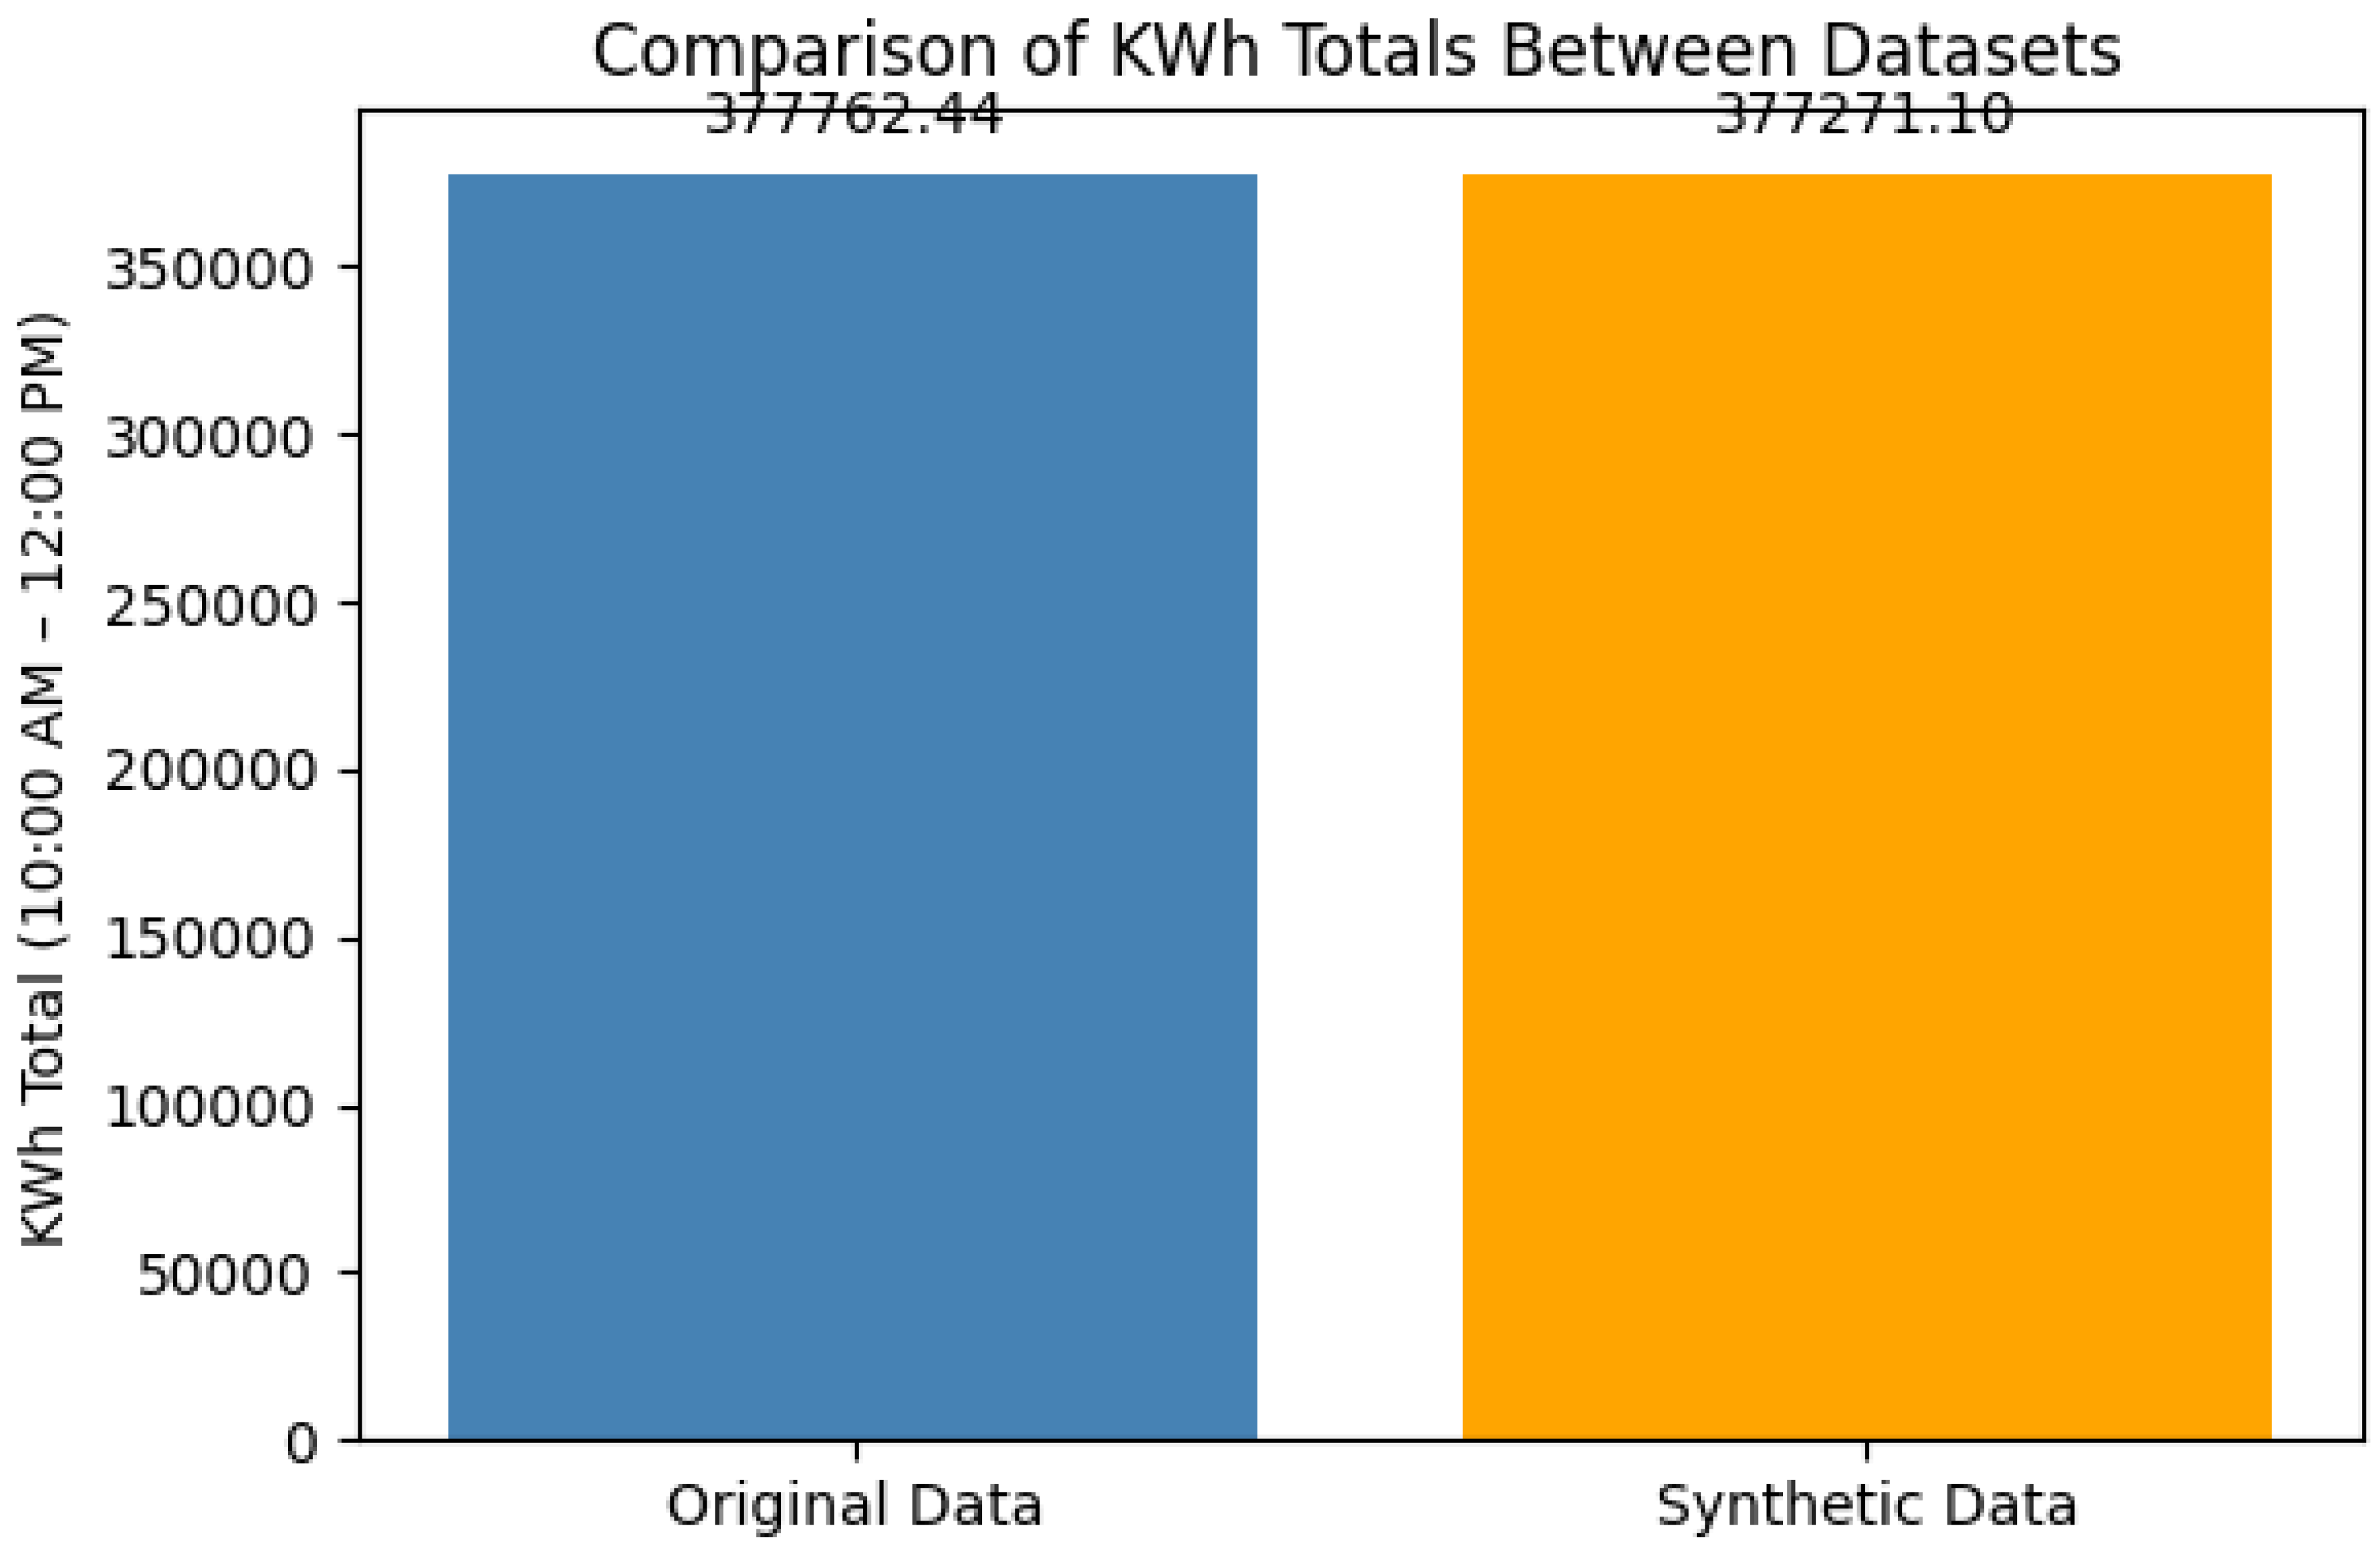
Figure 3.
Conditional Tabular GAN (CTGAN).
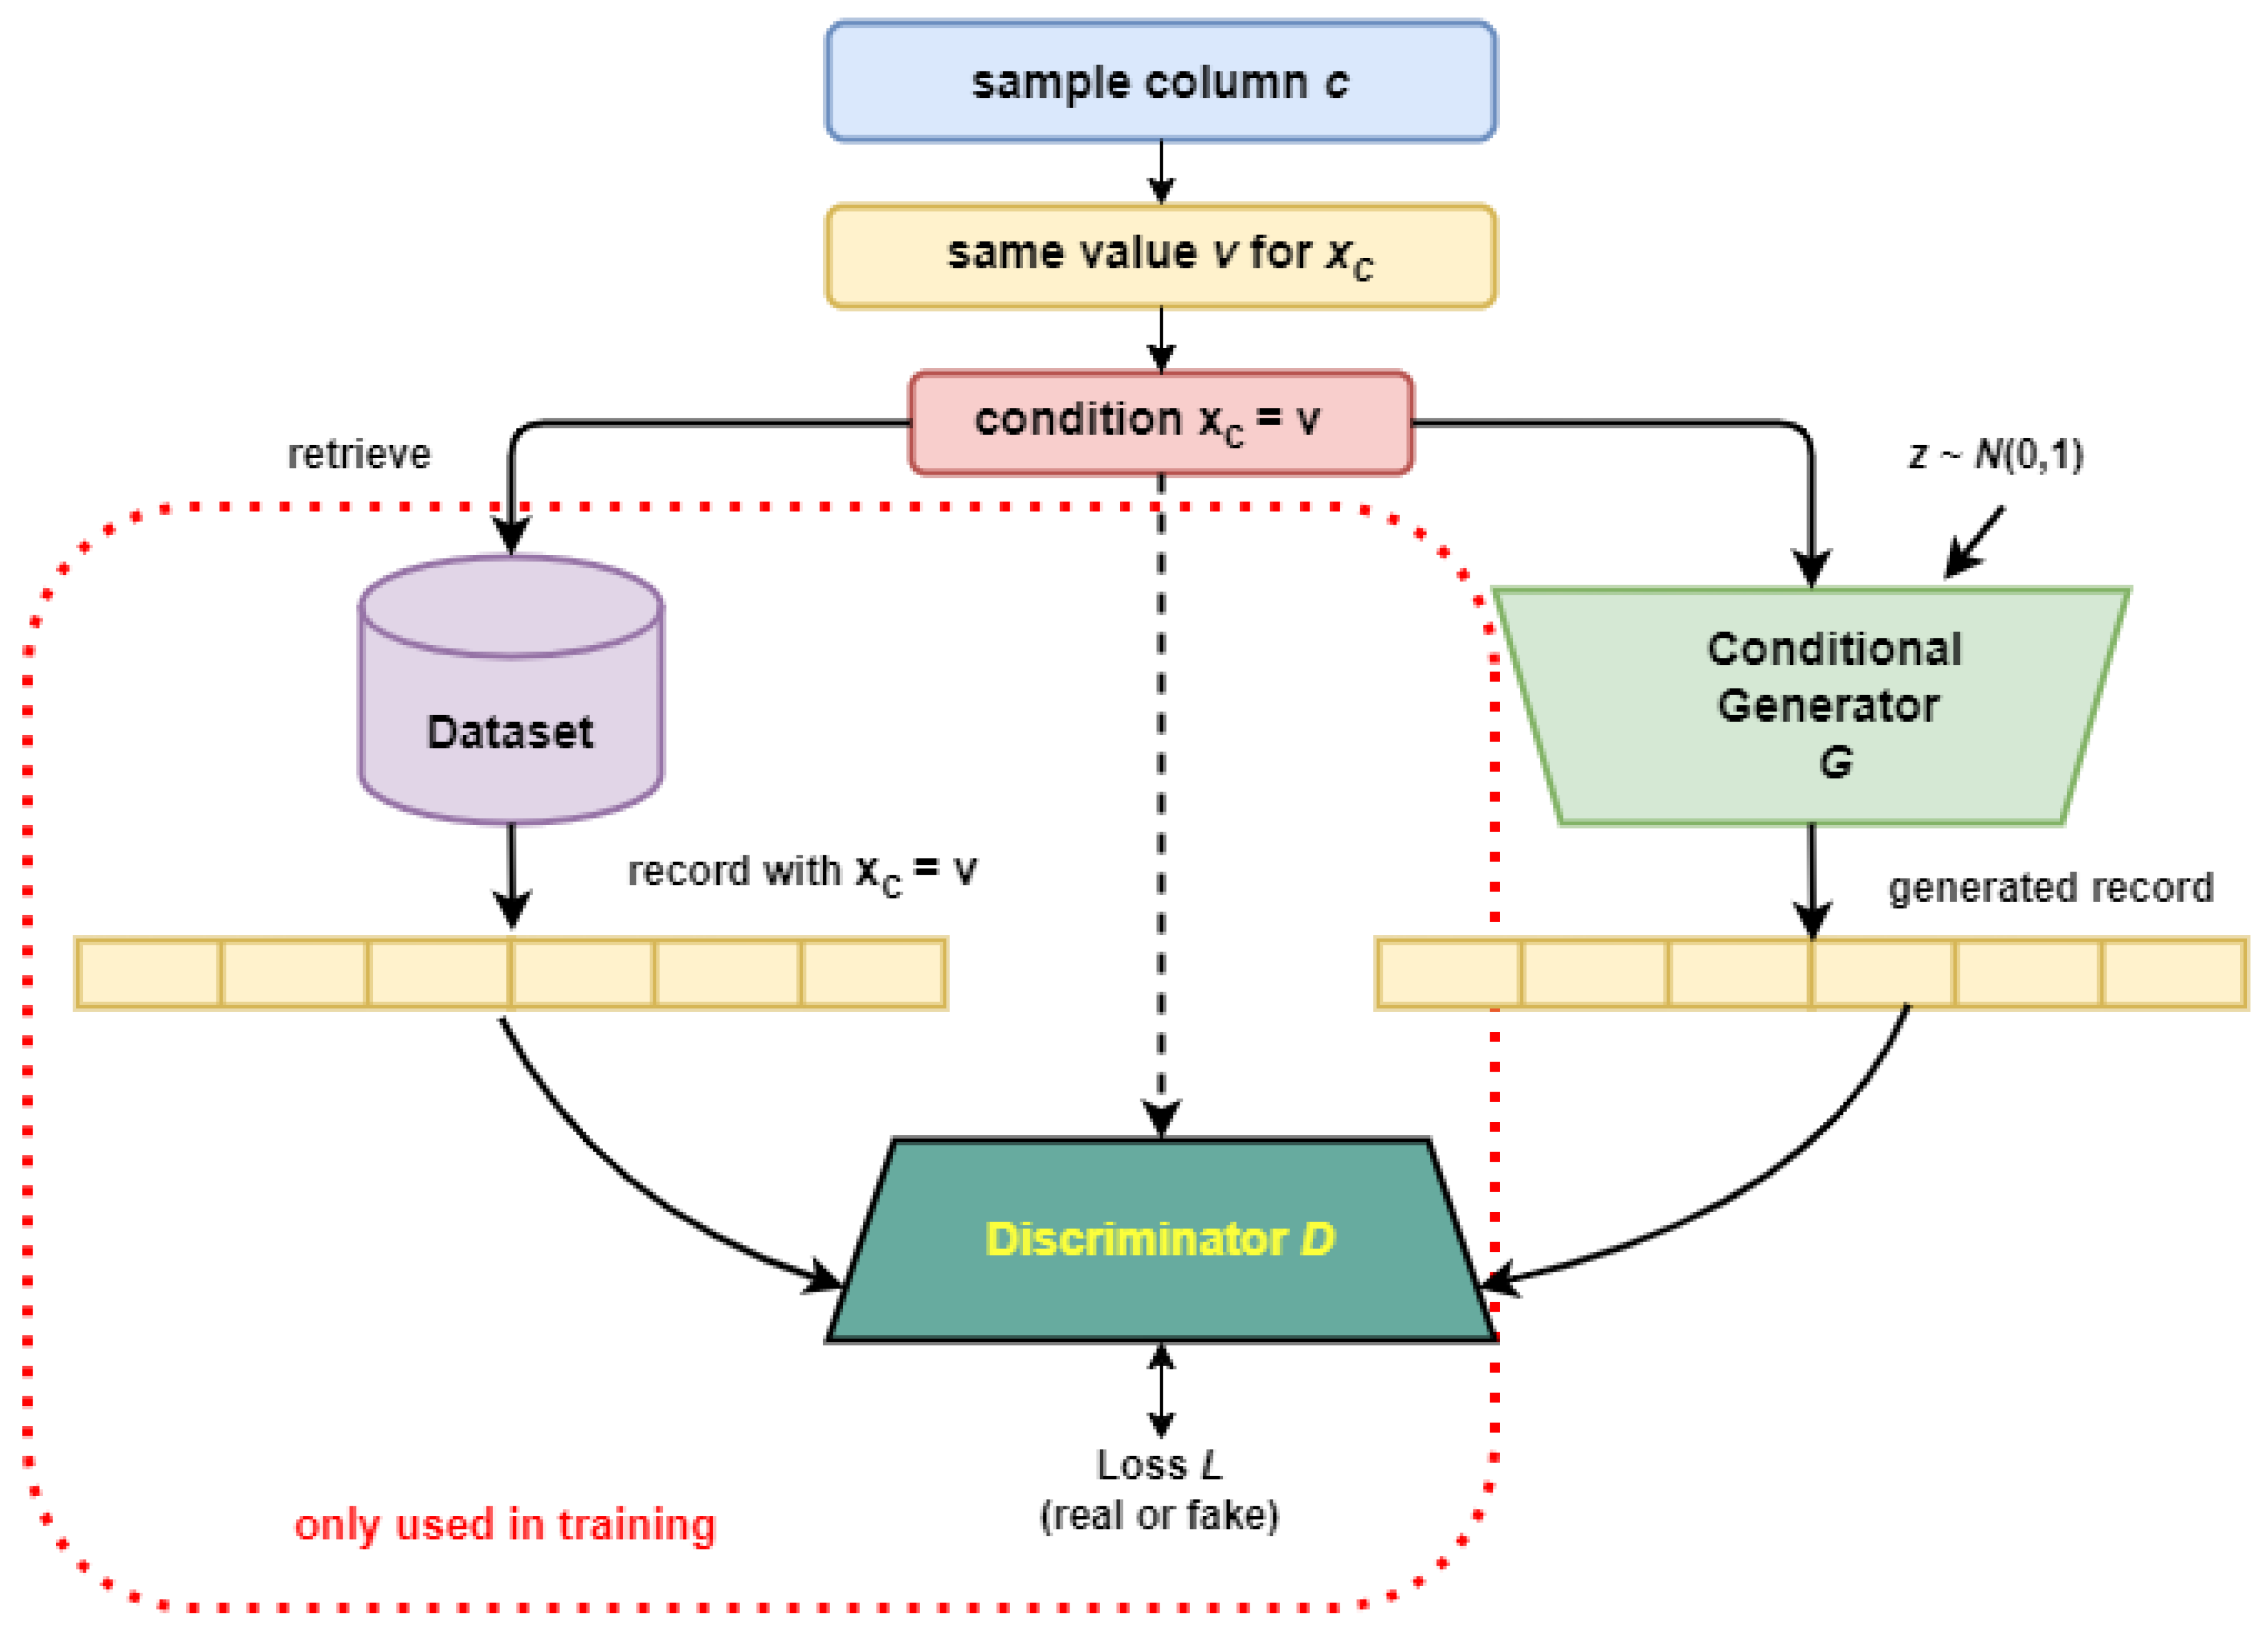
Figure 4.
Generative Modeling: Variational Autoencoder (VAE).
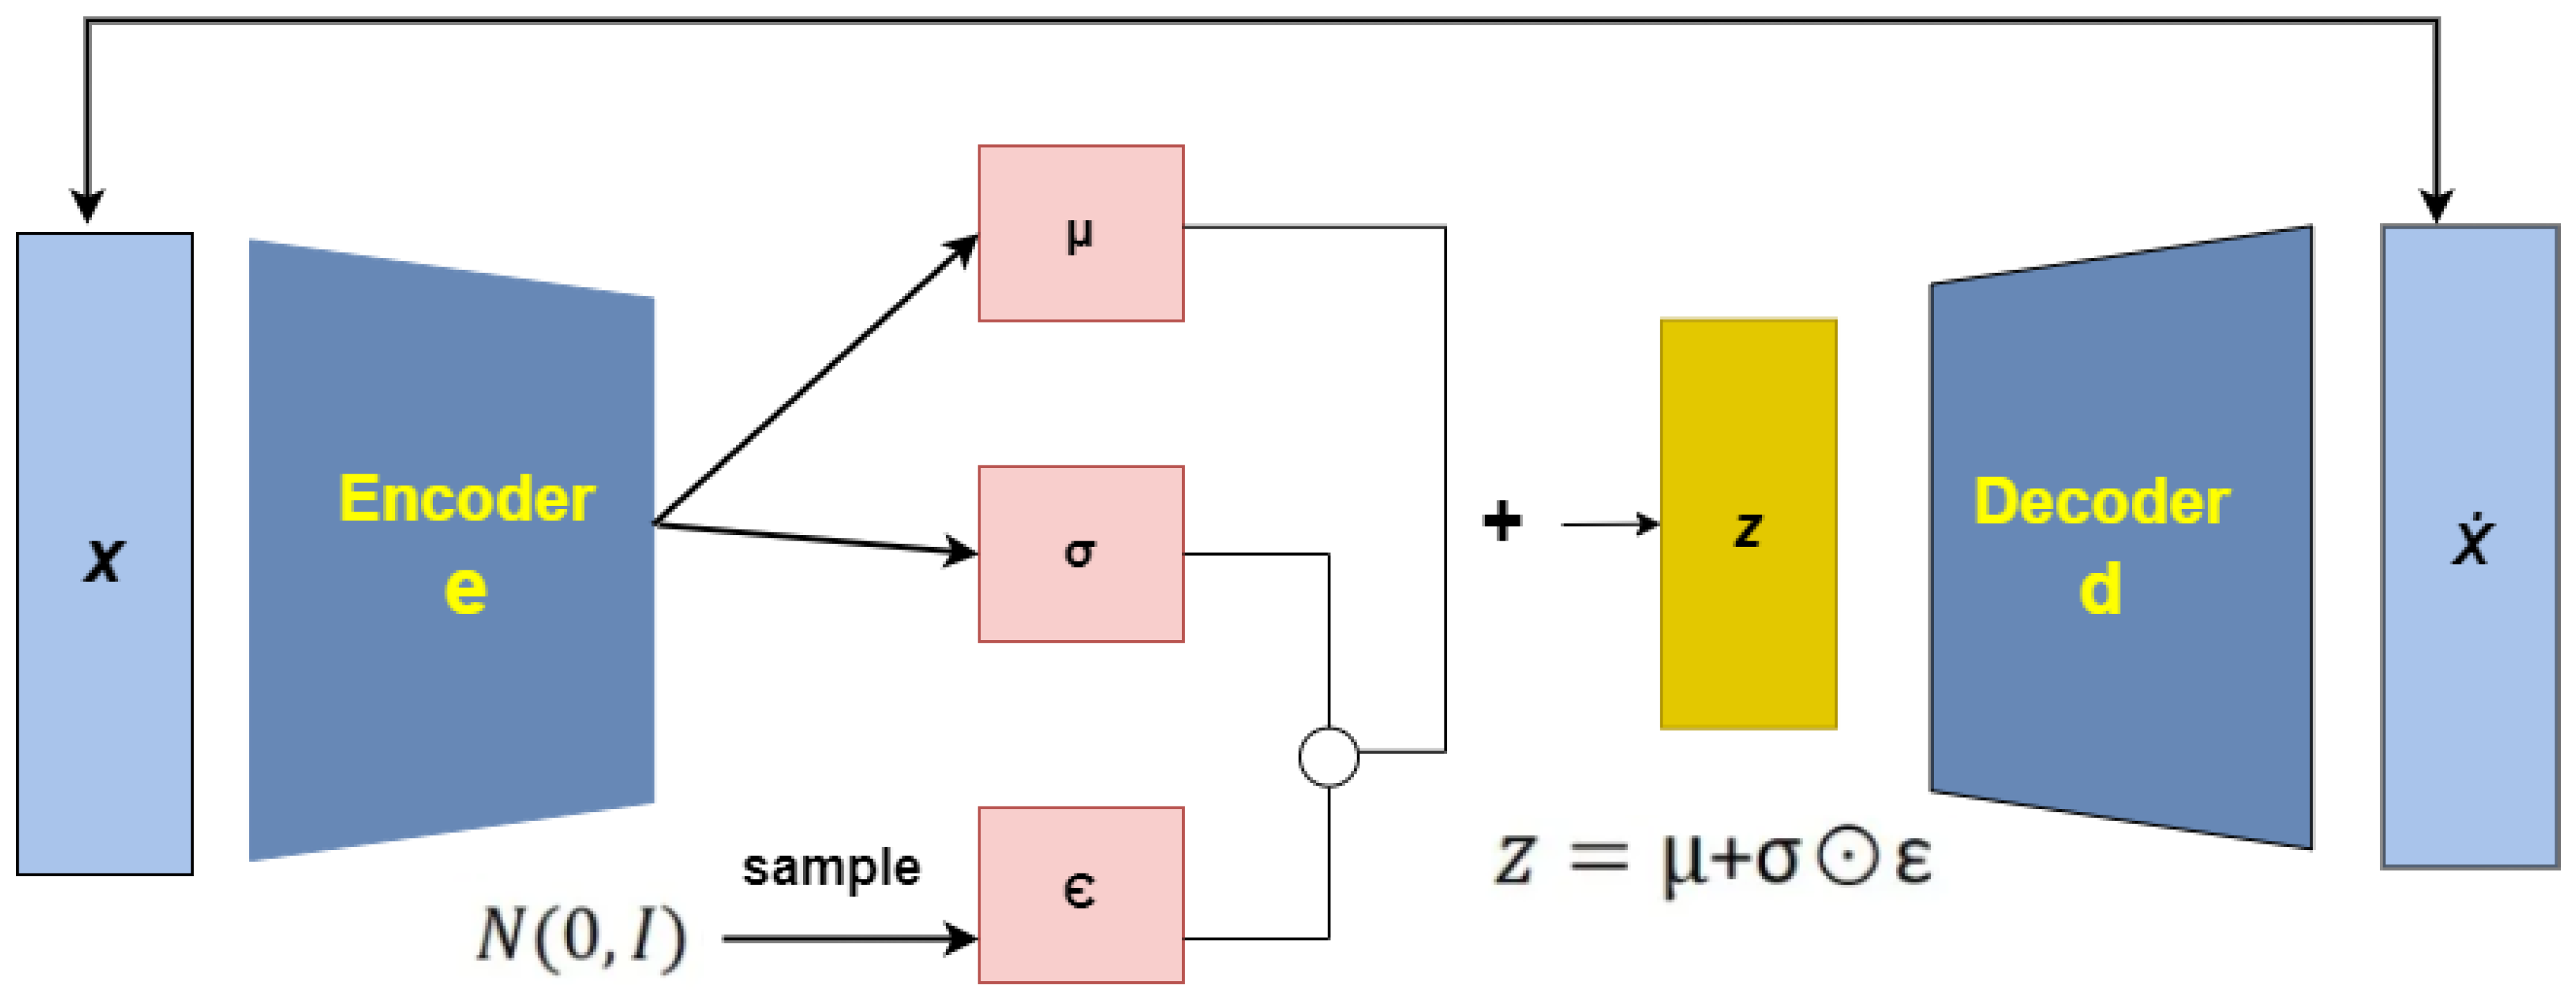
Figure 5.
Comparison of real vs. synthetic KwhTotal for (a) CGAN, (b) CTGAN, and (c) VAE.
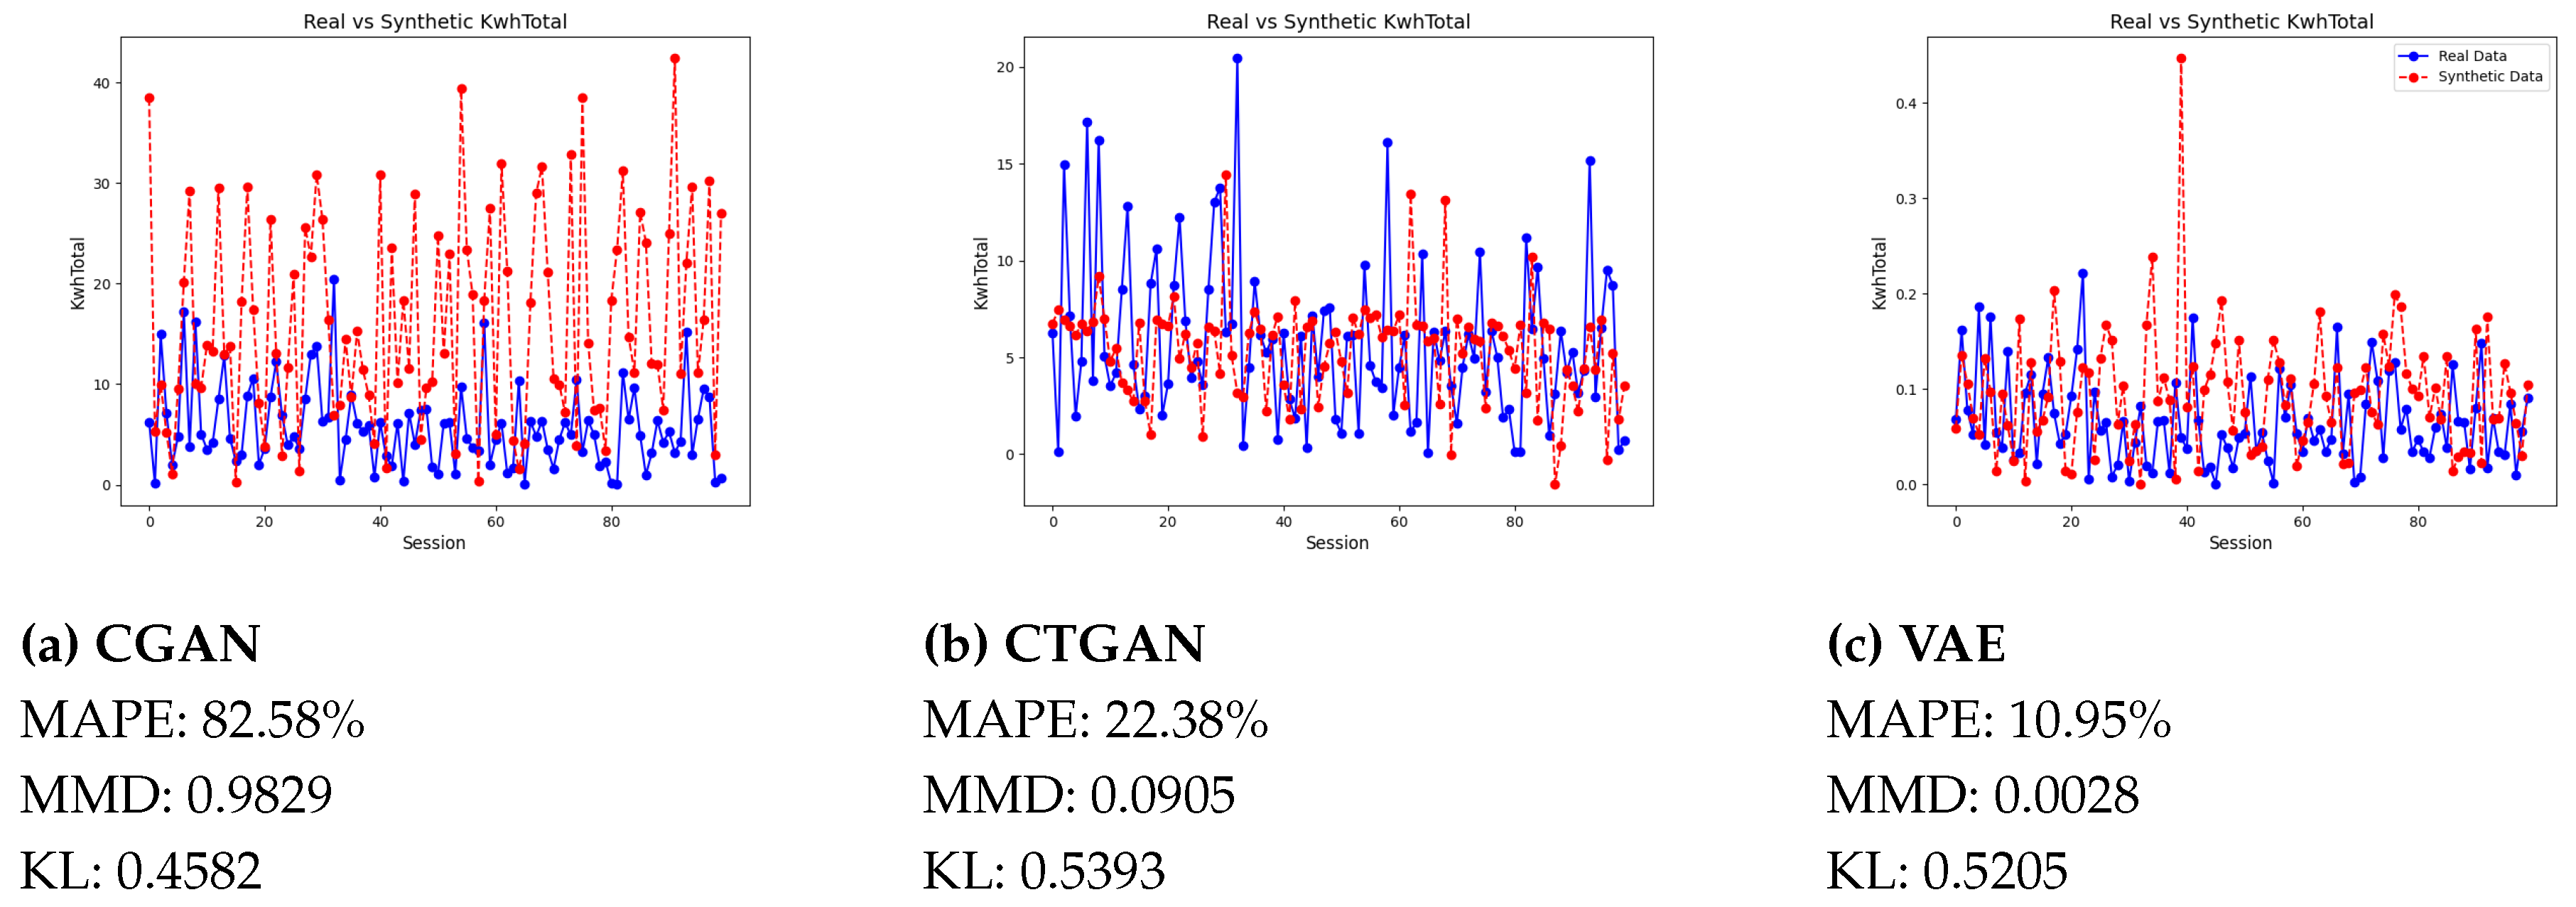
Figure 6.
Generative modelling (KDE) MAPE: 35.54%; MMD: 0.06202; KL: 0.0140.
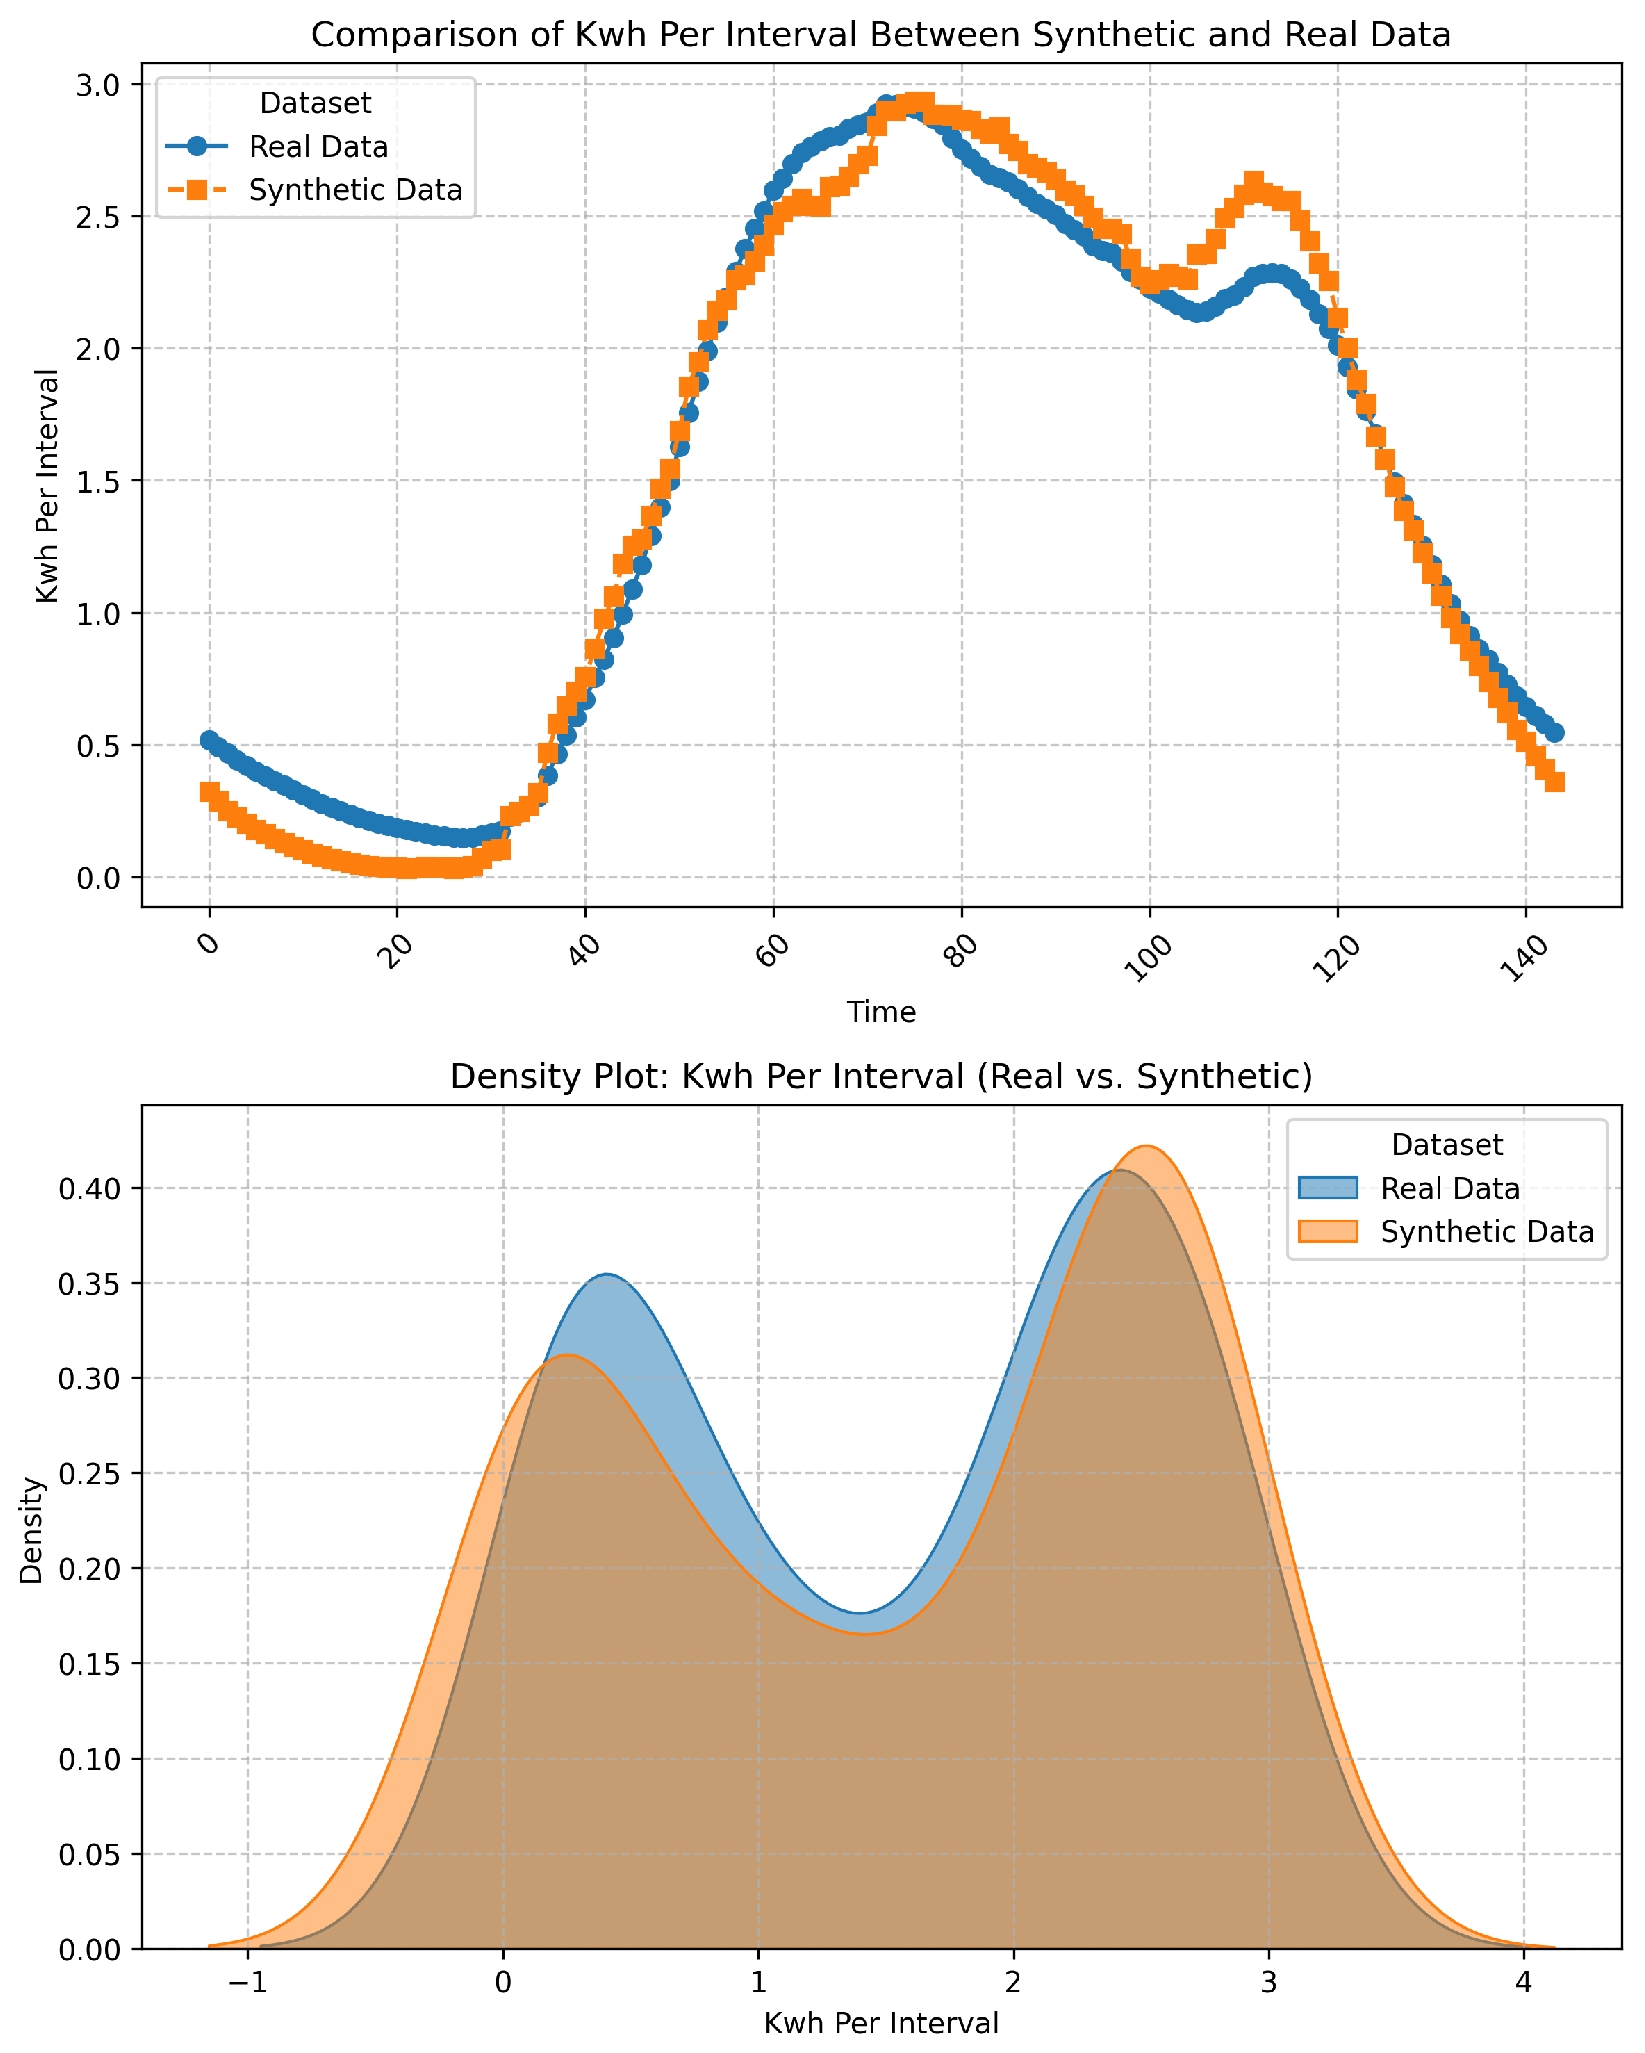

Table 1.
Comparison Metrics among different models.
| Model Name | Python Library | Description |
|---|---|---|
| CTGAN | SDV Tabular | Fits a conditional GAN model adapted for tabular data generation, with ability to model discrete and continuous columns. |
| CGAN | SDV Tabular | Adapts a GAN model that is conditional, designed for tabular data generation. |
| VAE | TensorFlow/Keras or PyTorch | Keras simplifies defining encoder, decoder,and loss functions while PyTorch offers more VAE architecture flexibility. |
| Generative modeling (KDE) | scipy.stats | It’s a statistical method utilizing Kernel Density Estimation (KDE) for generative modeling of random variables. |
Disclaimer/Publisher’s Note: The statements, opinions and data contained in all publications are solely those of the individual author(s) and contributor(s) and not of MDPI and/or the editor(s). MDPI and/or the editor(s) disclaim responsibility for any injury to people or property resulting from any ideas, methods, instructions or products referred to in the content. |
© 2025 by the authors. Licensee MDPI, Basel, Switzerland. This article is an open access article distributed under the terms and conditions of the Creative Commons Attribution (CC BY) license (http://creativecommons.org/licenses/by/4.0/).
Copyright: This open access article is published under a Creative Commons CC BY 4.0 license, which permit the free download, distribution, and reuse, provided that the author and preprint are cited in any reuse.


