Submitted:
12 August 2025
Posted:
14 August 2025
You are already at the latest version
Abstract
Supply chains are networks of logistical facilities such as suppliers, manufacturers, warehouses, distributors, and retailers. These facilities facilitate the movement of raw materials, intermediate products, and finished products. Disruptions in supply chain logistics can lead to shortages ranging from negligible to devastating. For instance, drug shortages can have negative economic and clinical impacts on patients. To effectively assess the risk of supply chain shortages, a method that can represent the supply chain in a suitable format for decision-making analysis and can be automated is necessary. In “A Quantitative Approach to Assess the Likelihood of Supply Chain Shortages,” we defined a methodology to measure the probability of a supply chain’s throughput failure. Based on this methodology, we created the SUpply chain Probabilistic Risk Assessment (SUPRA), a software tool that quantifies the probability of supply chain shortages, as presented in this paper. Using facility failure and flow information, SUPRA outputs the supply chain failure probability and importance measures of the supply chain facilities. We can generate a shortage risk profile from the results. The shortage risk profile, importance measures, and quantified supply chain failure probabilities can inform decision-makers to mitigate and manage supply chain shortages.
Keywords:
supply chain shortage risk
; probabilistic risk assessment
; drug shortages
; fault tree methodology
1. Introduction
Supply chains are logistic networks of suppliers, manufacturers, warehouses, distributors, and retailers [1]. The raw materials, intermediate products, and finished products flow between these facilities. Disruptions in supply chain logistics can cause shortages [2]. The consequences of shortages can range from negligible to devastating. For example, drug shortages have adverse economic and clinical effects on patients [3]. Significant research is underway to characterize the impact of shortages on supply chains.
Walid Klibi et al. [4] proposed a three-phase hazard modeling approach to develop a set of possible scenarios including disruptions and characterize their impact on the supply chain. While they characterize the impact of disruptions on supply chains, including average capacity loss and loss of operational days, they haven’t explicitly quantified the overall supply chain failure, from individual facility level failure. Sheffi and Rice [5] qualitatively distinguish between increasing flexibility and adding redundancy to reduce supply chain vulnerability. Pavlov et al. have used network graphs to quantify supply chain resilience using a hybrid fuzzy-probabilistic method, but they do not consider the throughput of the supply chain [6]. Simchi-Levi et al. focus on quantifying the duration of a supply chain disruption and have developed a time-to-recover model that uses a network graph to fail a node and calculate the impact iteratively [8,9].
Mahmoud M. Bassiouni et al. propose a Deep Learning (DL) methodology to predict the risk associated with the intercity export of shipment [9]. They performed the study using the online data set: “United States Supply Chain Information for COVID-19”. Results show that one of the proposed models is about 100% accurate in predicting the risk of shipment to a target location under COVID-19 restrictions. Bastian Engelking et al. collaborated with an automotive case study company on an Action Design Research (ADR) project to develop a Machine Learning (ML) prototype for Supply Chain Risk Management (SCRM) [10]. The ADR process results in a framework of design principles for applying ML in SCRM.
Edward Elson Kosasih and Alexandra Brintrup propose using Graph Neural Networks (GNNs) to reduce supply chain risk by identifying potential links in the supply chain network unknown to the buyer [11]. Additionally, Edward Elson Kosasih et al. have developed a framework that combines GNNs and knowledge graphs to uncover hidden risks in supply chains [12]. Ajmal Aziz et al. propose a novel method for learning a representation of a supply chain network as a heterogenous graph [13]. The Graph Representation Learning (GRL) method is used in the study to estimate missing data from supply chain entities to increase visibility into interdependencies. Thus, we apply graph neural networks and graph representation learning to analyze supply chain risk.
Typically, the black box nature, that is, explanations lacking results of Artificial Intelligence (AI) algorithms or ML models, challenges their use [14]. Hence, Andreas Holzinger et al. [15] motivate using GNNs to enable information fusion for multi-modal causability. Causability is the extent to which explaining a statement to a human expert achieves a specified level of causal understanding with effectiveness, efficiency, and satisfaction in a specified context of use. Apart from causability another important aspect to consider is the trustworthiness of the AI or Neural Network (NN). In [16], Andreas Holzinger suggests using a human in the loop for certain tasks to promote reliability and trust in AI while ensuring that humans remain in control. Given data availability, we can consider the GNN and GRL methods to analyze supply chain risk in future work.
Munoz et al. conducted a simulation-based study to construct a comprehensive operational supply chain resilience metric encompassing multiple echelons and dimensions [17]. They used disruptions as inputs to quantify the transient response of the supply chain effectively. Rathore et al. focused their analysis on the food supply chain within developing countries [18]. They employed the grey analytical hierarchy process and the grey technique for order performance to develop an extensive risk index, providing a holistic perspective on the subject.
Similarly, Faisal et al. employed graph theory and interpretive structural modeling to formulate a risk index that addressed information risks impacting the supply chain [19]. Tarei et al. utilized the DEcision-MAking Trial and Evaluation Laboratory Analytical Network Process (DEMATEL-ANP) to model various risk drivers and sub-risks, enabling the quantification of corresponding indexes [20]. The authors demonstrated the application of this method in a case study centered around the petroleum supply chain.
Sharma et al. adopted the fuzzy synthetic evaluation method to quantify risks faced by the pharmaceutical supply chain in India [21]. Their findings indicated that the most significant contributing risks were counterfeit drugs, demand fluctuations, and customer loss due to poor service performance by partners. Moreover, the primary risks identified were demand, finance, and logistics. Lawrence et al. developed a Bayesian causality model to represent the supply chain and quantify its cumulative risk [22]. Predictive inference reasoning and sensitivity analysis were employed to analyze the results of this quantification. Ramesh K.T. et al. utilized a hybrid approach, combining expert judgment with quantitative data analysis, to establish an overall inbound supply risk score [23]. The authors employed DEMATEL-ANP for data analysis and demonstrated their framework within the context of the Indian electric supply chain.
Qazi et al. devised a framework that integrated Bayesian networks and game theory to quantify the probability of high development costs and time [24]. Lau et al. proposed a federated learning-enabled multi-criteria risk evaluation system to systematically identify, assess, and prioritize risks within the cold supply chain [25]. Cube et al. presented a discrete event simulation-based method to quantify monetary supply risk [26].
From the literature review, we can conclude that there is a need to develop a supply chain risk quantification method that,
- represents the supply chain information in a way that enables decision-making,
- relates facility-level failure with supply-chain-level failure,
- and can be automated using a software package.
In “A Quantitative Approach to Assess the Likelihood of Supply Chain Shortages,” we defined a methodology to quantify the failure probability of the throughput of a supply chain [27]. Based on the methodology, we have developed the SUpply chain Probabilistic Risk Assessment tool (SUPRA) to quantify pharmaceutical drug shortages presented in this paper. We have built SUPRA to address the supply chain shortage quantification research needs identified in the literature review. This paper’s organization is as follows: Section two briefly summarizes the supply chain shortage risk quantification methodology developed in [27]. Section three describes the development of SUPRA and gives its results. Section four presents the development of SUPRA, and section five introduces new postprocessing methods for SUPRA results. Section six concludes the paper, and section seven discusses future work.
2. Overview of Supply Chain Shortage Quantification
In [27], we described a methodology to represent supply chains as network graphs and fault trees to quantify the supply chain flow and failure probability, respectively, as shown in Figure 1. The first step is to organize the supply chain data in a format suitable for analysis, such as a network graph. We then quantify the total supply chain flow, given facility level flow. After flow quantification, we can use a fault tree solver to generate and quantify the supply chain fault trees. We organize the results of the flow and failure probability quantifications in postprocessing to derive insights from the results. The failure probability vs. flow graph compares the susceptibilities to failure of all the facilities in the supply chain. Given a certain demand value, we can plot the probability vs. shortage similarly, which gives a shortage risk profile.
This paper presents the adaptation of the shortage risk quantification methodology into a software package, SUPRA. Additionally, we present extra steps for postprocessing results, as shown in section four and Figure 1. The extra steps include quantifying importance measures, mitigation analysis, and guidelines for decision-makers.
The vertices of the network graph, as shown in Figure 2, denoted as ‘V,’ represent the facilities and facility failure probabilities. In contrast, the graph’s edges represent the flow of goods between the facilities, denoted by ‘E’ in Figure 2. The nodes’ s’ and ‘t’ represent the source and termination of the supply chain and are not included in the quantification process. We use the network graph representation of the supply chain to calculate the total throughput and visualize the supply chain. The fault tree of the supply chain gives the supply chain failure probability. We can get the shortage probability and generate a risk profile by relating the supply chain failure probability with the flow. Figure 3 and Figure 4 show supply chains represented as network graphs and fault trees.
3. Development of SUPRA
We first began the development of SUPRA to quantify pharmaceutical drug supply chain shortage risk. Therefore, the presentation of the tool in this paper relies on pharmaceutical drug supply chain taxonomy. The supply chain facilities that we considered for drug manufacturing are the Active Pharmaceutical Ingredient (API) and the Finished Dosage Form (FDF) facilities, as shown in Figure 5, based on the system reliability approach given by Tillman et al. in [28]. The facilities have been assigned data points such as a facility ID, a reliability probability (R) or a failure probability (F=1-R), and a facility flow (f).
Using SUPRA, we can read input data from an Excel sheet (or optionally as a Pandas dataframe) to make a fault tree, quantify it, and post-process the results [29]. Figure 6 illustrates a generated fault tree, visualized in the open-source, collaborative PRA tool OpenPRA [30]. SUPRA is part of the development effort within the OpenPRA umbrella to quantify supply chains using PRA best practices.
3.1. Data Structures
We stored the input data for this program in Excel sheets, which contain values corresponding to various drugs denoted by a unique drug ID. Each row of the sheet describes a single API and FDF chain. We organized the rows into the following columns relevant to fault tree construction, as shown in Table 1. Columns A, B, C, and E give us the names of the drug supply chain tiers. Columns D, F, G, H, I, and J give the failure probability, flow, and maximum flow for the FDF and API facilities.
We placed no arbitrary limits on the size or number of the input sheets. In our testing, we have scaled the data from hundreds of thousands to millions of rows, each representing partial drug information. Therefore, efficiently reading and processing the input data is vital. To accomplish this, we used the Python library Pandas to quickly read the input Excel sheets and store the information in a Pandas Dataframe, an object provided by the library that allows the data to be queried and processed through the Pandas API [29]. The code iterates over the rows stored in this data frame to construct fault trees, following the format specified by SCRAM, a command-line tool for various risk analysis methods, including fault tree quantification [31]. A Python interface for SCRAM provides a Python class with methods for constructing fault trees and exporting the trees to an XML file compatible with the SCRAM command-line tool.
3.3. Fault Tree Creation Algorithm
Fundamentally, the algorithm for constructing a fault tree is as follows: begin by querying a list of all unique values found in the drug_id column of the input sheet, then iterate over these values, passing one at a time to a function tasked with constructing a single gate. For a given drug_id, this function using the SCRAM Python interface, creates the root gate of the tree. It then queries a list of all unique app_ids associated with the drug_id and iterates over each unique app_id. For each app_id, we create a gate, then query all rows associated with the drug_id and app_id to produce a list of API and FDF chains associated with the application. We create an OR gate and basic events corresponding to each chain’s API and FDF facilities using the failure probabilities specified in the input data. We then add the basic events to the chain gates, the chain gates to the app gates, and the app gates to the root gate. The gates are either an AND gate or an OR gate, depending on the drug’s number of supply chains.
A Python dictionary object, functioning as a hash map, is created for the generated events for quick access. Since memory for these events is allocated dynamically on the heap within an iterative loop, we use the API and FDF facilities’ total count to pre-allocate the map’s zeroed-out memory. In addition, to speed up instantiation, we utilized pthreads [32] to create a separate map for the API and FDF. Here, we set up the dataframe for read-only memory access, making operations thread-safe and circumventing the added overhead of copying the large dataset. Finally, since the API and FDF IDs are unique, the two maps can be merged in constant time.
3.4. Modeling Backup Facilities
Some API or FDF facilities have a non-zero maximum flow and a zero flow; these are backup facilities. It is of value to know how much the drug failure probability is because of their inclusion. In Figure 7 and Figure 8, if we consider fdf_2 a backup facility, SUPRA determines whether the facility is a backup facility by checking its flow and maximum flow and quantifying the supply chain failure with and without the facility.
3.5. Modeling Shared Facilities
Multiple supply chains may share API and FDF facilities. Supply chains may sometimes have the same facility as an API and an FDF. For example, api_1 in Figure 7 and Figure 8 can be a shared facility in two supply chains, in this case:
- aap_1>chain 1>api_1>fdf_1
- app_1>chain 1>api_1>fdf_2
SCRAM treats objects with the same ID as one object. If a facility shared among multiple drug supply chains fails, then knowing the relative impact of its failure as compared to other facilities is important.
Currently, our dataset has facilities shared among chains within the same drug_id. If more than one drug supply chain shares a facility, we can update the terminology to reflect the shared facility among multiple drug applications.
3.7. Pseudocode
For every inactive drug (maximum units = 0, units =0 for api_id)
Drop the inactive drug.
If the user wants quantification without a backup facility (maximum units≠ 0, units = 0, for api_id or fdf_id)
Drop the backup facilities.
Else
Include them in quantification.
Calculate supply chain flow,
Sum up the flow column for fdf_id.
Define function, create gate,
For selected column,
Read number of rows,
If number of rows is 0,
Exit code.
Else if, number of rows is 1,
Create OR gate.
Else if, Else if, number of rows is more than 1,
Create an AND gate.
For every drug_id,
Call the function, create gate.
If an OR gate is created,
Set it equal to the app_id OR gate.
For every app_id,
Call the function, create gate.
Add api_id and fdf_id as basic events.
Using SCRAM,
Quantify the fault tree and,
Generate importance measures for every basic event.
3.8. Single Child Corner Case
SCRAM requires each gate in the tree to have more than one input to be quantified. Still, many drugs in the input data share the facility for the FDF and API process. In these cases, we add a house event with perfect reliability and quantify the chain, as shown in Figure 9.
4. Additional Steps for Supply Chain Shortage Risk Quantification Methodology
In this section, we present the additions to the
4.1. Calculating Importance Measures
Importance measures help us quantify one facility’s relative susceptibility to failure with respect to the others within a drug supply chain. Table 2 gives a list of all the importance measures [33]. Based on the importance measures, stakeholders can develop reliability improvement methods for vulnerable facilities.
We calculate the importance measures of API and FDF facilities using built-in SCRAM libraries. A well-designed supply chain will have equally balanced importance measures. Otherwise, a supply chain configuration may be optimal in production but not have a resilient production flow.
Facilities with a very low marginal importance measure could have their reliability requirements relaxed. Conversely, those with a high marginal importance measure are critical for supply chain reliability. More effort should be invested in improving their reliability or changing the structure of the supply chain. The improvement potential importance measure indicates the extent to which supply chain reliability improves when the failure probability of the facility i is reduced to zero. In a scenario where the supply chain has failed, the diagnostic importance measure can be used to prioritize maintenance, as it will focus on facilities that are most likely to have caused the failure.
The risk achievement worth importance measure is used to find the risk significance of facilities removed from the supply chain. If the importance measure is close to 1, then its improvement has a negligible effect on the supply chain. Risk reduction worth is complementary to the risk achievement worth.
4.2. Guidelines for Decision Makers
Our current analysis considers the supply chains of individual drugs for quantification. However, for stakeholders, such as federal regulators, an important layer to add to the current analysis is the supply risk of a drug treatment plan. A drug treatment plan may consist of combinations of requisite drugs. Sometimes, the plan may also consist of more than one acceptable drug. The stakeholders select an AND gate or an OR gate and ultimately construct the body of the drug treatment plan as a network graph. Figure 10 and Figure 11 show an example of a combination where we require more than one drug for treatment. Another example can be a treatment plan with more than one acceptable drug, shown in Figure 12 and Figure 13.
4.3. Mitigation Analysis
Some supply chains may fail with probabilities considered substantially high by decision-makers. For these supply chains, it is of interest to reduce the likelihood of failure by applying mitigation techniques. Reducing the facility failure probability may mean troubleshooting manufacturing issues or shipping logistics. Another mitigating method is to add one or more backup facilities.
We are working on implementing mitigation analysis, which consists of reducing the supply chain failure by employing either mitigation methods: reducing the failure probabilities of the facilities or adding backup facilities. This mitigation algorithm is a part of our future work.
5. SUPRA Results
In this section, we present and discuss the failure and flow quantification results generated by SUPRA.
5.1. Fault Tree Quantification Results
We generated outputs in the form of data sheets, one with quantified drug supply chain failure, as shown in Table 3, and another with importance measure calculations for facilities of the drug supply chains, as shown in Table 4. In Table 3, we generated the drug id, drug supply chain failure probability, any quantification error warnings, the supply chain output, a demand value, and the drug shortage calculated as per equation (2). Table 5 gives a summary of the failure probability quantification results.
We plotted the failure probability vs. drug supply with and without backup facilities in Figure 14. This graph determines the supply chains that do not meet the acceptability criteria of supply failure set by the decision-makers. From Figure 15, Figure 16, and Figure 17 we can see that adding backup facilities reduces the failure probabilities for a significant number of supply chains.
We plotted the shortage risk profile with and withoutback-ups using a variable demand that we randomly picked in the range of 90-100% of the drug supply units calculated without backup. The shortage risk profile is an important result that helps us:
- To parameterize and quantify the effect of constant or variable demand on the supply chain shortage.
- To establish the basis for the cost-benefit analysis of adding backup facilities.
- To develop consequence analysis. Using expert judgment the shortage risk profile can be used to quantify drug shortages’ economic consequences.
As we can see from Figure 18 and Figure 19, adding backup facilities shifts the distribution of supply chain facilities to lower failure probabilities, lower shortage, and increase surplus.
The marginal, conditional, diagnostic, risk achievement worth, and risk reduction worth importance measures for the facilities of a drug supply chain are shown in Table 6. We can see that the facility’s importance measures are not balanced and need to be evened out.
5.2. Mitigation Analysis
For a demonstration of mitigation analysis, from the probability of occurrence vs. shortage for supply chains, we selected a subset of drug supply chains in the range of 0.06 to 0.09 failure probability and 7200 to 7900 units of shortage and reduced the failure probabilities of these data points to below a threshold of 0.065 probability as shown in Figure 19.
6. Conclusion
There is a need for a method that represents the supply chain in a format conducive to decision-making analysis and can be automated. We developed a software tool to assess the likelihood of supply chain shortages in this paper to suit the research need. The software tool, Supply chain Probabilistic Risk Assessment (SUPRA), takes in supply chain facility failure and flow information and outputs supply chain failure probability. Thus, this paper advances the knowledge representation and extraction of supply chain shortages by relating facility-level failure to supply chain level failure, generating a shortage risk profile, and automating the process.
7. Future Work
In the current stage of development, SUPRA is written to cater to the quantification of drug supply chains. However, we are working on including modules in SUPRA that can quantify generic supply chains and implement mitigation methods.
Author Contributions
Conceptualization, Mihai A. Diaconeasa; methodology, Mihai A. Diaconeasa, and Priyanka Pandit; software, Arjun Earthperson and Priyanka Pandit; formal analysis, Priyanka Pandit and Mihai A. Diaconeasa; writing—original draft preparation, Priyanka Pandit, Mihai A. Diaconeasa; writing—review and editing, Priyanka Pandit, Arjun Earthperson, and Mihai A. Diaconeasa; funding acquisition, Mihai A. Diaconeasa; supervision, Mihai A. Diaconeasa. All authors have read and agreed to the published version of the manuscript.
Funding
The research reported in this publication was supported by the US Food & Drug Administration (FDA) under contract award number 75F40120C00124.
Data Availability Statement
The data supporting the results in this paper was available to the authors under an NDA.
Acknowledgments
The authors would like to acknowledge Daniel M. Nevius for the software implementations. The authors greatly appreciate the opportunity provided by the FDA to perform the study presented in this paper and for their valuable feedback on it. Heartfelt gratitude to Dr. Reza Kazemi-Tabriz and his team including Matthew Rosenberg, Zachary Tillman, Roberto Delhy Nolivos, Ruiz-Barnes Cesar, and Negar Tavasoli Hozouri for providing valuable insights in their reviews.
Conflicts of Interest
The authors declare no conflict of interest. The funders compiled the data used in this paper; and had no role in the writing of the manuscript; or in the decision to publish the results.
References
- D. Simchi-Levi, P. D. Simchi-Levi, P. Kaminsky, and E. Simchi-Levi, Designing and Managing the Supply Chain: Concepts, Strategies, and Case Studies. McGraw Hill Professional, 2003.
- K. Katsaliaki, P. K. Katsaliaki, P. Galetsi, and S. Kumar, “Supply chain disruptions and resilience: a major review and future research agenda,” Ann. Oper. Res., vol. 319, no. 1, pp. 965–1002, Dec. 2022. [Google Scholar] [CrossRef]
- J. M. Phuong, J. J. M. Phuong, J. Penm, B. Chaar, L. D. Oldfield, and R. Moles, “The impacts of medication shortages on patient outcomes: A scoping review,” PLoS ONE, vol. 14, no. 5, p. 20 May. [CrossRef]
- W. Klibi and A. Martel, “Scenario-based Supply Chain Network risk modeling,” Eur. J. Oper. Res., vol. 223, no. 3, pp. 644–658, Dec. 2012. [CrossRef]
- J. B. R. J. Yossi Sheffi, “A Supply Chain View of the Resilient Enterprise,” MIT Sloan Manag. Rev., vol. 47, no. 1, pp. 41–48, Fall 2005.
- Pavlov, D. Ivanov, A. Dolgui, and B. Sokolov, “Hybrid fuzzy-probabilistic approach to supply chain resilience assessment,” IEEE Trans. Eng. Manag., vol. 65, no. 2, pp. 20 May; 18. [CrossRef]
- D. Simchi-Levi, W. D. Simchi-Levi, W. Schmidt, and Y. Wei, “From Superstorms to Factory Fires: Managing Unpredictable Supply-Chain Disruptions,” Harvard Business Review, Jan. 01, 2014. Accessed: Apr. 20, 2022. [Online]. Available: https://hbr.org/2014/01/from-superstorms-to-factory-fires-managing-unpredictable-supply-chain-disruptions. 2014. [Google Scholar]
- D. Simchi-Levi et al., “Identifying Risks and Mitigating Disruptions in the Automotive Supply Chain,” Interfaces, vol. 45, no. 5, pp. 375–390, Oct. 2015. [CrossRef]
- M. M. Bassiouni, R. K. M. M. Bassiouni, R. K. Chakrabortty, O. K. Hussain, and H. F. Rahman, “Advanced deep learning approaches to predict supply chain risks under COVID-19 restrictions,” Expert Syst. Appl., vol. 211, p. 118604, Jan. 2023. [Google Scholar] [CrossRef]
- Bode, R. Bogaschewsky, M. Eßig, R. Lasch, and W. Stölzle, Eds., Supply Management Research: Aktuelle Forschungsergebnisse 2020. in Advanced Studies in Supply Management. Wiesbaden: Springer Fachmedien Wiesbaden, 2020. [CrossRef]
- E. E. Kosasih and A. Brintrup, “A machine learning approach for predicting hidden links in supply chain with graph neural networks,” Int. J. Prod. Res., vol. 60, no. 17, pp. 5380–5393, Sep. 2022. [CrossRef]
- E. E. Kosasih, F. E. E. Kosasih, F. Margaroli, S. Gelli, A. Aziz, N. Wildgoose, and A. Brintrup, “Towards knowledge graph reasoning for supply chain risk management using graph neural networks,” Int. J. Prod. Res., vol. 0, no. 0, pp. 1–17, Jul. 2022. [Google Scholar] [CrossRef]
- A. Aziz, E. A. Aziz, E. Kosasih, R.-R. Griffiths, and A. Brintrup, “Data Considerations in Graph Representation Learning for Supply Chain Networks,” presented at the ICML 2021 Workshop on Machine Learning for Data, Jul. 2021. [CrossRef]
- J. Pearl, “The limitations of opaque learning machines, in: J. Brockman (Ed.), Possible Minds: 25 Ways of Looking at AI,” Penguin Press, New York, Technical Report, 19. [Online]. Available: https://ftp.cs.ucla.edu/pub/stat_ser/r489.pdf. 20 May.
- A. Holzinger, B. A. Holzinger, B. Malle, A. Saranti, and B. Pfeifer, “Towards multi-modal causability with Graph Neural Networks enabling information fusion for explainable AI,” Inf. Fusion, vol. 71, pp. 28–37, Jul. 2021. [Google Scholar] [CrossRef]
- Holzinger, “The Next Frontier: AI We Can Really Trust,” in Machine Learning and Principles and Practice of Knowledge Discovery in Databases, M. Kamp, I. Koprinska, A. Bibal, T. Bouadi, B. Frénay, L. Galárraga, J. Oramas, L. Adilova, G. Graça, et al., Eds., in Communications in Computer and Information Science. Cham: Springer International Publishing, 2021, pp. 427–440. [CrossRef]
- Munoz and, M. Dunbar, “On the quantification of operational supply chain resilience,” Int. J. Prod. Res., vol. 53, no. 22, pp. 6736–6751, Nov. 2015. [Google Scholar] [CrossRef]
- R. Rathore, J. J. R. Rathore, J. J. Thakkar, and J. K. Jha, “A quantitative risk assessment methodology and evaluation of food supply chain,” Int. J. Logist. Manag., vol. 28, no. 4, pp. 1272–1293, Jan. 2017. [Google Scholar] [CrossRef]
- M. Nishat Faisal, D. K. M. Nishat Faisal, D. K. Banwet, and R. Shankar, “Information risks management in supply chains: an assessment and mitigation framework,” J. Enterp. Inf. Manag., vol. 20, no. 6, pp. 677–699, Jan. 2007. [Google Scholar] [CrossRef]
- P. K. Tarei, J. J. P. K. Tarei, J. J. Thakkar, and B. Nag, “A hybrid approach for quantifying supply chain risk and prioritizing the risk drivers: A case of Indian petroleum supply chain,” J. Manuf. Technol. Manag., vol. 29, no. 3, pp. 533–569, Jan. 2018. [Google Scholar] [CrossRef]
- A. Sharma, D. A. Sharma, D. Kumar, and N. Arora, “Supply chain risk factor assessment of Indian pharmaceutical industry for performance improvement,” Int. J. Product. Perform. Manag., vol. ahead-of-print, no. ahead-of-print, Jan. 2022. [Google Scholar] [CrossRef]
- J.-M. Lawrence, N. U. J.-M. Lawrence, N. U. Ibne Hossain, R. Jaradat, and M. Hamilton, “Leveraging a Bayesian network approach to model and analyze supplier vulnerability to severe weather risk: A case study of the U.S. pharmaceutical supply chain following Hurricane Maria,” Int. J. Disaster Risk Reduct., vol. 49, p. 101607, Oct. 2020. [Google Scholar] [CrossRef]
- K. T. Ramesh, S. P. Sarmah, and P. K. Tarei, “An integrated framework for the assessment of inbound supply risk and prioritization of the risk drivers: A real-life case on electronics supply chain,” Benchmarking, vol. 27, no. 3, pp. 1261–. [CrossRef]
- A. Qazi, J. A. Qazi, J. Quigley, and A. Dickson, “A Novel Framework for Quantification of Supply Chain Risks,” in 4th Student Conference on Operational Research, P. C. D. Granado, M. Joyce-Moniz, and S. Ravizza, Eds., in OpenAccess Series in Informatics (OASIcs), vol. 37. Dagstuhl, Germany: Schloss Dagstuhl–Leibniz-Zentrum fuer Informatik, 2014, pp. 1–15. [CrossRef]
- H. Lau, Y. P. H. Lau, Y. P. Tsang, D. Nakandala, and C. K. M. Lee, “Risk quantification in cold chain management: a federated learning-enabled multi-criteria decision-making methodology,” Ind. Manag. Data Syst., vol. 121, no. 7, pp. 1684–1703, Jul. 2021. [Google Scholar] [CrossRef]
- P. von Cube et al., “Monetary Quantification of Supply Risks of Manufacturing Enterprises - Discrete Event Simulation Based Approach,” Procedia CIRP, vol. 57, pp. 164–170, Jan. 2016. [CrossRef]
- P. Pandit, A. Earthperson, A. Tezbasaran, and M. A. Diaconeasa, “A Quantitative Approach to Assess the Likelihood of Supply Chain Shortages,” in Volume 13: Safety Engineering, Risk, and Reliability Analysis; Research Posters, Virtual, Online: American Society of Mechanical Engineers, Nov. 2021. [Google Scholar] [CrossRef]
- Z. Tillman, M. Z. Tillman, M. Rosenberg, R. Delhy, C. Ruiz-Barnes, and R. Kazemi, “A System Reliability Approach for Assessing the Vulnerability of United States Pharmaceutical Supply Chains,” in Proceedings of the 30th European Safety and Reliability Conference and 15th Probabilistic Safety Assessment and Management Conference, Research Publishing Services, 2020, pp. 1027–1033. [CrossRef]
- “pandas.DataFrame — pandas 1.4.2 documentation.” https://pandas.pydata.org/docs/reference/api/pandas.DataFrame.html (accessed Apr. 20, 2022).
- “OpenPRA: Open-Source Framework for Probabilistic Risk Assessment | Probabilistic Risk Assessment Group.” https://openpra.org (accessed Apr. 29, 2021).
- A. Rakhimov, “SCRAM, https://github.com/rakhimov/scram.” Accessed: Feb. 11, 2021. [Online]. Available: https://github.com/rakhimov/scram.
- A. Nichols, D. A. Nichols, D. Buttlar, and J. Proulx Farrell, Pthreads programming: a POSIX standard for better multiprocessing, Nachdr. Beijing Köln: O’Reilly, 2002.
- M. Rausand, A. M. Rausand, A. Barros, and A. Hoyland, System Reliability Theory: Models, Statistical Methods, and Applications. John Wiley & Sons, 2020.
Figure 1.
Overview of SUPRA Methodology.
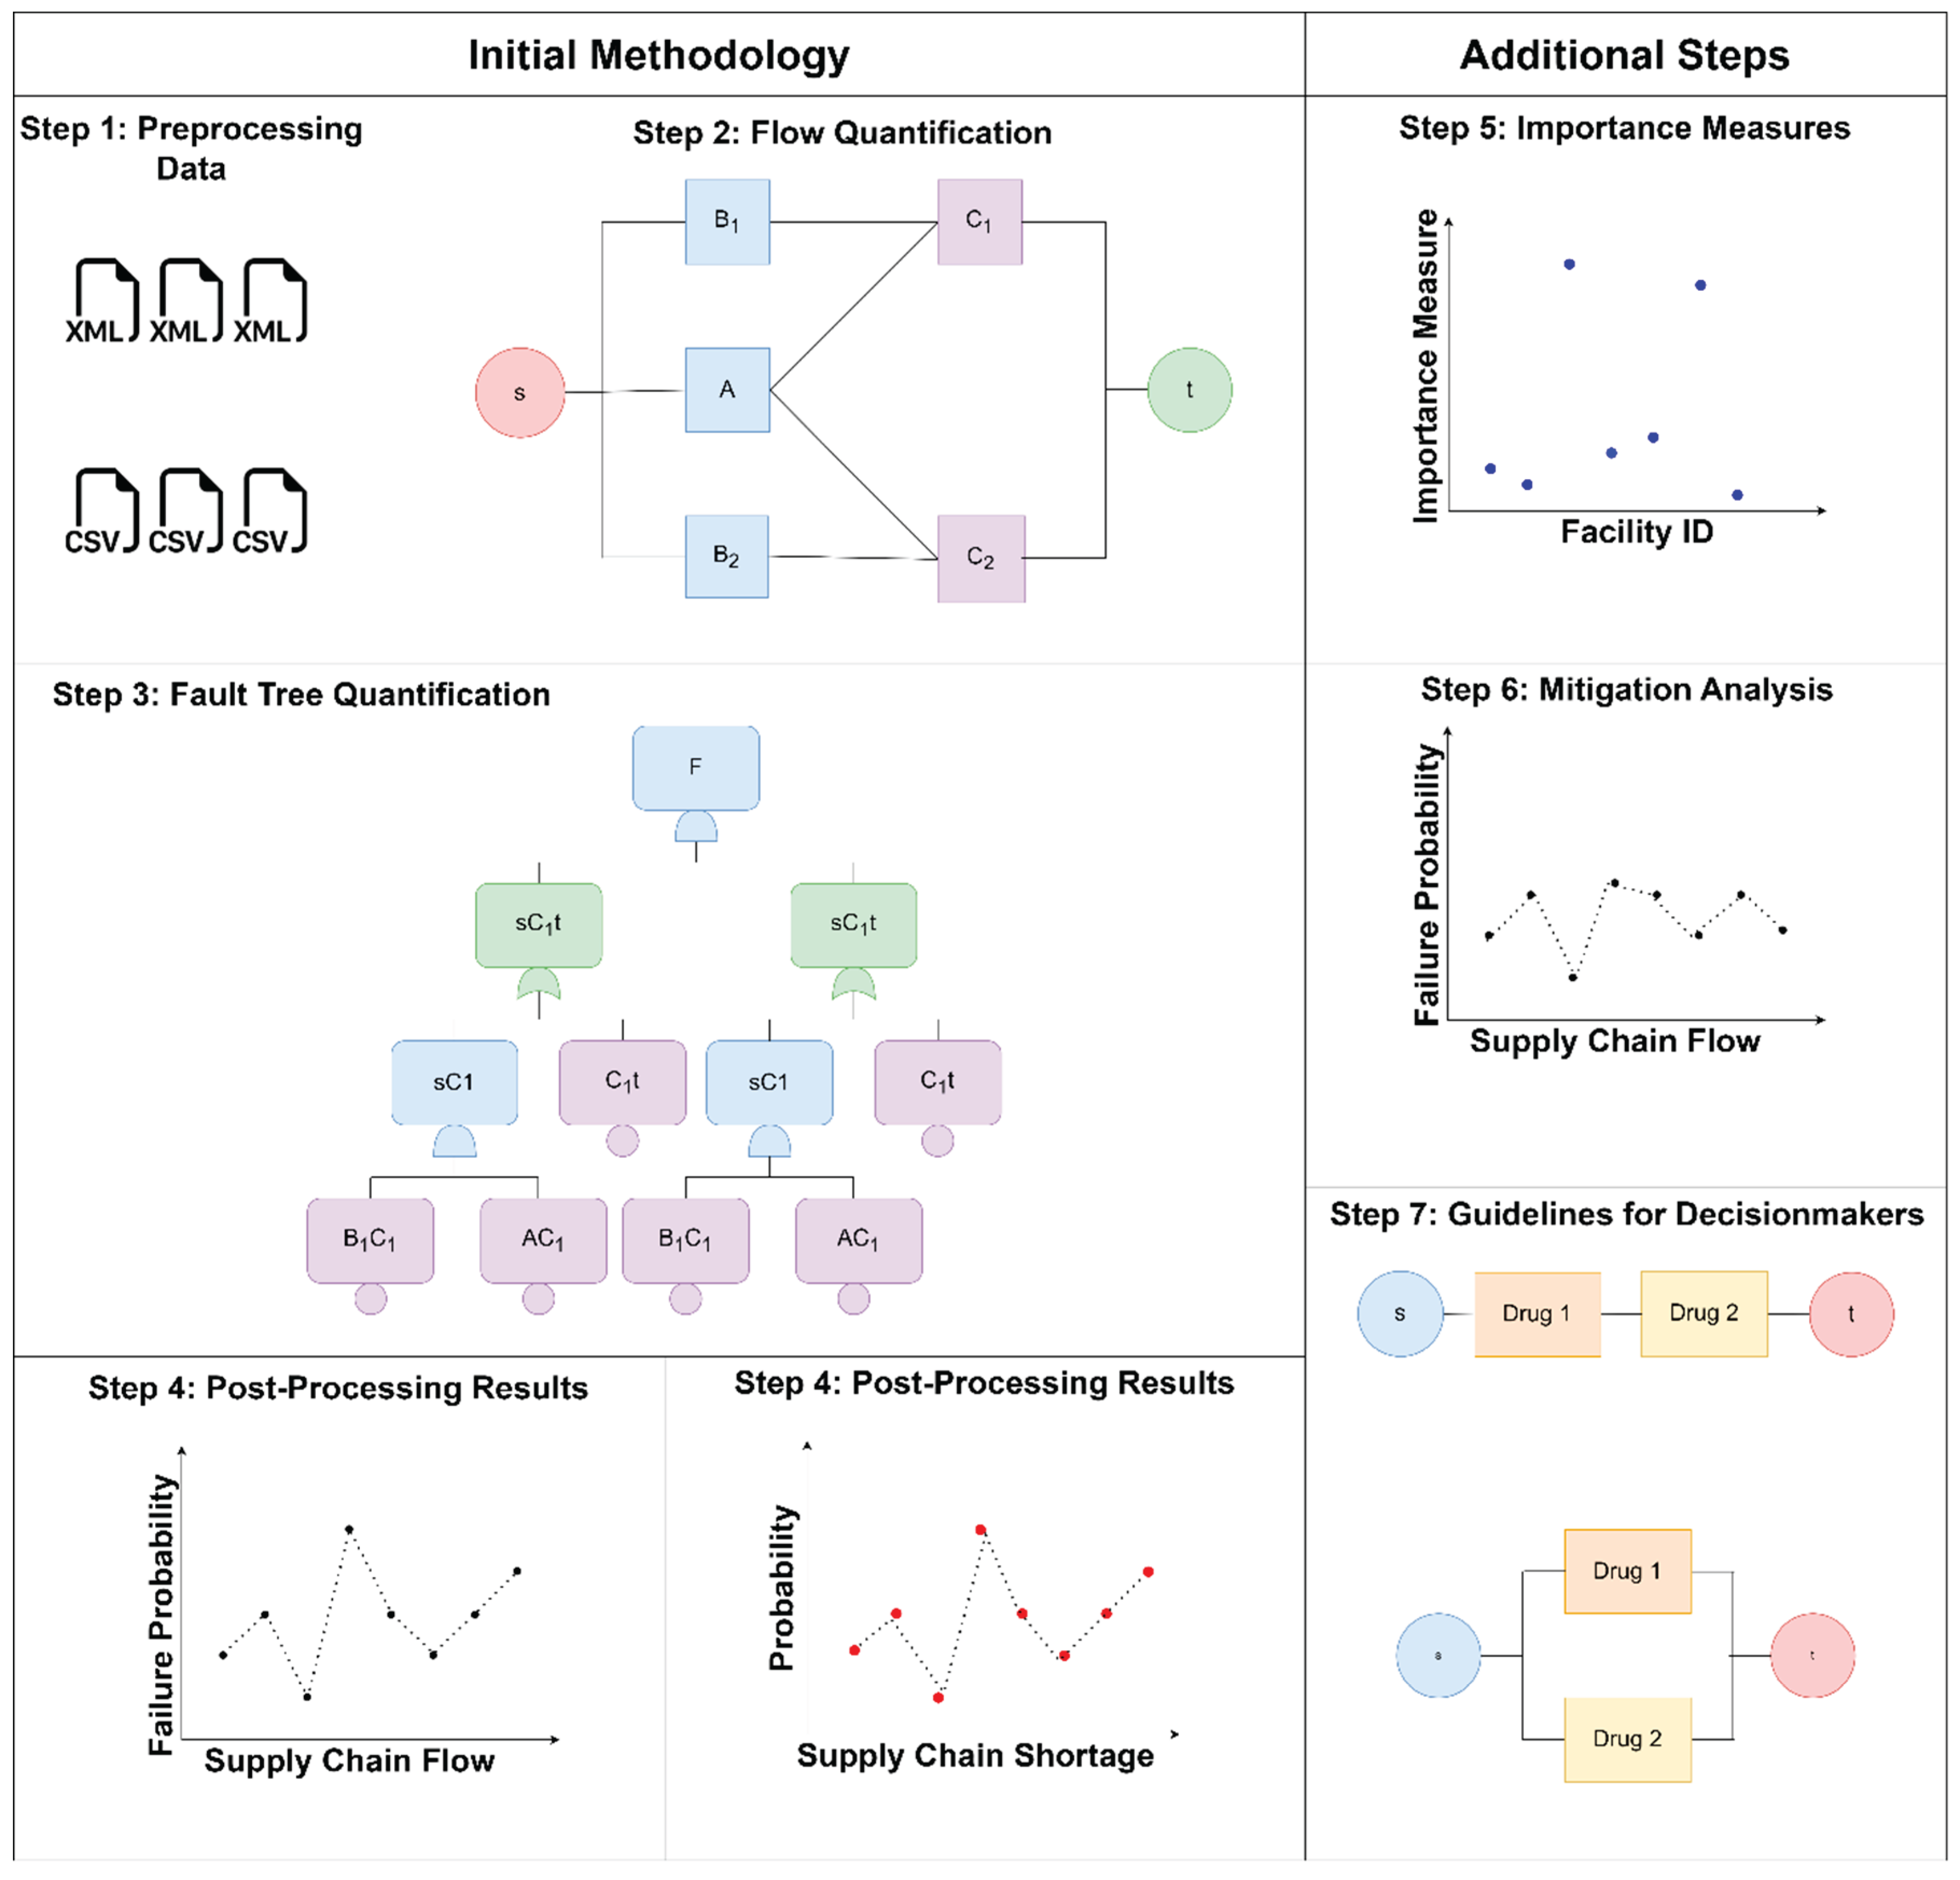
Figure 2.
Representation of Supply chains as Network Graphs.
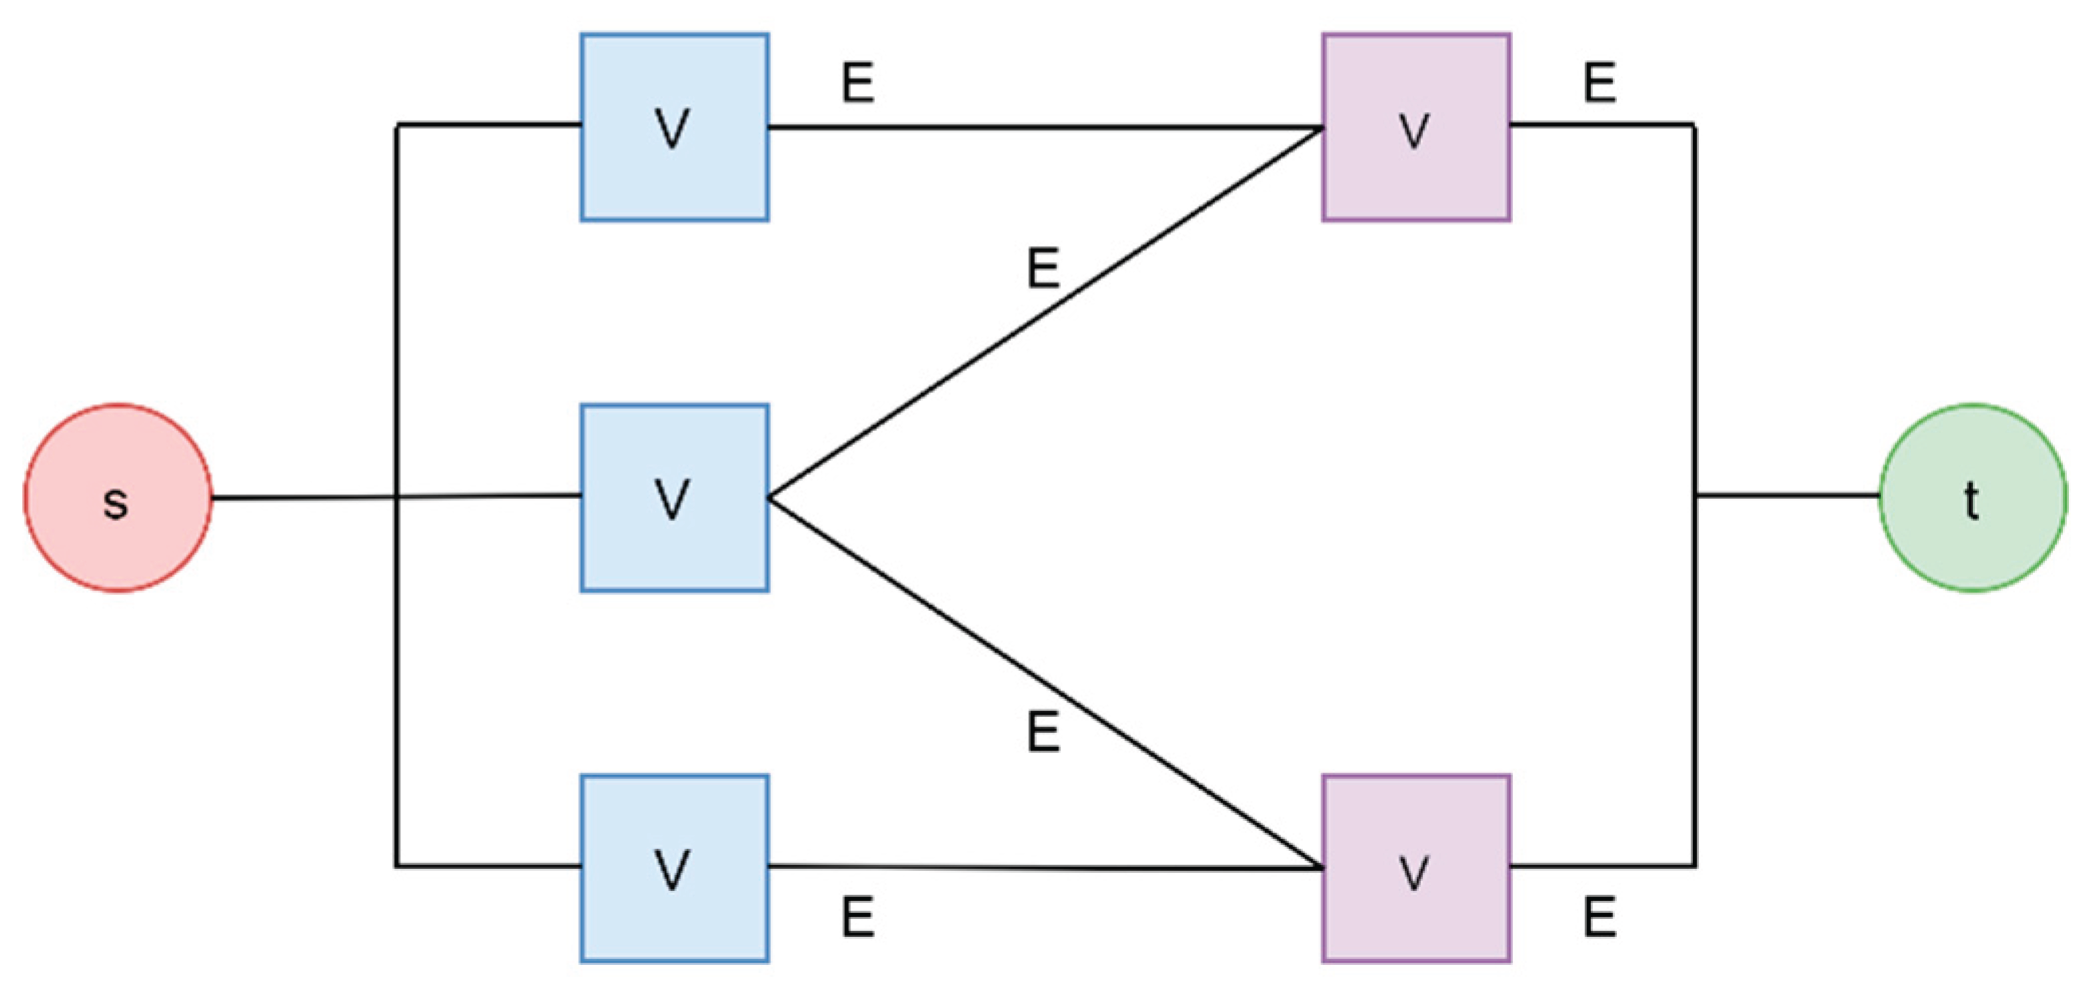
Figure 3.
Example of Network Graph Representation of Supply chains.
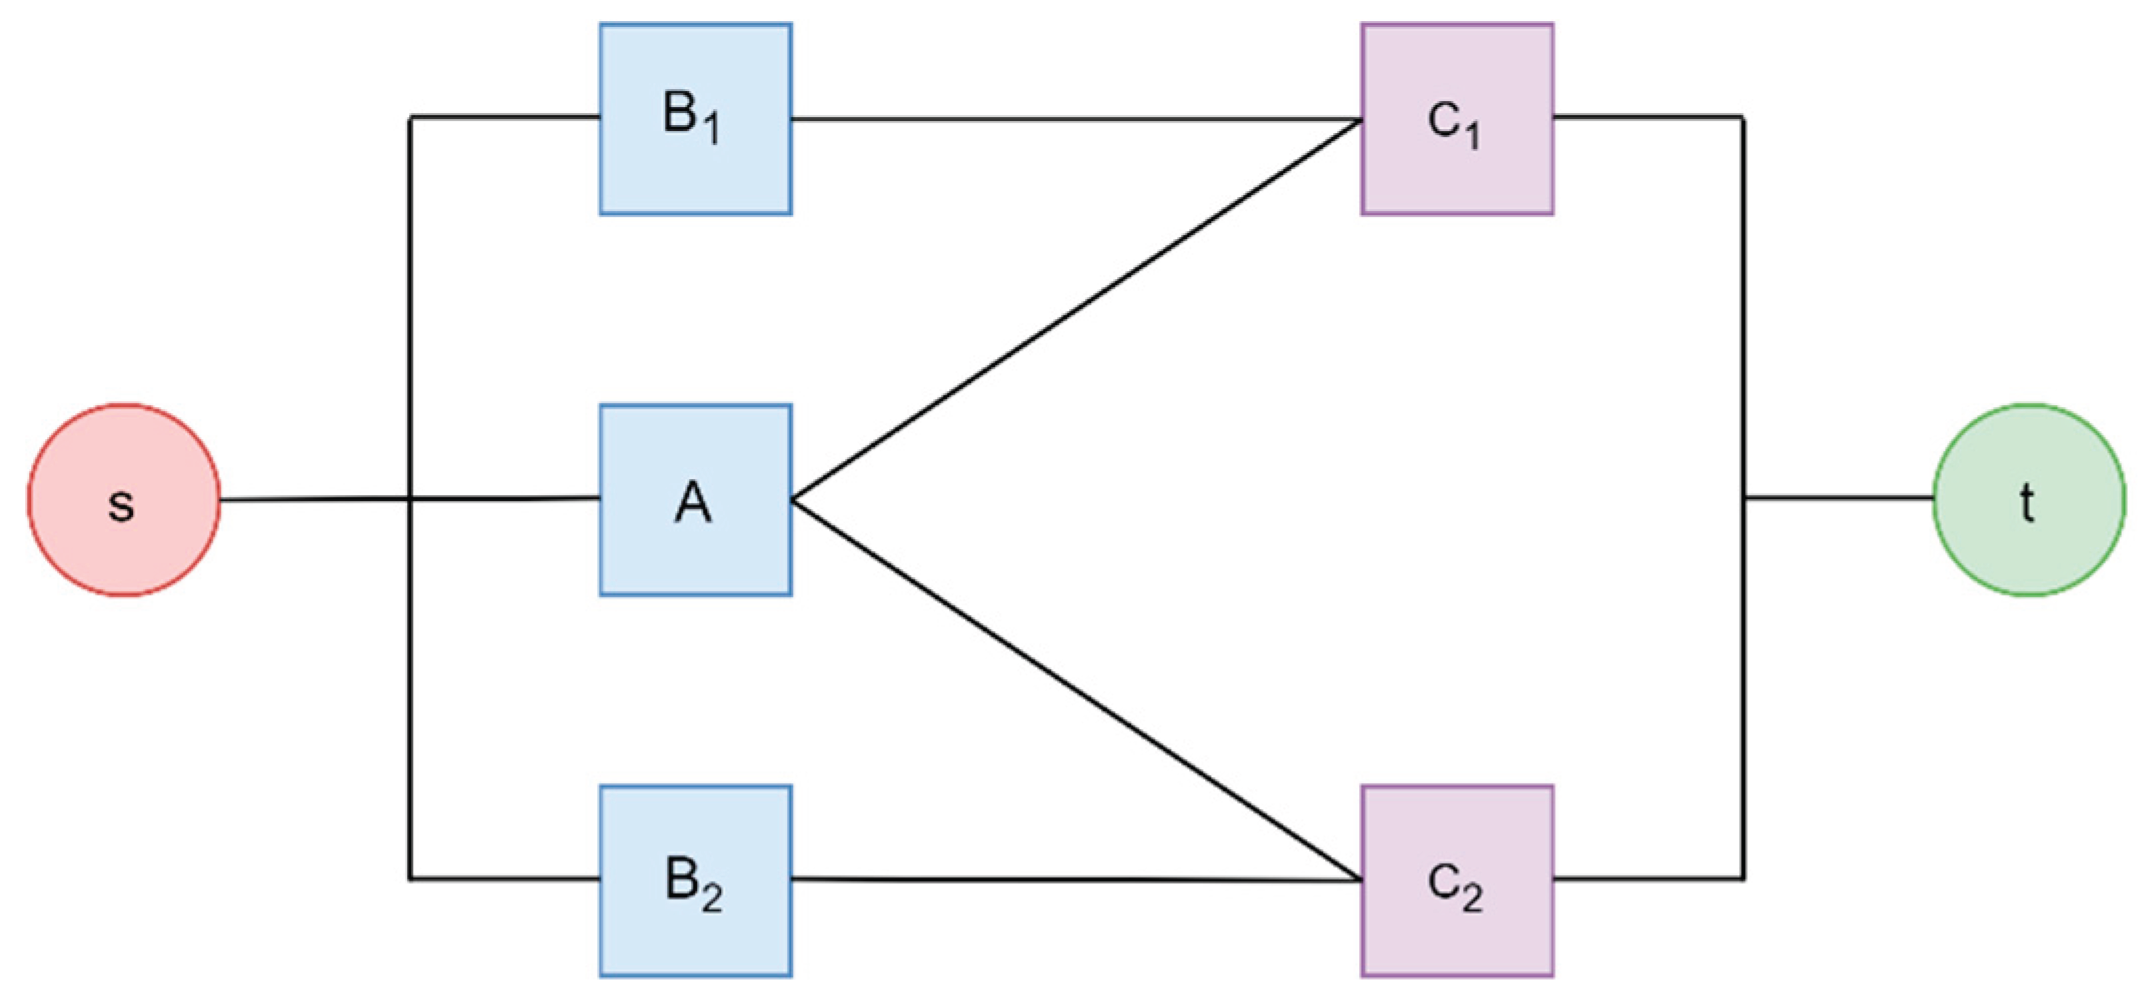
Figure 4.
Example of Fault Tree Representation of Supply Chains.
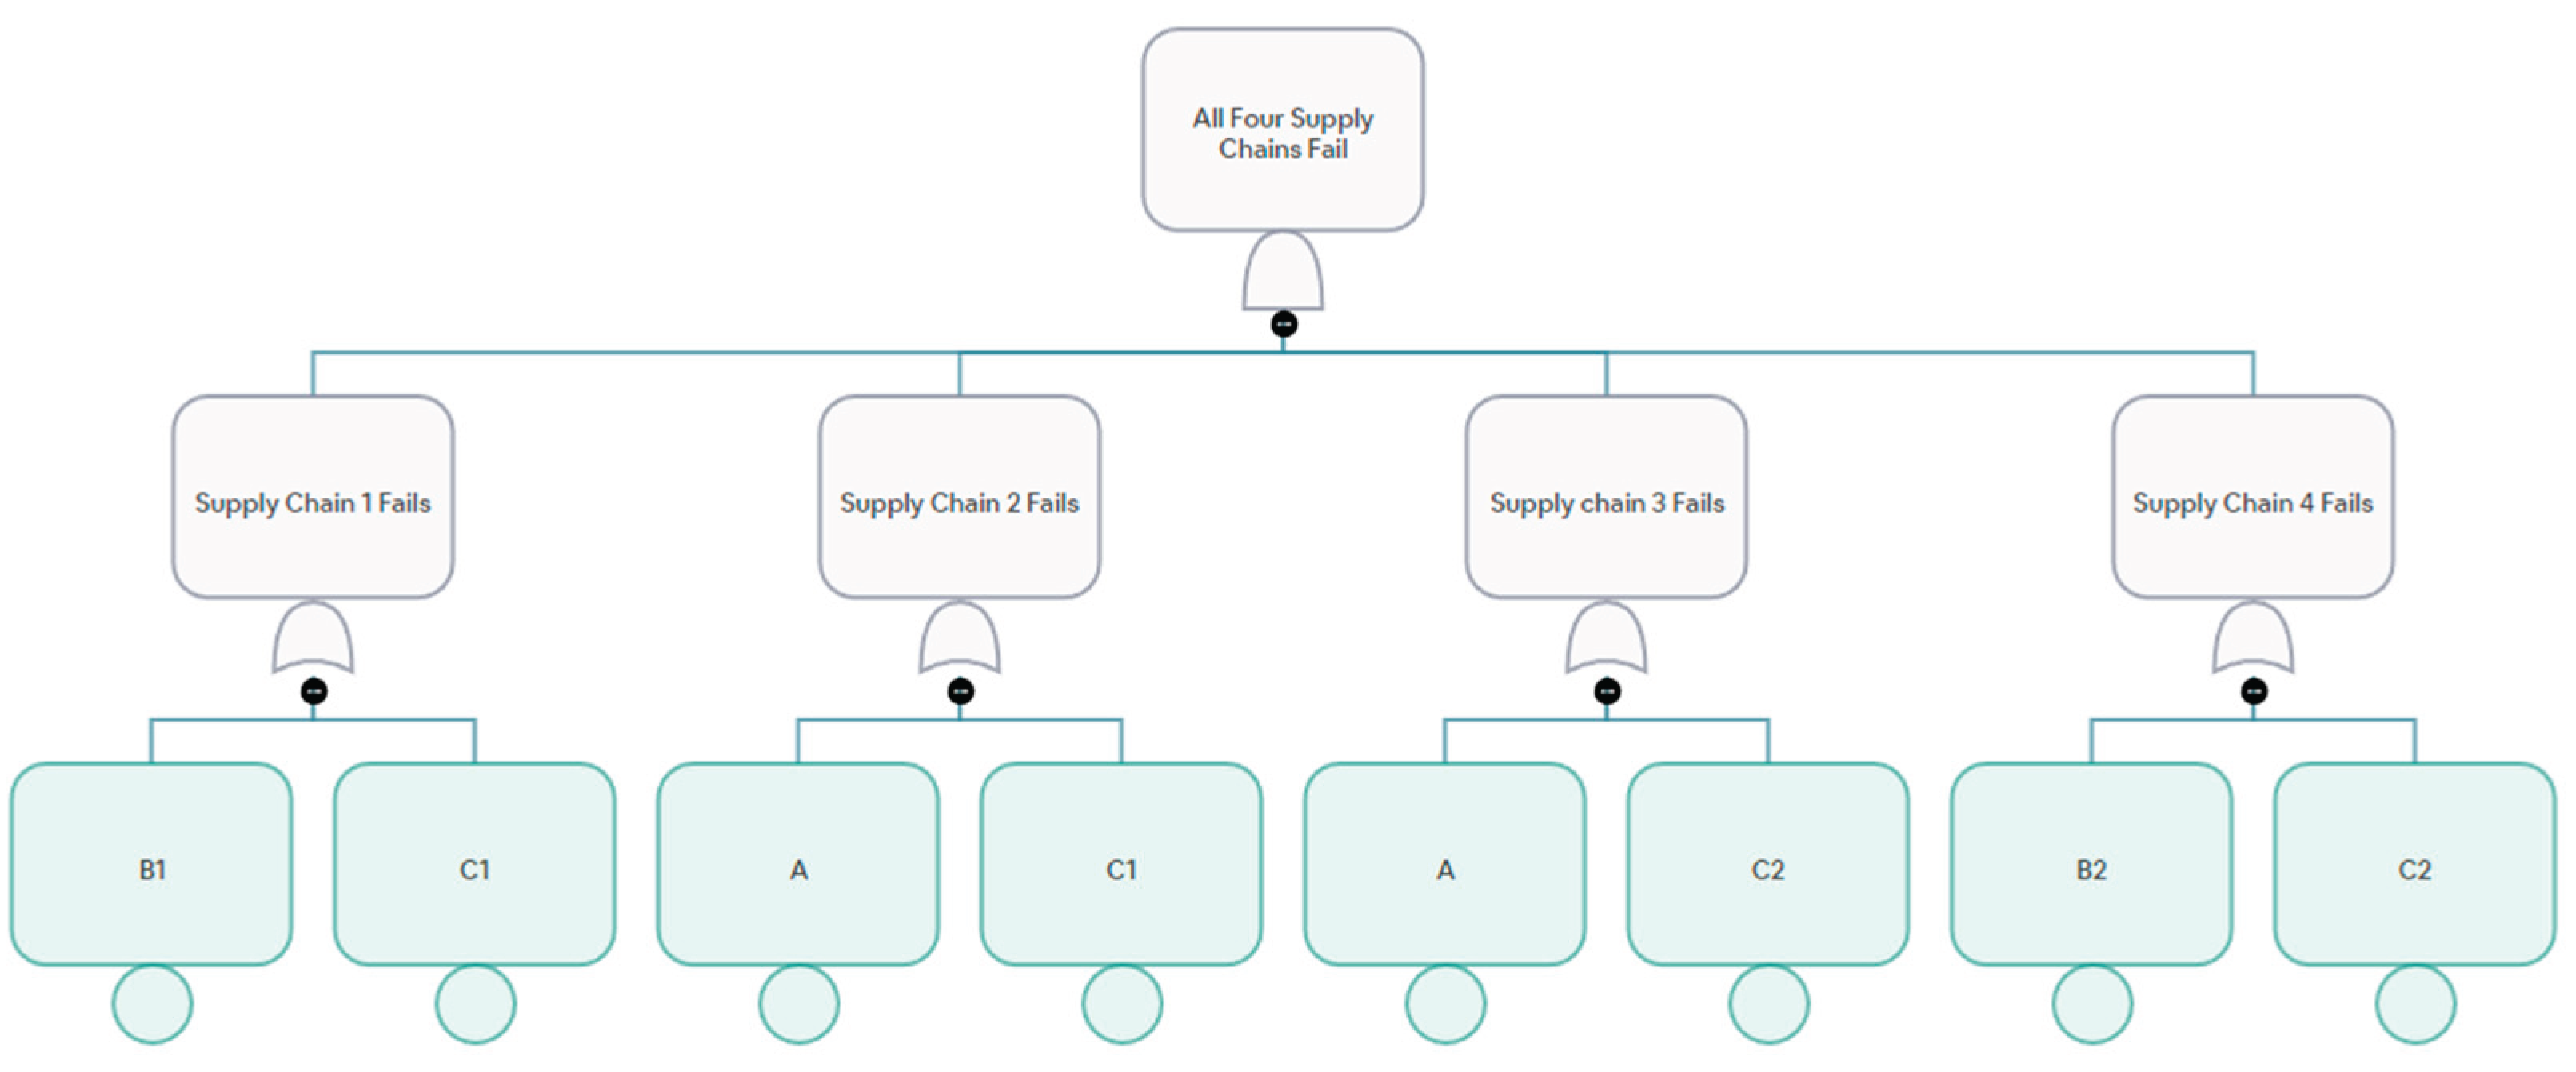
Figure 5.
Pharmaceutical Drug Supply Chain.
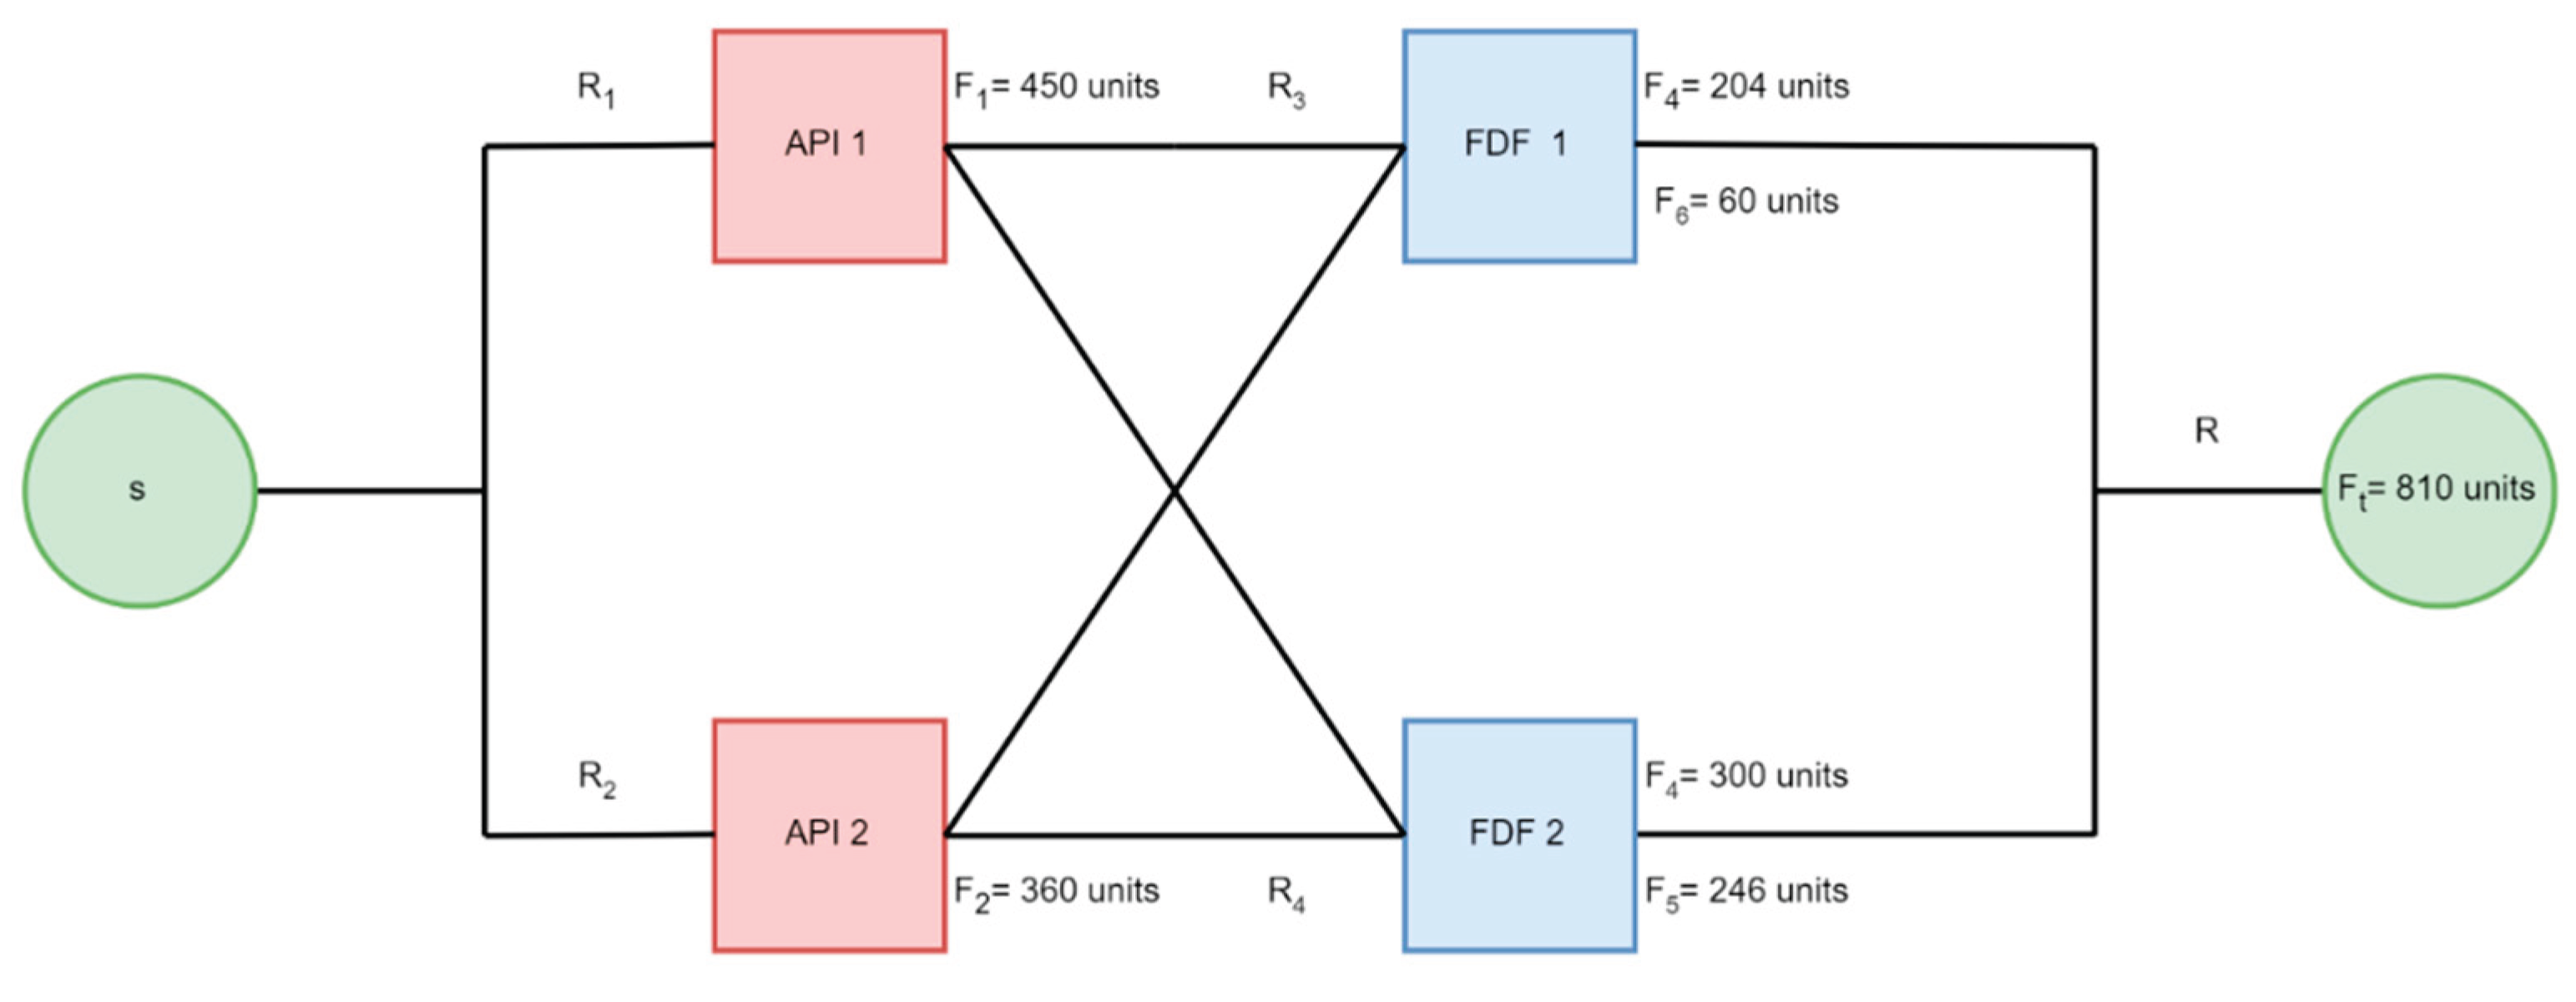
Figure 6.
Drug Supply Chain Fault Tree, generated in OpenPRA.
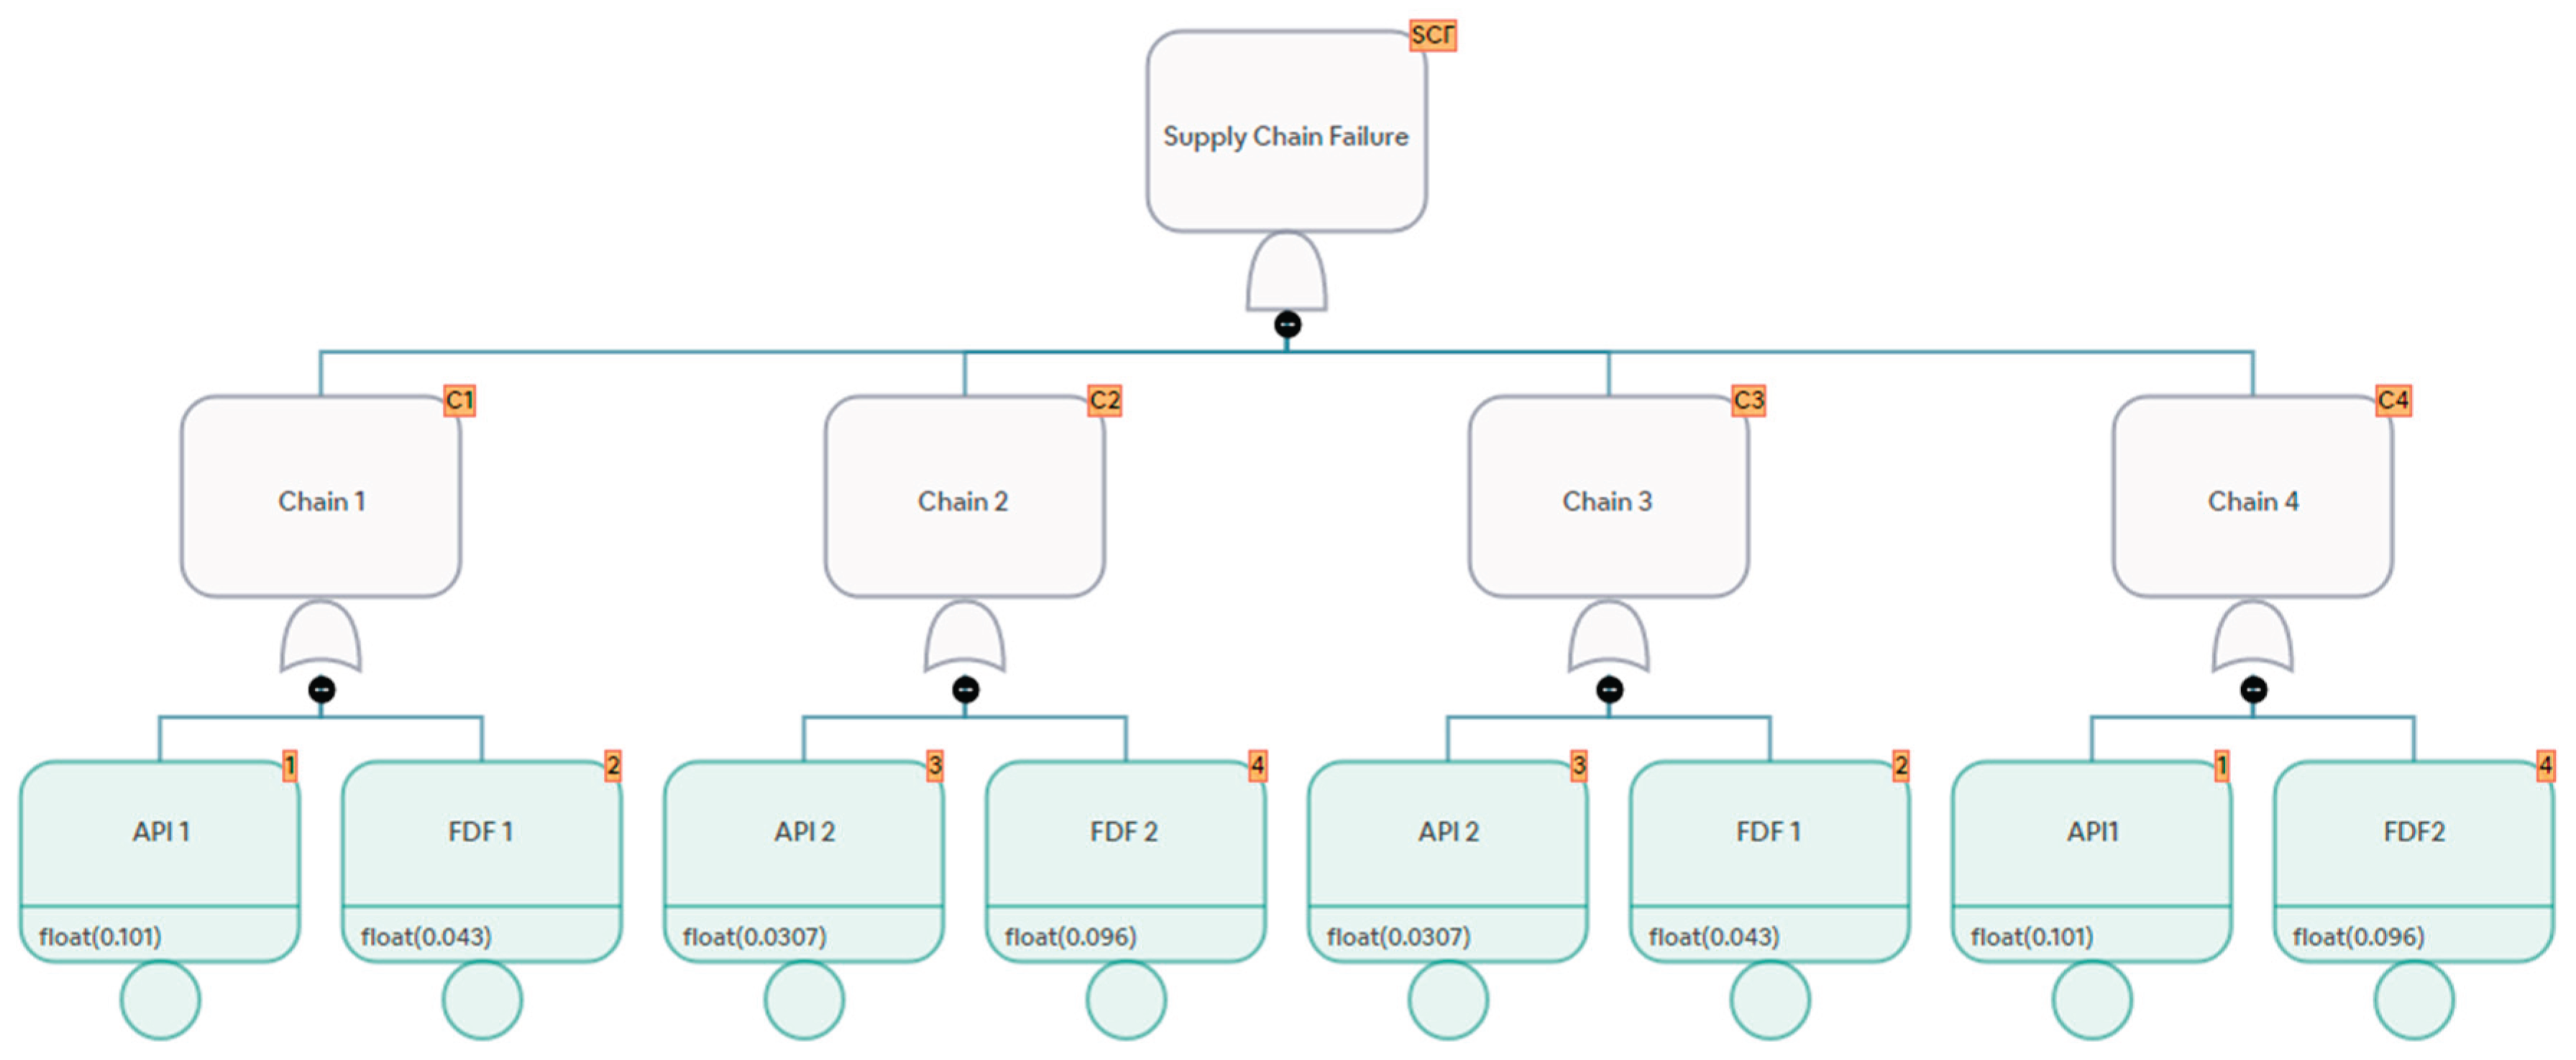
Figure 7.
Modeling Backup and Shared Facilities.
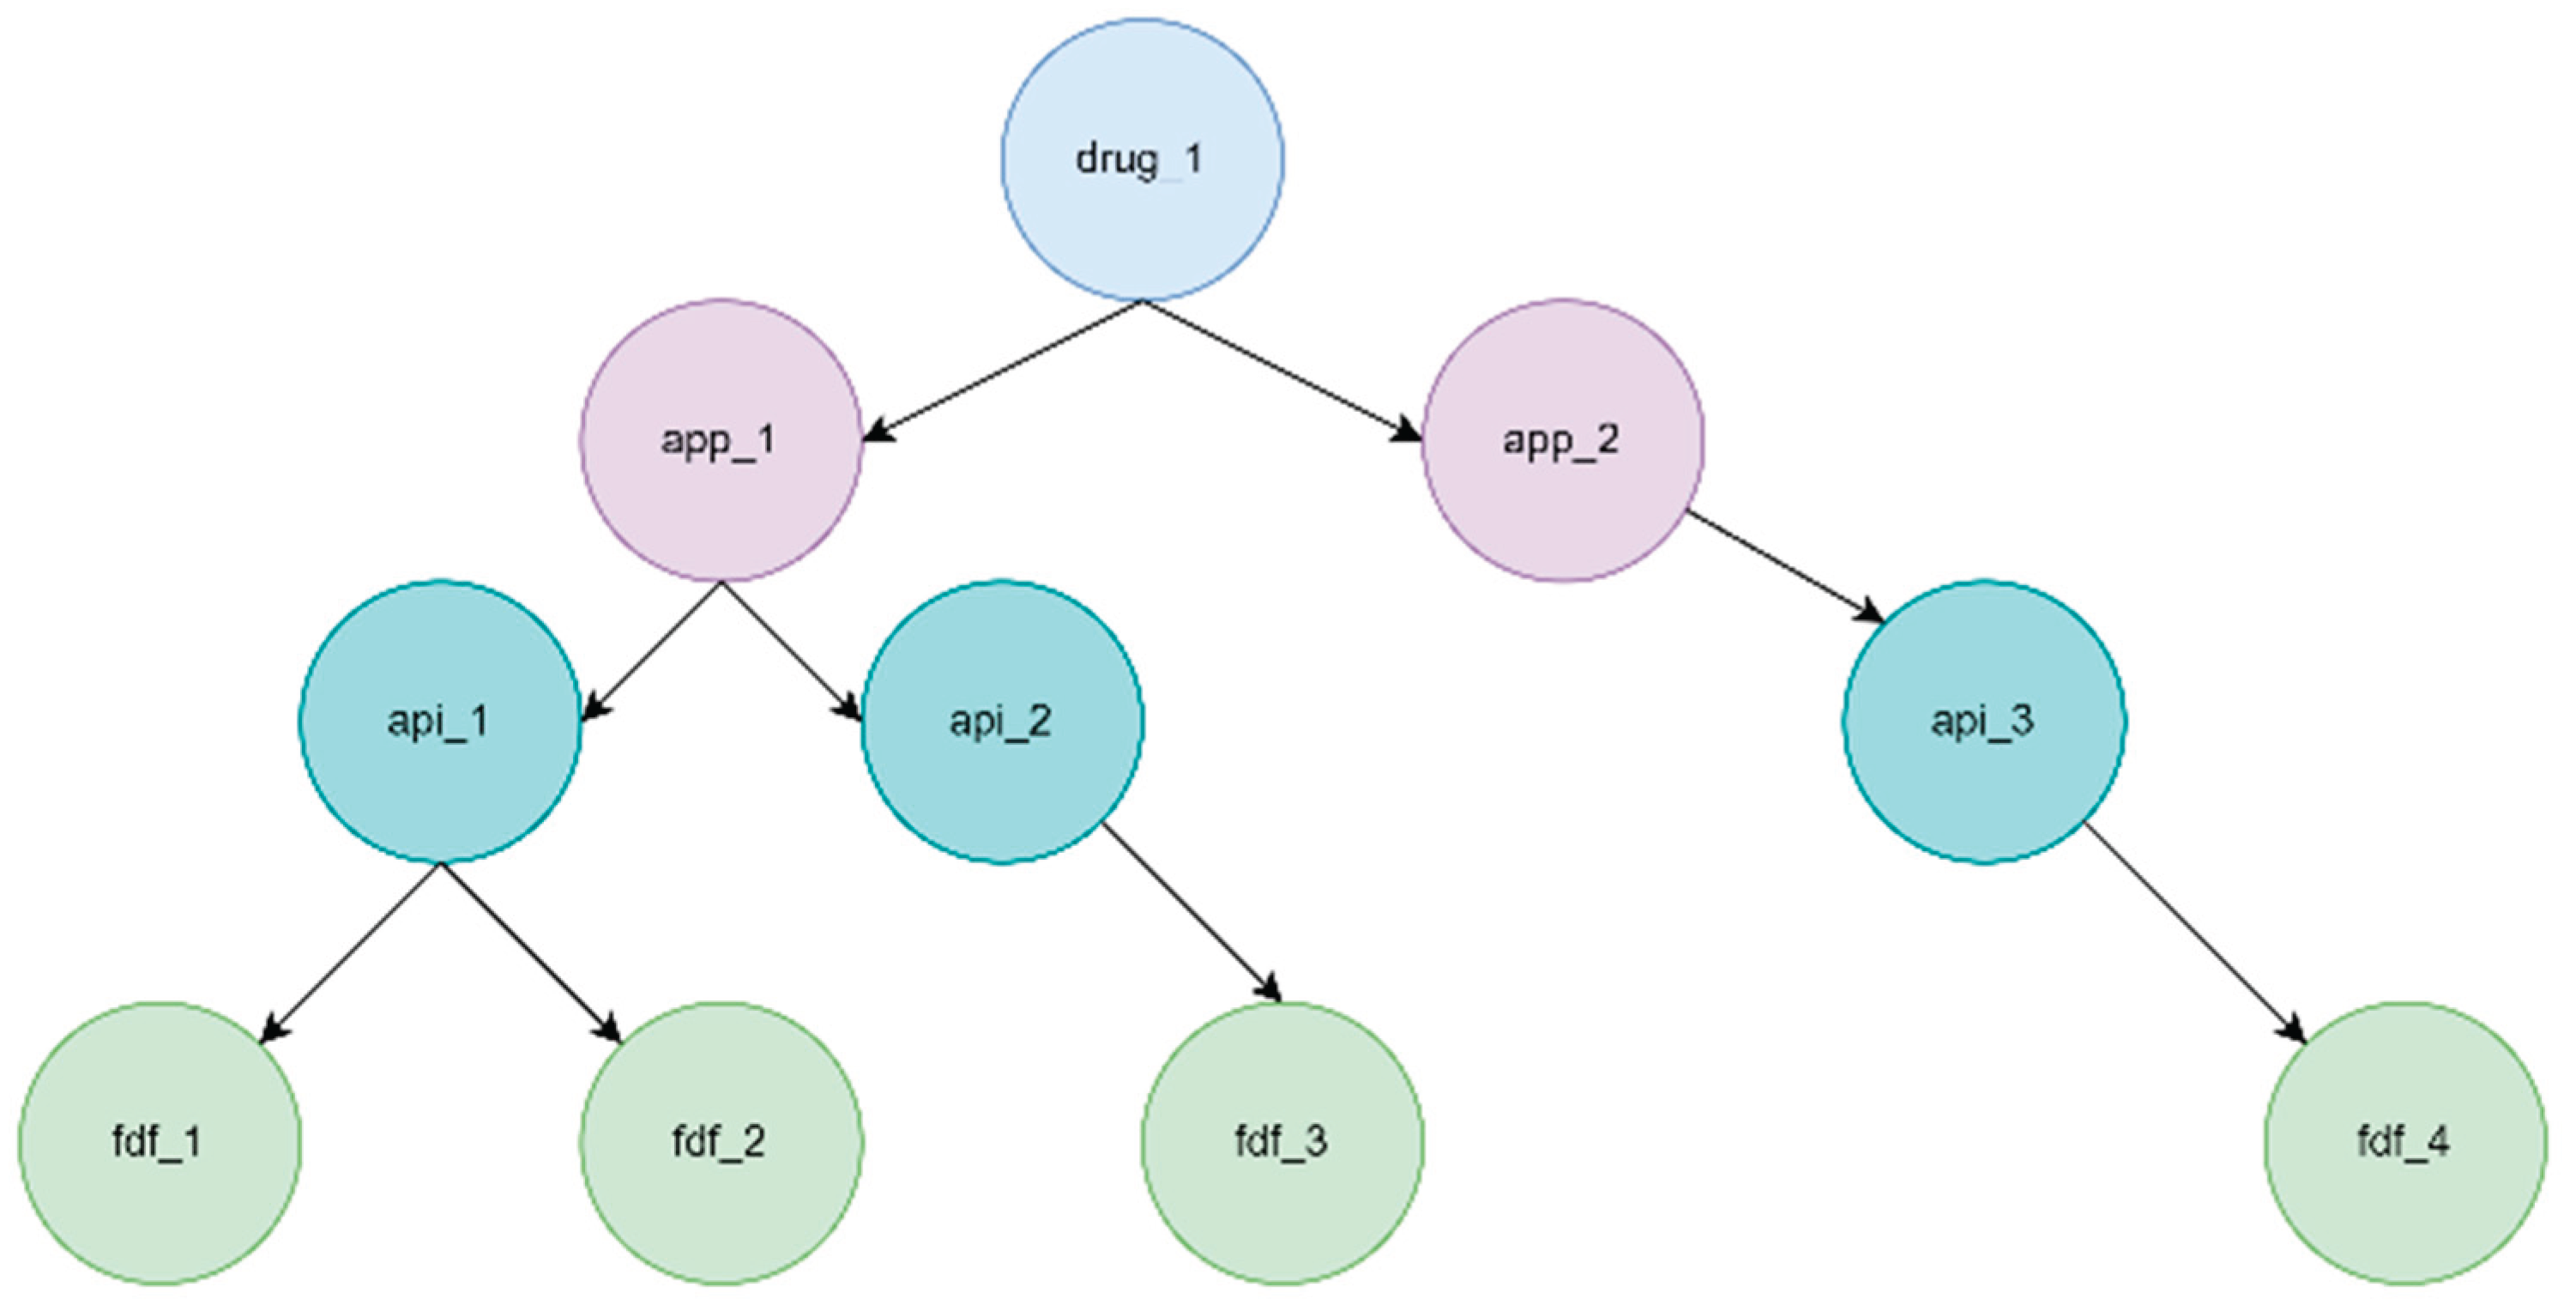
Figure 8.
Fault Tree for Modeling Backup and Shared Facilities.
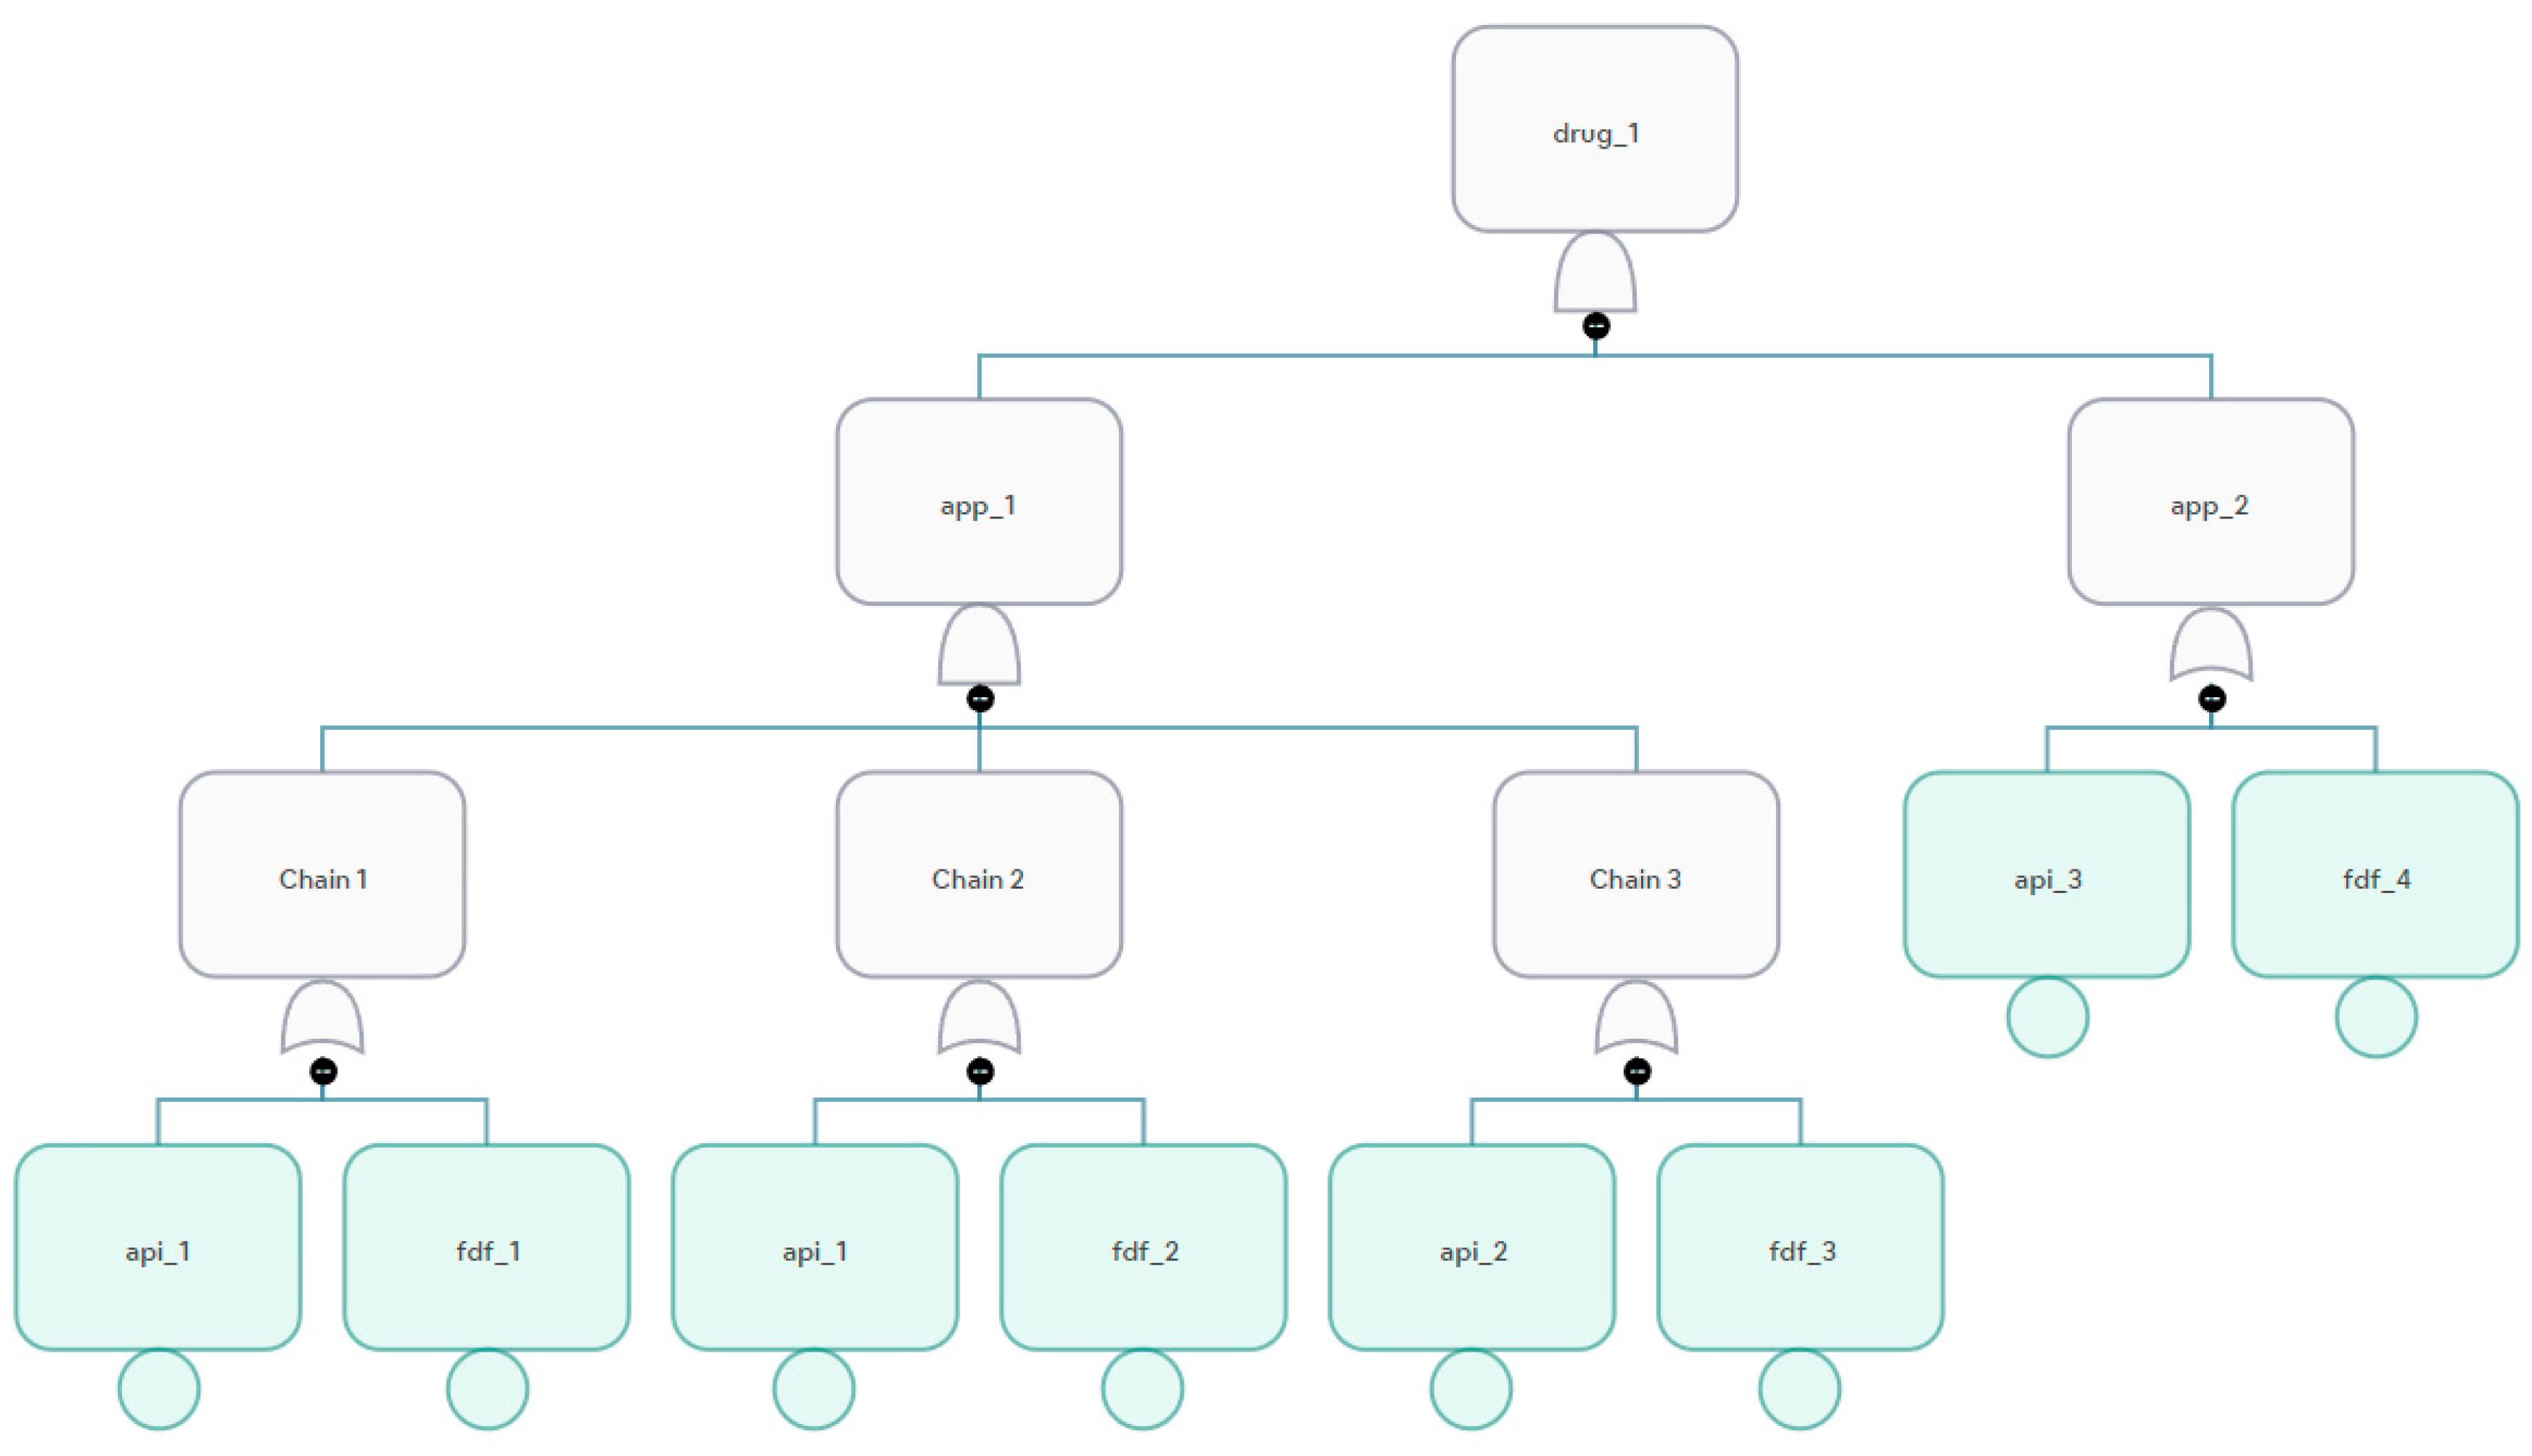
Figure 9.
Single Child Corner Case.
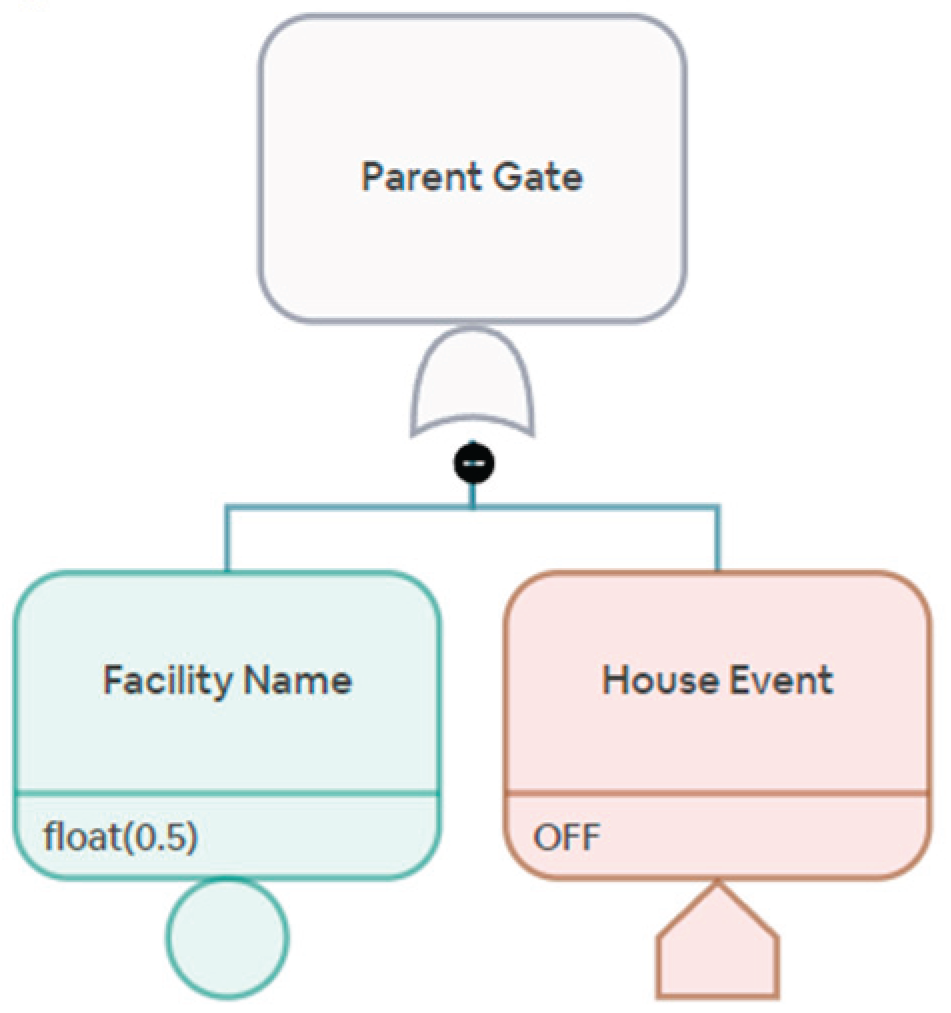
Figure 10.
Example of a Treatment Plan with More Than One Requisite Drug
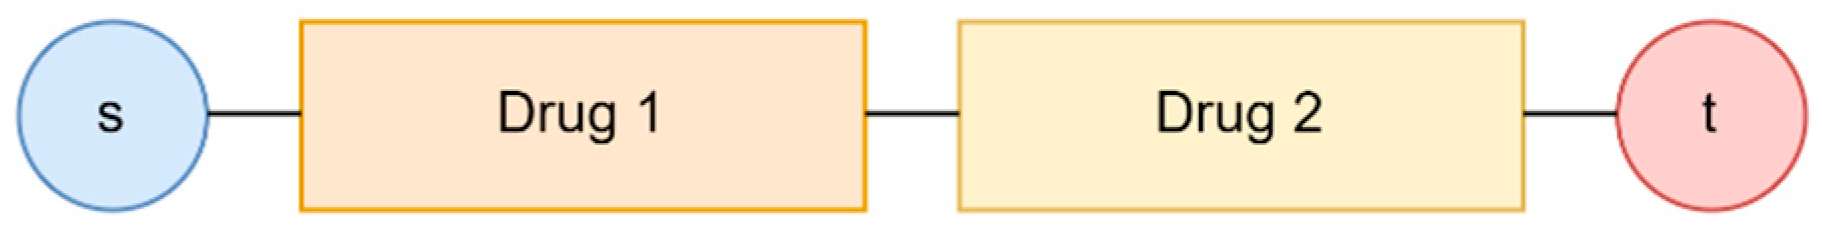
Figure 11.
Fault Tree for Treatment Plan with More Than One Necessary Drug
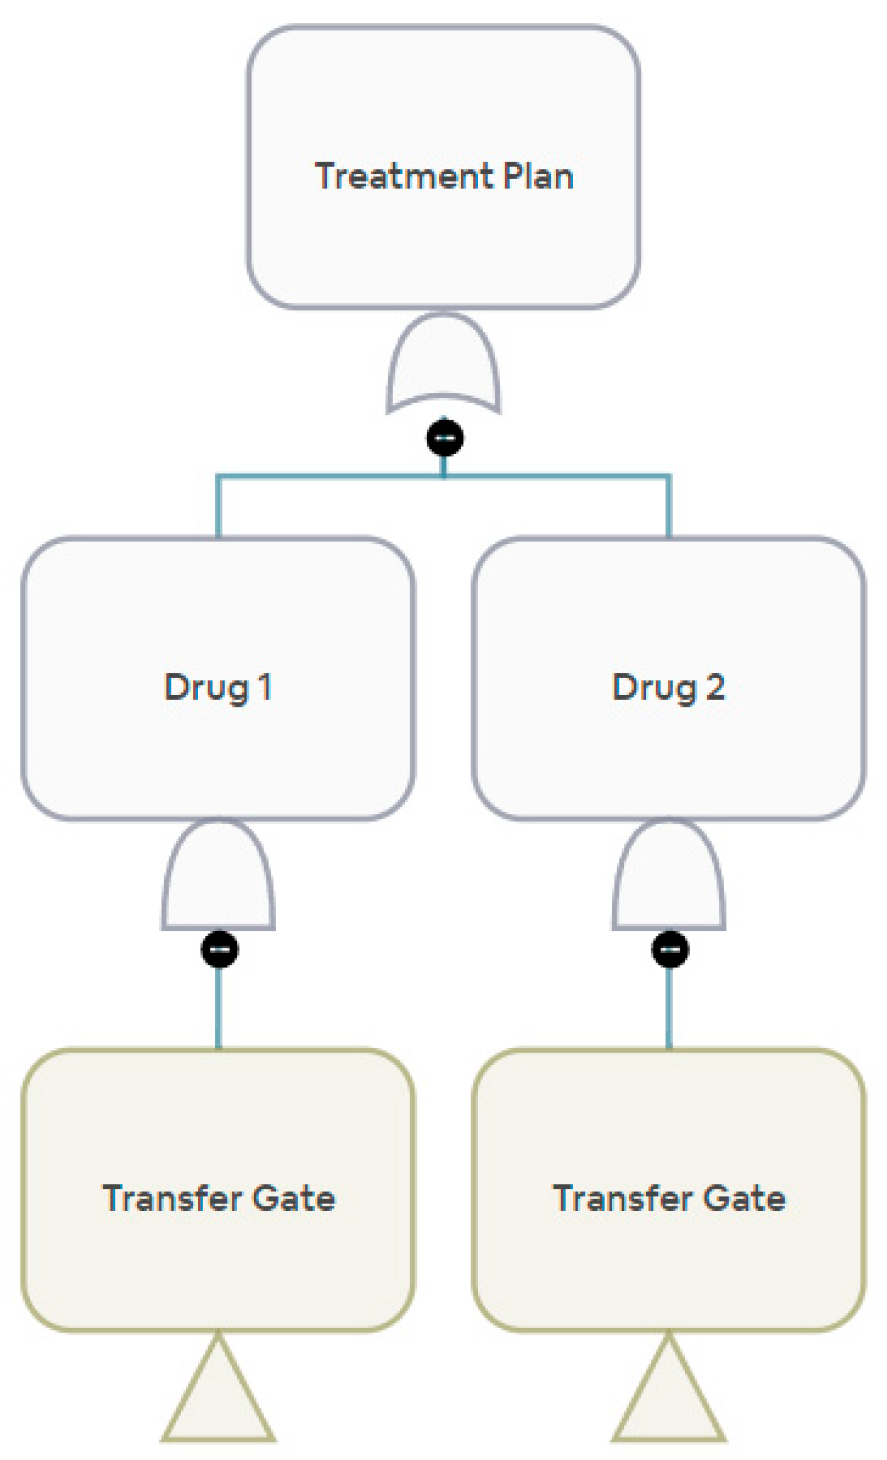
Figure 12.
Drug Sourcing Plan with Allowed Substitutions
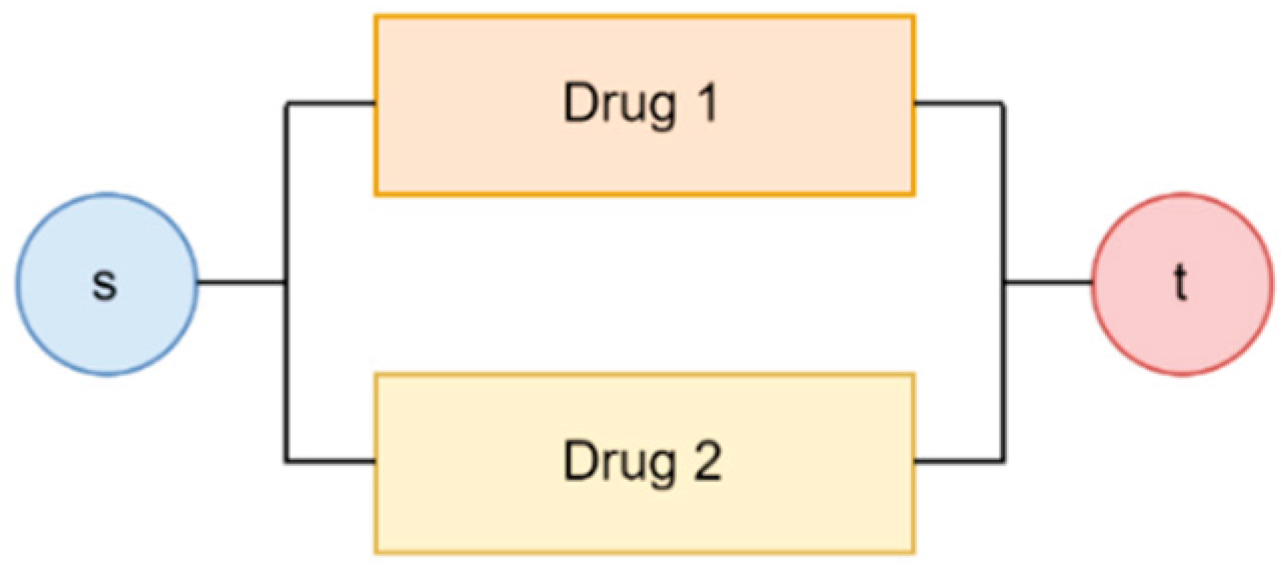
Figure 13.
Fault Tree for Treatment Plan with More Than One Acceptable Drug
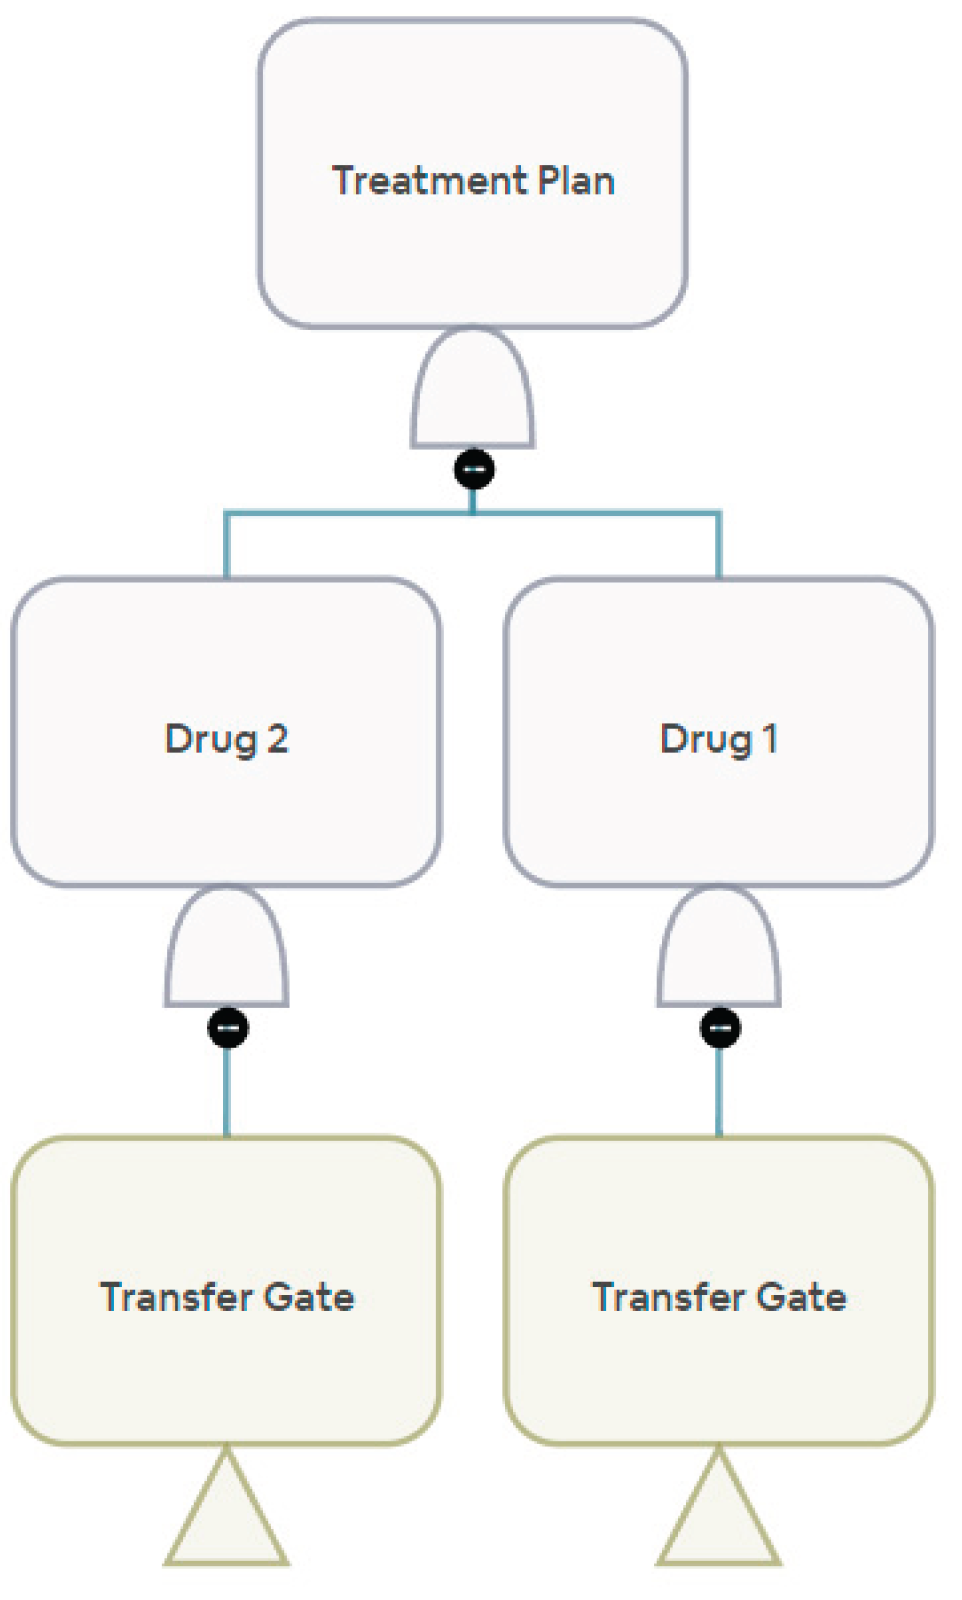
Figure 14.
Drug Supply Failure Probabilities with and without Backup.
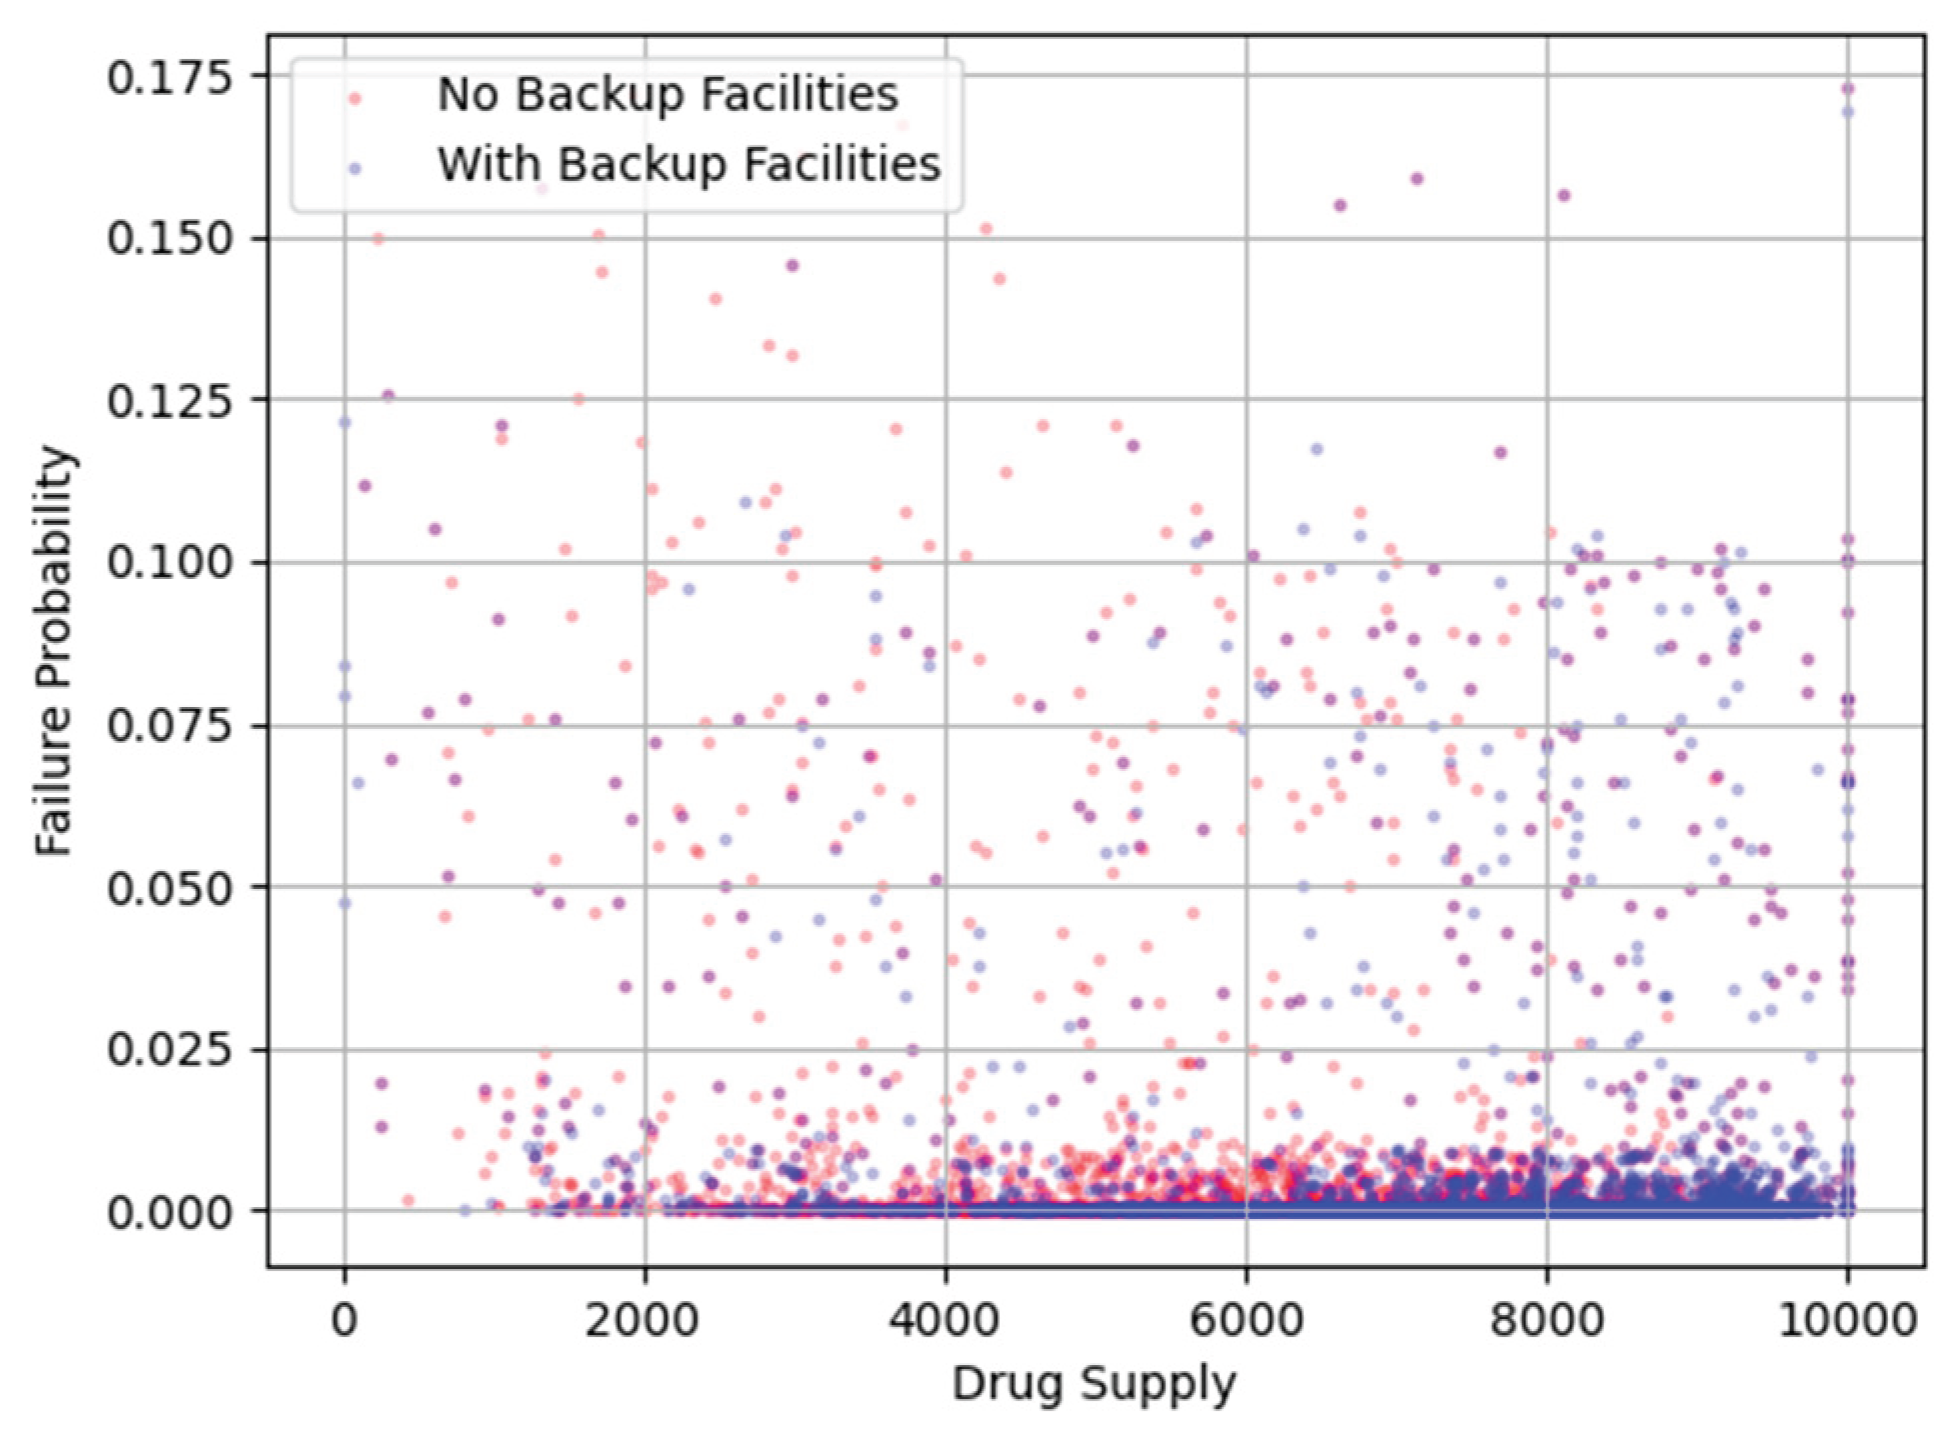
Figure 15.
Histogram of Supply Chain Failure Probability, without Backups.
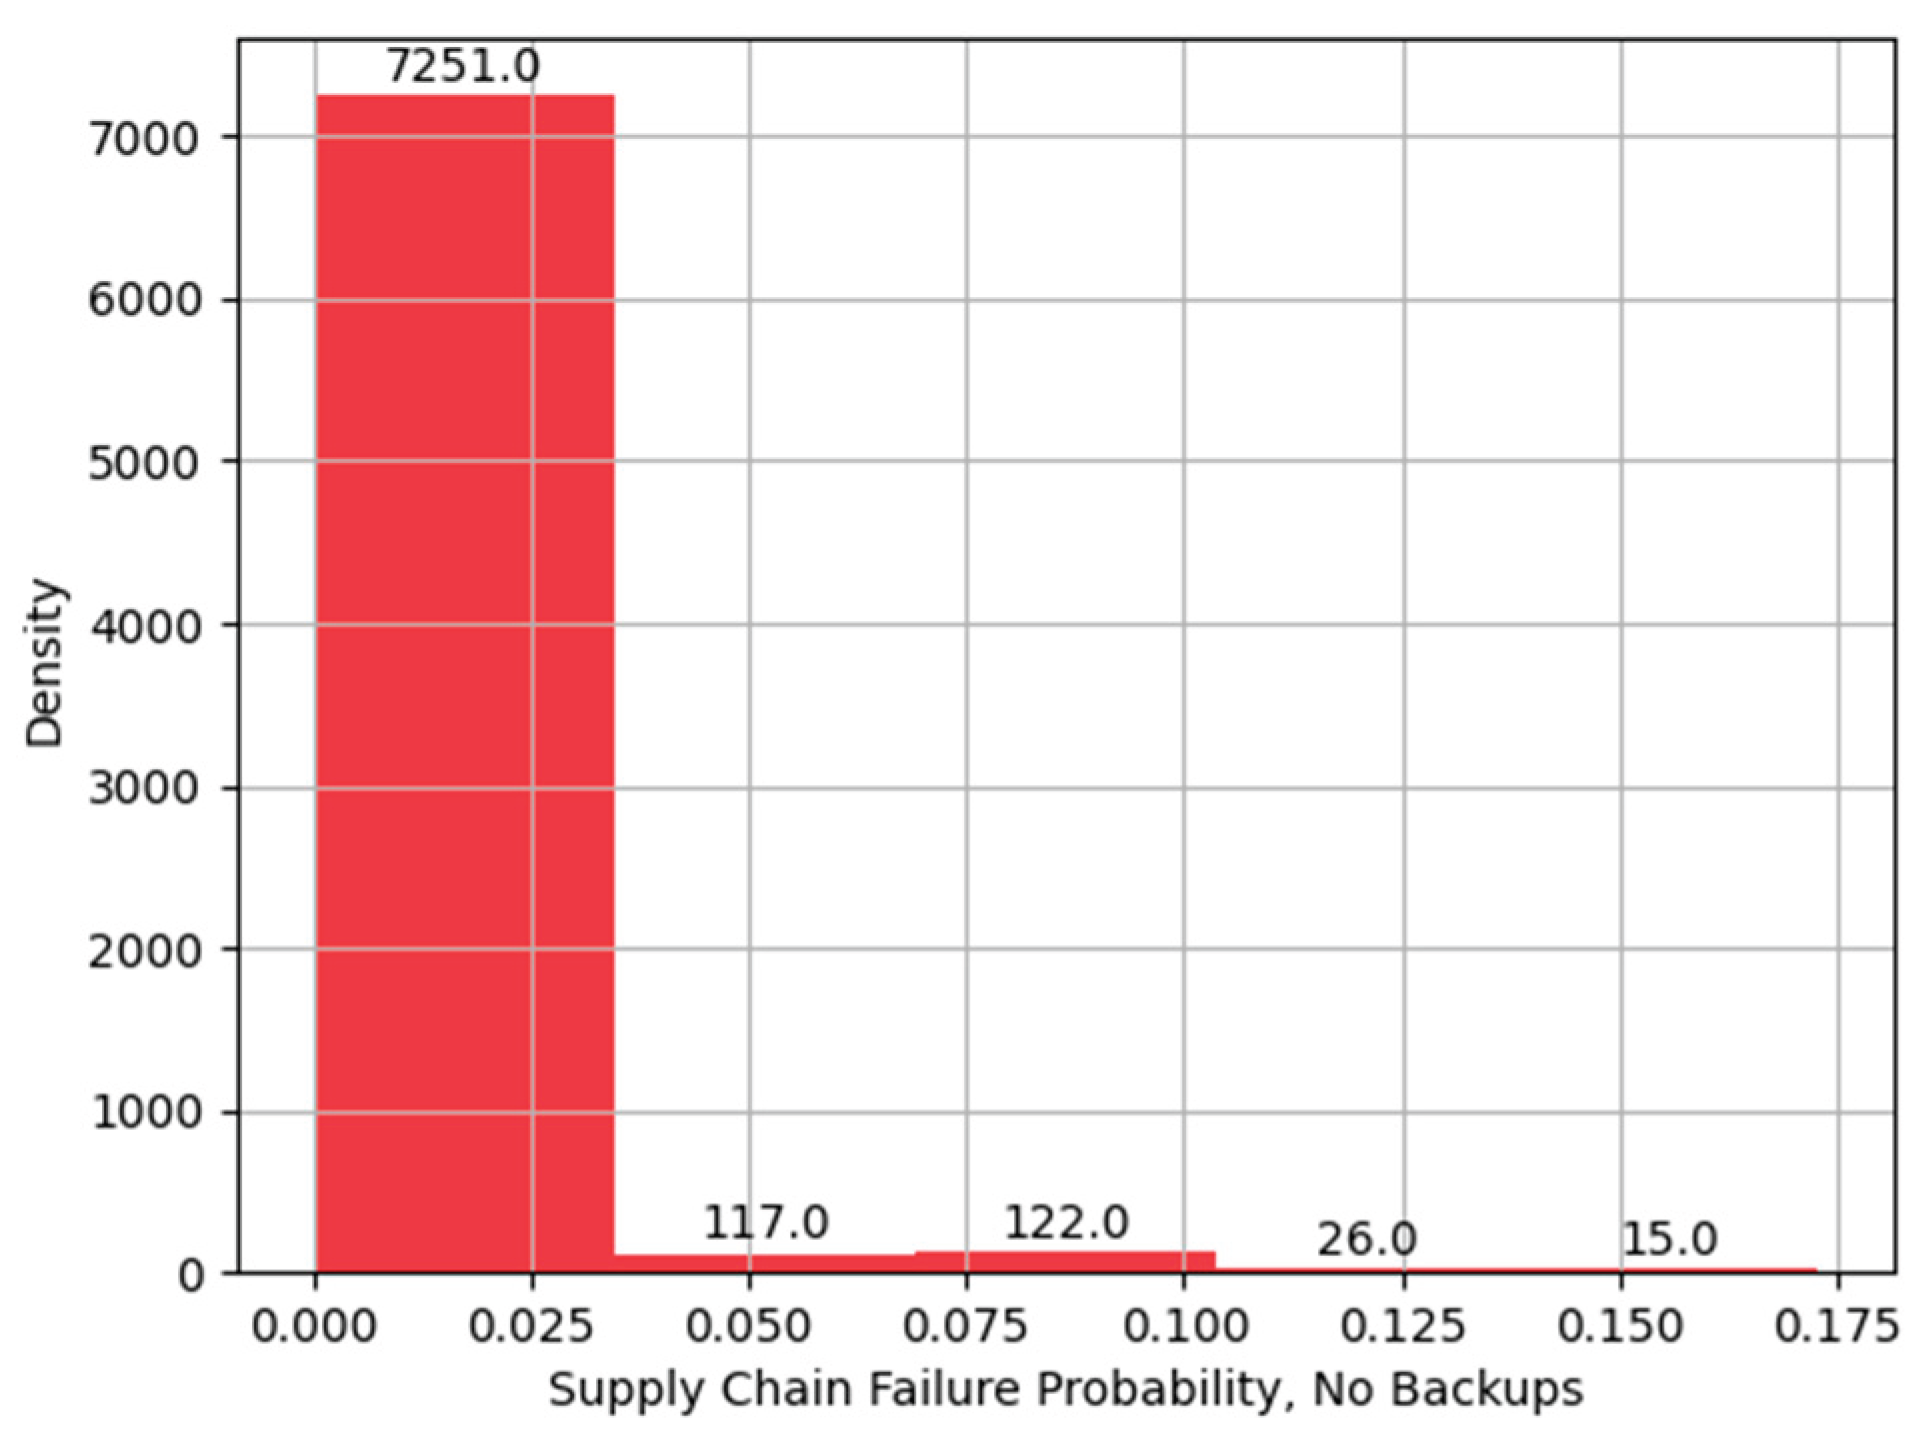
Figure 16.
Histogram of Supply Chain Failure, with Backups.
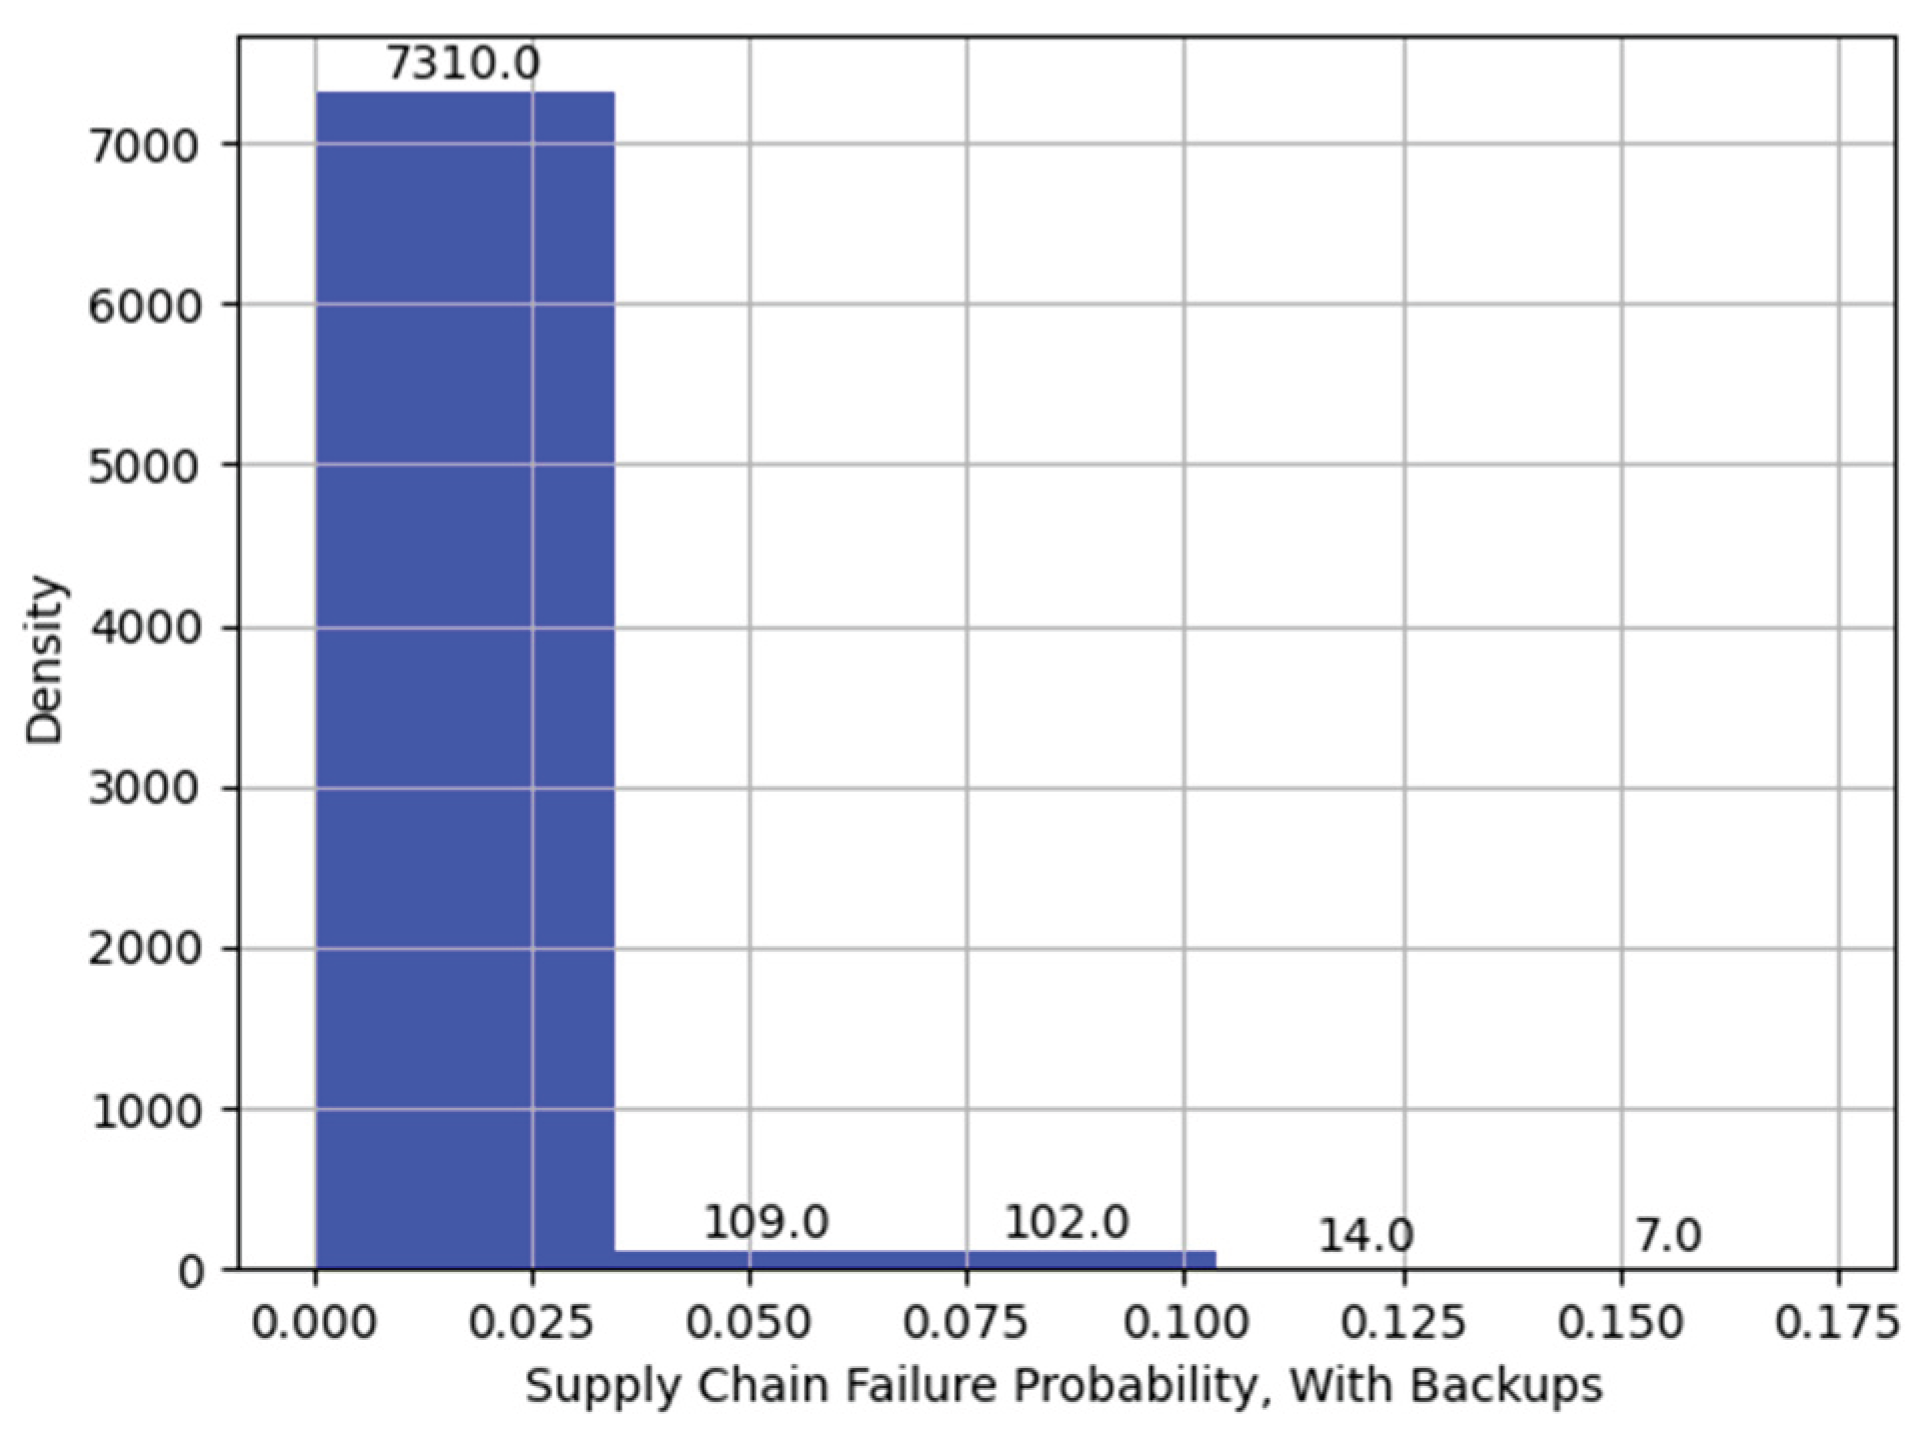
Figure 17.
Histogram of Percent Reduction in Failure Probability.
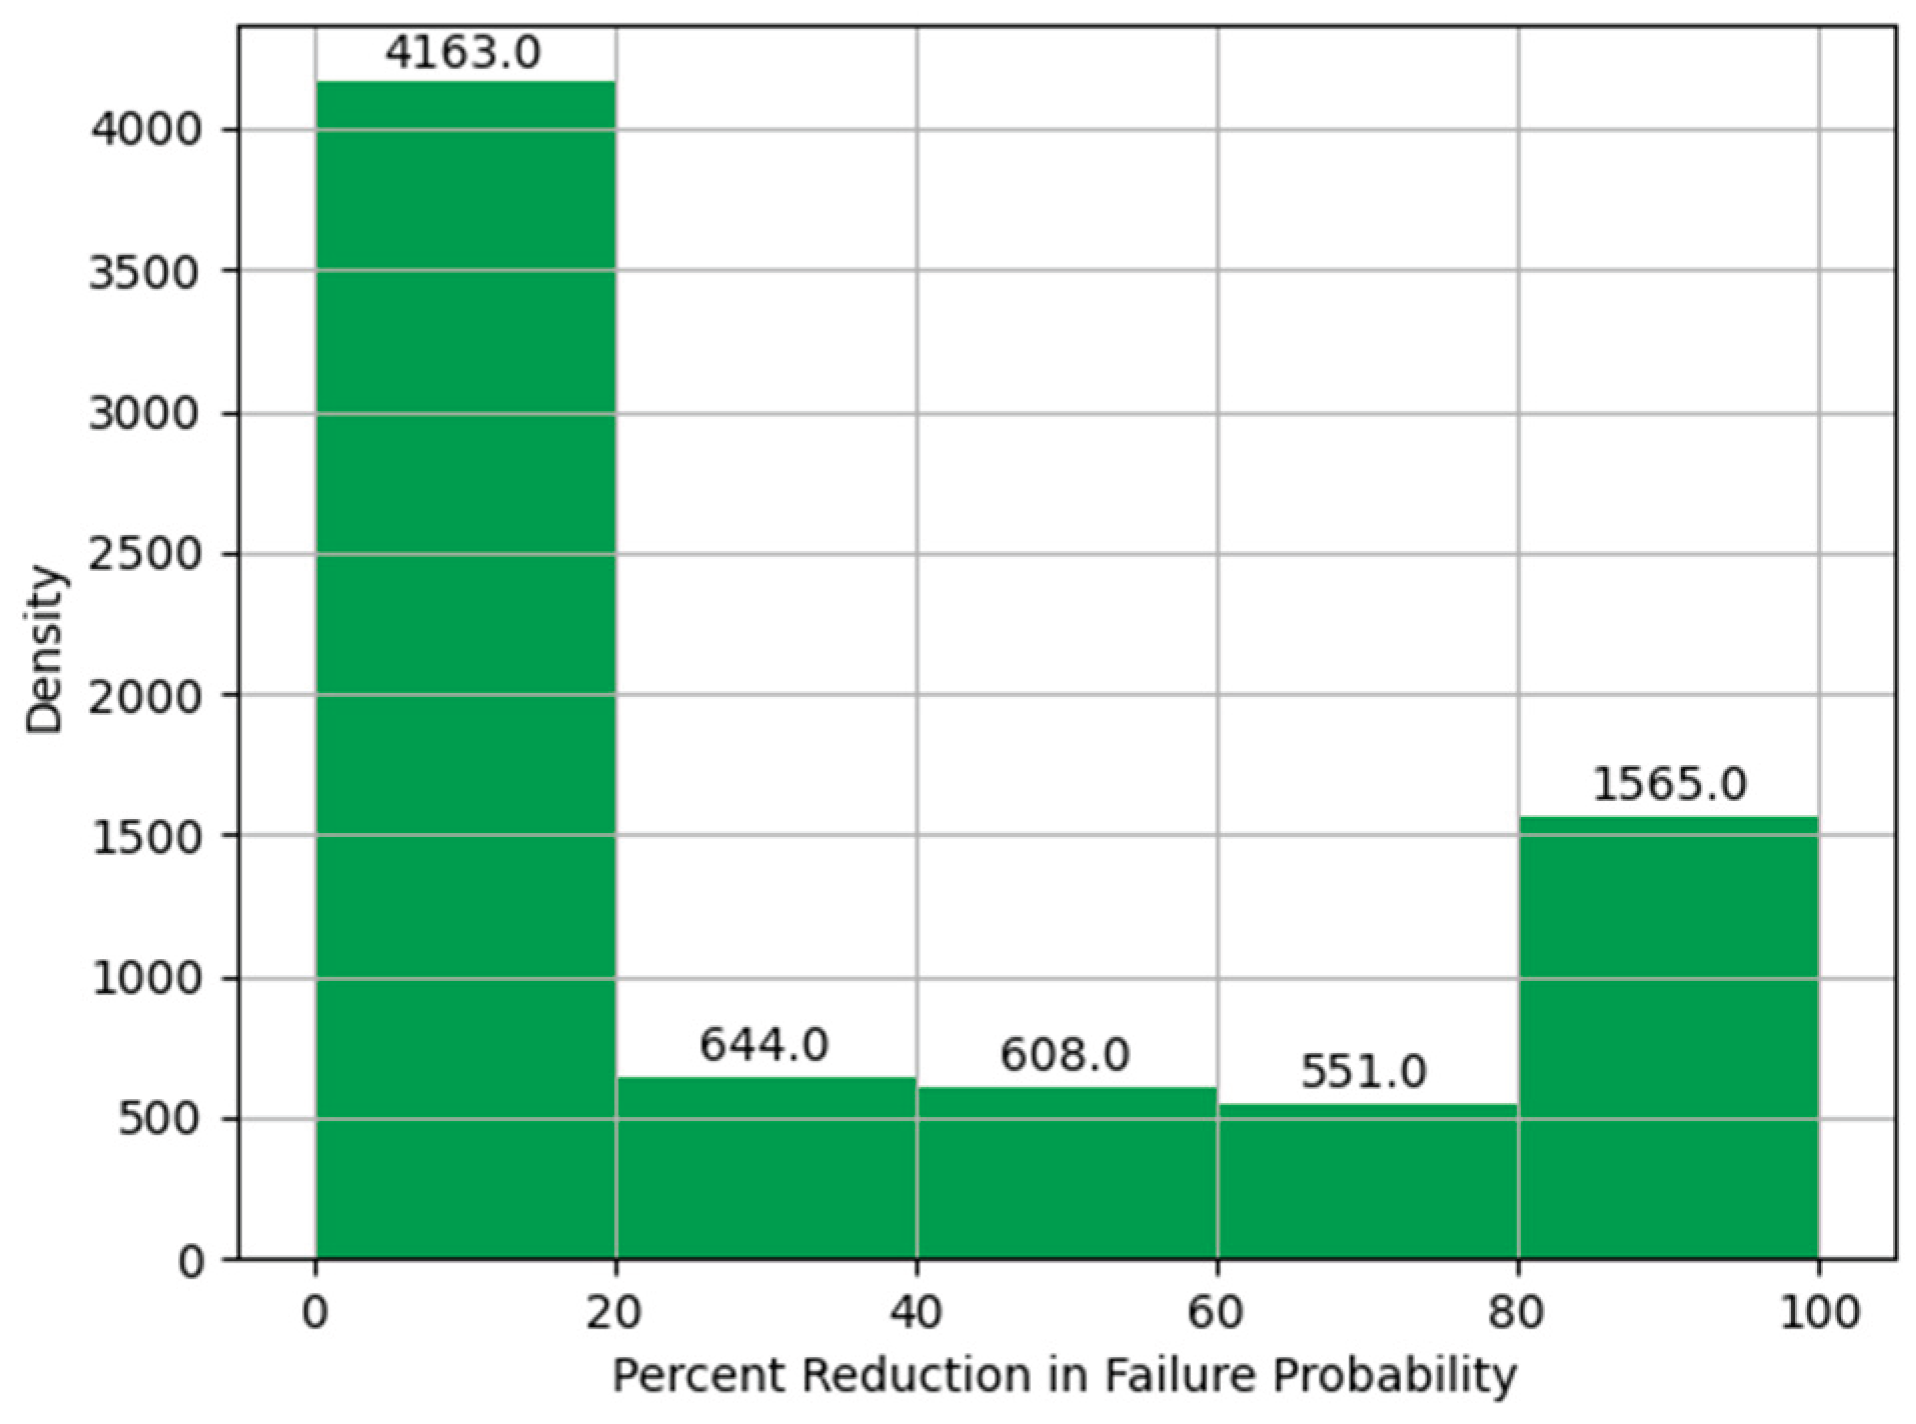
Figure 18.
Shortage Risk Profile.
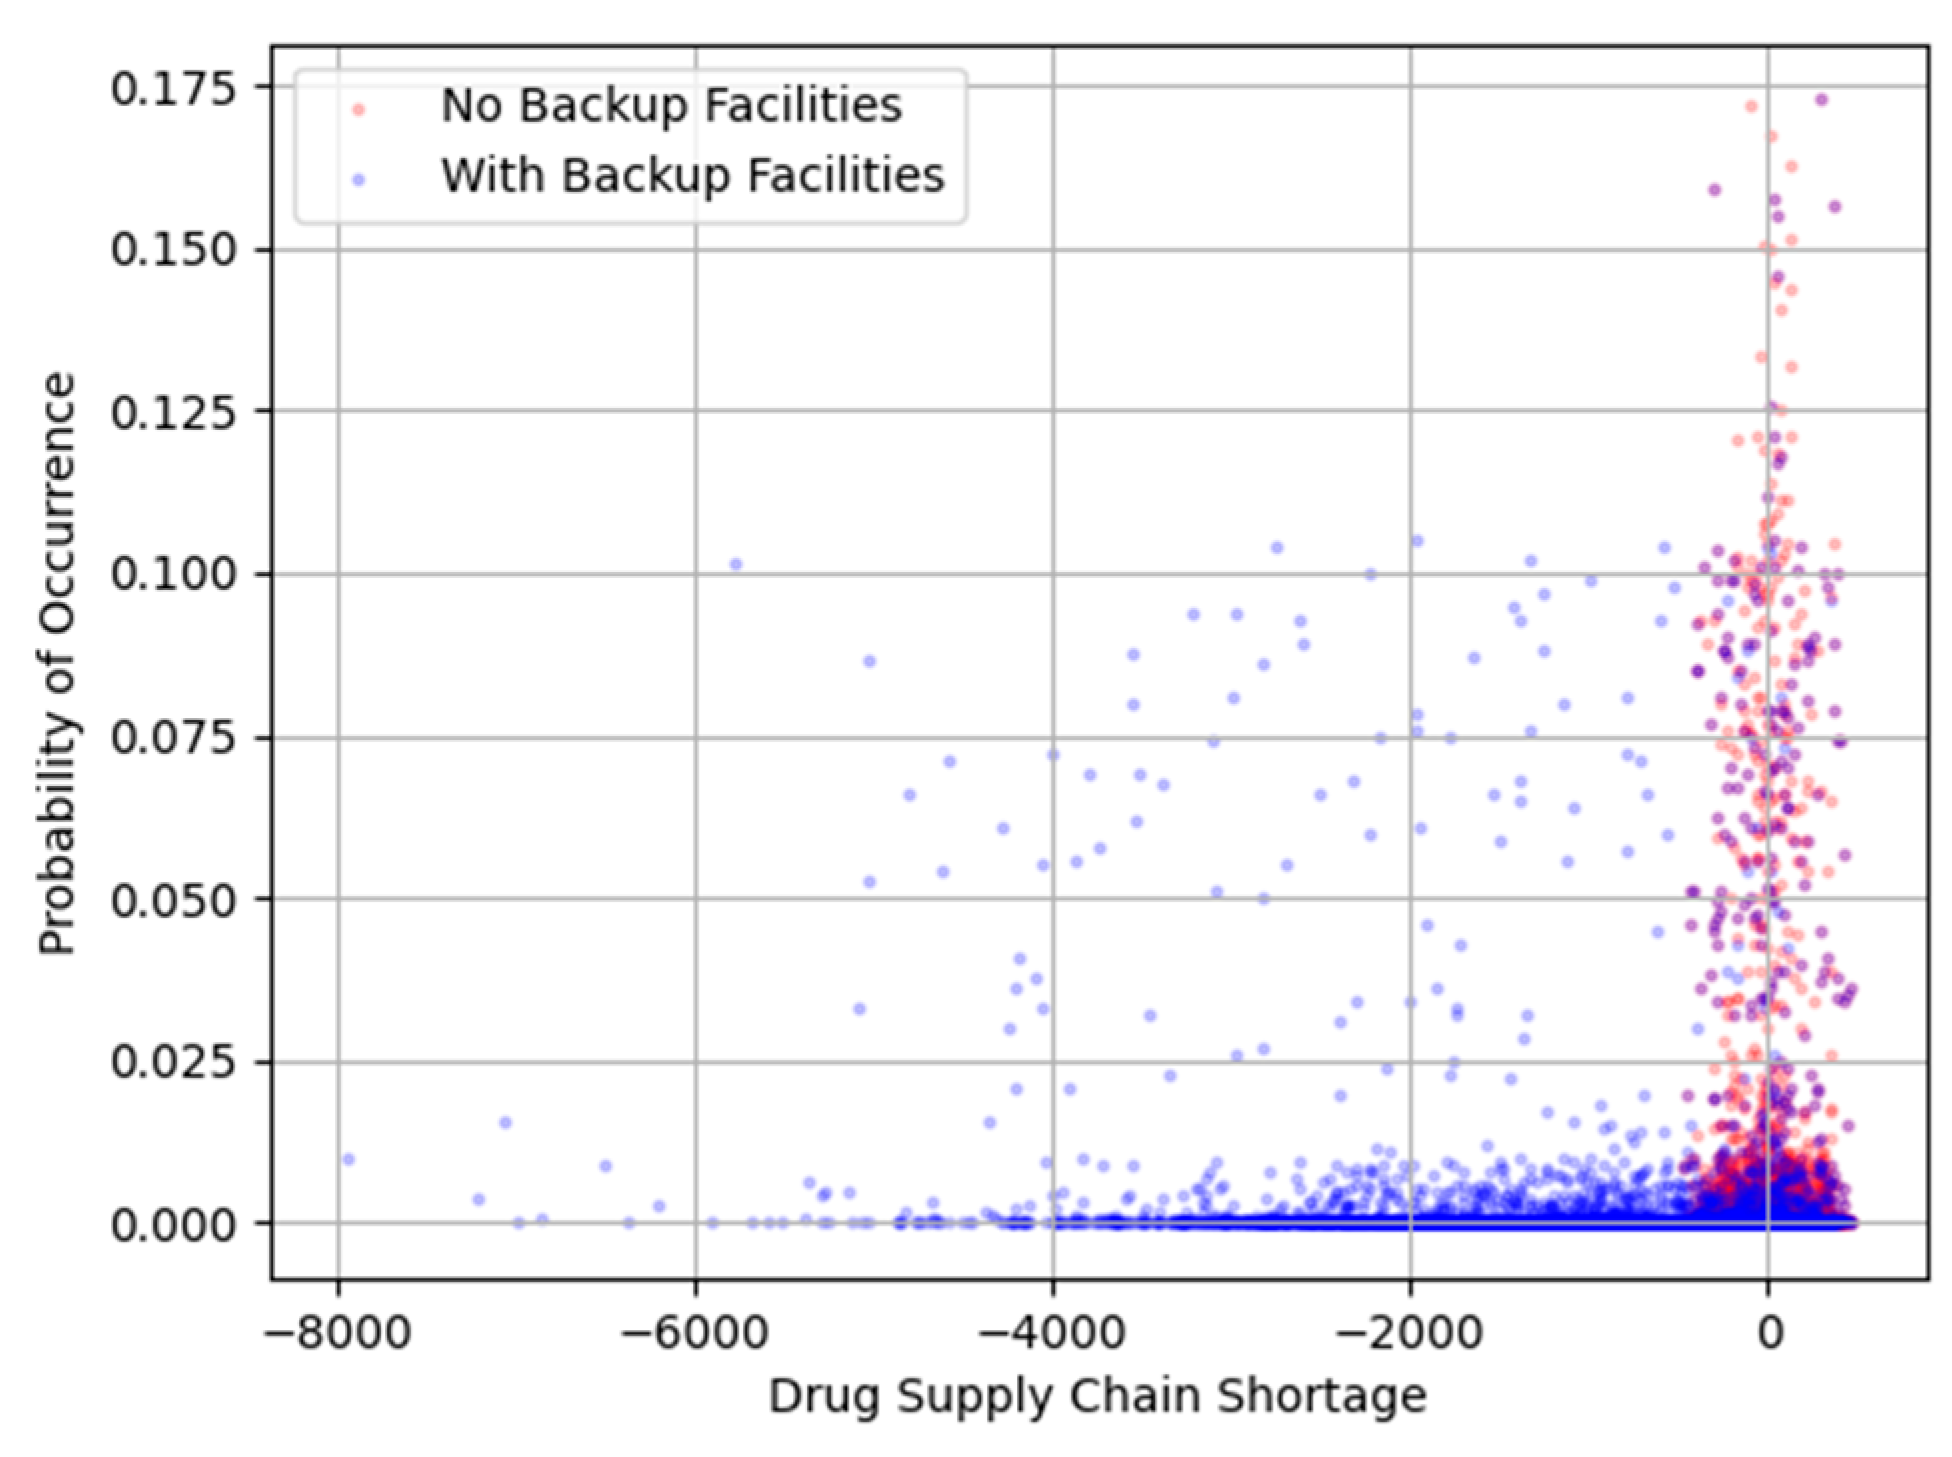
Figure 19.
Histogram of Supply Chain Shortage.
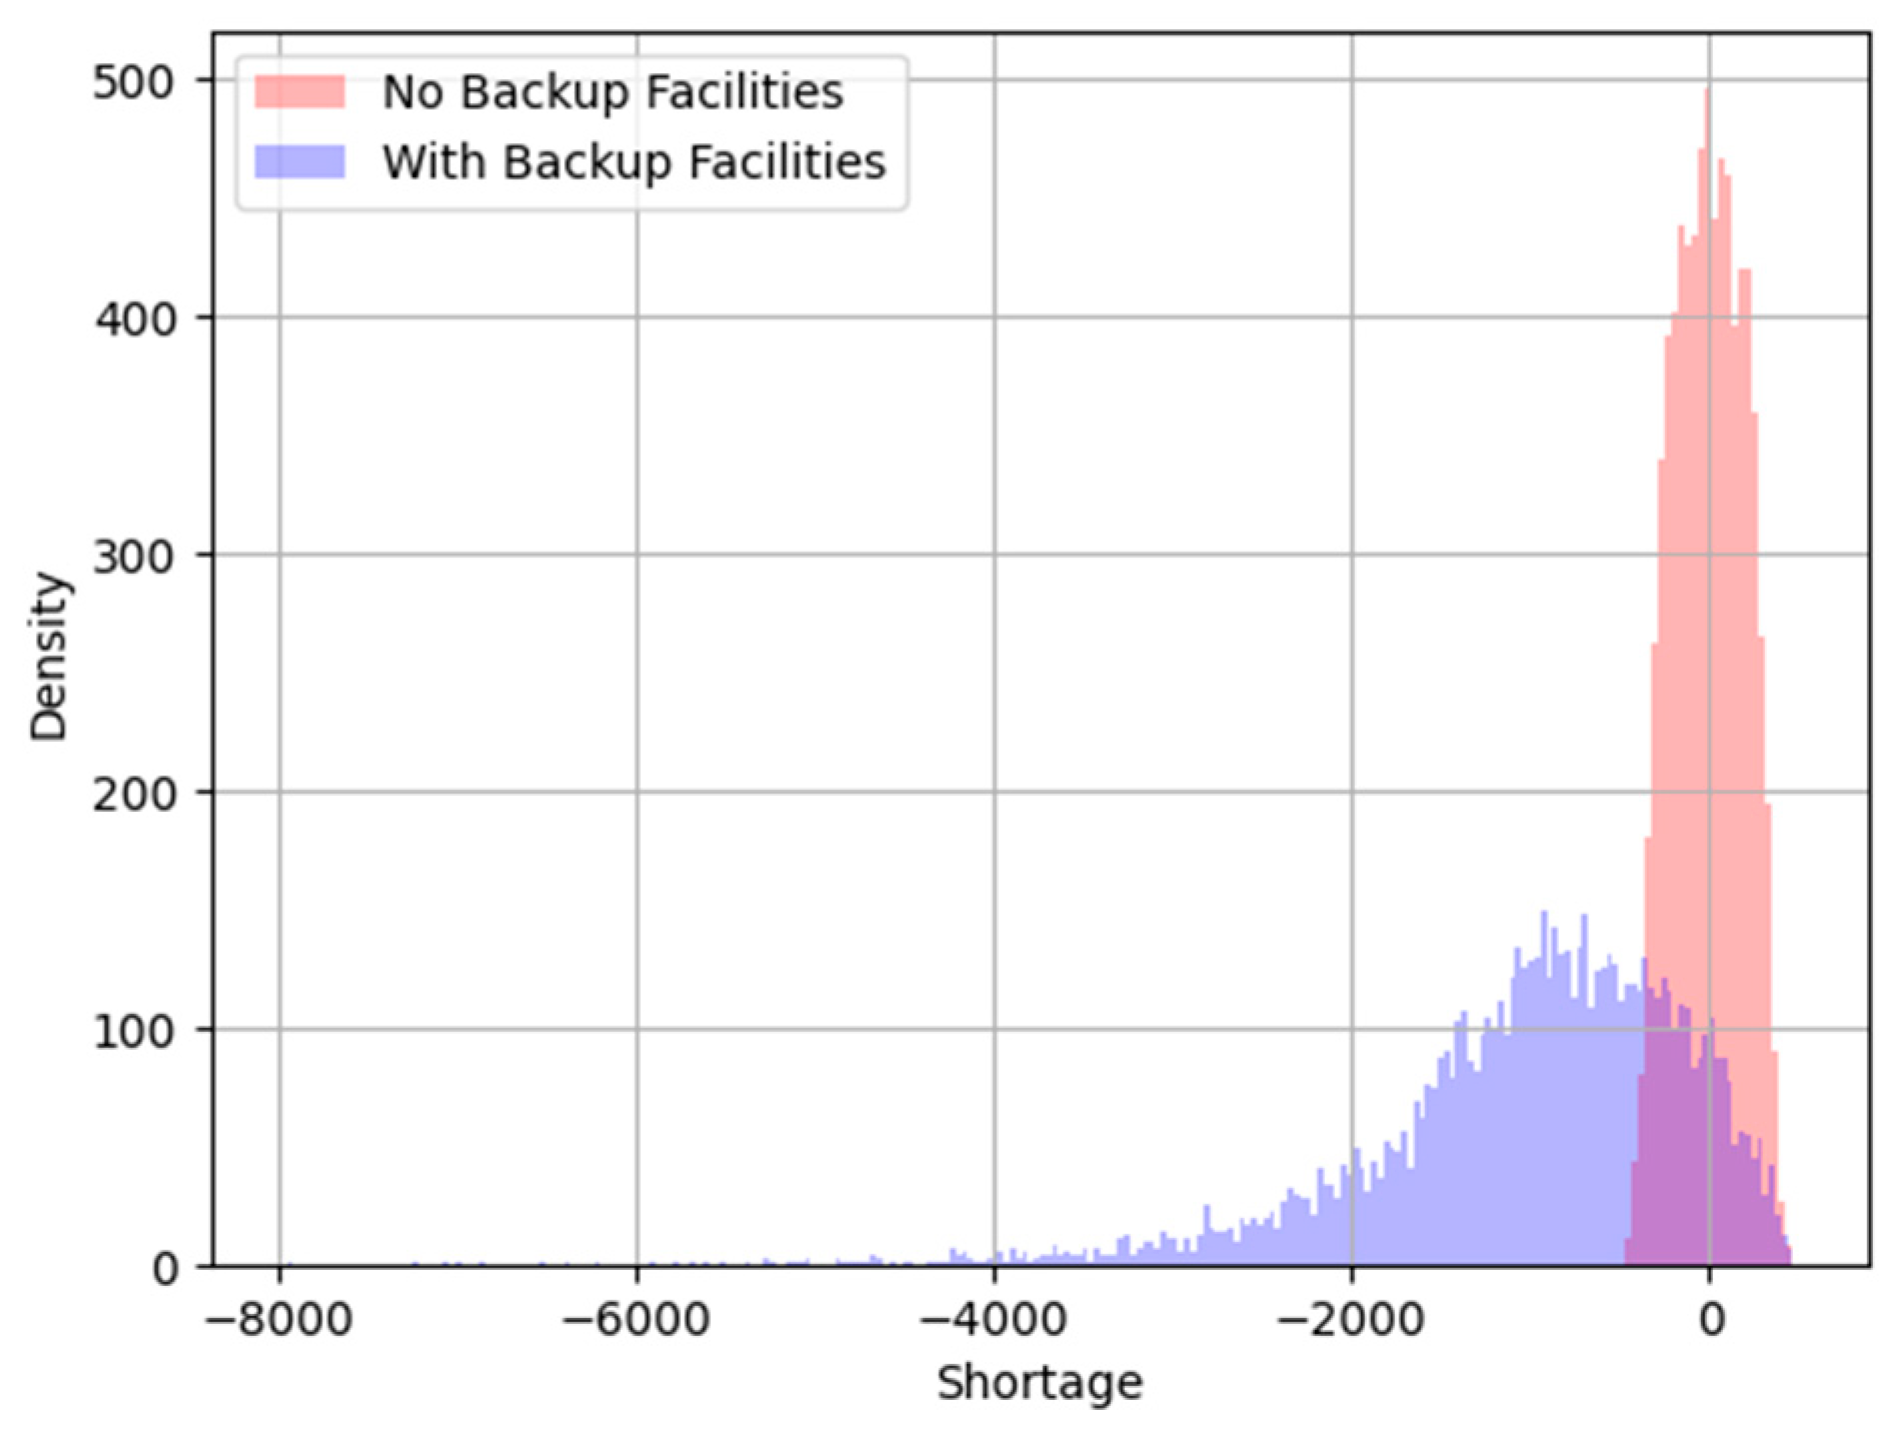
Figure 19.
Application of Mitigation Analysis to Shortage Probability of Drug Supply Chains.
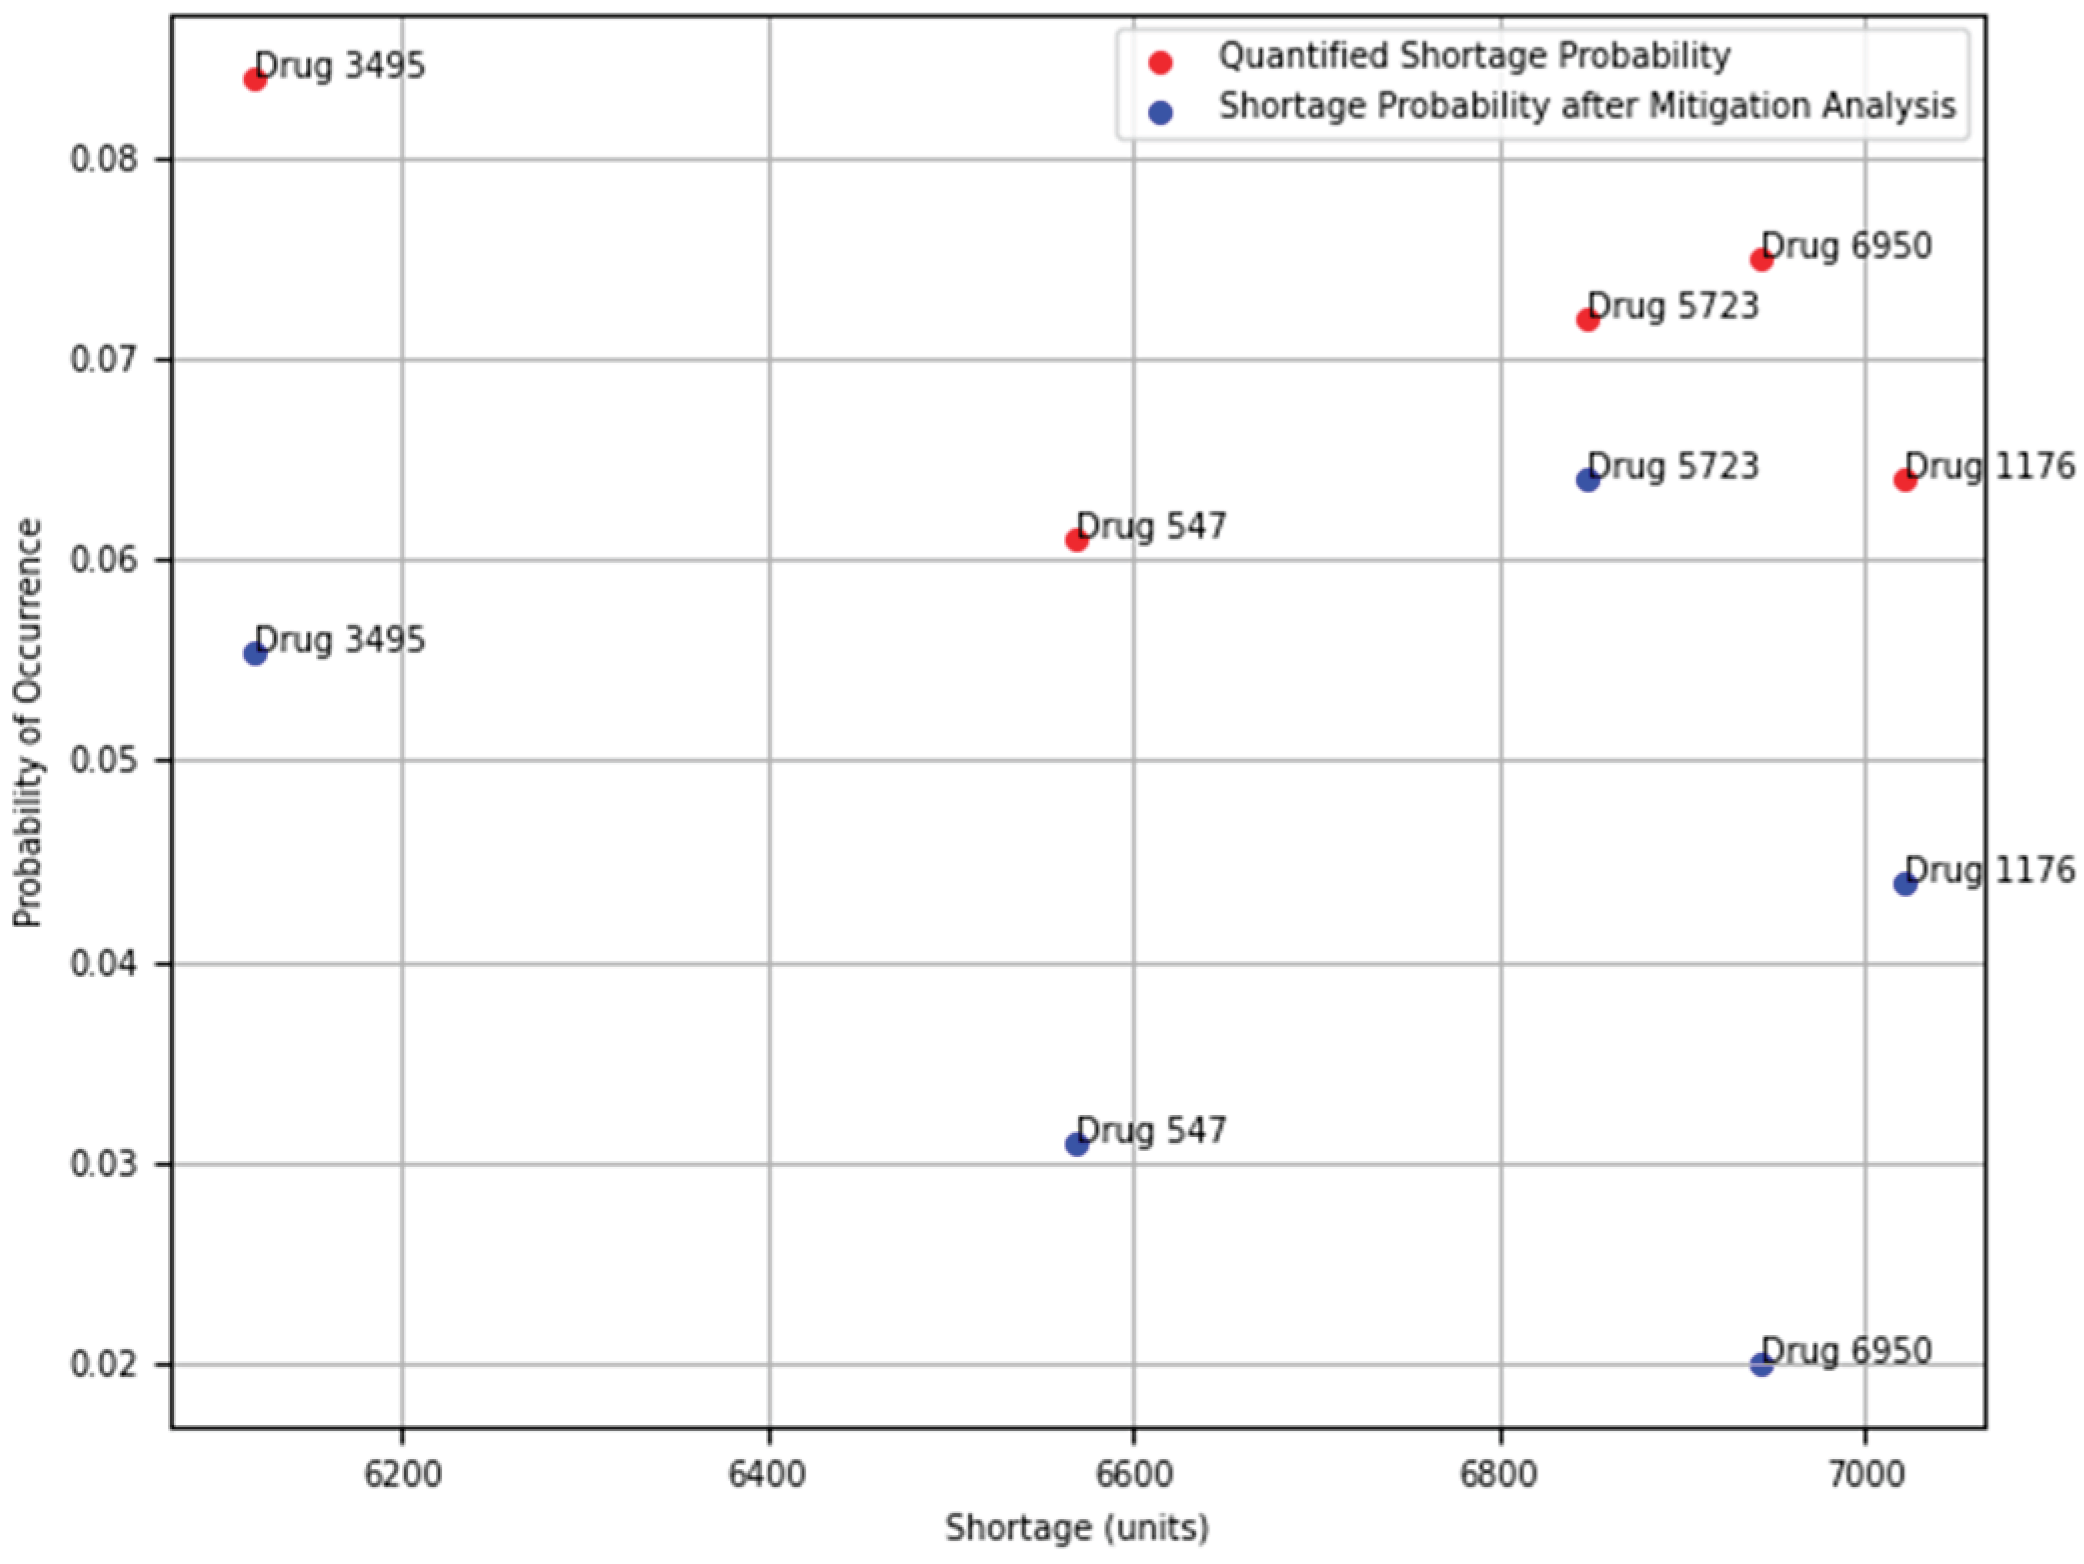

Table 1.
Input Data for SUPRA.
| Column | Data Label |
|---|---|
| A | |
| B | |
| C | |
| D | |
| E | |
| F | |
| G | |
| H | |
| I | |
| J |
Table 2.
Importance Measures.
| Importance Measure | Definition |
|---|---|
| The conditional importance measure (CIF) of a facility i, is based on the conditional probability of supply chain failure given that the facility i had already failed. | |
| The marginal or Birnbaum’s importance measure (MIF) quantifies the rate of change of the supply chain reliability with respect to changes to the reliability of a single facility. | |
| The diagnostic or Fussell-Vesely importance measure (DIF) is the probability that at least one minimal cut-set that contains a specific facility, results in system failure. | |
| The risk achievement worth (RAW) importance measure quantifies the relative increase in the supply chain failure probability given that facility i is in a failed state. | |
| The risk reduction worth (RRW) importance measure quantifies the relative reduction in the supply chain failure probability given facility i is made perfectly reliable. |
Table 3.
Output Data from SUPRA for Drug Supply Chain Flow and Failure Probability.
| Drug ID | |
| Failure Probability | |
| Warnings | none |
| Throughput/Flow | 8003.23 |
| Demand | 7959 |
| Shortage/Surplus | -44 |
Table 4.
Output Data from SUPRA for Drug Supply Chain Importance Measures.
| Facility ID | |
| Occurrence | 4 |
| Failure Probability | |
| MIF | |
| CIF | |
| DIF | |
| RRW | |
| RAW |
Table 5.
Summary of Statistics from SUPRA Results.
| Failure Probability | 5th Percentile | Median | 95th Percentile |
| Without Backup | 5.02e-8 | 3.36e-5 | |
| With Backup | 2.48e-8 | 1.95e-5 |
Table 6.
Importance Measures for Drug Supply Chain Number 1213.
| Name | MIF | CIF | DIF | RAW | RRW |
|---|---|---|---|---|---|
| APP1-API1 | |||||
| APP1-FDF2 | |||||
| APP1-FDF3 | |||||
| APP1-API2 | |||||
| APP1-FDF1 | |||||
| APP2-API1 | |||||
| APP2-FDF1 | |||||
| APP2-FDF2 |
Disclaimer/Publisher’s Note: The statements, opinions and data contained in all publications are solely those of the individual author(s) and contributor(s) and not of MDPI and/or the editor(s). MDPI and/or the editor(s) disclaim responsibility for any injury to people or property resulting from any ideas, methods, instructions or products referred to in the content. |
© 2025 by the authors. Licensee MDPI, Basel, Switzerland. This article is an open access article distributed under the terms and conditions of the Creative Commons Attribution (CC BY) license (http://creativecommons.org/licenses/by/4.0/).
Copyright: This open access article is published under a Creative Commons CC BY 4.0 license, which permit the free download, distribution, and reuse, provided that the author and preprint are cited in any reuse.


