Submitted:
12 August 2025
Posted:
12 August 2025
You are already at the latest version
Abstract
High Temperature Gas-cooled Reactor (HTGR) is the Generation IV advanced nuclear reactor, which can realize inherent safety and prevent core melt. Institute of Nuclear and New Energy Technology (INET) of Tsinghua University has developed a commercial scale 200 MWe High Temperature gas-cooled Reactor Pebble bed Module project (HTR-PM), which entered commercial operation on December 6, 2023. A passive Reactor Cavity Cooling System (RCCS) is designed for HTR-PM to export heat from the reactor cavity in normal operation and also in accident condition, keeping the safety of the reactor pressure vessel (RPV) and reactor cavity. RCCS of HTR-PM has been designed as three independent sets, normal operation of two sets of RCCS can guarantee the safety of the PRV and reactor activity. The heat can be transferred from the RPV to the final heat sink, atmosphere, through the thermal radiation and natural convection in the reactor cavity, and the natural circulation of water and air in the RCCS. The CAVCO code has been developed by INET to simulate the behavior of RCCS. In this paper, assuming different RPV temperatures and different ambient temperatures, as well assuming all or parts of the RCCS sets work, the performances of RCCS are studied by CAVCO to evaluate its operational reliability, so as to provide reference for further optimization. The analysis results indicate that even under hypothetically extremely RPV temperatures, two sets of RCCS could effectively remove heat without causing water boiling or system failure. However, during winter when ambient temperatures are low, particularly when the reactor operates at lower RPV temperature, additional attention must be given to the operational safety of the system. It is crucial to prevent system failure caused by the freezing of circulating water and the potential cracking of water-cooling pipes due to freezing. Depending on the reactor status and ambient conditions, one or all three sets of RCCS may need to be taken offline. Besides, the maximum heat removal capacity of the RCCS with only two sets operational exceeds the design requirement of 1.2 MW. When the ambient temperature fluctuates significantly, it may be advisable to increase the number of available RCCS sets to mitigate the effect of abrupt changes in cooling water temperature on pipeline thermal stress.
Keywords:
HTGR
; reactor cavity cooling system (RCCS)
; CAVCO
; safety
1. Introduction
High Temperature Gas-cooled Reactors (HTGR) are internationally listed as one of the reactor types that meets the technical requirements of the Generation IV advanced nuclear reactor which have excellent inherent safety [1,2]. HTGR use helium gas with good chemical stability as a coolant, and graphite with large heat capacity as a moderator. Besides, HTGR can achieve excellent high-temperature resistance by utilizing encapsulated particulate fuel elements., the reactor can naturally export residual heat without any external energy supply, thereby eliminating the possibility of core melting accident. Even if accident happens, it can effectively contain radioactive products and control radiation level at a lower level [3].
High Temperature Gas-cooled Reactor Pebble bed Module (HTR-PM) is the world’s first modular HTGR nuclear power plant (NPP) with inherent safety characteristics and significant commercial potential among the Generation IV advanced nuclear reactors. It was designed by the Institute of Nuclear and New Energy Technology (INET), Tsinghua University, and constructed in Shidao Bay, Rongcheng city, Shandong province, China. In HTR-PM, a reactor cavity cooling system (RCCS) is designed to remove residual heat from the reactor core during both normal operation and accident conditions, thereby ensuring the safety of the reactor.
The design of RCCS varies significantly across different types of HTGRs. In the United States’ Modular High Temperature Gas-cooled Reactor (MHTGR), the RCCS consists of cooling panels surrounding the reactor pressure vessel (RPV) [4].These panels, together with concentric hot/cold ductwork and inlet/outlet steel plenums, form a completely passive air-cooling system that based on natural convection, with air circulating between the panels and the external environment. In Japan’s High Temperature Engineering Test Reactor (HTTR), the vessel cooling system (VCS) is composed of Cooling Water Panels (CWP) surrounding the RPV, which are installed on the inner surface of the concrete containment wall. Heat is transferred to the water-cooling loop primarily by thermal radiation and natural convection, and then ultimately dissipated to an external cooling tower. The residual heat is transferred from the CWP to the cooling tower by a pump-driven water loop [5,6,7]. In South Africa’s Pebble Bed Modular Reactor (PBMR), the RCCS is a totally passive safety system based on a “water-steam” concept. The system relies mainly on natural circulation without active mechanical drives to remove heat[8,9].
In the HTR-PM, the RCCS operates based on the natural circulation of water and air to carry out the heat, without the need for external energy input. Figure 1 shows the main components of the RCCS [10], which consists of three independent sets. The water-cooling panel (WCP) is arranged on the inner layer of the reactor cavity with vertical water-cooling pipes welded on it. The heat can be transferred from RPV to the WCP by radiation and natural convection. The heated water in the water-cooling pipes then flows upwards to the air cooler in the air-cooling tower and finally transfers the heat to the environment via air natural circulation. The design capability of the RCCS for each reactor module is 1.2 MW with a 3x50% redundancy design, which means that two sets working normally can meet the design requirements and effectively remove the heat [11].
In the simulations of the RCCS for the HTR-PM and the 10 MW High Temperature Gas-cooled Test Reactor (HTR-10), Zhang et al. derived a formula for calculating the view factors of two-dimensional radiative heat transfer within the cavity and established a mathematical model for calculating the radiative heat flux [12]. Wang et al. developed the TINTE-RHRS code by integrating a HTGR system analysis program with an RCCS model [13]. This software enables thermodynamic coupling between the reactor core and the RCCS, employing an overlapping domain decomposition coupling method to analyze the operational characteristics of the RCCS in HTR-PM. Qin et al. established a two-dimensional model of the HTR-PM cavity using the CFD software Fluent to simulate both radiative and convective heat transfer within the cavity, thereby obtaining the temperature distribution of the concrete structures [14]. In addition, Qin et al. used the CFD software CFX to analyze the heat transfer behavior inside the air-cooling tower of HTR-PM by solving the Reynolds-Averaged Navier-Stokes (RANS) equations combined with a turbulence model [15]. Zhao et al. developed a program in C language to evaluate the transient characteristics of the RCCS for HTR-10. The program analyzed the flow and heat transfer in the water circulation loop and the air-cooling tower, and its results were compared with experimental data [16]. Zhao et al. also developed a multi-scale CFD-system coupled code to simulate the transient behavior of HTR-10’s RCCS during startup, demonstrating good agreement with experimental results [17].
In this paper, the operational characteristics of the RCCS is analyzed by the CAVCO code, which was developed by INET, Tsinghua University, specifically for evaluating the performance of HTGR’s RCCS [18,19,20]. The effects of RPV temperature and ambient temperature on the performance of the RCCS with varying numbers of sets available are analyzed. Particular attention is given to potential failure model of the RCCS, for example, heat transfer deterioration due to boiling in hot summer or at high RPV temperature, and pipe rupture caused by freezing in cold winter or at low RPV temperature. These analyses aim to enhance understanding and support optimization of the system. The work presented in this paper proves that the RCCS can effectively remove residual heat to ensure reactor safety, and provides insight for the safe operation of RCCS.
2. Code and Model
The CAVCO code was developed to simulate the thermal-hydraulic behavior of the RCCS, which utilizes water natural circulation and air natural circulation to transfer heat, with the outer wall temperature of the RPV as a boundary condition. Furthermore, this code has also been coupled with TINTE code, a system code developed by the Jülich Research Center, Germany for thermal hydraulic and transient analysis of pebble-bed HTGR, to analyze the impact of RCCS behavior on reactor core and RPV. Figure 2a illustrates the calculation nodes of the RCCS in the CAVCO code: A-nodes represent the annular reactor cavity formed by the cylindrical RPV wall, the WCP, and the upper and lower insulation walls; A1-A15 and A43-A45 denote the outer insulation walls of the annular cavity, A16-A42 correspond to the WCP, A46-A90 represent the inner wall of the annular cavity (i.e., the outer surface of the RPV), and A91 and A92 refer to the bottom and top surfaces of the cavity (insulation wall). C-nodes represent the water circulation components, while B-nodes and D-nodes denote the walls of the water-cooling pipes and the air cooler pipes, respectively. C1-C27 represent the water inside the water-cooling pipes, C29-C46 represent the water inside the air cooler pipes, and C28 and C47 correspond to the rising and falling sections of the water flow, respectively. E-nodes represent the air-cooling tower section, where E19 is insulated, and the remaining nodes correspond to air nodes. In the calculation process, the temperature of A46-A90 (outer wall of RPV) and E20 (ambient temperature) are provided as boundary conditions.
During the calculation process, the temperature distribution along the outer wall of the RPV is defined as the heat source, while the ambient temperature serves as the cold source. The natural convection within the cavity between the RPV and the WCP is calculated using empirical formulas (Equation 1), and radiative heat transfer is modeled based on radiation exchange among micro-elements with the annular cavity [21] (between the RPV and the WCP), excluding the pipe sections (Equation 2 and Equation3 [22]). Therefore, the number of operational RCCS sets does not influence the radiative view factor calculations of the heat transfer surfaces (Figure 2b). Once the panel absorbs the heat, it conducts the heat to the water-cooling pipes. It’s assumed that the pipe temperature equals the temperature at its contact point with the steel panel. The temperature distribution of the WCP is approximately as shown in the Figure 3. The relationship between the temperature of the steel panel and that of the water-cooling pipes is shown in Equation 4 which is derived based on the thermal conductivity equation. In this equation, h represents the equivalent heat transfer coefficient, represents the average temperature of the steel panel, Tpipe represents the temperature of the water-cooling pipes. Table 1 shows the expressions for effective thermal conductivity under different operational configurations of RCCS. In the expressions, δ refer to the thickness of the panel, and λ denotes the thermal conductivity of the panel material.
Qc = -0.9799ARPV∆tc1.3787Rc0.7171e0.3896 X+ 0.0004∆T × Hc(Hc + 0.3502)(Hc - 1.3714)
The code employs a one-dimensional model to calculate the water and air circulation loop. The following assumptions are considered during the calculation process: due to the small temperature difference between the inlet and outlet water, the flow velocity is considered constant; so, the momentum equation of the fluid at each computational node is omitted under the assumption of constant velocity. Furthermore, the diffusion of heat along the temperature gradient is neglected when solving the fluid energy equation, given the relatively mild variation of water temperature along the flow direction. The governing equations for the loop calculation are shown in Equation 5 and 6:
In the simulation, variations in the heat transfer area are used to reflect the impact of different numbers of operating RCCS sets. The periodic temperature distribution of the water-cooling panel and the water-cooling pipes in the circumferential direction, and also the resulting non-uniform temperature distribution in the circumferential direction of the RPV, are not considered.
3. Results and Discussion
3.1. Calculation Condition
This study primarily evaluates the influence of RPV temperature, ambient temperature, and the number of operating RCCS sets on the system’s heat carrying capacity and cooling water temperature. Additionally, potential failure modes of the system are analyzed, for example, heat transfer deterioration or pipe rupture caused by boiling or freezing of the water.
Table 2 summarizes the operating conditions studied in this paper, and Table 3 lists the main variables. For case 1 through 5, the RPV temperature is assumed to be uniform along its height. In case 6, the RPV temperature follows a cosine distribution along the height direction, while the ambient temperature remains constant. The working pressure of the cooling water inside the water-cooling pipes is set at 0.3 MPa, corresponding to a saturation temperature of 131.4 ℃. It is conservatively considered that RCCS would fail completely, and the computation would terminate, once the outlet water temperature (node C28 in Figure 2a) reaches 130 ℃.
3.2. Calculation Results
3.2.1. Heat Carrying Capacity
Figure 4 illustrates the calculated heat carrying capacity for cases 1 to 5. Figure 3 (a), (b), and (c) respectively correspond to different number of operating RCCS sets, with different colors representing different RPV temperatures. Points not shown in the figure indicate system failure (cooling water freezing or boiling) under the respective operating conditions.
It can be observed that, the total heat carrying capacity of the system is positively correlated with the RPV temperature and the number of operating RCCS sets, and negatively correlated with the ambient temperature. Moreover, the heat carrying capacity of each individual set is positively correlated with the RPV temperature, but negatively correlated with both the ambient temperature and the number of operating RCCS sets. A large temperature difference between the heat source (RPV) and the old source (ambient environment) enables the system to dissipate more heat. Therefore, the higher RPV temperatures and lower ambient temperatures result in greater total heat carrying capacity, as well as increased average heat carrying capacity per set. Although increasing the number of operating RCCS sets enhances the overall heat carrying capacity of the system, it leads to a reduction in the average heat carrying capacity of per set.
Furthermore, under identical RPV temperatures and numbers of operating RCCS sets, the relationship between heat carrying capacity and ambient temperature in nearly linear (as shown by Equation 3), indicating minimal sensitivity to ambient temperature variations. This indicates that the system’s heat carrying capacity is predominantly influenced by the RPV temperature. This behavior can be attributed to the dominant heat transfer mechanism between the RPV and the WCP, which is thermal radiation. Since radiative heat transfer is proportional to the fourth power of absolute temperature, the heat transfer rate is mainly governed by the temperature of the hotter region (RPV).
Figure 5 shows the proportion of convection heat transfer within the cavity under different conditions. The thermal radiation dominates the heat transfer mechanism inside the reactor cavity, with convection contributing less than 20%. As the ambient temperature increases, or the RPV temperature increases, the proportion of convective heat transfer decreases. This is because the variation in radiative heat transfer with temperature is significantly greater than that of convective heat transfer. Consequently, an increase in RPV temperature leads to a higher share of radiative heat transfer and a corresponding decrease in convective heat transfer. Additionally, the more RCCS sets in operation, the higher the proportion of convective heat transfer.
Equation 4 and Figure 6 further illustrate the influence of ambient temperature variations on heat carrying capacity. The ratio bp / kp serves as an indicator of this sensitivity; the smaller the value of bp / kp, the less pronounced the impact of ambient temperature variations on heat carrying capacity. Figure 4 shows that bp / kp decreases with increasing RPV temperatures and numbers of operating RCCS sets. This negatively correlation is because a higher RPV temperature enlarges the temperature difference between the RPV and the ambient temperature, thereby reducing the relative effect of ambient temperature changes on radiative heat transfer. At a constant RPV temperature, a larger number of operating RCCS sets correspond to a larger heat exchange area, which enhances the heat carrying capacity and improves the system’s adaptability to ambient temperature variations. Consequently, with more sets working normally, the ambient temperature variations have less effect on the heat carry capacity.
P = P(Ta, TRPV , n) = kpTa + bp
P(Ta + ∆Ta, TRPV , n)/P(Ta, TRPV , n) = (kP(Ta + ∆Ta ) + bp) / (kpTa + bp)
= 1 + ∆Ta/(bp / kp + ∆Ta )
3.2.2. Cooling Water Temperature
Figure 7, Figure 8 and Figure 9 illustrate how the inlet and outlet temperatures of the cooling water vary under different ambient temperatures, numbers of operating RCCS sets, and RPV temperatures. It is observed that the inlet and outlet water temperatures exhibit a positive correlation with both ambient and RPV temperatures. When either the RPV or ambient temperature increases, the cooling water temperature also rises, and vice versa. Besides, inlet and outlet water temperatures show a negative correlation with the number of operating RCCS sets.
The temperature difference between inlet and outlet of the cooling water is negatively correlated with both the ambient temperature and the number of operating RCCS sets, while it is positively correlated with the RPV temperature. It can be inferred that the temperature difference increases with the increase of heat carrying capacity per set.
3.2.3. RPV Temperature Distribution
Figure 10 shows the RPV temperature under different operating conditions. The temperature distributions during normal operation and under Depressurized Loss of Forced Coolant (DLOFC) accident at 540,000 s were calculated by DAYU3D code. DAYU3D is a system analysis code independently developed by INET for HTGR [23,24,25]. It has been validated against the TINTE code [26], confirming its reliability and accuracy. DLOFC is a typical accident of HTGR, which may result in the maximal fuel and RPV temperature [27,28]. The RPV temperature distribution under DLOFC conditions follows an approximate cosine pattern, consistent with case 6-1. During normal operation, the RPV temperature distribution remains relatively uniform along the vertical axis, with the value close to 200 ℃. This study investigates the influence of RPV temperature distribution on the system’s heat carrying capacity. A cosine-shaped temperature distribution is assumed, with varying amplitudes but a constant average temperature.
Figure 11 shows the total heat carrying capacity, radiative heat transfer capacity, and convection heat transfer capacity of the system under different RPV temperature distributions and numbers of operating RCCS sets. The greater the RPV temperature variation, the higher the system’s overall heat carrying capacity. Since thermal radiation is the dominant heat transfer mechanism within the reactor cavity, the trend of total heat carrying capacity closely mirrors to that of radiative heat transfer. The thermal radiation capacity of a surface is proportional to the fourth power of its absolute temperature. Under the identical temperature variations of a certain surface, the increase in thermal radiation caused by a temperature rise is higher than the decrease caused by an equivalent temperature drop (equation 9). Consequently, at a constant average RPV temperature, a greater temperature difference among the RPV surfaces results in a higher overall thermal radiation capacity of the RPV surface, thereby enhancing the heat carrying capacity of the system.
εσ[(T + ∆T)4 – T4] - εσ[T4 - (T - ∆T)4] = εσ(12T2∆T2 + 2∆T4) > 0
3.2.4. Temperature Limit
Figure 12 shows the ambient temperature limits of the system under different numbers of operational RCCS sets and RPV temperatures, with Table 2 provides the fitting formula for these curves. The results indicate that, at a fixed RPV temperature, increasing the number of operating RCCS sets leads to a higher ambient temperature limit. This observation is consistent with the conclusion that the more operating RCCS sets result in a lower average cooling water temperature, which reduces the likelihood of reaching the boiling point and increases the risk of freezing at the same ambient temperature. In addition, it was found that higher RPV temperatures corresponds to lower ambient temperature limits for the same number of operating sets. This is because as the RPV temperature increases, the average cooling water temperature also increases, decreasing the likelihood of freezing and increasing the likelihood of boiling, which ultimately lowers the ambient temperature limit.
The heat carrying capacity is also influenced by the temperature distribution of RPV. Greater temperature non-uniformity enhances the total heat released from the reactor cavity. Using the average RPV temperature for calculations may underestimate the actual heat carrying capacity, potentially leading to an overestimation of the ambient temperature at which system failure occurs. Therefore, for estimating the ambient temperature associated with boiling failure, the maximum PRV temperature should be used; conversely, for icing failure estimation, the average RPV temperature is recommended. This approach ensures a conservative estimation of the ambient temperature limit range.

Table 4.
Equation between Limit Temperature and RPV Temperature.
| Set of RCCS | Equation | |
|---|---|---|
| 1 | Tfreezing = 0.000114TRPV2 - 0.354TRPV + 379.903 | Tboiling = 0.000416TRPV2 - 0.0199RPV + 444.231 |
| 2 | Tfreezing = -0.000352TRPV2 - 0.187TRPV + 247.845 | Tboiling = 0.000370TRPV2 - 0.0889TRPV + 415.496 |
| 3 | Tfreezing = -0.000343TRPV2 + 0.228TRPV + 231.553 | Tboiling = 0.000335TRPV2 - 0.112TRPV + 403.750 |
4. Discussion
In HTR-PM, the RCCS is designed as that, two sets working normally can guarantee the heat carrying capacity of 1.2 MW, so to keep the RPV and cavity safe under accident conditions. The working pressure of the cooling water in the water-cooled pipes is 0.3MPa.
The calculation results introduced in Chapter 3 show the influence of ambient temperature, RPV temperature and the number of operational RCCS sets on the system’s operational characteristics and safety performance. These findings provide valuable insights for the future design improvement as well as optimization of operation and maintenance strategies. In this section, potential failure modes due to boiling or freezing of the water are further analyzed, along with possible mitigation measures. Additionally, the heat carrying capacity of the HTR-PM RCCS is also discussed.
4.1. High Temperature Failure Analysis
The temperature of RCCS cooling water rises with increasing ambient temperature and RPV temperature, and also increases when fewer RCCS sets are in operation. According to the HTR-PM design, the RPV temperature limits for normal operation and design basis accident (DBA) are set at 350℃ and 425℃, respectively. Analyses indicate that in all DBAs and most beyond design basis accidents (BDBAs), the RPV temperature does not exceed 400 ℃. Calculation results show that if two or three RCCS sets can work normally and the ambient temperature is below 40 ℃, the outlet water temperature will not reach the boiling point at 0.3 MPa, which means the RCCS would not fail due to the heat transfer deterioration. Thus, the HTR-PM satisfied the design requirement of 3×50% redundancy during operation.
Based on the working principle of the RCCS, as well as the above analysis, it is crucial to prevent cooling water boiling and subsequent heat transfer deterioration during hot summer conditions. Therefore, continuous monitoring of RPV temperature, RCCS operating pressure, ambient temperature and outlet water temperature is essential. If the outlet water temperature approaches the boiling point, increasing the system pressure is a feasible countermeasure.
Moreover, analysis results show that if only one RCCS set works, the system may be prone to failure under higher RPV or ambient temperature. Therefore, reactor operation with only a single RCCS set should not be permitted. In exceptional circumstances where only two sets are functional and the third is undergoing maintenance or repair, the reactor should be shut down if the maintenance or repair could not be completed within the designated timeframe.
When empirical formulas are employed to estimate the ambient temperature at which system boiling failure occurs, using the average RPV temperature for calculations may result in an overestimation of the actual ambient temperature at failure. Instead, using the maximum RPV temperature leads to a more conservative estimation.
4.2. Low Temperature Failure Analysis
Based on the above analysis, it can be concluded that, compared with system failure caused by water boiling, cooling water freezing in the HTR-PM RCCS is more likely to occur and thus requires greater attention. This conclusion is also supported by HTR-PM operational experience. Freezing of cooling water may result in rupture of the water-cooling pipes, thereby disrupting the circulation of cooling water within RCCS.
During winder operation, it is crucial to monitor the inlet water temperature closely and implement preventive measures when the temperature approaches the freezing point, for example shutting down part or all of the RCCS sets, closing the air inlet door of the air-cooling tower, or applying insulation to the water pipes of the air cooler.
4.3. System Heat Carrying Capacity
The actual heat carrying capacity of the system is influenced by several factors, including the RPV temperature, ambient temperature, and the number of operating RCCS sets. The cavity transfers heat mainly through radiation, with natural convection contributing less than 20% of the total heat transfer. The heat carrying capacity increases with the increase of RPV temperature, decreases with the increase of ambient temperature, and increases with the increase of operating RCCS sets. According to the calculation results, the RPV temperature has the most significant impact on the system’s heat carrying capacity, whereas ambient temperature and the number of operating RCCS sets have relatively minor effects. The relationship between heat carrying capacity and ambient temperature is approximately linearly. When the RPV temperature is high and multiple RCCS sets are in operation, the heat carrying capacity is less sensitive to variations in ambient temperature. In addition, there is a positive correlation between the heat carrying capacity and the temperature difference between the inlet and outlet of the cooling water.
The temperature distribution across the RPV also influences the system’s heat carrying capacity. When the average RPV temperature remains constant, a more uneven temperature distribution leads to increased thermal radiation emitted by the RPV, thereby enhancing the heat carrying capacity of the RCCS. Therefore, approximating the system’s heat carrying capacity using the average RPV temperature, rather than the actual temperature, may result in an underestimation. Employing the highest RPV temperature provides a more conservative approach.
In case that ambient temperature fluctuations are significant, increasing the number of operating RCCS sets appropriately can help mitigate the impact of ambient temperature changes on the heat carrying capacity, reduce cooling water temperature fluctuations, and minimize thermal stress on the pipelines.
In HTR-PM design, the specified heat carrying capacity of the RCCS with two sets in operation is 1.2 MW. According to the calculation results, the heat carrying capacity of two RCCS sets can exceed 2 MW in normal operation when the RPV exhibits a uniform temperature distribution above 400 ℃ (a scenario unlikely to occur in practice). The analysis results indicate that the current RCCS design of the HTR-PM meets, and potentially exceeds the required performance standards.
In actual reactor operation, the RPV temperature is also affected by the operational characteristics of the RCCS. Therefore, in order to accurately determine the required design capacity of the RCCS and optimize associated costs, further coupled analysis of reactor behaviors and RCCS behaviors is necessary.
5. Conclusions
The paper investigates the influence of ambient temperature, RPV temperature and the number of operating RCCS sets on the system’s heat carrying capacity and cooling water temperature. Furthermore, the limit of ambient temperature under which the system can operate normally at various RPV temperatures and RCCS configurations are also analyzed. Based on the calculation results, the following conclusions can be drawn:
(1) During normal operation of the HTR-PM, when RPV temperature is maintained at a relatively low level, a single RCCS set is sufficient to ensure the safety of the reactor cavity. However, in certain accident scenarios involving emergency reactor shutdowns, the core and RPV temperatures may rise due to the decay heat. In such cases, two RCCS sets can effectively remove the residual decay heat and keep the RPV and reactor cavity safe.
(2) The RCCS may experience boiling or freezing of the cooling water during operation, potentially leading to heat transfer deterioration or even system failure. According to the calculation results, cooling water boiling does not occur during normal operation of the reactor. However, under accident conditions with elevated RPV temperatures, it is essential to maintain an adequate number of operating RCCS sets to prevent boiling. Compared to boiling, the freezing of the cooling water and the resulting pipe rupture need more attention. Especially during winter and at lower RPV temperatures, partial or full shutdown of the RCCS sets may be necessary to avoid freezing. Alternatively, closing the air inlet door of the air cooler to increase the cooling water temperature is also a feasible measure.
(3) Heat transfer within the cavity primarily occurs through thermal radiation, with natural convection contributing less than 20% of the total heat transfer. The system’s heat carrying capacity is predominantly determined by the RPV temperature and is positively correlated with the temperature difference between the inlet and outlet of cooling water. Additionally, the spatial distribution of RPV temperature influences the heat transfer performance; a more uneven temperature distribution enhances radiative heat emission from the RPV, thereby increasing the overall heat load of the system. Based on the analysis results and operation experience, it has been found that the heat carrying capacity of the RCCS of HTR-PM exceeds the design requirement of 1.2 MW when two of three sets are operating normally.
(4) Nevertheless, since the RPV temperature is also influenced by the operational characteristics of the RCCS, future study should incorporate coupled simulations of the reactor, RPV and RCCS behaviors. Such integrated analyses will enhance the understanding of RCCS performance and support further design optimization of the system.
Author Contributions
Methodology, Yanhua Zheng, Xinsheng Xu, Yiyang Ye, Yingjie Wu; software, Xinsheng Xu, Yiyang Ye; formal analysis, Xinsheng Xu, Yanhua Zheng; data curation, Xinsheng Xu, Yingjie Wu; writing—original draft preparation, Xinsheng Xu.; writing—review and editing, Yanhua Zheng; visualization, Xinsheng Xu; supervision, Yanhua Zheng.
Funding
This research was funded by Beijing Natural Science Foundation 1244054.
Conflicts of Interest
The authors declare no conflicts of interest.
References
- Zhang, Z.; Yu, S. Future HTGR developments in China after the criticality of the HTR-10. Nuclear Engineering and Design 2002, 218, 249–257. [Google Scholar] [CrossRef]
- Zhang, Z.; Wu, Z.; Wang, D.; Xu, Y.; Sun, Y.; Li, F.; Dong, Y. Current status and technical description of Chinese 2× 250 MWth HTR-PM demonstration plant. Nuclear Engineering and Design 2009, 239, 1212–1219. [Google Scholar] [CrossRef]
- Zhang, Z.; Wu, Z.; Wang, D.; Tong, J. Development strategy of high temperature gas cooled reactor in China. Strategic Study of Chinese Academy of Engineering 2019, 21, 12–19. [Google Scholar] [CrossRef]
- Conklin, J. Modeling and performance of the MHTGR (Modular High-Temperature Gas-Cooled Reactor) reactor cavity cooling system; Nuclear Regulatory Commission, Washington, DC (USA). Div. of Regulatory …: 1990.
- Fujiwara, Y.; Goto, M.; Iigaki, K.; Iyoku, T.; Ho, H.Q.; Kawamoto, T.; Kondo, M.; Kunitomi, K.; Morita, K.; Nagasumi, S. Design of high temperature engineering test reactor (HTTR). In High Temperature Gas-Cooled Reactors; Elsevier: 2021; pp. 17–177.
- Takada, S.; Suzuki, K.; Inagaki, Y.; Sudo, Y. Experimental and numerical studies on performance of passive decay heat removal by a water cooling panel from a high-temperature gas-cooled reactor. Journal of nuclear science and technology 1999, 36, 413–423. [Google Scholar] [CrossRef]
- Takamatsu, K. Thermal-hydraulic analyses of the High-Temperature engineering Test Reactor for loss of forced cooling at 30% reactor power. Annals of Nuclear Energy 2017, 106, 71–83. [Google Scholar] [CrossRef]
- Freile, R.; Tano, M.; Balestra, P.; Schunert, S.; Kimber, M. Improved natural convection heat transfer correlations for reactor cavity cooling systems of high-temperature gas-cooled reactors: From computational fluid dynamics to Pronghorn. Annals of Nuclear Energy 2021, 163, 108547. [Google Scholar] [CrossRef]
- Koster, A.; Matzner, H.; Nicholsi, D. PBMR design for the future. Nuclear Engineering and Design 2003, 222, 231–245. [Google Scholar] [CrossRef]
- QIN, H.; LI, X.; ZHANG, L.; LIU, X.; ZHENG, Y.; WU, X. Heat Removal Performance Analysis of HTR-PM Reactor Cavity Cooling System under Accident Condition. Atomic Energy Science and Technology 2025, 59, 838–845. [Google Scholar]
- LI, X.-w.; WU, X.-x.; Zhang, L.; HE, S.-y. Analysis of passive residual heat removal system of modular high temperature gas-cooled reactor. Atomic Energy Science and Technology 2011, 45, 790–795. [Google Scholar]
- Zhang, W.; Jia, D.; Qiu, S. Calculation of radiation in the primary cavity of HTR-10. Nuclear Power Engineering 2002, 23, 10–16. [Google Scholar]
- Wang, D.; Hao, C.; Li, F. Operating characteristic analysis of passive residual heat removal system of HTR-PM. Science & Technology Review 2012, 30, 33–38. [Google Scholar]
- QIN, H.; LI, X.; ZHANG, L.; LIU, X.; ZHENG, Y.; WU, X. Heat Removal Performance Analysis of HTR-PM Reactor Cavity Cooling System under Accident Condition. Atomic Energy Science and Technology 2025, 59, 838–845. [Google Scholar]
- Qin, H.; Li, X.; Zhang, L.; Wu, X. Flow distribution in the air cooler of HTGR passive cavity cooling system. Annals of Nuclear Energy 2023, 180, 109478. [Google Scholar] [CrossRef]
- Zhao, H.; Zheng, Y.; Chen, X.; Ma, T.; Dong, Y. A one-dimensional code of the passive residual heat removal system for the modular high temperature gas-cooled reactor. Progress in Nuclear Energy 2019, 110, 374–383. [Google Scholar] [CrossRef]
- Zhao, H.; Zheng, Y.; Ma, T.; Dong, Y. A multi-scale CFD-system coupled code for transient analysis of the passive residual heat removal system of MHTGR. Annals of Nuclear Energy 2020, 141, 107304. [Google Scholar] [CrossRef]
- He, D. Simulation of Residual Heat Removal System in HTR-PM. Tsinghua University, Beijing, China (Master thesis) 2010.
- Wang, D. Simulation of High Temperature Gas Cooled Reactor’s Multi-Loop System. Tsinghua University, Beijing, China (PhD thesis) 2011.
- Ye, Y. Development of coupling program for high-temperature gas-cooled reactor cavity cooling system based on TINTE and analysis of RCCS characteristics Tsinghua University, Beijing, China (PhD thesis) 2023.
- Xu, X.; Zhang, H.; Zheng, Y.; She, D. Three-dimensional Radiation View Factor Calculation in DAYU3D Program. 2024.
- Modest, M.F.; Mazumder, S. Radiative heat transfer; Academic press: 2021.
- Zhang, H.; Zheng, Y.; She, D.; Shi, L. Preliminary Study on Three-Dimensional Characteristics of Modular High Temperature Gas-Cooled Reactor. In Proceedings of the International Conference on Nuclear Engineering; 2022; p. V015T016A057. [Google Scholar]
- Zhang, H.; Tan, B.; She, D.; Shi, L. An efficient method for solving flow field in high temperature gas-cooled reactor. Progress in Nuclear Energy 2025, 180, 105599. [Google Scholar] [CrossRef]
- Zhang, H. , Wen, Y., She, D., Zheng, Y., Shi, L., 2025. DAYU3D: A modern code for HTGR thermal-hydraulic design and accident analysis. Nuclear Science and Technology 2025.
- Gerwin, H.; Scherer, W.; Lauer, A.; Strydom, G. Tinte-a two-dimensional code for reactor dynamics. Berichte des Forschungszentrums Jülich Jül 2009, 4294. [Google Scholar]
- Zheng, Y.; Stempniewicz, M.M.; Chen, Z.; Shi, L. Study on the DLOFC and PLOFC accidents of the 200 MWe pebble-bed modular high temperature gas-cooled reactor with TINTE and SPECTRA codes. Annals of Nuclear Energy 2018, 120, 763–777. [Google Scholar] [CrossRef]
- Xu, X.; Ye, Y.; Zheng, Y.; Marek, M.S. Study on Reactor Cavity Cooling System of HTR-PM in DLOFC Accident With TIN-CAVCO Code and SPECTRA Code. In Proceedings of the International Conference on Nuclear Engineering; 2024; p. V006T007A028. [Google Scholar]
Figure 1.
The system components of RCCS (1: Reactor core; 2: Reactor pressure vessel; 3: Water-cooling panel; 4: Reactor cavity concrete; 5: Hot water main pipe; 6: Air-cooler; 7: Cold water main pipe; 8: Air-cooling tower; 9: Air inlet; 10: Air outlet).
Figure 1.
The system components of RCCS (1: Reactor core; 2: Reactor pressure vessel; 3: Water-cooling panel; 4: Reactor cavity concrete; 5: Hot water main pipe; 6: Air-cooler; 7: Cold water main pipe; 8: Air-cooling tower; 9: Air inlet; 10: Air outlet).

Figure 2.
Calculation model of HTR-PM RCCS: (a) RCCS Calculation Nodes; (b) View Factor Calculation Unit.
Figure 2.
Calculation model of HTR-PM RCCS: (a) RCCS Calculation Nodes; (b) View Factor Calculation Unit.
Figure 3.
Temperature and heat flux distribution of WCP.
Figure 4.
Heat carrying capacity of RCCS: (a) Heat carrying capacity under one set of RCCS; (b) Heat carrying capacity under two sets of RCCS; (c) Heat carrying capacity under three sets of RCCS.
Figure 4.
Heat carrying capacity of RCCS: (a) Heat carrying capacity under one set of RCCS; (b) Heat carrying capacity under two sets of RCCS; (c) Heat carrying capacity under three sets of RCCS.
Figure 5.
Proportion of convection heat transfer in the cavity: (a) Proportion of convection heat transfer under one set of RCCS; (b) Proportion of convection heat transfer under two sets of RCCS; (c) Proportion of convection heat transfer under three sets of RCCS.
Figure 5.
Proportion of convection heat transfer in the cavity: (a) Proportion of convection heat transfer under one set of RCCS; (b) Proportion of convection heat transfer under two sets of RCCS; (c) Proportion of convection heat transfer under three sets of RCCS.
Figure 6.
bp / kp under different boundary conditions.
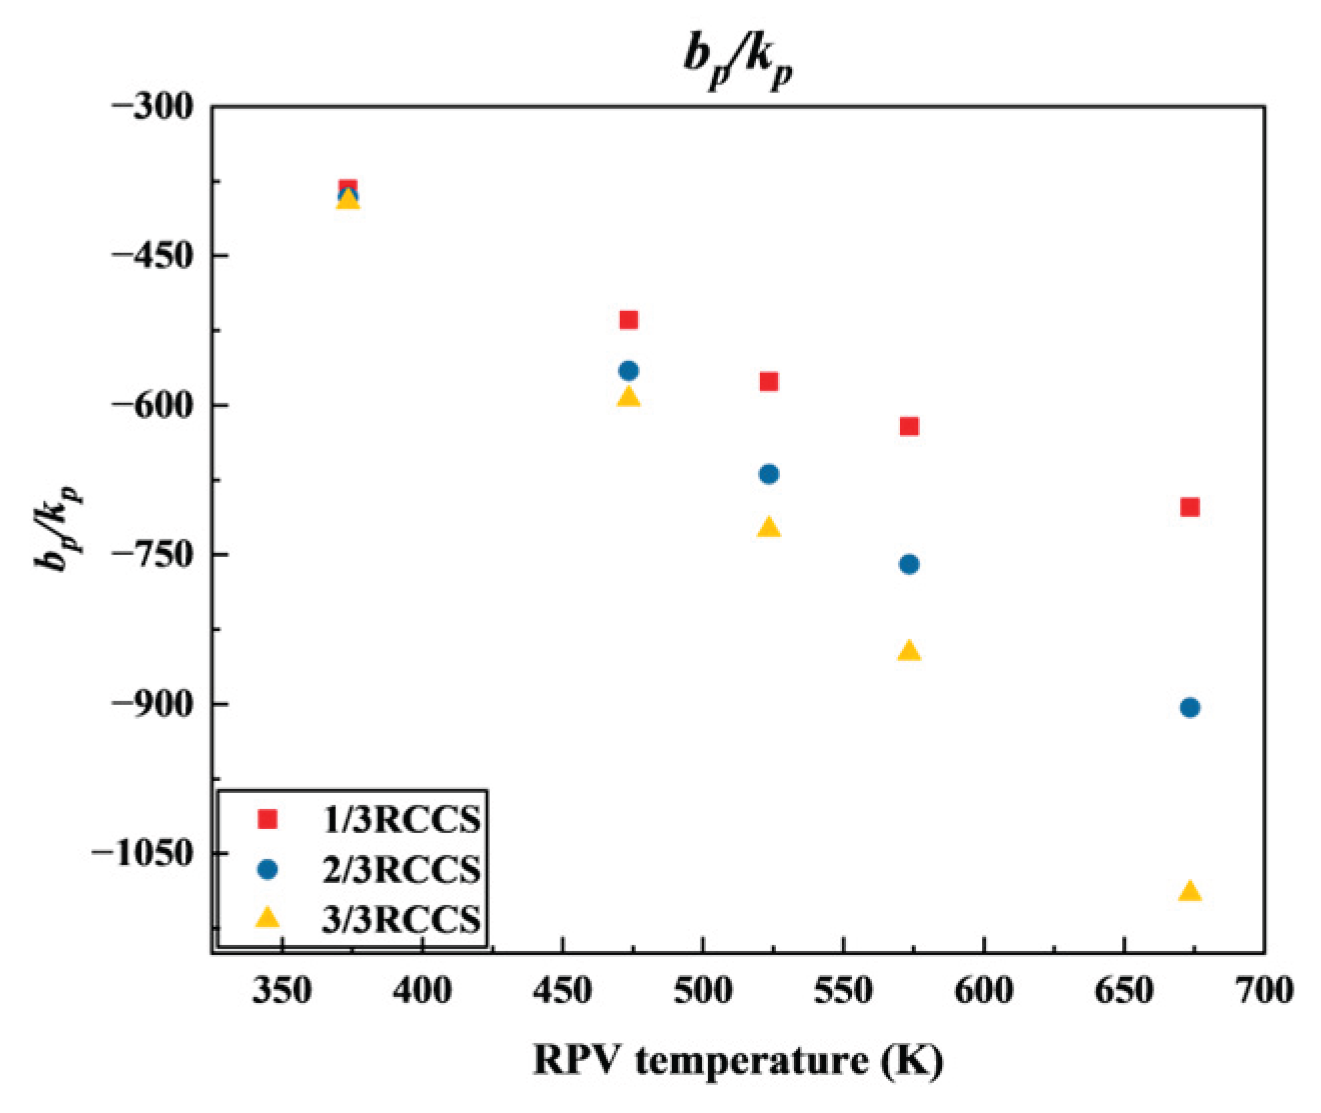
Figure 7.
Cooling water temperature under one set of RCCS: (a) Inlet water temperature under one set of RCCS; (b) Outlet water temperature under one set of RCCS; (c) Temperature difference under one set of RCCS.
Figure 7.
Cooling water temperature under one set of RCCS: (a) Inlet water temperature under one set of RCCS; (b) Outlet water temperature under one set of RCCS; (c) Temperature difference under one set of RCCS.
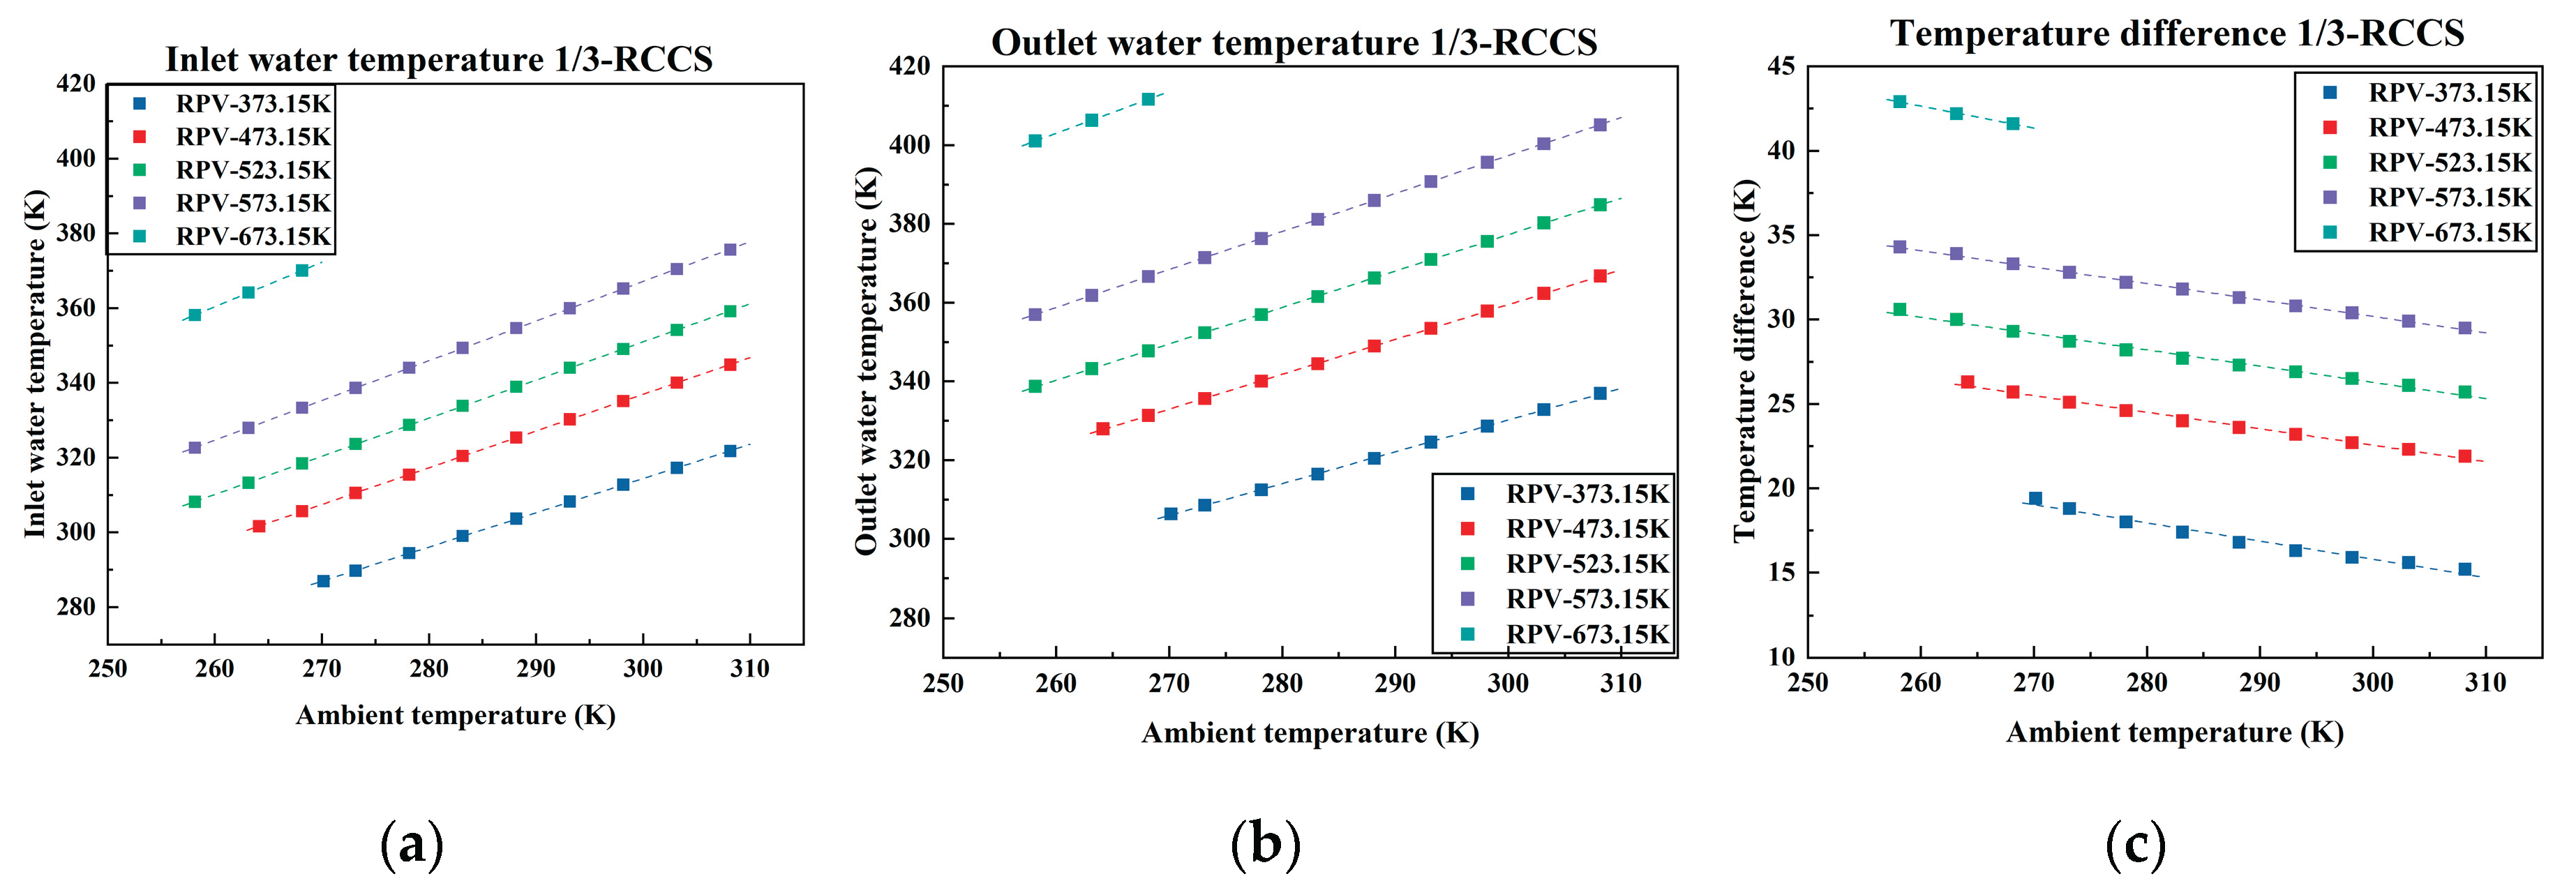
Figure 8.
Cooling water temperature under two sets of RCCS: (a) Inlet water temperature under two sets of RCCS; (b) Outlet water temperature under two sets of RCCS; (c) Temperature difference under two sets of RCCS.
Figure 8.
Cooling water temperature under two sets of RCCS: (a) Inlet water temperature under two sets of RCCS; (b) Outlet water temperature under two sets of RCCS; (c) Temperature difference under two sets of RCCS.
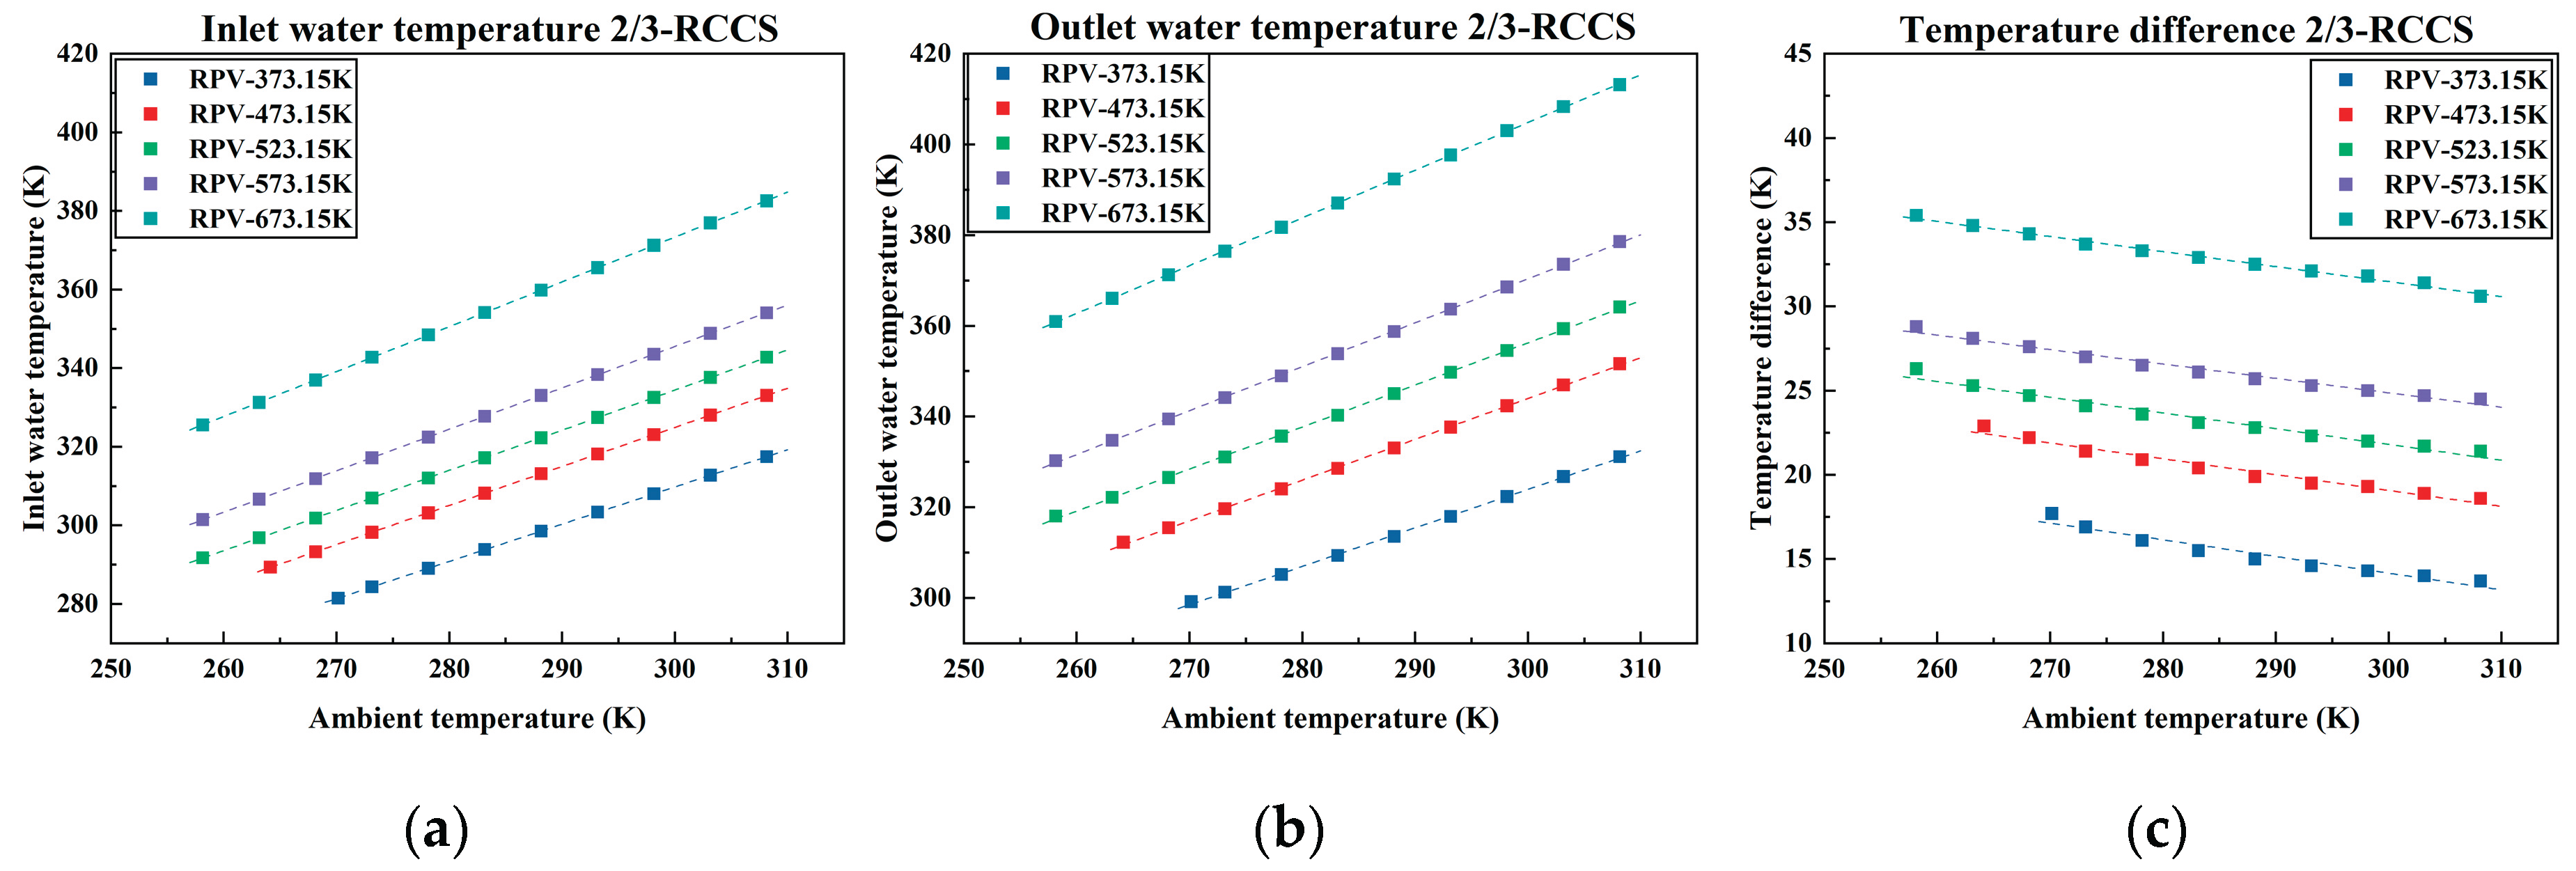
Figure 9.
Cooling water temperature under three sets of RCCS: (a) Inlet water temperature under three sets of RCCS; (b) Outlet water temperature under three sets of RCCS; (c) Temperature difference under three sets of RCCS.
Figure 9.
Cooling water temperature under three sets of RCCS: (a) Inlet water temperature under three sets of RCCS; (b) Outlet water temperature under three sets of RCCS; (c) Temperature difference under three sets of RCCS.
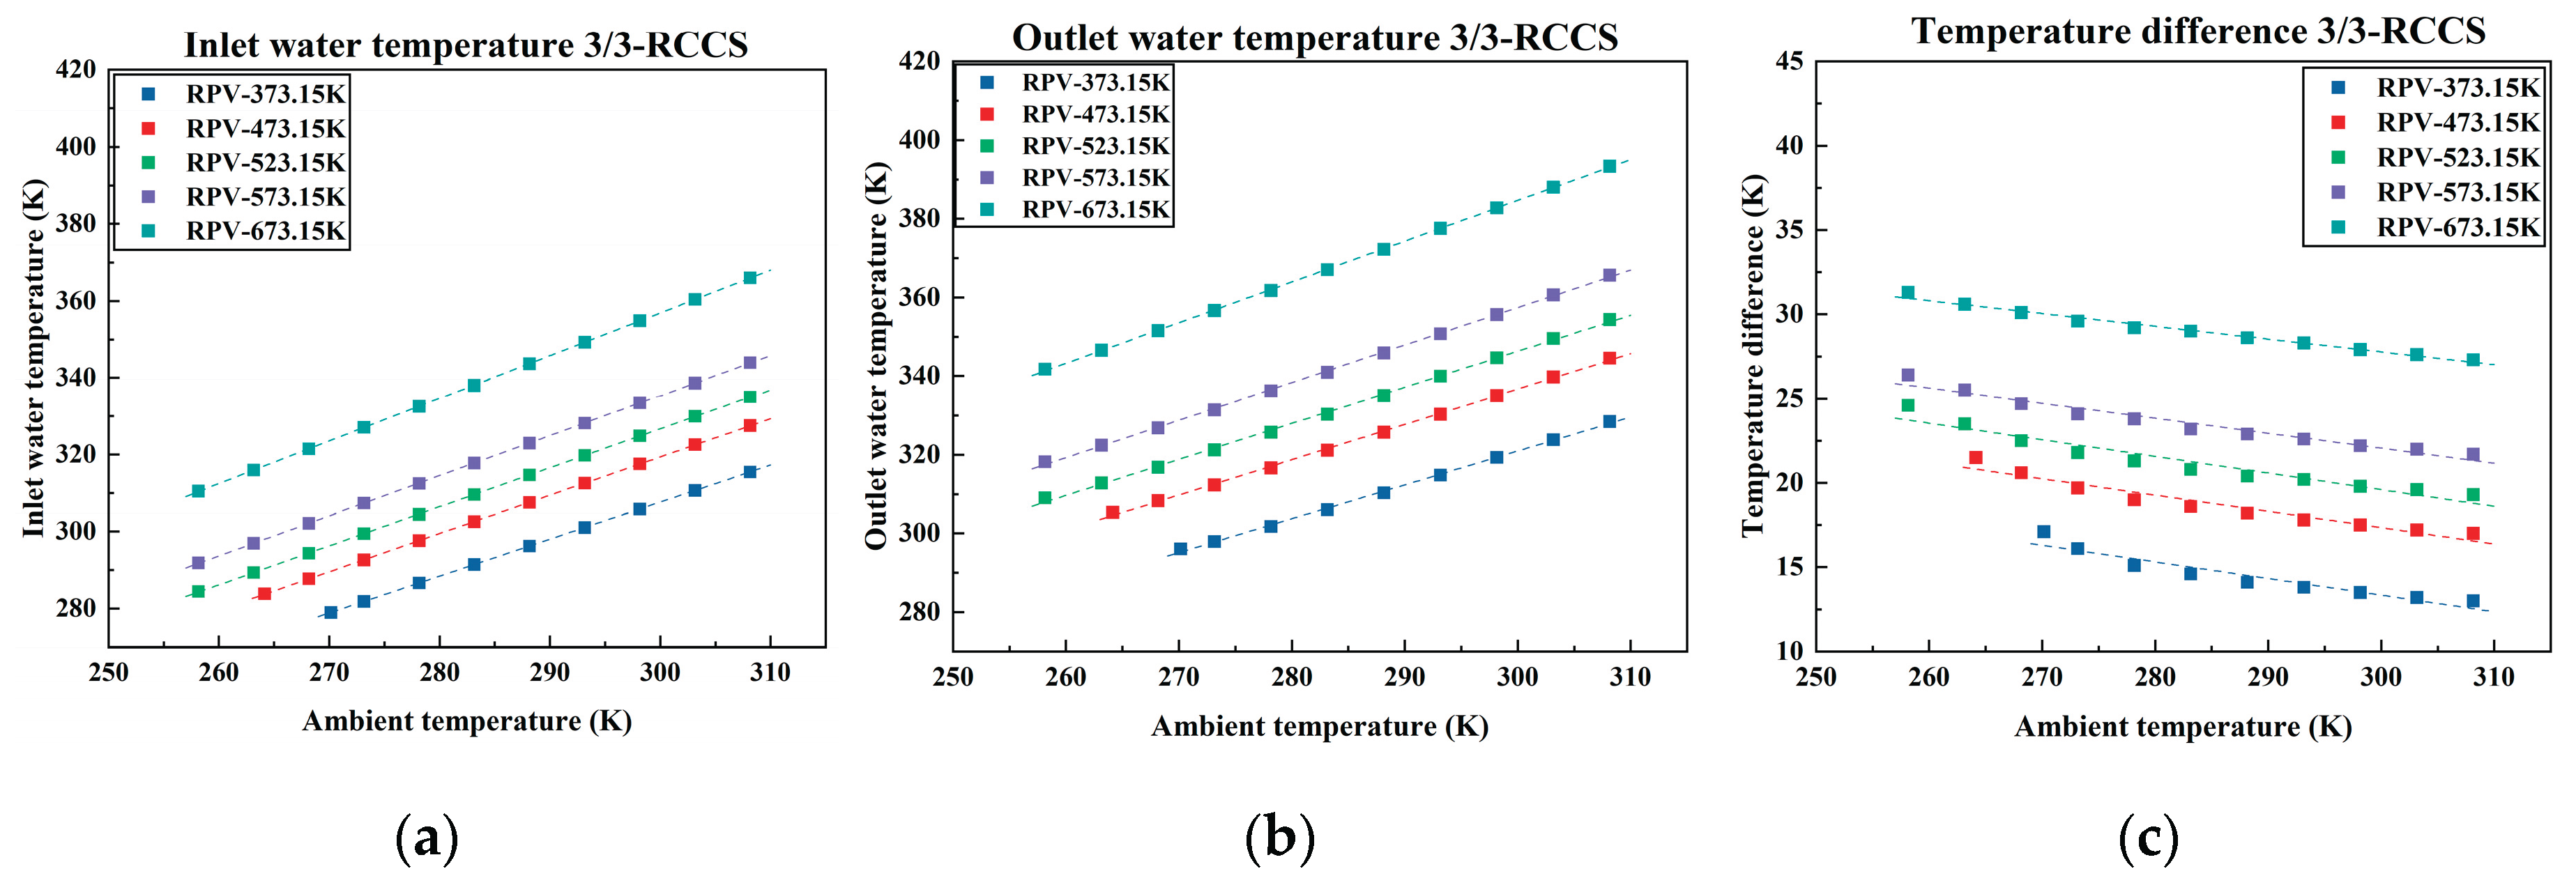
Figure 10.
RPV temperature distribution under different conditions.
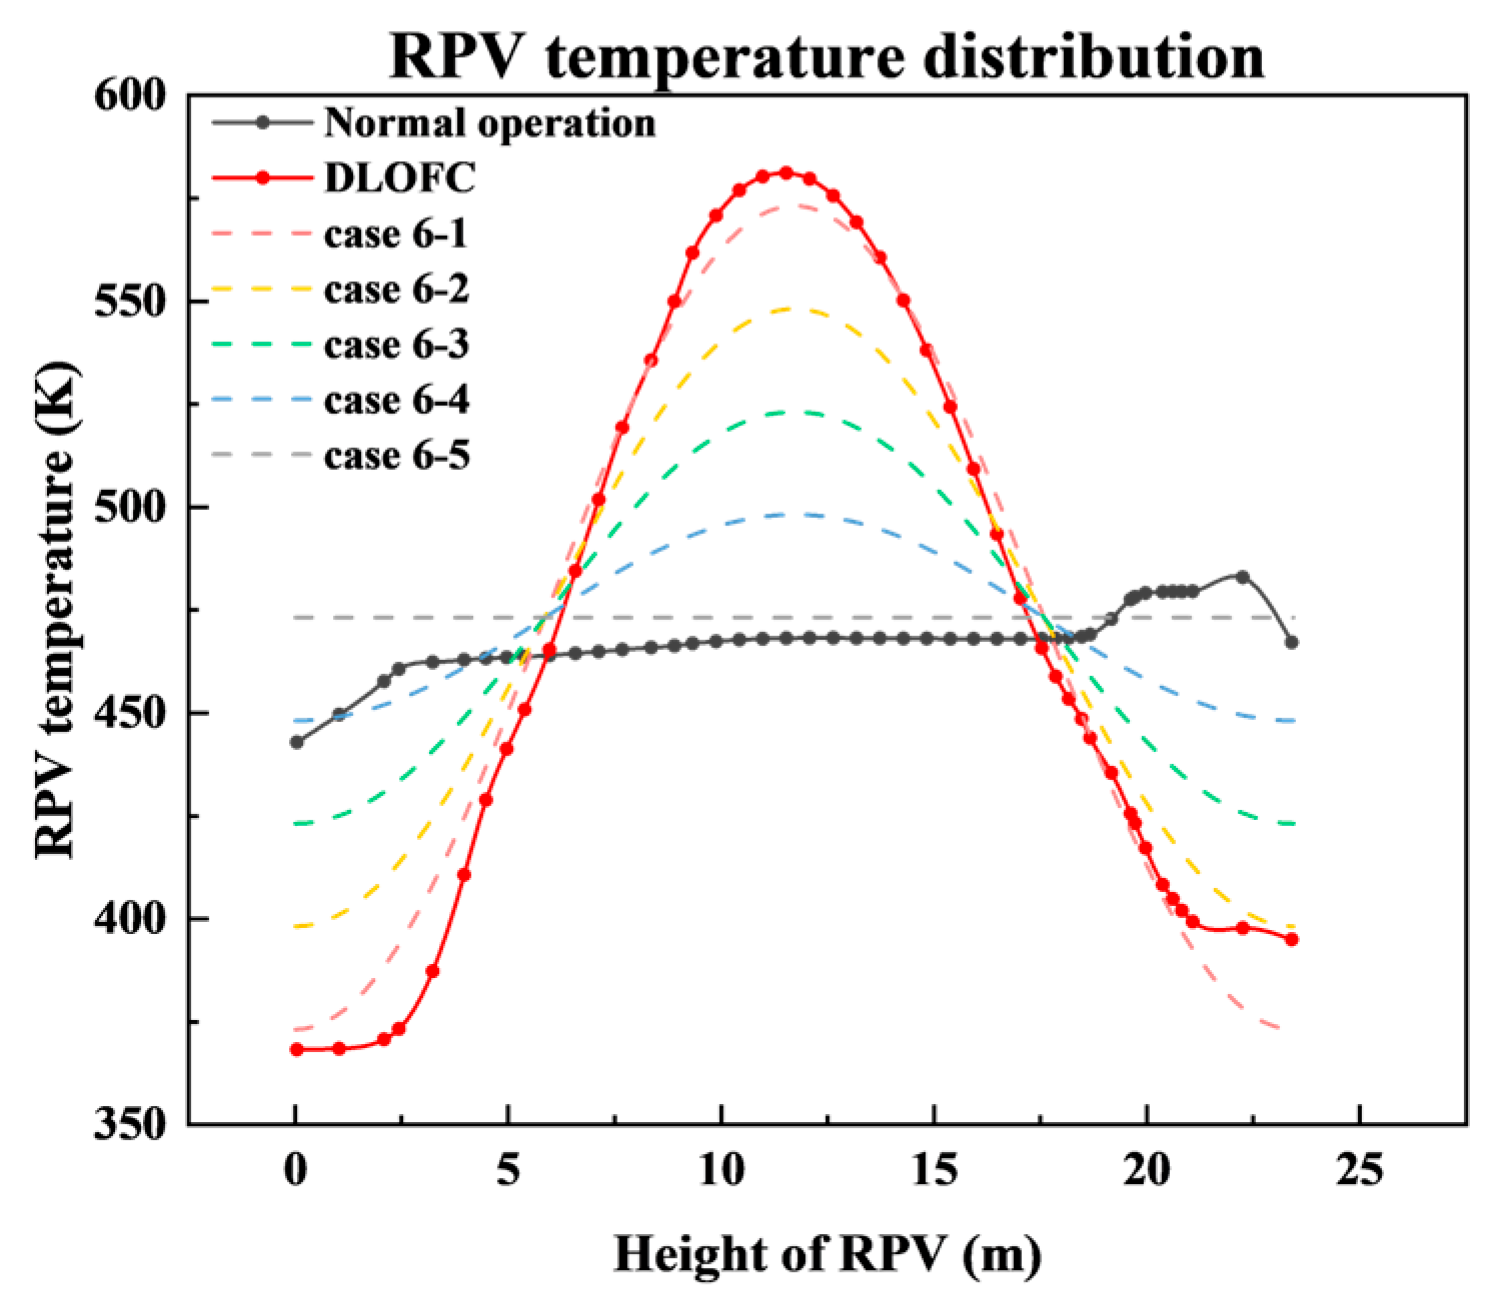
Figure 11.
Heat capacity under different RPV temperature distribution: (a) Total heat carrying capacity; (b) Thermal radiative heat transfer; (c) Natural convection heat transfer.
Figure 11.
Heat capacity under different RPV temperature distribution: (a) Total heat carrying capacity; (b) Thermal radiative heat transfer; (c) Natural convection heat transfer.
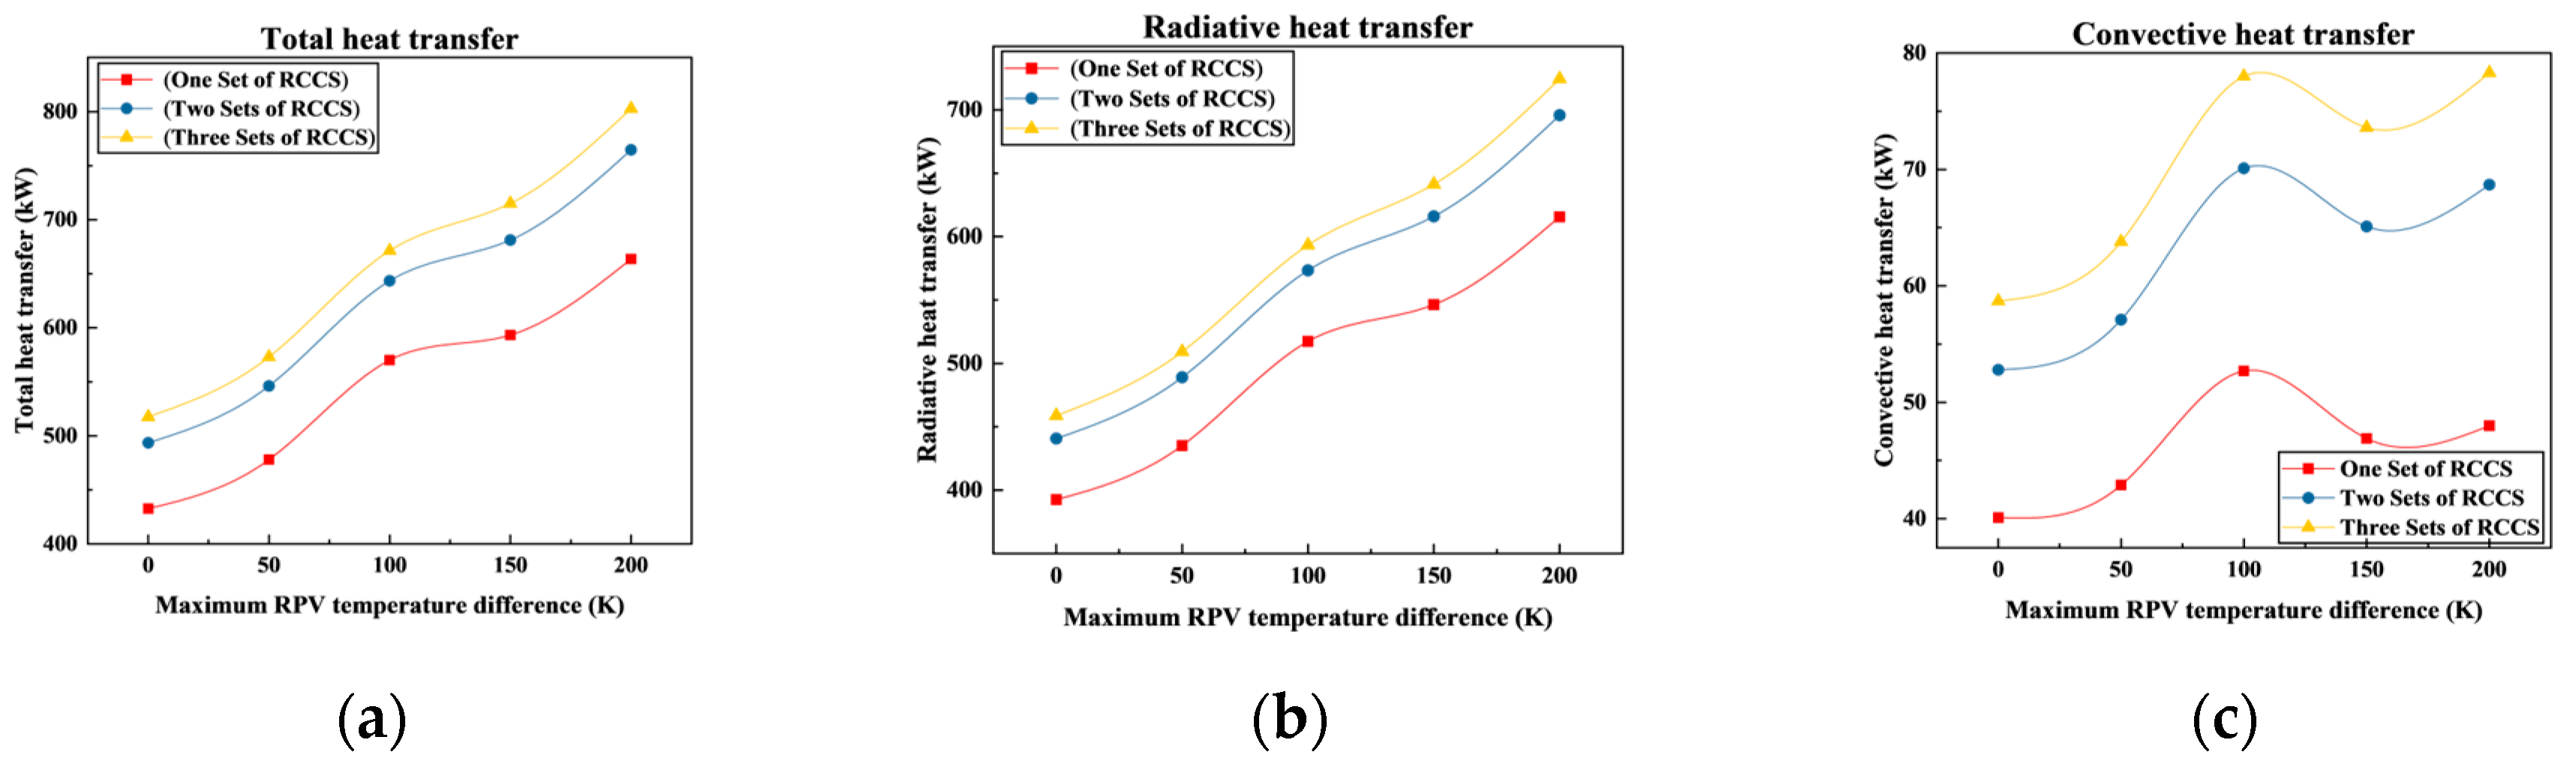
Figure 12.
Limit ambient temperature of RCCS under different conditions.
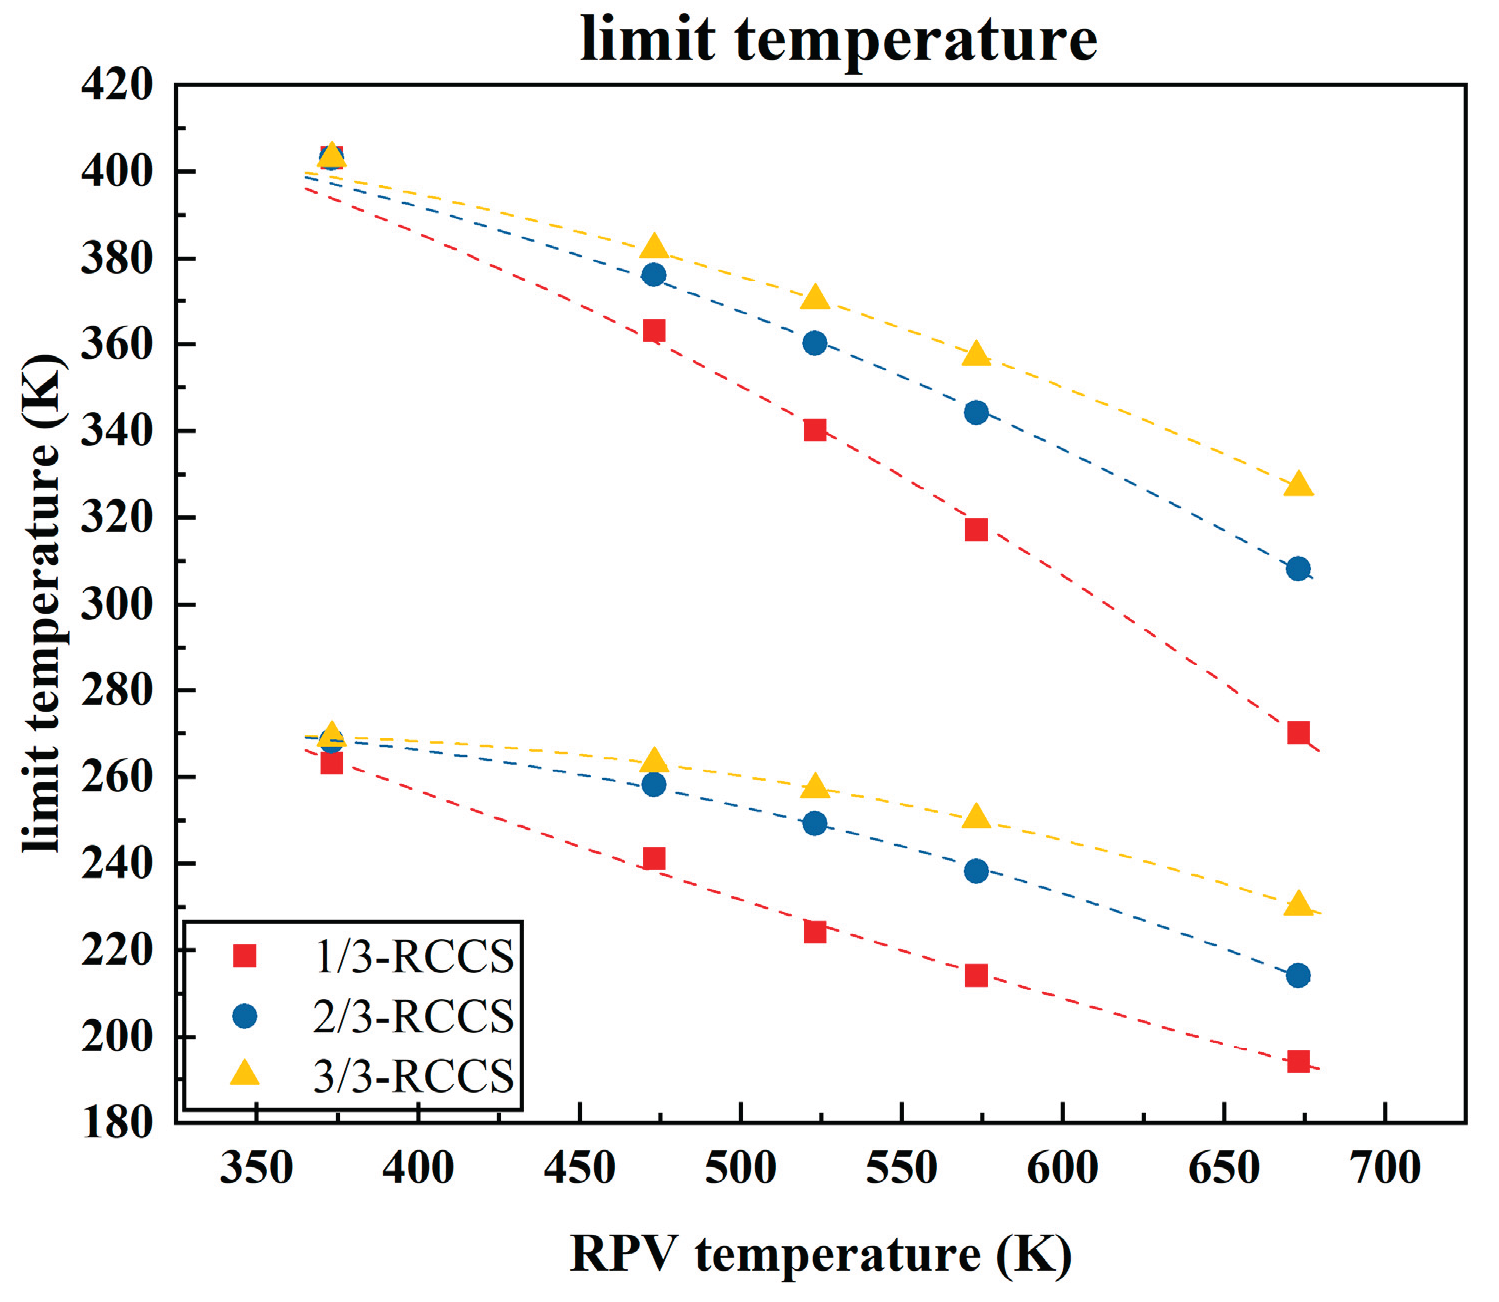
Table 1.
Table 1. Effective thermal conductivity under different sets of operational RCCS.
| Set of RCCS | Sketch | h (W / (m2 · K)) |
|---|---|---|
| 1 |  |
3λpδ/b2 |
| 2 | 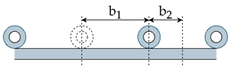 |
3λpδ/(b12 - b1b2 + b22) |
| 3 | 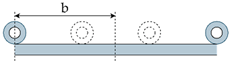 |
3λpδ/b2 |
Table 2.
Calculate Conditions.
| Case | RPV temperature (K) | Ambient temperature (K) | Set of RCCS |
|---|---|---|---|
| 1 | 373.15 | 258.15/263.15/268.15/ 273.15/278.15/283.15/ 288.15/293.15/298.15/ 303.15/308.15 |
1/2/3 |
| 2 | 473.15 | ||
| 3 | 523.15 | ||
| 4 | 573.15 | ||
| 5 | 673.15 | ||
| 6 | -100cos(2π*h/23.446)+473.15/ -75cos(2π*h/23.446)+ 473.15/ -50cos(2π*h/23.446)+ 473.15/ -25cos(2π*h/23.446)+ 473.15/ 473.15 |
293.15 |
Table 3.
Variables.
| Variable | Unit | Physical significance |
|---|---|---|
| Ac | m2 | Cross-sectional area of the pipe |
| ARPV | m2 | Area of RPV |
| Ak | m2 | Area of surface k |
| bp | kW | Intercept of the line |
| J/(kg∙K) | Specific heat capacity | |
| d | m | Diameter of the pipe |
| g | m/s2 | Gravitational acceleration |
| Hc | WCP height to annular cavity height ratio | |
| heff | W/(m2∙K) | |
| Jk | W/m2 | Net radiative heat transfer of surface k |
| kp | kW/K | Slope of the line |
| l | m | Length of the pipe |
| n | Operational sets of RCCS | |
| P | kW | Heat carrying capacity |
| Qc | W | Natural convection heat power on the outer wall of the annular cavity |
| Qr,k | W | Net radiative heat transfer of surface k |
| qx | W/m | Linear heat rate |
| Rc | Ratio of inner and outer wall radius in the annular cavity | |
| Ta | K | Ambient temperature |
| TRPV | K | RPV temperature |
| TWCP | K | WCP temperature |
| Tfreezing | K | Ambient temperature corresponding to water zero point |
| Tboiling | K | Ambient temperature corresponding to water boiling point |
| Tpipe | K | Temperature of the pipe wall |
| K | Average temperature of the steel panel | |
| ∆Tc | K | The difference between the highest and lowest temperatures on the RPV wall |
| ∆tc | K | The average temperature difference between the inner and outer walls of the annular cavity |
| u | m/s | Velocity of the fluid |
| Xk-i | View factor from surface k to surface i | |
| εk | Emissivity of surface k | |
| σ | W/(m2・K4) | Stefan-Boltzmann constant |
| kg/ m3 | Density | |
| Friction factor | ||
| Local loss coefficient | ||
| δ | m | Thickness of the panel |
| λp | W/(m∙K) | Thermal conductivity of the panel |
Disclaimer/Publisher’s Note: The statements, opinions and data contained in all publications are solely those of the individual author(s) and contributor(s) and not of MDPI and/or the editor(s). MDPI and/or the editor(s) disclaim responsibility for any injury to people or property resulting from any ideas, methods, instructions or products referred to in the content. |
© 2025 by the authors. Licensee MDPI, Basel, Switzerland. This article is an open access article distributed under the terms and conditions of the Creative Commons Attribution (CC BY) license (http://creativecommons.org/licenses/by/4.0/).
Copyright: This open access article is published under a Creative Commons CC BY 4.0 license, which permit the free download, distribution, and reuse, provided that the author and preprint are cited in any reuse.


