Submitted:
11 August 2025
Posted:
13 August 2025
You are already at the latest version
Abstract
Urban ecosystem services (ES) are increasingly recognized as critical determinants of residents’ quality of life and well-being. This study proposes a novel demand-supply matching framework that integrates ES concepts into community-level planning and service evaluation. Using 371 resident surveys across 10 communities in Wuhan, China, we identify key environmental elements contributing to perceived service quality. We combine a random forest algorithm to rank environmental feature importance with a Multinomial Logit (MNL) model to quantify their impacts. Results reveal that community autonomy, neighborhood relationships, environmental civilization, security monitoring, and digital infrastructure (e.g., optical fiber) are central to enhancing service quality. While provisioning and regulating services—like safety and infrastructure—are relatively well-established, cultural services such as social cohesion and civic participation remain under-supported. Our findings highlight the heterogeneity of residents’ environmental expectations and offer practical pathways to integrate ES thinking into community planning and budget allocation. The proposed data-driven approach helps bridge ecological theory with operational urban management.
Keywords:
community environment
; community management
; demand-supply matching
; random forest model
; service quality optimization
1. Raising the Problem
1.1. Research Background
Community is the basic unit of social life, connecting different actors and involving the development of grassroots democratic politics and the supply of basic public services. It is an important aspect of community residents’ lives and a bridge for transmitting residents’ needs information, which directly affects the satisfaction, happiness, and security of residents’ lives. In the report of the 19th National Congress, it is proposed to promote the focus of social governance down to the grassroots level, indicating the direction and focus of community governance in the new era. Community management and service, as an important part of community governance, should occupy a pivotal position in current community work. With the rapid development of China’s social economy and changes in main social contradictions, people’s demand for a better life is growing day by day. Communities residents pay more attention to their own living standards and quality, and have higher expectations and demands for community management and service quality, which are reflected not only in the physical environment but also in management practices, interpersonal dynamics, and other spiritual needs in order to achieve higher life satisfaction and happiness. Currently, many problems persist in community management and service. For instance, management entities like neighborhood committees, property companies, and owners’ committees have unclear roles, overlapping rights, responsibilities, and interests due to differences in their positions, resources, and actions. Community residents’ sense of belonging is weak, and their enthusiasm for participation is low, with community construction remaining primarily government-led.
1.2. Literature Review
1.2.1. Community Environment
Community environment is an important support and measurement index for the quality of life of community residents. The narrow sense of community environment only refers to the ecological green environment of the community, while the broad sense of community environment can be further understood by the research of relevant scholars. The academic community defines the community environment from different dimensions and indicators, and focuses on the community environment as follows. First of all, it pays attention to land use, space form, road traffic, green space, open space and other elements, which are the most direct factors [1] affecting community environment. Secondly, scholars such as Yang and Irvine believe that attention should be paid to the medical facilities in the community. When the residents of the community are equipped with abundant medical resources, the evaluation of the community environment will be more meaningful [2,3]. Finally, the research on the food environment near the community is also very important. Scholars Lin and Zhang et al believe that wet markets and hypermarkets are considered as health food stores, because they can provide a variety of fresh food choices and improve residents’ eating habits [4]. Health issues [5] should be paid more attention when studying community environment.
1.2.2. Quality and Measurement of Community Management
Community management is to manage all aspects of daily life of community residents in the community, and the standards of community management also involve all aspects of residents’ lives. Community management capabilities include community service provision, residents’ participation, community cultural leadership, community security and conflict adjustment, and community informatization capabilities [6]. Lian and other scholars believe that paying attention to community governance involves improving the service level of community governance, enhancing participation in community governance through diversity, giving full attention to the role of community education, and shaping new modes of [7] community communication. Scholar Ye et al. proposed that community governance capacity should include community service provision, residents’ participation, cultural leadership, security conflict supervision and community informatization capacity [8]. Scholars Wang et al. believe that in Chinese communities, the quality of management cannot be separated from the interaction [9]between party organizations, neighborhood committees and residents. Residents’ voluntary participation in community management can also effectively improve the quality of community management, providing a new way [10] to improve the measurement of community management. The current multi-management path has been recognized, and good progress has been made in the process of actual implementation.
1.2.3. Community Service Quality and Measurement
The quality of community service is more reflected in the supply of community public services, and there are also some researches on the service quality of community management departments. Nowadays, remarkable achievements have been made in the construction of community service quality, but there are still many problems, among which the imbalance of resource supply is an important phenomenon [11]. Some scholars He et al proposed that the development of big data and Internet technology can solve this problem [12] well. In terms of the construction of related index evaluation system, Kuo et al believe that the two key factors, the ability of service team and the reliability of service performance, have been proved to be important for the evaluation of community service quality [13]. Among them, education, safety and medical condition are also important indicators [14]to evaluate the quality of community service. At the same time, scholars Goethem et al. believe that a high-quality community service quality can significantly affect the physical and mental health of teenagers and improve the residential satisfaction [15] of elderly residents.
To sum up, the research on community environment and management is increasing day by day, which enriches the research results and inspires the research ideas of this paper. Through combing, it is found that the impact of community environment on community management and service quality has not reached a consensus, the empirical research is not enough, and the theoretical perspective needs to be continuously expanded. In the new period of social and economic development and transformation, starting from the demand-supply matching theory, it has important theoretical and practical significance to study the optimization and improvement of community environment, community management and service, so as to meet the aspirations of community residents for a better life.
2. Hypothesis, Data and Method
2.1. Research Hypothesis
The Person-Environment Fit theory can be traced back to the Parsons Environment Fit model on career decision proposed by Parsons. The model holds that matching personal traits with demands of career positions can help individuals make more correct career choices [16]. With the continuous development and improvement of the connotation of person-environment matching theory, Cable and Derue creatively subdivide the complementary matching into demand-ability matching and demandsupply matching. Demand-ability matching refers to the degree to which an individual’s ability meets the environmental needs; Demand-supply matching refers to the degree to which an individual’s needs are met in the environment. Different individuals have different needs, and whether the environmental capacity and supply can meet the individual’s needs determines the individual’s participation [17] in environmental activities. Based on previous studies, Ali creatively investigated the role of individualenvironment matching theory in improving teaching satisfaction and subjective wellbeing, including the matching between teachers’ teaching satisfaction and life satisfaction, person-organization matching, person-job matching, person-career matching, person-group matching and person-to-person matching [18]. Padmasiri extended the individual-environment matching theory to the family field for discussion, including person-job matching, person-organization matching, person-group matching, person-supervisor matching and person-family matching [19]. Inoue et al. studied the impact [20] of nurses learning and exchanging nursing practices inside and outside the hospital on various dimensions of their individual-environment fitness (demand-supply, demand-ability, individual-organization and individual-group fitness).
According to the demand-supply matching theory, when the needs and preferences of community residents are matched with the supply of environmental resources, the needs of community residents will be well met, which will promote the enthusiasm of residents in participating in organizational activities and construction. In the community life, the construction of all aspects of the community environment is a resource supply of the community itself, and the community residents also have their own strong material and spiritual needs for good community environment construction, in order to enjoy better community management and service, and improve the quality and level of life. When the community actors meet the needs of the community residents in a specific way, the needs of the community residents can better match the supply capacity of the community itself, so as to promote the residents to give a higher evaluation of the quality of community governance and service. The specific theoretical analysis framework is shown in Figure 1. Based on this, the research hypothesis is proposed:
H1: Community environment can positively affect community management and service quality. The better the community environment construction, the better the community residents’ evaluation of the community management and service quality.
H2: Community residents pay more attention to the construction of community cultural environment, and the cultural environment has a greater impact on community management and service quality than the physical environment.

Table 1.
Variable construction and descriptive statistics
| Category | Variable name | Construction Method | Mean | Standard |
|---|---|---|---|---|
| Community Management and Service quality |
Community management and service quality |
No effect, not very good, fair, fairly good, very good, on a scale of 1 to 5 |
3.68 | 1.05 |
| Overall appearance |
Community planning(sqgh) |
The value ranges from 1 to 5: very poor, poor, fair, good, very good |
3.81 | 0.99 |
| Community health (sqws) |
The value ranges from 1 to 5: very poor, poor, fair, good, very good |
3.70 | 1.03 | |
| Community Civilization (sqwm) |
Same as above | 3.88 | 0.94 | |
| Governance Democracy (glmz) |
Same as above | 3.78 | 1.00 | |
| Infrastructure | Through Optical Network (gxwl) |
Same as above | 3.62 | 1.22 |
| Parking Conditions (tctj) |
Same as above | 3.31 | 1.15 | |
| Property Management (wygl) |
Same as above | 3.24 | 1.23 | |
| Security Monitoring (abjk) |
Same as above | 3.52 | 1.12 | |
| Living facilities |
kindergarten (yey) | Same as above | 3.12 | 1.36 |
| Nursing home (yly) | Same as above | 2.53 | 1.29 | |
| Hypermarket (dxcs) | Same as above | 2.98 | 1.34 | |
| Community Health Station (sqylz) |
Same as above | 3.47 | 1.15 | |
| Community Room (sqhds) |
Same as above | 3.56 | 1.10 | |
| Cultural environment |
Neighborhood Relations (llgx) |
Same as above | 3.84 | 0.87 |
| Social Participation of Residents (shcy) |
Same as above | 3.78 | 0.92 | |
| Community Organization Leadership (zzld) |
Same as above | 3.88 | 0.88 | |
| Self-government of the population (zzqk) |
Same as above | 3.75 | 0.90 | |
| Resident and Community Relations (sqgx) |
Same as above | 3.68 | 1.05 |
2.2. Research Methods
2.2.1. Random Forest Model
Random Forest model is a machine learning algorithm [21]based on classification tree proposed by Breiman. The random forest model takes the decision tree model as the base evaluator, and obtains the prediction result by constructing multiple decision trees. The construction idea of the decision tree model is to make top-down recursive segmentation of data to form a top-down splitting tree with the goal of reducing the impurity. The measure of the importance of the feature can be obtained by averaging the decreasing amplitude of the impurity caused by the feature in all the decision tree models in the random forest. In this paper, the random forest model is used as an analysis method to better explain the collected data sample set. The formula for calculating the importance of indicators is as follows:
In formula (1), represents the importance of the k factor, represents the total number of features, the number of decision tree trees and the number of nodes of a single decision tree, and represents the average Gini index reduction rate of the k feature in the jnode of the itree.
2.2.2. Mlogit Model
Explanatory variables are community management and service quality, corresponding to "community governance and service effect evaluation" in the questionnaire survey, which is divided into 5 options: "No effect, not good, average, relatively good, very good", corresponding score is 1 to 5, the higher the score indicates that the community residents think the community quality and service level is better, and the explanatory variables in this paper are multiple categorical variables. Therefore, the Mlogit model was selected for analysis. The premise of community residents choosing community environmental factors to evaluate the scores of community governance and environmental quality is that if and only if community residents choose community environmental factors to bring higher effects than other community environmental factors. j i j The model is constructed as follows:
In formula (2), represents the probability of community residents’ evaluation of community management and service quality i ; Is the evaluation score of the i respondent on community management and service quality, and is the factor affecting community governance and service governance, including 18 community environmental elements corresponding to the overall appearance, infrastructure, living facilities and human environment in the community environment; is the estimated coefficient of the influencing factors, indicating the multiple of the increase of the individual’s score on the first factor relative to the probability ratio of choosing to score 1 point when the value of other influencing factors remains unchanged; is the constant term and is the random error term.
2.2.3. Ordered Logit Model
This paper mainly investigates the key factors affecting community residents’ evaluation of community management and service quality, and the evaluation of the effect of community management and service quality corresponds to a score of 1 to 5, which is a discrete selection variable. Considering that community management and service quality are orderly and multi-categorical variables, the estimation of community management and service quality using a general linear model is highly likely to produce large errors, based on this, In this paper, the ordered Logit model is selected. The specific model is as follows:
Where, is the evaluation of the i respondent on community management and service quality, is the intercept term, is the parameter vector to be estimated, sqgh is the acronym of the name of the independent variable, is the characteristic variable of the first respondent, is the random error term.
3. Empirical Analysis
3.1. Parameter Setting of Random Forest Model
Based on Andy Liaw’s experience in determining parameter mtry when establishing random forest algorithm, the prediction performance of random forest algorithm is better when mtry=p/3, where p is the number of variables introduced into the model. In this paper, 18 variables were introduced in the establishment of the random forest algorithm, so the value of mtry was set to 6, and the change of model error with the increase of the number of decision trees was drawn, so as to determine the number of optimal Ntrees. It can be seen from Figure 2 that ntree becomes stable at around 200. This paper further sets ntree at 200, and observes the changes of the goodness of fit and residual square of mtry gradually increasing from 1-9. When mtry=1, the average sum of squares of residuals of the model is the smallest and the goodness of fit is the best. Therefore, 1 is finally selected as the optimal mtry value.
3.2. Importance Identification of Community Management and Service Quality
3.2.1. Benchmark Results
The decision tree, as the base evaluator of random forest, branches from top to bottom according to the degree of impurity reduction. The closer the explanatory variable is to the top of the decision tree, the more explanatory it is to the explained variable in the model. From this, the importance ranking of features can be obtained, and the community environment elements that have a greater impact on community management and service quality can be identified. Figure 3 and Table 2 respectively show the importance ranking of the information features based on the full sample, in which the horizontal axis in Figure 3 represents the scores corresponding to the importance level, the vertical axis represents the Chinese acronym names of all explanatory variables, and the specific numerical importance level in Table 2 corresponds to the horizontal axis in Figure 3. It is helpful to understand the importance ranking of 18 community environmental factors by community residents more accurately. The top five elements of community environment ranking are: residents’ self-governance (zzqk), residents and community relations (sqgx), community civilization (sqwm), security monitoring (abjk), and access to optical fiber network (gxwl). With the rapid development of social economy and the increasing improvement of people’s living standards, both fixed city residents and a large number of resident migrants in the city have put forward higher requirements and expectations for the construction of community environment, which not only includes visual physical environment such as sports facilities and community health, but also residents have gradually begun to pay attention to the construction of human environment in community governance. This is consistent with the results of the benchmark importance ranking. Community residents have higher demand for the cultural environment in the aspects of residents’ autonomy and residents’ relations with the community, while the demand for infrastructure environment such as security monitoring and fiber optic network is relatively low.
In order to better show the decision-making process of random forest, the regression tree graph is further drawn in this paper, as shown in Figure 4. According to the principle of the random forest model, the regression tree takes the features that bring the greatest degree of node impurity reduction after splitting as branch nodes and branches them from top to bottom. The features at the top of the tree bring the greatest degree of impurity reduction, that is, the features closer to the top of the tree have the greatest influence on community management and community service quality. Since the prediction results of the random forest model are the average results of the predictions of multiple trees, a regression tree is randomly selected for visualization for ease of presentation. It can be found that the variables from the top of the tree to the bottom in the figure are resident and community relations (sqgx), optical fiber network (gxwl), community civilization (sqwm), community planning (sqgh) and organizational leadership (zzld). This is basically consistent with the feature importance ranking based on the whole sample estimation, which enhances the credibility of the analysis results.
In order to further verify the explanatory power of random forest, this paper uses Mlogit model and ordered Logit model to further investigate the impact of community residents on community management and service quality evaluation based on community environment. The explanatory variables in this paper are multi-categorical variables, and the application of Mlogit model is mainly to select the base group. All coefficients are estimated relative to the base group, emphasizing the relative choice among multiple options, and explaining the model parameters from the perspective of odds ratio, so as to maximize the utility of individual choice. The idea of Mlogit model originated from the Logit model. The explanatory variables in this paper are five degrees of satisfaction from low to high ranking, and are classified ordered multicategorical variables. It is appropriate to use the ordered Logit model to further verify the impact of community residents on community management and service quality evaluation based on community environment. In this paper, before using these two models to investigate the impact of community environment on community management and service quality, firstly, Lasso regression was used to reduce the dimensionality of the data. Lasso regression is a kind of data dimensionality reduction method, good at dealing with variable screening, to reduce the variable set for the idea of compression estimation, by constructing a penalty function to sample data variable selection, to prevent data overfitting, not only can be used for linear relations, can also be used for nonlinear relations. The concrete performance is that it can compress the coefficient of the variable and compress some insignificant variable coefficients to 0, so as to achieve the purpose of variable selection. Through Lasso regression processing of the data, the results show that the coefficients of the three explanatory variables, namely community civilization (sqwm), management democracy (glmz) and community activity room (sqhds), are 0, which are non-important variables. These three variables will not be included in the analysis of the following model.
Table 3.
Lasso regression results
| Variable | Coefficient | IncNodePurity |
|---|---|---|
| sqgh | -0.058 | 11.460 |
| sqws | 0.141 | 9.793 |
| sqwm | 0 | 12.527 |
| glmz | 0 | 10.742 |
| gxwl | 0.225 | 12.298 |
| tctj | -0.152 | 8.644 |
| wygl | -0.025 | 9.448 |
| abjk | 0.097 | 11.582 |
| yey | -0.032 | 9.865 |
| yly | -0.052 | 9.105 |
| dxcs | -0.041 | 9.666 |
| sqylz | 0.091 | 10.101 |
| sqhds | 0 | 10.122 |
| llgx | 0.052 | 9.771 |
| shcy | -0.108 | 9.947 |
| zzld | 0.038 | 13.410 |
| zzqk | 0.080 | 14.148 |
| sqgx | 0.291 | 14.446 |
Variables whose coefficients are not 0 in Lasso regression results are selected and brought into Mlogit model for further analysis, so that the model can better explain the results. Table 4 reports the model estimation results of the impact of community environmental factors on community management and service quality, in which columns (1) - (4) represent the results of Mlogit analysis, and column (5) represents the results of OLS linear regression. In this paper, the analysis results in column (4) are selected as an example to illustrate, because the evaluation of community residents on community management and service quality is mainly reflected in the situation of relative high scores, and the first five explanatory variables that show a positive correlation between the results are emphasized. In column (4), when other variables do not change, when residents score 5 points on the evaluation of community management and service quality, compared with 1 point, the score coefficient of community health (sqws) will increase by 1.824, the score coefficient of optical fiber network (gxwl) will increase by 1.194, and the score coefficient of security monitoring (abjk) will increase by 1.264. The score coefficient of residents and community relations (sqgx) will increase by 1.964, and the score coefficient of community organization leadership (zzld) will increase by 1.434. In other words, residents pay more attention to these aspects of community environmental factors. According to the coefficient size, the importance of community residents’ demand for community environmental factors can be deduced as follows: Residents and community relations> Community health > Community organization leadership>Community health > Access to optical fiber network. In the OLS regression analysis results in column (5), it can be found that the top five community environment elements are: residents and community relations (sqgx), optical fiber network (gxwl), community health (sqws), security monitoring (abjk), and community organization leadership (zzld) according to the order of the coefficient of positive correlation regression results. Finally, the significance degree and value of these two regression coefficients were integrated, and the top 5 community environmental factors were: residents and community relations (sqgx), optical fiber network (gxwl), community health (sqws), community organization leadership (zzld), and security monitoring (abjk).
Then, in order to further verify the above analysis results and make the data analysis results more convincing, controlling the variables at the individual level and the community level, the ordered Logit model was used to investigate the impact of the remaining 15 community environment variables on the community management and service quality. Specifically, in the regression results of the ordered Logit model, the community environmental factors that have a significant positive impact on community management and service quality are selected and sorted according to the size of the regression coefficient to obtain the ranking of community environmental factors that affect community management and service quality. In order, they were gxwl, abjk, sqgx, zzld and zzqk. The specific results can be seen in Table 5.
Table 6 shows the analysis results of community environmental importance characteristics based on Mlogit model, ordered Logit model and random forest model. According to the ranking of important features of the results of the three models, it is found that residents and community relations (sqgx) and optical fiber network (gxwl) are relatively high in the comprehensive importance rankings of the three models. At the same time, the ranking of these two elements in the random forest model is also relatively high, which also shows the robustness of the conclusions of this paper. The random forest model can effectively avoid the problems of reduction of freedom and collinearity, and obtain more accurate and reliable importance features.
3.2.2. Heterogeneity Analysis
The above feature importance ranking is based on the whole sample. For different types of communities, is there a significant difference in the importance of factors affecting community residents’ evaluation of community environment? The survey in this paper includes five major community types, namely commercial housing, unit housing, urban village, urban-rural integration and new countryside. Since the survey samples of urban village, urban-rural integration and new countryside take up a small proportion of the total survey samples, in order to make the heterogeneity analysis more representative, In the end, only two types of community with relatively large sample size (more than 100 samples), commercial housing and unit housing, were selected for heterogeneity analysis, and the impact of community environmental factors on the management and service quality of these two different types of communities was investigated respectively. Based on the estimation results of the importance characteristics of commercial housing and unit housing shown in Figure 5, it can be seen that for residents of commercial housing communities, the top 5 community environmental factors in terms of importance are as follows: Residents and community relations (sqgx), access to optical fiber network (gxwl), community health (sqws), hypermarket (dxcs) and management democracy (glmz). For the residents of the unit type community, the top five elements of community environment in terms of importance are: resident autonomy (zzqk), resident and community relations (sqgx), security monitoring (abjk), community organization leadership (zzld) and community civilization (sqwm). The above results indicate that residents of both commercial housing and unit housing types attach great importance to resident-community relations, which is similar to the estimated results of the full sample. Relatively speaking, commercial housing communities attach more importance to the relationship between residents and communities, which may be due to the fact that the buyers of commercial housing come from different regions, engage in different industries, and have more diverse types of personnel. Residents may have a stronger demand for the humanistic environment of the community environment. On the other hand, the unit housing community pays less attention to the relationship between residents and the community, but pays more attention to the autonomy of residents. The analysis may be due to the fact that the unit housing community is generally earned by the supporting work and welfare of the staff within the system, the overall quality of the staff is higher, the community is older and the community management subject is more single. Community management and services come more from the selfmanagement of community residents.
3.3. Path Analysis of Community Management and Service Quality Optimization
The above importance analysis of community environmental factor ranking provides direction and guidance for improving community management and service quality. However, the specific optimization path also needs to consider the economic conditions of different communities and the marginal income effect brought by the corresponding investment in community environment improvement. This paper uses the bias effect graph analysis tool to try to reveal the optimization path of community environment construction in Wuhan City to improve community management and service quality. The partial effect graph of a feature reflects the influence of the marginal change of the feature on the explained variable when the values of other features remain unchanged, and can reveal the marginal effect size under different values of the feature. Figure 6 shows the feature effects that affect community management and service quality. For the sake of analysis and presentation, only the top 4 community environmental factors that contribute to the improvement of community management and service quality based on the above analysis are reported: residents and community relations (sqgx), security monitoring (abjk), optical fiber network (gxwl) and community organization leadership (zzld). Among them, the Y-axis community residents’ rating is the community management and service quality, with options ranging from "no effect" to "very good", corresponding scores ranging from 1 to 5, the higher the value, the better the community management and service quality. The X-axis is the community residents’ evaluation of the community environment elements, the options from "very poor" and "very good" 5, corresponding values of 1 to 5, the higher the value indicates that the community residents think the community environment is better built. The partial effect curve reflects the marginal impact on community management and service quality after increasing investment in community environment construction under the condition that other conditions remain unchanged.
By observing the change trend of the curve in the bias effect diagram, it can be found that the bias effect diagram of each community environmental factor has two or three obvious turning points, which can divide the community environmental factor input into different stages. The higher the slope, the higher the improvement of community management and service quality brought by the input of community environmental factors, and the stage with the highest slope is the optimal interval. The partial effect curve of residents and community relations (sqgx) has the highest slope between 4-5, and the average input level of community environmental factors in the surveyed communities has not reached 4. Therefore, communities need to pay more attention to the construction of residents and community relations in the future to improve community management and service quality. The bias effect curve of security monitoring (abjk) has the largest slope between 3 and 4, and the input level of the sample community in this basic environment construction is higher than 3 and close to 4, indicating that the sample community has been in a relatively optimal range in the construction of security monitoring. The bias effect curve of the optical fiber network (gxwl) has the largest slope between 3-4, and the sample community’s construction investment level is close to 4, indicating that the sample community has been in a relatively optimal range in the environmental construction of the optical fiber network. The optimal range of community organization leadership (zzld) is 4-5, but the current investment in ZZLD is lower than 4, indicating that the management and service of sample communities in the future need to further strengthen the construction of the human environment of community organization leadership. In summary, the sample communities are already at a good level in the construction of basic environment such as security monitoring and optical fiber network. In the future, under the condition of limited community construction funds, we should focus on the construction of humanistic environment such as the relationship between residents and communities and the leadership of community organizations. At the same time, we should also pay attention to the construction of basic physical environment of communities. To improve the quality of community management and service in a targeted manner.
4. Conclusions and Suggestions
4.1. Research Conclusions
Based on 312 questionnaire survey data collected from residents in 10 communities in Wuhan City, this study divides community environment into four levels from the macro level: overall appearance, infrastructure, living facilities and human environment. From the perspective of demand-supply matching, this study provides a new interpretation perspective for community environment’s impact on community management and service quality. The influence of community environment on community management and service quality was analyzed, the important elements of community environment that affect community management and service quality were revealed, and the optimization path of community environment construction was further proposed. The specific conclusions are as follows:
(1)Based on Random forest model and Mlogit model, the factors of community environment construction that have a greater impact on community management and service quality are identified. In the Random Forest model, the top 5 community environmental factors that improve the quality of community management and service are: resident autonomy (zzqk), resident and community relations (sqgx), community civilization (sqwm), security monitoring (abjk), and access to optical fiber network (gxwl). The ranking of factors affecting community management and service quality in Mlogit model is as follows: residents and community relations (sqgx), access to fiber optic network (gxwl), community health (sqws), community organization leadership (zzld), security monitoring (abjk). The empirical results show that community environment has a positive impact on community residents’ evaluation of community management and service quality, and community residents pay more attention to the construction of community human environment.
(2)There is heterogeneity in the importance of community environment factors affecting community management and service quality. The results show that the community, no matter the type of commercial housing or unit housing, attaches great importance to the relationship between residents and community. Relatively speaking, the commercial housing community pays more attention to the relationship between residents and community, while the unit housing community pays more attention to the autonomy of residents. This is related to community attributes and personnel composition. Commercial housing pays more attention to economic attributes and personnel composition is diverse and complex; While the unit housing is mostly the supporting welfare of the institutional staff, the personnel is relatively fixed, and the overall quality is high. These conclusions provide theoretical basis and practical reference for fine environmental construction in different communities.
(3)Using the bias effect graph analysis tool, the optimization path of community environment construction to improve the quality of community management and service in Wuhan City was revealed. The results of the bias effect graph analysis show that the sample communities are already at a good level in the basic environmental construction such as security monitoring and optical fiber network, and need to increase economic investment in the relations between residents and communities and the leadership of community organizations.
4.2. Research Suggestions
(1)Focus on the construction of community in the aspect of cultural environment to meet the spiritual needs of community residents. The community can often organize cultural and recreational activities to enhance the organizational relationship between residents and the community, and promote the formation of a good community atmosphere and harmonious interpersonal relations; At the same time, the democratization of community management autonomy should be increased, and community residents should be encouraged to participate in community affairs, so that they can become managers and participants from residents, and improve the community sense of belonging and identity of community residents.
(2)Different community environment construction measures should be taken according to different community types. For the commercial housing community with complex personnel composition, its infrastructure is relatively sound, and more attention should be paid to the construction of human environment to improve the management and service level of the community; And for the unit housing community, its residents are of high quality, the community autonomy is better, but the infrastructure is relatively old, can be targeted to improve.
(3)Reasonable planning of the use of community environment construction funds. Use scientific means to accurately understand the status quo and shortcomings of community environmental construction, do pre-research, and listen to the needs and suggestions of community residents; According to the uneven situation of community environmental construction, reasonable fund budget allocation is given, focusing on the short-board elements of environmental construction, and improving the marginal utility of limited fund use.
Ethics Approval and Consent to Participate
Not applicable.
Consent for Publication
Not applicable.
Author Contributions
F.Z. designed the research framework and wrote the theoretical analysis part of the manuscript. Y.D. collected and analyzed the data, and also contributed to the interpretation of the results. S.H. prepared all the figures and tables in the manuscript, making the data presentation more intuitive. Y.D. reviewed and revised the entire manuscript, providing valuable suggestions to improve the overall quality and coherence. All authors approved the final version of the manuscript.
Funding
The research was partially supported in part by the National Natural Science Foundation of China with award number 62372409, by the Ministry of Science and Technology with award number DL2023147001L, and by the Zhejiang University with award number 226202200238.
Acknowledgments
Not applicable.
Conflicts of Interest
The authors declare no competing interests.
References
- Frank, L.D.; Schmid, T.L.; Sallis, J.F.; Chapman, J.; Saelens, B.E. Linking objectively measured physical activity with objectively measured urban form: Findings from SMARTRAQ. American Journal of Preventive Medicine 2005, 28, 117–125. [Google Scholar] [CrossRef] [PubMed]
- Yang, X.; Liu, H. Health Resource Geographic Allocation and Health Outcome: An Empirical Analysis Based on Cross-province Data. Chinese Health Economics 2016, 35, 63–65. [Google Scholar]
- Irvine, K.N.; Warber, S.L.; Patrick, D.W.; Gaston, K.J. Understanding urban green space as a health resource: A qualitative comparison of visit motivation and derived effects among park users in Sheffield, UK. International Journal of Environmental Research and Public Health 2013, 10. [Google Scholar] [CrossRef] [PubMed]
- Lin, X.; Yang, J. Built Environment And Public Health Review And Planning In North American Metropolitan Areas. Planners 2015, 31, 12–19. [Google Scholar]
- Zhang, Y.; Liu, N.; Long, Y. Research on Healthy Neighborhood Evaluation System Based on the Combined Perspectives of Urban Planning and Public Health. Landscape Architecture 2020, 27, 96–103. [Google Scholar]
- Bray, D. Building ’community’: New strategies of governance in urban China. Economy and Society 2006, 35, 530–549. [Google Scholar] [CrossRef]
- Lian, X.; Li, D.; Di, W.; et al. Research on influential factors of satisfaction for residents in unit Communities—Taking ningbo city as an example. Sustainability 2022, 14, 6687. [Google Scholar] [CrossRef]
- Ye, J. Governance ability of rural-to-residential communities: Dimensions, influencing factors and improvement paths. Zhongzhou Academic Journal 2021, 59–65. [Google Scholar]
- Wang, P.; Li, T. Research on the Interrelationship between Party Organizations and Neighborhood Committees in Chinese Urban Communities—Based on Community Case Analysis in C, N and B Cities. Hebei Journal 2021, 41, 191–199. [Google Scholar]
- Wang, S. Building a community: The Effective Path of Promoting Party Building and Leading Community Autonomy in the New Era. Strives Realism 2021, 42, 110–152. [Google Scholar]
- Wang, K.; Sun, S.; Xu, R. Research on precise supply of community public services: Micro-logic and fine way. Journal of Fuyang Normal University (Social Science) 2020, 109–117. [Google Scholar]
- He, J.; Shao, Y. Three-dimensional model of intelligent supply in community public service and construction of operating mechanism system. Journal of Gansu Administration Institute 2019, 64–75. [Google Scholar]
- Kuo, Y.C.; Chou, J.S.; Sun, K.S. Elucidating how service quality constructs influence resident satisfaction with condominium management. Expert Systems with Applications 2011, 38, 5755–5763. [Google Scholar] [CrossRef]
- Christenson, J.A. Urbanism and Community Sentiment: Extending Wirth’s Model. Social Science Quarterly 1979, 60, 387–400. [Google Scholar]
- van Goethem, A.A.; van Hoof, A.; Orobio de Castro, B.; et al. Quality is Key-The Impact of Community Service, Community Service Quality, and Reflection on Adolescents’ Volunteering Intentions. International Journal of Developmental Science 2014, 8, 137–147. [Google Scholar] [CrossRef]
- Parsons, F. Choosing A Vocation; Houghton Mifflin, 1909.
- Cable, D.M.; DeRue, D.S. The convergent and discriminant validity of subjective fit perceptions. Journal of Applied Psychology 2002, 87, 875. [Google Scholar] [CrossRef] [PubMed]
- Ali, I. Examining the role of person-environment fit in improving teaching satisfaction and subjective wellbeing: Person environment fit and subjective wellbeing. International Journal of Asian Business and Information Management 2017, 8, 1–14. [Google Scholar] [CrossRef]
- Padmasiri, M.D.; Kailasapathy, P.; Jayawardana, A. Development of the person–family fit construct: An extension of person–environment fit into the family domain. South Asian Journal of Human Resources Management 2019, 6, 156–176. [Google Scholar] [CrossRef]
- Inoue, M.; Kunie, K.; Takemura, Y.; et al. The influence of learning circumstances and on-the-job opportunities for professional growth on perceived person–environment fit among hospital nurses: A longitudinal study. Journal of Nursing Management 2021, 29, 776–784. [Google Scholar] [CrossRef] [PubMed]
- Breiman, L. Random forests. Machine learning 2001, 45, 5–32. [Google Scholar] [CrossRef]
Figure 1.
Parameter tuning process of random forest model
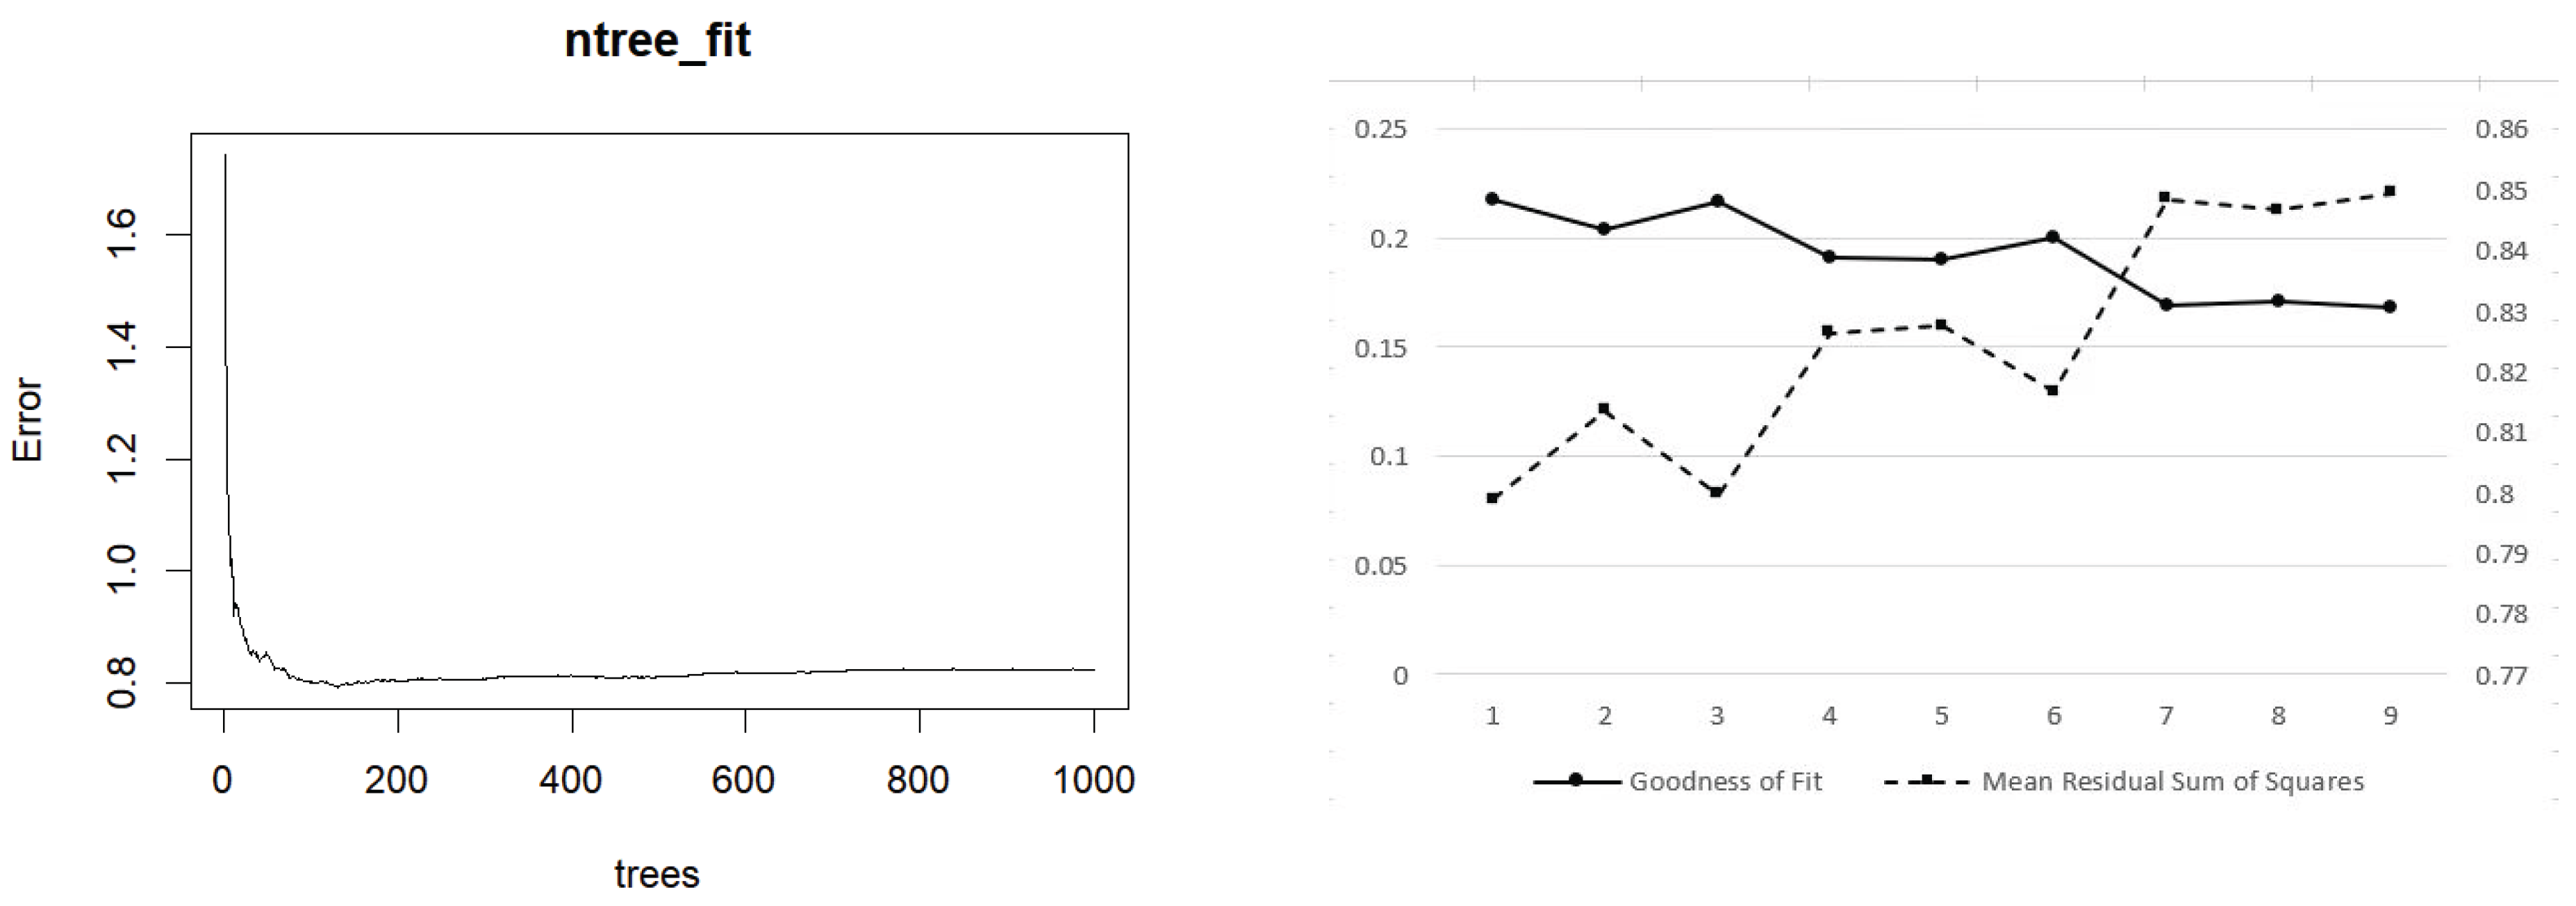
Figure 2.
Importance ranking diagram of random forest variables
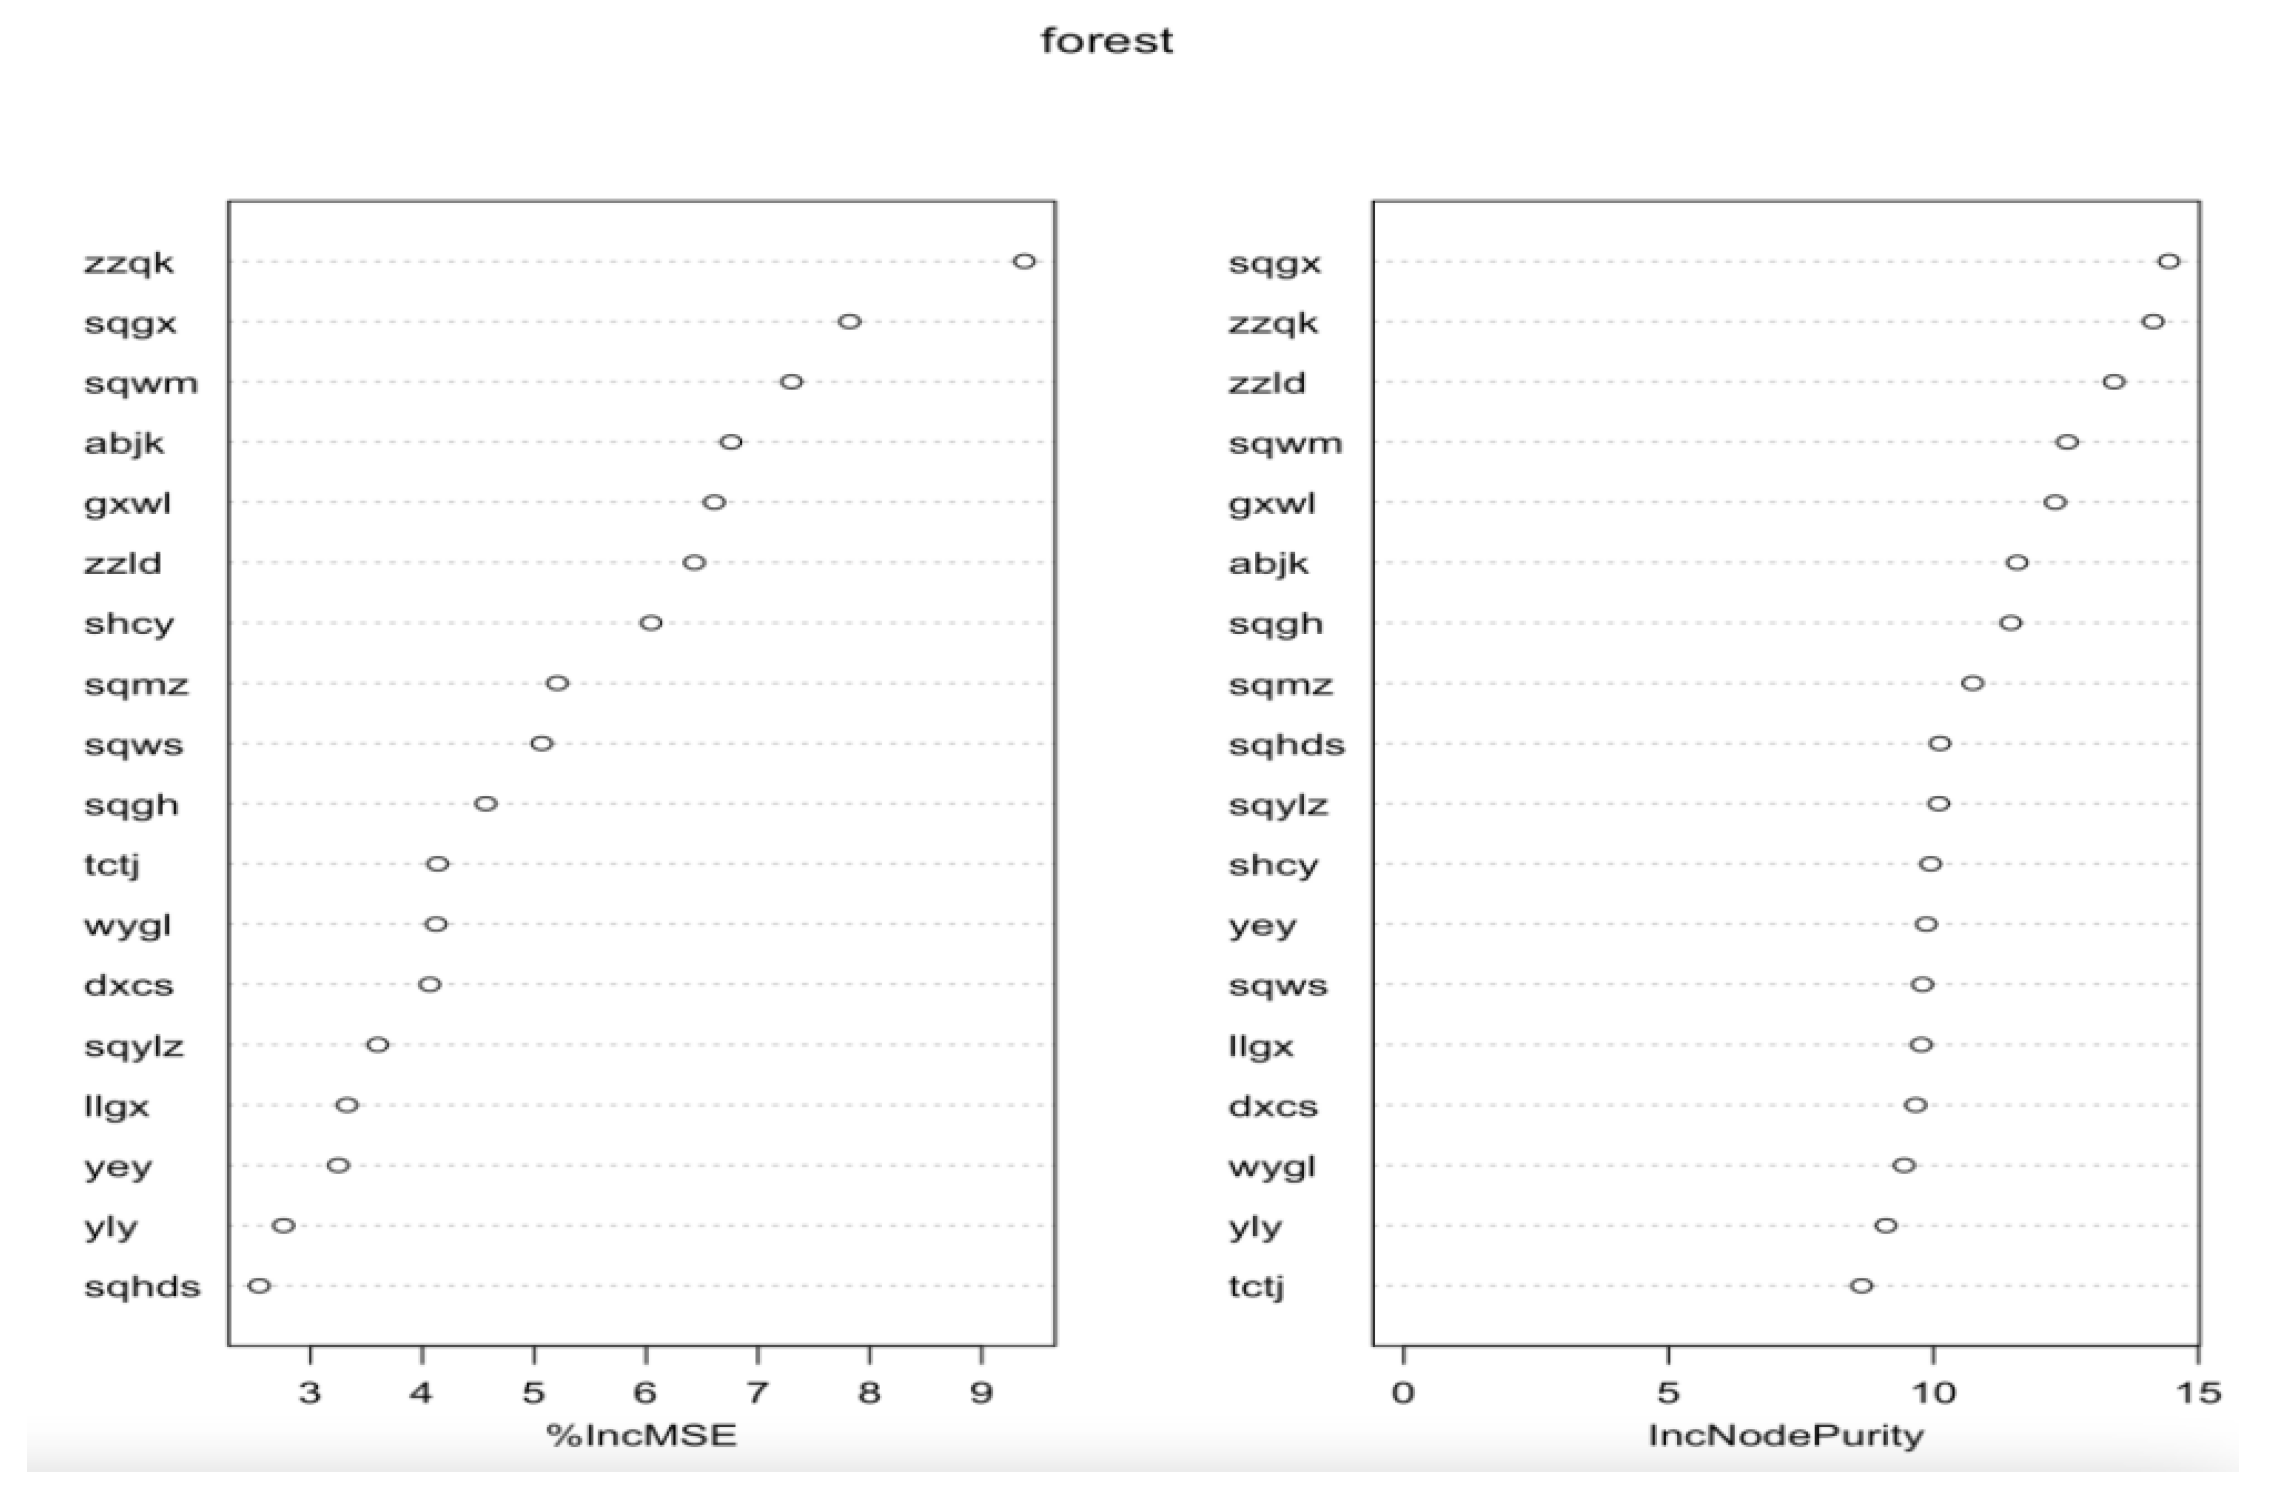
Figure 3.
Regression tree visualization
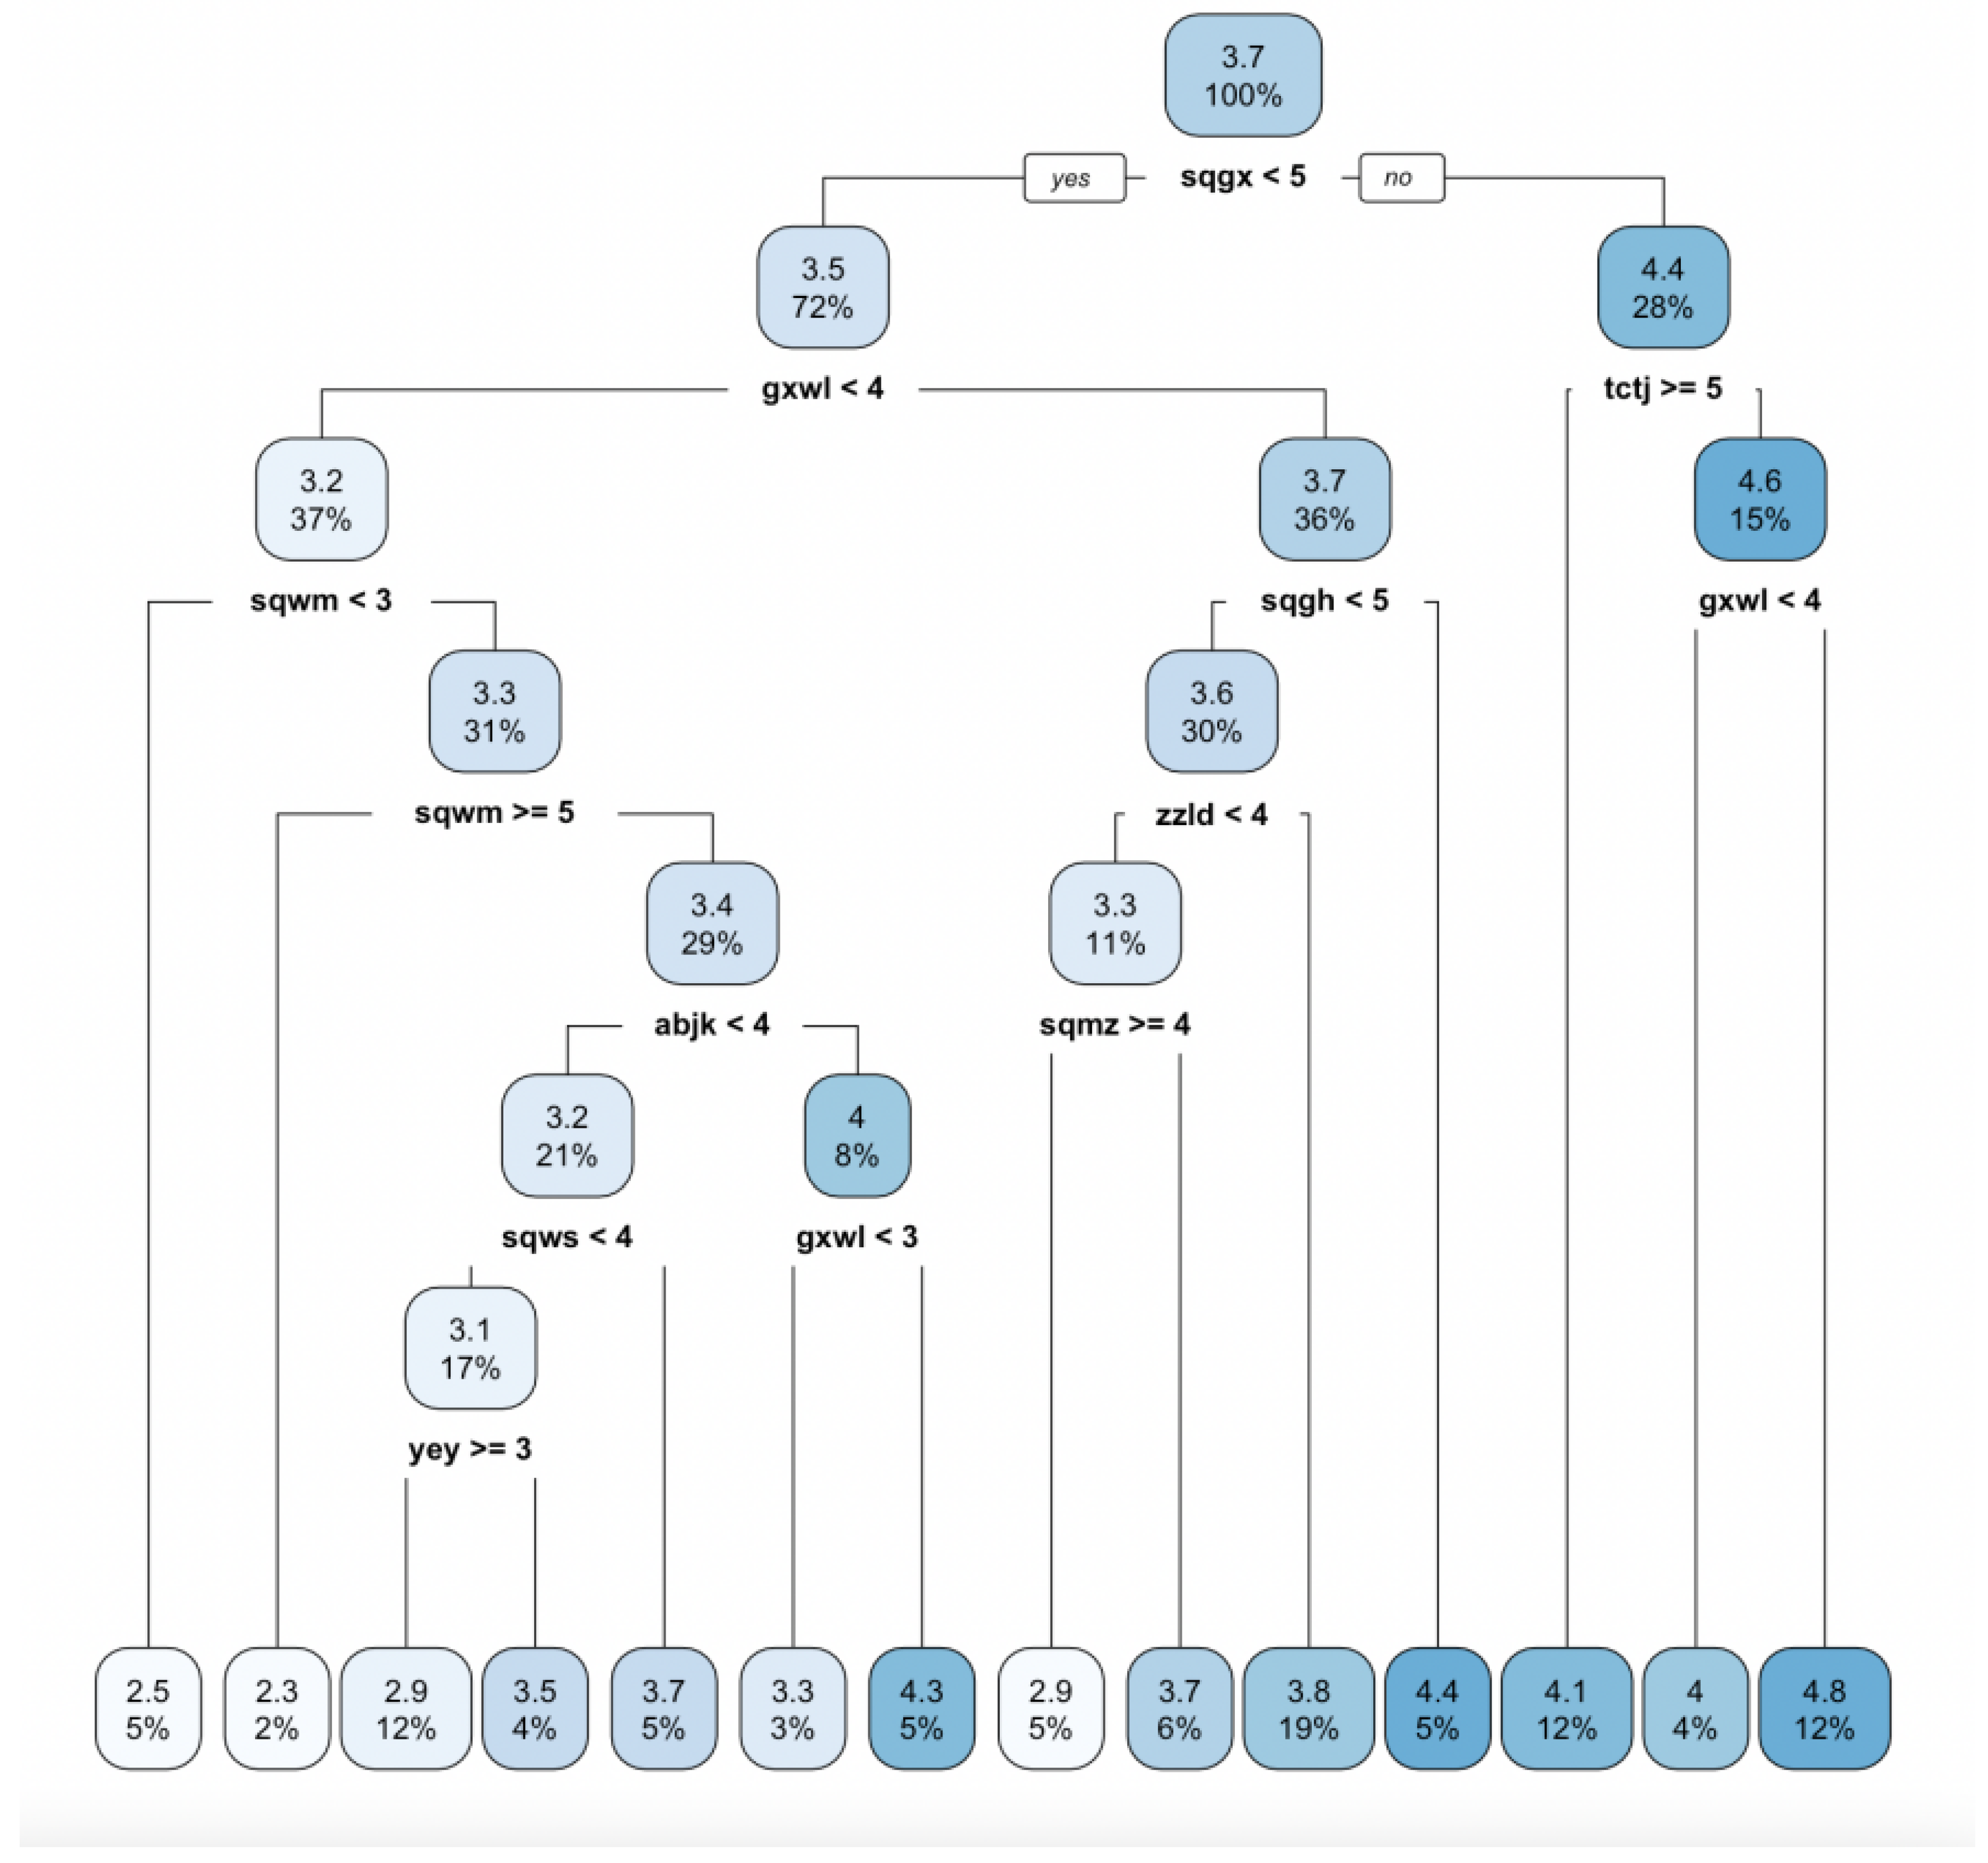
Figure 4.
Heterogeneity analysis based on commercial housing and unit type
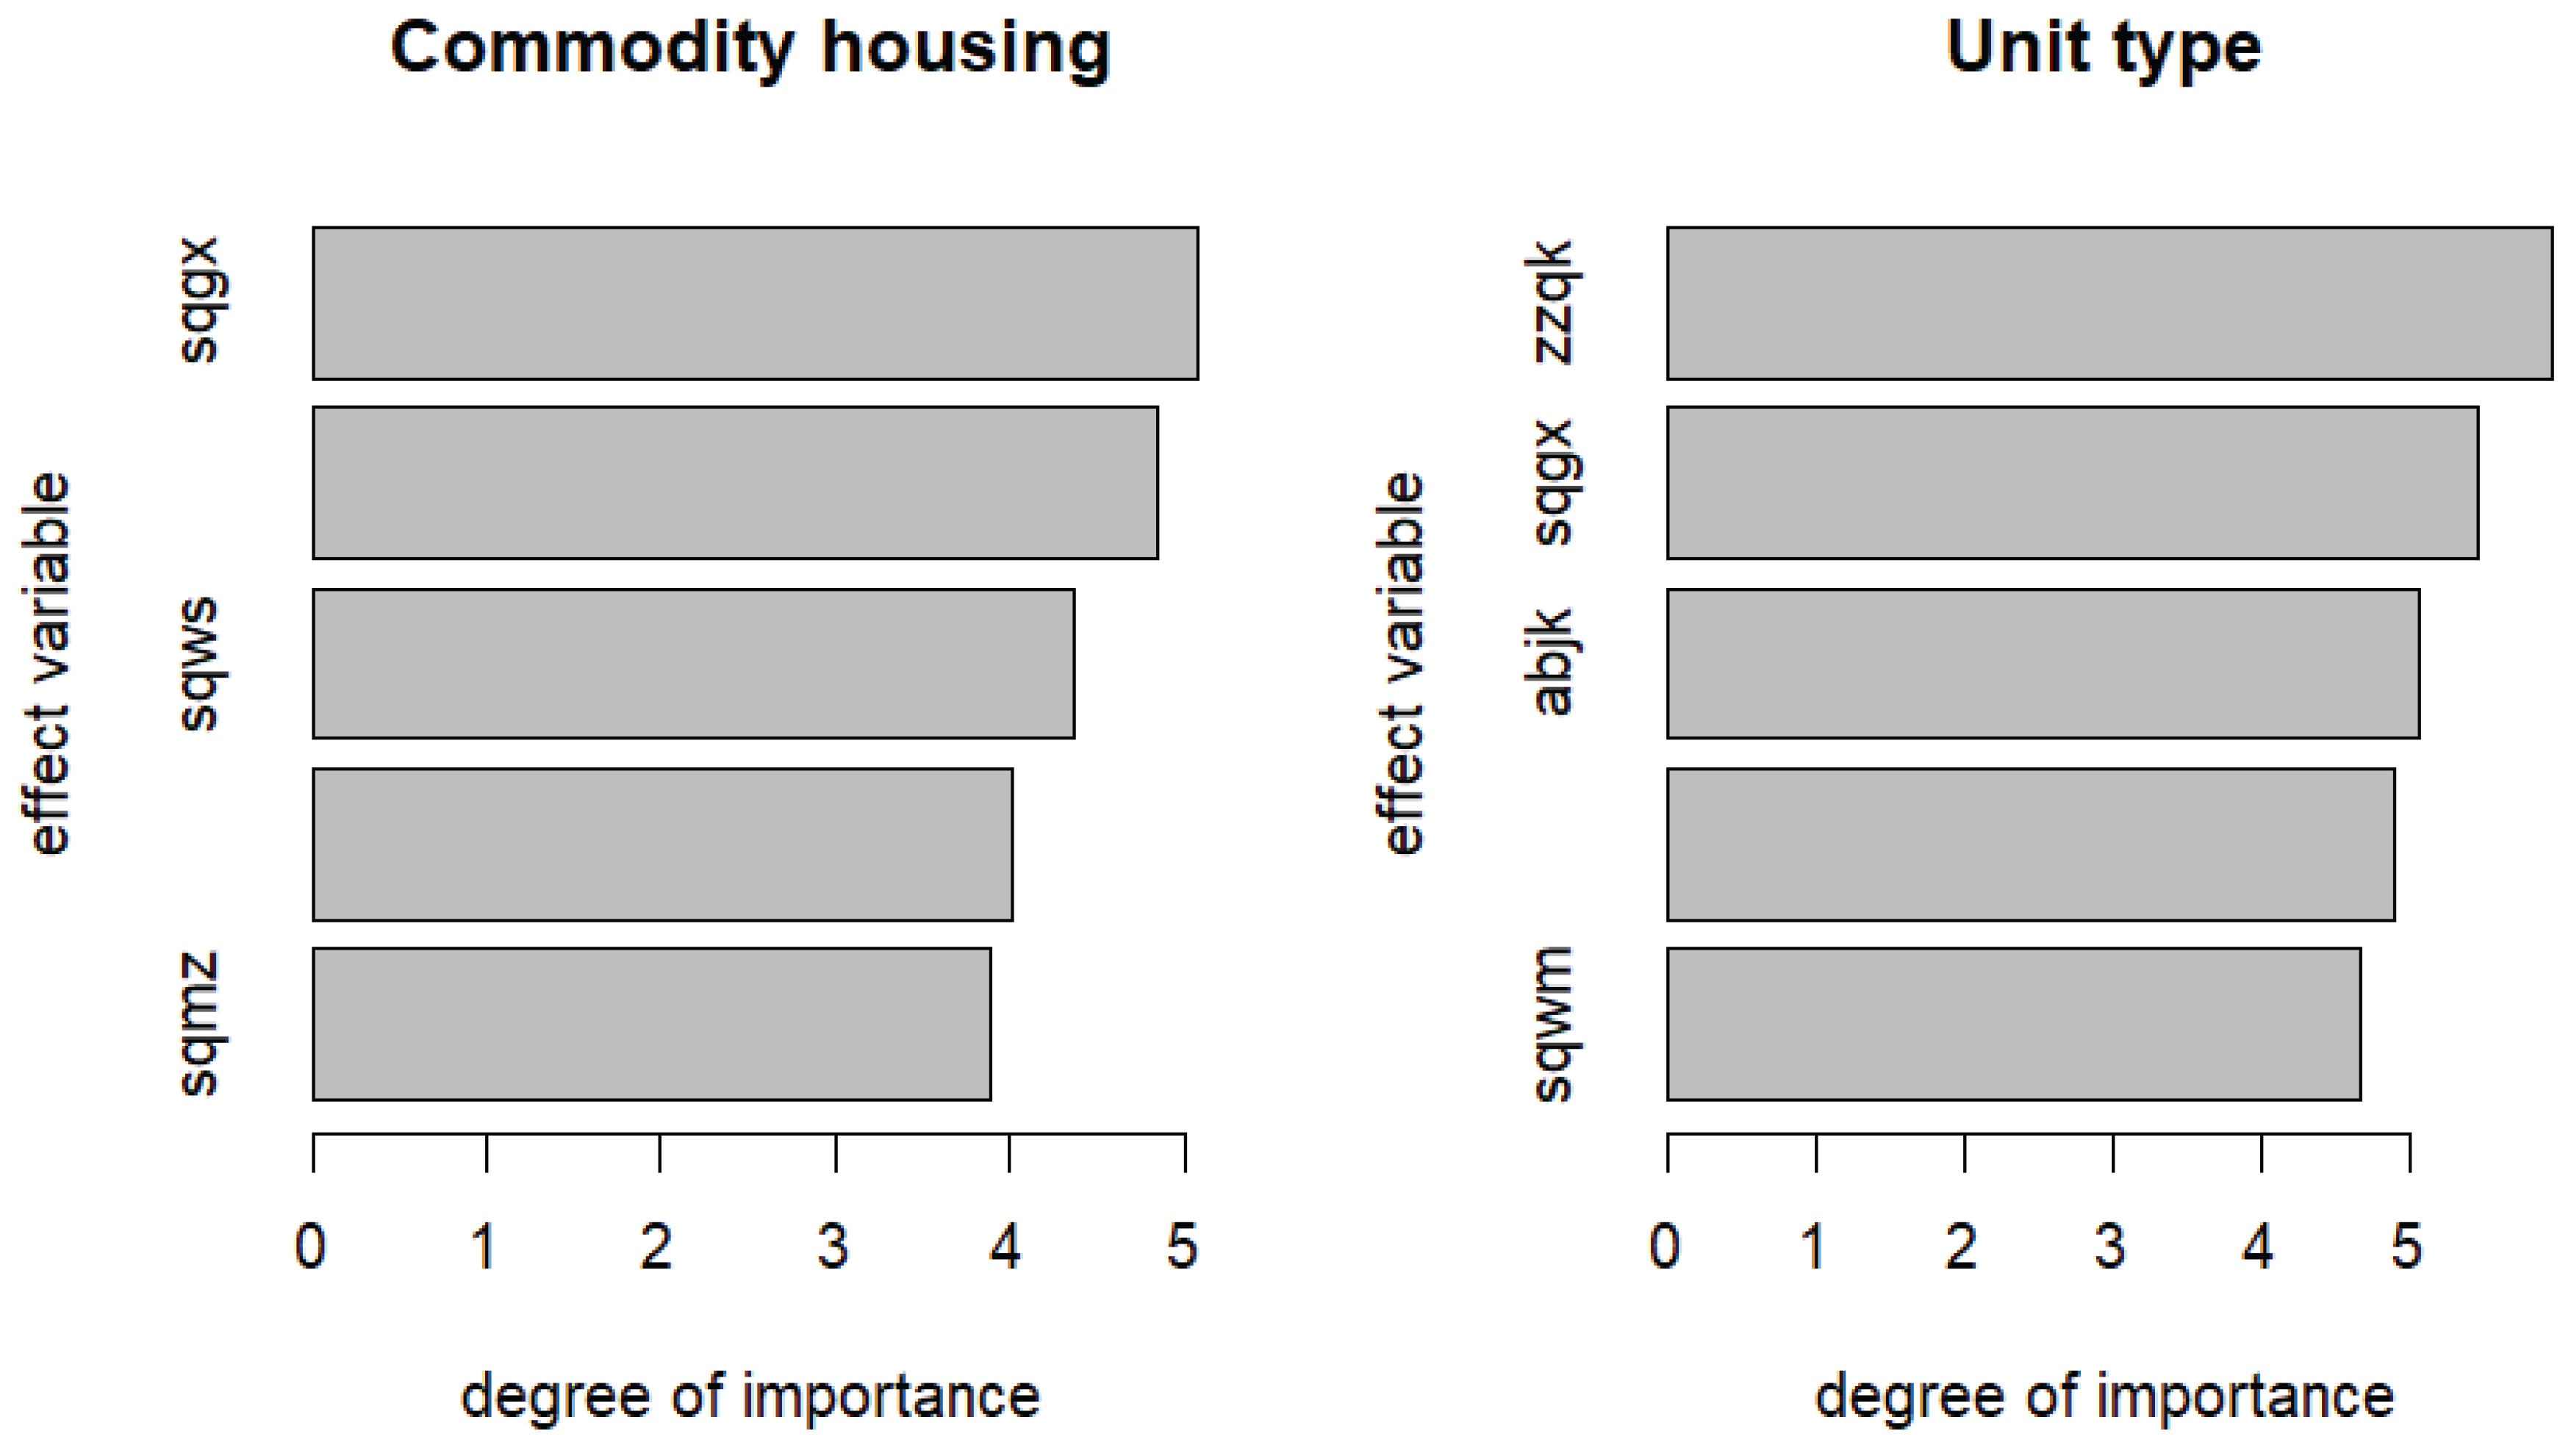
Figure 5.
Partial effect diagram of community environment optimization
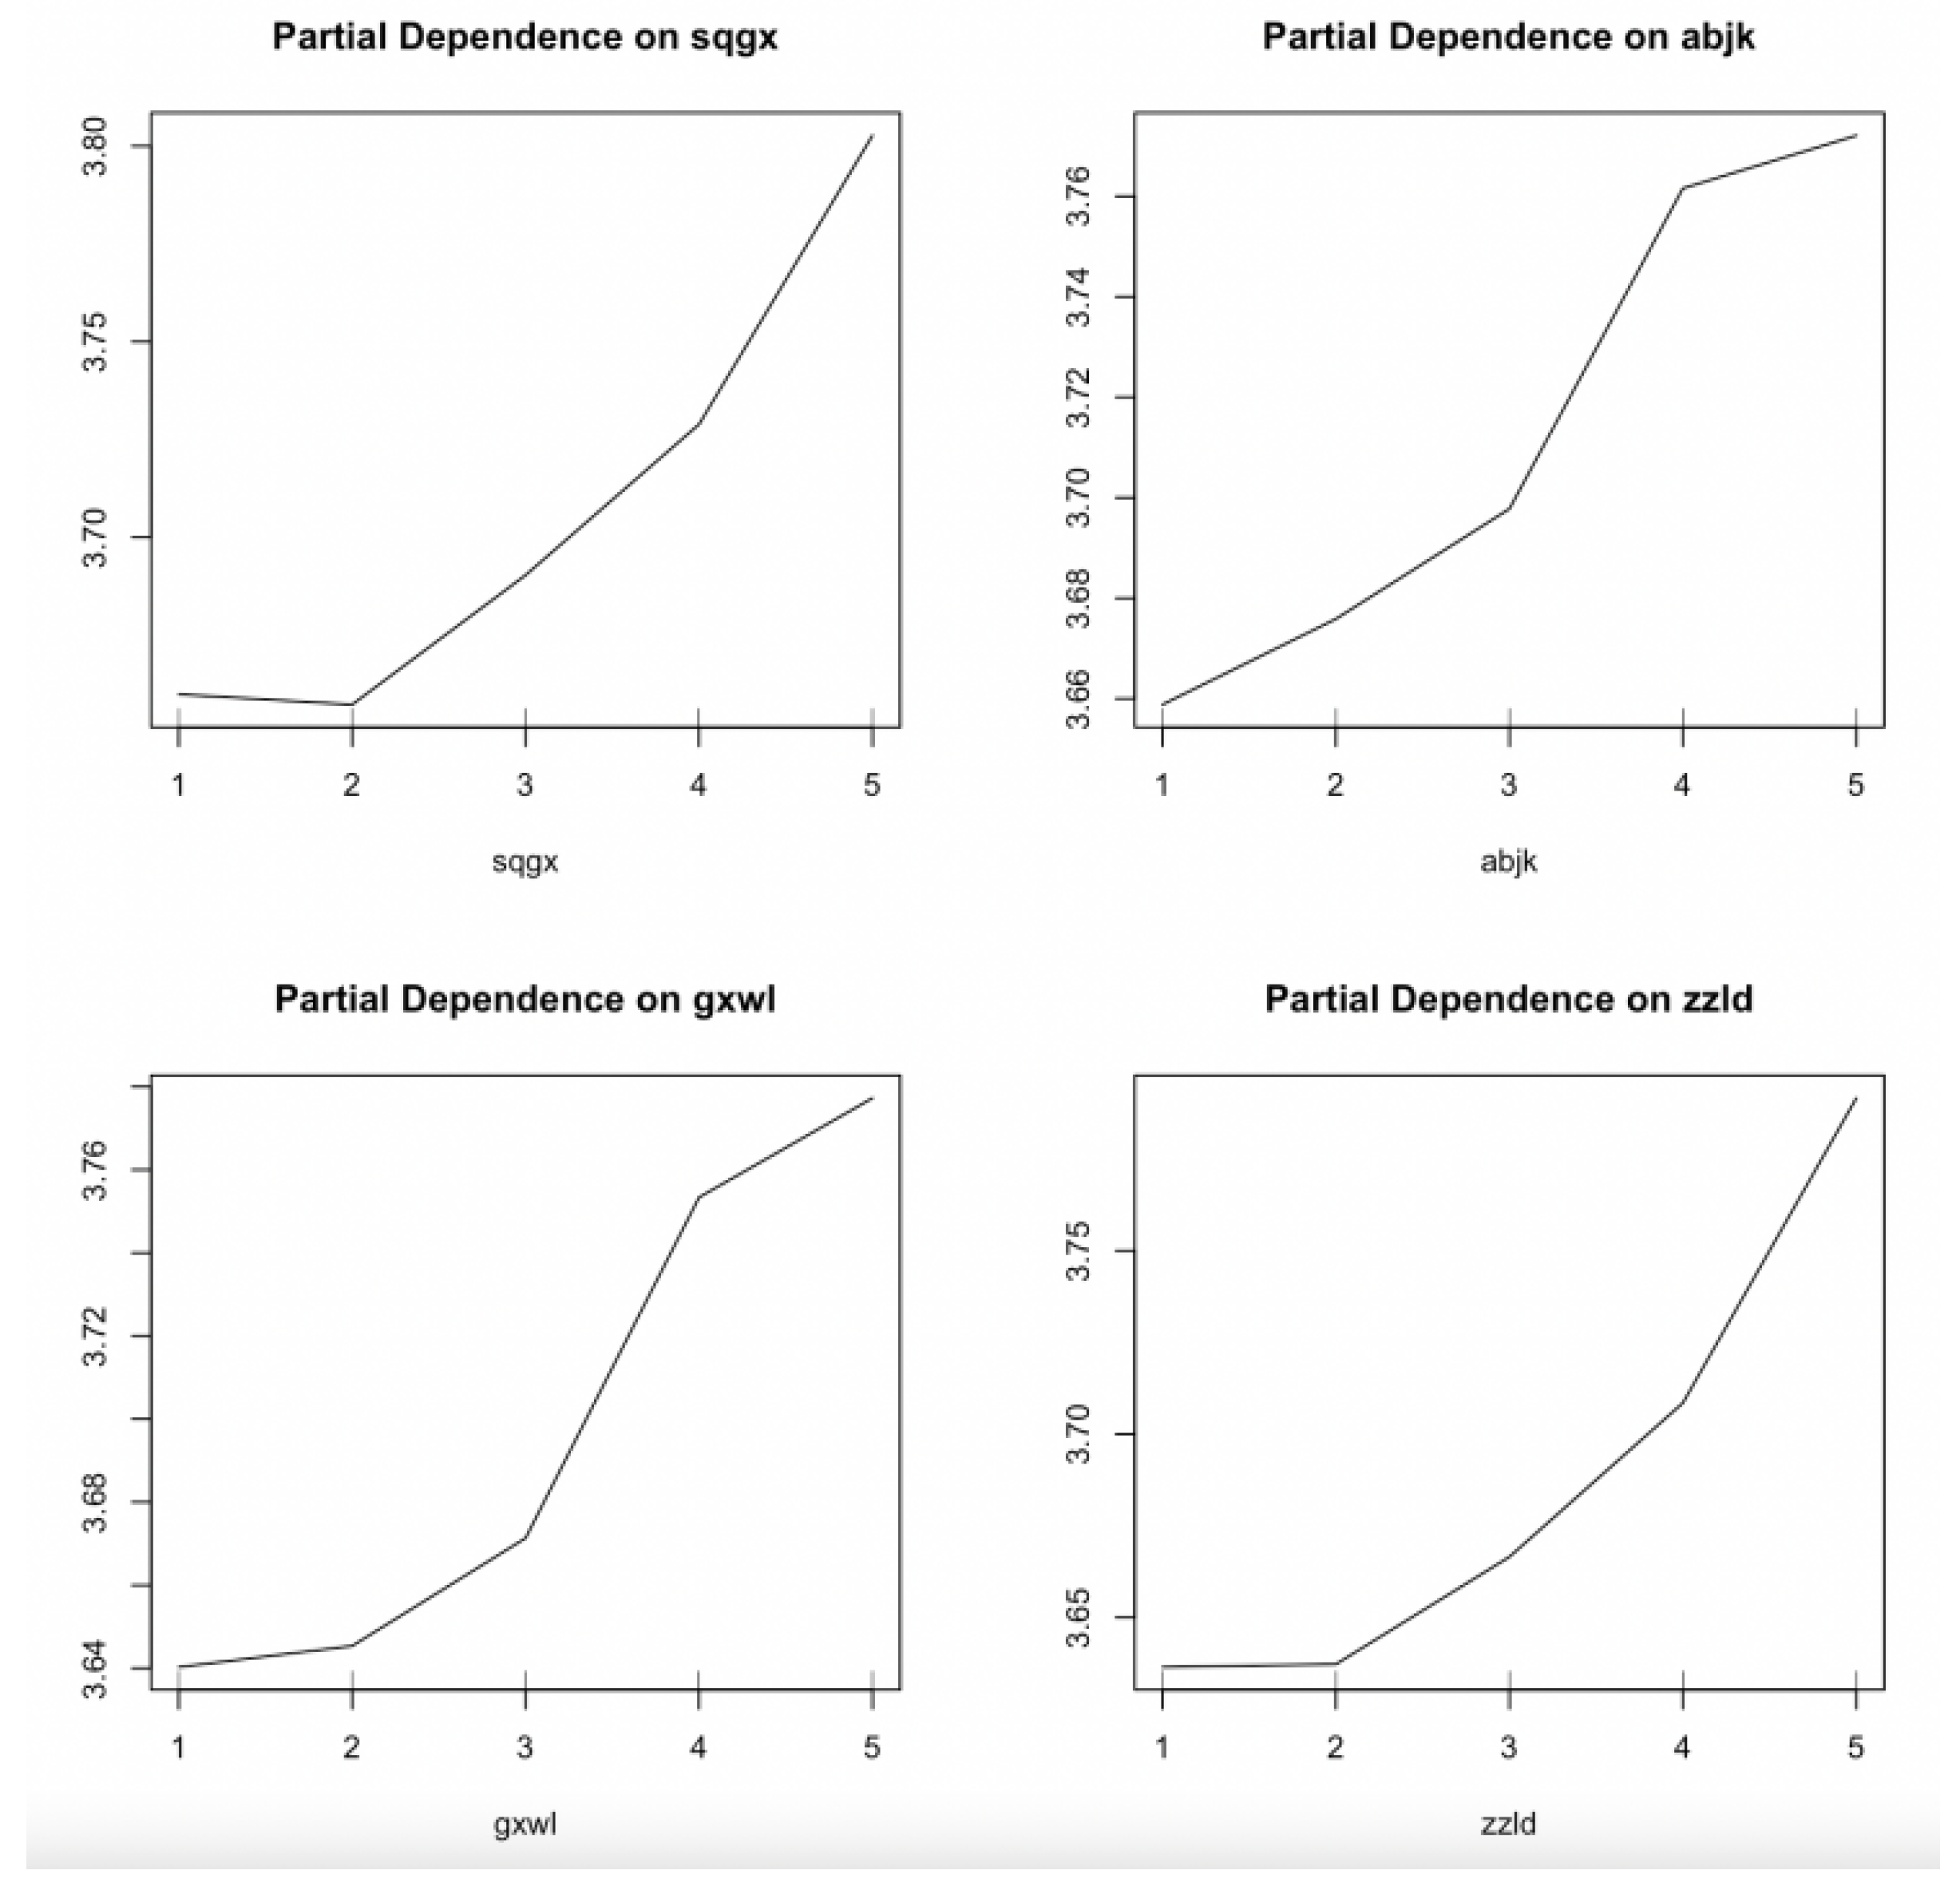
Table 2.
Feature importance estimates for the full sample
| Variable | %IncMSE | IncNodePurity |
|---|---|---|
| sqgh | 4.567 | 11.460 |
| sqws | 5.067 | 9.793 |
| sqwm | 7.300 | 12.527 |
| glmz | 5.207 | 10.742 |
| gxwl | 6.610 | 12.298 |
| tctj | 4.136 | 8.644 |
| wygl | 4.122 | 9.448 |
| abjk | 6.760 | 11.582 |
| yey | 3.248 | 9.865 |
| yly | 2.759 | 9.105 |
| dxcs | 4.067 | 9.666 |
| sqylz | 3.600 | 10.101 |
| sqhds | 2.542 | 10.122 |
| llgx | 3.327 | 9.771 |
| shcy | 6.044 | 9.947 |
| zzld | 6.431 | 13.410 |
| zzqk | 9.382 | 14.148 |
| sqgx | 7.819 | 14.446 |
Table 4.
Analysis results of Mlogit model
| (1) | (2) | (3) | (4) | (OLS) | |
|---|---|---|---|---|---|
| 1/5 | 2/5 | 3/5 | 4/5 | ||
| sqgh | -1.942** | -2.197*** | -1.833** | -1.932** | -0.053 |
| (0.893) | (0.820) | (0.812) | (0.846) | (0.083) | |
| sqws | 0.651 | 1.661** | 1.479** | 1.824** | 0.164** |
| (0.812) | (0.747) | (0.733) | (0.767) | (0.082) | |
| gxwl | -0.399 | 0.305 | 0.705 | 1.194** | 0.272*** |
| (0.609) | (0.551) | (0.546) | (0.578) | (0.056) | |
| tctj | 0.714 | 0.016 | -0.199 | -0.474 | -0.180*** |
| (0.865) | (0.732) | (0.717) | (0.728) | (0.065) | |
| wygl | -1.236 | -0.970 | -0.556 | -1.009 | 0.014 |
| (0.931) | (0.849) | (0.841) | (0.858) | (0.061) | |
| abjk | 0.521 | 0.625 | 0.574 | 1.264** | 0.115* |
| (0.627) | (0.576) | (0.572) | (0.607) | (0.060) | |
| yey | 0.185 | -0.363 | -0.236 | -0.201 | -0.022 |
| (0.470) | (0.404) | (0.397) | (0.413) | (0.046) | |
| yly | 0.528 | 0.502 | 0.307 | 0.134 | -0.062 |
| (0.543) | (0.470) | (0.460) | (0.475) | (0.048) | |
| dxcs | -0.347 | 0.099 | -0.039 | 0.111 | -0.008 |
| (0.495) | (0.428) | (0.425) | (0.447) | (0.050) | |
| sqylz | 0.126 | 0.253 | 0.488 | 0.222 | 0.050 |
| (0.583) | (0.518) | (0.511) | (0.537) | (0.059) | |
| llgx | 0.514 | 0.587 | 0.561 | 0.252 | 0.043 |
| (0.997) | (0.929) | (0.921) | (0.960) | (0.089) | |
| 1/5 | 2/5 | 3/5 | 4/5 | ||
| shcy | -0.072 | -0.948 | -0.784 | -1.478* | -0.129 |
| (0.784) | (0.738) | (0.728) | (0.776) | (0.088) | |
| zzld | -0.247 | 0.926 | 1.328 | 1.434** | 0.043* |
| (0.989) | (0.932) | (0.921) | (0.934) | (0.022) | |
| zzqk | -0.603 | -1.074 | -1.151 | -0.307 | 0.099 |
| (1.043) | (0.996) | (0.986) | (1.051) | (0.110) | |
| sqgx | 0.299 | 0.774 | 0.998 | 1.964** | 0.283*** |
| (0.861) | (0.877) | (0.869) | (0.972) | (0.0105) | |
| changshuxiang | 7.830* | 5.476 | -0.329 | -8.095* | 1.331*** |
| (4.414) | (3.975) | (3.960) | (4.277) | (0.418) | |
| N | 312 0.364 0.314 7.177*** (df = 23; 288) |
||||
| R2 | |||||
| F | |||||
Table 5.
Regression results of ordered Logit model
| Variable | Cofficient | Variable | Cofficient |
|---|---|---|---|
| sqgh | 0.035 (0.191) |
dxcs | -0.081 (0.117) |
| sqws | 0.257 (0.191) |
sqylz | 0.182 (0.144) |
| gxwl | 0.662*** (0.132) |
llgx | 0.014 (0.212) |
| tctj | -0.465*** (0.157) |
shcy | -0.403* (0.213) |
| wygl | 0.014 (0.149) |
zzld | 0.477* (0.262) |
| abjk | 0.285** (0.140) |
zzqk | 0.409 (0.263) |
| yey | -0.102 (0.109) |
sqgx | 0.481* (0.249) |
| yly | -0.133 (0.111) |
Note: * , ** , *** . Standard errors in parentheses.
Table 6.
Estimation results of Mlogit model, ordered Logit model and random forest model
| Important feature ranking |
Mlogit model, | Ordered logit model |
Random forest model |
|---|---|---|---|
| 1 | sqgx | gxwl | zzqk |
| 2 | gxwl | abjk | sqgx |
| 3 | sqws | sqgx | sqwm |
| 4 | zzld | zzld | abjk |
| 5 | abjk | zzqk | gxwl |
Disclaimer/Publisher’s Note: The statements, opinions and data contained in all publications are solely those of the individual author(s) and contributor(s) and not of MDPI and/or the editor(s). MDPI and/or the editor(s) disclaim responsibility for any injury to people or property resulting from any ideas, methods, instructions or products referred to in the content. |
© 2025 by the authors. Licensee MDPI, Basel, Switzerland. This article is an open access article distributed under the terms and conditions of the Creative Commons Attribution (CC BY) license (http://creativecommons.org/licenses/by/4.0/).
Copyright: This open access article is published under a Creative Commons CC BY 4.0 license, which permit the free download, distribution, and reuse, provided that the author and preprint are cited in any reuse.


