Submitted:
08 August 2025
Posted:
11 August 2025
You are already at the latest version
Abstract
When searching for cancerous lesions in the lungs, it is usually necessary to perform a larger number of radiological examinations, and the search for a specific site for biopsy is difficult even with the use of sophisticated endoscopic devices. Our innovative solution uses the introduction of near-infrared (NIR) radiation source into the lungs and the monitoring of transmitted light through a bronchoscope. We also described different experimental setups for NIR translumination. The first experiments performed on a laboratory pig showed promising results.
Keywords:
solitary pulmonary nodule
; NIR
; lung imaging
; translumination
1. Introduction
Our research and subsequently this article, focuses on selective tumor visualization in the human body. The following introduction will be about the ongoing initiatives to begin development and research in this area. The factors that cause serious conditions in pneumology have been the same for many decades, especially in regards to lung cancer.
Lung cancer still accounts for 12.3% of all new cases of cancer diagnosis Bach-1 (2008), Ardila (2019). Smoking is a well-documented cause of lung cancer, having been directly linked to 90% of cases. Lung cancers most commonly arise from the epithelial lining of bronchial airways. Four histological types of lung cancer have been defined: small cell carcinoma, squamous-cell carcinoma, adenocarcinoma, and large-cell carcinoma. The latter three are often grouped into what is usually referred to as a non-small cell carcinoma; accounting for approximately 85% of all lung cancers. If the disease is detected in a late stage, which is unfortunately most common situation, the five-year mortality rate for patients is about 85%. An explanation for this poor survival rate is likely to be in the staging of the disease; at the time of diagnosis only 20% of patients have localized disease. Even when the tumor is radiologically localized, the five-year survival rate is still only 30-40%. However, if found in the early stage of disease (usually presented as solitary pulmonary nodule on CT), the five-year survival is drastically improved reaching 80% in developed countries. This is why lung cancer screening was introduced 7 years ago, which resulted in a steep increase in the number of solitary pulmonary nodules (SPN) caught during low dose spiral CT screening of the chest.
The Nelson study conducted in Europe showed their achieved results consistent with and even exceeding the National Lung Screening Trial NLST (performed by the National Cancer Institute, USA) Stemmer (2020), although the methodology of this study was in some ways different. It is therefore certain that many early lung tumors will be (and are already) diagnosed as solitary pulmonary nodules. Thus, the current effort in pneumology diagnostics is focused on solitary pulmonary nodules. Nowadays diagnosis of lung cancer is usually based on tissue diagnosis through endoscopic or transparietal approaches. As the diagnosis will move from advanced stages, where morphological evidence is usually not difficult to find, to earlier stages, new requirements for the diagnosis of small solitary pulmonary nodules will arise.
However, in addition to clear positive results, screening also brings a number of problems. The most significant is the vast number of false positives found on the LDCT Humphrey (2013) forming the so-called over-diagnosis effect in this population. This systematic screening error leads to unnecessary treatment and its associated morbidity and mortality in findings that would not have otherwise reduced the patient quality of life. In the NLST over-diagnosis was 19% Bach-2 (2008). This issue is most easily expressed by the following simple enumeration. For each cancer death prevented by early diagnosis of lung cancer, we would create 320 cases of “over-diagnosis”. Hence, futile investigation in these cases creates large-scale ethical, economic and medical problems. We are therefore exploring new methods of narrowing down the screening group and evaluating CT images to reduce unwanted screening effects. The most promising pretests are the analysis of serum, exhaled air and/ or spirometric examination. Chronic obstructive pulmonary disease is associated with an increased risk of developing lung cancer. In men, forced expiratory volume in 1 second (FEV1) of less than 70% is associated with a 2.23-fold increased risk and for women it is 3.94-fold Wasswa-Kintu (2005). Other methods that have been proposed to narrow down the screening population are based on molecular biology, but these have been tested in the setting of lung cancer recurrence only Salaün (2008), Spira (2007) and Kurie (1998).
According to current recommendations by the European Respiratory Society and the European Society of Radiology, lung cancer screening should take place in comprehensive longitudinal programs, with assured quality control, and only in multidisciplinary centers equipped to work with low-dose CT, computerized pulmonary nodule evaluation and the ability to work with patients with positive screening results. However, this recommendation is no longer limited to clinical trials, in some countries it is already common clinical practice. In particular, it is necessary to continue to reduce the effective radiation dose by using re-construction algorithms, such as iterative reconstruction, and develop volumetric processing. The inclusion of patient data in a controlled central register (image bank) is another necessary condition for screening.
The selection of an optimal screening interval, which can be obtained in particular by processing the Nelson study data, is important. It appears that the prolongation of the screening interval (in the Nelson study it was 1 year, 2 years, and 2.5 years) brings a stationary incidence of diagnosed tumors to the screening round (0.8%), but worsening of the average stage of newly diagnosed tumors in the last round of screening (i.e. 2.5 years) Khorana (2019). Thus, the 2.5-years interval is clearly too long and the screening should be kept at the NLST recommended 12-month interval between the screening rounds Pham (2019). Another problem is that most of the research is focused on lung nodules that are detected at the beginning of the screening. New nodules are reported in different studies, although their significance is quite varied. ELCAP, I-ELCAP, PLuSS and Mayo trials have shown an annual incidence of new nodules of De Koning (2018), Oudkerk (2017). These new nodules are typically fast-growing and the available data shows that the probability of malignancy in such a newly emerging nodule is 1.6-7.5% De Koning (2018), Oudkerk (2017). Therefore, it may be necessary to choose a lower volume threshold for these new nodules than for the first round of screening. The most cited models that aim to distinguish between malignant and benign nodules, are models of McWilliams and the American College of Radiology model (Lung-RADS model published in 2014 Clark (2014)). The Lung-RADS model is used in virtually all American screening centers. It includes 5 categories that determine management based on the type of lesion and its size. Therefore, proper selection of patients seems to be most important for screening, and new screening programs should always include 3D image analysis. Multidisciplinary teams are necessary to make the right decisions about individual cases.
The advantages and disadvantages of used screening technologies are these are summarized in Table 1.
A solitary pulmonary nodule is a pathology up to 3 cm in diameter, that is surrounded by normal lung tissue, and is not the result of any other pneumopathy Cronin (2008). There are basically three diagnostic possibilities here Wahidi (2007), MacMahon (2017). The first option is the immediate indication for a chest surgery. Such an approach has got its non-zero morbidity and mortality, is very expensive and should only be used exceptionally in patients whose diagnosis of malignant disease is uncertain. Another possibility is the transparietal lung biopsy under CT or ultrasound navigation Criado (2010). In addition to the radiation risk Pogue (2006) for both the patient and doctor, there is also a 40% risk of the patient developing pneumothorax, which is a potentially very serious complication in this group of fragile patients with frequent emphysematous lung remodeling. Therefore, we only resort to this approach after repeated failures in endoscopic diagnosis. Until recently, pulmonary endoscopy alone had very limited value in the diagnosis of solitary pulmonary nodules. For morphological diagnosis, only 30 to 40% sensitivity has been reported. Combined with one of the new navigation methods, the success rate of endoscopic diagnosis for nodules of 2 cm or more in diameter can rise up to 85%, but smaller nodules are still a serious diagnostic problem, as they are often not associated with the bronchial lumen and therefore endoscopic diagnosis is difficult, if not impossible. New methods are therefore being developed, mainly based on electromagnetic or software navigation, tunnelisation to the lesion or ultrathin bronchoscopy Ntziachristos (2002), Votruba (2015). However, none of these methods have repeatable results, and therefore the analysis of diagnostic efficiency is difficult (dependent on technology, on the location of the lesion and on the quality of the diagnostics). Yet navigation in lung endoscopy, along with the development of robotic endoscopy, is a very rapidly developing technological field.
Raman-spectroscopy has become very popular recently. It has been shown that adding Raman spectroscopy to current white light bronchoscopy/autofluorescence bronchoscopy (WLB/AFB) improves sensitivity and specificity for the detection of preneoplastic lesions in vivo Stevens (2016), Short (2011). They combine all three modalities to demonstrate in vivo detection of preneoplastic lesions in 26 patients. They were able to obtain a sensitivity of 96% and a specificity of 91%. Continued work is however needed to develop an optimized probe and data analysis model for this trimodal application. Additional work is being done to identify disease specific biomarkers from Raman spectra which correlate to biochemical signatures of specific histological signs of malignancy. As for solitary pulmonary nodule detection, Raman spectroscopy has been shown to be useful as a device for monitoring the nodule. The special optical catheter Raman probe can be directed to the site of a suspected SPN by the mean of fluoroscopy which confirms the different tissue compositions prior to biopsy McGregor (2018), Synytsya (2014), Krbcová (2019).
Recently near-infrared (NIR) image-guided surgery has been proposed to identify nodules in solid organs Okusanya (2014). This technique is based on the application of a specific fluorescent dye (typically indocyanin green) and followed by imaging with an NIR camera. With this technique, thoracic surgeons were able to visualize 16 from 18 small SPNs in the peripheral area of the lung during videothoracoscopy Votruba (2016), Okusanya (2014), Han (2018). The recent advancements in this technique has lead to NIR-II imaging in wavelengths above 1,000 nm Cao (2020) with application of nanoparticles and quantum dots as a contrast agent. In spite of the high visual contrast of these pathological tissues, the contraindications (renal dysfunction, iodine hypersensitivity, uremia) are a limiting factor of these NIR contrast techniques.
2. Description of the Solution
Our aim is to develop a diagnostic infrared imaging kit for morphological SPNs detection using real time visualization. This principle is based on the use of near infrared light to make solitary pulmonary nodules visible. The method of lung tissue illumination, and acquisition of video sequence data obtained from the lungs, in combination with the in vivo implementation, is completely unique and has not yet been published.
It is well-known that transmittance, which is a ratio between transmitted radiant flux and radiant flux that has reached surface of matter, depends on the optical characteristics of the matter being investigated. This is represented by the absorption coefficient , scattering coefficient , and the index of refraction g, as well as on the anisotropy, with respect to the isotropy properties of the matter. In respect to the tissue being examined, it can be assumed that the mentioned optical characteristics are in strong correlation with the morphological characteristics of the tissue. This is because scattering arises due to the relative refractive index mismatching at the boundaries between two such medias or structures, for instance between the extracellular fluid and the cell membrane, which is represented by inhomogeneities. It is also essential to note that cell density also plays an important role in the outcome of scattering, for example, tumor clusters are characterized by a different density than normal tissue. Light scattering and absorption can provide information both about the tissue structure as well as the chromophore content and these are features that can be used to distinguish between normal tissues, malignant lesions, and other pathologies.
It follows that NIR light penetrating normal lung parenchyma will undergo different attenuation than the light penetrating through pathological tissue, based on the tissue properties mentioned above and therefore give us information about its morphological properties and the presence of SPN as well.
The possibility of direct visualization of the solitary pulmonary nodules by translumination with different light sources has not yet been described or investigated in the area of lung parenchyma. The indisputable advantage of such approach potentially becoming included in routine clinical pleuroscopy, would be the possibility of real time tissue biopsy under direct visual control together with SPN treatment in one session. Since clinical pleuroscopy is an examination that has practically no contraindications, except for patient non-compliance and those individuals with severe respiratory failure or severe coagulation disorders; a SPN visualization method based on this approach would allow for easy implementation into a variety of clinical situations and be incorporated into many sites throughout the world.
The main goal of this research was to verify a proof of concept that can be developed into a solution for both illumination and acquisition. The implemented prototype has proven under clinical trial to be a comprehensive solution with high added value for basic and applied research. To the best of our knowledge such a comprehensive product has not been presented elsewhere nor been introduced into the market so far.
2.1. Experimental Setup
The initial realization of the experiments were performed on extracted porcine lung tissues, where we tested various wavelengths in the infrared region as well as different powers and angles of radiation. In laboratory conditions, we managed to illuminate the lung tissue with a thickness of 4 cm and could visualize the fine lung tissue architecture. Naturally, the power of the light source can be increased, however care must be taken when heat is being released, as a change in temperature can affect the optical properties of the tissue. Therefore, we performed experiments in the range of 30-50°C, taking into caution that high temperature can cause local burns to the lung tissue. It is necessary to not only monitor and lower the power, but also perform passive cooling as active cooling is not possible due to size restrictions.
Once we verified the functionality of the entire solution on the extracted porcine lung tissue in the laboratory, we obtained consent from the ethical committee to perform the experiment on a pig, which will be further discussed in detail in this article. The device which we have constructed is shown in Figure 1. The in vivo part of the device consists of a lighting head and a supply cable, which is shown in Figure 1 as the gray bundle. The lighting head has an omnidirectional light source that consists of light-emitting diode (LED) with a diffuser. It was necessary to choose a light source that is small in size and radiates only in a narrow part of the infrared spectrum. These properties are met by an electro-luminescent diode from the LUXEON IR Compact Line series with a maximum possible radiometric power of 1,050 mW with a typical spectral range from 750 nm to 950 nm with a maximum at 850 nm (see Figure 2). The typical FWHM beam angle is 150°. The optical properties of the diode were experimentally affected by the cover layer of the nanohybrid composite, which was used to hermetically seal the lighting module. This composite enables the cooling of the LED and works also as a diffuser for getting homogenous omnidirectional illumination around the illumination unit.
Cooling of the lighting head is ensured by passive cooling, while the heat of the LED elements is distributed to the supply cable. The measured temperature of the lighting head did not exceed 40°C even after half an hour of use. The supply cable is led to the power source, which can be seen in Figure 1 as the black box in the middle, where there is a power supply along with a current regulator, which enables adjustment of the light illumination intensity during sensing. Adjustment of intensity is an essential requirement for the device because to illuminate a smaller section of lung tissue, lower exposure is required and vice versa for a larger section. Figure 1 further shows a camera with a special mount for connection to a pleuroscope.
We prepared a framework of the experiment setup, which is shown in Figure 3. A unilateral pneumothorax was induced in a dormant intubated pig, which was spontaneously being ventilated. The source of near-infrared radiation (illumination unit connected to a regulated power source) was introduced into its subsegmental bronchus by means of ticks and under visual inspection with a flexible bronchoscope, which allows for either a direct view or the use of a connected display). The pig lying on its side was subjected to a minipleuroscopy using one port not more than 6 mm in which the pleuroscope is inserted via a trocar. After a routine inspection of the pleural cavity, the radiation source was then performed against the distal end of the pleuroscope, which was placed in the correct position for acquisition. Subsequently, a camera was installed on the output optics of the pleuroscope which was inserted via a trocar, and after a suitable adjustment of the power of the illumination unit, the radiation penetrating the lung tissue was detected. The real time video stream was displayed on a notebook. After recording a high quality video signal of the visualized tissue the experiment was terminated.
Figure 4 demonstrates the experimental setup showing the optical principle of the lung tissue translumination (transmissive illumination). The principle is based on the use of transmissive illumination, where the infrared light comes out from the illumination unit and is scattered in the lung tissue, which is between the light source (lighting head) and the camera. The plano-concave lens collects a part of this scattered light and sends the light to the optic fiber in trocar or pleuroscope. For our experiment, instead of fiber we used the pleuroscope, which consists of one or more optic fibers inside. From the optic fibers / pleuroscope, the parallel beams go through to the second plano-concave lens, which expands the beams to the CMOS chip, which acquires the image of the lung tissue. All optical components are centered to the optical axis of the chip.
The camera connected to a pleuroscope was equipped with a CMOS chip with a global shutter (UI-3360-CP-NIR-GL Rev.2, iDS Imaging GmbH). The chip of this camera is in the 2/3” format and allows us to capture an image with a maximal size 2,048 × 1,088 pixels (with pixel size 5.5 µm). The frame rate used was 14.78 fps. The quantum efficiency of the camera at the maximum intensity wavelength of the source is approximately 35%, which is shown in Figure 5 (the ‘NIR’ curve).
The camera was connected to the pleuroscope through C-mount adapter (RIWO lens with snap-on mechanism and C-Mount thread; Richard Wolf GmbH) with a focal length of f = 27 mm.
2.2. Methodology for Translumination
We developed a methodology, which is summarized in Figure 6, in the form of a flowchart, where the complete process of NIR translumination is summarized. The principle is described in detail in our utility model UPV (2019), where we protect the principle of this method and the style of use.
First of all, it is necessary to choose the type of lighting unit, by selecting from the following options:
-
"Endoscopic NIR illumination"Illumination unit and endoscopic tool are inserted via mouth/nose.
-
"NIR illumination via trocar"We used this method, where the illumination unit is inserted via mouth/nose and the camera is positioned directly at the opening to the lung – we tested this option experimentally, but have not developed it further yet.
-
"External NIR illumination"The illumination unit is located outside of the body and has a high power and active cooling and subsequently a classic endoscopy is performed – we tested this option experimentally, but have not developed it further yet.
-
"Endoscopic NIR illumination with bronchial sensing"The illumination unit is inserted into the esophagus and endoscopy is performed in the bronchial airways – we tested this option experimentally, but have not developed it further yet.
In all cases, the step of NIR illumination power setting follows (see Figure 6), with a default illumination power setting for each lighting method. If the image quality is inadequate, it is necessary to increase (under-illuminated tissue) or decrease (over-illuminated tissue) the power of the light unit. This can be done either automatically by the software or by the physician who can adjust the illumination intensity. At the same time, the acquisition parameters of the capture device, typically the camera gain and exposure time, are also set. This is followed by the connection of the sensor unit, which in our case is the camera connected to the pleuroscope via the optical adapter. Any other type of illumination, based on experimental verification, would not fit the criteria since the ambient illumination and thickness of other tissues strongly degrade the quality of the illuminated tissue displayed. The associated software carries out analysis and image processing, for example, to highlight potential tumor foci or suspicious areas. In obvious cases, the software can evaluate the area as a pathological focus, giving the physician recommendations for finding.
3. Results and Discussion
Two examples of acquired images are shown in Figure 7. On the left side, there is an image of a porcine lung as seen directly via the camera and the thickness of the illuminated tissue is 4 centimeters. The parenchymal structure of the lung is nicely visible, including on outline of the lobes of the lungs. On the right side, there is an image of the bronchial airway of the living pig with illumination from the esophagus. The structure of mucosa in the bronchial airway is also clearly visible with the potential for further image processing and analysis.
We performed basic image processing of the image acquired in a direct view setup. Due to strong non-uniform illumination and noise level in the acquired image , we proposed a simple additive model for image processing. The corrected image is computed as: , where is the median filtered image with 3×3 kernel and is a square averaging kernel with size 101 pixels. An example of this processing is shown in Figure 8. The corrected image contains more visible structures, particularly the alveoli borders and the structures within. Next processing step might involve appropriate histogram adjustment. Here we applied the contrast limited adaptive histogram equalization Pizer (1977), Tawfik (2024) in order to show the effect on corrected image.
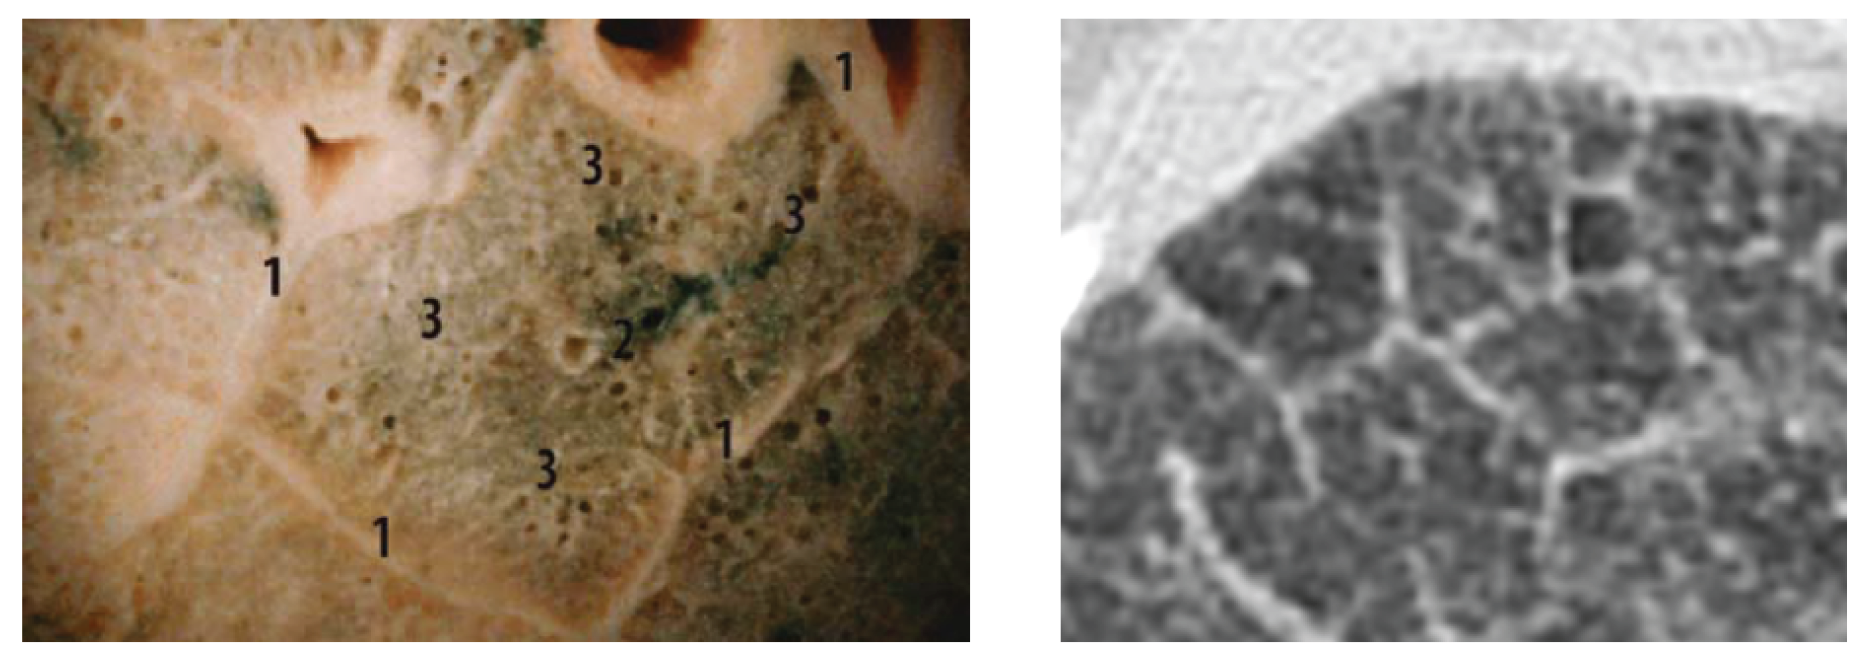
A comparison of the obtained images after improvements/filtering (see Figure 8) with the lung lobulus anatomy is shown in Figure 9, where the left image represents a cadaver section and the right one a high resolution computer tomography (HRCT) image. It is quite obvious that we managed to achieve a completely adequate imaging method that makes lung tissue visible in an excellent way.
The reason for our study was to answer, whether the lung parenchyma could be visualized by looking from the pleural cavity in a healthy pig. The finding that this method is well suited for imaging SPN will be the subject of further studies in the human population.
We speculated that having the possibility to place the source of NIR light into bronchial airways as well as simultaneously having the option to observe pleural surface would aid in the visualization of solitary pulmonary nodules without fluorescent dye and without the necessity of utilizing video thoracoscopy. To prove the idea, we had to confirm the possibility of visualization of transluminated NIR light form bronchial/esophageal area to the pleural cavity or/and trachea. Having such an option, would lead to a substantial improvement in the diagnostic approach to solitary pulmonary nodules, as well as a decrease in diagnostic costs. The possibility of direct visualization of the solitary lung lesion by translumination with different light sources has not been described or investigated in the area of lung parenchyma. The indisputable advantage of such approach potentially includes the ability for routine clinical video/pleuroscopy with the possibility of real time tissue biopsy under direct visual control and even SPN treatment in one session. As mentioned before, since clinical pleuroscopy is an examination that has practically no contraindications, a method that allows for the visualization of solitary pulmonary nodes would be very easy to apply to a variety of clinical situations as well as be incorporated into many sites throughout the world.
Technically, no issues arise when placing NIR light source into distal bronchial airways during bronchoscopy under general anesthesia. The only issue would be to create sufficient space for a diagnostic visualization device (minipleuroscope) that would be introduced and adequately targeted in the pleural cavity. In order to solve this, 3 years ago we developed and repeatedly used an endobronchial blocker technique in patients undergoing clinical pleuroscopy. During the procedure, we introduced a blocked device into the main bronchus on the examined site. After introducing a mini-trocar (5 mm) into the pleural cavity, we gently deflate the lung by channeling in the blocker device and introducing a mini-pleuroscope into the pleural cavity. Hence, we decided there is no principle nor technical obstacle in organizing the animal experiment.
Author Contributions
Conceptualization, Votruba J. and Drahanský M.; methodology, Votruba J.; software, Goldmann T.; validation, Votruba J., Kolář R., Drahanský M. and Brůha T.; data curation, Goldmann T. and Drahanský M.; writing—original draft preparation, Votruba J. and Drahanský M.; writing—review and editing, Goldmann T.; visualization, Drahanský M.; supervision, Votruba J.; funding acquisition, Drahanský M. All authors have read and agreed to the published version of the manuscript.
Funding
This article has been produced with the financial support of the European Union under the LERCO project number CZ.10.03.01/00/22_003/0000003 via the Operational Programme Just Transition.
Acknowledgments
We would like to thank the General University Hospital in Prague and the companies Oxyprotect z.s. and TrendBit s.r.o. for their support in solving this research task, additionally to the projects LERCO (see Funding above) and “Reliable, Secure, and Efficient Computer Systems” FIT-S-20-6427. We would also like to thank two colleagues for their inspiring comments and proofreading of the text – Rammika Subramaniam and Neil Nathwani. We would also like to thank MUDr. Jiří Beneš, Ph.D. (Clinic of Radiology, First Faculty of Medicine, Charles University, Prague) for significant comments on the practical implementation and experimental verification of the functional principle of the framework described in this article.
Conflicts of Interest
The authors declare no conflicts of interest.
Abbreviations
The following abbreviations are used in this manuscript:
| AFB | Auto-Fluorescence Bronchoscopy |
| CCD | Charge-Coupled Device |
| CMOS | Complementary Metal-Oxide-Semiconductor |
| CT | Computer Tomography |
| DALY | Disability-Adjusted Life-Year |
| FEV1 | Forced Expiratory Volume in 1 Second |
| FWHM | Full Width at Half Maximum |
| HRCT | High Resolution Computer Tomography |
| LED | Light-Emitting Diode |
| NIR | Near Infrared |
| NLST | National Lung Screening Trial |
| RIWO | Reduced I/O Working |
| QUALY | Quality-Adjusted Life-Year |
| SPN | Solitary Pulmonary Nodule |
| WLF | White Light Bronchoscopy |
References
- Bach, P.B. Is our natural-history model of lung cancer wrong?. The Lancet Oncology, 2008, 9.7, 693–697.
- Ardila, D., et al. End-to-end lung cancer screening with three-dimensional deep learning on low-dose chest computed tomography. Nature medicine, 2019, 25.6, 954–961.
- National Lung Screening Trial. Available online: https://www.cancer.gov/types/lung/research/nlst (accessed on 2025-JUN-20).
- Stemmer, A., et al. Using machine learning algorithms to review computed tomography scans and assess risk for cardiovascular disease: retrospective analysis from the National Lung Screening Trial (NLST) PLoS One, 2020, 15.8, 11.
- Humphrey, L.L., et al. Screening for lung cancer with low-dose computed tomography: a systematic review to update the US Preventive services task force recommendation. Annals of internal medicine, 2013, 159.6, 411–420.
- Bach, P.B. Overdiagnosis in lung cancer: different perspectives, definitions, implications. Thorax, 2008, 63.4, 298–300.
- Wasswa-Kintu, S. Relationship between reduced forced expiratory volume in one second and the risk of lung cancer: a systematic review and meta-analysis. Thorax, 2005, 60.11, 975–975.
- Salaün, M., et al. Molecular predictive factors for progression of high-grade preinvasive bronchial lesions. American journal of respiratory and critical care medicine, 2008, 177.8, 880–886.
- Spira, A., et al. Airway epithelial gene expression in the diagnostic evaluation of smokers with suspect lung cancer. Nature medicine, 2007, 13.3, 361–366.
- Kurie, J.M., et al. Autofluorescence bronchoscopy in the detection of squamous metaplasia and dysplasia in current and former smokers. Journal of the National Cancer Institute, 1998, 90.13, 991–995.
- Khorana, A.A., et al. Time to initial cancer treatment in the United States and association with survival over time: an observational study. PloS one, 2019, 14.3, 15.
- Pham, D., et al. Lung cancer screening rates: Data from the lung cancer screening registry. ASCO annual meeting, 2019.
- De Koning, H., et al. PL02. 05 effects of volume CT lung cancer screening: mortality results of the NELSON randomised-controlled population based trial. Journal of Thoracic Oncology, 2018, 13.10, 185.
- Oudkerk, M., et al. European position statement on lung cancer screening. The Lancet Oncology, 2017, 18.12, 754–766.
- Clark, T.J., et al. Lung CT screening reporting and data system speed and accuracy are increased with the use of a semiautomated computer application. Journal of the American College of Radiology, 2014, 12.12, 1301–1306.
- Lambert, L., et al. Srovnání radiační zátěže a obrazové kvality při HRCT vyšetření plic mezi přístroji na jednom pracovišti. Česká radiologie, 2015, 69.3.
- Lambert, L., et al. Ultra-low-dose CT Imaging of the Thorax: decreasing the radiation dose by one order of magnitude. The Indian Journal of Pediatrics, 2016, 83.12, 1479–1481.
- Cronin, P., et al. Solitary pulmonary nodules: meta-analytic comparison of cross-sectional imaging modalities for diagnosis of malignancy. Radiology, 2008, 246.3, 772–782.
- Wahidi, M.M., et al. Evidence for the Treatment of Patients With Pulmonary Nodules: When Is It Lung Cancer?: ACCP Evidence-Based Clinical Practice Guidelines (2nd Edition). Chest, 2007, 132.9, 94–107.
- MacMahon, H., et al. Guidelines for management of incidental pulmonary nodules detected on CT images: from the Fleischner Society 2017. Radiology, 2017, 284.1, 228–243.
- Criado, E., et al. Pulmonary sarcoidosis: typical and atypical manifestations at high-resolution CT with pathologic correlation. Radiographics, 2010, 30.6, 1567–1586.
- Pogue, B.W., Patterson, M. Review of tissue simulating phantoms for optical spectroscopy, imaging and dosimetry. Journal of biomedical optics, 2006, 11.4, 16.
- Ntziachristos, V., et al. Would near-infrared fluorescence signals propagate through large human organs for clinical studies? Optics letters, 2002, 27.5, 333–335.
- Votruba, J., et al. Bronchoscopic Diagnosis of Solitary Pulmonary Nodules with the Use of NIR Spectroscopy. Advances in Chemical Engineering and Science, 2015, 5.4, 490–498.
- Stevens, O., et al. Developing fibre optic Raman probes for applications in clinical spectroscopy. Chemical Society Reviews, 2016, 45.7, 1919–1934.
- McGregor, H.C., et al. Development and in vivo test of a miniature Raman probe for early cancer detection in the peripheral lung. Journal of Biophotonics, 2018, 11.11, 5.
- Synytsya, A., et al. Raman spectroscopy at different excitation wavelengths (1064, 785 and 532 nm) as a tool for diagnosis of colon cancer. Journal of Raman Spectroscopy, 2014, 45.10, 903–911.
- Krbcová, Z., et al. Variational approach to cancerous tissue identification from in vivo Raman spectra. Biomedical Signal Processing and Control, 2019, 49, 520–527.
- Votruba, J., et al. 54P Correlation of Raman and NIR spectroscopy for diagnosis of peripheral lung cancer. Journal of Thoracic Oncology, 2016, 11.4, 1.
- Okusanya, O.T., et al. Intraoperative near-infrared imaging can identify pulmonary nodules. The Annals of Thoracic Surgery, 2014, 98.4, 1223–1230.
- Datasheet of the LUXEON IR Compact Line. Available online: https://cz.mouser.com/datasheet/2/602/DS190-1138398.pdf (accessed on 2025-JUN-20).
- Datasheet of iDS UI-3360CP-NIR-GL Rev.2. Available online: https://en.ids-imaging.com/IDS/datasheet_pdf.php? sku=AB00624 (accessed on 2025-JUN-20).
- Votruba, J., Drahanský, M., Goldmann, T., Kolář, R., Brůha, T. Medical device for localization of solitary pulmonary nodes in lung tissue. Utility model, ÚPV-33726, CZ, 2019.
- Short, M.A., et al. Using laser Raman spectroscopy to reduce false positives of autofluorescence bronchoscopies: a pilot study. Journal of Thoracic Oncology, 2011, 6.7, 1206–1214.
- Han, K.N, Kim, H.K. Imaging techniques for minimally invasive thoracic surgery—Korea University Guro Hospital experiences. Journal of Thoracic Disease, 2018, 10.6, 1.
- Cao, J., at al. Recent progress in NIR-II contrast agent for biological imaging. Frontiers in Bioengineering and Biotechnology, 2020, 7.487.
- Pizer, S.M. 1977. Adaptive histogram equalization and its variations. Computer Graphics and Image Processing 6: 184–195. [Google Scholar] [CrossRef]
- Verschakelen, J.A., De Wever, W. Computed tomography of the lung. Springer-Verlag Berlin Heidelberg, 2007.
- Tawfik, N., et al. Enhancing Early Detection of Lung Cancer through Advanced Image Processing Techniques and Deep Learning Architectures for CT Scans. Computers, Materials and Continua, 2024, 81:1, 271–307.
Figure 1.
Construction of our illumination and acquisition solution.
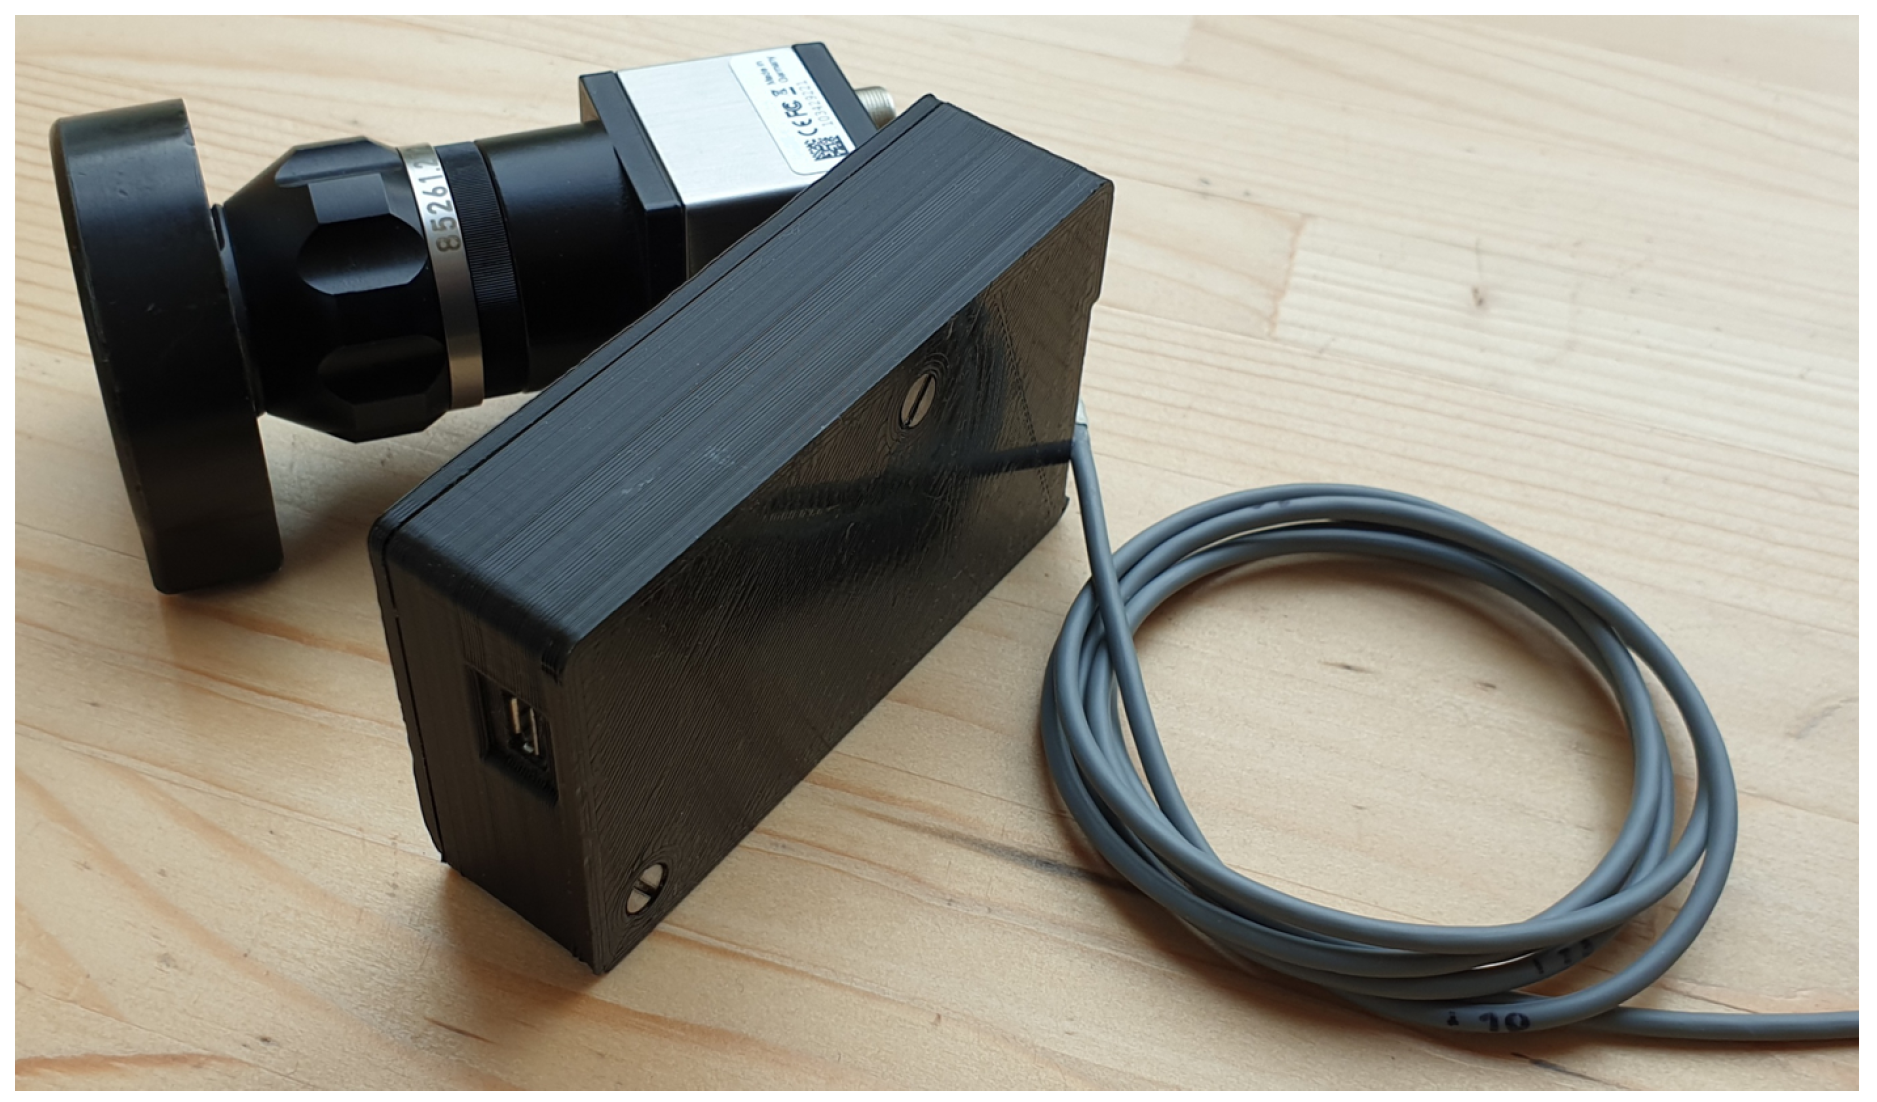
Figure 2.
Spectral power distribution characteristics for the used LED LUXEON IR.
Figure 2.
Spectral power distribution characteristics for the used LED LUXEON IR.
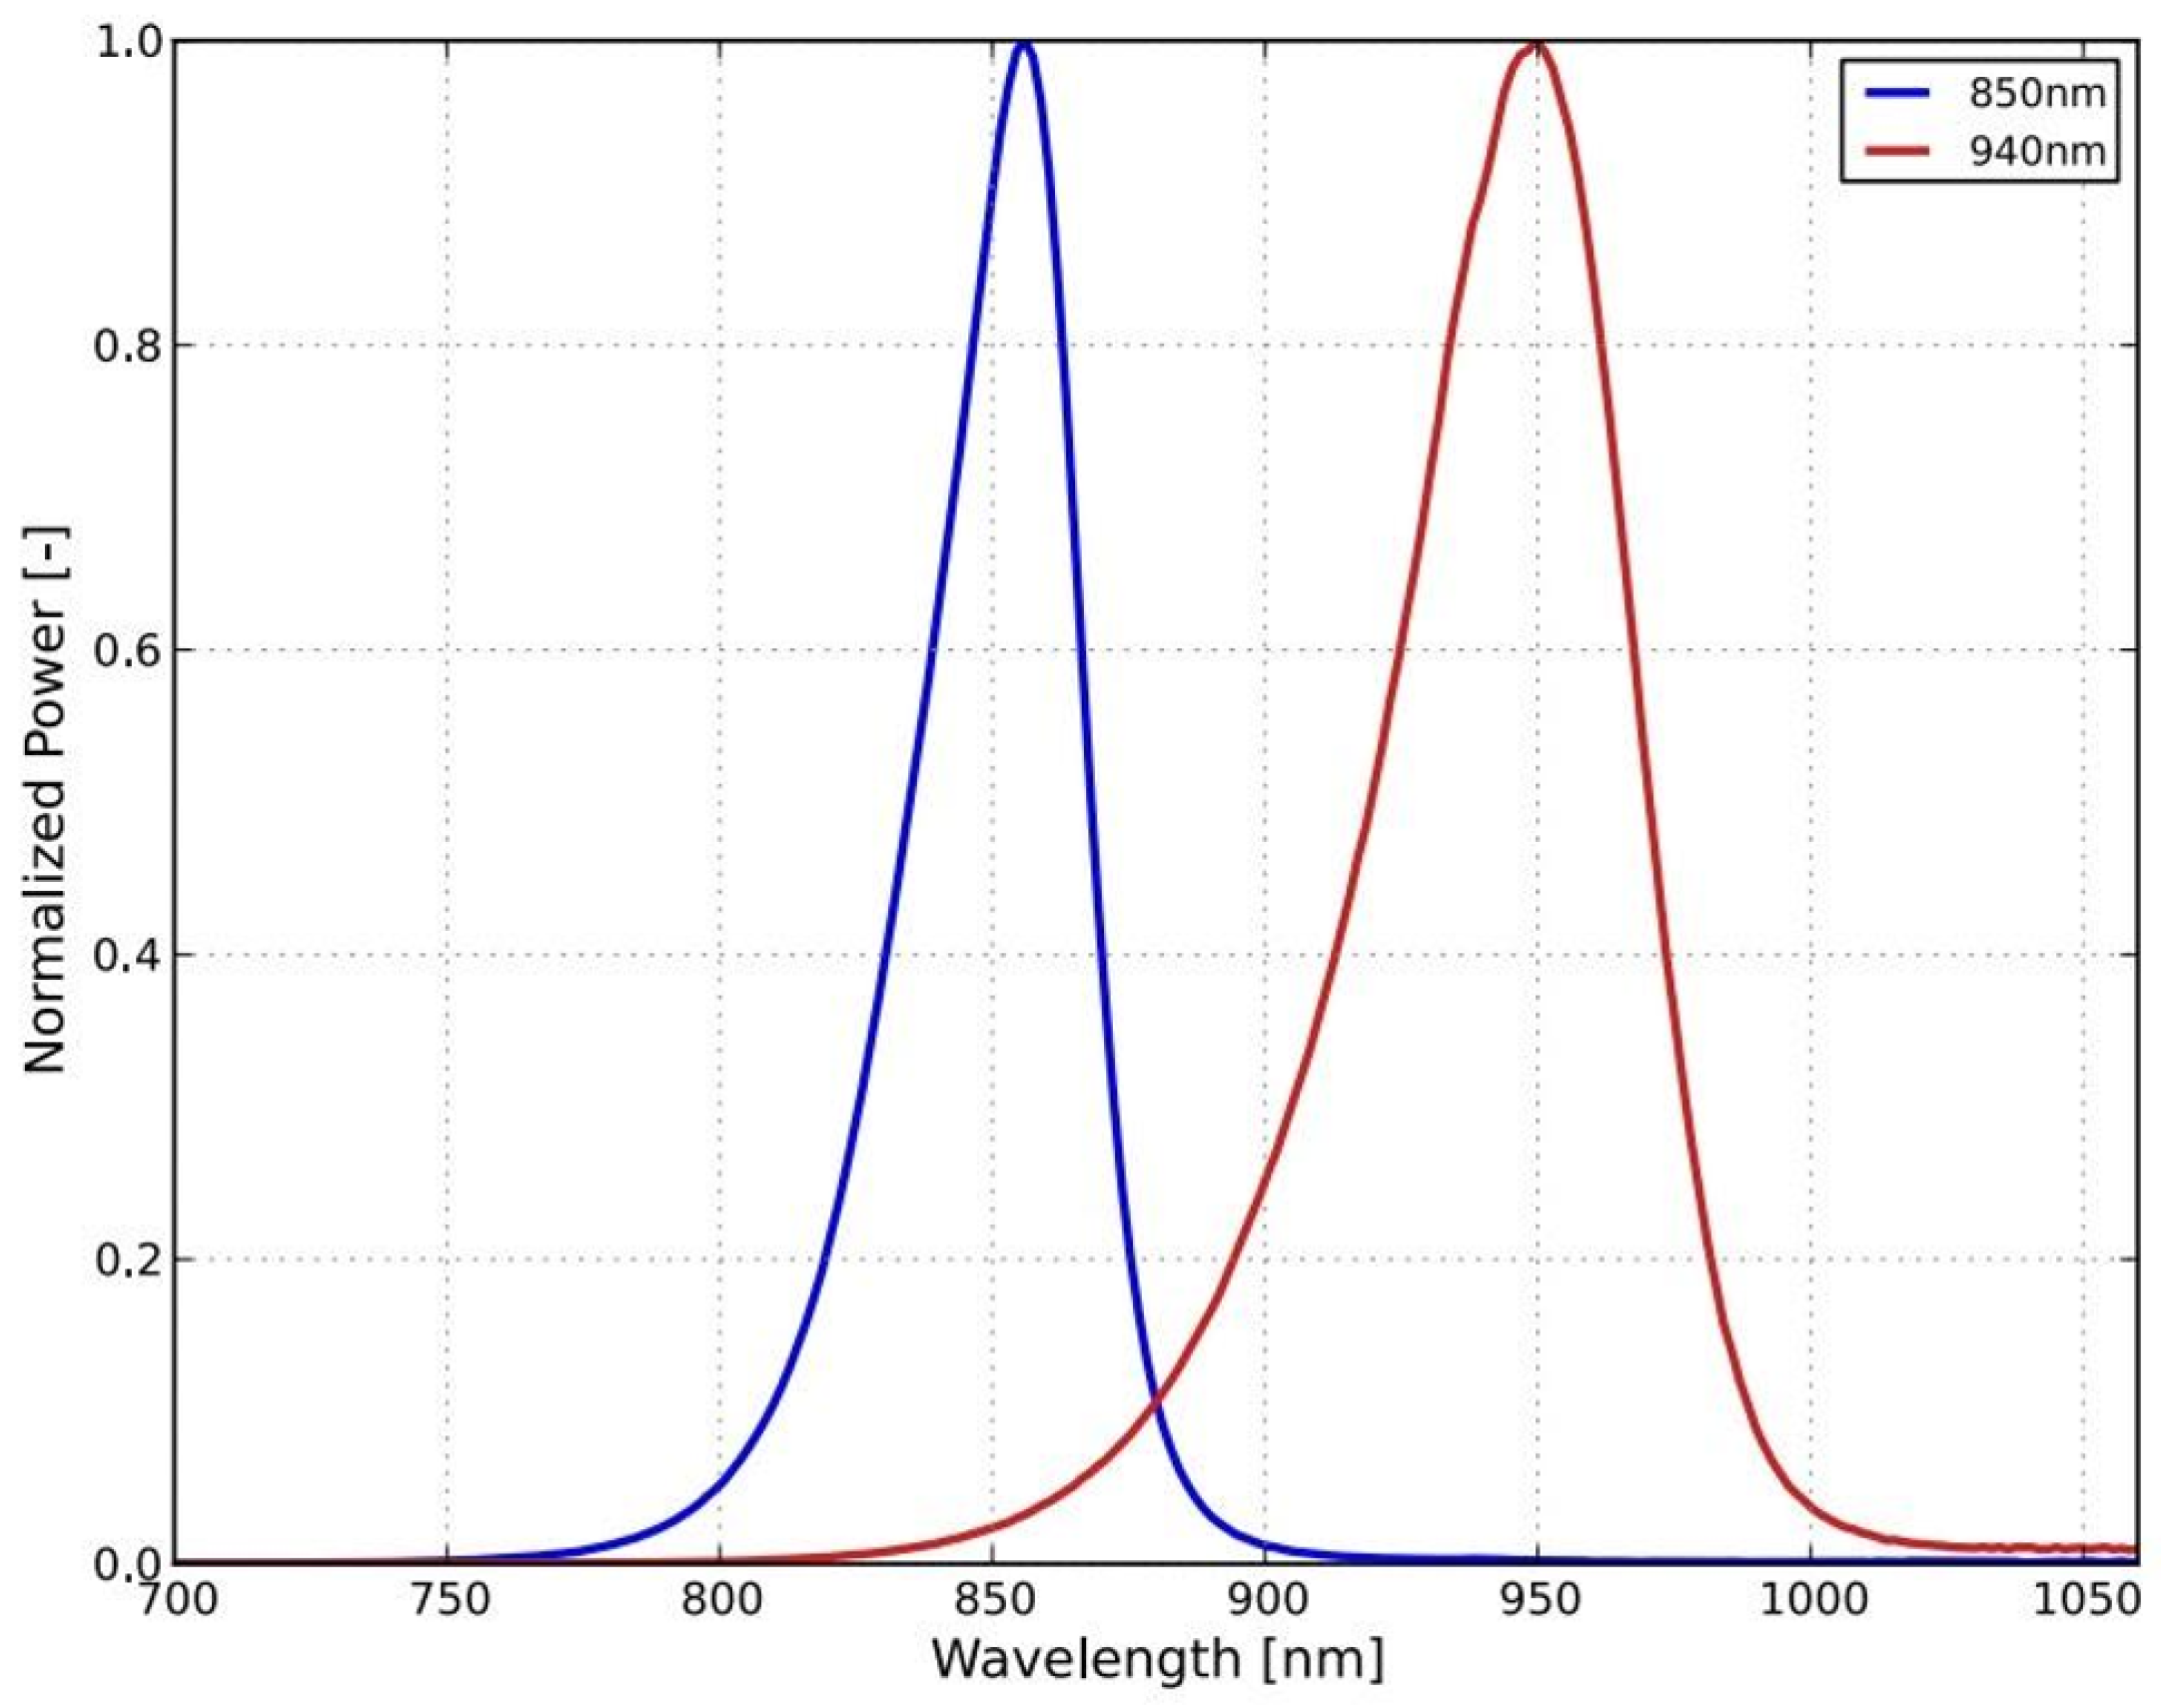
Figure 3.
Configuration of the experiment.
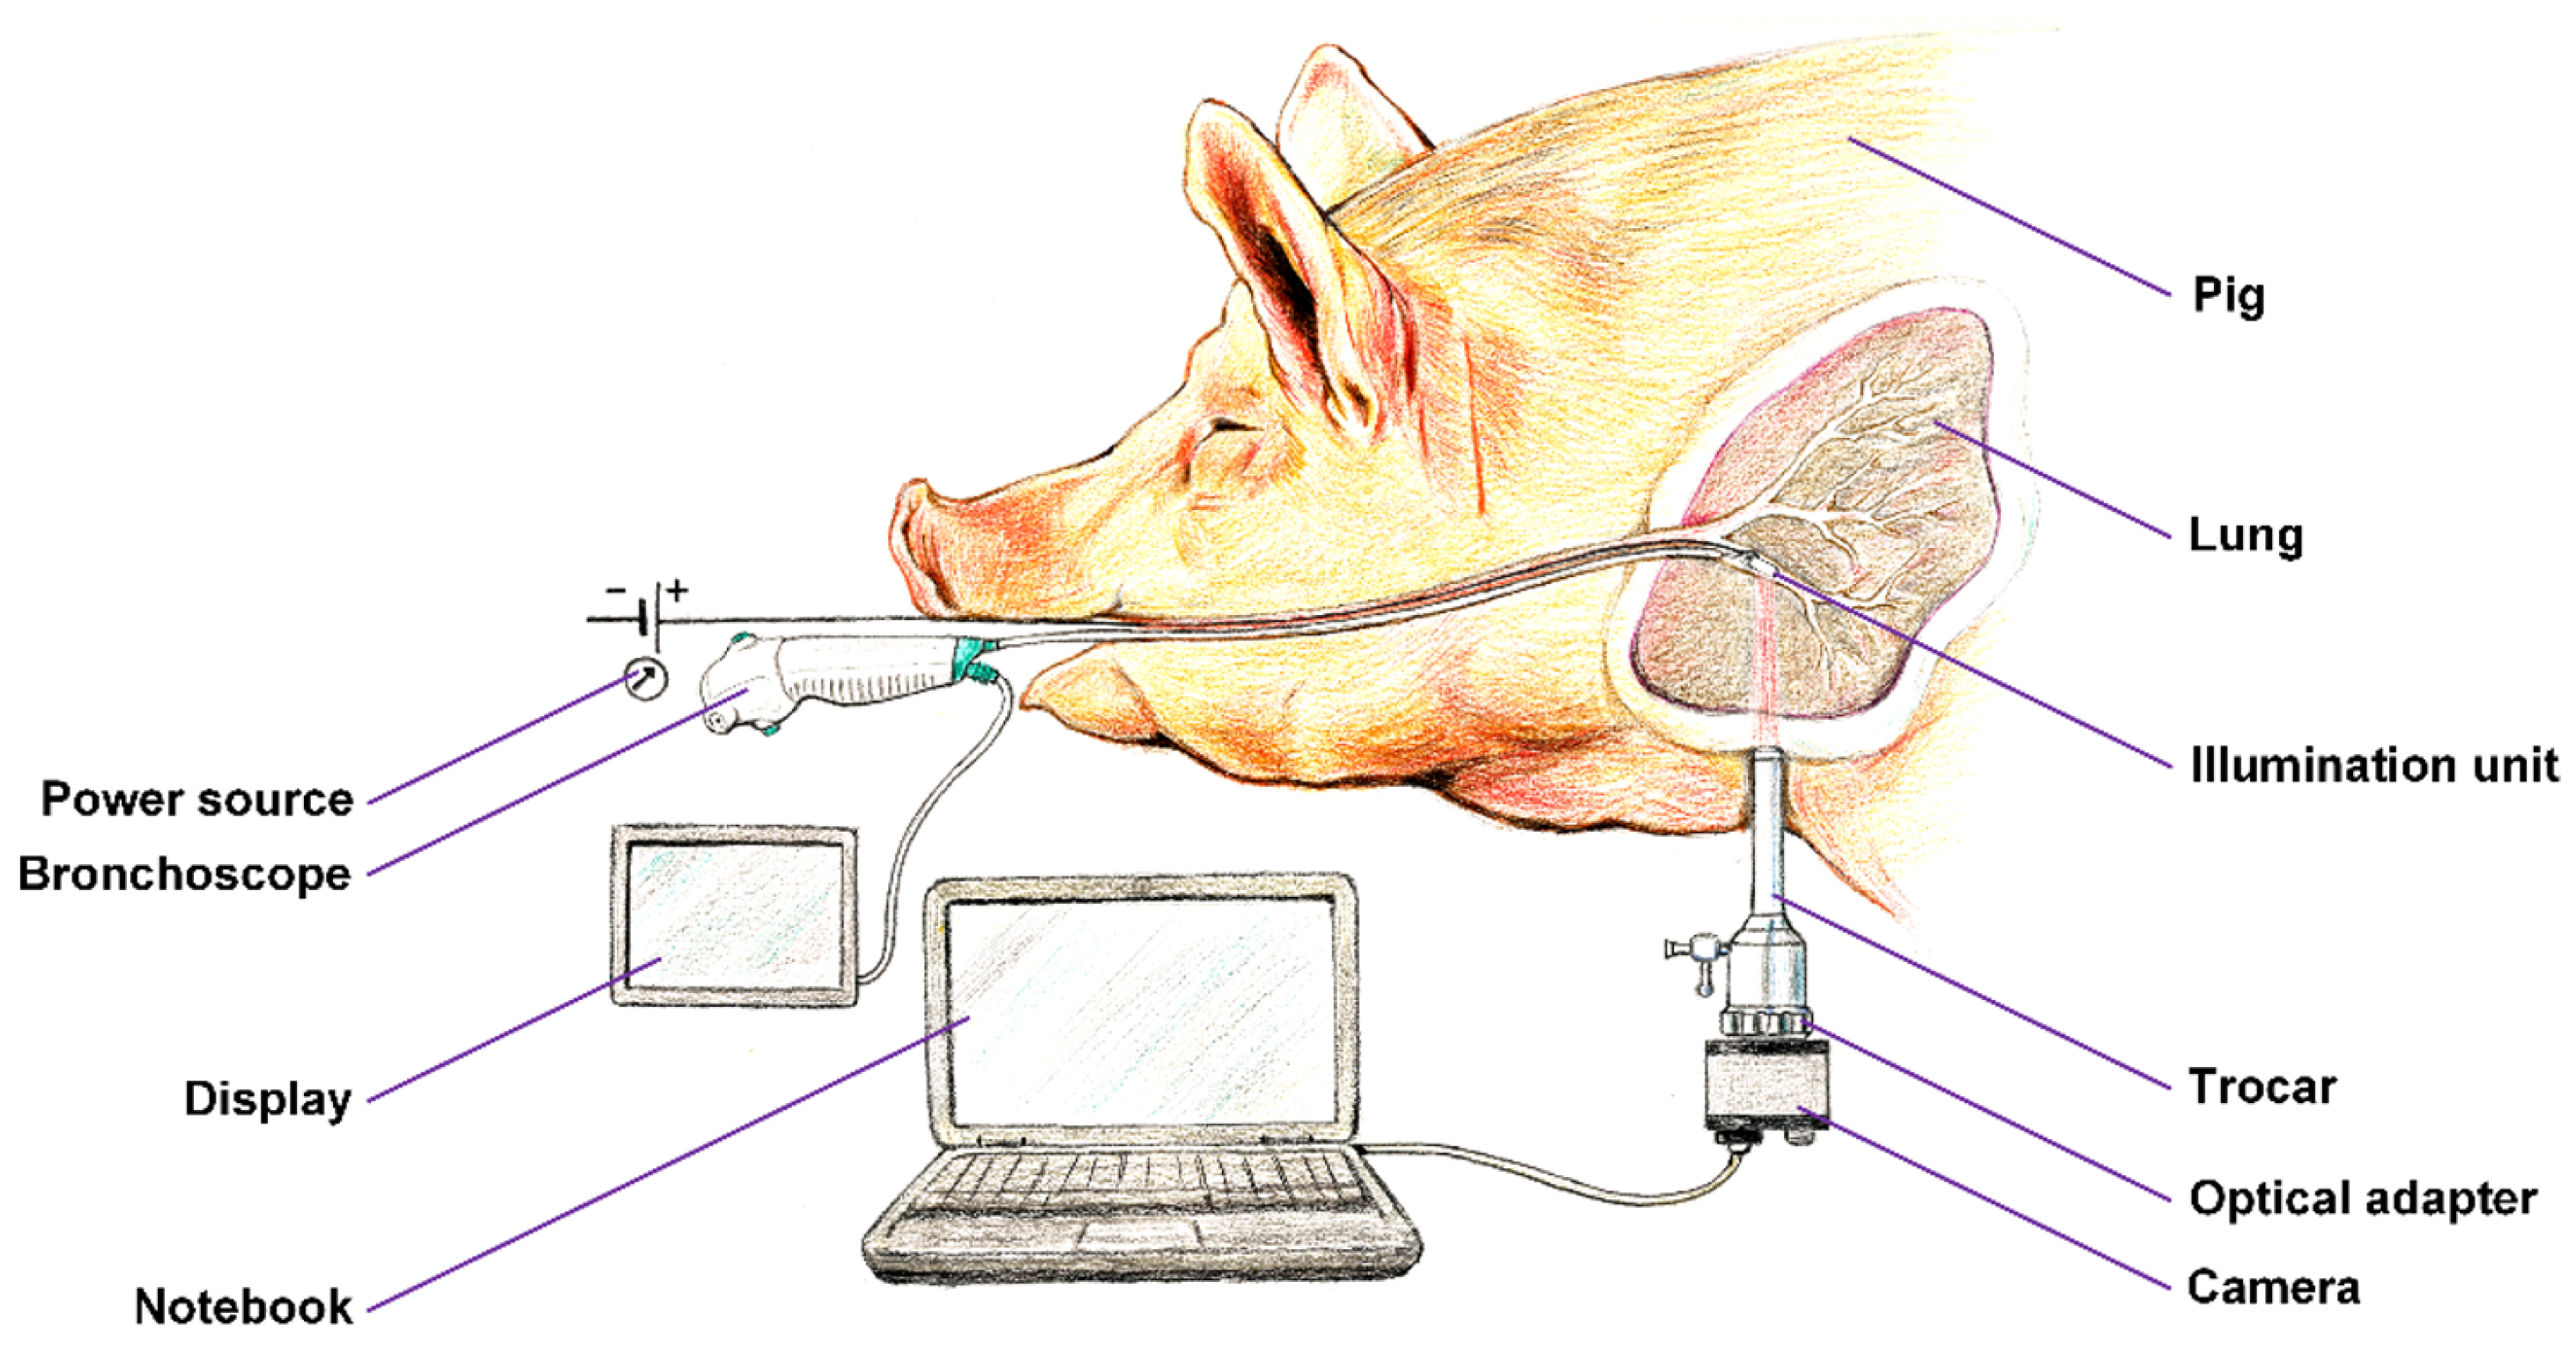
Figure 4.
Optical principle of the lung tissue translumination.
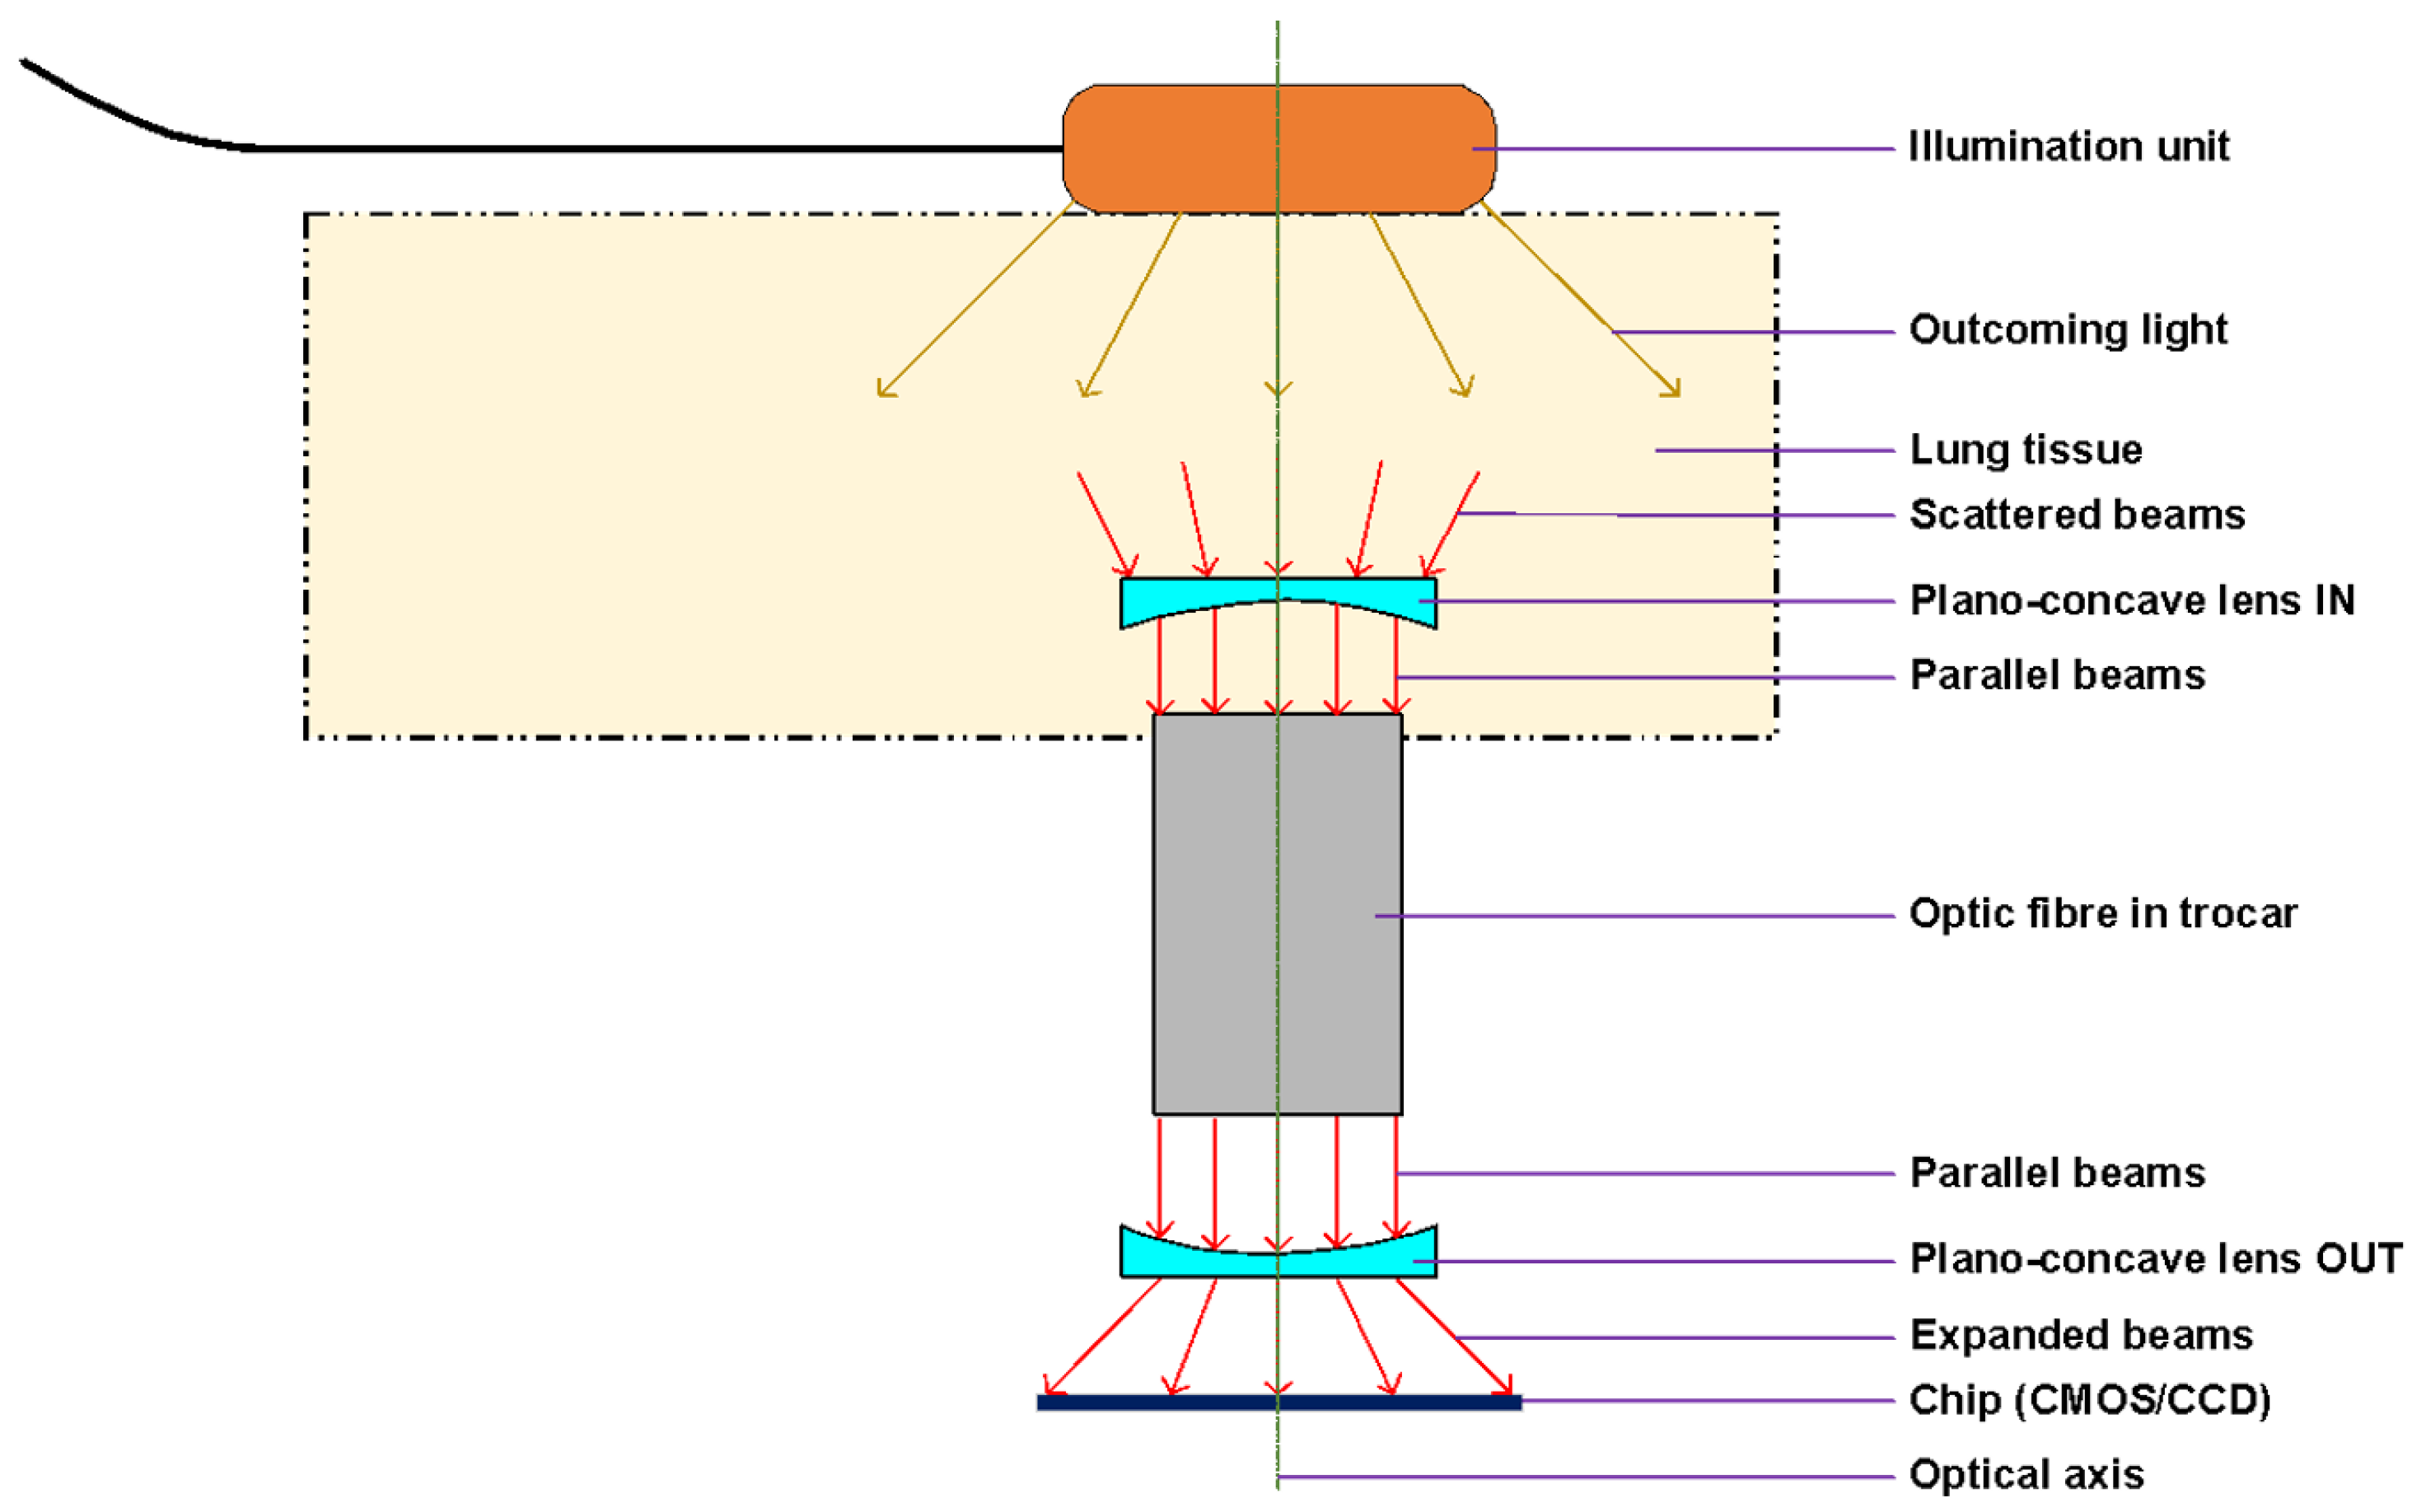
Figure 5.
Quantum efficiency at given wavelength range for the selected iDS Imaging camera. The NIR variant has been selected due to significantly higher quantum efficiency in 800-900nm range.
Figure 5.
Quantum efficiency at given wavelength range for the selected iDS Imaging camera. The NIR variant has been selected due to significantly higher quantum efficiency in 800-900nm range.
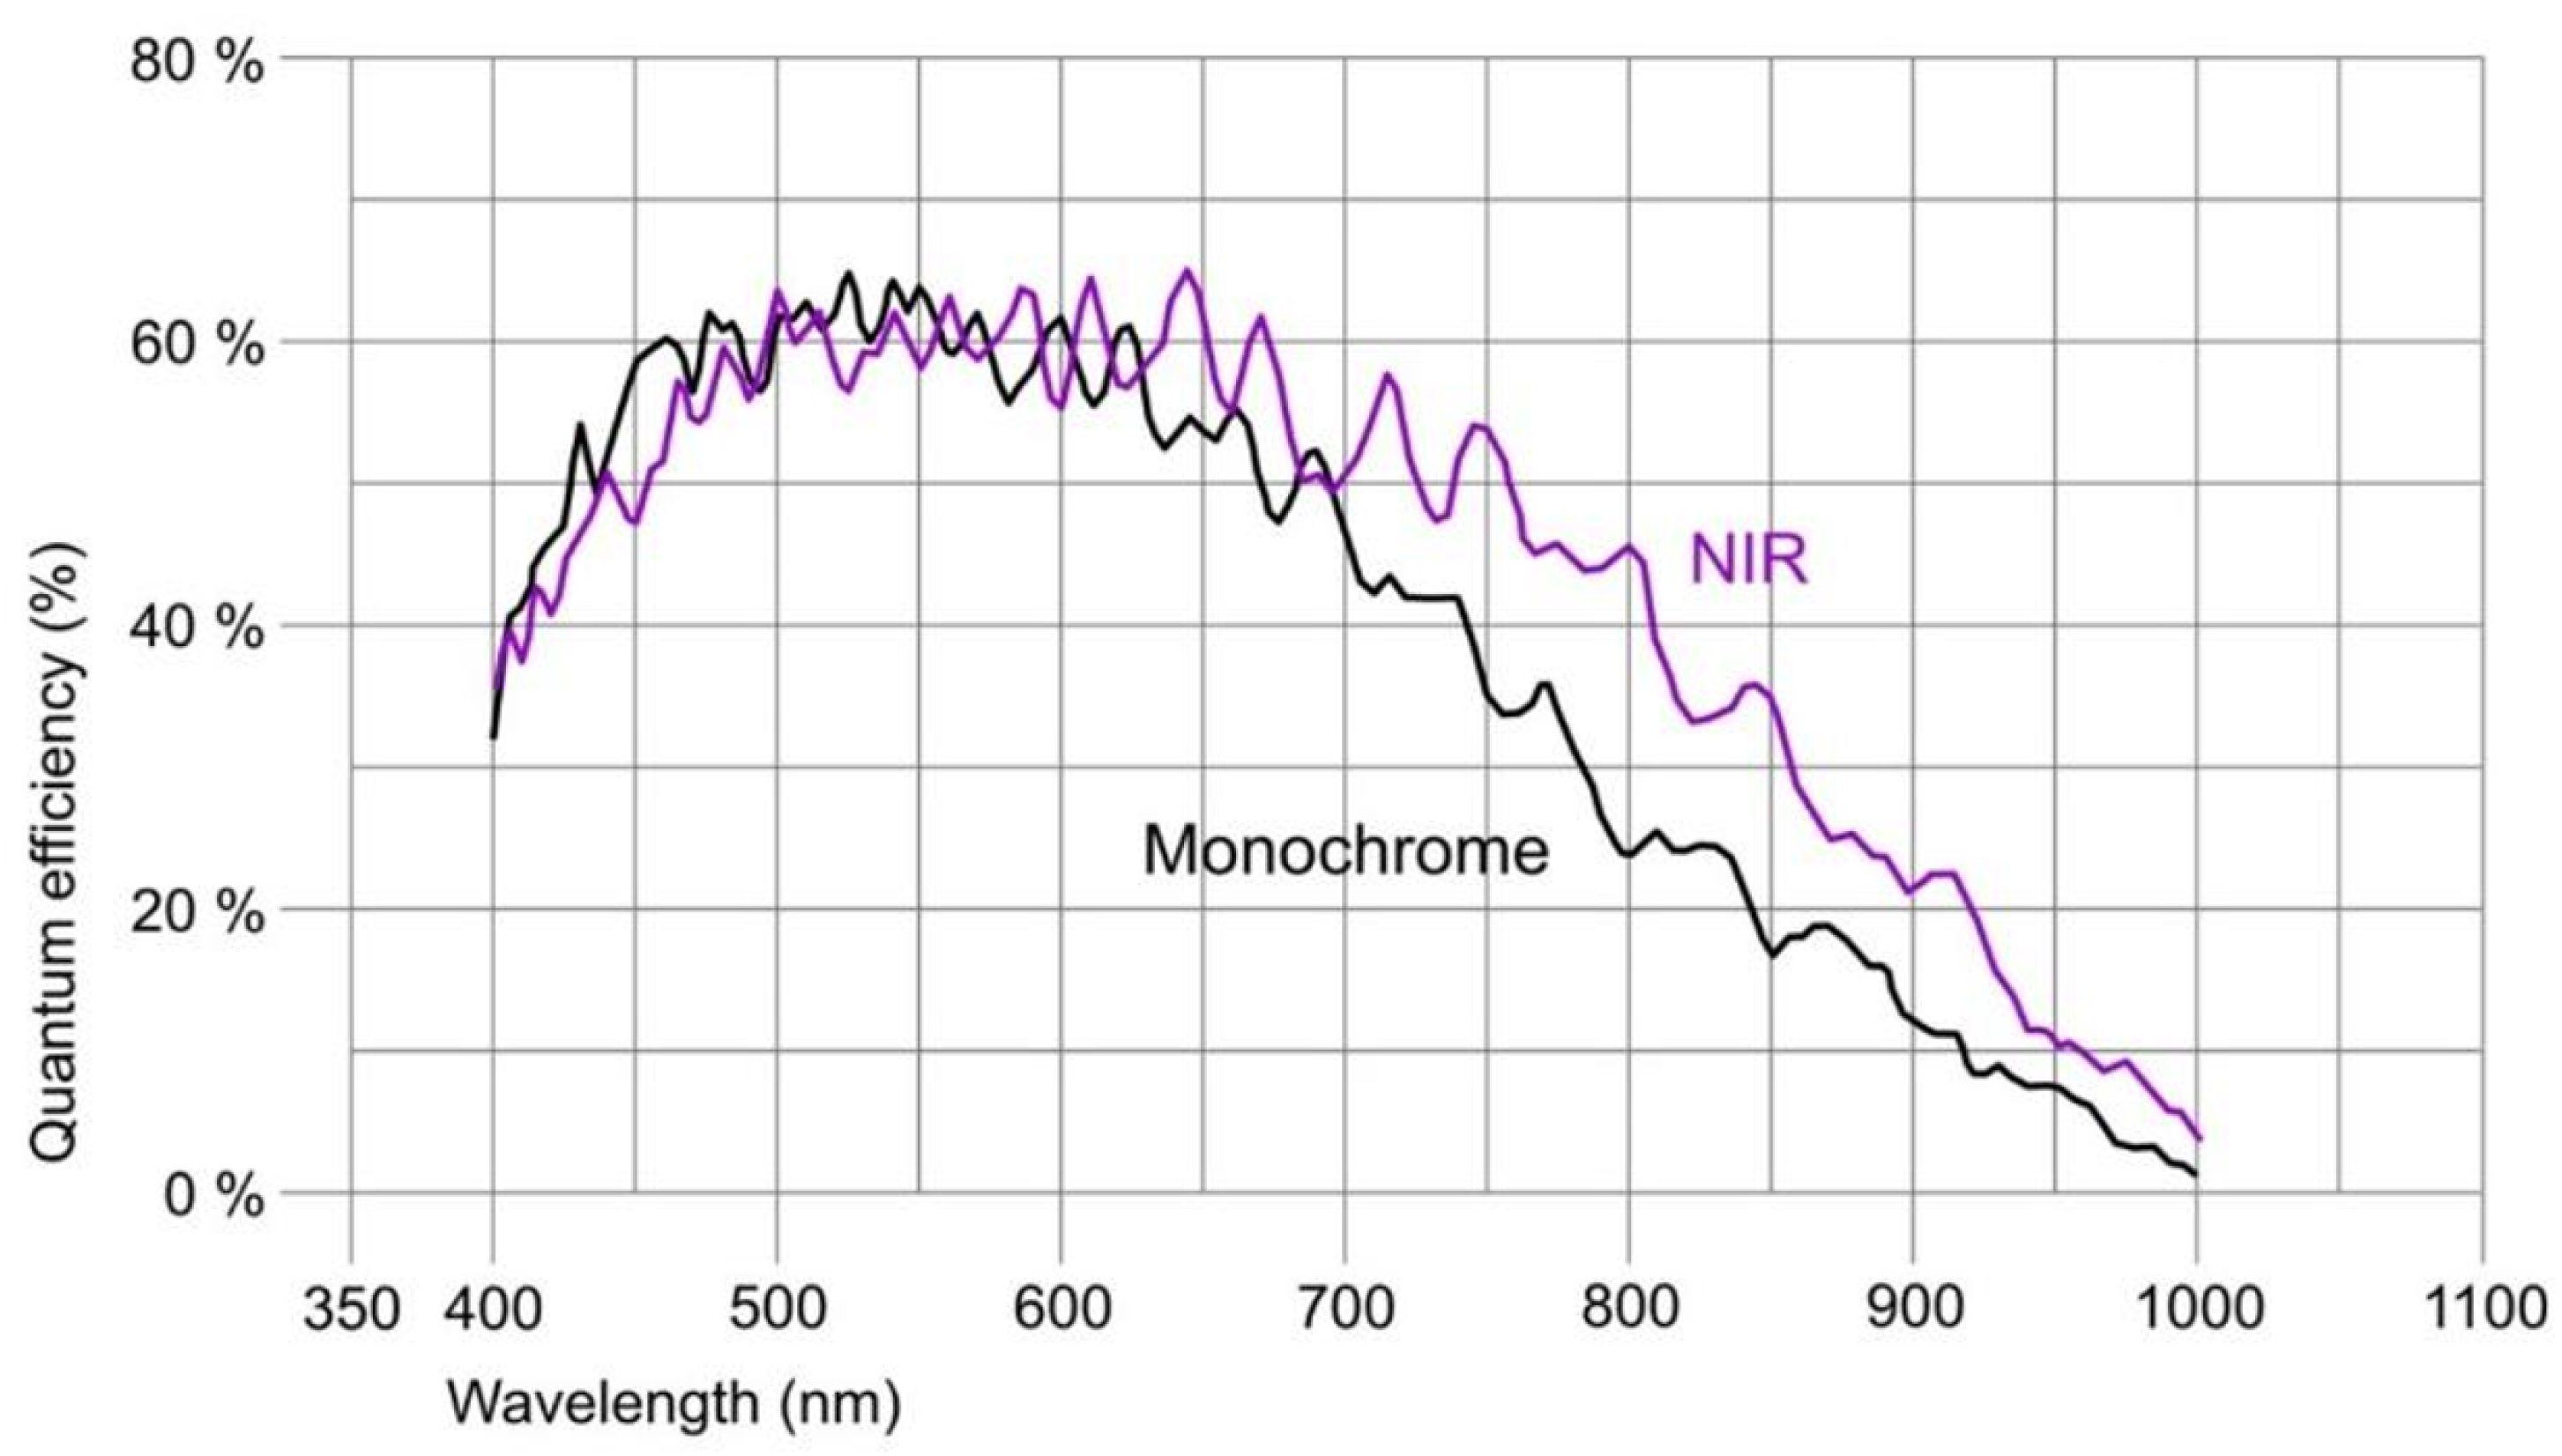
Figure 6.
Flowchart of the whole translumination process.
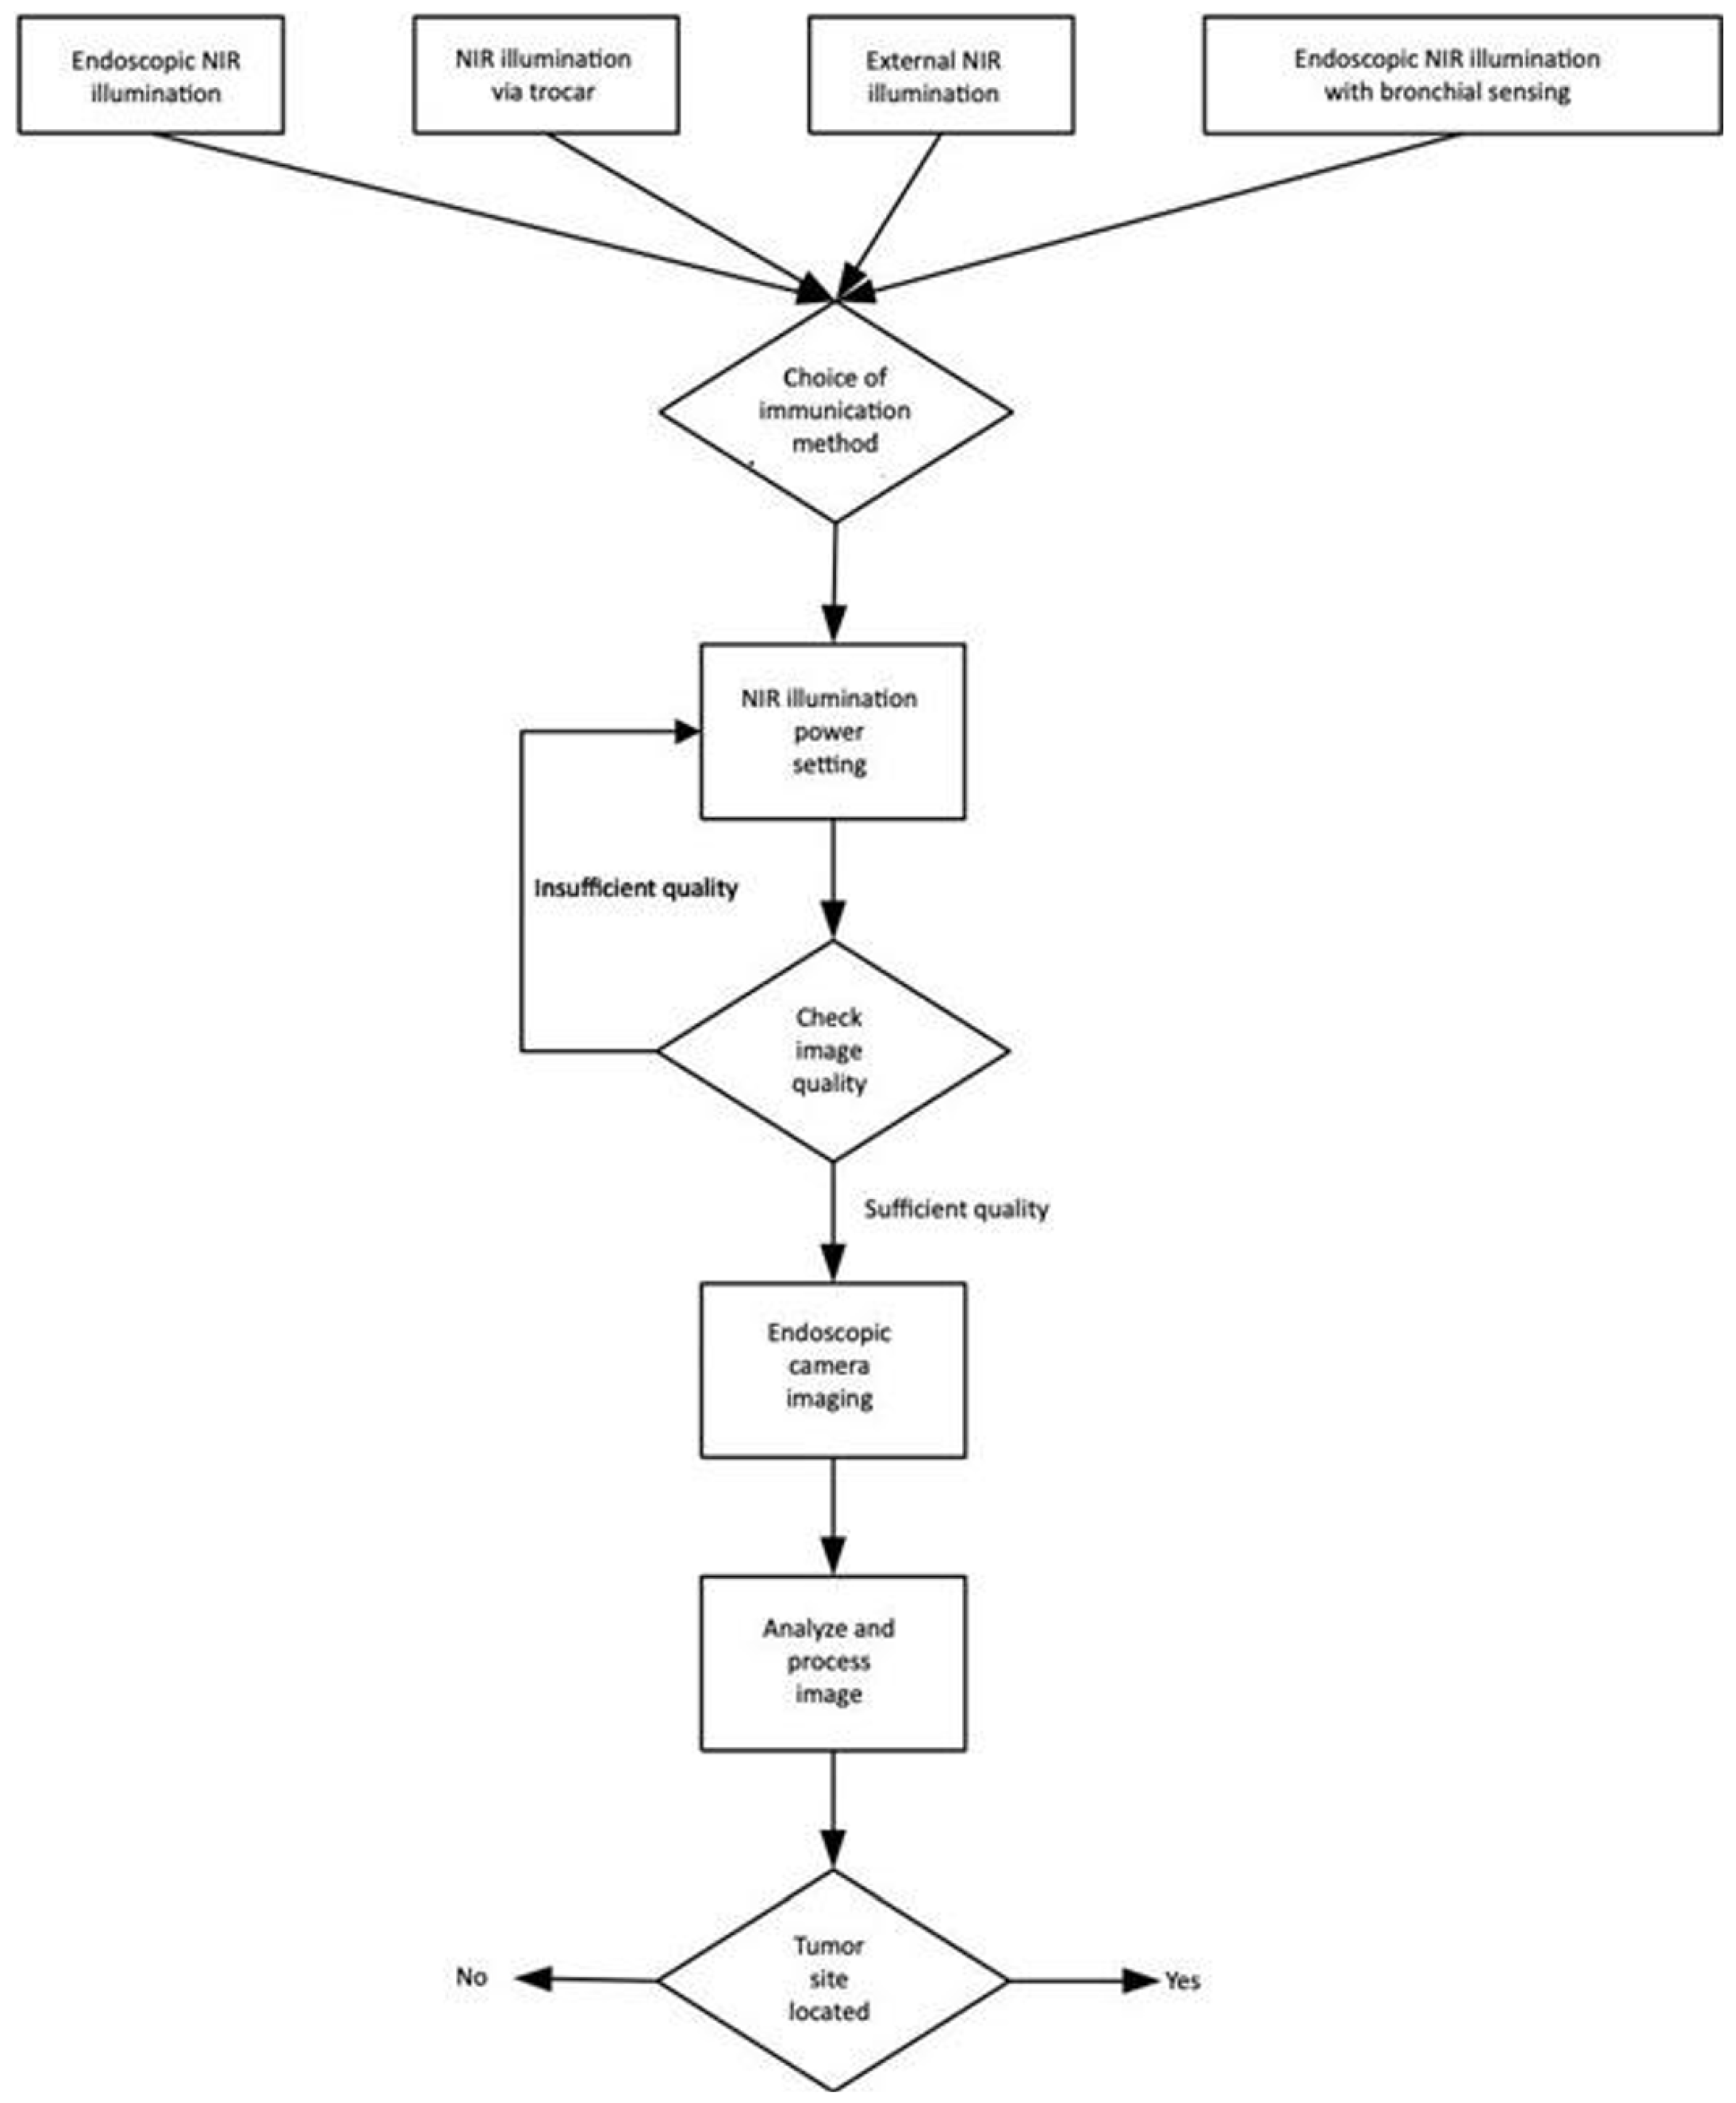
Figure 7.
Lung tissue with a direct view (left); Bronchial ways (multi-fiber pleuroscope) (right).
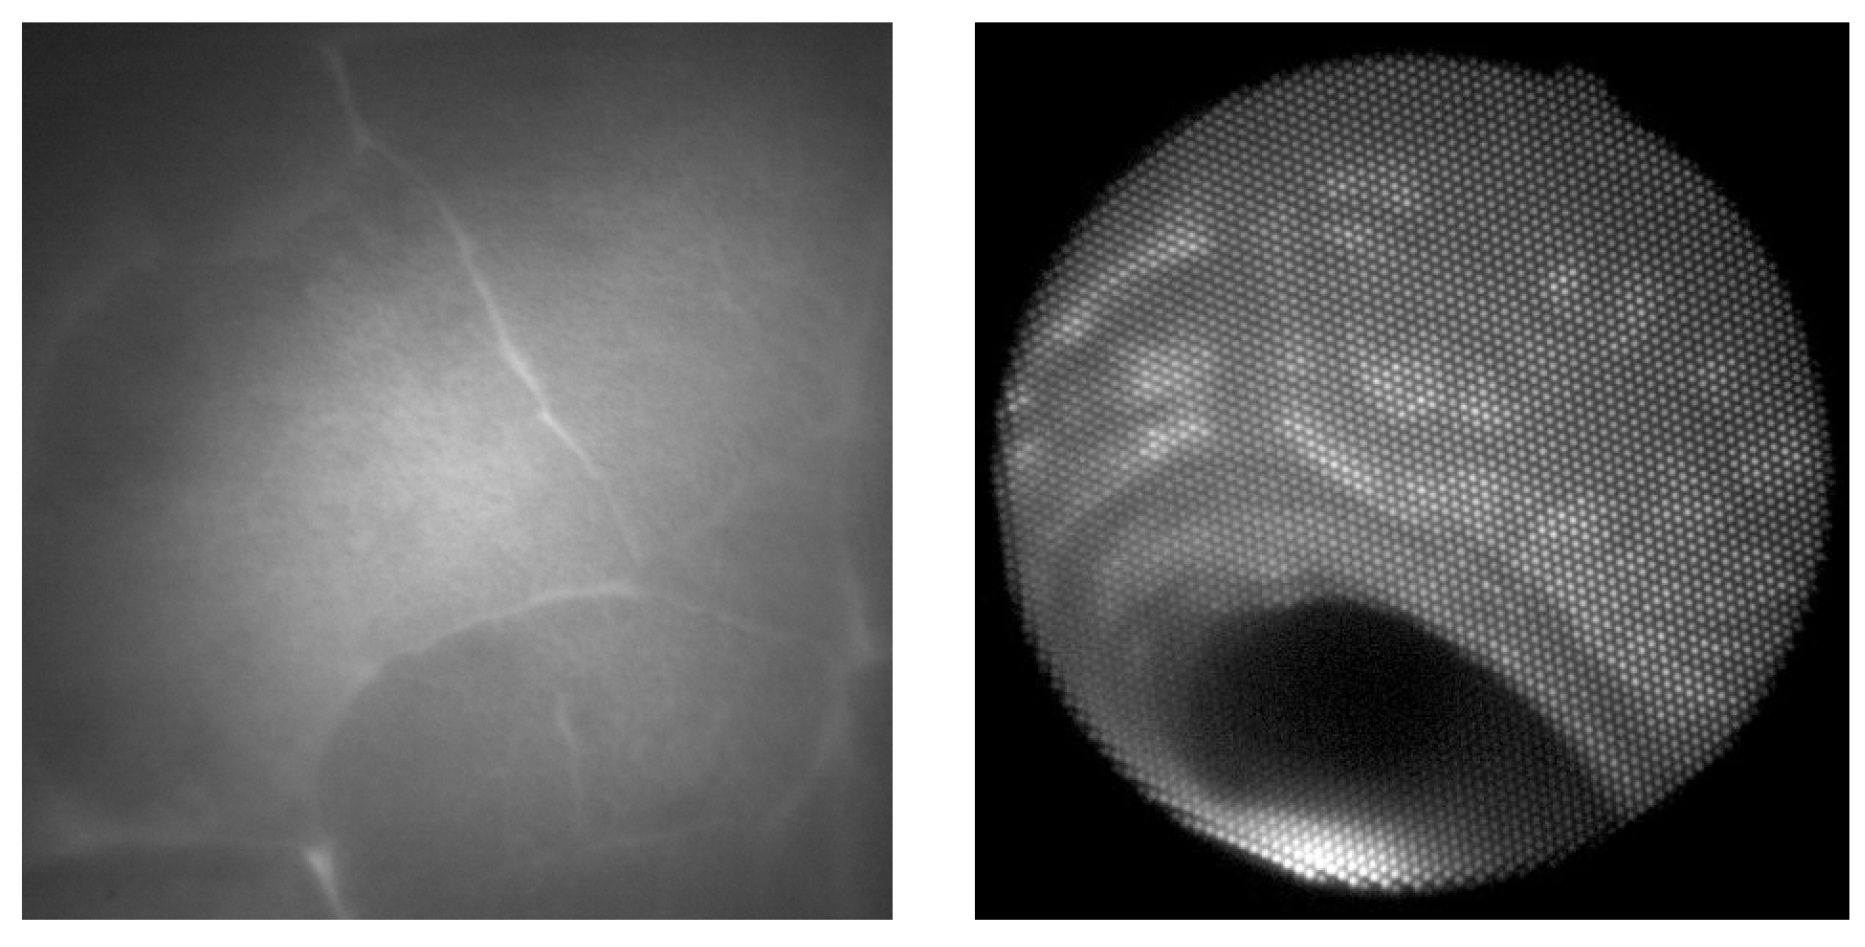
Figure 8.
Estimation of non-uniform illumination field (left), corrected image (middle) and image with adaptive histogram correction (right). The images are cropped in order to remove the border effect caused by image filtering. The original image is shown in Figure 7 left.
Figure 8.
Estimation of non-uniform illumination field (left), corrected image (middle) and image with adaptive histogram correction (right). The images are cropped in order to remove the border effect caused by image filtering. The original image is shown in Figure 7 left.
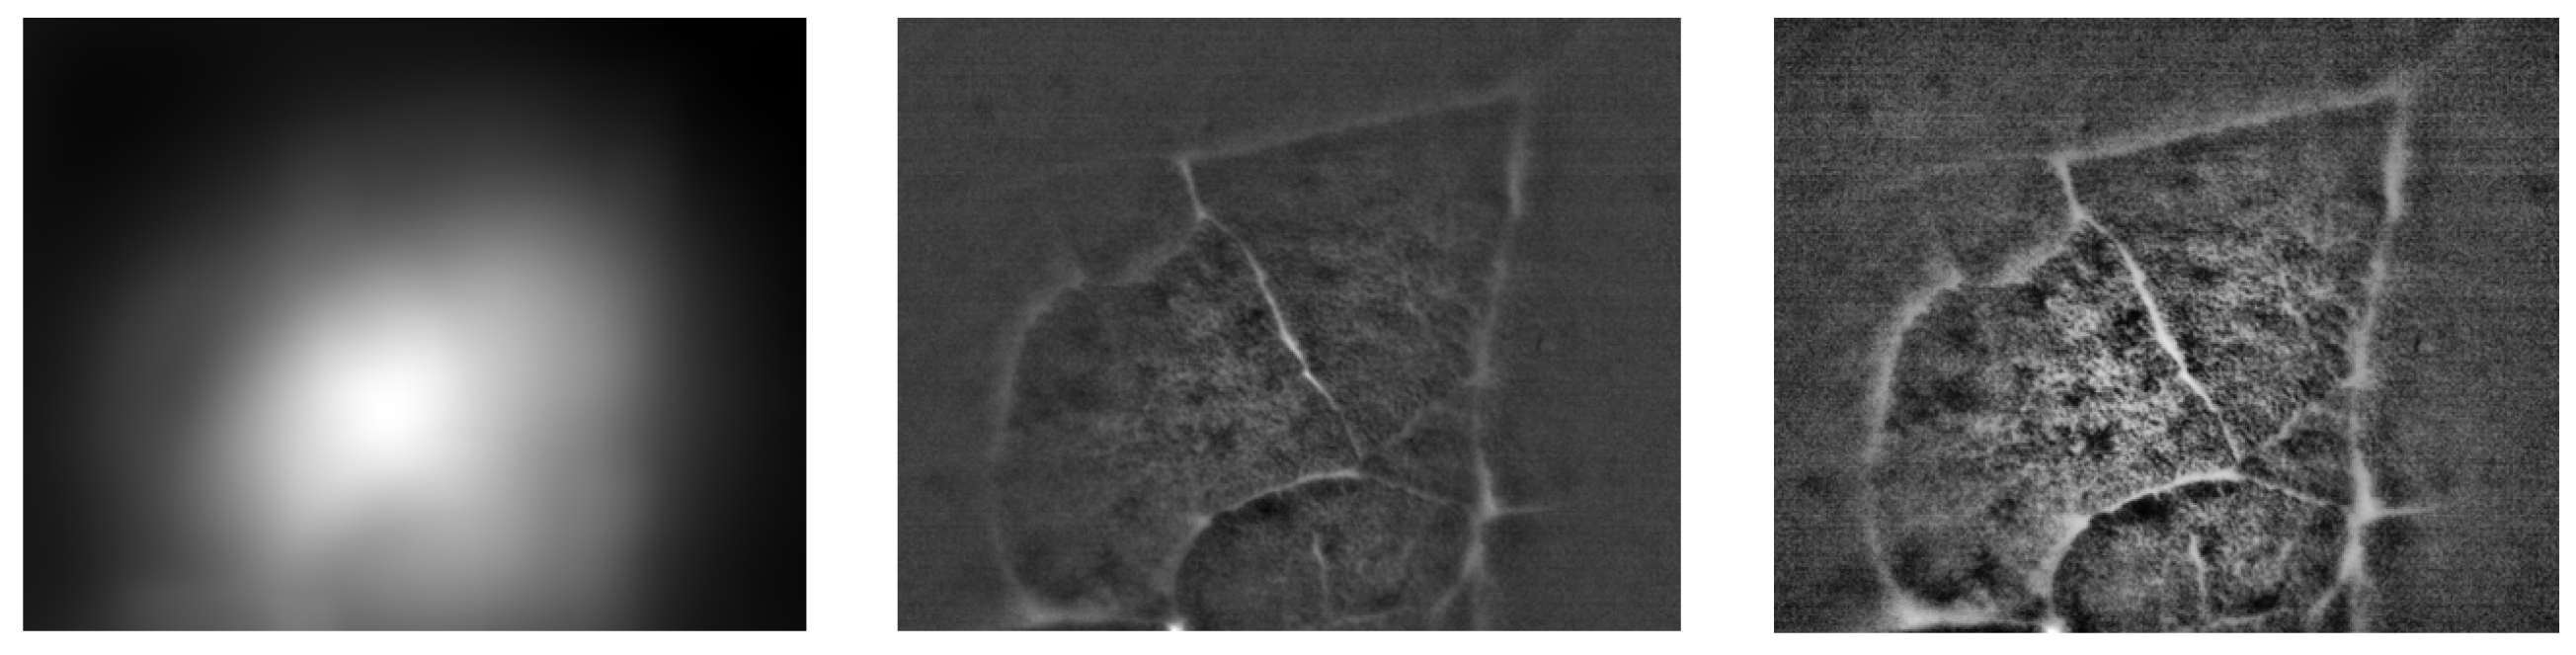
Figure 9.
Lung lobulus anatomy: cadaver section of the lungs with visible lung lobules with 1 for interlobular septa, 2 for central bronchioles (left), HRCT section of the patient with interstitial edema, where septas and lobules are clearly visible (right) Verschakelen (2007).
Figure 9.
Lung lobulus anatomy: cadaver section of the lungs with visible lung lobules with 1 for interlobular septa, 2 for central bronchioles (left), HRCT section of the patient with interstitial edema, where septas and lobules are clearly visible (right) Verschakelen (2007).

| Advantages | Disadvantages |
|---|---|
| Early diagnosis of lung tumors – reduction of overall and tumor-related mortality | Radiation burden |
| Reducing the number of patients with advanced disease | Over-diagnosis, unnecessary diagnostic and therapeutic interventions and associated morbidity and mortality |
| Increased disability-adjusted life-year (DALY) / quality-adjusted life-year (QALY) | Psychological burden on the patients |
| Possible first step towards quitting smoking | False assurance that patients are protected from the harmful effects of smoking |
| Broader therapy options | |
| Reducing the risk of postoperative complications associated with radical procedures as a result of delayed diagnosis | |
| Early detection of interstitial process in a treatable stage, assessment of calcium plaque burden, screening for osteoporosis |
Disclaimer/Publisher’s Note: The statements, opinions and data contained in all publications are solely those of the individual author(s) and contributor(s) and not of MDPI and/or the editor(s). MDPI and/or the editor(s) disclaim responsibility for any injury to people or property resulting from any ideas, methods, instructions or products referred to in the content. |
© 2025 by the authors. Licensee MDPI, Basel, Switzerland. This article is an open access article distributed under the terms and conditions of the Creative Commons Attribution (CC BY) license (http://creativecommons.org/licenses/by/4.0/).
Copyright: This open access article is published under a Creative Commons CC BY 4.0 license, which permit the free download, distribution, and reuse, provided that the author and preprint are cited in any reuse.


