
Submitted:
07 August 2025
Posted:
08 August 2025
You are already at the latest version
Abstract
Rolling contact fatigue (RCF) and wear are the primary types of damage found in rails and wheels, and these often compete with each other. This paper presents a comprehensive review of studies on RCF and wear of rails and wheels, focusing on their competition. First, RCF and wear in actual rails and wheels were discussed. Then, theory and models for RCF cracks were presented—from crack initiation, followed by short crack and long crack growth to crack branching and the branch crack growth. Then, different wear forms, wear regimes, and their theories and models were introduced. Several papers dealing with the competition between RCF and wear were discussed. Finally, current gaps or problems of the studies on RCF and wear of rails and wheels were identified and provided recommendations for future work.
Keywords:
rolling contact fatigue
; wear
; competition between RCF and wear
; rail
; wheel
1. Introduction
The rolling contact between wheels and rails is crucial for railway systems. Under a cyclic wheel passage, the high contact pressure and tangential traction lead to the initiation of cracks known as the rolling contact fatigue (RCF) and wear in both surfaces, considerably damaging the rails and wheels. Railway wheel turning data [1] revealed that the majority of wheels were turned due to either RCF or tread/flange wear. The cost of rail and track maintenance increases considerably with regard to the detection of RCF cracks, the installation of reinforcements, the renewal of rails and wear on curved sections of rails. In some cases, either RCF or wear dominates, making the other negligible. However, when both affect rails and wheels to a comparable degree, their competition becomes critical, as measures taken to reduce one may influence the progression or mitigation of the other.
The full lifecycle of a crack in a rail can be determined by combining all the phases of crack growth. By overlaying the wear-induced reduction in crack length onto the crack growth curve, Figure 1 illustrates how wear can truncate the crack lifecycle [2]. Curve A shows crack initiation and growth by ratcheting; curve B shows the contact stress–driven growth; curve C shows the crack moving away from the heavily stressed zone near the contact and rate decreases; and curve D shows the crack driven by rail bending and residual stresses. If the wear rate is higher than the crack growth rate, then the crack will be worn away. However, a low wear rate can be detrimental as the crack can move from curve A to D. This concept can be applied to RCF and wear competition of wheels.
Based on the permitted amount of material that can be lost, an increase in wear rate will decrease the lifespan of the rail (Figure 2). The fatigue life curve in this figure is based on the variation in crack growth rates with crack length shown by curves B and C in Figure 1. The actual life of a material is the lower value of its fatigue and wear life, as indicated by the bold curve. The peak point on this curve represents the maximum lifespan that can be achieved by balancing material removal rate via natural wear and grinding; this is referred to as the “magic wear rate” [3] or optimum wear rate.
Herein, a review of literature on RCF and wear of rails and wheels, particularly the competition between them, is presented. Section 2 and Section 3 describe various types of RCFs and wear, respectively, occurring on actual rails and wheels. Section 4 describes the initiation to eventual brittle failure of RCF cracks and the analytical and empirical models used to analyze these mechanisms. Section 5 outlines various types of wear and their models. Section 6 describes studies on RCF crack growth and wear competition in rails and wheels aiming for the magic wear rate. Section 7 points out the current gaps or problems of the studies on RCF and wear of rails and wheels were identified and provided recommendations for future work.
In the following text, since many papers are referred to, the same letter is used with different meanings, in which case the meaning of the letter is explained in each case.
2. Field-Observed RCF
2.1. RCF of Rails
RCF damage in rails became a major problem following the appearance of fatigue cracks—known as “dark spots”—in the curves of the Sanyo Main Line of Japan around 1951. The seriousness of the issue was quickly recognized, prompting extensive research into the phenomenon. In the Tokaido Shinkansen Line, which began operation in October 1964, rail “shelling” (or squats in Europe) in the middle of the rail became noticeable around 1973. On the Sanyo Shinkansen Line between Osaka and Okayama stations, squats began to occur when the cumulative passing tonnage (an index used to evaluate the damage to the track caused by train loads, expressed as “axle weight × number of passing axles”) exceeded 150 million tons. Its increasing tendency became more pronounced when the tonnage exceeded 200 million tons.
2.1.1. Squats
Figure 3 shows a typical appearance of squats [4]. The main crack develops as a “horizontal crack”, which is a coplanar crack, in the direction of train travel at a shallow angle, and a small horizontal one develops on the opposite direction of the train. Such horizontal cracks rapidly form in tunnels where water leaks constantly wet the top of the rail. The crack branches to form a “transverse crack,” that causes spalling of the rail surface or rail breakage.
2.1.2. Head Checks
On high rails in curved sections and even on straight sections in some cases, wheel flanges contact rail gauge corners and cause damage to gauge corners. This is because the wheel diameter difference at the contact point, unlike the top of the head, causes a large differential slip to act on it. Typical examples of damage are cracks that form continuously at regular intervals, known as “head checks.” The intervals are usually 1–3 mm depending on the contact conditions and the material.
2.2. RCF of Wheels
RCF initiating at the wheel tread is related to loading between the wheel and rail. When the stress due to loading exceeds the yield stress of the material, its surface under-goes plastic deformation. Consequently, permanent deformation and ultimately fatigue cracking occurs at the thin surface layer, which grows into small crack at a shallow angle that grows into the wheel. Most of these cracks grow as the vehicle operates and can cause damage. Typical RCF cracks in wheels are described in subsequent sections.
2.2.1. Spalling
Spalling is a nest-like failure, in which the surface layer separates at a depth of a few millimeters almost parallel to the surface. This type of damage is caused by the arrest of thermal cracks, followed by the initiation and growth of cracks due to the occurrence of RCF parallel to the surface near the bottom of the arrested cracks (Figure 4) [5]. The adjacent cracks coalesce and cause detachment of the tread materials. Thermal crack initiation is caused by thermal fatigue that occurs when the surface layer on the tread is subjected to tension resulting from the temperature rise caused by the tread braking heat. It yields in compression due to restraint from the low temperatures of the surrounding parts that inhibit expansion and then progresses to tensile stress due to natural cooling after the braking is stopped.
2.2.2. Shelling
Shelling is the damage caused by pure RCF and can occur even in the absence of thermal effects. It can occur at two points of origin—either on the tread surface where plastic flow is pronounced or in the subsurface region with the maximum shear stress. In either case, the crack is at a shallow angle to the surface and the cracked area is often detached.
2.2.3. Heavy Shelling
This is one of the form of shelling. The internal pressure generated by fluid such as snowmelt or rainwater trapped inside a crack opening on the surface has a significant effect on crack growth, and the more pronounced the fluid effect is, the deeper the crack tends to be. In this case, the crack consists of a main crack growing deeper inside the tread and many cracks that branch from the main crack. The branched cracks reach the surface again, resulting in detaching.
2.2.4. Flat Spalling
A wheel flat is an oval-shaped plane area created by the localized wear on the tread surface when the wheel stops rotating due to strong braking force and slides along the rail. A structure known as a white etching layer (WEL) may appear under the wheel flat. Delamination may occur if the wheel with a flat spot is used without repair. Two types of cracks can cause delamination: those within the WEL and those at the edge of the flat spot between the WEL and base metal.
3. Field-Observed Wear
3.1. Wear of Rails
Wear of rail is caused by microscopic adhesion and fracture at the actual contact point of the friction surfaces. It occurs when two objects are plastically deformed due to localized high pressure at the contact point, causing one of the objects to spall from its surface and generating wear debris. Factors such as the tonnage of vehicles passing, wheel material and shape, lateral pressure, frange lubrication, materials and shapes of rails, curved alignment, gradient, track maintenance status, rail lubrication, environmental conditions, and weather affect wear.
3.1.1. Side Wear
The top and side surfaces within the gauge of rail head are worn with prolonged rail use. The wears on the head surface of straight and curved low rails are almost flat; how-ever, the gauge corners of high rails are subjected to a large slip caused by the rotation of wheels under the lateral force that causes side wear (Figure 5) [6]. Rail replacement is time- and labor-intensive. Improving the wear resistance of rails can considerably reduce the maintenance cost. Head-hardened rail and lubrication are commonly used to improve the wear resistance and reduce the frictional coefficient. In Japan, HH340 rails and HH370 rails with heat-treated heads are often used for the outer rails of sharp curves.
3.1.2. Corrugation
Corrugation is a phenomenon in which the top surface of a rail wears or plastically deforms in a wavy pattern at regular intervals. An example of the corrugation is shown in Figure 6 [7]. Corrugations on conventional railway lines can be broadly categorized into three types: corrugation with a wavelength of 30–80 mm occurring on straight sections, corrugations with a wavelength of 400–600 mm occurring mainly on the outer rails of sharp curves with a curve radius of 800 m or less, and corrugations with a wavelength of 60–150 mm occurring mainly on the inner rail of sharp curves with a curve radius of 400 m or less.
3.2. Wear of Wheels
Wear of wheel considerably impacts the performance of railway systems and increases the maintenance cost. Wheel profiles have been designed focusing on enhancing their strength and minimizing wear, as well as ensuring ride comfort and safety. Any change in the initial wheel profile can considerably impact the vehicle dynamics; therefore, such changes must be corrected and the wheel must be restored to its original profile. However, wheel reprofiling is restricted to a predefined limit of 780 of 860-mm wheel diameter, beyond which the wheel must be replaced. Wheel reprofiling and replacement considerably add to the maintenance cost.
3.2.1. Hollow Wear and Grooving Wear
The abnormal wear in wheel tread can be classified into hollow wear and grooving wear based on the wear pattern. Hollow wear refers to the large and concave wear pattern at the center of the wheel tread, whereas grooving wear involves the formation of concave wear partially at the edge of the tread where it contacts the brake shoe. Grooving wear is caused by a complex combination of various factors such as uneven hardness of the brake shoe.
3.2.2. Flange Vertical Wear
Flange wear occurs when (1) there are many curves or (2) the outer flange strongly contacts the rail on a curve due to high load bearing capacity on the side, high rotation resistance of the bogie, or high rigidity of the axle box support as well as during (3) wheel axle parallelism or diagonal dimension of the bogie is out of alignment.
4. RCF Crack Models
4.1. Crack Initiation
The response of materials in the railway wheel-rail contact zone can be divided to one of the four types as shown in Figure 7 [8]. A perfectly elastic response (a) is rare in the contact area, as it occurs only if the yield stress is not exceeded, and plastic deformation occurs even at fairly low contact loads. Exceeding the yield stress during the initial loading cycles introduces residual stresses, and the plastically deformed material undergoes work hardening. These two effects may combine to cause the material response to stabilize in an elastic state on continued cycles. This is called elastic shakedown (b). If the loading is more severe and the cyclic stress-strain curve becomes a stable closed loop with zero net plastic deformation, the material response is called plastic shakedown (c). When the material exhibits additional plastic deformation with each loading cycle, it is known as a ratcheting material response. The accumulation of deformation continues until the ductility of the material is exceeded and the material ruptures (d). RCF crack initiation criteria for elastic shakedown, plastic shakedown, and ratchetting material responses are explained below.
4.1.1. Elastic Shakedown
Dang Van proposed a multiaxial fatigue crack initiation criterion based on shear stress [9]. This criterion states that damage or crack initiation occurs when the combination of the shear stress amplitude τa(t) and the hydrostatic stress σh(t) satisfies one or both of the following inequalities during some portion of the stress cycle t1 < t < t2:
where τe is the fatigue limit of the material in pure shear and aDV is a material constant. In this case, the value of the left hand side is calculated using the critical plane approach. Ekberg et al. [10] and Kato et al. [11] employed the Dang Van criterion to evaluate the RCF crack initiation in railway wheel treads.
4.1.2. Plastic Shakedown
Jiang and Sehitoglu [12] defined the damage parameter as follows:
where, < > is MacCauley brackets, σmax is the maximum stress, Δε is the normal strain amplitude, Δτ is the shear stress amplitude, Δγ is the engineering shear strain amplitude, and J is a material constant. In this case, the plane with the maximum value of the damage parameter FPmax is the critical plane for crack initiation. The fatigue initiation life Nf is calculated on this plane as follows;
where E is the Young’s modulus. σ’f and ε’f are the axial fatigue strength and axial fatigue ductility coefficients and b and c are the fatigue strength and fatigue ductility exponents, respectively. Ringsberg [13] and Akama et al. [14] used this criterion to predict the initia-tion of head checks at the gauge corners of rails.
4.1.3. Ratcheting
Franklin and Kapoor [15,16,17] proposed a method for predicting the crack initiation life based on ratcheting and applied it to rails. The ferrite and pearlite grains are assumed to be hexagonal (the brick model), and it is assumed that the crack initiates when the total accumulated plastic shear strain γnij in the region reaches the critical shear strain γc. For each load cycle and grain (i, j) in row j and column i, the strain increment Δγij is calculated using the maximum value of the orthogonal shear stress τzxj(max) at each depth and the effective shear yield stress keffij for each grain.
where n is a number of load cycle and C is the ratcheting rate parameter to RCF and wear competition for the rails.
The effective shear yield stress increases as the plastic shear strain accumulates. The new value is calculated using a modified Voce equation:
where k0 is the initial shear yield stress and βs is the strain hardening ratio. Figure 8 shows how modelling indicates the distribution of failure leads to generation of wear debris and crack-like flaws. In this figure, the black squares are the bricks where γnij reaches γc.
Garnham et al. [18] analyzed the microstructure of used rail samples taken from the outer rail of a curved section and rail test pieces from a twin-disc tests via scanning elec-tron microscopy They concluded that the non-metallic inclusion MnS was flattened due to the accumulation of repeated stress, becoming the source of crack initiation. Akama and Kimata [19] considered crack initiation from such nonmetallic inclusions and applied this crack initiation criterion to RCF cracks in wheel treads.
4.2. Crack Growth
4.2.1. Short Crack
After crack initiation, “short fatigue crack” growth occurs that cannot be dealt with linear elastic fracture mechanics (LEFM) [20]. When the crack size becomes comparable to the scale of the characteristic microstructural dimensions (i.e., less than or equal to the grain size), obstacles such as grain boundaries, particle inclusions, or phase changes hinder further crack growth. These obstacles are called “barriers” that retard or even arrest crack growth. In such cases, the crack is called a “microstructurally short crack” (MSC). After overcoming these microstructural barriers, the crack may be long enough to grow based on continuum-mechanics mechanisms, whereby the crack length and applied stress or strain determine the crack growth rate. However, crack growth may occur within plastic regions, which invalidates the LEFM analyses and the growth rate is greater than that predicted via LEFM. Such a crack is known as a “physically small crack” (PSC). When addressing the initial stages of crack growth, it is essential to consider the characteristics of short-cracks.
- (a)
- MSC crack growth (Stage I)
Hoshide and Kusuura [21] and Hobson [22] proposed a crack growth equation for Stage I that described the crack growth within the first few ferrite grains, grain boundary ferrite, and ferrite within the lamellar structure of pearlite colonies. Such cracks are driven by the cyclic shear stress range on the slip planes in the ferrite grain, in the grain boundary ferrite, or on the planes parallel to the lamellae structure in the pearlite grain depending on the point of crack initiation. The crack growth rate is influenced by the distance between the crack tip and dominant microstructural barriers. The grain boundary strength makes it a major microstructural obstacle to crack growth, and the grain boundary is therefore assumed to act as a barrier. The crack growth rate in Stage I is described as follows:
where A and α are material constants, a is the crack length, N is the cycle, and Δτω is the cyclic shear stress range on the slip planes.
Distinguishing between the initiation and growth of a Stage I crack is extremely difficult; these may be considered continuous phenomena.
- (b)
- PSC crack growth (Stage II)
When a crack is long enough to allow the crack tip to open, PSC crack growth occurs (Stage II). In this stage, the influence of the crack microstructure is disregarded, and the crack growth is described via continuum mechanics as follows:
where Δεt is the total normal strain perpendicular to the crack faces and B, β, and D are the experimentally determined material constants. During transition from Stages I to II, the crack length is introduced in terms of the number of grains.
- (c)
- Coalescence
The sudden extension of crack length must be considered during the crack growth stage because cracks may coalesce. Crack coalescence is represented by assuming that cracks combine when the crack length reaches a critical value and the tip-to-tip distance between them is less than the critical distance [23]. After coalescence, the crack length is defined by the length of the straight line between both crack tips. When multiple cracks coalesce to form a large crack, the overall crack length is determined by the maximum distance between the crack tips.
- (d)
- Surface roughness
Wheel and rail surfaces have microscale roughness. Instead of a smooth Hertzian contact pressure distribution, the contact between the two surfaces occurs at asperity peaks. This makes the real contact area only a fraction of the apparent contact area; thus, the pressures at these contact points are correspondingly high. Kapoor et al. [24] per-formed a series of twin-disc tests, which showed that even when the load was below the shakedown limit, the surface roughness caused plastic deformation within a few microns. Franklin and Kapoor [16] approximated the rough contact by multiplying the orthogonal shear stress as follows:
where d is the affected depth, z is the distance of the depth direction and A is a magnification factor.
A(1- z) = d
Donzella et al. [25] and Akama and Kimata [19] used Seabra and Berthe’s [26] approach, in which surface roughness results in pressure peaks with amplitudes that depend mainly on the perturbation amplitude Amp and the wavelength λ. The pressure concentration factor is defined as the ratio of pressure peak Pmax to the nominal maximum contact pressure P0:
where b is the half-width of the contact area, Re is the equivalent radius of the contacting bodies, and C1, αp, βp, and γp are the parameters of roughness characteristics.
4.2.2. Long Crack
LEFM is strictly applicable when the crack tip plastic zone rp is less than 1/50 of the crack length a and the bulk stress is less than 1/3 of the yield stress σy, but in practice it is often applied even when rp/a = 1/20 or more. When the horizontal crack increases to 3 mm in length, rp/a corresponds to 1/20 [35]. Many studies on RCF cracks have been conducted using stress intensity factor (SIF), a typical parameter for LEFM. In this case, the KI for the opening mode (Mode I), KII for the in-plane shear mode (Mode II), and KIII for the out-of-plane shear mode (Mode III) at the crack tip were considered.
- (a)
- Role of the lubricant
Way [36] found that a lubricant is required to enable cracks to grow through regions of residual compressive stresses on the surface of materials. Several possible mechanisms have been proposed as follows:
1) Fluid lubrication mechanism
Cracks may grow in KII driven by cyclic shear stresses with the fluid acting as a lubricant between the faces. This mechanism relies on the assumption that if a crack is subjected to a cycle of shear stress, it will grow in its own plane, along the direction of the principal shear stress. The fluid lubricates the faces of the crack so that the KII at the crack tip increases. Keer and Bryant [37] and Bower [38] have used the dislocation distribution technique to calculate the SIFs in a two-dimensional (2D) crack. These calculations predicted similar cycles of variations in KII at the crack tip, indicating that the amplitude of these variations are sufficiently large to cause crack growth. Bogdański et al. [39] further studied mixed-mode SIFs generated during rolling–sliding contact such as that between a rail and wheel. They performed three-dimensional (3D) simulations to predict the full cycles of KI, KII, and KIII variations when the crack was subjected during the passage of a contact.
2) Hydraulic pressure mechanism
Fluid may be forced into the crack prizing the faces apart and driving the crack by transferring the stress by hydraulic action creating KI at the tip. The body force method developed by Kaneta and Murakami et al. is widely used for calculating SIFs for RCF cracks [40,41,42,43]. They considered that the fluid in the cracks transmitted contact pressure to the crack faces via hydraulic action. This pressure was assumed to decrease linearly from the contact pressure at the crack mouth to zero at the crack tip, representing the dynamic nature of fluid pressurization at the crack mouth and depressurization as the wheel passes over the crack. The sliding behavior of the crack faces was modified using the friction between them in regions where the crack was closed. In cases wherein the applied shear stress was insufficient to overcome this friction force, that region of the crack was assumed to be locked. This analytical model [43] is shown in Figure 9.
The elastic half-space contains a semi-elliptical surface-breaking crack of width 2a at the surface, and its length is denoted as d. The crack is inclined at an angle α to the surface of the semiinfinite solid, over which an elliptical Hertzian contact load with a surface traction moves along the x-direction. Figure 10 and Figure 11 show the variation of the dimensionless mode I SIF (FI) at the deepest point of the crack tip during a load cycle. These results are obtained by assuming that the crack faces are subjected to fluid pressure, indicated by the solid lines. The dotted lines are the results for the condition of no fluid pressure. In cases wherein the fluid pressure existed, FI was positive in a certain region of |e/cx| < 1. A positive value indicated that the crack tip was open, and the magnitude of the positive value of FI induced by the fluid pressure was larger for type A than for type B.
The main results obtained from the study are summarized below:
(i) When the surface traction is large and crack face friction is low, shear mode crack growth occurs at the deepest point of the crack tip, with the crack extending roughly along the original crack plane.
(ii) The directions of the surface traction, the movement of the contact pressure, and the crack inclination angle strongly control the oil seepage into the crack.
(iii) The tensile mode fatigue crack growth is induced by the oil hydraulic action due to oil entering the crack. In particular the transition from a pit to a crack is primarily caused by tensile mode growth.
(iv) The tensile mode crack growth induced by oil hydraulic pressure is likely to occur at the deepest point of the crack when the crack is shallow in comparison with the width of the mouth and the crack size a/c is large. However, as the depth of the crack increases the crack growth is most likely to occur at the tip of the mouth, which may result in an arrowhead-shaped crack.
(v) When the major axis of the contact ellipse is in the direction of motion of the load and the ratio of the major to the minor axis is large, the possibility of the tensile mode crack growth is low.
These analytical results are consistent with the typical experimental result observed by numerous researchers. These pressure and friction distributions were also applied in the work by Fletcher and Beynon [44,45] using Green’s function approach.
Kaneta et al. [46] performed a series of experiments to reproduce the dark spot defects (squats) using a newly developed two-disk rolling/sliding contact machine. They explained the cause of occurrence of these dark spot defects. Figure 12 shows a typical dark spot defect observed in their experiments, which was very similar to those observed in actual rails.
It is found that the dark spot defects are caused by frequent repetitions of dry and wet runnings, and that the traction force plays an important role for the occurrence of the cracks. The principal crack may occur from a tiny pit formed a posteriori on the contacting surface and after that, the second crack is formed by cracks branched from the extended principal crack. It has also been proved experimentally that water is capable of entering the tip of the crack. Furthermore, a possible mechanism for the dark spot cracking has been proposed on the basis of the LEFM approach.
3) Fluid entrapment mechanism
Under conditions of pure rolling, or if there is a driving traction applied to the surface, then the crack is pulled open by the capillary action. When the load moves a small distance further, this fluid may be trapped inside the crack. Once the fluid is trapped inside the crack, part of the crack will be prevented from closing by a fluid pressure. The fluid is assumed to be incompressible, so that the fluid pressure is determined by the condition that the volume of the crack must remain constant. As the load moves over the surface, the fluid is first forced towards the tip of the crack. Subsequently, the crack begins to re-open, until at a critical point the mouth of the crack re-opens. At this point, the fluid pressure required to keep the crack’s volume constant is greater than the contact pressure at its mouth, so it is assumed that fluid must be escaping from the crack. While the fluid is escaping, the fluid pressure acting on the crack is determined from the condition that it must be just sufficient to keep the crack open near the mouth, so that fluid can flow between its faces. It is also assumed that the faces of the crack can slip tangentially relative to each other while fluid flows between them. The study undertaken by Bower [38] is the most comprehensive examinations of the mechanisms, and Akama and Mori [47] also analyzed the cycles of KI and KII using boundary element (BE) method. Bogdański et al. [48] performed 3D cases using finite element (FE) method to predict the full cycles of KI, KII and KIII when the crack was subjected during the passage of a contact.
Fletcher et al. [49] conducted full-scale track tests to investigate the fluid penetration of surface breaking rolling contact fatigue cracks on a specially built test track. The tests showed that a water-based ultraviolet fluorescent marker fluid could penetrate cracks of various sizes under locomotive load and in the unloaded control sample. This evidence of crack penetration by fluid is consistent with crack growth mechanisms that depend on fluids inside the cracks. Use of a paint-based marker fluid did not reveal fluid penetration of the cracks, because the fluid simply did not penetrate as its physical properties were too different from those of water, or because it was degraded under the wheel pressure load and became visually undetectable.
(b) Crack growth laws
Horizontal crack growth laws were developed using loading conditions closer to those experienced in the rail, helping to take account of the ‘non-proportional’ changes of mode I and II loading which take place during the wheel passage. Bold et al. [50] developed crack growth laws for RCF cracks using biaxial fatigue specimens of normal-grade rail steel cut from the rail web. Following Eqs. (11) and (12) summarize the work, showing KI and KII ranges. ΔKeq is an equivalent SIF range, used to combine KI and KII, although the peaks in the SIFs for different modes of failure were out of phase with one another during the passage of the contact. ΔKth is the threshold SIF range.
The stress cycles applied during the development of this law were based on predictions by Bower [38] of the stresses to which inclined RCF cracks in rail are subjected.
Horizontal cracks were subjected to nonproportional mixed-mode loading with not only superimposed KI and KII cycles but also KIII cycles. Akama and Matsubara [51] organized KI, KII and KIII in the equivalent stress intensity factor range ΔKv proposed by Richard [52] and performed a growth analysis using the Paris law in the following equation:
The constants in the Paris law were obtained from a mixed-mode crack growth test with nonproportional KI/KII loading using a biaxial tensile-compressive fatigue test apparatus [53] and a mixed-mode crack growth test with nonproportional KI/KIII loading using a tensile-torsional fatigue test apparatus [54]. Then, the crack growth rates of rail steel were obtained for each loading.
(c) Crack branching
Once a horizontal crack has grown to a certain length, it may begin to branch at an angle of approximately 60° to the surface. Otsuka et al. [55] made the assumption that crack growth may occur by whichever mode first gave a resultant SIF exceeding the threshold for the material using the theories of maximum shear stress and maximum tangential stress criterion, Eqs. (14) and (15), developed by Erdogan and Sih [56]. The directions of growth are θσ and θτ for tensile and shear mode growth respectively. Kσ and Kτ denote the equivalent SIFs for both these modes, respectively.
Kaneta et al [40,41,42,43] applied these theories for RCF situations and showed that the value of θσ which corresponds to the maximum value of Kσ is given by one of the roots of the derivative of Kσ with respect to θσ, given by Eq. (16).
Similarly the value of θτ which gives the maximum value of Kτ was found using one of the roots of Eq. (17).
The values of Kσ and Kτ at verious instants throughout the passage of the wheel are used to calculate crack growth direction from Eqs (16) and (17) evaluated at each instant. As a result, a range of values for the resultant Kσ and Kτ as well as θσ and θτ were obtained.
Dubourg and Lamacq [57] predicted the crack growth path (direction and rate) based on Hourlier and Pineau’s criterion [58] under nonproportional loading. This criterion assumed that a crack follows the easiest path available, i.e., the path along the direction θ, that maximizes the growth rate at the tip of an infinitesimal segment of length s of the kinked crack da/dN(s, θ) (Figure 13).
To apply the aforementioned criterion, experimental crack growth rates under a characteristic RCF load sequence must be combined with the theoretical expressions of k1 and k2, which are the local SIFs at the tip of the infinitesimal segment s inclined at an angle θ of the original crack. The expression of k1 and k2 were expressed following Amestoy [59] as Eq. (18) using KI and KII, which are SIFs of the original crack tip.
where
and
Here, N1, N2 are principal stresses and θ is the angle of first principal direction to Ox, Kij(0) and Kij(1) are the coefficient files determined analytically and depending only on θ.
For example, the Eqs. (11) and (12) are expressed at the tip of s, ∆kl and ∆k2 replacing ∆KI and ∆KII are then expressed according to Eq.(18) and da/dN(s, θ) are computed.
(d) Branch crack growth
In case of rail, after the crack has branched, it may start to grow at about 60º to the surface. The transverse cracks may lead to rail breaks if they keep on growing. The crack growth in this phase is influenced by several factors.
- 1)
- Bending stress
Fatigue cracks in steel are generally observed to grow perpendicular to the maximum principal stress, in this case transverse to the rail longitudinal axis. The cyclic stresses contributing to the growth arise from each wheel passage. The cyclic bending stresses can be calculated for the rail head by considering the rail as a beam on an elastic foundation providing vertical, lateral and torsional restraint to deformation under the applied loads or assume that the rail is supported on a continuous elastic foundation, and are known as ‘Winkler’ models.
- 2)
- Contact stress
The Hertz theory assumes that the contacting surfaces are continuous and may be represented by second degree polynomials prior to elastic deformation. However, the predicted elliptical contact deviated from the actual measurements of the contact area between wheel and rails [60]. In practice, the contact zone is adequately represented as a rectangle. The relative lateral position between the wheel and rail and the large variations between the radii of curvature at each wheel and rail location lead to the distribution of contact areas for any rail location.
- 3)
- Thermal stress
Longitudinal expansion or contraction is restricted in long lengths of continuously welded rail, so longitudinal stress can develop when the temperature changes. Compressive longitudinal stress should be avoided to prevent rail buckling in hot weather. However, excessive tensile stress should also be avoided, as this can cause small cracks to become rail breaks. When continuously welded rails are subjected to a temperature rise ΔT from its equilibrium temperature T0, the longitudinal thermal stress is nominally given by
where E is a Young modulus and αT is a coefficient of thermal expansion of rail steel, respectively.
- 4)
- Residual stress
Residual stresses are introduced into rails during manufacturing, particularly during roller straightening. The residual longitudinal stress distribution in standard carbon rails without subsequent heat treatments comprises tensile stresses in the head and foot and compressive stresses in the web. Regardless of their initial form, the residual stresses are modified under the action of high contact stresses during traffic passages . Within the contact zone on the rail head, the longitudinal stresses transform into compressive stresses at a rate dependent on the magnitude of axle loads and reach their final values. The cracks developed in this region are subjected to both KI and KII. However, the role of KII decreases after the cracks have branched. The fractured surfaces of the broken rails showed no evidence of shear mode. Striation patterns were present due to crack tip blunting and subsequent resharpening, which indicates that the cracks were growing in KI.
Kashiwaya and Ishida [61] modeled such a transverse crack as a circular crack inclined at 60° to the top surface of the rail and subjected to pure KI loading. In their model, it was assumed that the transverse crack growth occurred only by tensile stresses and the crack shape remained circular. Then, crack growth was calculated by considering stresses generated by train passage, residual stresses, and thermal stresses. The crack growth rates were obtained using compact tension specimens of 20-mm thickness to ensure plane strain conditions under KI. The fatigue crack growth rate was strongly related to the range of SIFs, and the crack growth rate can be adequately characterized by Paris law:
where C and m are the material constants. Based on the results of tension–compression tests performed on a standard test specimen made of JIS 60 kg rail, the values of these constants were obtained as follows.
C = l.0 × 10-11, m = 3
The growth rate of a transverse crack was mainly controlled by the thermal stress and increased rapidly in winter due to large tensile thermal stresses.
Fletcher et al. [62] investigated the interaction between adjacent transverse cracks (tens of millimeters) that are just getting started with their final stage. They performed the modeling using the FRANC3D BE software. Figure 13 shows the overview of the rail model and typical mesh. For the majority of runs with multiple cracks, a crack separation of 5 mm was used. This distance was representative of the crack separation observed on rails in curves. The cracks inclined at 30° below the rail surface were modeled to reasonably represent shallow RCF cracks reaching the end of contact stress–driven growth (curve C) and moving into bending stress–driven growth (curve D) in Figure 1. For 10-mm radius cracks with 5-mm separations, KI and KII were reduced to between 40% and 55 % of the value predicted for a single crack. Using the crack growth law developed for mixed-mode loading of rail steel, this reduction in SIFs translated to a reduction in the crack growth rate to ~27% of its value for single-crack models.
Figure 14.
Boundary element model [62].
Figure 14.
Boundary element model [62].
Mair and Groenhout [63] proposed a method to simulate the growth of transverse fatigue cracks in the rail head. The periphery of many cracks in the rail head was adequately represented as an ellipse, and an approximate solution was obtained. The SIF for an elliptical crack under an arbitrary normal loading was determined using Shah and Kobayashi’s method [64], provided the internal pressure could be expressed in terms of a polynomial in the local axis system (m, n).
where
The corresponding KI as a function of parametric angle of the defect ellipse θ can be derived as follows:
where G is the shear modulus, ac is the semimajor axis of elliptic crack, bc is the semiminor axis of elliptic crack, and Cij is the functions of Aij and the elliptic functions.
The SIF range is not the only parameter that affects the crack growth rate. Therefore, Eq. (20) was modified considering the stress ratio R, the threshold SIF range ΔKth, and the maximum KI value KImax during each load cycle. With increasing KI range, usually toward the end of component’s life, the crack growth rate increased considerably. In rails, such growth rate acceleration occurs at crack sizes around 20% of the rail head area; before this stage, the defects must be removed. Crack development at low growth rates exhibited a stronger dependence on KImax rather than ΔKI, resulting in a greater influence of stress ratio R. Consequently, Eq. (20) was modified for rail steels as follows:
where ΔKth is the threshold SIF range at R = 0, B and mc are the material constants, and KIc is the plane strain fracture toughness. Typical values of B and mc are 0.53 × 10⁻¹⁰ m/cycle and 2.13, respectively. Figure 15 is an illustration of the results of the growth rate calculation procedure that considers a 3 mm × 2 mm defect located 15 mm toward the gauge corner and 9 mm below the rail crown of an Australian Standard AS 1,085 53-kg/m rail section. The applied wheel load was 100 kN with an outward-acting lateral load of 20 kN. The thermal load equivalent was 25°C below the stress-free temperature.
5. Wear Models
Crack growth competes with wear during the initiation and early growth stages of cracks. Various types of wear occur depending on contact loading, materials, and environmental conditions. The subsequent sections describe the common wear mechanisms that occur in metal contacts.
5.1. Wear Mechanisms
5.1.1. Adhesive Wear
When a metal–metal junction forms between intimately contacting surfaces is sheared by frictional motion, a small fragment known as “transfer element” is sheared from one surface and adheres onto the mating surface. This transfer element creates a new asperity on the mating surface and may form a new junction during further sliding. When the next shearing occurs, a “transfer particle” is formed due to the accumulation of transfer elements. As process repeats, the transfer particle gradually grows to a considerable size and large particles are removed from the metal surface as wear particles. Holm [65] and Archard [66] determined the amount of wear V as follows:
where P is the load, L is the sliding distance, and H is the hardness. The constant k is known as the wear coefficient. This constant is interpreted as the probability that a true contact point will form wear particles with a certain volume when it repeatedly contacts the mating surface.
5.1.2. Abrasive Wear
Abrasive wear occurs when a surface is worn by the action of hard asperities on the counterface (two-body abrasive wear) or by hard particles trapped between the contacting surfaces (three-body abrasive wear). These third-body particles contain fragments of worn surface that has oxidized or hard contaminants such as silica or quartz. The wear mechanism involves hard particles plowing through the soft surface, which causes the debris to detach. When a conical asperity with a half-apex angle θ is pressed with a load P and slid by distance L, the amount of wear is given by
5.1.3. Fatigue Wear
Fatigue wear arises from cycling loading under friction. Repeated, alternating stresses lead to the formation and growth of subsurface cracks that cause surface degradation. Crack initiation begins in the region wherein strains or stresses reaches the critical values. The crack initiated at this weak point grows along the direction of weak planes, thereby generating a primary crack. This primary crack matures into secondary cracks owing to stresses induced by the sliding contact at the interface. These secondary cracks formed on the material subsurface grow along the weaker plane toward the surface and form wear particles.
5.1.4. Corrosive Wear
Corrosive wear occurs in corrosive environments. The removal and repair of oxide films on the metal surface affects the wear rate. Such type of wear commonly occurs in water and air environments. It can also occur in oil because it contains water and oxygen. The removal of oxide film usually accelerates wear, but corrosion products can also have a lubricating effect.
5.1.5. Delamination Wear
When a surface undergoes plastic deformation under repeated cyclic loading, thin sheets of wear debris are detached from the surface. Suh [67] proposed a theory based on the behavior of dislocations at the surface, subsurface crack and void formation, and subsequent joining of cracks by shear deformation of the surface. According to this theory, the wear particles are likely to appear as thin, flake-like sheets, and the surface layer can undergo significant plastic deformation. Kapoor et al. [68] proposed that slivers are produced by ratchetting of the surface layers and reaching a critical plastic strain; such wear is therefore called “ratchetting wear.”
5.2. Wear Regimes
The test for studying wear is often carried out on twin-disc machines. In this test, two discs made of wheel and rail material are loaded together and rotated at varying speeds to give the required slip. Twin-disc tests have carried out to study the wear behavior of railway wheel and rail steels and identified wear regimes. Early tests [69,70,71] revealed the existence of two wear regimes: severe and mild. In severe wear, relatively large (1–100 μm) metallic wear particles are formed that cause metallic surfaces to wear. The specific wear rate is within 10−7–10−5 mm2/N in ambient air conditions. In mild wear, fine (10–100 nm) wear oxide-containing particles are generated with a specific wear rate of <10−8 mm2/N.
Olofsson and Telliskivi [72] investigated the development of the damage mechanisms of wear and plastic deformation on new and 3-year-old rails in a commuter track over two years. They concluded that different wear mechanisms affected different parts of the rail. Mild wear was the dominant wear mechanism at the rail head, whereas severe wear was the dominant mechanism at the rail edge.
However, an additional wear regime, known as the catastrophic wear regime, was identified in subsequent studies [73,74,75]. Based on the ASTM standard G40, catastrophic wear occurs rapidly and causes significant surface damage or deterioration. This wear changes the shape of the component to an extent, such that its service life is considerably reduced or its function is destroyed. Figure 16 shows the results obtained by testing the wear mechanism under various contact conditions. As the contact severity increases, transitions occur between different wear regimes, the relationship between Tγ/A and wear rate breaks down, and various wear regimes emerge: mild, severe, and catastrophic; herein, T is the tractive force, γ is the slip, and A is the contact area [75]. Wheel tread and railhead wear are generally categorized as a mild wear regime, whereas wheel flange and rail gauge corner wear are considered a severe or catastrophic regime. The first transition from mild to severe wear is associated with the onset of full sliding contact and the second to catastrophic wear is caused by surface temperature.
5.3. Wear Coefficient Maps
While the Tγ/A method is used for plotting wear rate data, it can easily identify wear regime transitions. It can also be used to compare different material combinations; however, it does not facilitate to fully understand the effects of different parameters such as contact pressure and slip on the wear rate. Therefore, a mapping method was developed for plotting wear data. Wear coefficients were calculated from the rail steel wear data using Archard’s equation as follows [66]:
where V is the wear volume, N is the normal load, S is the sliding distance, and H is the material hardness. Wear coefficients were then plotted against contact pressure and sliding speed in the contact. Two types of plots were developed: contour maps and 3D point graphs. Figure 17 shows the data obtained from twin-disc testing using BS11 rail material versus Class D tire material [76].
5.4. Wear Prediction
Pombo et al. [77] developed a computational tool that predicted the wear growth of wheels in realistic service conditions. It used a commercial multibody software to study the dynamic problem and a code for managing its input and output data in order to compute thewear evolution. In the wear prediction tool, three alternative wear functions were implemented, devepoled by British Rail Research (BRR), which was the wear index Tγ, by the Royal Institute of Technology (KTH), which was based on Archard’s wear law and by the University of Sheffield (USFD), which related the wear rate to the wear index. The comparison of results obtained with BRR, KTH and USFD functions revealed a good agreement in wear prediction.
Jin et al. [78] conducted experimental research on wheel and rail wear using a large rolling–sliding contact test machine with actual profiles of wheel and rail specimens. They evaluated the effects of axle load, angle of attack, rail hardness, and lubrication on the wear behavior of the wheel flange and rail gauge corner. Based on these results, they calculated the Archard wear coefficients for Japanese railway tracks under various conditions. A wear prediction model of the rail profile was developed by considering contact stress, slip ratio at contact patch, and material hardness based on the experimental results and the wheel–rail contact analyses. The prediction results were compared with the measured values of an actual rail and the effectiveness of wear prediction methodology was verified for application in actual railway systems.
5.5. Corrugation
Li et al. [79] developed a 3D FE dynamic frictional rolling contact model to study of short pitch corrugation. This model considers the direct and instantaneous coupling between the contact mechanics and the structural dynamics in a vehicle-track system. The schematic diagram of the FE vehicle-track model is shown in Figure 18. In this study, the authers examined the system responses in terms of vibration modes, contact forces and the resulting wear using smooth rail and corrugated rail with progressively increasing amplitude to infer the conditions for consistent corrugation initiation and growth. They assumed wear to be the damage mechanism modelled short pitch corrugation using wavelengths from field observations of a Dutch railway. The wear of an element is as follows:
where k is the wear coefficient, Wf(x, y) is the frictional work, τi(x, y) and vi(x, y)are the local tangential stress and slip, respectively, and N is the number of time steps Δt during which the element passes through the contact patch.
The main insights are as follows:
(1) The longitudinal vibration modes were probably dominant in initiating short pitch corrugation;
(2) During the evolution of short pitch corrugation, the interaction and consistency between the longitudinal and vertical modes determined its development. Once a certain severity was reached, the vertical modes became dominant.
Li et al. [80] proposed a new hypothesis for the formation process of short pitch rail corrugation using a 3D FE model [79] with fastening models. It was found that longitudinal compression modes were responsible for corrugation initiation with necessary initial excitation that allows flexibility for longitudinal vibration. Consistency between longitudinal compression and vertical bending eigenfrequencies of the wheel-track system was required for consistent corrugation growth, which also determines maximum corrugation amplitude. Corrugation initiated by frequency selection instead of wavelength fixing. The proposed mechanism could explain field observations, including the wavelength and periodicity of corrugation in the Netherlands. It could also explain why corrugation formed on continuously supported tracks, despite the absence of pinned-pinned resonance. Furthermore, it could explain the small variation between the corrugation wavelength and train speed.
Zhang and Li [81] investigated the development mechanism of short pitch corrugation based on extensive field observations of 105 corrugations over a five-year period. Comprehensive field data were obtained during the eleven observations, including photos of the corrugations, their geometry, and the dynamic behaviors of the tracks and vehicles. The numerical predictions of the corrugation development process in [79,80] were validated by the field observations and measurements. One of the results is shown in Figure 19. Figure 19(b) and (c) show that both the longitudinal and vertical frequency response functions (FRFs) exhibit a predominant resonance peak around 1000 Hz, which supports the numerical prediction that consistency between the vertical and longitudinal modes determines corrugation growth. Furthermore, when compared to the FRFs of tracks without corrugation, the vertical resonance peak at 1000 Hz, which corresponds to the vertical pinned–pinned resonance mode, occurred at both the corrugated and non-corrugated tracks. However, the longitudinal mode at 1000 Hz only appeared in tracks with corrugation. This indicates that the longitudinal vibration mode is decisive in corrugation formation.
6. Competition Between RCF and Wear
The competition between RCF and wear in wheel/rail systems has been extensively studied. For instance, some studies evaluated crack growth using the Hobson rule or Paris law as well as wear using the Archard model, while others evaluated both crack growth and wear using the wear number Tγ.
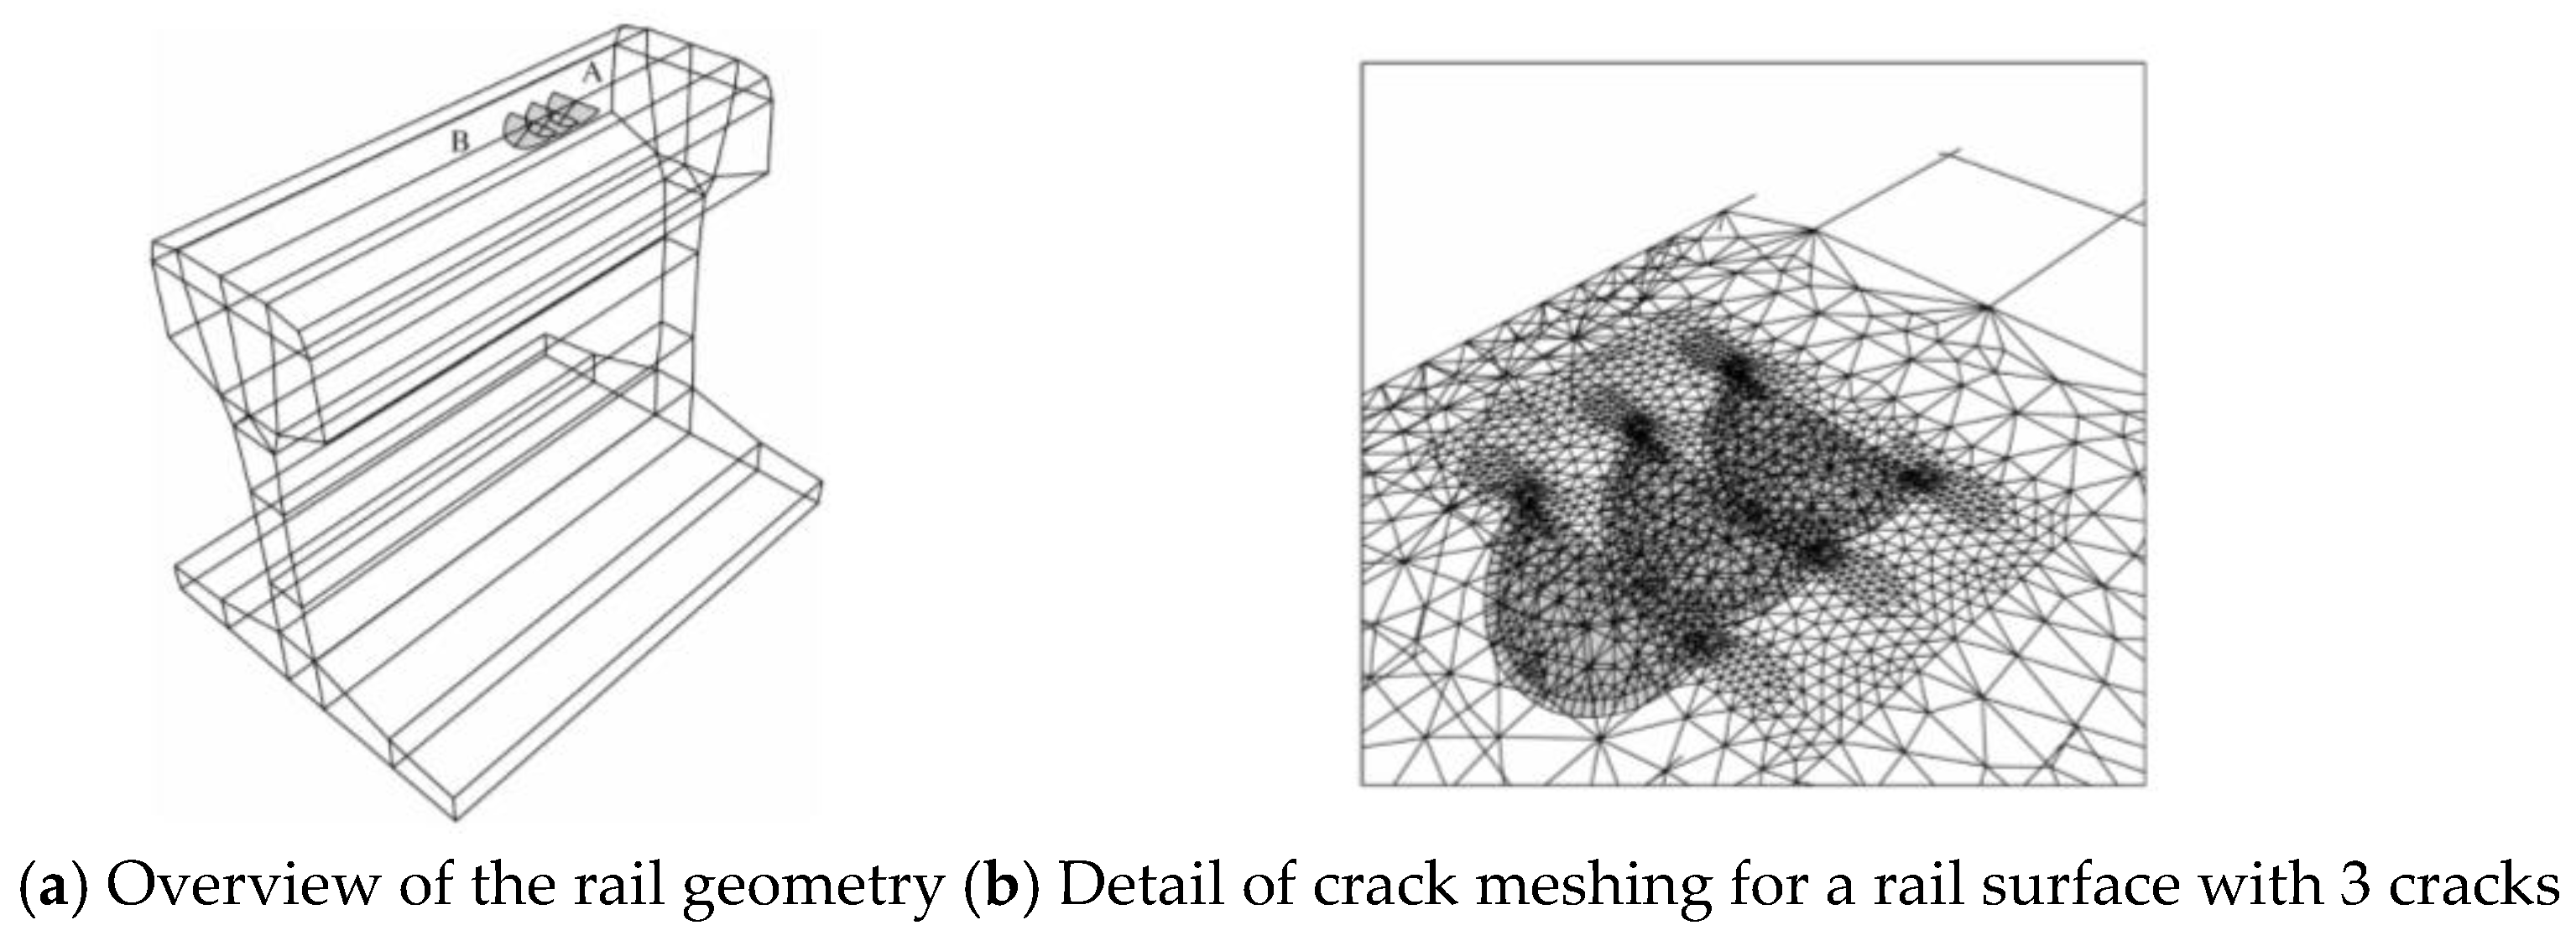
A pioneering research on the competition between RCF crack growth and wear in a wheel/rail system was conducted by Franklin et al. [15,16,17], who developed a “brick model” based on incremental plasticity by ratcheting. In this model, the rail cross section is divided into various sections (or bricks). If the bricks reach their critical shear strain, they are considered to have failed and are marked as weak. Franklin et al. designed many patterns of weak and nonfailed healthy bricks as scenarios to represent failure mechanisms. These patterns helped to identify the scenarios in which bricks were removed from the rail surface as wear debris or remain within the rail as crack-like defects. Figure 20 shows a simple hexagonal representation of a standard grade rail microstructure, in which pearlite regions enclosed by proeutectoid ferrite at prior-austenite grain boundaries are treated as a single-phase material. (a) 63 μm/1 μm microstructure orientated at 10°. (b) Close-up of the 60 μm/4 μm microstructure with 1 μm × 1 μm elements.
Figure 21 shows the results of a simulation at 1800MPa after 10,000 cycles. Figure 21(a) and (b) shows the results of simulations without and with shielding, respectively. Without shielding, greater scatter of failed elements can be observed in the proeutectoid ferrite and the relatively hard pearlite. This scatter reflects the variation in their material properties, which were sampled from a normal (Gaussian) distribution.
Burstow [82,83,84] developed a “whole life rail model” that considered the competition between RCF crack growth and wear in a rail. This model used a “damage function” that described the relationship between Tγ and the RCF crack initiation fatigue damage. The damage function comprised four regions: (i) a threshold below which RCF damage does not occur, (ii) a region where RCF damage increases linearly, (iii) a region where high wear suppresses crack growth, and (iv) a region where damaged material is entirely removed by wear.
Mazzù [85,86,87] proposed an integrated model that considers multiple interacting damage mechanisms in railway wheels. The procedure was based on models developed for wear, cyclic plasticity, and surface and subsurface fatigue cracks. These models were incorporated into an algorithm that exchanged input and output data between each failure model. Wear was assessed using the Archard model of adhesive wear. Cracks were evaluated using SIFs, threshold SIFs, and a Paris-type law.
Karttunen et al. [88,89] provided an engineering “meta-model” to predict gauge corner and flange root degradation concerning RCF and wear from measured rail, wheel, and track geometries. The impact of RCF is quantified using a dimensionless “fatigue index” (FI) [90] based on shakedown. Deterioration due to wear is quantified using Tγ.
Dirks and Enblom [91] introduced a model that could predict the wear and RCF of rails and wheels. Two existing RCF prediction models, namely the FI model and damage function model, were analyzed and compared in a parametric study. Wear was predicted using the Archard model.
Bevan et al. [92] developed a damage model to predict the deterioration rate of a wheel tread in terms of wear and RCF damage. This model used a description of a fleet’s route diagram to characterize the duty cycle of the vehicle. Many vehicle dynamics simulations were conducted using this duty cycle and a combination of the Archard and Tγ damage models to calculate the wheel and rail contact forces. As a result, the formation of wear and RCF damage were predicted. Figure 22 shows the observed and predicted crack lengths on the motor and trailer axles of typical DMU and EMU vehicles.
Brouzoulis [93] presented a 2D FE model to simulate the growth of a single RCF crack in a rail. This model accounted for wear and allowed crack curving. The Archard wear model was used along with a Paris-type crack growth law to predict the amount of wear. The crack driving force was derived based on the concept of material forces.
Jun et al. [94] calculated the minimum crack size required for a crack to grow in a rail and defined it as the smallest crack that grows rapidly enough to avoid being removed by wear and periodic grinding. The Archard wear model and the “2.5D” fatigue crack growth model developed by Fletcher and Kapoor [95] were used for calculations.
Trummer et al. [96] developed a predictive model for RCF crack initiation at the surface of rails and wheels and referred to it as the “wedge model.” In this model, both surface RCF crack initiation and delamination wear were deemed to be governed by the growth of microscopic cracks in a severely shear-deformed layer near the rail surface.
Hiensch and Steenbergen [97] extended the concept of a “damage function” from a conventional rail to a premium pearlite rail by simulating the dynamic train–track interaction and using field observations. They derived the RCF damage index for the rails to describe the behaviour of the associated “damage function.”
Akama and Kimata [19] developed a numerical simulation model to study the competition between RCF-initiated short crack growth and wear in a wheel tread. The simulation model assumed that the wheel materials were polycrystalline ferrite and pearlite and that RCF crack initiation was dependent on whether the total accumulated plastic shear strain reaching the critical value. In the early crack growth simulations, the two-stage short crack growth model proposed by Hobson was used. Regarding wear, the Archard model was adopted. One of the results is shown in Figure 23.
Hu et al. [98] investigated the wear and RCF in wheel–rail materials by varying the wheel/rail hardness ratios (Hw/Hr) and creepages. The results indicated that with the Hw/Hr increasing from 0.927 to 1.218, the wheel wear rate decreased significantly, while the rail wear rate increased. When Hw/Hr = 1.218, the rail wear rate increased. Both the wheel and rail wear rates increased as the creepage enlarged. In addition, the fatigue damage of ER7 and CL60 wheel materials was dominated by slender multilayer cracks, whereas the fatigue cracks were short and contained abundant interlayer broken materials on the C-class wheel steel.
Zhang et al. [99] studied the wear and fatigue competition mechanism of a bainitic rail steel via RCF testing. Results showed that the damage process could be divided into initial (before 2.0 × 10⁵ cycles), middle (around 2.0 × 10⁵ cycles), and late (after 2.0 × 10⁵ cycles) stages, with wear, wear and fatigue, and fatigue as the dominant mechanisms in each stage, respectively.
Zani and Petrogalli [100] conducted experiments with a twin-disc machine to study the relationship between RCF and wear. First, they plotted the collected test data on shakedown maps to assess the cyclic response and calculate FI for predicting surface-initiated fatigue damage. They then correlated the FI and cyclic yield strength of the material with the experimental wear rate. They also developed maps to predict changes in wear rate and cyclic response under varying contact conditions, slip ratio, and extraction position of specimens. The estimated wear rate was superimposed onto the shakedown map to investigate a possible relationship between RCF and wear.
Wang et al. [101] explored the competition mechanism between wear and RCF in hypoeutectoid, eutectoid rail, and bainitic rail steels under different slip ratios. As the slip ratio increased, the wear rates of hypoeutectoid and eutectoid rail steels first increased and stabilized, whereas that of bainitic rail steels increased. Bainitic rail steels suffered catastrophic wear when the slip ratio exceeded 2%. The RCF crack growth rate of hypoeutectoid and eutectoid rail steels first increased rapidly and then slowly. The competitive relationship between wear and RCF was reflected by the variation in the rail wear form.
Luo et al. [102] investigated the competitive relationship between wear and RCF in heavy-haul railway freight wheel steels. Wear and RCF tests were performed under dry friction and oil lubrication conditions on wheel steels with three different hardness levels: A# (329 HB), B# (341 HB), and C# (355 HB). Results indicated that wear-induced failure was the dominant mechanism in wear test, whereas RCF-related failure was the dominant mechanism in the RCF tests. A combined model comprising the Archard wear model and RCF model, as well as a competition coefficient TC were proposed to describe the competition between wear and RCF. Figure 24 schematizes the competition between wear and RCF in these tests. Figure 24(a) shows that in severely dry conditions, intense wear rapidly removes the initiated RCF cracks. Figure 24(b) shows that due to oil lubrication, the wear is restrained and the RCF cracks can grow further.
Tao et al. [103] conducted an on-site investigation on a metro line in China to observe the wheel tread condition and measure the wear patterns of rails and wheels. Based on the observation and measurement results collected from 23 trains, the relationship between the wheel wear and RCF was analyzed. Results revealed that about 42% of wheels on this line experienced RCF in the central area of the wheel tread. Moreover, wheels with RCF generally showed groove wear, indicating wear is the main cause of RCF in the central area of the wheel tread on this line.
7. Discussion
In this section, current gaps or problems in the studies on RCF and wear of rails and wheels are identified, and recommendations for future work will be provided.
7.1. Details of Crack Initiation and MSC Growth
To obtain an accurate lifespan for RCF crack initiation, it is necessary to consider physical processes such as slip band formation and dislocation movement. Regarding short crack growth, most studies do not consider stage I growth, in which the microstructure affects crack growth. Crack growth and wear mainly compete with each other in the stages of crack initiation and early growth, as shown by curves A and B in Figure 1. Therefore, the details of crack initiation and MSC growth must be considered. Urashima and Nishida [104] studied the fatigue crack initiation and growth behavior of rail steels using SEM observations. They observed that slip occurred parallel to the lamella of the pearlite colony and that fatigue cracks were initiated in the very early stage of fatigue. They also observed that cracks grew preferentially along the lamella and deflected slightly when they reached the boundary of the pearlite block. Such observations should be performed extensively and incorporated into the MSC model.
7.2. 3D Analysis of Short Cracks
Cracks and microstructure are usually studied by taking cross-sections, and the real 3D nature is inferred or approximated from the 2D view. To properly model the early stages of crack growth, it is necessary to consider the whole crack in 3D. Bomidi et al. [105,106] developed a 3D FE model to study subsurface-initiated spalling observed in bearings. The microstructure topology was represented by randomly generated Voronoi tessellations. The elastic–plastic model coupled with continuum damage mechanics was used to predict both ratcheting behavior and fatigue damage in heavily loaded contacts. Franklin et al. [107] used a 3D model of microstructure for rail steel based on convex polyhedra, generated using the Voronoi method, to model the early stages of crack growth. This was, however, the first step in representing 3D structures, and a model for 3D short crack growth has yet to be developed.
7.3. Modelling for Fatigue Wear
Chawanat and Akama [29] performed twin-disc tests that combined wheel and rail discs. The wheel disc was the high-speed side, and included WEL. As a result, the initial wear amount of the rail disc was greater when the slip ratio (Sr) was 9% than when the Sr was 1%. However, when Sr was 1%, the rail disc’s wear amount increased rapidly in the subsequent cycle and became greater than when Sr was 9%. This is due to fatigue wear, wherein the wear caused by adhesive wear on the rail disc was minimal, leading to the accumulation of fatigue. This results in crack initiation, growth, and branching, ultimately causing delamination. Fatigue wear modeling of rails and wheels has hardly been done. Wang and Kato [108] proposed a model to predict fatigue wear lifespan using a simplified theoretical expression that combines the Manson-Coffin equation and the analytical solution of an elastic-perfectly plastic model. Although it is a different field of research, this may be considered a clue.
7.4. Complex Shape of Horizontal Crack Growth
Deng et al. [109] performed a five-year continual field monitoring study on squats induced by corrugations. A small black depression formed at the corrugation under wheel-rail dynamic forces, and then a primary crack typically initiated on the gauge side edge of the depression. The crack then grew in a U-shape on the rail surface toward the gauge side in both the traffic and opposite-traffic directions, as well as into the rail toward the field side at an angle of approximately 20°. Initially, the black squat depression was elliptical in shape; then, its edge followed the U-shaped cracking path as it grew. The squats turned into a kidney-like shape, typically with a U-shaped crack. As the squats grew further, a ridge formed in the middle part of the depression, and an I-shaped crack appeared at this ridge due to the impact of the wheels. This process eventually led to two lung-shaped mature squats, typically with a Y-shaped crack. Previous numerical studies have assumed that the shape of the growing horizontal crack remains semi-elliptical, even in 3D analyses. However, the growth shape is complex, as mentioned above, so numerical analysis must take this into account.
7.5. Effects of Rolling Reversal of Wheel
Trains often operate as a shuttle service. When a train arrives at the terminal station, its direction of travel is reversed, and therefore so is the rolling direction of the wheels. It is important to investigate how the crack growth and wear on the wheel tread are changed by reversing the rolling direction. Tyfour and Beynon [110] performed the unlubricated twin-disc tests using the wheel and rail steel and indicated that direction reversals can decrease the wear rate. The largest decrease in rail wear rate occurred with frequent reversals. They also investigated the influences of reversing direction on RCF initiation and growth of rail discs with water lubrication [111]. They noted that reversing the direction of rolling increased RCF life. Akama and Takahashi [112] conducted a series of wear and fatigue tests using a twin-disc machine and FE simulation of the tests to elucidate how reversing the rolling direction of the wheel affects the wear and RCF cracks on the wheel tread. In wet conditions, the wear rate increased when the rolling direction of the wheel disc was reversed in some cases. In contrast, in the dry conditions, the wear rate was much higher than in the wet conditions; however, it changed little before and after the reversal. The Archard model could not explain the increase in wear rate after the reversal in wet conditions because the model does not take into account the delamination wear induced by the fluid. Further research is needed on this issue.
8. Conclusions
A comprehensive literature review on RCF and wear of rails and wheels was presented herein. First, RCF and wear in actual rails and wheels were discussed. Then, theory and models for RCF cracks were presented—from crack initiation, followed by short crack and horizontal crack growth to crack branching and transverse crack growth. Then, different wear forms, wear regimes (mild, severe, and catastrophic), and their theories and models were introduced. Several papers dealing with the competition between RCF and wear were discussed. Finally, current gaps or problems of the studies on RCF and wear of rails and wheels were identi-fied and provided recommendations for future work.
In future, this review is expected to assist researchers seeking to investigate and address the problems associated with RCF and wear of rails and wheels.
References
- Bevan, A.; Iwnicki, S. Review of wheel turning data and identification of other wheel damage modes, T792 project report, RSSB, 2010.
- Kapoor, A.; Fletcher, D.I.; Franklin, F.J. The role of wear in enhancing rail life. Tribol. Series 2003, 41, 331–340. [Google Scholar]
- Magel, E.; Mutton, P.; Ekberg, A.; Kapoor, A. Rolling contact fatigue. wear and broken rail derailments. Wear 2016, 366–367, 249–257. [Google Scholar] [CrossRef]
- Kanematsu, Y. A study on grinding control method considering surface decarburization and rolling contact fatigue of railway rails. PhD thesis, Tokyo University of Science 2023.
- Railway wheelset, Edited by Research Committee for wheelset of high-speed vehicle, Maruzen planet, 2011. (in Japanese).
- Wheel-rail interface handbook, Edited by R. Lewis and U. Olofsson, Woodhead publishing Limited, 2009.
- Matsumoto, A. Prevention of rail corrugation on curve and improvement of bogie curving performance, PhD thesis, The University of Tokyo, 2017.
- Kapoor, A. A re-evaluation of the life to rupture of ductile metals by cyclic plastic strain. Fat. Fract. Eng. Mater. Struct. 1994, 17, 201–219. [Google Scholar] [CrossRef]
- Van, K.D.; Cailletaud, G.; Flavenot, J.F.; Douaron, A.L. Criterion for high cycle fatigue failure under multiaxial loading in biaxial and multiaxial fatigue, 1989, 459–478. Mechanical Engineering Publications, London.
- Ekberg, A.; Bjarnehed, H.; Lundbéan, R. A fatigue life model for general rolling contact with application to wheel/rail damage. Fat. Fract. Engng. Mater. Struct. 1995, 18, 1189–1199. [Google Scholar] [CrossRef]
- Kato, T.; Sugeta, A.; Nakayama, E. Investigation of influence of white layer geometry on spalling property in railway wheel steel. Wear 2011, 18, 400–407. [Google Scholar] [CrossRef]
- Jiang, Y.; Sehitoglu, H. Modeling of cyclic ratchetting plasticity, part I: Development of constitutive relations. Trans. ASME, J. Appi. Mech. 1996, 63, 720–725. [Google Scholar] [CrossRef]
- Ringsberg, J.W. Life prediction of rolling contact fatigue crack initiation. I. J. Fat. 2001, 23, 575–586. [Google Scholar] [CrossRef]
- Akama, M.; Matsuda, H.; Doi, H.; Tsujie, M. Fatigue crack initiation life prediction of rails using theory of critical distance and critical plane approach. J. Comput. Sci. Tech. 2012, 6, 54–69. [Google Scholar] [CrossRef]
- Franklin, F.J.; Widiyarta, I.; Kapoor, A. Computer simulation of wear and rolling contact fatigue. Wear 2001, 251, 949–955. [Google Scholar] [CrossRef]
- Franklin, F.J.; Kapoor, A. Modelling wear and crack initiation in rails. Proc. Instn. Mech. Engrs., Part F, J. Rail Rapid Transit 2007, 221, 23–33. [Google Scholar] [CrossRef]
- Franklin, F.J.; Garnham, J.E.; Fletcher, D.I.; Davis, C.L.; Kapoor, A. Modelling rail steel microstructure and its effect on crack initiation. Wear 2008, 265, 1332–1341. [Google Scholar] [CrossRef]
- Garnham, J.E.; Ding, R.-G.; Davis, C.L. Ductile inclusions in rail, subject to compressive rolling-sliding contact. Wear 2010, 269, 733–746. [Google Scholar] [CrossRef]
- Akama, M.; Kimata, T. Numerical simulation model for the competition between short crack propagation and wear in the wheel tread. Wear 2020, 448–449, 203205. [Google Scholar] [CrossRef]
- Suresh, S. Fatigue of Materials, 2nd ed.; Cambridge University Press: Cambridge, 1998. [Google Scholar]
- Hoshide, T.; Kusuura, K. Life prediction by simulation of crack growth in notched components with different microstructures and under multiaxial fatigue. Fat. Fract. Engng. Mater. Struct. 1998, 21, 201–213. [Google Scholar] [CrossRef]
- Hobson, P. D. The growth of short fatigue cracks in a medium carbon steel. PhD thesis, University of Sheffield, 1985.
- Socie, D.; Furman, S. Fatigue damage simulation models for multiaxial loading, Fatigue 96, 6th International Fatigue Congress, G. Lutjering and H.Nowack, Eds., Berlin, Germany, 1996, 967–976.
- Kapoor, A.; Franklin, F. J.; Wong, S. K.; Ishida, M. Surface roughness and plastic flow in rail wheel contact. Wear 2002, 253, 257–264. [Google Scholar] [CrossRef]
- Donzella, G.; Faccoli, M.; Ghidini, A.; Mazzu, A.; Roberti, R. The competitive role of wear and RCF in a rail steel. Eng. Fract. Mech. 2005, 72, 287–308. [Google Scholar] [CrossRef]
- Seabra, J.; Berthe, D. Influence of surface waviness and roughness on the normal pressure distribution in the Hertzian contact. Trans. ASME, J. Tribol. 1987, 109, 462–469. [Google Scholar] [CrossRef]
- Ringsberg, J. W.; Bergkvist, A. On propagation of short rolling contact fatigue cracks. Fat. Fract. Engng. Mater. Struct. 2003, 26, 969–983. [Google Scholar] [CrossRef]
- Canadinc, D.; Sehitoglu, H.; Verzal, K. Analysis of surface crack growth under rolling contact fatigue. I. J. Fat. 2008, 30, 1678–1689. [Google Scholar] [CrossRef]
- Chawanat, W.; Akama, M. Crack propagation under rolling contact fatigue near the white etching layer of a railway wheel. Tribol. Online 2024, 19, 277–286. [Google Scholar] [CrossRef]
- Lian, Q.; Deng, G.; Juboori, A.; Li, H.; Liu, Z.; Wang, X.; Zhu, H. Crack propagation behavior in white etching layer on rail steel surface. Eng. Fail. Anal. 2019, 104, 816–829. [Google Scholar] [CrossRef]
- Kráčalík, M.; Daves, W.; Antretter, T. Calculation of crack driving forces of surface cracks subjected to rolling/sliding contact. Eng. Fract. Mech. 2016, 152, 10–25. [Google Scholar] [CrossRef]
- Tillberg, J.; Larsson, F.; Runesson, K. On the role of material dissipation for the crack-driving force. I. J. Plast. 2010, 26, 992–1012. [Google Scholar] [CrossRef]
- Daves, W.; Kráčalík, M.; Scheriau, S. Analysis of crack growth under rolling-sliding contact. I. J. Fat. 2019, 121, 63–72. [Google Scholar] [CrossRef]
- Floros, D.; Ekberg, A.; Larsson, F. Evaluation of mixed-mode crack growth direction criteria under rolling contact conditions. Wear 2020, 448–449, 203184. [Google Scholar] [CrossRef]
- Bold, P. E. Multiaxial fatigue crack growth in rail steel. PhD thesis, University of Sheffield, 1990.
- Way, S. Pitting due to rolling contact. Trans. ASME. J. of Appl. Mech. 1935, 57, A49–A58. [Google Scholar] [CrossRef]
- Keer, L.M.; Bryant., M.D. A Pitting model for rolling contact fatigue. Trans. ASME, J. Tribol. 1983, 105, 198–205. [Google Scholar] [CrossRef]
- Bower, A. F. The influence of crack face friction and trapped fluid on surface initiated rolling contact fatigue cracks. Trans. ASME, J. Tribol. 1988, 110, 704–711. [Google Scholar] [CrossRef]
- Bogdański, S.; Olzak, M.; Stupnicki, J. Numerical stress analysis of rail rolling contact fatigue cracks. Wear 1996, 191, 14–24. [Google Scholar] [CrossRef]
- Murakami, Y.; Kaneta, M.; Yatsuzuka, H. Analysis of surface crack propagation in lubricated rolling contact. ASLE Trans. 1985, 28, 60–68. [Google Scholar] [CrossRef]
- Kaneta, M.; Yatsuzuka, H.; Murakami, Y. Mechanism of crack growth in lubricated rolling/sliding contact. ASLE Trans. 1985, 28, 407–414. [Google Scholar] [CrossRef]
- Kaneta, M.; Murakami, Y. Effects of oil hydraulic pressure on surface crack growth in rolling/sliding contact. Tribol. Int. 1987, 20, 210–217. [Google Scholar] [CrossRef]
- Kaneta, M.; Murakami, Y. Propagation of semi-elliptical surface cracks in lubricated rolling/sliding elliptical contacts. Trans. ASME, J. Tribol. 1991, 113, 270–275. [Google Scholar] [CrossRef]
- Fletcher, D.I.; Beynon, J.H. A simple method of stress intensity factor calculation for inclined surface-breaking cracks with crack face friction under contact loading. Proc. Instn. Mech. Engrs., Part J, J. Engng. Tribol. 1999, 213, 481–486. [Google Scholar] [CrossRef]
- Fletcher, D.I.; Beynon, J.H. A simple method of stress intensity factor calculation for inclined fluid-filled surface-breaking cracks under contact loading. Proc. Instn. Mech. Engrs., Part J, J. Engng. Tribol. 1999, 213, 299–304. [Google Scholar] [CrossRef]
- Kaneta, M.; Matsuda, K.; Murakami, K.; Nishikawa, H. Possible mechanism for rail dark spot defects. Transactions of the ASME: Series F, J. Tribol. 1998, 120, 304–309. [Google Scholar] [CrossRef]
- Akama, M.; Mori, T. Boundary element analysis of surface initiated rolling contact fatigue cracks in wheel/rail contact systems. Wear 2002, 253, 35–41. [Google Scholar] [CrossRef]
- Bogdański, S.; Lewicki, P. 3D model of liquid entrapment mechanism for rolling contact fatigue cracks in rails. Wear 2008, 265, 1356–1362. [Google Scholar] [CrossRef]
- Fletcher, D.I.; Hyde, P.; Kapoor, A. Investigating fluid penetration of rolling contact fatigue cracks in rails using a newly developed full-scale test facility. Proc. IMechE Part F: J. Rail Rapid Transit. 2007, 221, 35–44. [Google Scholar] [CrossRef]
- Bold, P.E.; Brown, M.W.; Allen, R.J. Shear mode crack growth and rolling contact fatigue. Wear 1991, 144, 307–317. [Google Scholar] [CrossRef]
- Akama, M.; Matsubara, K. Simulation for propagation of horizontal fissures in rail squats. Trans. JSCES 2020, 20200017. (in Japanese). [Google Scholar]
- Richard, H.A.; Eberlein, A.; Kullmer, G. Concepts and experimental results for stable and unstable crack growth under 3D-mixed-mode-loadings. Engng. Fract. Mech. 2017, 174, 10–20. [Google Scholar] [CrossRef]
- Akama, M. Fatigue crack growth under non-proportional mixed mode loading in rail and wheel steel part 1: Sequential mode I and mode II loading. Appl. Sci. 2019, 9, 2006. [Google Scholar] [CrossRef]
- Akama, M.; Kiuchi, A. Fatigue crack growth under non-proportional mixed mode loading in rail and wheel steel part 2: Sequential mode I and mode III loading. Appl. Sci. 2019, 9, 2866. [Google Scholar] [CrossRef]
- Otsuka, A.; Mori, K.; Miyata, T. The condition of fatigue crack growth in mixed mode condition. Eng. Fract. Mech. 1975, 7, 429–439. [Google Scholar] [CrossRef]
- Erdogan, F.; Sih, G. C. On the crack extention in plates under plane loading and transverse shear. ASME J. Basic Eng. 1963, 85, 519–525. [Google Scholar] [CrossRef]
- Dubourg, M.C.; Lamacq, V. A predictive rolling contact fatigue growth model: Onset of branching, direction and growth – role of dry and lubricated conditions on crack patterns. J. Tribol. 2002, 124, 680–688. [Google Scholar] [CrossRef]
- Hourlier, F.; Pineau, A. Propagation of fatigue cracks under polymodal loading. Fat. Fract. Eng. Mater. Struct. 1982, 5, 287–302. [Google Scholar] [CrossRef]
- Amestoy, M.; Leblond, J.B. Crack paths in plane situations—II. Detailed form of the expansion of the stress intensity factors. Int. J. Solids Struc. 1992, 29, 465–501. [Google Scholar]
- Enblom, R.; Berg, M. Impact of non-elliptic contact modelling in wheel wear simulation. Wear 2008, 265, 1532–1541. [Google Scholar] [CrossRef]
- Kashiwaya, K.; Ishida, M. The prediction model of growth rate of rail transverse crack. Proc. Railway Mech. 2003, 7, 79–84. (in Japanese). [Google Scholar]
- Fletcher, D. I.; Hyde, P.; Kapoor, A. Growth of multiple rolling contact fatigue cracks driven by rail bending modelled using a boundary element technique. Proc. IMec, Part F: J. Rail Rapid Transit 2004, 218, 243–253. [Google Scholar] [CrossRef]
- Mair, R.I.; Groenhout, R. The growth of transverse fatigue defects in the head of railway rails. Rail Eng. Int. 1980, 11, 675–686. [Google Scholar]
- Shah, R.C.; Kobayashi, A. Stress intensity factor for an elliptical crack under arbitrary normal loading. Eng. Fract. Mech. 1971, 3, 71–96. [Google Scholar] [CrossRef]
- Holm, R. Electric Contacts. Almquist and Wiksells Akademiska Handböcker, Stockholm, 1946.
- Archard, J.F. Contact and rubbing of flat surfaces. J. Appl. Phys. 1953, 24, 981–988. [Google Scholar] [CrossRef]
- Suh, N. P. The delamination theory of wear. Wear 1973, 25, 111–124. [Google Scholar] [CrossRef]
- Kapoor, A.; Franklin, F. J. Tribological layers and the wear of ductile materials. Wear 2000, 245, 204–215. [Google Scholar] [CrossRef]
- Beagley, T. M. Severe wear of rolling/sliding contacts. Wear 1976, 36, 317–335. [Google Scholar] [CrossRef]
- Bolton, P.J.; Clayton, P.; McEwen, I.J. Wear of rail and tyre steels under rolling/sliding conditions. ASLE transactions 1982, 25, 17–24. [Google Scholar] [CrossRef]
- Bolton, P.J.; Clayton, P. Rolling-sliding wear damage in rail and tyre steels. Wear 1984, 93, 145–165. [Google Scholar] [CrossRef]
- Olofsson, U.; Telliskivi, T. Wear, plastic deformation and friction of two rail steels—A full-scale test and a laboratory study. Wear 2003, 254, 80–93. [Google Scholar] [CrossRef]
- Garnham, J.E.; Beynon, J.H. Dry rolling-sliding wear of bainitic and pearlitic steels. Wear 1992, 157, 81–109. [Google Scholar] [CrossRef]
- Lewis, R.; Dwyer-Joyce, R.S. Wear mechanisms and transitions in railway wheel steels. Proc. IMec, Part J: J. Engng. Tribol. 2004, 218, 467–478. [Google Scholar] [CrossRef]
- Lewis, R.; Dwyer-Joyce, R.S.; Olofsson, U.; Pombo, J.; Jambrósio, J.; Pereira, M.; Ariaudo, C.; Kuka, N. Mapping railway wheel material wear mechanisms and transitions. Proc. IMechE Part F: J. Rail Rapid Transit 2010, 224, 125–137. [Google Scholar] [CrossRef]
- Lewis, R.; Olofsson, U. Mapping rail wear regimes and transitions. Wear 2004, 257, 721–729. [Google Scholar] [CrossRef]
- Pombo, J.; Ambrósio, J.; Pereira, M.; Lewis, R.; Dwyer-Joyce, R.; Ariaudo, C.; Kuka, N. Development of a wear prediction tool for steel railway wheels using three alternative wear functions. Wear 2011, 271, 238–245. [Google Scholar] [CrossRef]
- Jin, Y.; Ishida, M.; Namura, A. Experimental simulation and prediction of wear of wheel flange and rail gauge corner. Wear 2011, 271, 259–267. [Google Scholar] [CrossRef]
- Li, S.; Li, Z.; Núñez, A.; Dollevoet, R. New insights into the short pitch corrugation enigma based on 3D-FE coupled dynamic vehicle-track modeling of frictional rolling contact. Appl. Sci. 2017, 7, 807. [Google Scholar] [CrossRef]
- Li, Z.; Li, S.; Zhang, P.; Núñez, A.; Dollevoet, R. Mechanism of short pitch rail corrugation: Initial excitation and frequency selection for consistent initiation and growth. Int. J. Rail Trans. 2022, 12, 1–36. [Google Scholar] [CrossRef]
- Zhang, P.; Li, Z. The development of short pitch rail corrugation: Extensive field monitoring and validation of numerical predictions. Tribo. Int. 2025, 210, 10821. [Google Scholar] [CrossRef]
- Burstow, M. C. Whole life rail model application and development for RSSB - Development of an RCF damage parameter, Technical Report AEATR-ES-2003-832 Issue 1, Rail Safety & Standards Board (RSSB), 2003.
- Burstow, M. C. Whole life rail model application and development for RSSB - Continued development of an RCF damage parameter, Technical Report AEATR-ES-2004-880 Issue 2, Rail Safety & Standards Board (RSSB), 2004.
- Burstow, M. C.; Watson, A. S.; Beagles, M. Simulation of rail wear and rolling contact fatigue using the Whole Life Rail Model, Proceedings of ‘Railway Engineering 2003’, London 30th April 1st May, 2003.
- Mazzù, A.; Petrogalli, C.; Faccoli, M. An integrated model for competitive damage mechanisms assessment in railway wheel steels. Wear 2015, 322–323, 181–191. [Google Scholar] [CrossRef]
- Mazzù, A.; Donzella, G. A model for predicting plastic strain and surface cracks at steady-state wear and ratcheting regime. Wear 2018, 400–401, 127–136. [Google Scholar] [CrossRef]
- Mazzù, A.; Petrogalli, C.; Lancini, M.; Ghidini, A.; Faccoli, M. Effect of wear on surface crack propagation in rail-wheel wet contact. J. Mater. Eng. Perform 2018, 27, 630–639. [Google Scholar] [CrossRef]
- Karttunen, K.; Kabo, E.; Ekberg, A. Numerical assessment of the influence of worn wheel tread geometry on rail and wheel deterioration. Wear 2014, 317, 77–91. [Google Scholar] [CrossRef]
- Karttunen, K.; Kabo, E.; Ekberg, A. Estimation of gauge corner and flange root degradation from rail. wheel and track geometries. Wear, 2016; 366–367, 294–302. [Google Scholar]
- Ekberg, A.; Kabo, E.; Andersson, H. An engineering model for prediction of rolling contact fatigue of railway wheels. Fatigue Fract. Eng. Mater. Struct. 2002, 25, 899–909. [Google Scholar] [CrossRef]
- Dirks, B.; Enblom, R. Prediction model for wheel profile wear and rolling contact fatigue. Wear 2011, 271, 210–217. [Google Scholar] [CrossRef]
- Bevan, A.; Molyneux-Berry, P.; Eickhoff, B.; Burstow, M. Development and validation of a wheel wear and rolling contact fatigue damage model. Wear 2013, 307, 100–111. [Google Scholar] [CrossRef]
- Brouzoulis, J. Wear impact on rolling contact fatigue crack growth in rails. Wear 2014, 314, 13–19. [Google Scholar] [CrossRef]
- Jun, H.K.; Lee, D.H.; Kim, D.S. Calculation of minimum crack size for growth under rolling contact between wheel and rail. Wear 2015, 344–345, 46–57. [Google Scholar] [CrossRef]
- Fletcher, D.I.; Kapoor, A. Rapid method of stress intensity factor calculation for semi-elliptical surface breaking cracks under three-dimensional contact loading. Proc IMechE, Part F: J. Rail Rapid Transit 2006, 220, 219–234. [Google Scholar] [CrossRef]
- Trummer, G.; Marte, C.; Dietmaier, P.; Sommitsch, C.; Six, K. Modelling surface rolling contact fatigue crack initiation taking severe plastic shear deformation into account. Wear 2016, 352–353, 136–145. [Google Scholar] [CrossRef]
- Hiensch, M.; Steenbergen, M. Rolling contact fatigue on premium rail grades: Damage function development from field data. Wear 2018, 394–395, 187–194. [Google Scholar] [CrossRef]
- Hu, Y.; Zhou, L.; Ding, H.H.; Tan, G.X.; Lewis, R.; Liu, Q.Y.; Guo, J.; Wang, W.J. Investigation on wear and rolling contact fatigue of wheel-rail materials under various wheel/rail hardness ratio and creepage conditions. Tribol. Int. 2020, 143, 106091. [Google Scholar] [CrossRef]
- Zhang, R.; Zheng, C.; Chen, C.; Lv, B.; Gao, G.; Yang, Z.; Yang, Y.; Zhang, F. Study on fatigue wear competition mechanism and microstructure evolution on the surface of a bainitic steel rail. Wear 2021, 482–483, 203978. [Google Scholar] [CrossRef]
- Zani, N.; Petrogalli, C. Predictive maps for the rolling contact fatigue and wear interaction in railway wheel steels. Wear 2022, 510–511, 204513. [Google Scholar] [CrossRef]
- Wang, H.H.; Wang, W.J.; Han, Z.Y.; Wang, Y.; Ding, H.H.; Lewis, R.; Lin, Q.; Liu, Q.Y.; Zhou, Z.R. Wear and rolling contact fatigue competition mechanism of different types of rail steels under various slip ratios. Wear 2023, 22, 204721. [Google Scholar] [CrossRef]
- Luo, K.; Liu, X.; Yang, Y.; Cong, T.; Zhang, F.; Wang, W. Modeling the competitive relationship between wear and rolling contact fatigue of railway wheel steel. Wear 2025, 560–561, 205615. [Google Scholar] [CrossRef]
- Tao, G.; Tan, M.; Yuan, X.; Wen, B.; Wen, Z. Influence of wheel wear on the rolling contact fatigue of metro wheels in the central area of the wheel tread. Wear 2025, 571, 205777. [Google Scholar] [CrossRef]
- Urashima, C.; Nishida, S. Fatigue crack initiation and propagation behaviour and fracture surface of eutectoid steels. J. Soc. Mat. Sci., Japan 1994, 43, 515–521. [Google Scholar] [CrossRef]
- Bomidi, J. AR.; Weinzapfel, N.; Sadeghi, F. An improved approach for 3D rolling contact fatigue simulations with microstructure topology. Tribol. Trans. 2013, 56, 385–399. [Google Scholar] [CrossRef]
- Bomidi, J.A.R.; Sadeghi, F. Three-dimensional finite element elastic–plastic model for subsurface initiated spalling in rolling contacts. Trans. ASME, J. Tribol. 2014, 136, 011402. [Google Scholar] [CrossRef]
- Franklin, F.J.; Gahlot, A.; Fletcher, D.I.; Garnham, J.E.; Davis, C. Three-dimensional modelling of rail steel microstructure and crack growth. Wear 2011, 357–363. [Google Scholar] [CrossRef]
- Wang, D.F.; Kato, K. Nano-scale fatigue wear of carbon nitride coatings: Part II—Wear mechanisms. Trans. ASME, J. Tribol. 2003, 125, 437–444. [Google Scholar] [CrossRef]
- Deng, X.; Qian, Z.; Li, Z.; Dollevoet, R. Investigation of the formation of corrugation-induced rail squats based on extensive field monitoring. Int. J. Fat. 2018, 112, 94–105. [Google Scholar] [CrossRef]
- Tyfour, W.R.; Beynon, J.H. The effect of rolling direction reversal on the wear rate and wear mechanism of pearlitic rail steel. Tribol. Int. 1994, 27, 401–412. [Google Scholar] [CrossRef]
- Tyfour, W.R.; Beynon, J.H. The effect of rolling direction reversal on fatigue crack morphology and propagation. Tribol. Int. 1994, 27, 273–282. [Google Scholar] [CrossRef]
- Akama, M.; Takahashi, Y. The influence of rolling direction reversal on wear and RCF cracks on the wheel tread, The 5th International Conference on Railway Technology, 22 – 25 Aug. 2022, Le Corum Congress Center, France.
Figure 1.
Combining wear rate with crack tip advance rate [2].
Figure 1.
Combining wear rate with crack tip advance rate [2].
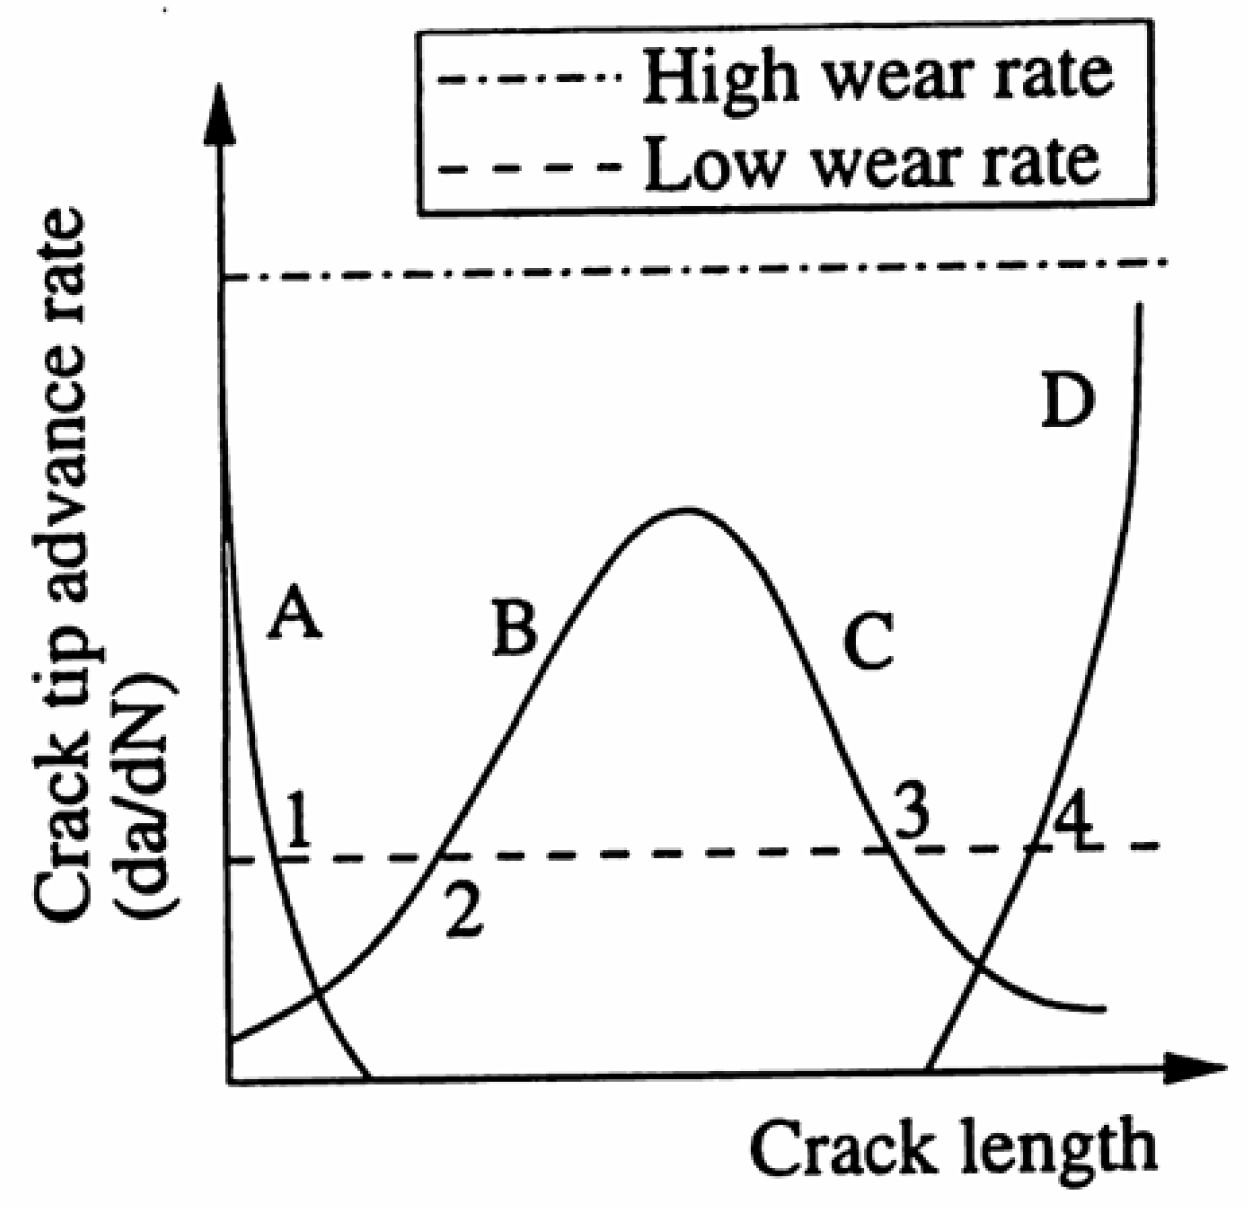
Figure 2.
The relationship between wear life and RCF life [2].
Figure 2.
The relationship between wear life and RCF life [2].
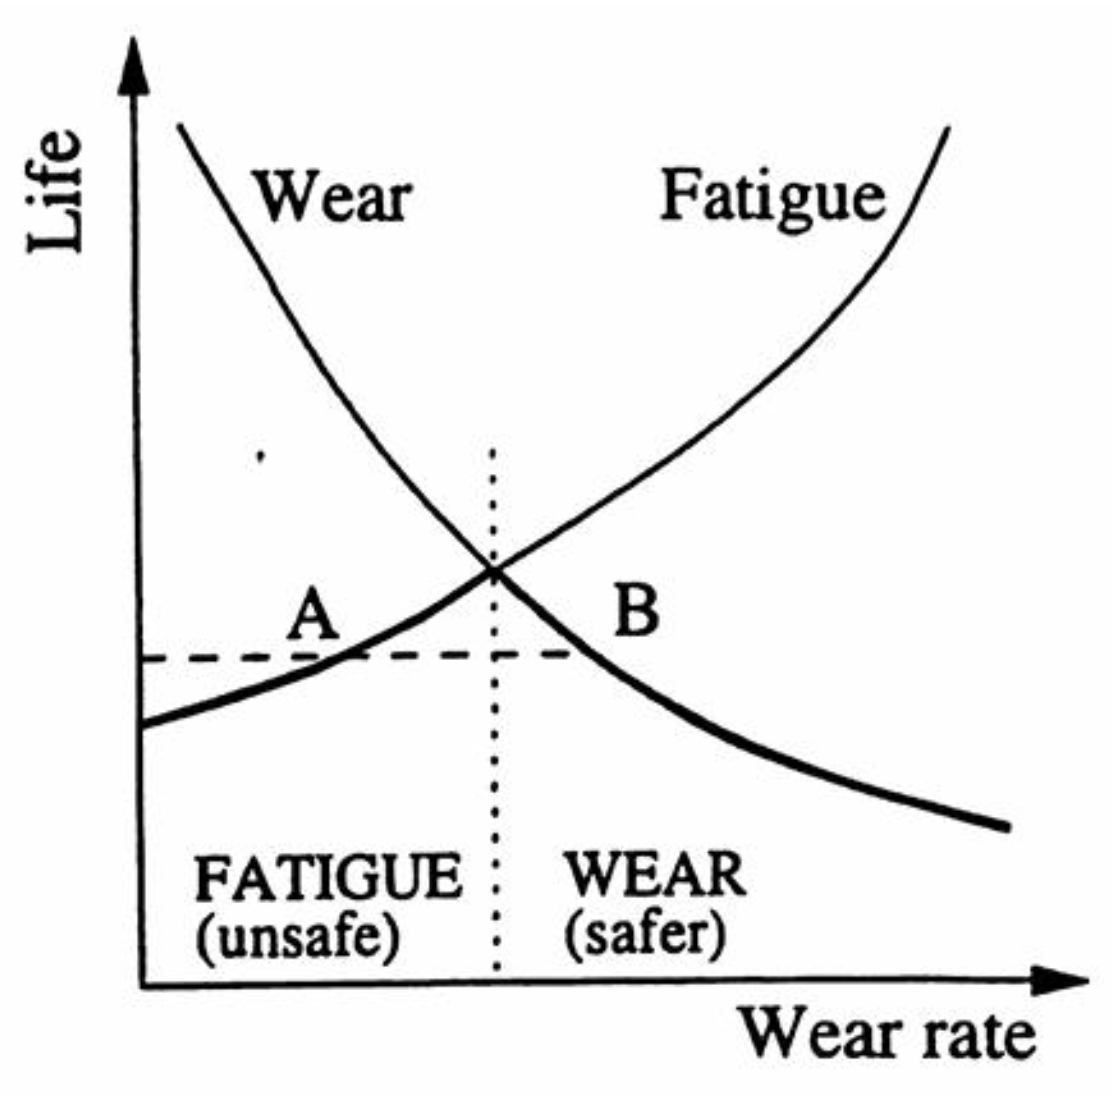
Figure 3.
Appearance from the surface of the squats and the broken rail by transverse crack [4].
Figure 3.
Appearance from the surface of the squats and the broken rail by transverse crack [4].
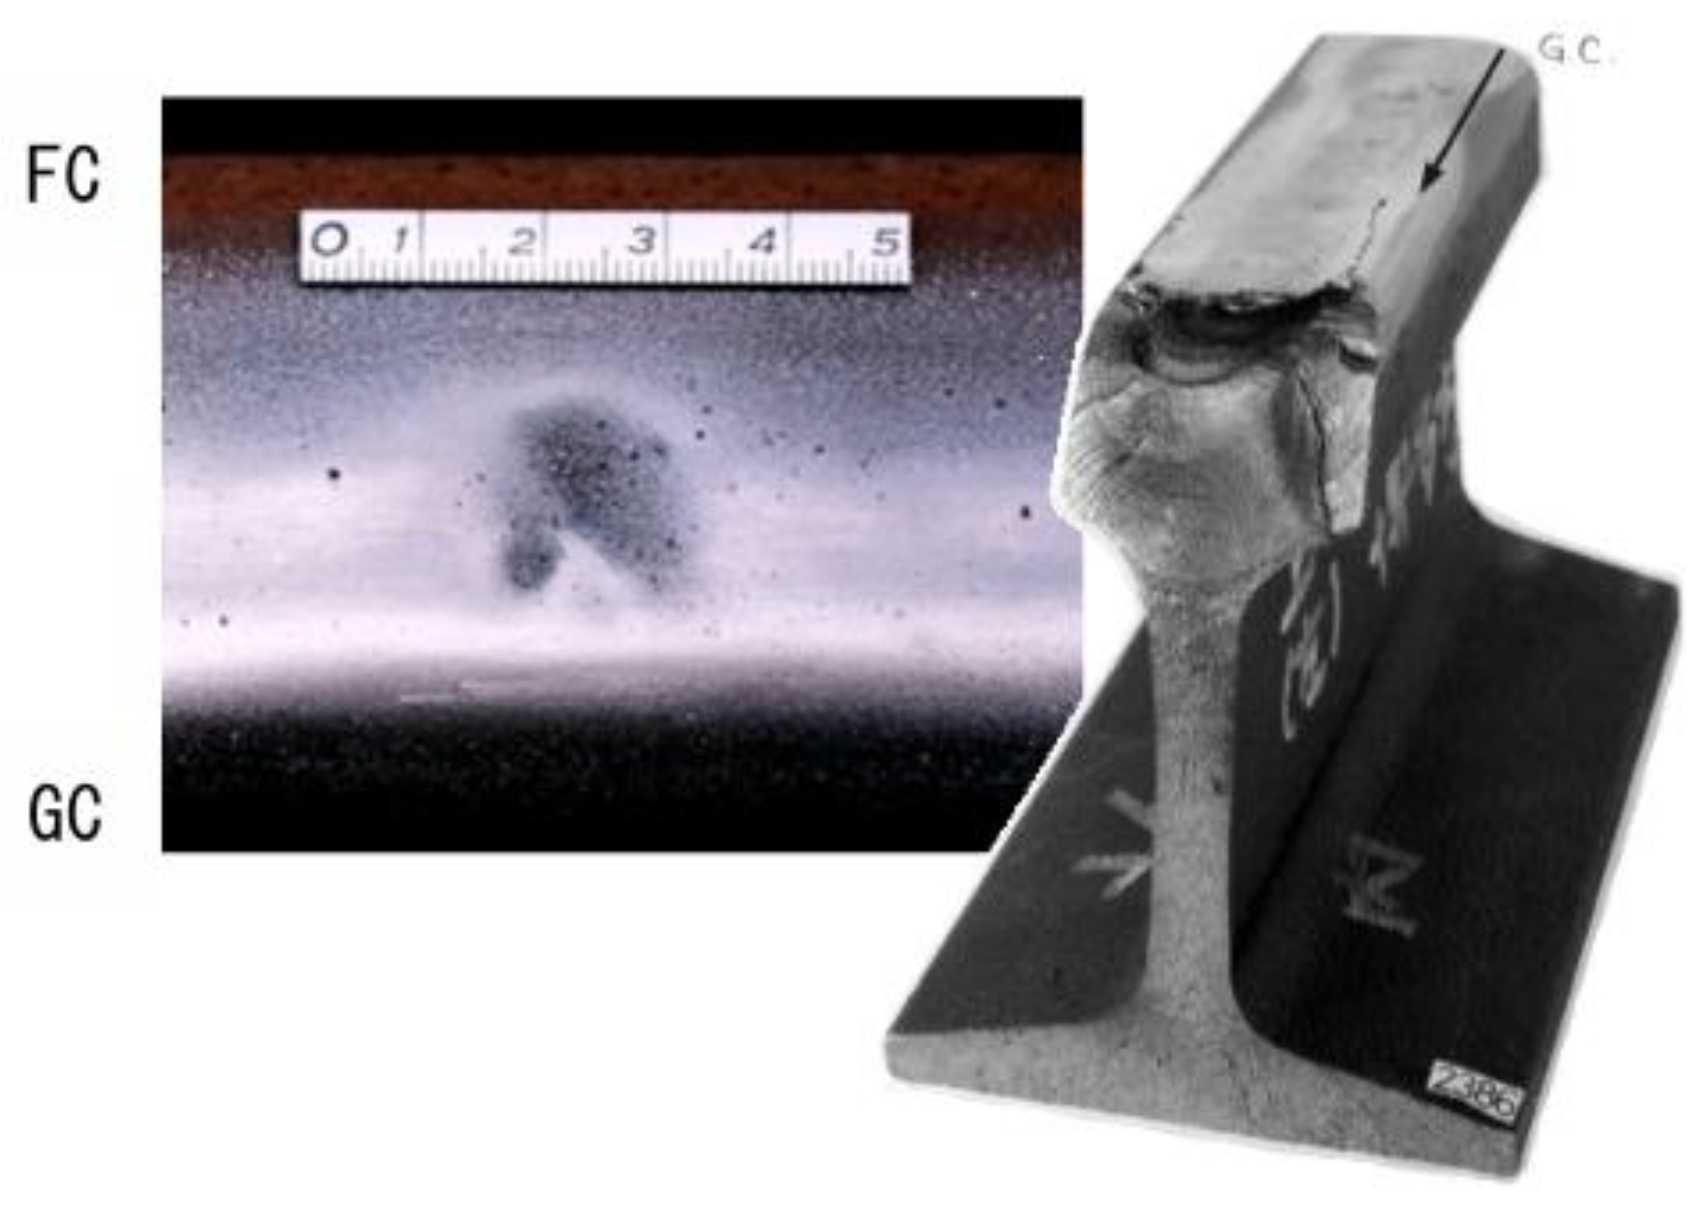
Figure 4.
Spalling on wheel tread [5].
Figure 4.
Spalling on wheel tread [5].
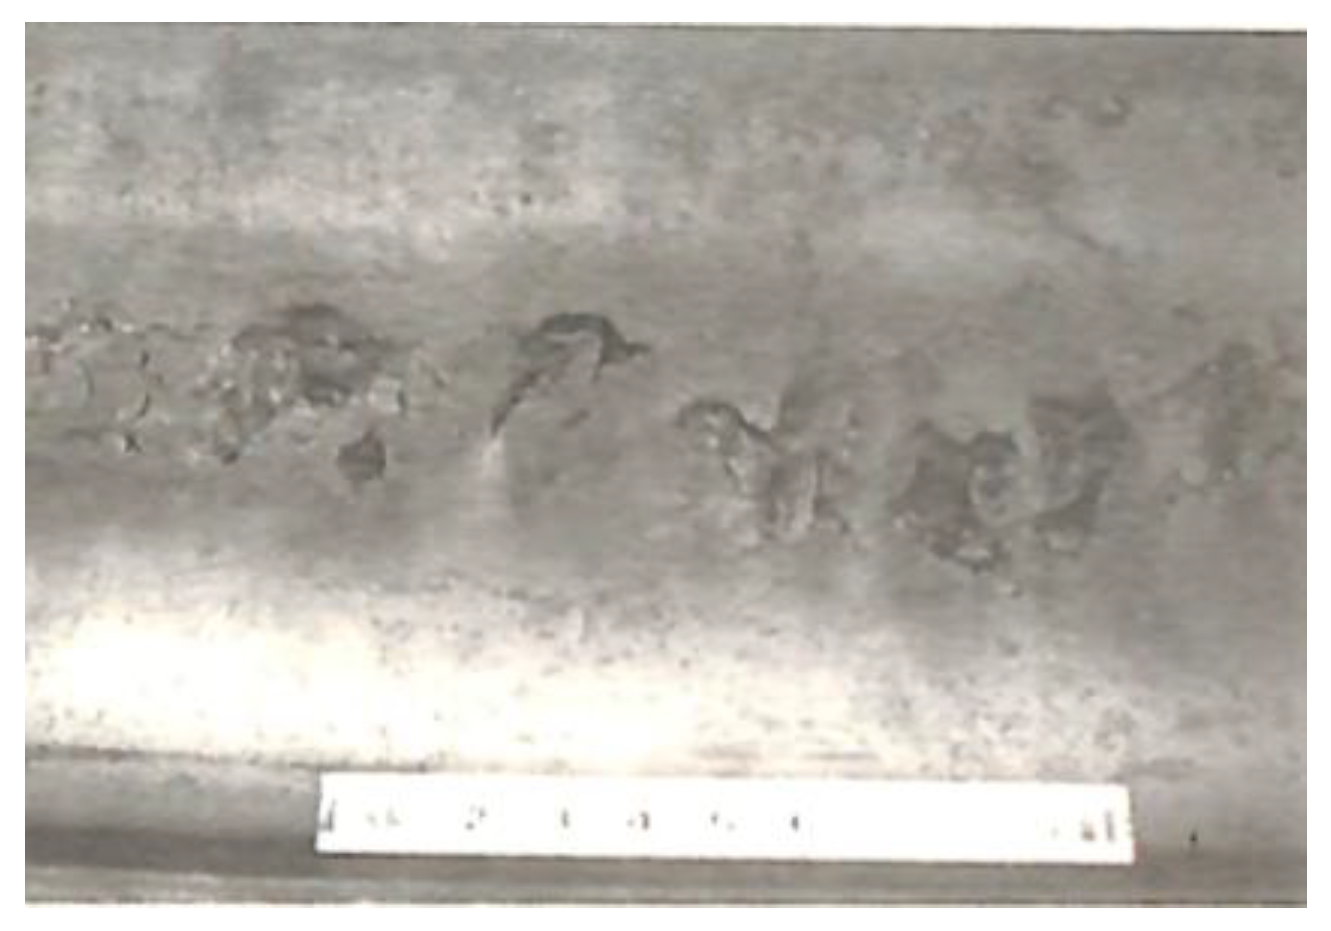
Figure 5.
Typical side wear [6]. Variation of worn profiles at curve radius 400 m and 900 m of JIS 60-kg rail.
Figure 5.
Typical side wear [6]. Variation of worn profiles at curve radius 400 m and 900 m of JIS 60-kg rail.
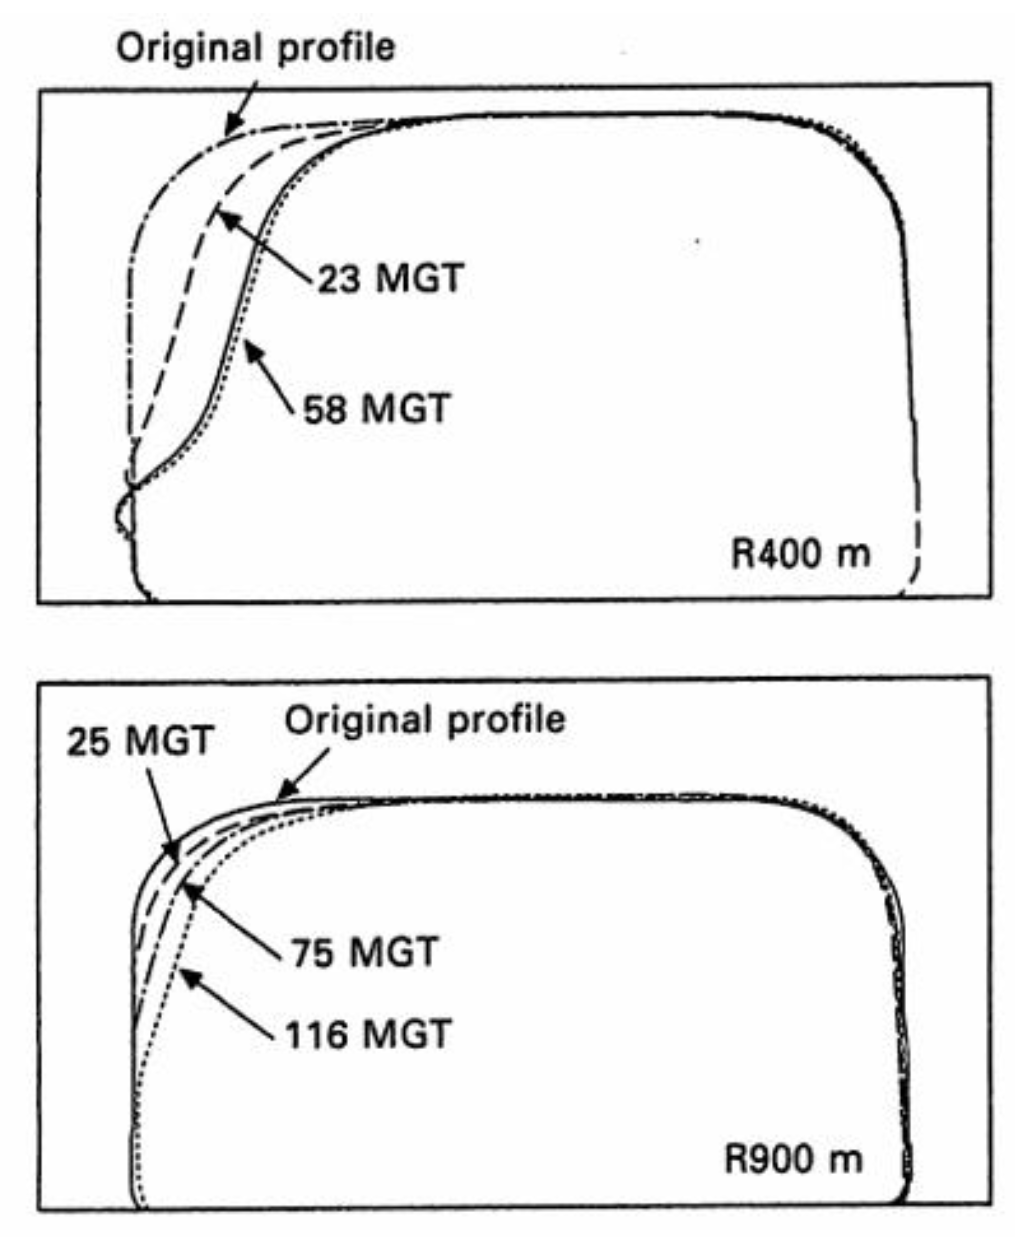
Figure 6.
Example of corrugation [7].
Figure 6.
Example of corrugation [7].
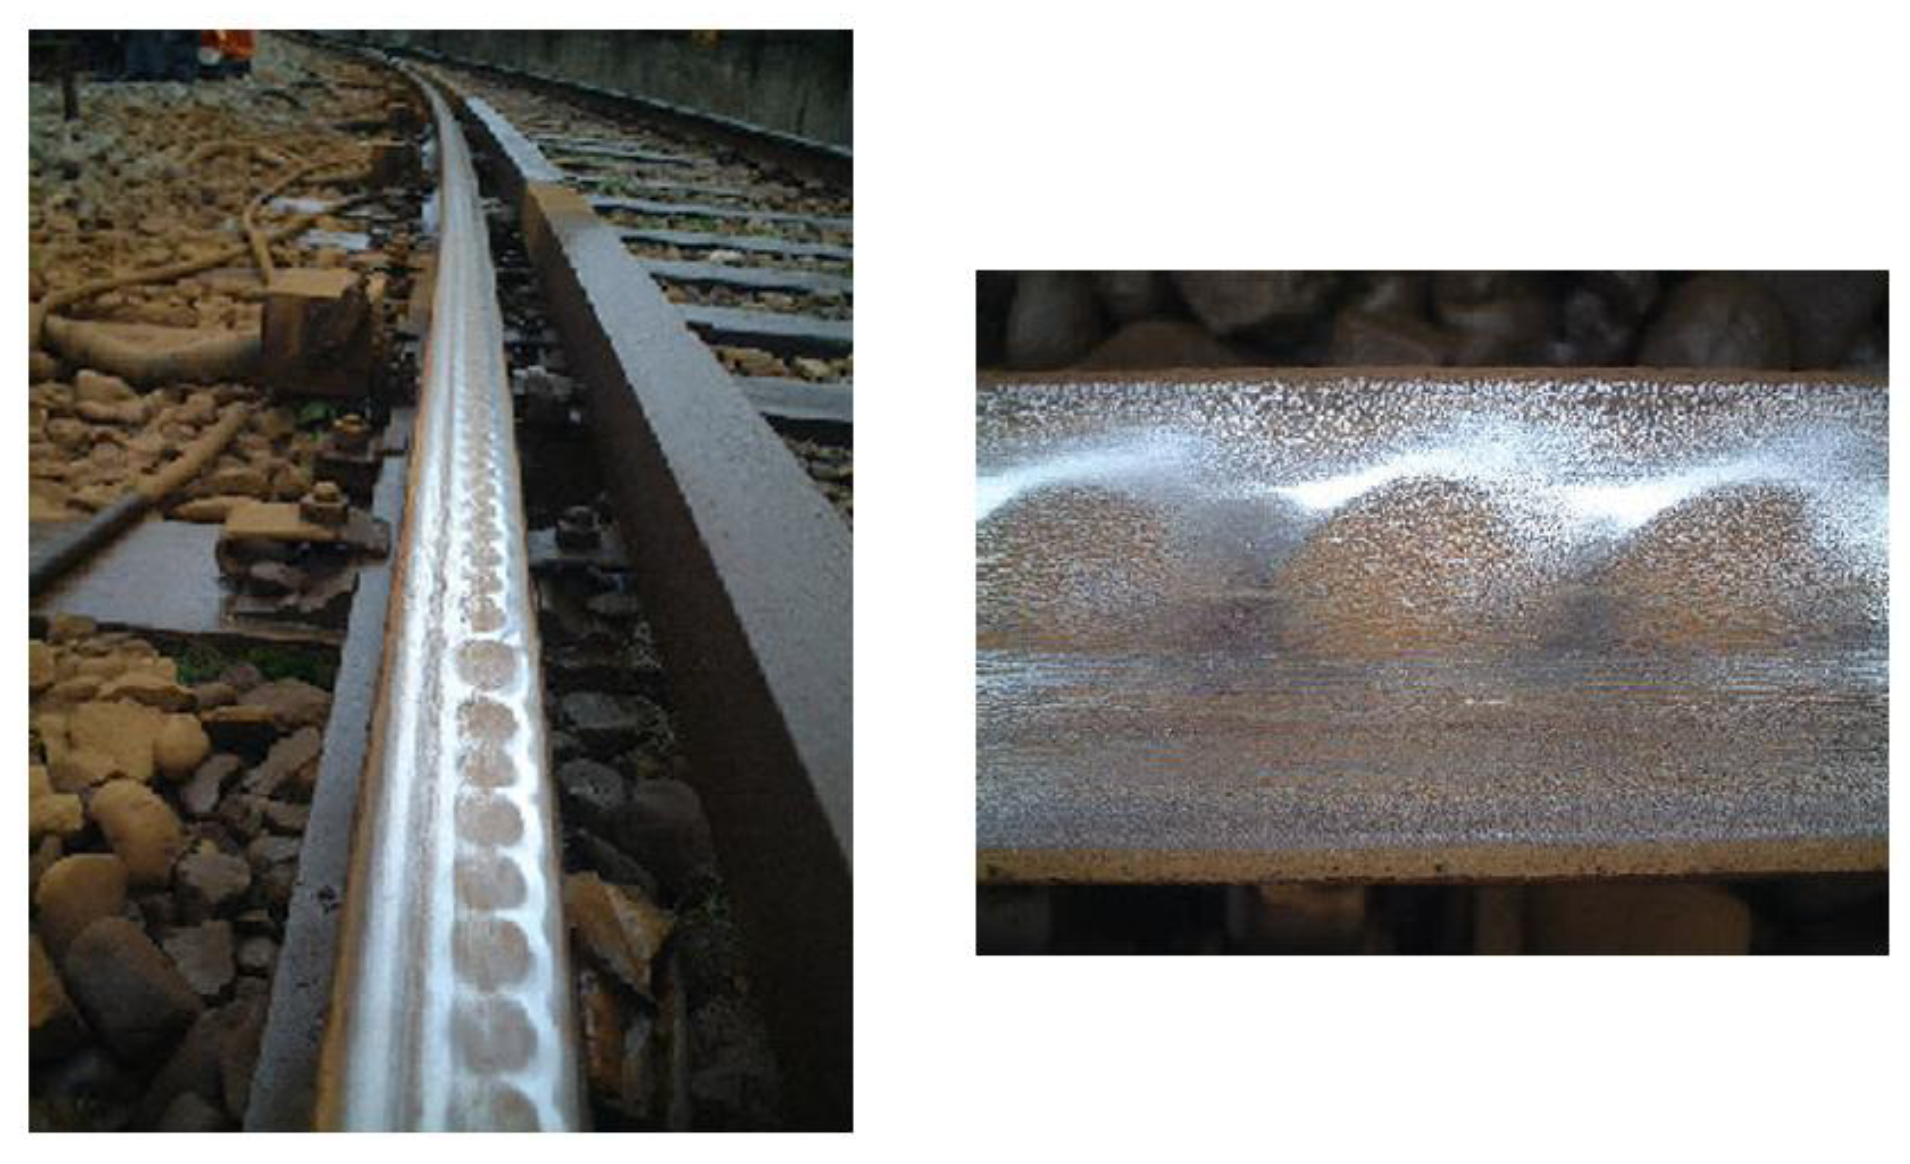
Figure 7.
Different forms of material response to cyclic loading: (a) perfectly elastic, (b) elastic shakedown, (c) plastic shakedown, and (d) ratchetting [8].
Figure 7.
Different forms of material response to cyclic loading: (a) perfectly elastic, (b) elastic shakedown, (c) plastic shakedown, and (d) ratchetting [8].
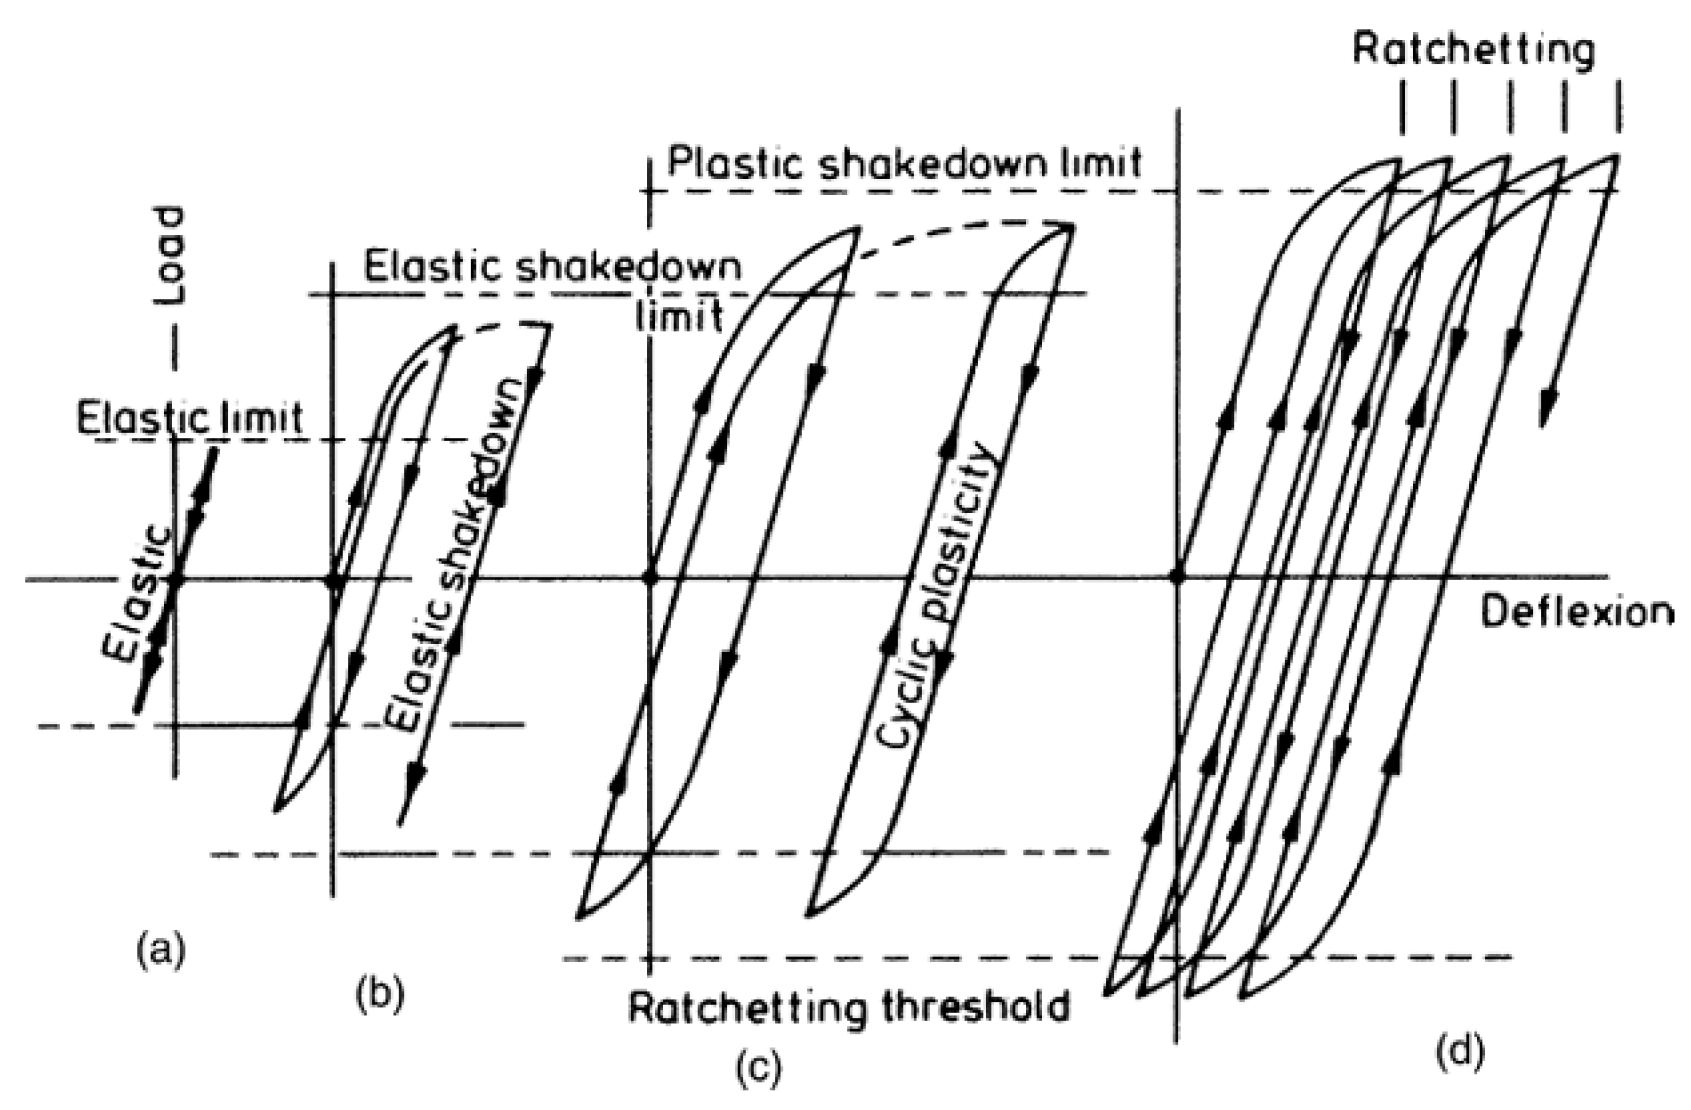
Figure 8.
Schematic of ratcheting failure simulation results. (a) Loss of unsupported bricks indicates wear and surface roughness development. (b) Failed but supported bricks represent crack initiation and growth. [15].
Figure 8.
Schematic of ratcheting failure simulation results. (a) Loss of unsupported bricks indicates wear and surface roughness development. (b) Failed but supported bricks represent crack initiation and growth. [15].
Figure 9.
Analytical model and notation [43].
Figure 9.
Analytical model and notation [43].
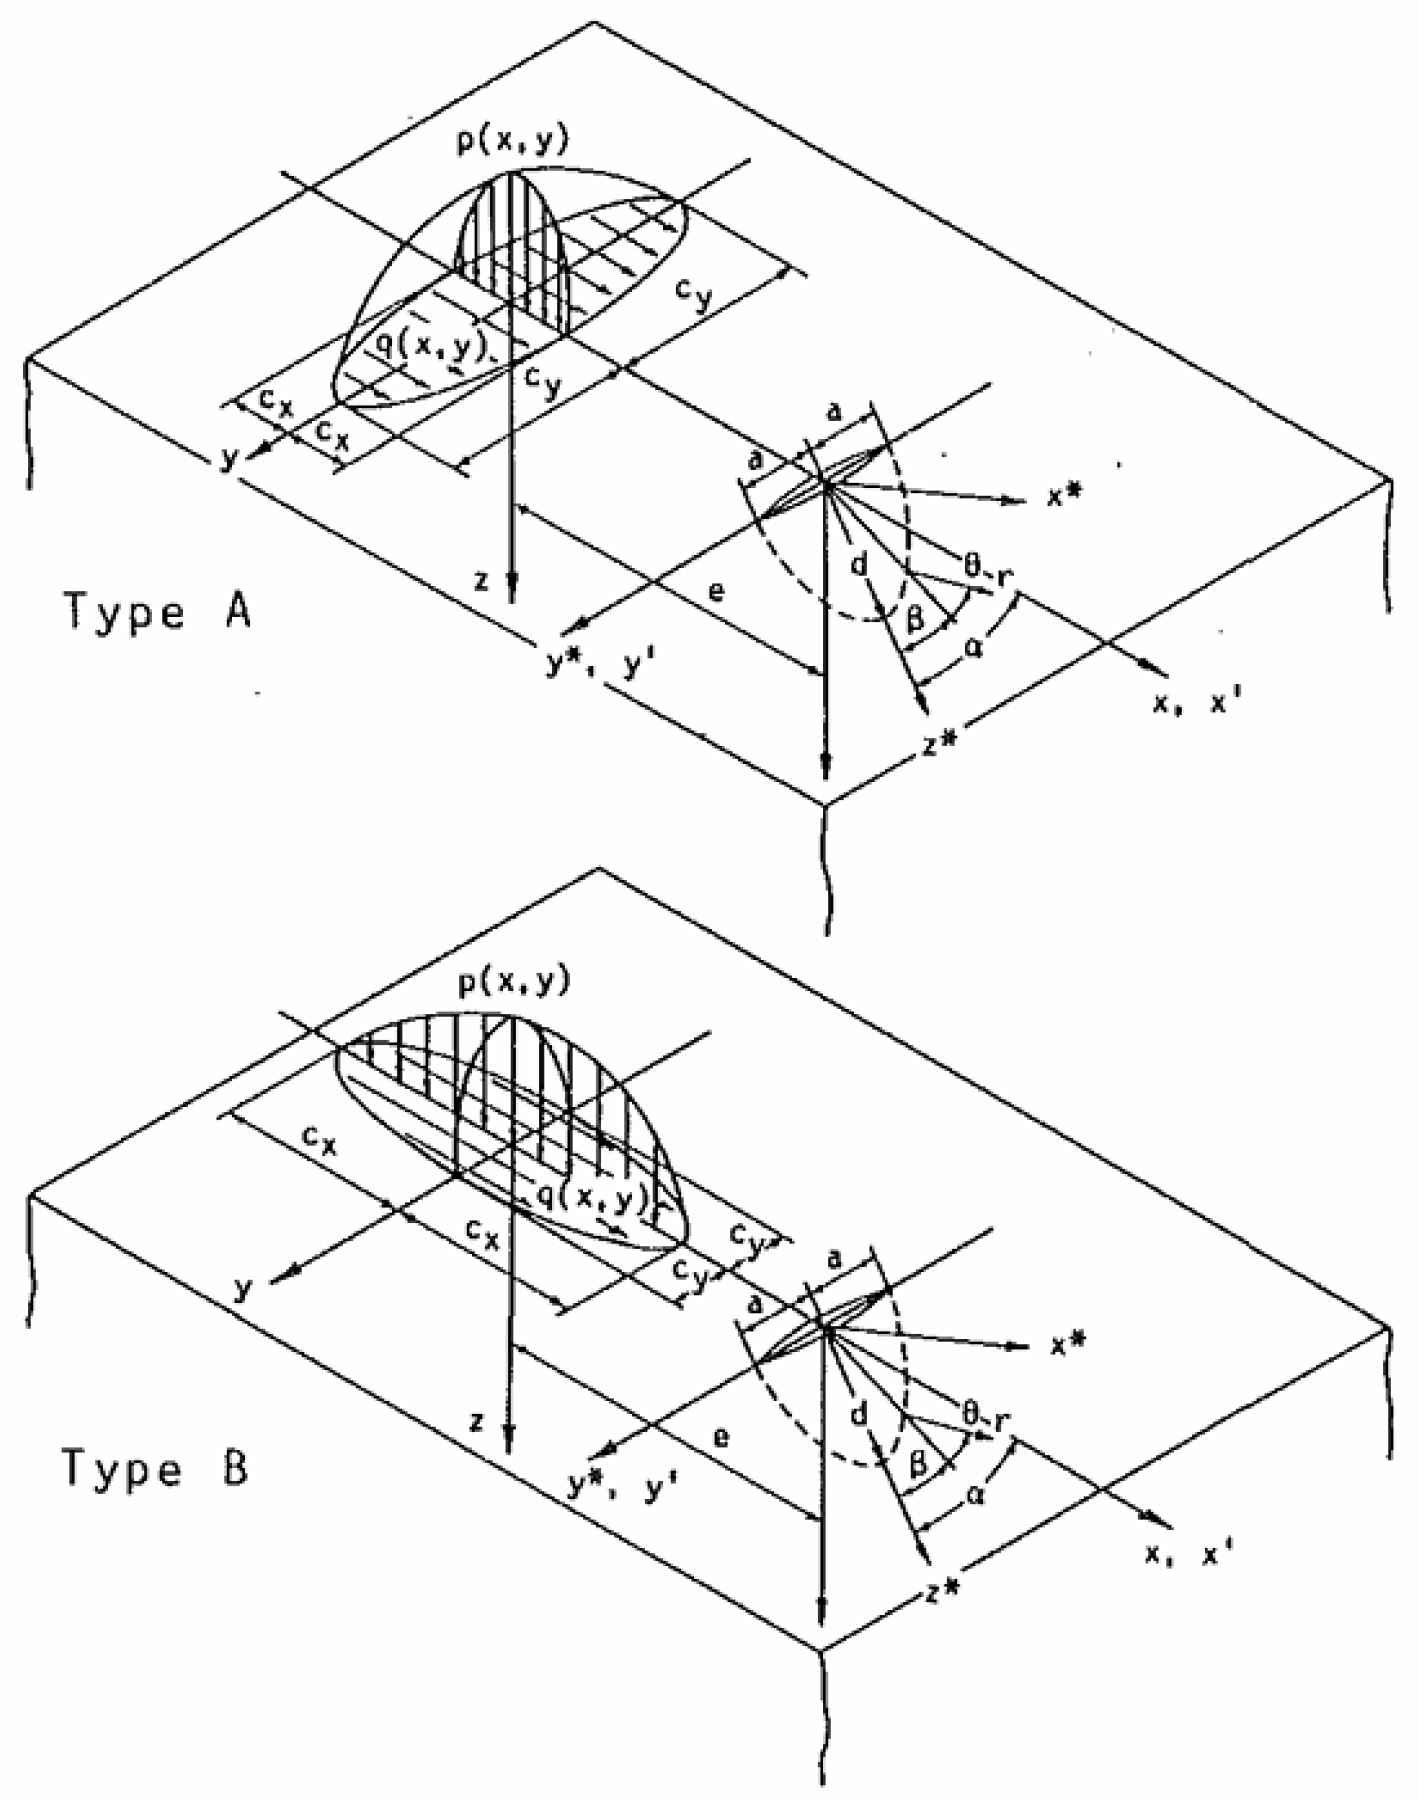
Figure 10.
Variation of FI at the deepest point of the crack tip due to movement of the contact load: d/a = 0.5, f = -0.1, dotted lines denote no oil hydraulic pressure on the crack faces [43].
Figure 10.
Variation of FI at the deepest point of the crack tip due to movement of the contact load: d/a = 0.5, f = -0.1, dotted lines denote no oil hydraulic pressure on the crack faces [43].
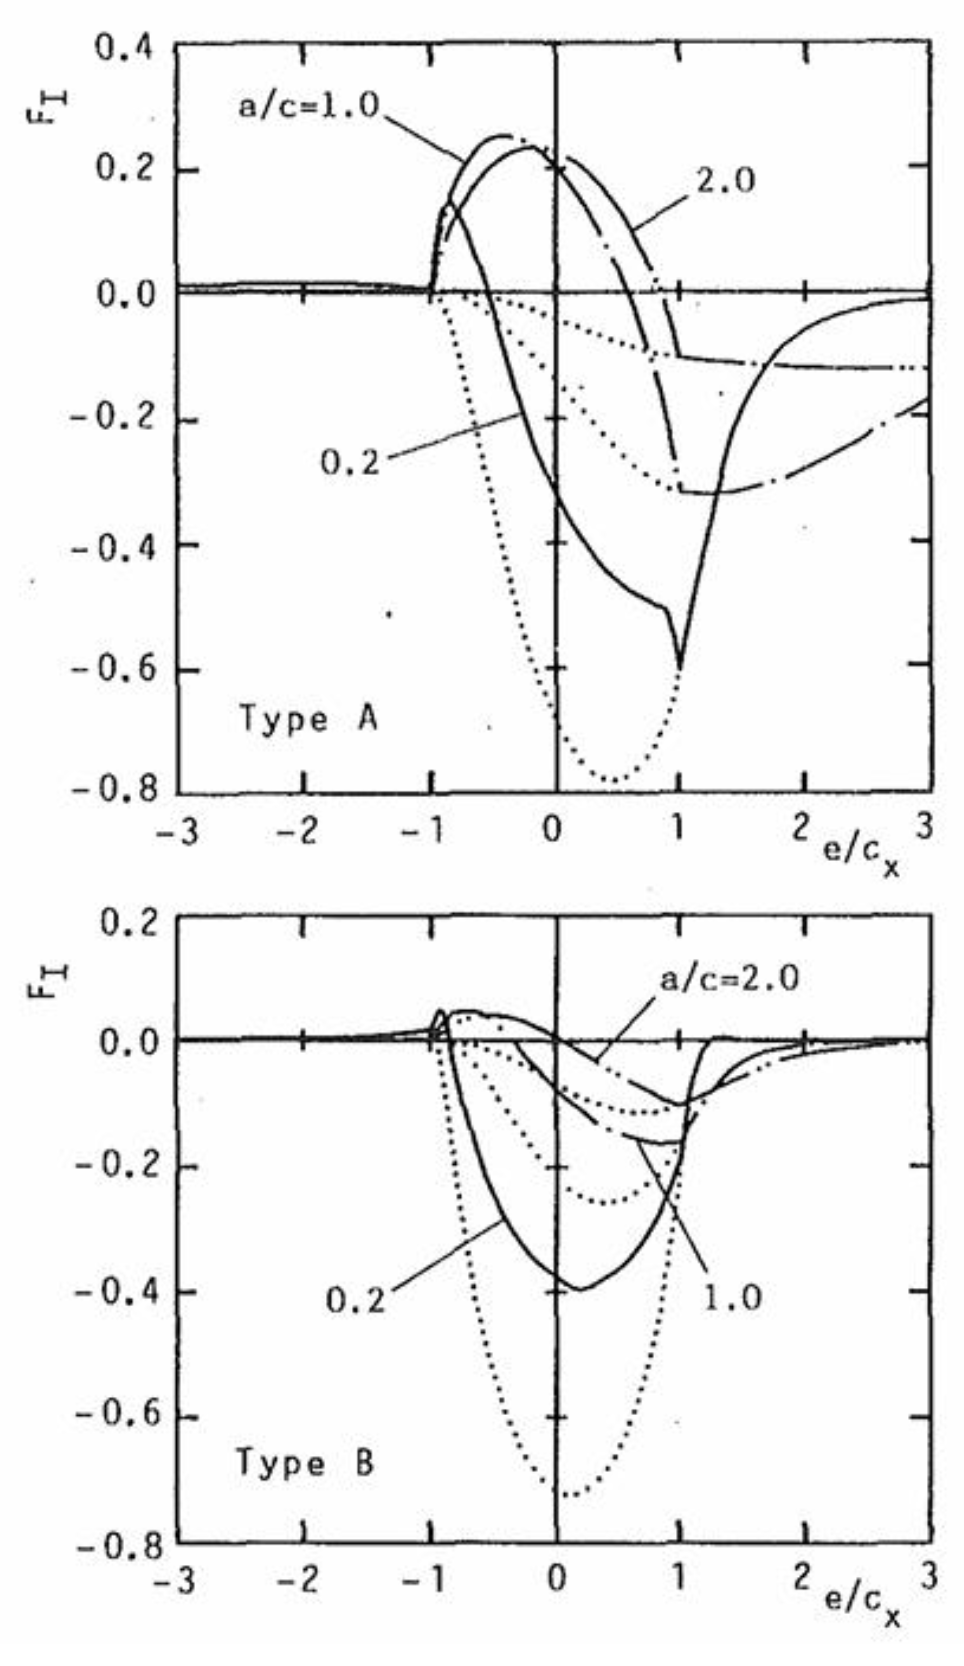
Figure 11.
Variation of FI at the deepest point of the crack tip due to movement of the contact load: d/a = 2.0, f = - 0.1, dotted lines denote no oil hydraulic pressure on the crack faces [43].
Figure 11.
Variation of FI at the deepest point of the crack tip due to movement of the contact load: d/a = 2.0, f = - 0.1, dotted lines denote no oil hydraulic pressure on the crack faces [43].
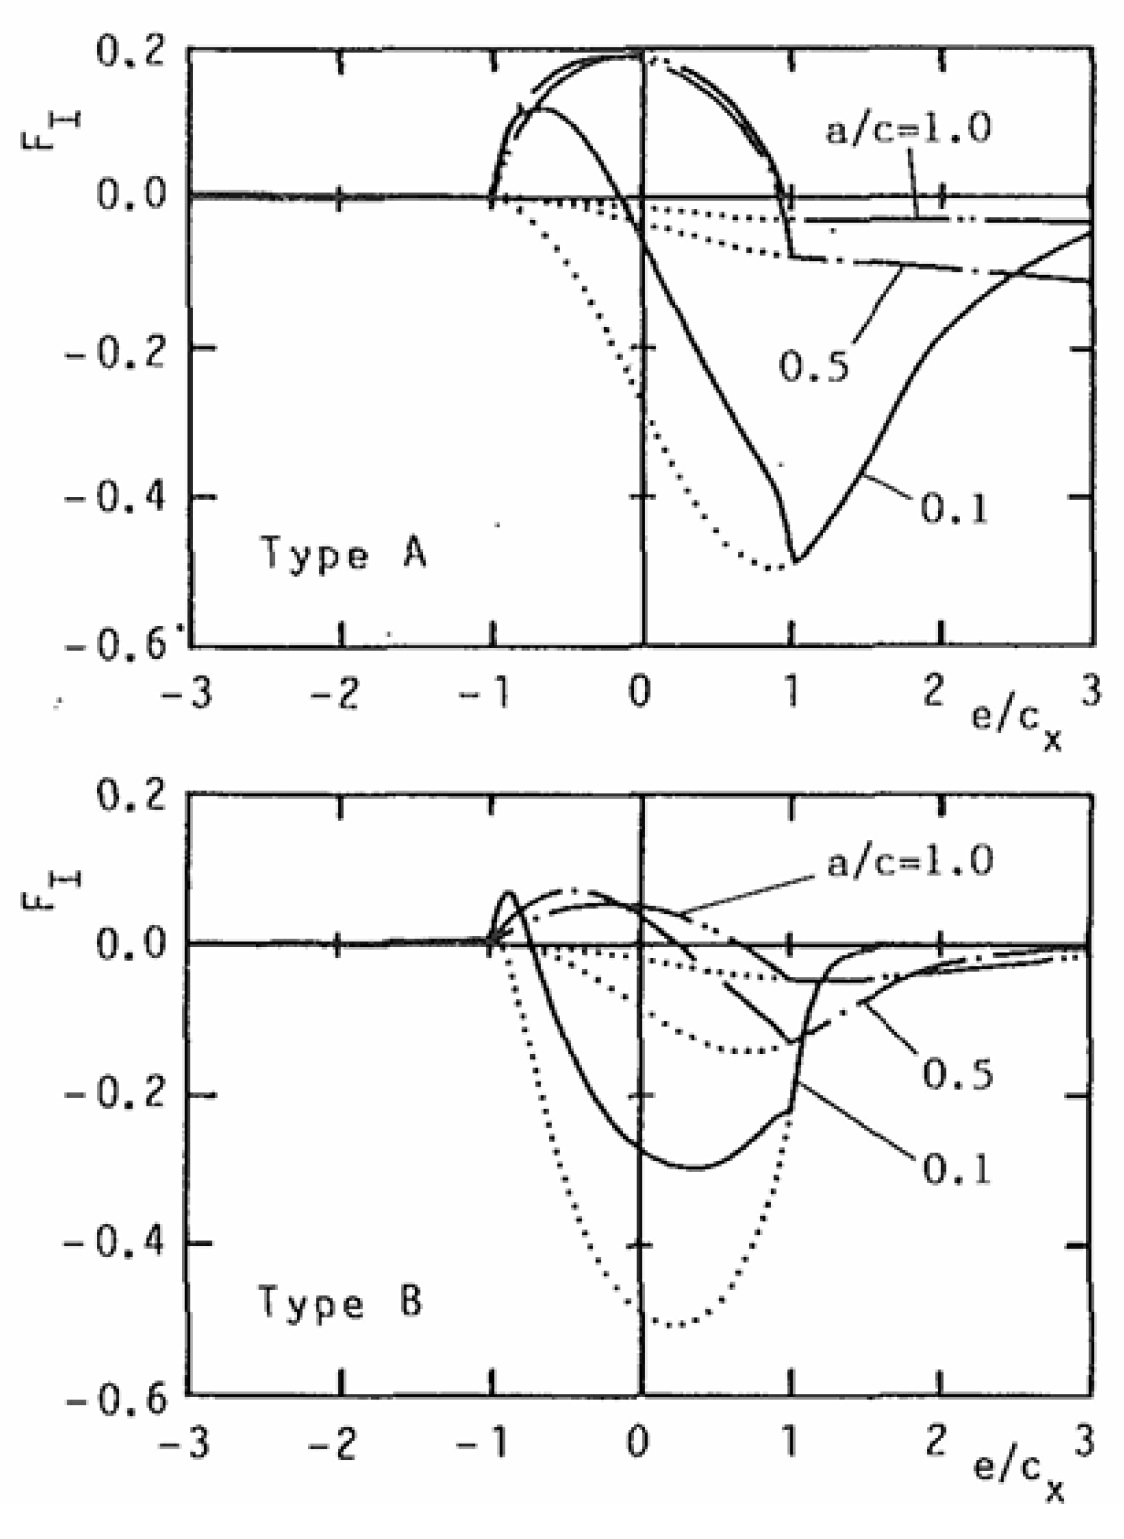
Figure 12.
Reproduced typical dark spot defect, high slip ratio, 60-s intervals between dry and wet runnings: (a) stylus trace along the A-A line indicated in (b); (b) surface appearance; (c) circumferential section parallel to A-A line indicated in (b); (d) axial section of same specimen but different dark spot defect [46].
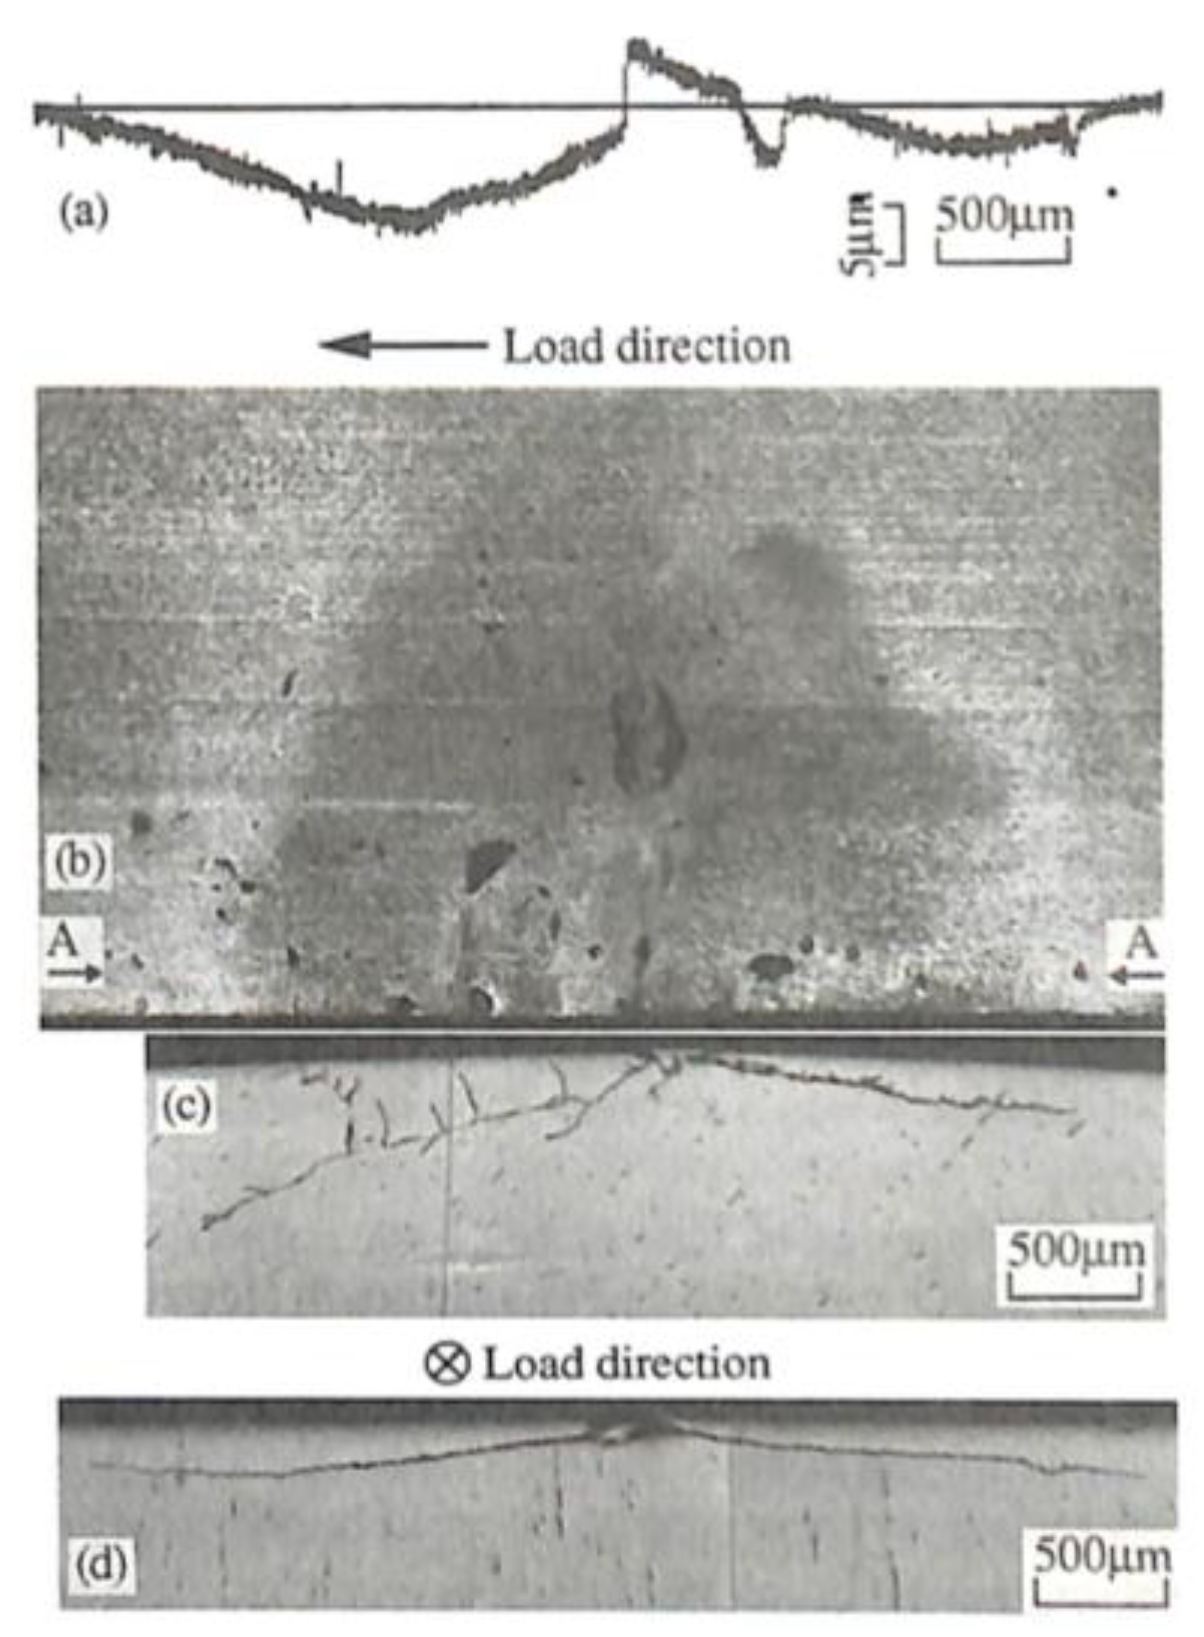
Figure 13.
Definition of KI and KII before branching and k1 and k2 after branching at the tip of an infinitesimal segment of length s inclined at an angle θ to the initial crack direction [57].
Figure 13.
Definition of KI and KII before branching and k1 and k2 after branching at the tip of an infinitesimal segment of length s inclined at an angle θ to the initial crack direction [57].
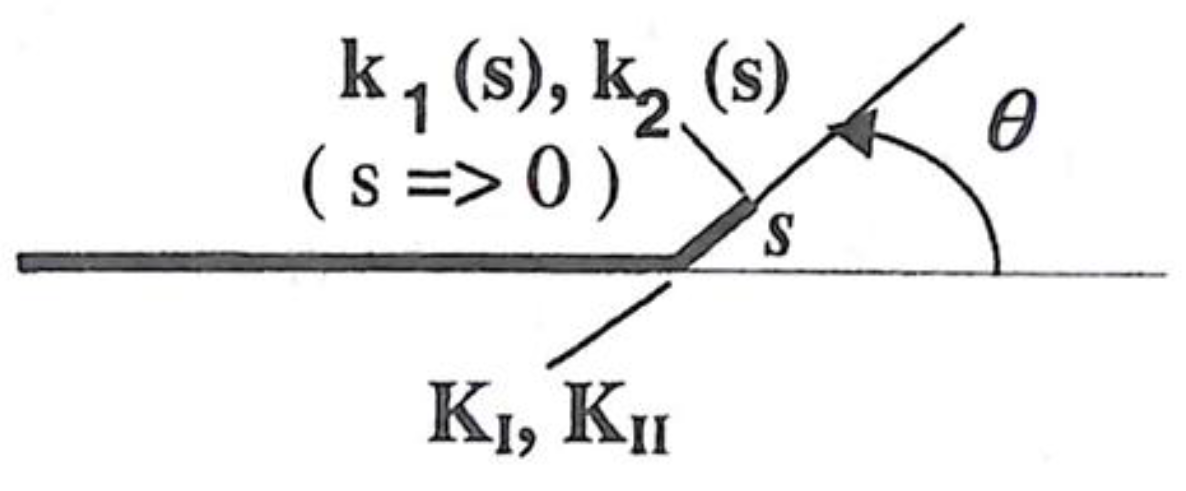
Figure 15.
Growth of defect near the gauge corner subject to lateral and vertical loads [63].
Figure 15.
Growth of defect near the gauge corner subject to lateral and vertical loads [63].
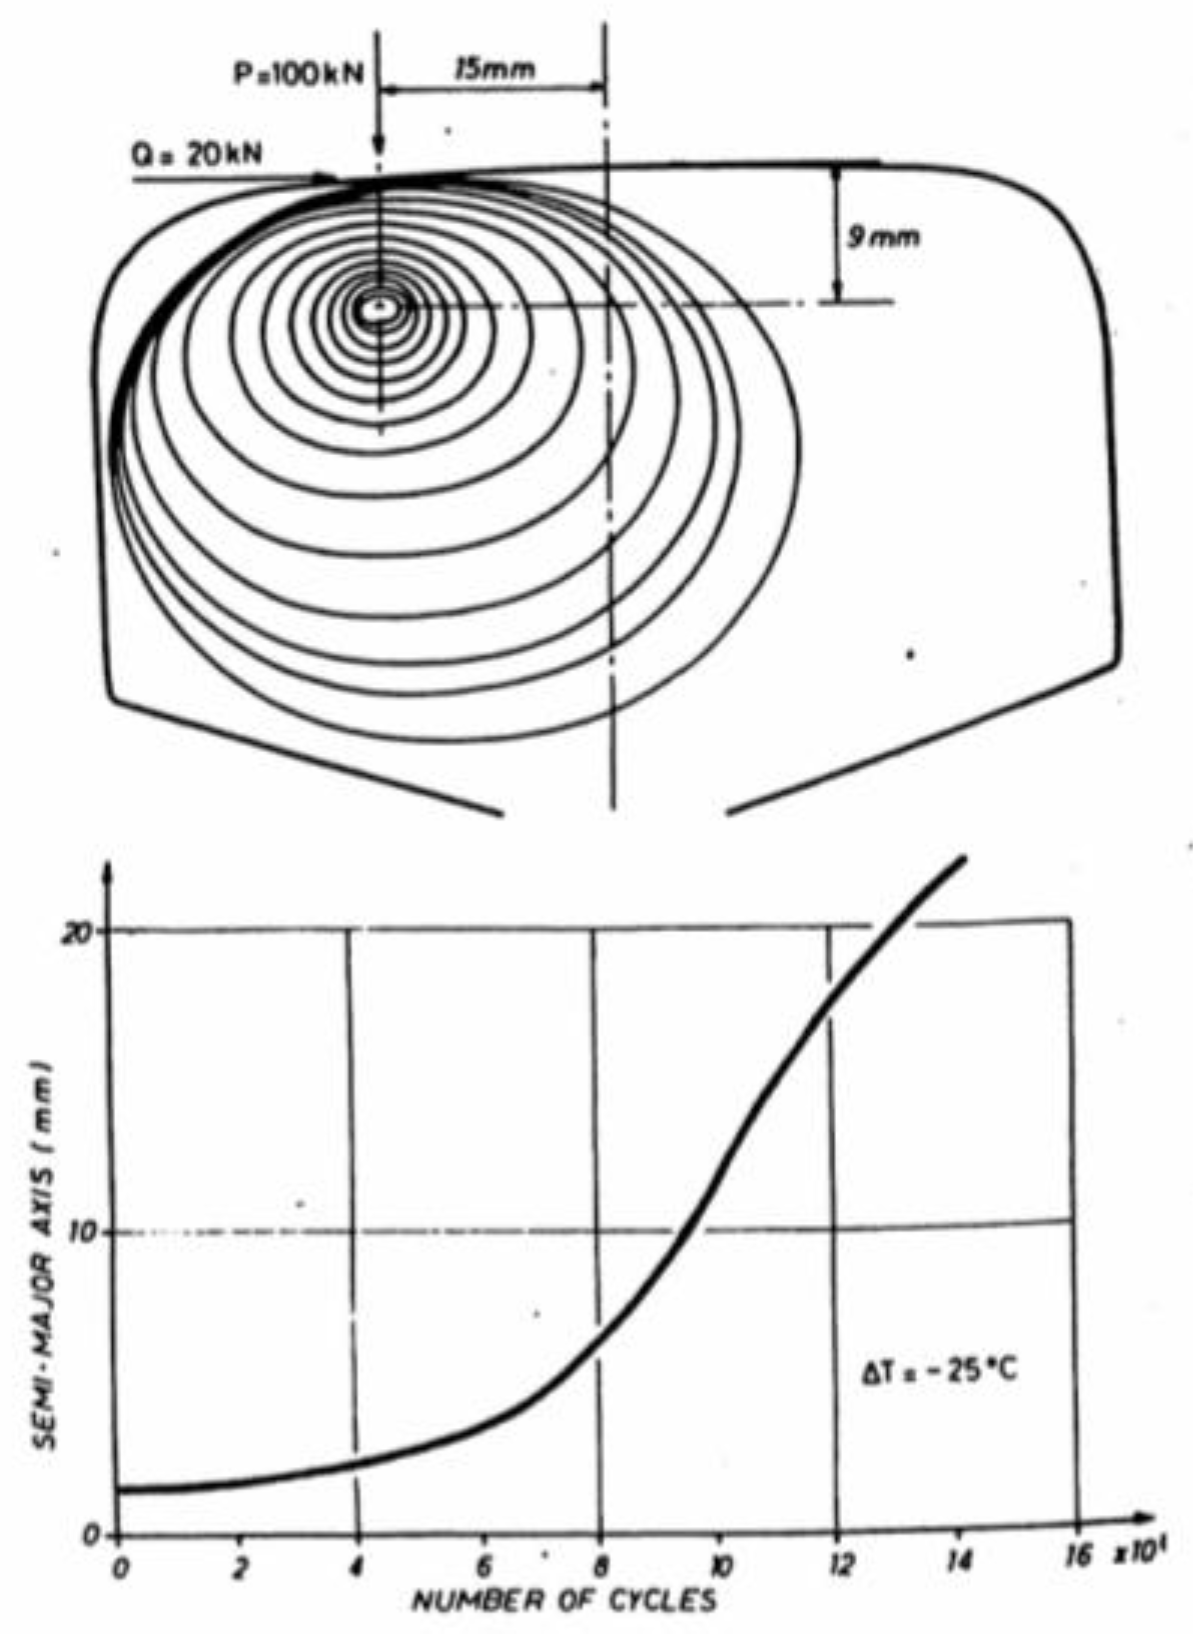
Figure 16.
R8T and R7T wheel steel wear rates and regimes [75].
Figure 16.
R8T and R7T wheel steel wear rates and regimes [75].
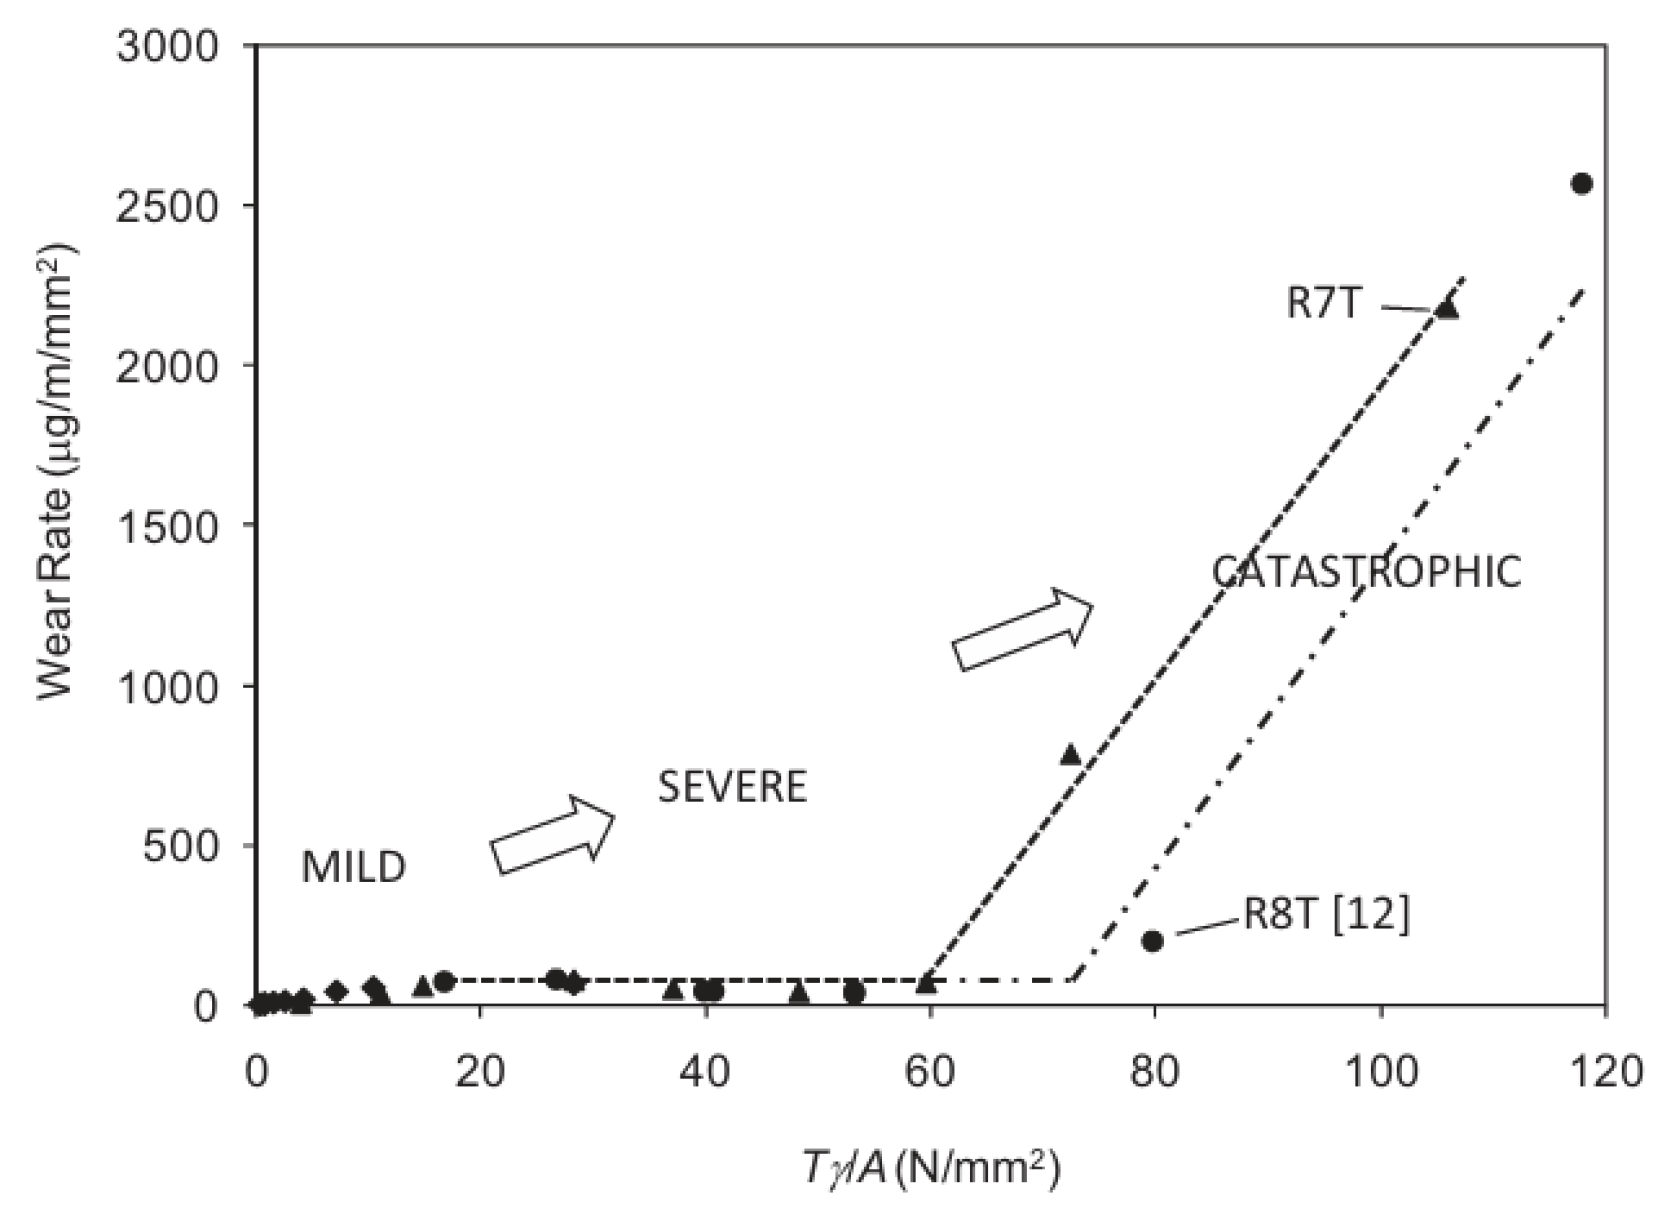
Figure 17.
Wear coefficient maps for standard carbon rail material and an unspecified wheel material [76].
Figure 17.
Wear coefficient maps for standard carbon rail material and an unspecified wheel material [76].
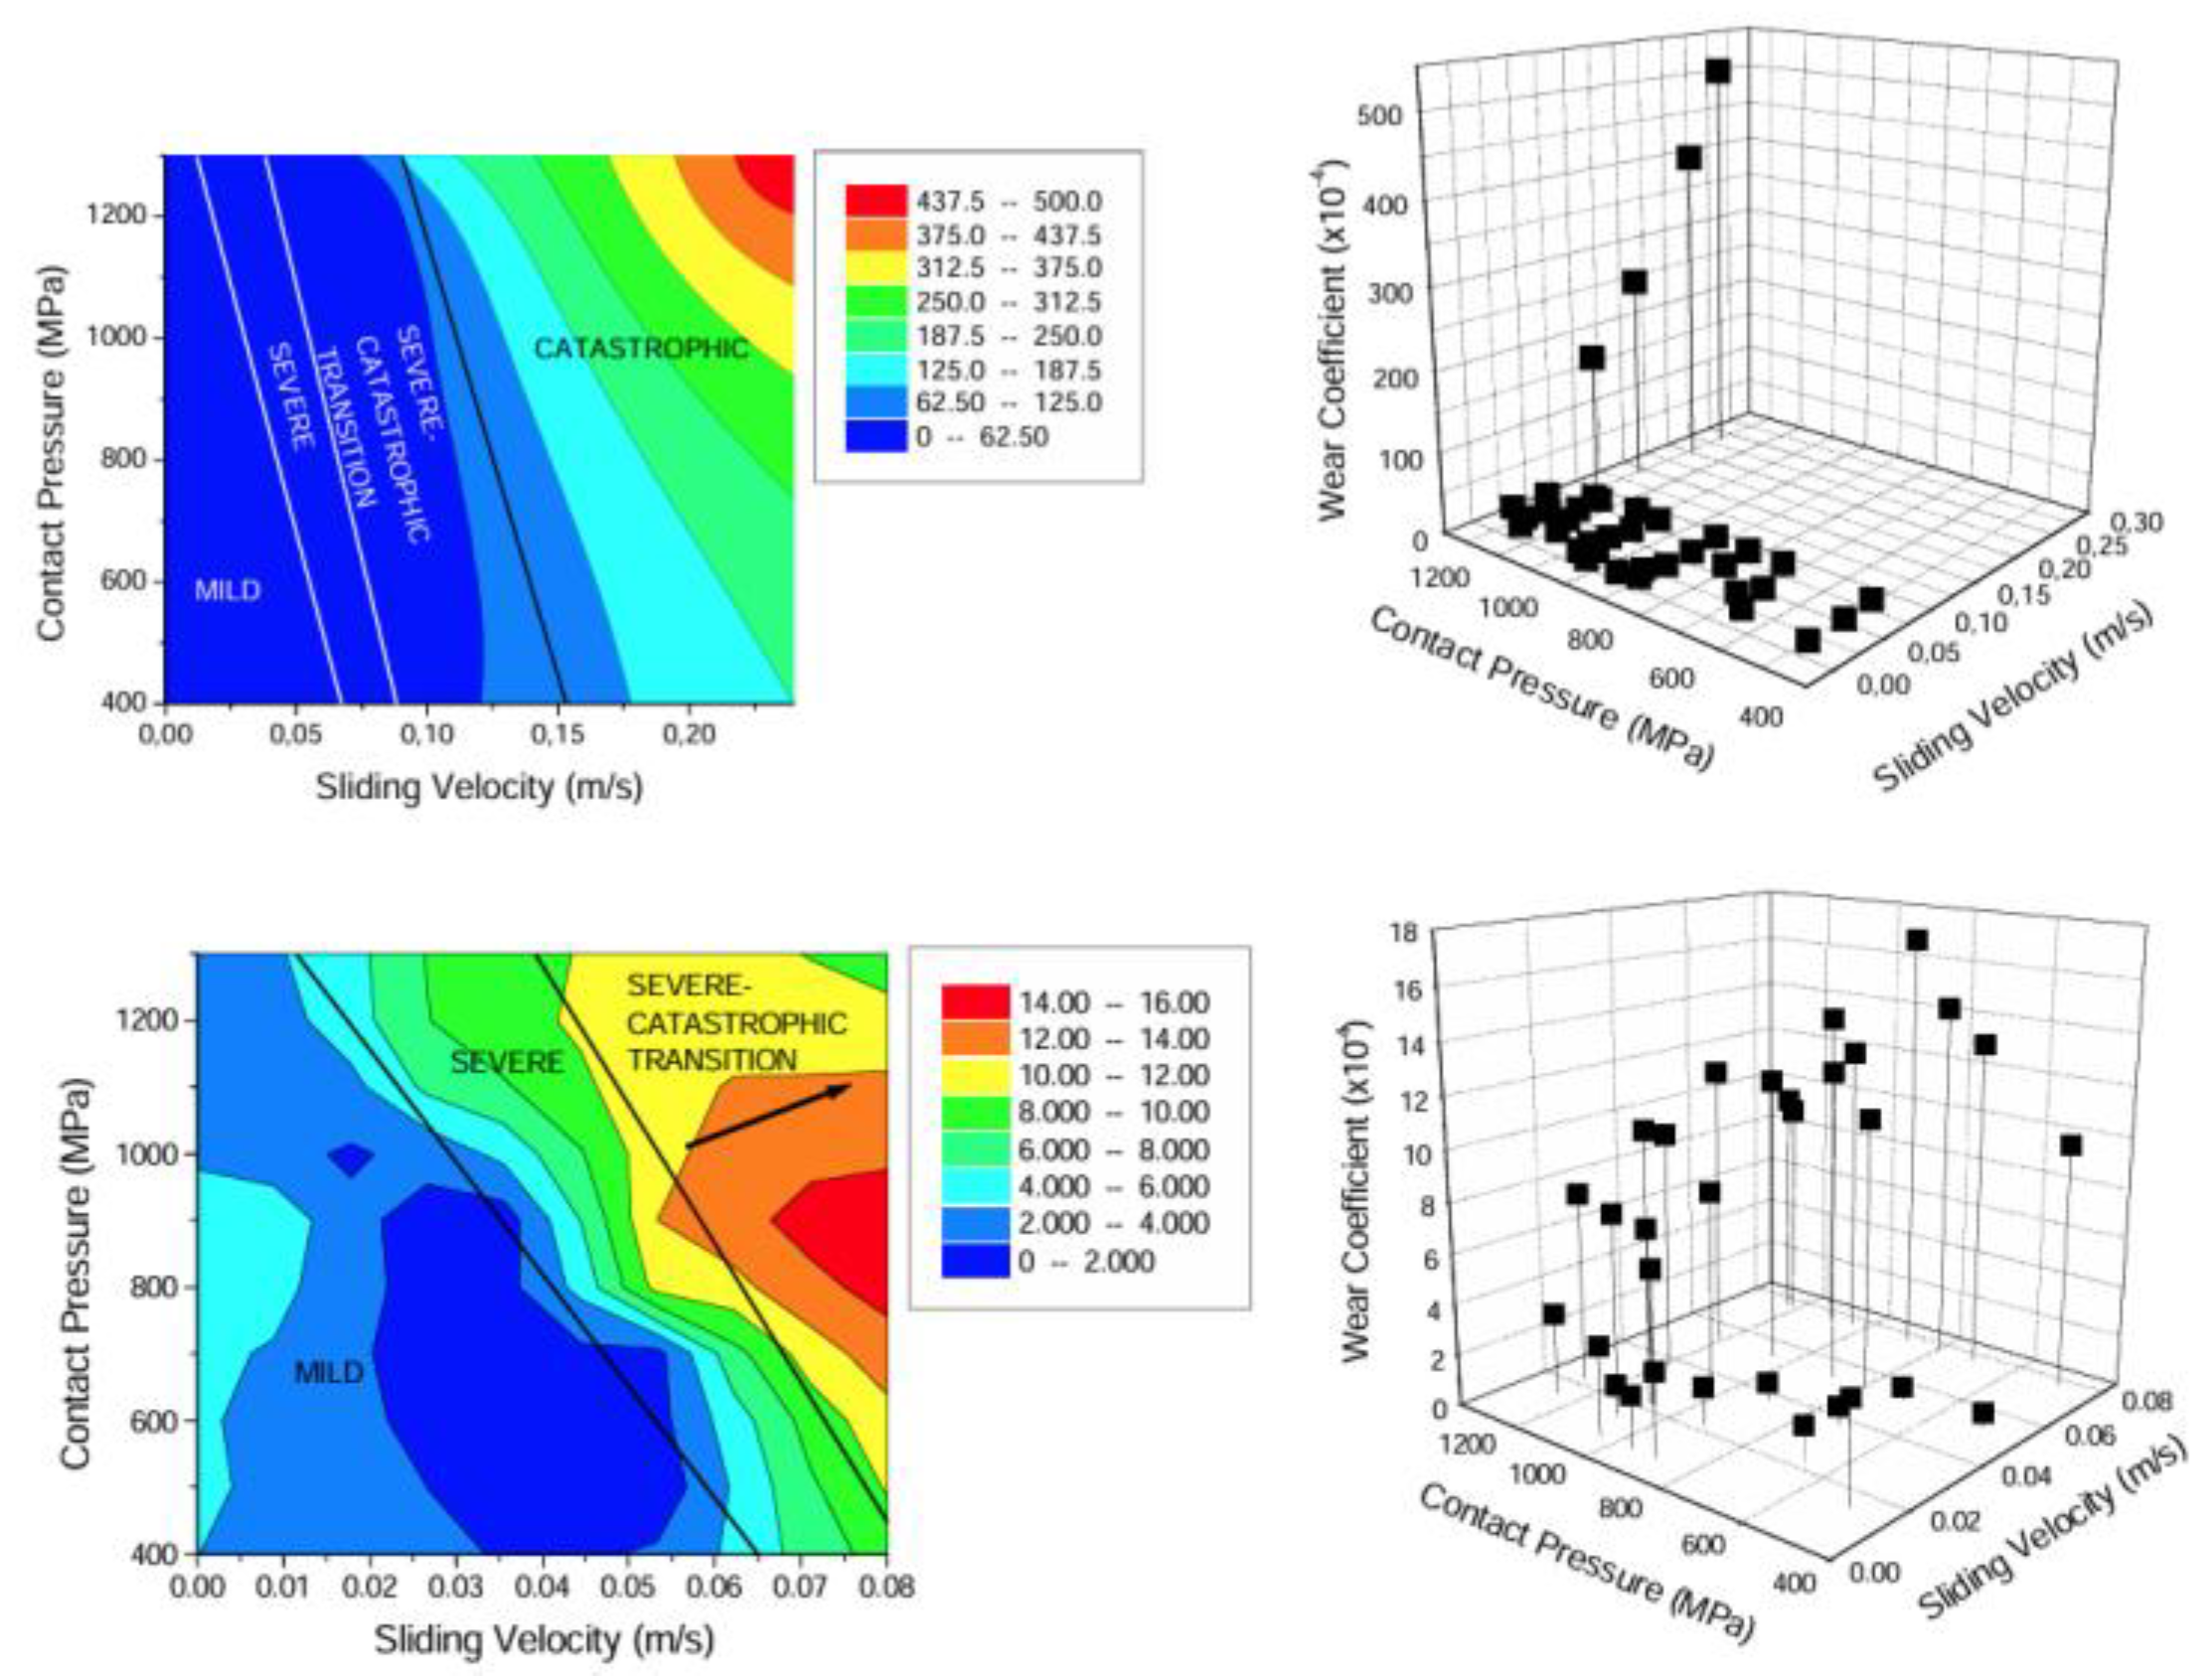
Figure 18.
Vehicle-track frictional rolling model in 3D. (a) Schematic diagram of the model. (b) FE model in 3D [79].
Figure 18.
Vehicle-track frictional rolling model in 3D. (a) Schematic diagram of the model. (b) FE model in 3D [79].
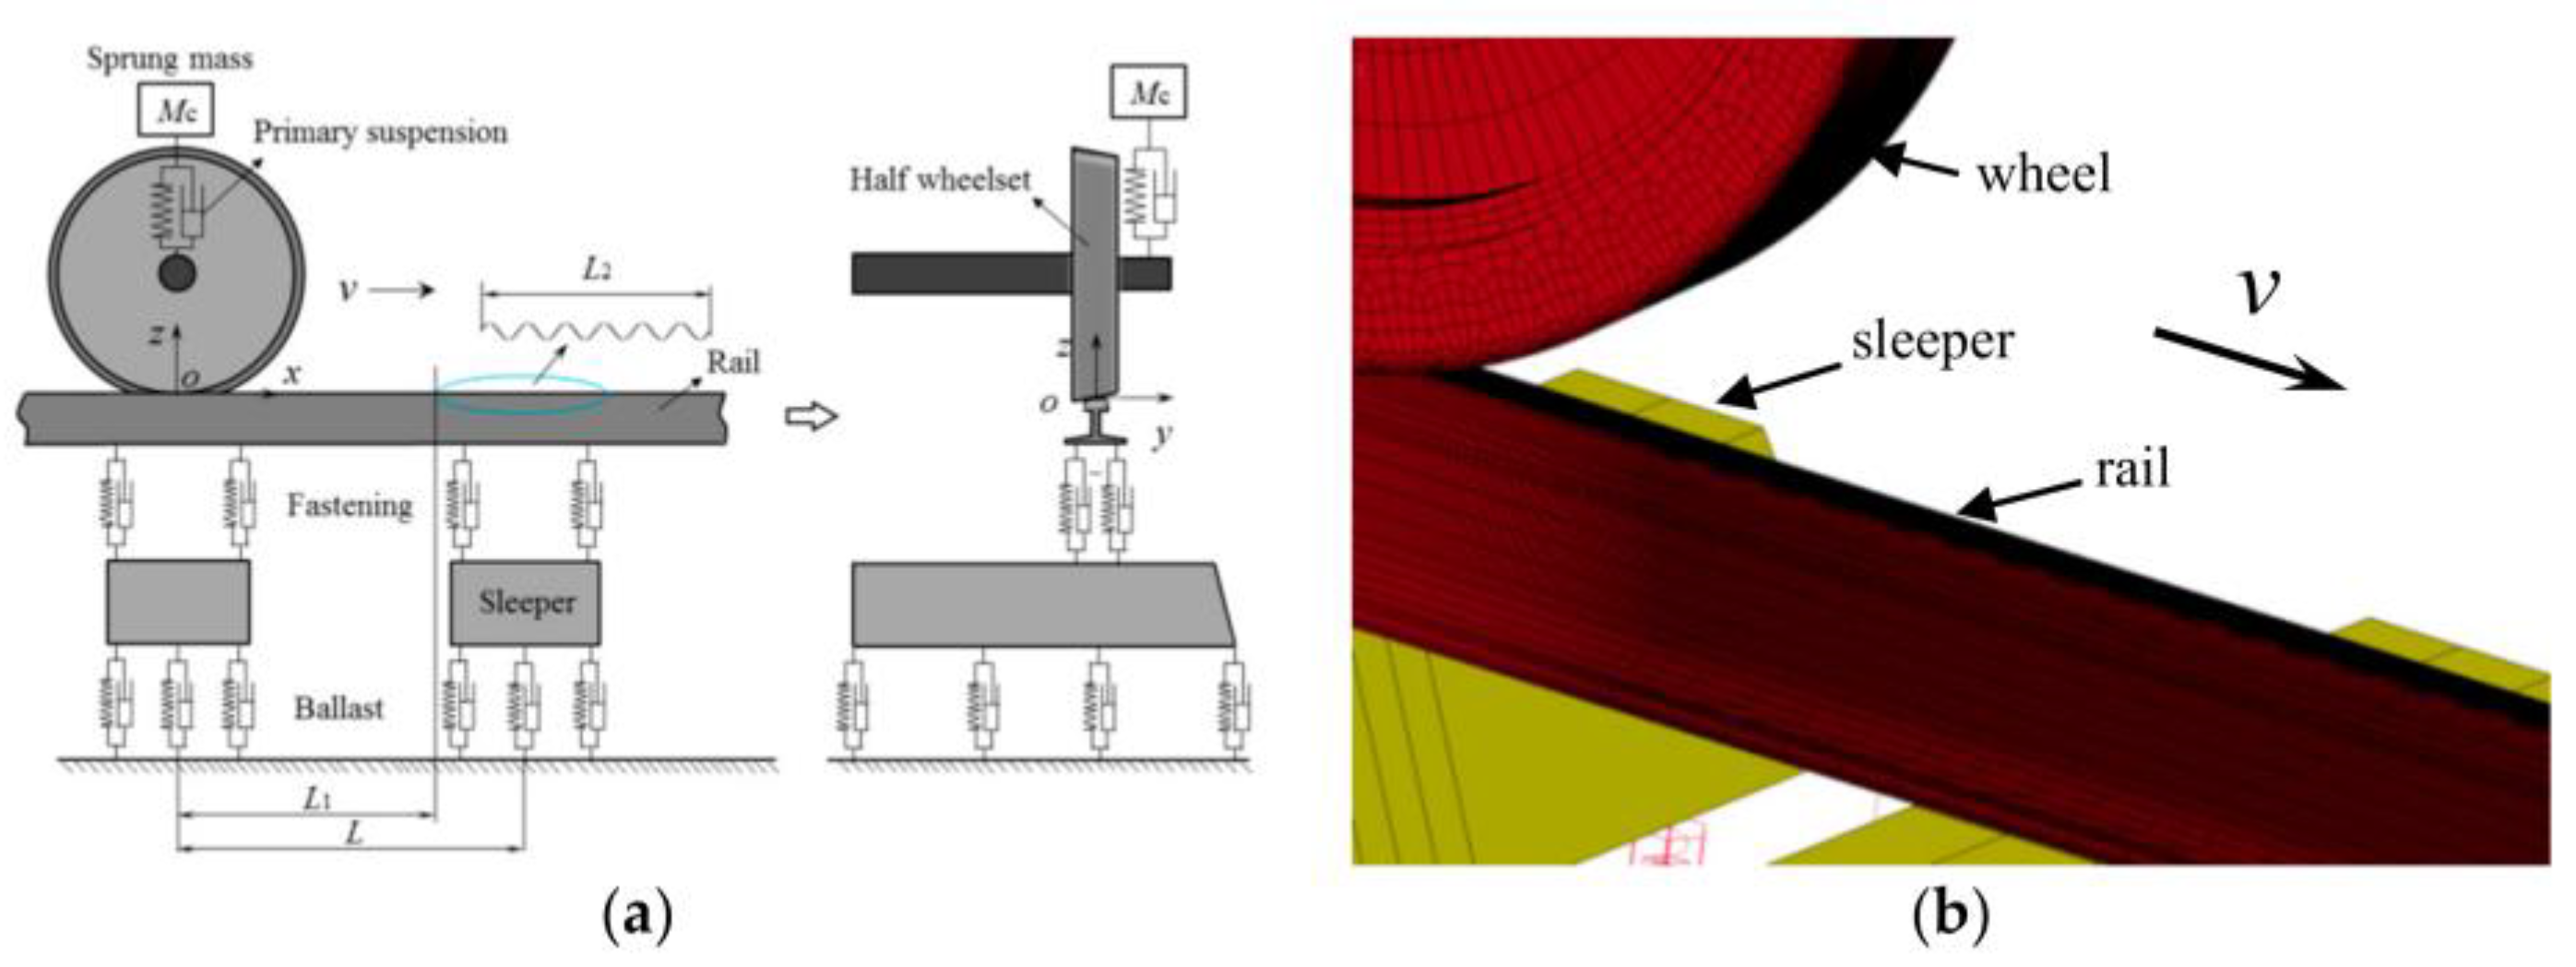
Figure 19.
Validation of the dominance of rail longitudinal mode on corrugation formation. (a) Corrugation on the track near Zoetermeer station, the Netherlands, and aclamp was made for the rail longitudinal excitation; (b) vertical FRFs of tracks with and without corrugation; (c) longitudinal FRFs of tracks with and without corrugation [81].
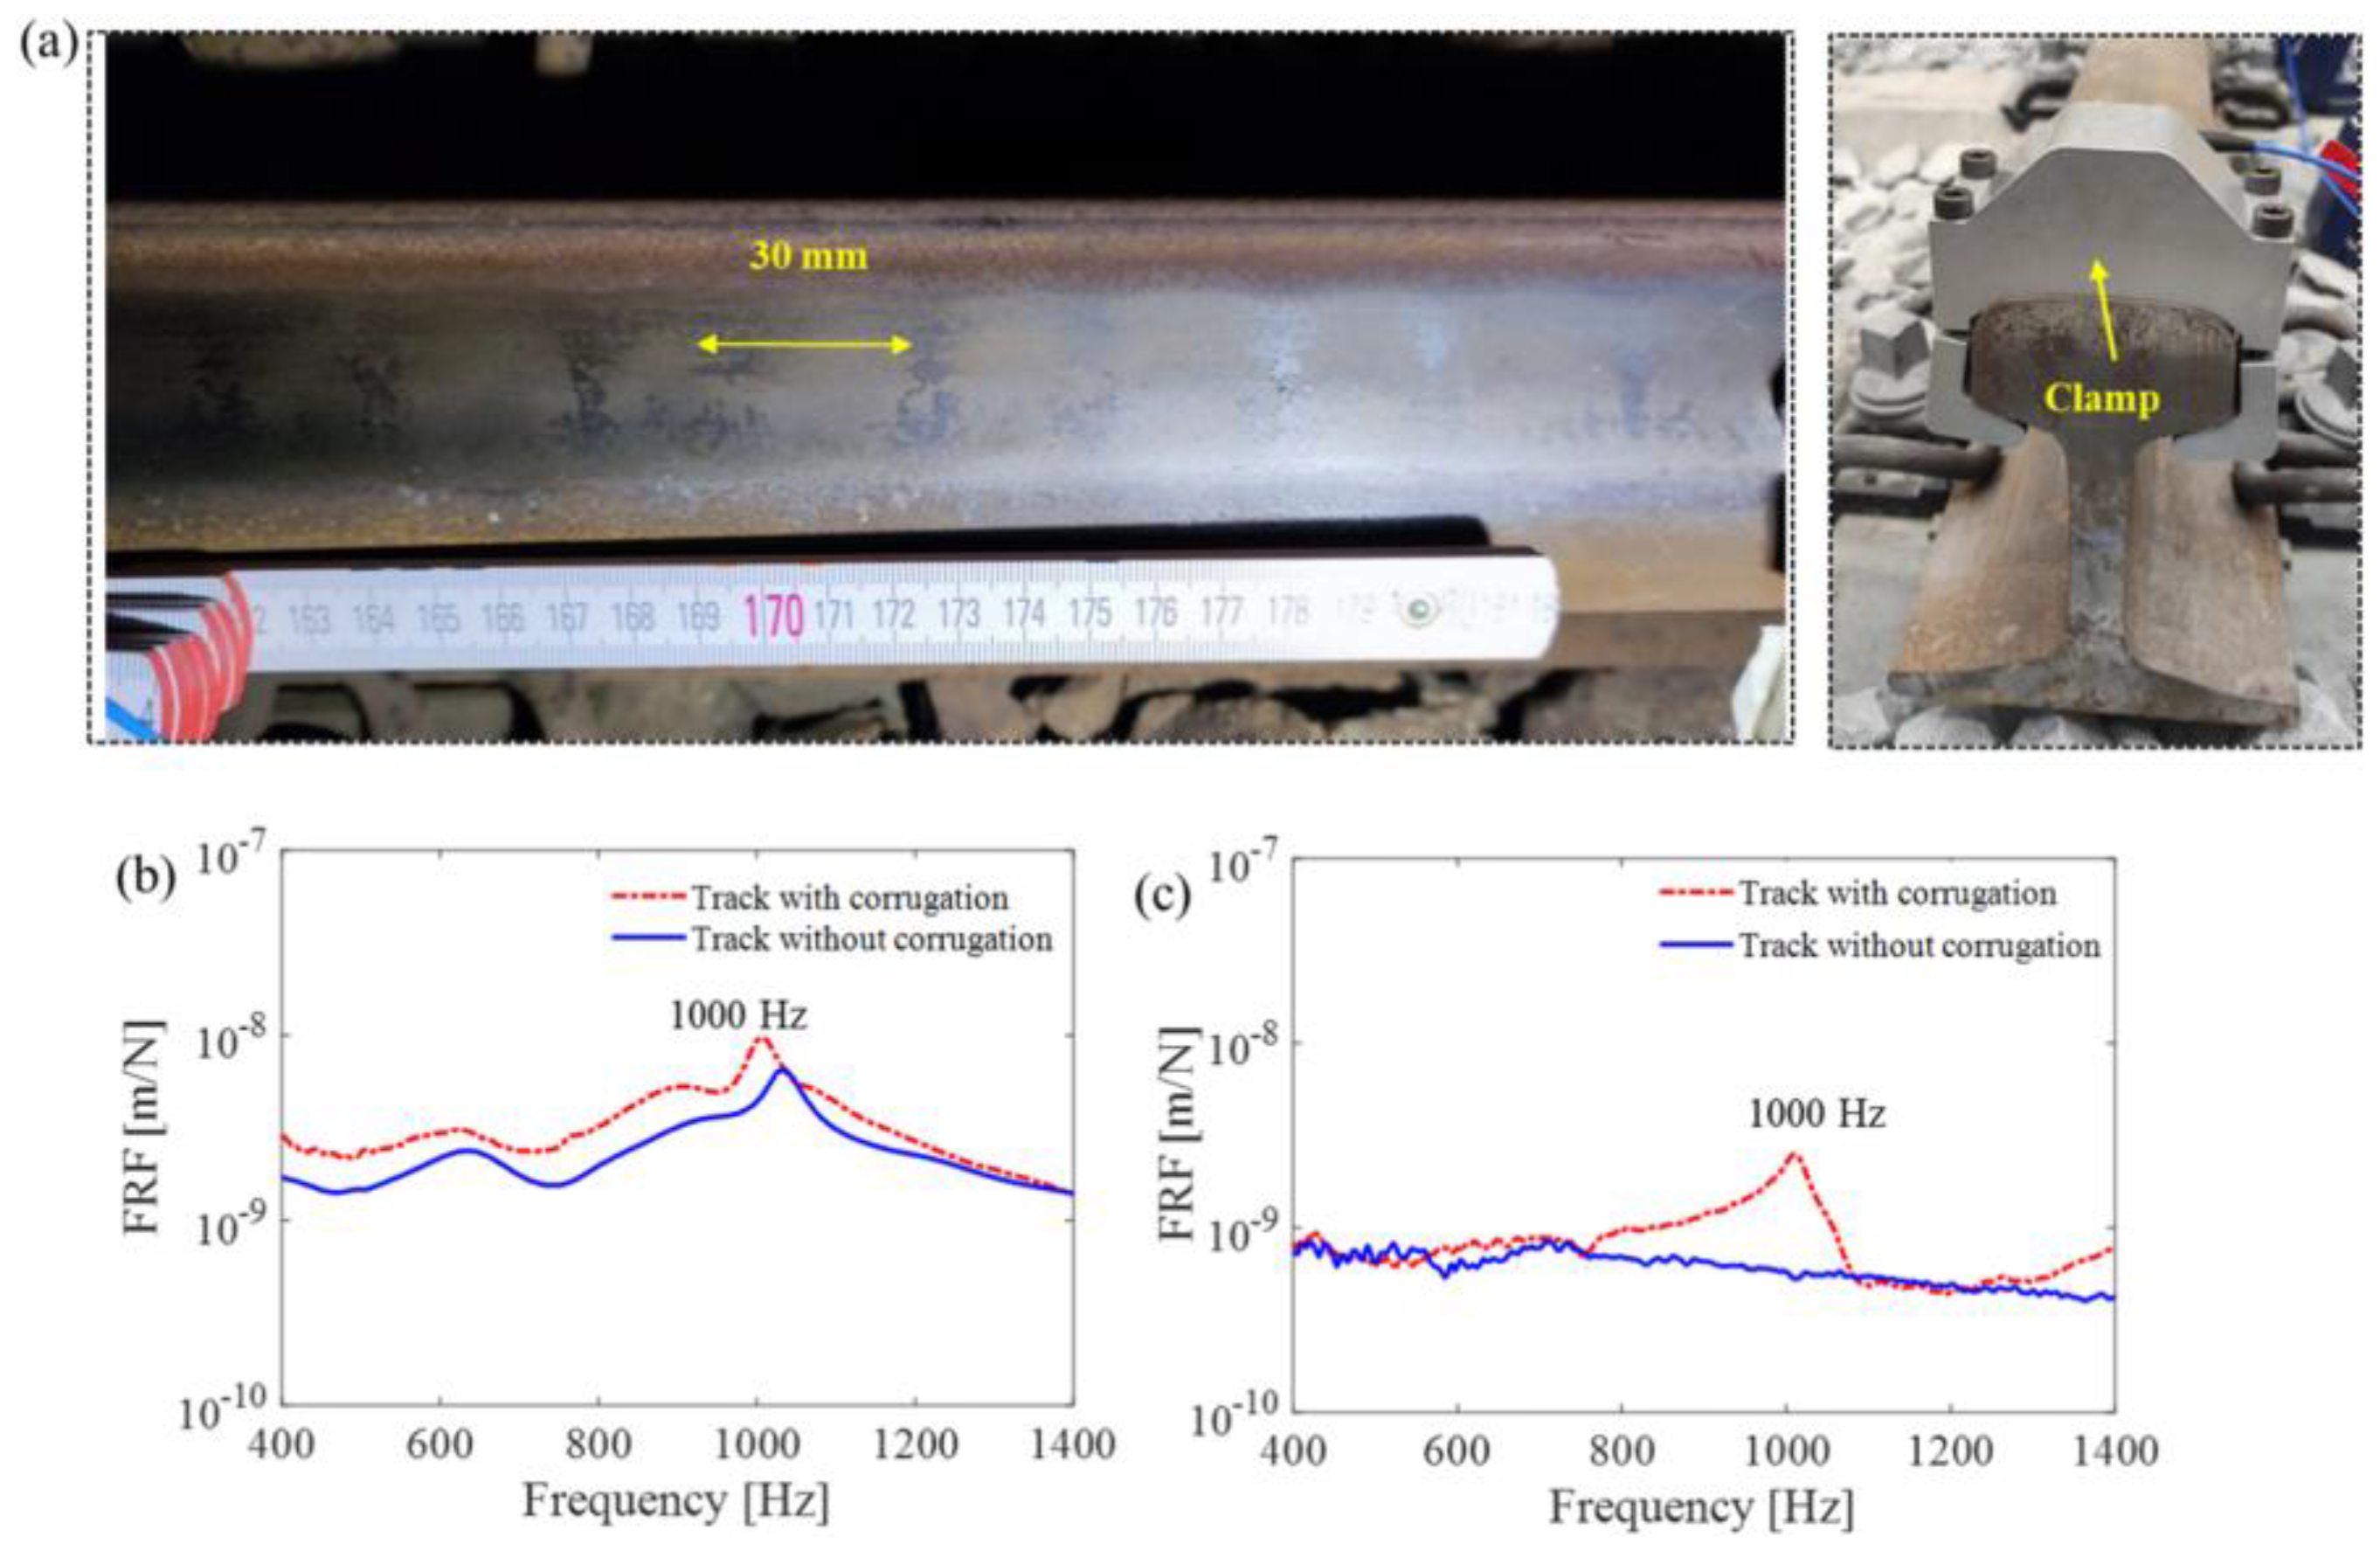
Figure 20.
A simple representation of standard-grade rail microstructure [17].
Figure 20.
A simple representation of standard-grade rail microstructure [17].
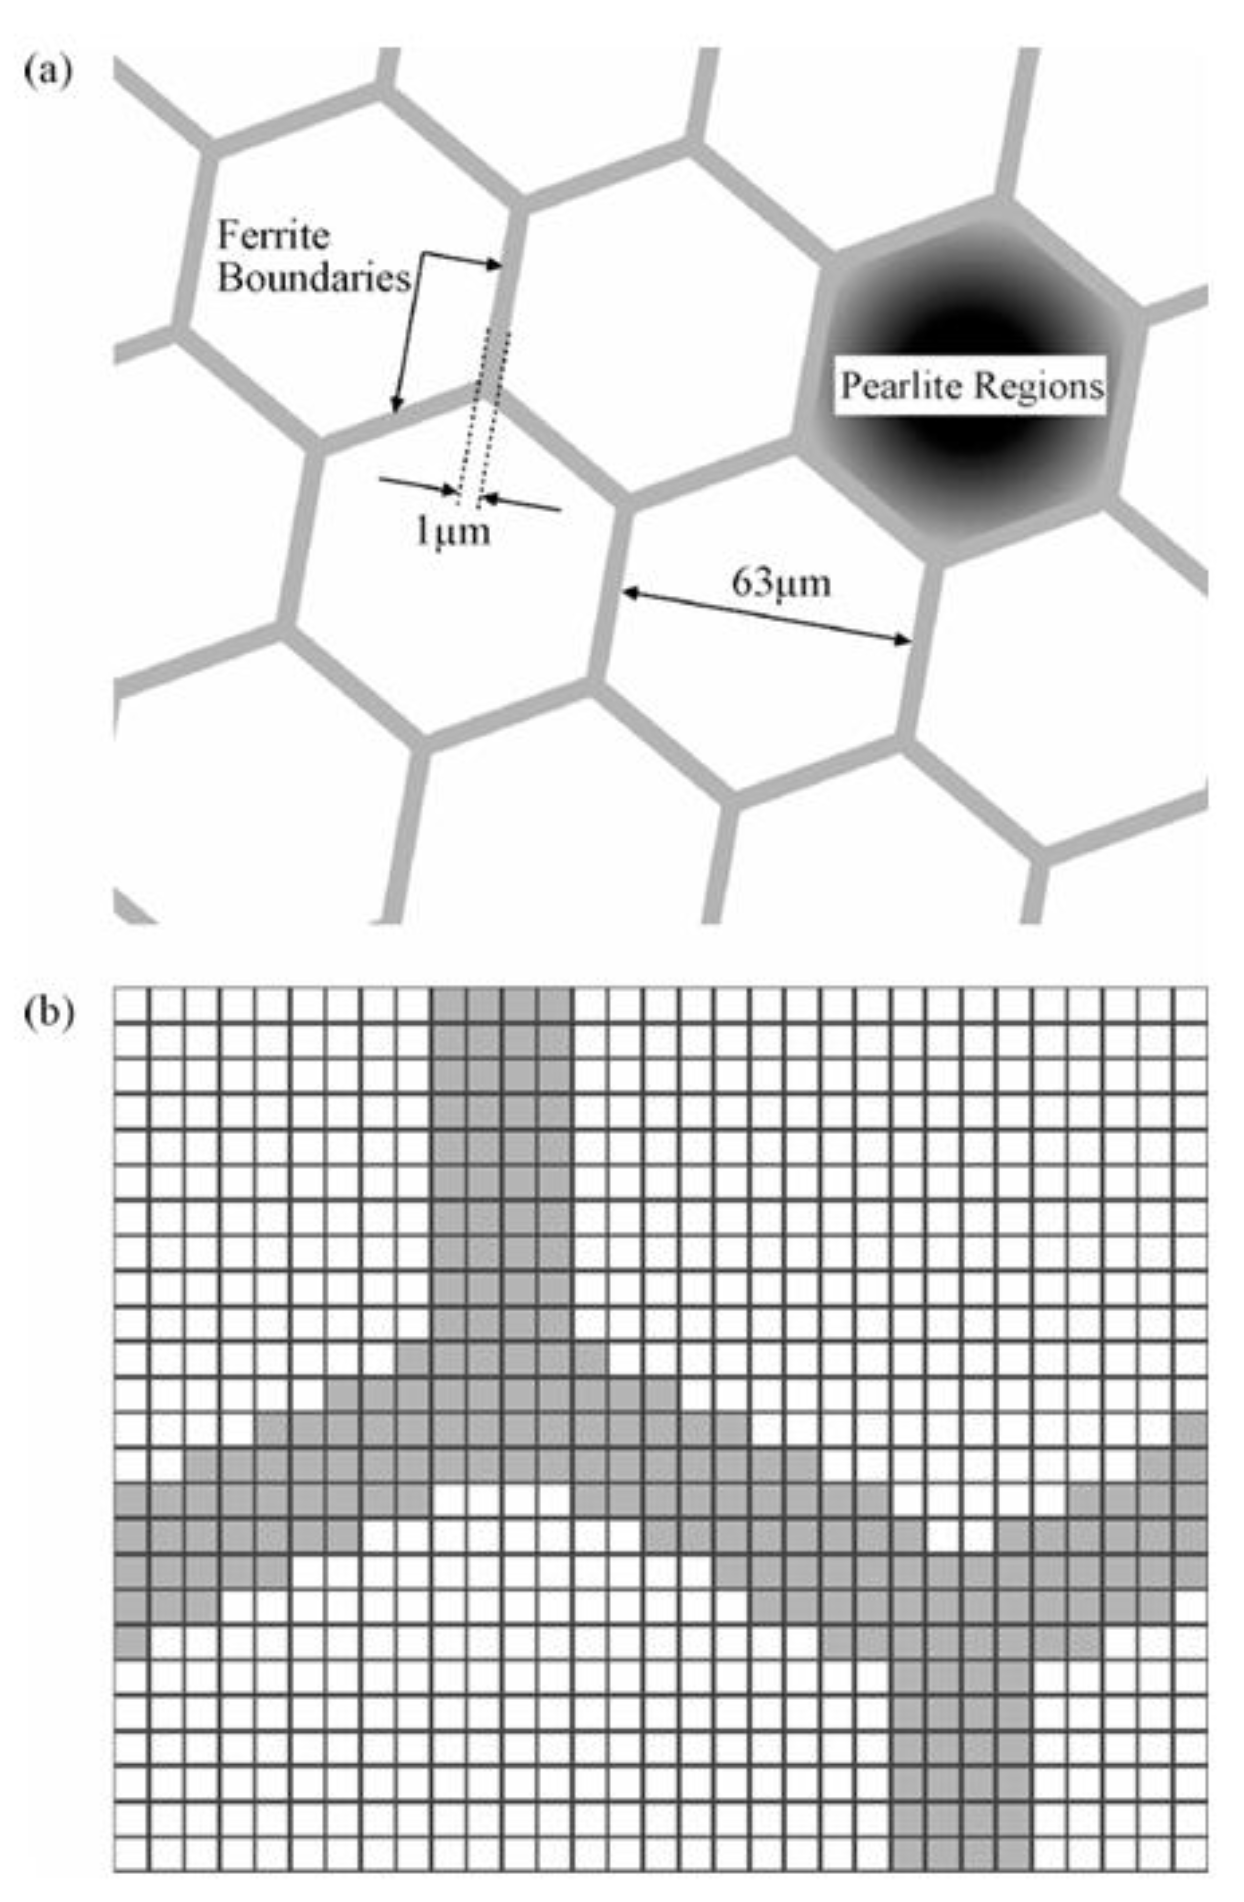
Figure 21.
A 256 × 256 image representing a two-material microstructure used as the basis for a 1,024 × 1,024 simulation; snapshots taken after 10,000 cycles with a peak contact pressure of 1,800 MPa. Light gray denotes pearlite, dark gray denotes ferrite, black denotes failed elements, and white denotes the locations from where elements have been removed due to wear. (a) Without shielding. (b) With shielding. (c) With shielding and deformation [17].
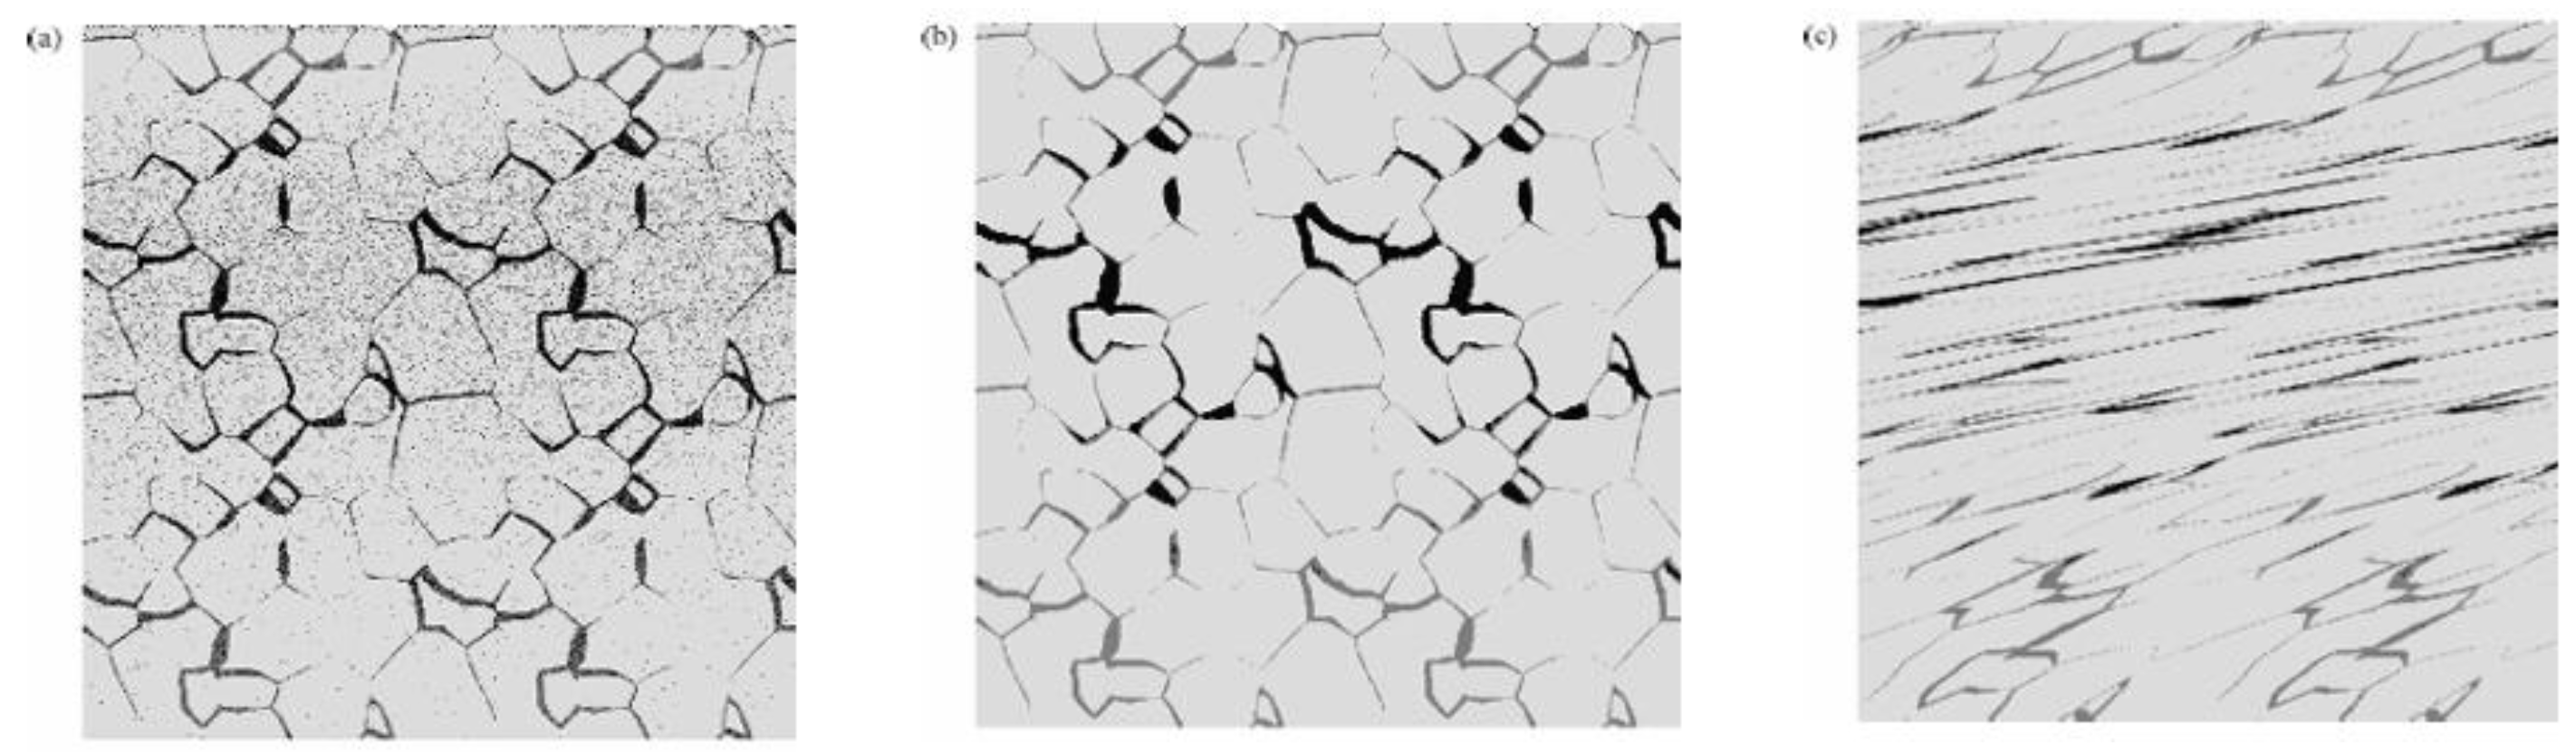
Figure 22.
Observed and modelled crack length [92].
Figure 22.
Observed and modelled crack length [92].
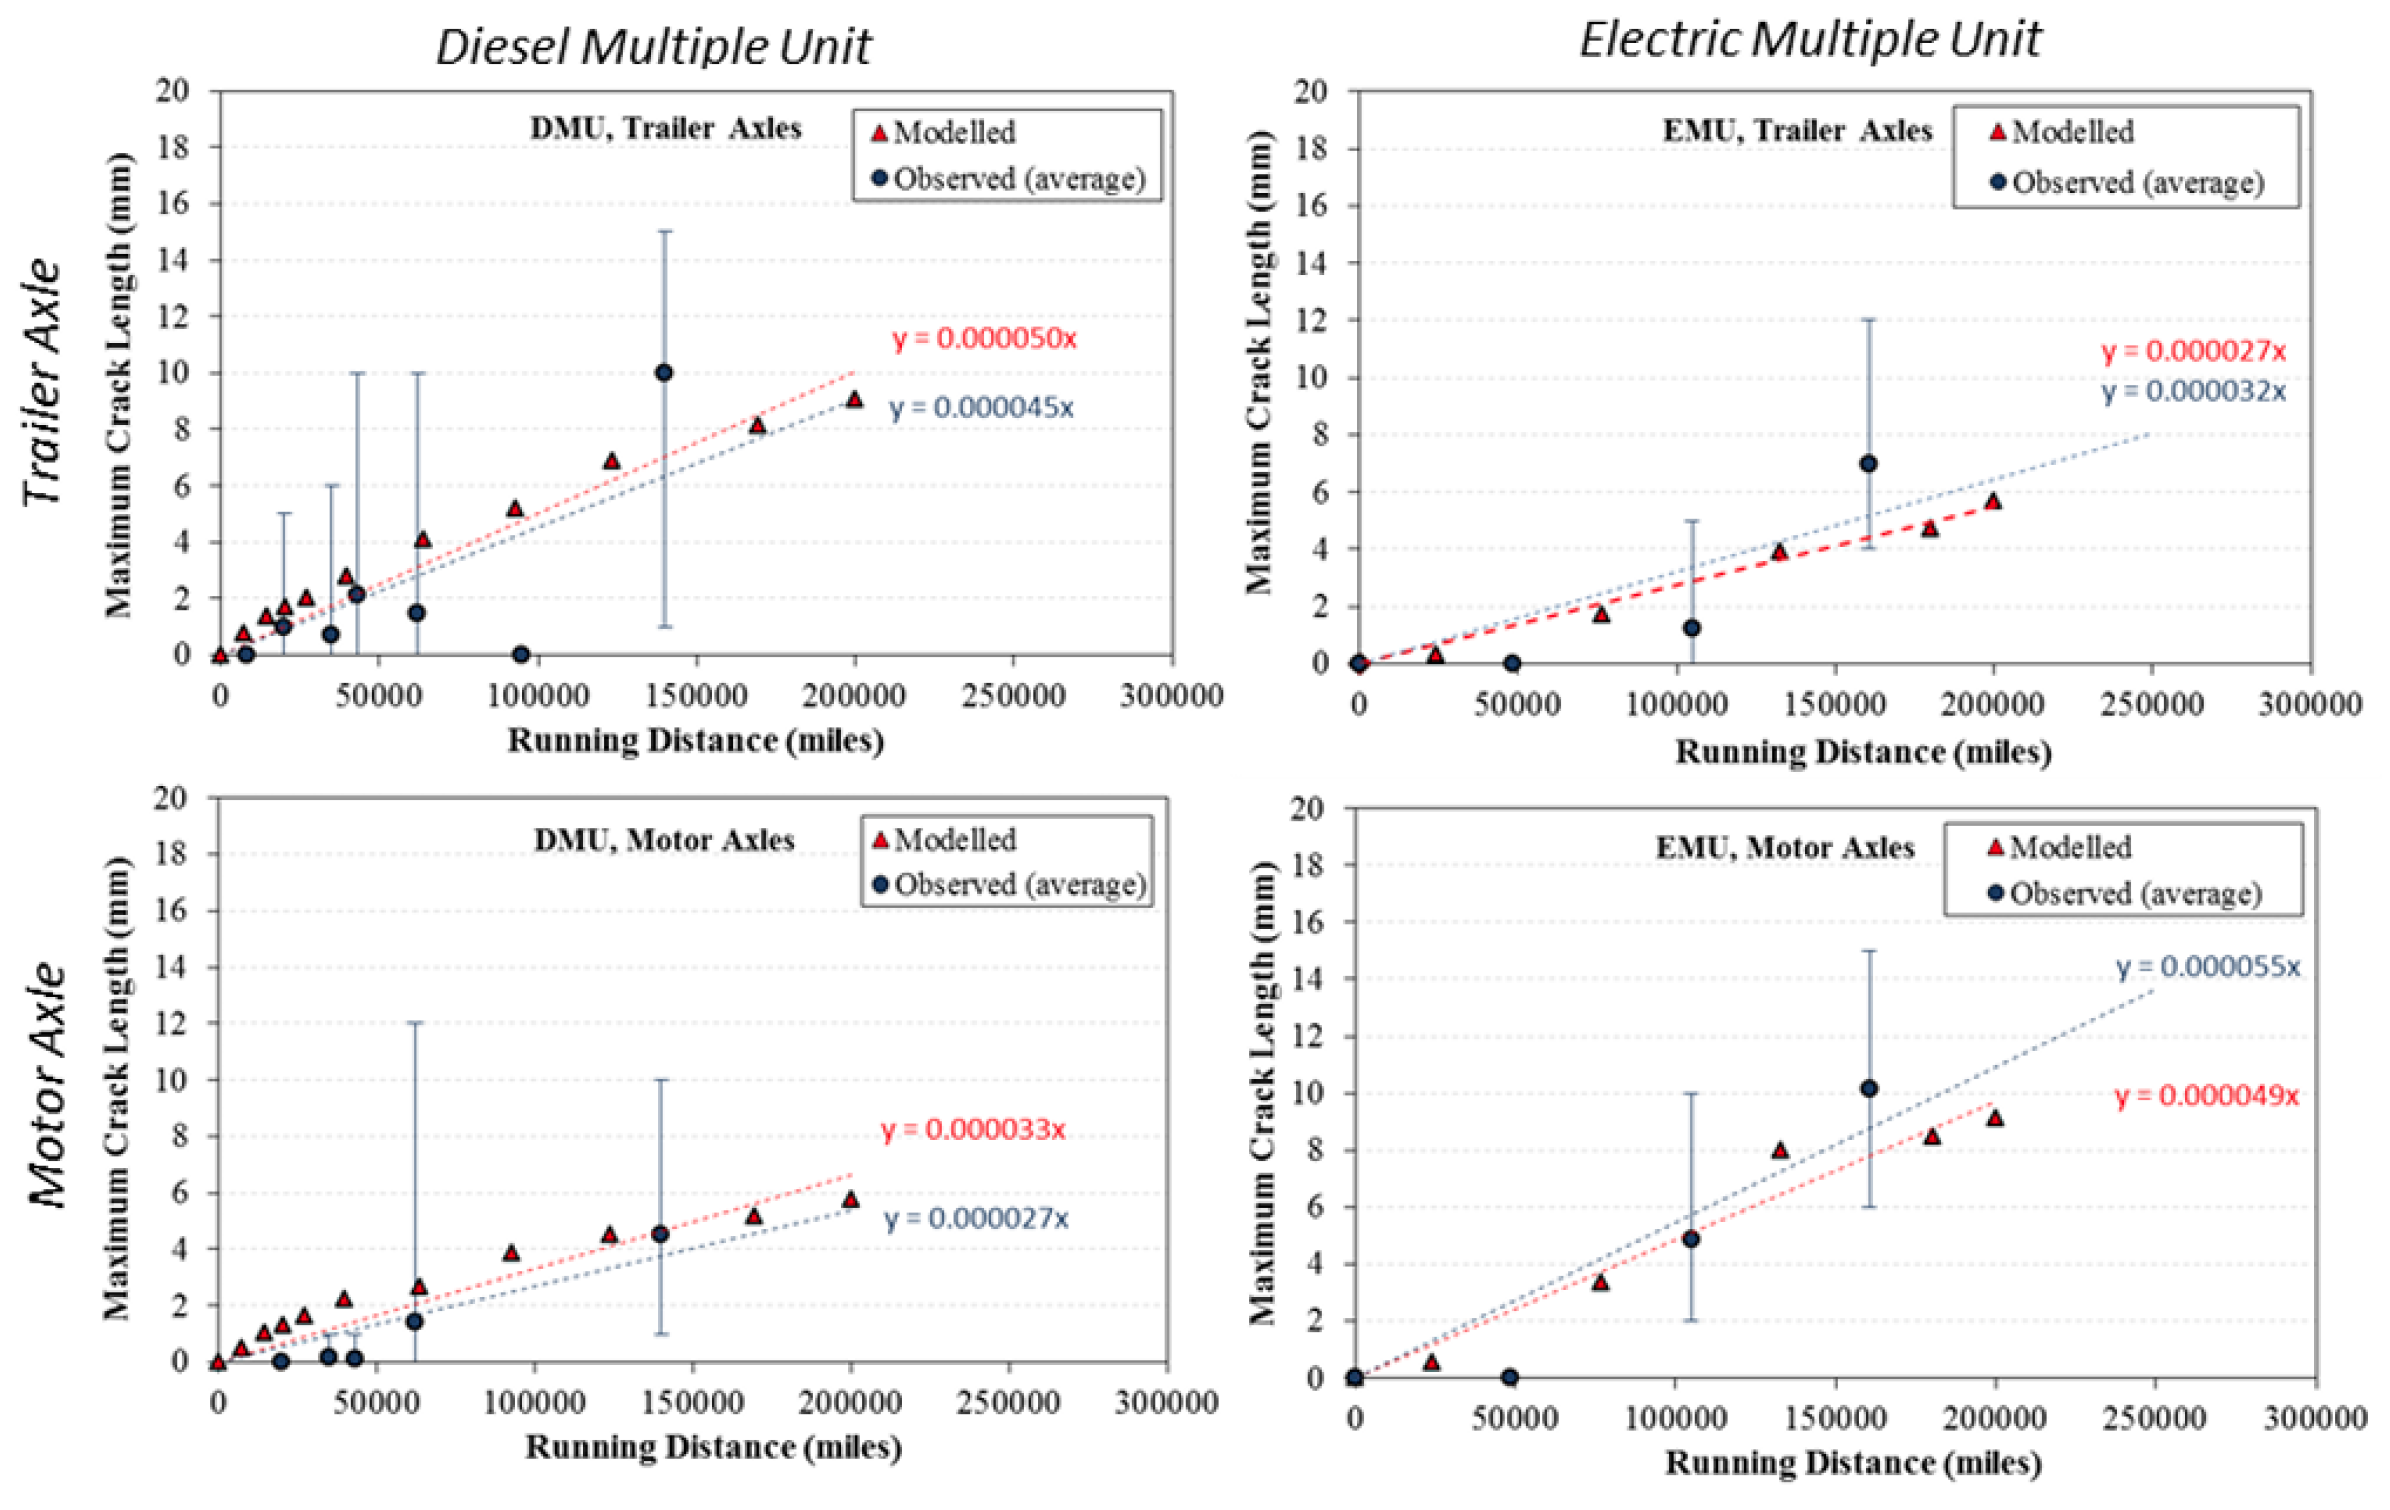
Figure 23.
Simulation results for the interaction between short fatigue crack growth and wear in the rail disc of twin-disc test : (a) initial; (b) after 5 × 10⁵ cycles; (c) after 1 × 10⁶ cycles [19].
Figure 23.
Simulation results for the interaction between short fatigue crack growth and wear in the rail disc of twin-disc test : (a) initial; (b) after 5 × 10⁵ cycles; (c) after 1 × 10⁶ cycles [19].
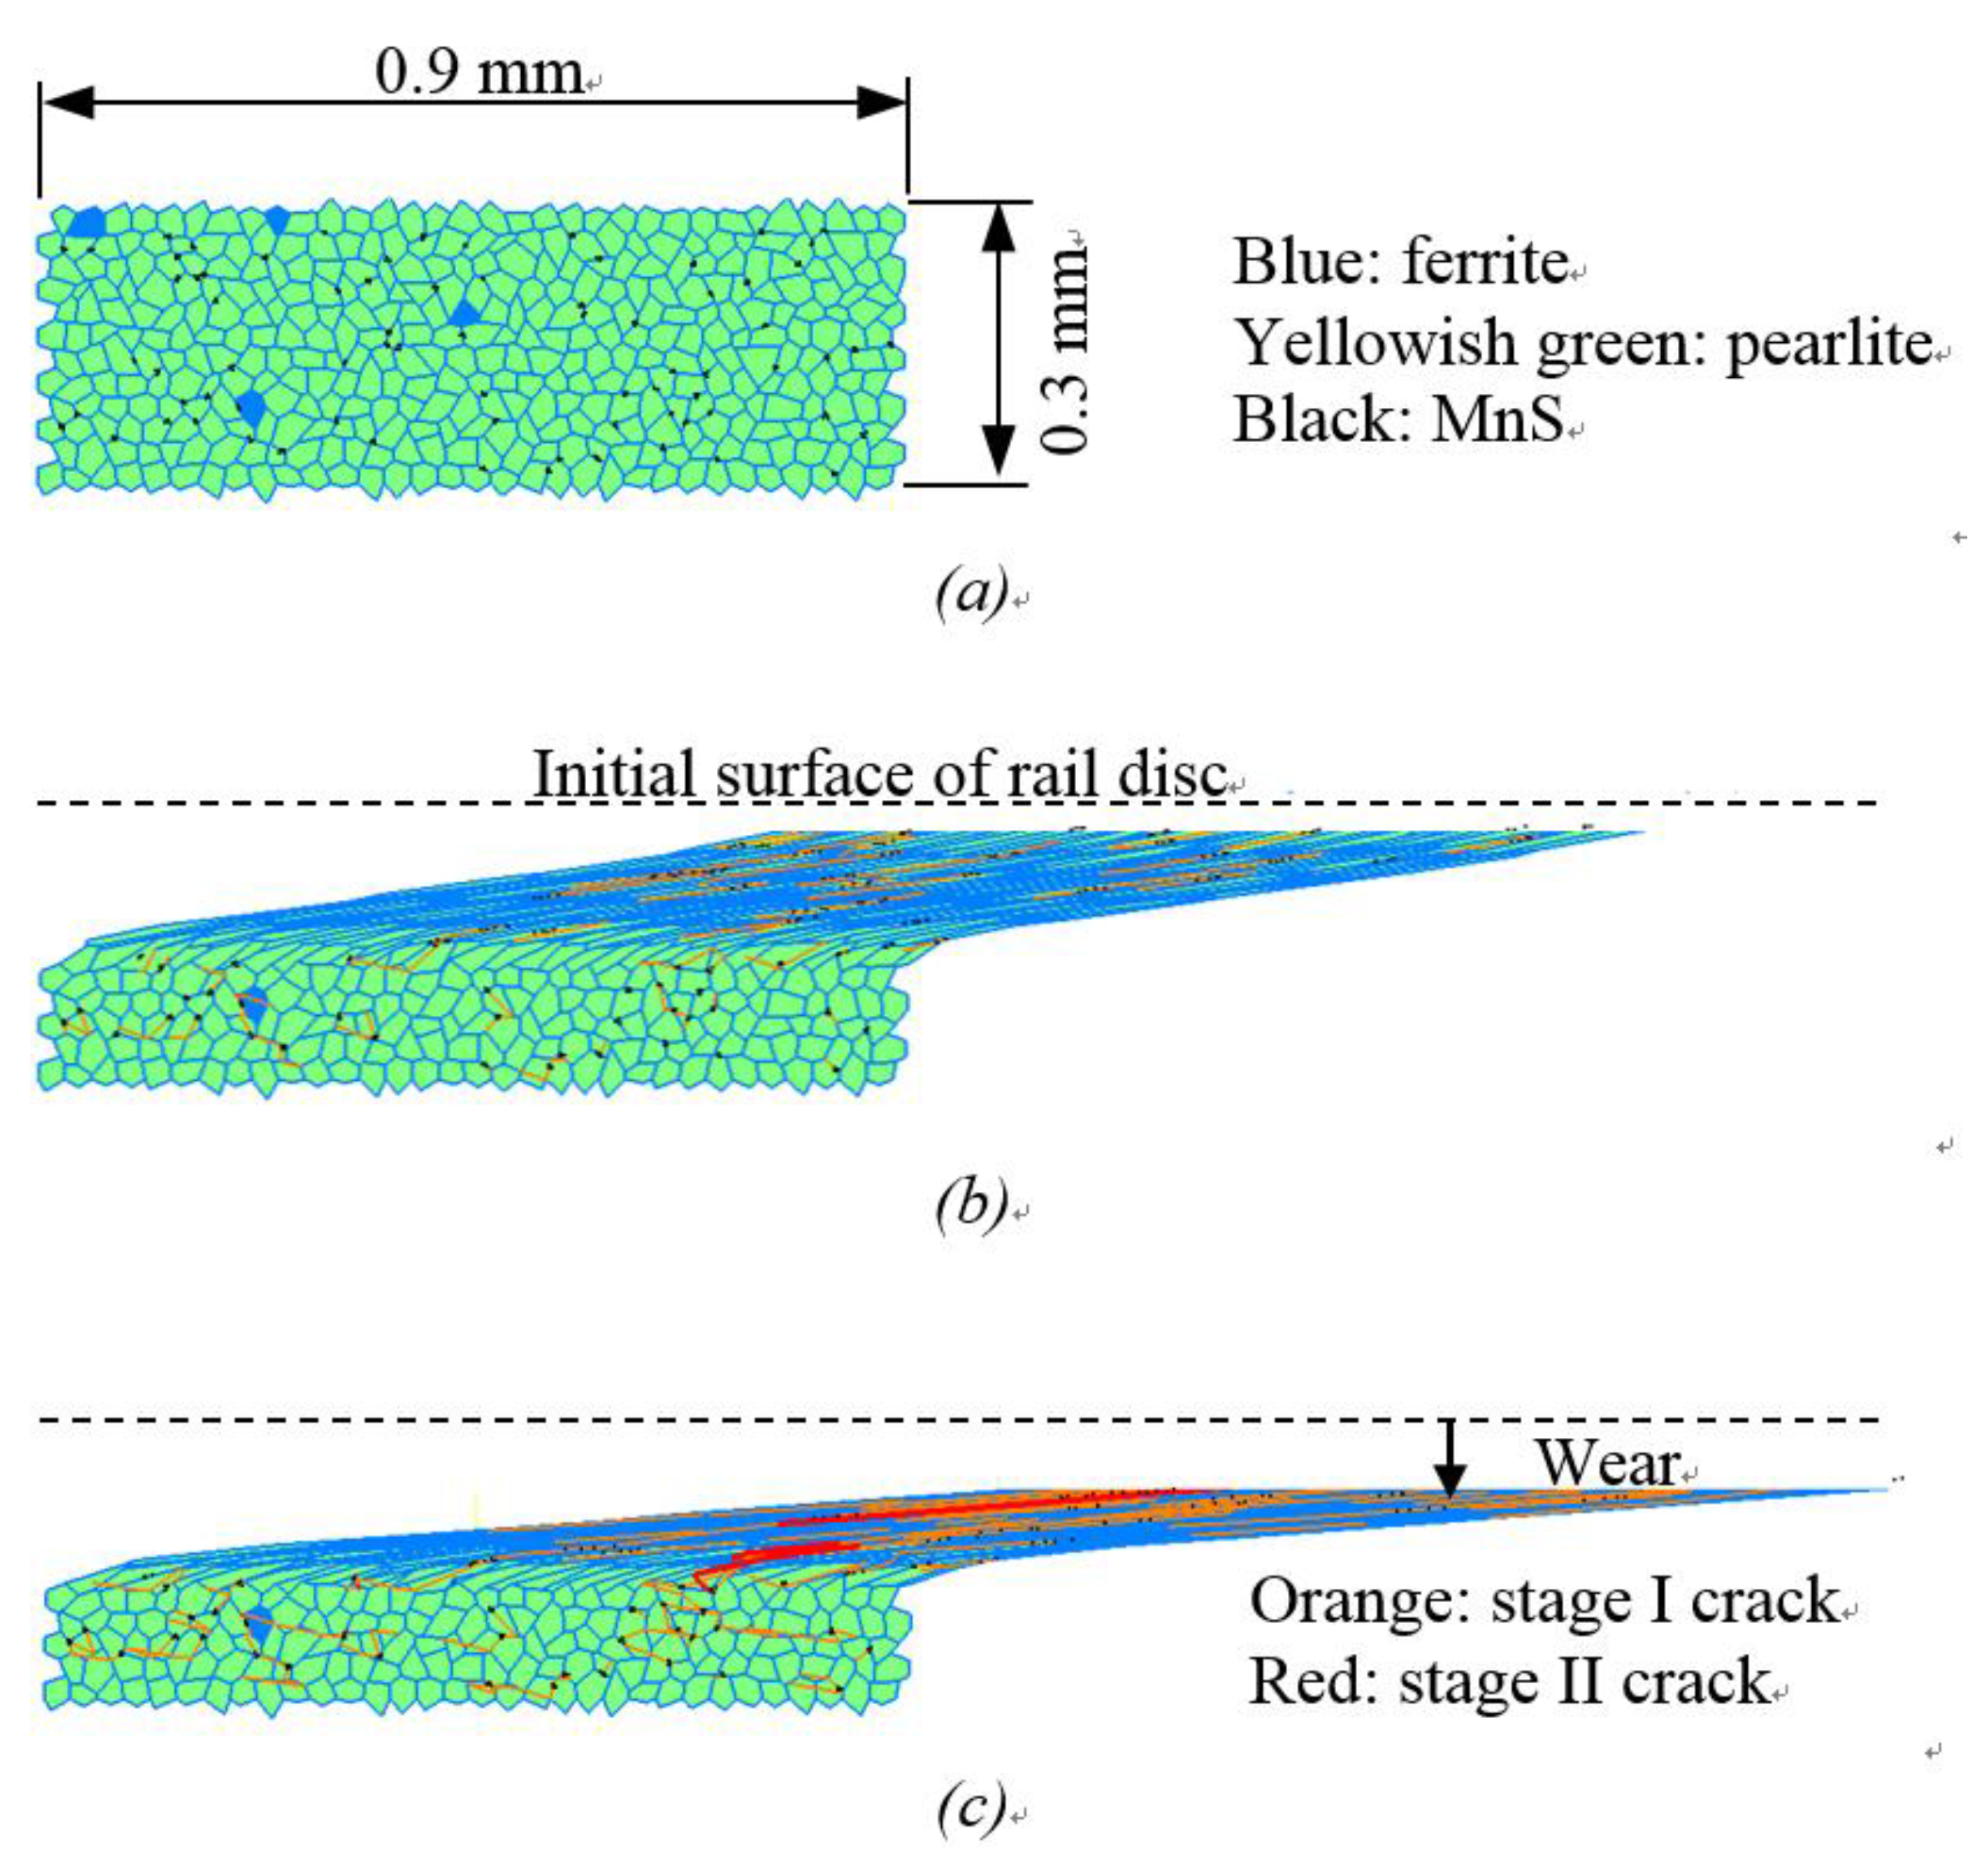
Figure 24.
Competitive relationship diagram of crack growth and wear rate, (a) wear dominated, (b) RCF dominated [102].
Figure 24.
Competitive relationship diagram of crack growth and wear rate, (a) wear dominated, (b) RCF dominated [102].
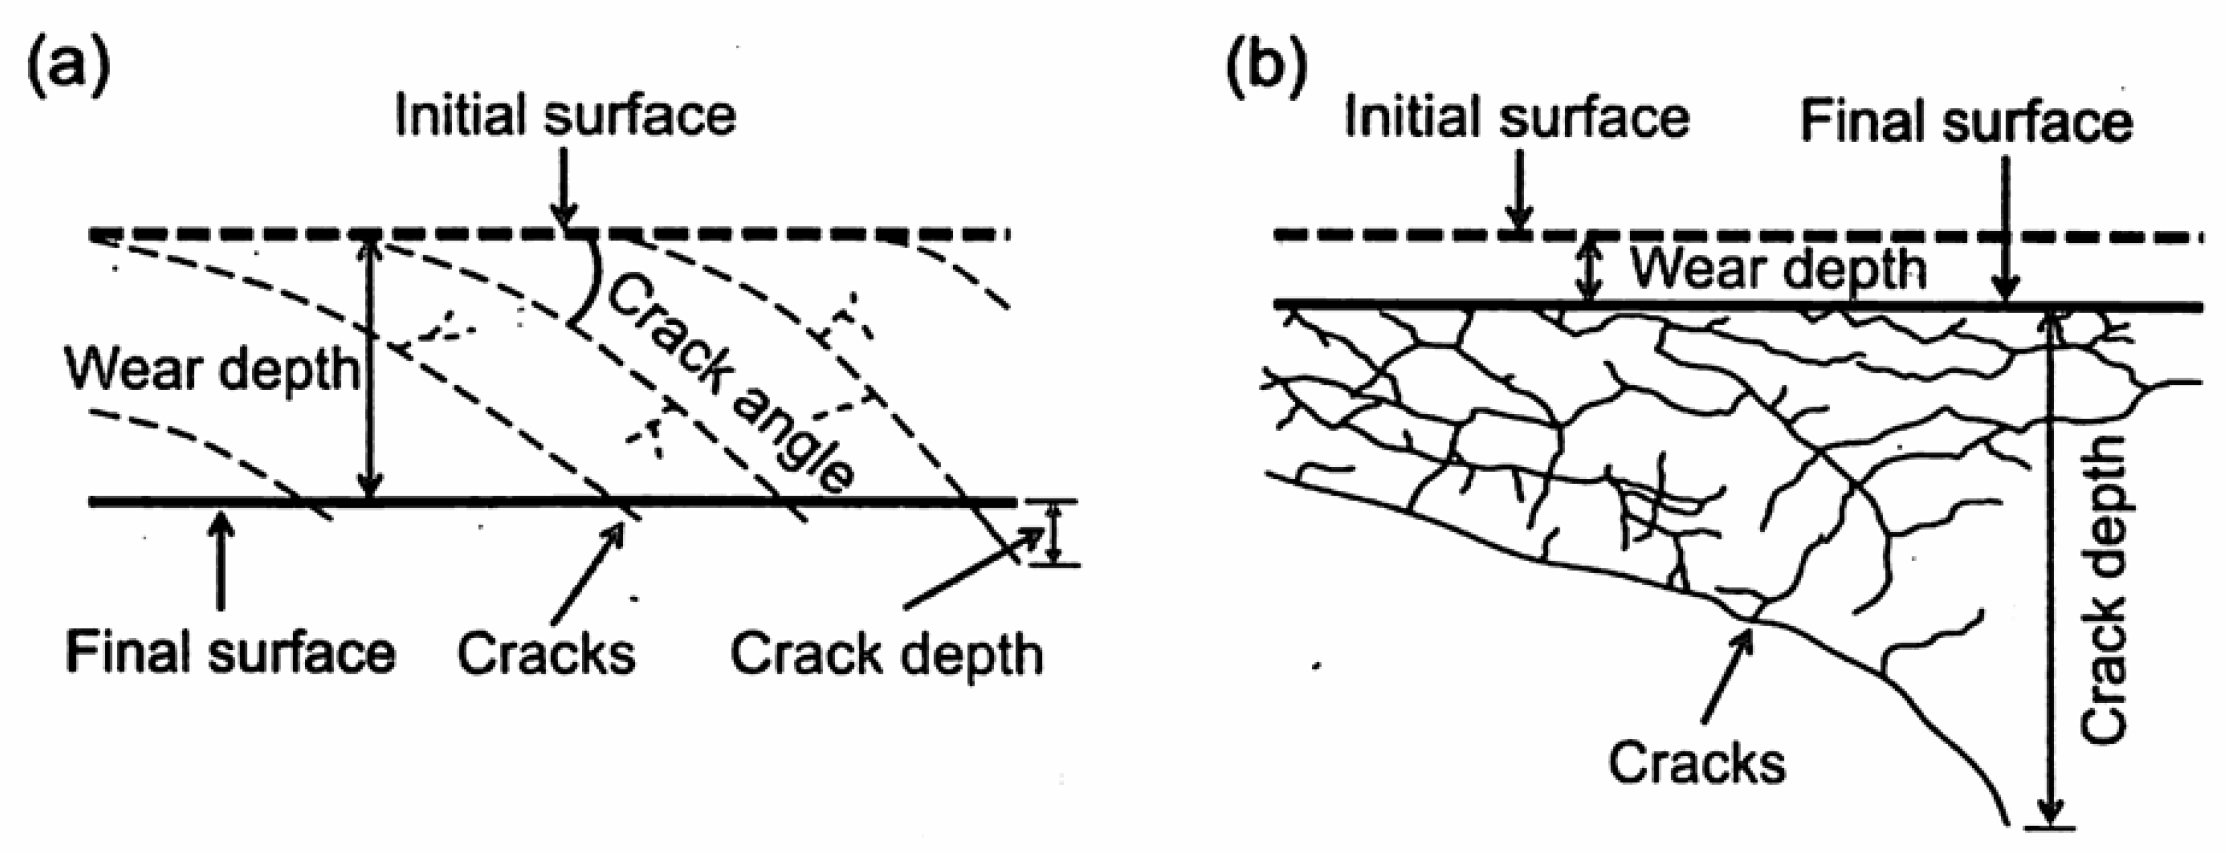
Disclaimer/Publisher’s Note: The statements, opinions and data contained in all publications are solely those of the individual author(s) and contributor(s) and not of MDPI and/or the editor(s). MDPI and/or the editor(s) disclaim responsibility for any injury to people or property resulting from any ideas, methods, instructions or products referred to in the content. |
© 2025 by the authors. Licensee MDPI, Basel, Switzerland. This article is an open access article distributed under the terms and conditions of the Creative Commons Attribution (CC BY) license (http://creativecommons.org/licenses/by/4.0/).
Copyright: This open access article is published under a Creative Commons CC BY 4.0 license, which permit the free download, distribution, and reuse, provided that the author and preprint are cited in any reuse.


