

Submitted:
06 August 2025
Posted:
07 August 2025
You are already at the latest version
Abstract
Background/Objectives: Frequent users (FUs) are defined as patients who repeatedly attend the Emergency Department (ED). This study aims to identify the clinical and social characteristics of FUs in a Local Health Authority in Rome and to quantify and compare the amount of variation in the probability of being FU attributable to General Practitioners (GPs) and Local Health Districts (LHDs). Methods The Healthcare Emergency Information System and an automated database of Lazio region residents were used for the collection of data on the patients' socioeconomic level, GPs, LHD and information about any chronic diseases. Different FU classes (visits ≥4, 5, 7 or 10) were considered in the descriptive analysis. Univariate logistic analysis and a logistic multilevel model were performed for inferential analyses. Results: A total of 89,036 individuals visited at least one of the 13 EDs included in the study. A total of 2.6% of the no FU group had mental illnesses, compared to 7.6% in the FU≥4 group. The OR for becoming an FU increased with the patient's clinical complexity. GP can play an important role in determining FU behavior, while no significant effect was found on the LHD level. Conclusions: This study allows the identification of potential predictive risk factors for disproportionate use of the ED and helps policymakers face the FU phenomenon.
Keywords:
frequent user
; emergency department
; Local Health Authority
; Rome
; socioeconomic level
1. Introduction
The Italian population, like the rest of the OECD Countries, has experienced an increase in chronic illness over the last few decades, with population aging being one of its primary causes [1]; despite significant improvements in the emergency care system, the increase in the number of fragile patients and their assistance needs have led to a rise in Emergency Department (ED) attendance [2,3]. In hospitals with insufficient inpatient bed availability, a rise in ED visits and the number of emergency patients requiring admission may increase the length of stay in the ED, leading to overcrowding and compromised ED performance. Reduced ED utilization has become a primary goal for new healthcare delivery models [4,5,6]. However, the predictors of ED attendance are complex and involve multiple components [7].
There is not a single FU definition, and it depends on the length of observation time. Frequent Users (FUs) are defined as patients who repeatedly attend the EDs, at least four times in a year [8,9,10,11,12,13]. Furthermore, FUs account for 4.5% to 8% of the ED population but comprise up to 28% of ED visits [10,14]. The overuse of EDs causes two major issues: the first is associated with extra ED activity expenditures, the weight of which is constantly out of the government’s budget limits in the public sector, particularly since the end of the COVID-19 pandemic emergency [15,16,17]. The second is the risk of compromising the quality of the ED services to patients with real acute issues and appropriate ED attendance. Furthermore, it increases the risk of overcrowding, raising the risk of human errors [8,9,18].
Previous research has highlighted how FUs are more likely to suffer from chronic diseases (particularly renal failure, cardiovascular disease, diabetes and chronic pulmonary disease), mental illnesses or substance use disorders [19,20]. The prevalence of chronic conditions is higher in FUs than in the rest of the population, and timely interventions in primary care could help avoid ED visits or hospitalization [21,22]. A growing body of evidence reveals that FUs have a high level of healthcare use (other than the ED), a connection with low socioeconomic level, and an association between the characteristics of their residence and health outcomes [19,21,22,23,24,25,26,27].
Like other countries, Italy has recently focused on improving care coordination and reducing ED attendance and hospital admissions by encouraging more appropriate use of community-based services [28]. Compared with other European contexts, a relatively high proportion of Italians report that they have unmet medical needs, and access to care is particularly difficult for Italians with lower socioeconomic level [29].
Analyzing the socioeconomic profile and the geographic variation in ED use may be a critical first step to drive local policies in reducing avoidable emergency department visits in Italy [30].
According to the literature, the prevalence of health problems is essential in ED attendance frequency. Nevertheless, other factors have also been associated with high levels of ED attendance [31,32,33,34], especially in the city outskirts or in inner city areas, such as in Rome, such as housing problems and employment status, loneliness and urban marginalization, low levels of social support, proximity to the ED, and poor access to primary care [35,36,37].
Shifting the frame of reference from macro areas to a more granular unit of analysis, i.e., census tracts, improves the identification of local hotspots with high healthcare use and shifts the focus to factors found among local populations and communities, providing insight into how to geographically target interventions for the improvement of healthcare delivery [38].
This study was carried out in Local Health Authority (LHA) Roma 1 (see Appendix), one of the three LHAs in the urban municipality of Rome, in the Lazio Region. It consists of 6 Local Health Districts (LHD 1, LHD 2, LHD 3, LHD 13, LHD 14, LHD 15) and 805 General Practitioners (GPs), has approximately 1 million residents and is one of the most populous areas in Italy, with 13 EDs (out of the 22 in the Rome metropolitan area), an aging index (the number of people in age group 65+ divided by the population age 0-14, per 100) of 202 in 2024 (the Lazio Region mean is 189,0) and an old age dependency ratio (the ratio of the number of people in age group 65+ divided by the population in the working age 15-64) of 38,1 in 2024 [39].
This study aims to identify the clinical and social characteristics of FUs and to quantify and compare amount of variation in the probability of being FU attributable to GPs and LHDs.
2. Materials and Methods
2.1. Study Design
This is a retrospective cohort study that included all ED visits from January 1, 2021, to December 31, 2021, in all 13 Emergency Departments within LHA Roma 1. All patients assisted by a GP from the same LHA were enrolled in the cohort. Patients younger than 18 years and those who attended single-specialism EDs (ophthalmology, pediatrics) and attendances for obstetric or gynecological problems were excluded since they represent a population with specific needs and peculiarities that is worthy of specific focus and not comparable with the general population.
FUs were defined using a cut-off of ≥4 visits per patient per year. Because of the absence of a universal definition of FUs, different cut-offs (visits ≥5, 7 or 10) were also considered in the descriptive analysis.
For each patient in the cohort the following risk factors potentially associated with the study outcome were considered: gender, age, socioeconomic level (high, middle-high, medium, middle-low, low) and the presence of chronic or multiple-chronic conditions [40,41]. The socioeconomic level was calculated at the census tract level, based on the methodology developed by Nicola Caranci and colleagues [42]. This index integrates multiple socio-economic indicators derived from national census data, including educational attainment, employment status, home ownership versus rental, household overcrowding, and family structure. It provides a composite measure of socio-economic disadvantage within small geographic areas. Among the multiple-chronic conditions group of patients, high clinical complexity was identified as a five-year mortality risk higher than 10%, based on the number and type of chronic diseases they suffer from [43].
Data related to ED visits were also compared to identify differences between FUs and no FUs. In particular, triage score, principal diagnosis group in the ED, and reported symptoms at the time of arrival were considered.
2.2. Data Sources
The cohort was enrolled from the Healthcare Emergency Information System, which collects all visits to emergency services, patient demographic data, visit and discharge dates and hours, ICD-9-CM diagnosis, reported symptoms on attendance, triage score (from no urgent to emergency), and status at discharge (e.g., dead, hospitalized, or discharged at home).
The cohort was linked to the automated system of databases of residents who receive NHS assistance in the Lazio Region, thus allowing researchers to obtain information related to chronic or multiple chronic diseases, GP and LHD of each patient, and socioeconomic level based on the residence address [42,44,45]. A deterministic record linkage procedure with anonymous identification codes was used to merge the data from different information systems. To preserve privacy, each individual identification code was subsequently and automatically deidentified, and the conversion table was deleted, giving researchers the access to only fully anonymized data.
2.3. Geographical Analysis
The administrative-territorial division of the LHA Roma 1 was used to analyze the association between the percentage of FUs and urban settings, as already performed elsewhere [46]. Each of the six LHDs of LHA Roma 1 is divided into Geographical Units (GUs, in Italy called “Zone Urbanistiche”), as defined by the Municipality of Rome. It is the smallest territorial level for which population data are available in Italy and many other countries [47,48].
2.4. Statistical Analysis
The response variable is binary (FU>=4 vs no FU). Frequency distributions of FUs (visits ≥4, 5, 7 and 10) by triage, principal diagnosis and declared symptoms at ED arrival were compared to no FU. A descriptive analysis was performed reporting absolute frequencies among patient groups and characteristics of ED attendances. Univariate logistic analysis was used to identify candidate predictor variables among those collected in the dataset. A logistic multilevel model (patient < GP< District) was performed to quantify the variability in ED FU behavior attributable to LHDs and primary care physicians and to identify the role of social and clinical determinants (gender, age, socioeconomic level and presence of chronic or multiple-chronic conditions).
Age was considered as a continuous variable, the Box-Tidwell test was used to check for linearity between the “predictor” and the logit. The role of individual variables was expressed as Odds Ratios (OR); the variance components - estimated by multilevel models - were expressed in terms of Median Odds Ratios (MORs). The MOR quantifies the variation between clusters by comparing two persons from two randomly chosen, different clusters. Consider two persons with the same covariates, chosen randomly from two different clusters. The MOR is the median odds ratio between the person of higher propensity and the person of lower propensity. This measure is always greater than or equal to 1.00. If the MOR is 1.00, there is no variation between clusters. If there is considerable between-cluster variation, the MOR will be large[50]. The MORs were estimated for the “empty” model, which only includes a random intercept, and the complete model, which includes all patient risk factors. SAS (SAS Institute Inc., North Carolina) software was used for statistical analyses.
3. Results
3.1. Descriptive Analysis
In 2021, 89,036 people attended at least once in any one of the 13 EDs within the LHA Roma 1. The characteristics of patients and ED attendances are summarized in Table 1 and Table 2. A total of 72,781 patients had a GP in the LHA Roma 1. Patients cumulatively had 99.811 attendances. FUs represented a tiny fraction of the overall population (2.7%) but were responsible for a large portion of attendances (11.3%). Among no FUs, females accounted for 51.9%, while males were more frequent among FUs (between 51.9%, for FU>=5, and 57.7%, for >=10) than among no FUs (48.1%). The age class 50-59 was the most frequent among no FUs (18.4%) and FU≥4 (17.5%) and rose with the growth of FU attendances. The socioeconomic level was low among most of the FUs (from 25.3% of FU≥4 to 24.6% of FU≥10), while high and medium-high levels were found in the no FU class. Multiple chronic conditions were present in 29.4% of FU≥4 patients, while 47.6% of FU≥4 patients did not have chronic disorders registered.
Table 2 was realized after having first classified the patients based on the number of visits to the emergency room. Emergency and urgency triage codes decreased from 24.9% in the FU≥4 group to 20.9% in the FU≥10 group. In contrast, non-urgency codes increased from 8.1% in the FU≥4 group to 14.4% in the FU≥10 group. The main diagnoses among all the patients belonged to the specific symptoms and signs group. Mental disorders were registered in 2.6% of the NO FU group but increased from 7.6% in the FU≥4 group to 15.9% in the FU≥10 group. Cardiovascular diseases were similar in the no FU and FU≥4 groups (8.6% and 8.2%, respectively). Excluding nonspecific and missing diagnoses, many acute symptoms registered as the main issue (e.g., trauma, abdominal and chest pain, dyspnea) decreased from the no FU group to the FU≥10 group. In contrast, psychomotor agitation increased from 5.1% in the FU≥4 group to 11.2% in the FU≥10 group. Social issues are present in 0.4% of diagnoses in the FU≥4 group to 0.9% in the FU≥10 group, while it is not registered in the no FU group.
3.2. Geographical Distribution
The geographical classification comprises two levels: GUs and LHDs. Five classes were identified for each level according to the relative percentage of FUs in the area. The geographical distribution represented in Figure 1 shows that some areas of LHA Roma 1 have a significantly higher percentage of FUs, mostly in LHD 1, LHD 14 and LHD 15.
Legend: the colors represent the 5-cut-off percentage of FUs on the geographical unit population level. The bold black line separates the six LHDs, the narrow black line separates the GUs.
3.3. Inferential Analysis
Multilevel analysis results are reported in Table 3. Among candidate predictor variables identified in the descriptive and geographical analysis, the most prominent effect was related to the presence of multiple chronic conditions: the higher the patient’s clinical complexity, the higher the OR for being a FU. OR increases with decreasing socioeconomic level, with an effect that is more evident for low and medium-low levels and less clear for higher levels. The GP role does not consistently suggest an essential role in determining FU behavior (MOR 1.18, Wald p = 0.061), and no significant effect was found on the LHD level (MOR 1.05, Wald p = 0.127).
4. Discussion
FUs represented 2.7% of the overall population but were responsible for 11.3% of attendances registered during 2021, in line with the literature [46], mostly in the age class 50-59. The risk of being FU increases with the patient’s clinical complexity and for low and medium-low socioeconomic level. Generally, patients with higher socioeconomic levels were less likely to go to the ED. This is in line with another study in Milan, where the odds of avoidable hospital admissions were higher among low socioeconomic levels of patients compared with the other classes [49]. Prior studies suggest that patients with low socioeconomic level perceive ED assistance to be cheaper and more accessible than ambulatory care and are often more likely to use EDs for nonurgent conditions [50,51,52].
In this study, non-urgent triage codes were more frequent in FUs (from 8.1% in the FU≥4 group to 14.4% in the FU≥10 group), and mental disorders were present in a large proportion of FUs (to 15.9% in the FU≥10 group). Psychomotor agitation and social issues are important diagnoses associated with FUs, but the results of “symptoms, signs and ill-defined conditions” and “external causes of injury and supplemental classification” diagnosis groups, as well as the main issues on admission, such as fever, chest pain or dyspnea, may suffer the influence of the COVID-19 pandemic, which may have also affected the results of time-dependent illnesses such as stroke or cardiac complaints, possibly due to concerns about COVID-19 acquisition in the hospital [53,54]. The increase of physical and mental morbidities, especially with socioeconomic deprivation, is associated with the attendance rate at EDs, supporting previous evidence of increased emergency attendance among people with chronic illnesses and psychiatric disorders who are more likely to visit EDs [19,55]; this also holds true for people with low socioeconomic level [56,57]. Across the EU, admissions connected to chronic diseases and psychiatric disorders are estimated to be potentially avoidable through better prevention and disease management to decrease their dependence on the ED [58,59]. Some authors have investigated the importance of social support in the ED for older adults, even if in a systematic review there was no significant association between ED attendance and social support [60].
Regarding the geographical analysis shown in Figure 1, this study characterizes variation using a more granular geographic unit of analysis. This may be considered the first step to setting up a specific public health strategy aimed at improving adequate healthcare attendance for specific populations and communities, as decided in Paris by the Ile-de-France Health Regional Agency. [46] In other studies on geographic variation in healthcare, healthcare utilization and outcomes were quantified by using geographic macro areas, but it was impossible to distinguish a single neighborhood characterized by different socioeconomic and demographic characteristics [30,49,61,62]. Further studies may help to analyze the association among FUs, population density, income and medical services or GP offices in the same area.
The multilevel analysis shows that GP does not consistently suggest an important role in avoiding FU behaviors (MOR 1.18, Wald p=0.061), similar to the territorial level. In some studies, the reduction in demand for ED seems to be achieved via the availability of at-home GP visits or improved public transport [63]. Other authors have demonstrated that frequent ED users actually have high rates of general practitioner consultations and outpatient care utilization in addition to ED use. Thus, efforts to only increase primary care access or visiting hours (on weekdays and weekends) may not necessarily result in decreased ED utilization [64].
Primary prevention of the FU phenomenon is not much discussed in the literature. These subpopulations of FU may represent different targets for action plans, such as specific and individual interventions [65,66]. The individual plans on FUs are often based on the principle of secondary prevention because they are triggered after an ED visit, followed by an intervention or a treatment by a case-management team [67].
The high rates of FUs in ED attendances could thus indicate poverty in metropolitan areas and highlight social inequalities in access to health. As stated in the New Urban Agenda, The United Nations Sustainable Development Goals focus on health promotion through several interconnected health-related targets, achievable through multisectoral approaches [68]. Thus, the decrease of FU rate and the increase of general population’s health status may be realized through joint policies with other partners (such as school or transportation actors) [69,70].
Limitations and Strengths
This study is the most comprehensive examination in a single metropolitan area in Italy that considers all FU attendances in one year and their different health statuses, socioeconomic determinants and geographical data. Although these findings are not generalizable to the entire population, they will be relevant to many urban areas with similar levels of social deprivation. Thus, it seems possible for institutions or health care providers to identify territories where residents are at higher risk of developing FU patterns and to suggest primary prevention actions. Access to regional data flows allowed to avoid missing records or information. Additionally, residents who may be living in extremely disadvantaged circumstances were probably captured by our data because of the fictitious address LHA assigned to them.
This study has some limitations. The retrospective nature of the study allowed investigation of the predictors of ED attendance at one point in time and only in LHA residents, excluding homeless without residency, foreigners or people resident in LHA Roma 1 but whose health services should be delivered from the other LHAs in Rome. Only the main diagnosis was considered, and inaccuracies in the clinical dataset may have under recorded some morbidities. The proximity of the ED and general practitioner or primary care services as predictors of ED attendance was not investigated. Other variables would be necessary to quantify COVID-19-specific attendance to better understand the influence on the data.
5. Conclusions
Frequent ED use is a major challenge in health facility management. The analysis of ED attendances and the socioeconomic and geographical factors of the FUs highlights the need for new approaches to address important issues such as socioeconomic inequalities, increasing better housing conditions and employment, and structural issues such as strategic placement of primary care services and better transport.
This study allows the identification of potential risk factors predictive of disproportionate use of the ED and helps policymakers anticipate the needs of specific categories of patients. Further studies are necessary to analyse the presence of FUs and the geographical position of hospitals, residents’ income and primary care services in the entire Lazio region. It would be useful to investigate the efficacy of territorial interventions, according to the new directives of the National Recovery and Resilience Plan on chronic conditions management at the territorial level.
Author Contributions
GF: AV, PP, PC and CDV conceptualized and designed the study, drafted the initial manuscript, and critically reviewed and revised the manuscript. MF, MDM, MD designed the data collection instruments, collected data, carried out the initial analyses, and critically reviewed and revised the manuscript. AB, PL, GD critically reviewed and revised the manuscript. MD and MM coordinated and supervised data collection, and critically reviewed and revised the manuscript for important intellectual content. All authors have approved the final article.
Funding
This research received no external funding.
Institutional Review Board Statement
The study was conducted in accordance with the Declaration of Helsinki, and approved by the Lazio 1 Ethical Committee (protocol code 238/CE Lazio 1, 09/03/2023).
Informed Consent Statement
Not applicable.
Data Availability Statement
The datasets used and/or analyzed during the current study are available from the corresponding author on reasonable request.
Conflicts of Interest
The authors declare no conflicts of interest.
Abbreviations
The following abbreviations are used in this manuscript:
| ED | Emergency Department |
| FU | Frequent User |
| LHD | Local Health District |
| NHS | National Health Service; |
| LHA | Local Health Authority |
| GP | General Practitioner |
| GU | Geographical Unit |
| OR | Odds Ratios |
| MOR | Median Odds Ratios |
Appendix A
Italian National Health Service
Italian National Health Service (NHS) is structured on three different levels: the first concerns the Central Government and Ministry of Health, the second concerns the twenty Regional Governments and the third the Local Health Authority (LHA) together with the Independent hospitals. NHS is mainly funded by public taxes and guided by the principles of universal coverage, solidarity, human dignity. LHA consist of at least one not independent hospital and one or more Local Health Districts (LHDs), which provides primary care services (vaccination and screening, specialist consultations, counselling for family planning, home care) and coordinates General Practitioners (GPs) and Primary Care Paediatricians (PCPs). The primary care physicians can work in solo or in operational and multidisciplinary forms of associations to guarantee full access to the public, 24 hours a day, 7 days a week.
References
- OECD/European Observatory on Health Systems and Policy. Italy: country health profile 2017. OECD Publishing/European Observatory on Health Systems and Policies, 2017.
- Cinelli G, Gugiatti A, Meda F, Petracca F. La struttura e le attività del SSN. In: Rapporto OASI 2020. CERGAS - Bocconi. Milano: Egea; 2020. p. 37-115.
- Carle F, Franchino G, Bruno V. (2022). Osservatorio della Salute delle Regioni Italiane. Assistenza Ospedaliera. Rapporto Osservasalute 2021. p. 517-581.
- Lee DC, Doran KM, Polsky D, Cordova E, Carr BG. Geographic variation in the demand for emergency care: A local population-level analysis. Healthc (Amst). 2016; doi: 10.1016/j.hjdsi.2015.05.003. Epub 2015 Jun 11.
- Reid RJ, Johnson EA, Hsu C, Ehrlich K, Coleman K, Trescott C, et al. Spreading a medical home redesign: effects on emergency department use and hospital admissions. Ann Fam Med. 2013; doi: 10.1370/afm.1476.
- Smulowitz PB, Honigman L, Landon BE. A novel approach to identifying targets for cost reduction in the emergency department. Ann Emerg Med. 2013; doi: 10.1016/j.annemergmed.2012.05.042.
- Marmot M. Social determinants of health inequalities. Lancet. 2005; doi: 10.1016/S0140-6736-(05)71146-6.
- Dufour I, Chouinard MC, Dubuc N, Beaudin J, Lafontaine S, Hudon C. Factors associated with frequent use of emergency-department services in a geriatric population: a systematic review. BMC Geriatr. 2019; doi: 10.1186/s12877-019-1197-9.
- Gentili S, Gialloreti E, Riccardi F, Scarcella P, Liotta G. Predictors of emergency room access and not urgent emergency room access by the frail older adults. Front Public Health. 2021; doi: 10.3389/fpubh.2021.721634.
- Chiu YM, Dufour I, Courteau J, Vanasse A, Chouinard MC, Dubois MF, et al. Profiles of frequent emergency department users with chronic conditions: a latent class analysis. BMJ Open. 2022; doi: 10.1136/bmjopen-2021-055297.
- Moe J, Kirkland SW, Rawe E, Ospina MB, Vandermeer B, Campbell S, et al. Effectiveness of interventions to decrease emergency department visits by adult frequent users: a systematic review. Acad Emerg Med. (2017) ;24(1):40-52. doi: 10.1111/acem.13060.
- LaCalle E, Rabin E. Frequent users of emergency departments: the myths, the data, and the policy implications. Ann Emerg Med. (2010) 56:42-8. doi: 10.1016/j.annemergmed.2010.01.032.
- Legramante JM, Morciano L, Lucaroni F, Gilardi F, Caredda E, Pesaresi A, et al. Frequent use of emergency departments by the elderly population when continuing care is not well established. PLoS One. (2016) 11(12):e0165939. doi: 10.1371/journal.pone.0165939.
- Furia G, Vinci A, Colamesta V, Papini P, Grossi A, Cammalleri V, et al. Appropriateness of frequent use of emergency departments: a retrospective analysis in Rome, Italy. Front Public Health. 2023; doi: 10.3389/fpubh.2023.1150511.
- Borrega JG, Hermes C, König V, Kitz V, Möller S, Stark D, et al. Sustainability in intensive and emergency care: a nationwide survey by the German Society of Medical Intensive Care and Emergency Medicine. Med Klin Intensivmed Notfmed. 2023; doi: 10.1007/s00063-023-01039-2.
- Pietrantonio F, Rosiello F, Alessi E, Pascucci M, Rainone M, Cipriano E, et al. Burden of COVID-19 on Italian Internal Medicine Wards: Delphi, SWOT, and performance analysis after two pandemic waves in the Local Health Authority “Roma 6” Hospital structures. Int J Environ Res Public Health. 2021; doi: 10.3390/ijerph18115999.
- Armocida B, Formenti B, Ussai S, Palestra F, Missoni E. The Italian health system and the COVID-19 challenge. Lancet Public Health. 2020; doi: 10.1016/S2468-2667(20)30074-8.
- Maruster L, Van der Zee DJ, Buskens E. Identifying frequent health care users and care consumption patterns: process mining of emergency medical services data. J Med Internet Res. 2021; doi: 10.2196/27499.
- Krieg C, Hudon C, Chouinard MC, Dufour I. Individual predictors of frequent emergency department use: a scoping review. Review BMC Health Serv Res. 2016; doi: 10.1186/s12913-016-1852-1.
- Di Bella E, Gandullia L, Leporatti L, Locatelli W, Montefiori M, Persico L, et al. Frequent use of emergency departments and chronic conditions in ageing societies: a retrospective analysis based in Italy. Popul Health Metr. 2020; doi: 10.1186/s12963-020-00237-w.
- Gibson OR, Segal L, McDermott RA. A systematic review of evidence on the association between hospitalisation for chronic disease related ambulatory care sensitive conditions and primary health care resourcing. BMC Health Serv Res. 2013; doi: 10.1186/1472-6963-13-336.
- Alcusky M, Singer D, Keith SW, Hegarty SE, Lombardi M, Saccenti E, et al. Evaluation of care processes and health care utilization in newly implemented medical homes in Italy: a population-based cross-sectional study. Am J Med Qual. 2020; doi: 10.1177/1062860619860590.
- Costa C, Santana P, Dimitroulopoulou S, Burstrom B, Borrell C, Schweikart J. Population Health Inequalities Across and Within European Metropolitan Areas through the Lens of the EURO-HEALTHY Population Health Index. Int J Environ Res Public Health. 2019; doi: 10.3390/ijerph16050836.
- Borrell C, Pons-Vigués M, Morrison J, Díez È. Factors and processes influencing health inequalities in urban areas. J Epidemiol Community Health. 2013; doi: 10.1136/jech-2012-202014.
- Mitsakou C, Dimitroulopoulou S, Heaviside C, Katsouyanni K, Samoli E, Rodopoulou S, et al. Environmental public health risks in European metropolitan areas within the EURO-HEALTHY project. Sci Total Environ. 2019; doi: 10.1016/j.scitotenv.2018.12.130.
- Santana P, Costa C, Cardoso G, Loureiro A Ferrão J. Suicide in Portugal: spatial determinants in a context of economic crisis. Health Place. 2015; doi: 10.1016/j.healthplace.2015.07.001.
- Mauro M, Giancotti M. The 2022 primary care reform in Italy: Improving continuity and reducing regional disparities? Health Policy. 2023; doi: 10.1016/j.healthpol.2023.104862.
- Matranga D, Maniscalco L. Inequality in Healthcare Utilization in Italy: How Important Are Barriers to Access? Int J Environ Res Public Health. 2022; doi: 10.3390/ijerph19031697.
- Bilheimer LT. Evaluating metrics to improve population health. Prev Chronic Dis. 2010;7(4):A69.
- Giebel C, McIntyre JC, Daras K, Gabbay M, Downing J, Pirmohamed M, et al. What are the social predictors of accident and emergency attendance in disadvantaged neighbourhoods? Results from a cross-sectional household health survey in the north west of England. BMJ Open. 2019; doi: 10.1136/bmjopen-2018-022820.
- Scantlebury R, Rowlands G, Durbaba S, Schofield P, Sidhu K, Ashworth M. Socioeconomic deprivation and accident and emergency attendances: cross sectional analysis of general practices in England. Br J Gen Pract. 2015; doi: 10.3399/bjgp15X686893.
- Hull SA, Jones IR, Moser K. Factors influencing the attendance rate at accident and emergency departments in East London: the contributions of practice organization, population characteristics and distance. J Health Serv Res Policy. 1997; doi: 10.1177/135581969700200104.
- Rudge GM, Mohammed MA, Fillingham SC, Girling A, Sidhu K, Stevens AJ. The combined influence of distance and neighbourhood deprivation on Emergency Department attendance in a large English population: a retrospective database study. PLoS One. 2013; doi: 10.1371/journal.pone.0067943.
- Takahashi PY, Ryu E, Hathcock MA, Olson JE, Bielinski SJ, Cerhan JR, et al. A novel housing-based socioeconomic measure predicts hospitalisation and multiple chronic conditions in a community population. J Epidemiol Community Health. 2016; doi: 10.1136/jech-2015-205925.
- Loureiro A, Costa C, Almendra R, Freitas Â, Santana P. The socio-spatial context as a risk factor for hospitalization due to mental illness in the metropolitan areas of Portugal. Cad Saude Publica 2015;31 Suppl 1:219-31.
- Hoffmann R, Borsboom G, Saez M, Dell’Olmo M, Burström BB, Corman D, et al. Social differences in avoidable mortality between small areas of 15 European cities: An ecological study. Int J Health Geogr. 2014; doi: 10.1186/1476-072X-13-8.
- Gotsens M, Marí-Dell’Olmo M, Pérez K, Palência L, Martinez-Beneito MA, Rodríguez-Sanz M, et al. Socioeconomic inequalities in injury mortality in small areas of 15 European cities. Health Place. 2013; doi: 10.1016/j.healthplace.2013.09.003.
- Nolasco A, Moncho J, Quesada JA, Melchor I, Pereyra-Zamora P, Tamayo-Fonseca N, et al. Trends in socioeconomic inequalities in preventable mortality in urban areas of 33 Spanish cities, 1996–2007 (MEDEA project). Int J Equity Health. 2015; doi: 10.1186/s12939-015-0164-0.
- Open Salute Lazio. Dati sullo stato di salute della popolazione residente nella Regione Lazio. 2023. https://www.opensalutelazio.it/salute/stato_salute.php?stato_salute. Accessed 30 aug 2023.
- Pines JM, Asplin BR, Kaji AH, Lowe RA, Magid DJ, Raven M, et al. Frequent users of emergency department services: gaps in knowledge and a proposed research agenda. Acad Emerg Med. 2011; doi: 10.1111/j.1553-2712.2011.01086.x.
- Birmingham LE, Cochran T, Jennifer A, Frey JA, Stiffler KA, Wilber ST. Emergency department use and barriers to wellness: a survey of emergency department frequent users. BMC Emerg Med. 2017; doi: 10.1186/s12873-017-0126-5.
- Rosano A, Pacelli B, Zengarini N, Costa G, Cislaghi C, Caranci N. Update and review of the 2011 Italian deprivation index calculated at the census section level. Epidemiol Prev 2020; 44 (2-3):162-170. doi: 10.19191/EP20.2-3.P162.039.
- Corrao G, Rea F, Di Martino M, De Palma R, Scondotto S, Fusco D, et al. Developing and validating a novel multisource comorbidity score from administrative data: A large population-based cohort study from Italy. BMJ Open. 2017; doi: 10.1136/bmjopen-2017-019503.
- Di Martino M, Furfaro S, Mulas MF, Mataloni F, Santurri M, Paris A, et al. Population segmentation as a tool for planning community healthcare networks: the key role of social and health information systems. Recenti Prog Med. 2022; doi: 10.1701/3748.37313.
- Mataloni F, Bauleo L, Badaloni C, Nobile F, Savastano J, Noccioli F, et al. Geocoding one million of addresses using API: a semiautomatic multistep procedure. Epidemiol Prev. 2022; doi: 10.19191/EP22.3.A463.031. PMID: 35443573.
- Hellmann R, Feral-Pierssens AL, Michault A, Casalino E, Ricard-Hibon A, Adnet F, et al. The analysis of the geographical distribution of emergency departments’ frequent users: a tool to prioritize public health policies? BMC Public Health. 2021; doi: 10.1186/s12889-021-11682-z.
- Roma Capitale - Territorio. Zone urbanistiche. 2023. https://www.comune.roma.it/web-resources/cms/documents/Territorio_RomaCapitale.pdf. Accessed 30 aug 2023.
- Domínguez-Berjón MF, Borrell C, López R, Pastor V. Mortality and socioeconomic deprivation in census tracts of an urban setting in southern Europe. J Urban Health. 2005; doi: 10.1093/jurban/jti047. Epub 2005 May 11. PMID: 15888637; PMCID: PMC3456560.
- Pongiglione B, Torbica A, Gusmano MK. Inequalities in avoidable hospitalisation in large urban areas: retrospective observational study in the metropolitan area of Milan. BMJ Open. 2020; doi: 10.1136/bmjopen-2020-042424.
- Kangovi S, Barg FK, Carter T, Long JA, Shannon R, Grande D. Understanding why patients of low socioeconomic status prefer hospitals over ambulatory care. Health Aff (Millwood). 2013; doi: 10.1377/hlthaff.2012.0825.
- Lee JE, Sung JH, Ward WB, Fos PJ, Lee WJ, Kim JC. Utilization of the emergency room: impact of geographic distance. Geospat Health. 2007; doi: 10.4081/gh.2007.272.
- Rudge GM, Mohammed MA, Fillingham SC, Girling A, Sidhu K, Stevens AJ. The combined influence of distance and neighbourhood deprivation on Emergency Department attendance in a large English population: a retrospective database study. PLoS One. 2013; doi: 10.1371/journal.pone.0067943. Print 2013.
- Lucero AD, Lee A, Hyun J, Lee C, Kahwaji C, Miller G, et al. Underutilization of the emergency department during The Covid-19 pandemic. West J Emerg Med. 2020; doi: 10.5811/westjem.2020.8.48632.
- Reschen ME, Bowen J, Novak A, Giles M, Singh S, Lasserson D, et al. Impact of the COVID-19 pandemic on emergency department attendances and acute medical admissions. BMC Emerg Med. 2021; doi: 10.1186/s12873-021-00529-w.
- Woo JH, Grinspan Z, Shapiro J, Rhee SY. Frequent Users of hospital Emergency Departments in Korea characterized by claims data from the National Health Insurance: a cross sectional study. PLoS One. 2016; doi:10.1371/journal.pone.0147450.
- Or Z, Penneau A. A multilevel analysis of the determinants of emergency care visits by the elderly in France. Health Policy. 2018; doi: 10.1016/j.healthpol.2018.05.003.
- Scantlebury R, Rowlands G, Durbaba S, Schofield P, Sidhu K, Ashworth M. Socioeconomic deprivation and accident and emergency attendances: cross-sectional analysis of general practices in England. Br J Gen Pract. 2015; doi: 10.3399/bjgp15X686893.
- OECD Health at a Glance: Europe 2018: State of Health in the EU Cycle, OECD Publishing, 2018. https://doi.org/https://doi.org/10.1787/health_glance_eur-2018-en.
- Vinton DT, Capp R, Rooks SP, Abbott JT, Ginde AA. Frequent users of US emergency departments: characteristics and opportunities for intervention. Emerg Med J. 2014; doi: 10.1136/emermed-2013-202407. Epub 2014 Jan 28.
- Valtorta NK, Moore DC, Barron L, Stow D, Hanratty B. Older adults’ social relationships and health care utilization: a systematic review. Am J Public Health. 2018; doi: 10.2105/AJPH.2017.304256.
- Mercier G, Georgescu V, Bousquet J. Geographic variation in potentially avoidable hospitalizations in France. Health Aff (Millwood). 2015; doi: 10.1377/hlthaff.2014.1065.
- Freitas A, Rodrigues TC, Santana P. Assessing urban health inequities through a multidimensional and participatory framework: evidence from the EURO-HEALTHY Project. J Urban Health. 2020; doi: 10.1007/s11524-020-00471-5.
- Hull SA, Homer K, Boomla K, et al. Population and patient factors affecting emergency department attendance in London: retrospective cohort analysis of linked primary and secondary care records. Br J Gen Pract. 2018; doi: 10.3399/bjgp18X694397.
- Van den Heede K, Van de Voorde C. Interventions to reduce emergency department utilisation: a review of reviews. Health Policy. 2016; doi: 10.1016/j.healthpol.2016.10.002.
- Althaus F, Paroz S, Hugli O, Ghali WA, Daeppen J-B, Peytremann-Bridevaux I, et al. Effectiveness of interventions targeting frequent users of emergency departments: a systematic review. Acad Emerg Med. 2017; doi: 10.1111/acem.13060.
- Kanzaria HK, Niedzwiecki MJ, Montoy JC, Raven MC, Hsia RY. Persistent frequent emergency department use: Core Group exhibits extreme levels of use for more than a decade. Health Aff (Millwood). 2017; doi: 10.1377/hlthaff.2017.0658.
- Vu F, Daeppen JB, Hugli O, Iglesias K, Stucki S, Paroz S, et al. Screening of mental health and substance users in frequent users of a general Swiss emergency department. BMC Emerg Med. 2015; doi: 10.1186/s12873-015-0053-2.
- Marmot M, Bell R. The Sustainable Development Goals and Health Equity. Epidemiology. 2018; doi: 10.1097/EDE.0000000000000773.
- Ellena M, Ballester J, Mercogliano P, Ferracin E, Barbato G, Costa G, et al. Social inequalities in heat-attributable mortality in the city of Turin, northwest of Italy: a time series analysis from 1982 to 2018. Environ Health. 2020; doi: 10.1186/s12940-020-00667-x.
- Cheshire J. Featured Graphic. Lives on the line: mapping life expectancy along the London Tube network. Environment and Planning A. 2012; doi: 10.1068/a45341.
- Ritsatakis A, Ostergren PO, Webster P. Tackling the social determinants of inequalities in health during phase V of the Healthy Cities Project in Europe. Health Promot Int. 2015; doi: 10.1093/heapro/dav034.
Figure 1.
Geographical distribution of FUs. The colors represent the 5-cut-off percentage groups of FUs on the Geographical Unit population level. The bold black line separates the six LHDs, the narrow black line separates the Geographical Units.
Figure 1.
Geographical distribution of FUs. The colors represent the 5-cut-off percentage groups of FUs on the Geographical Unit population level. The bold black line separates the six LHDs, the narrow black line separates the Geographical Units.
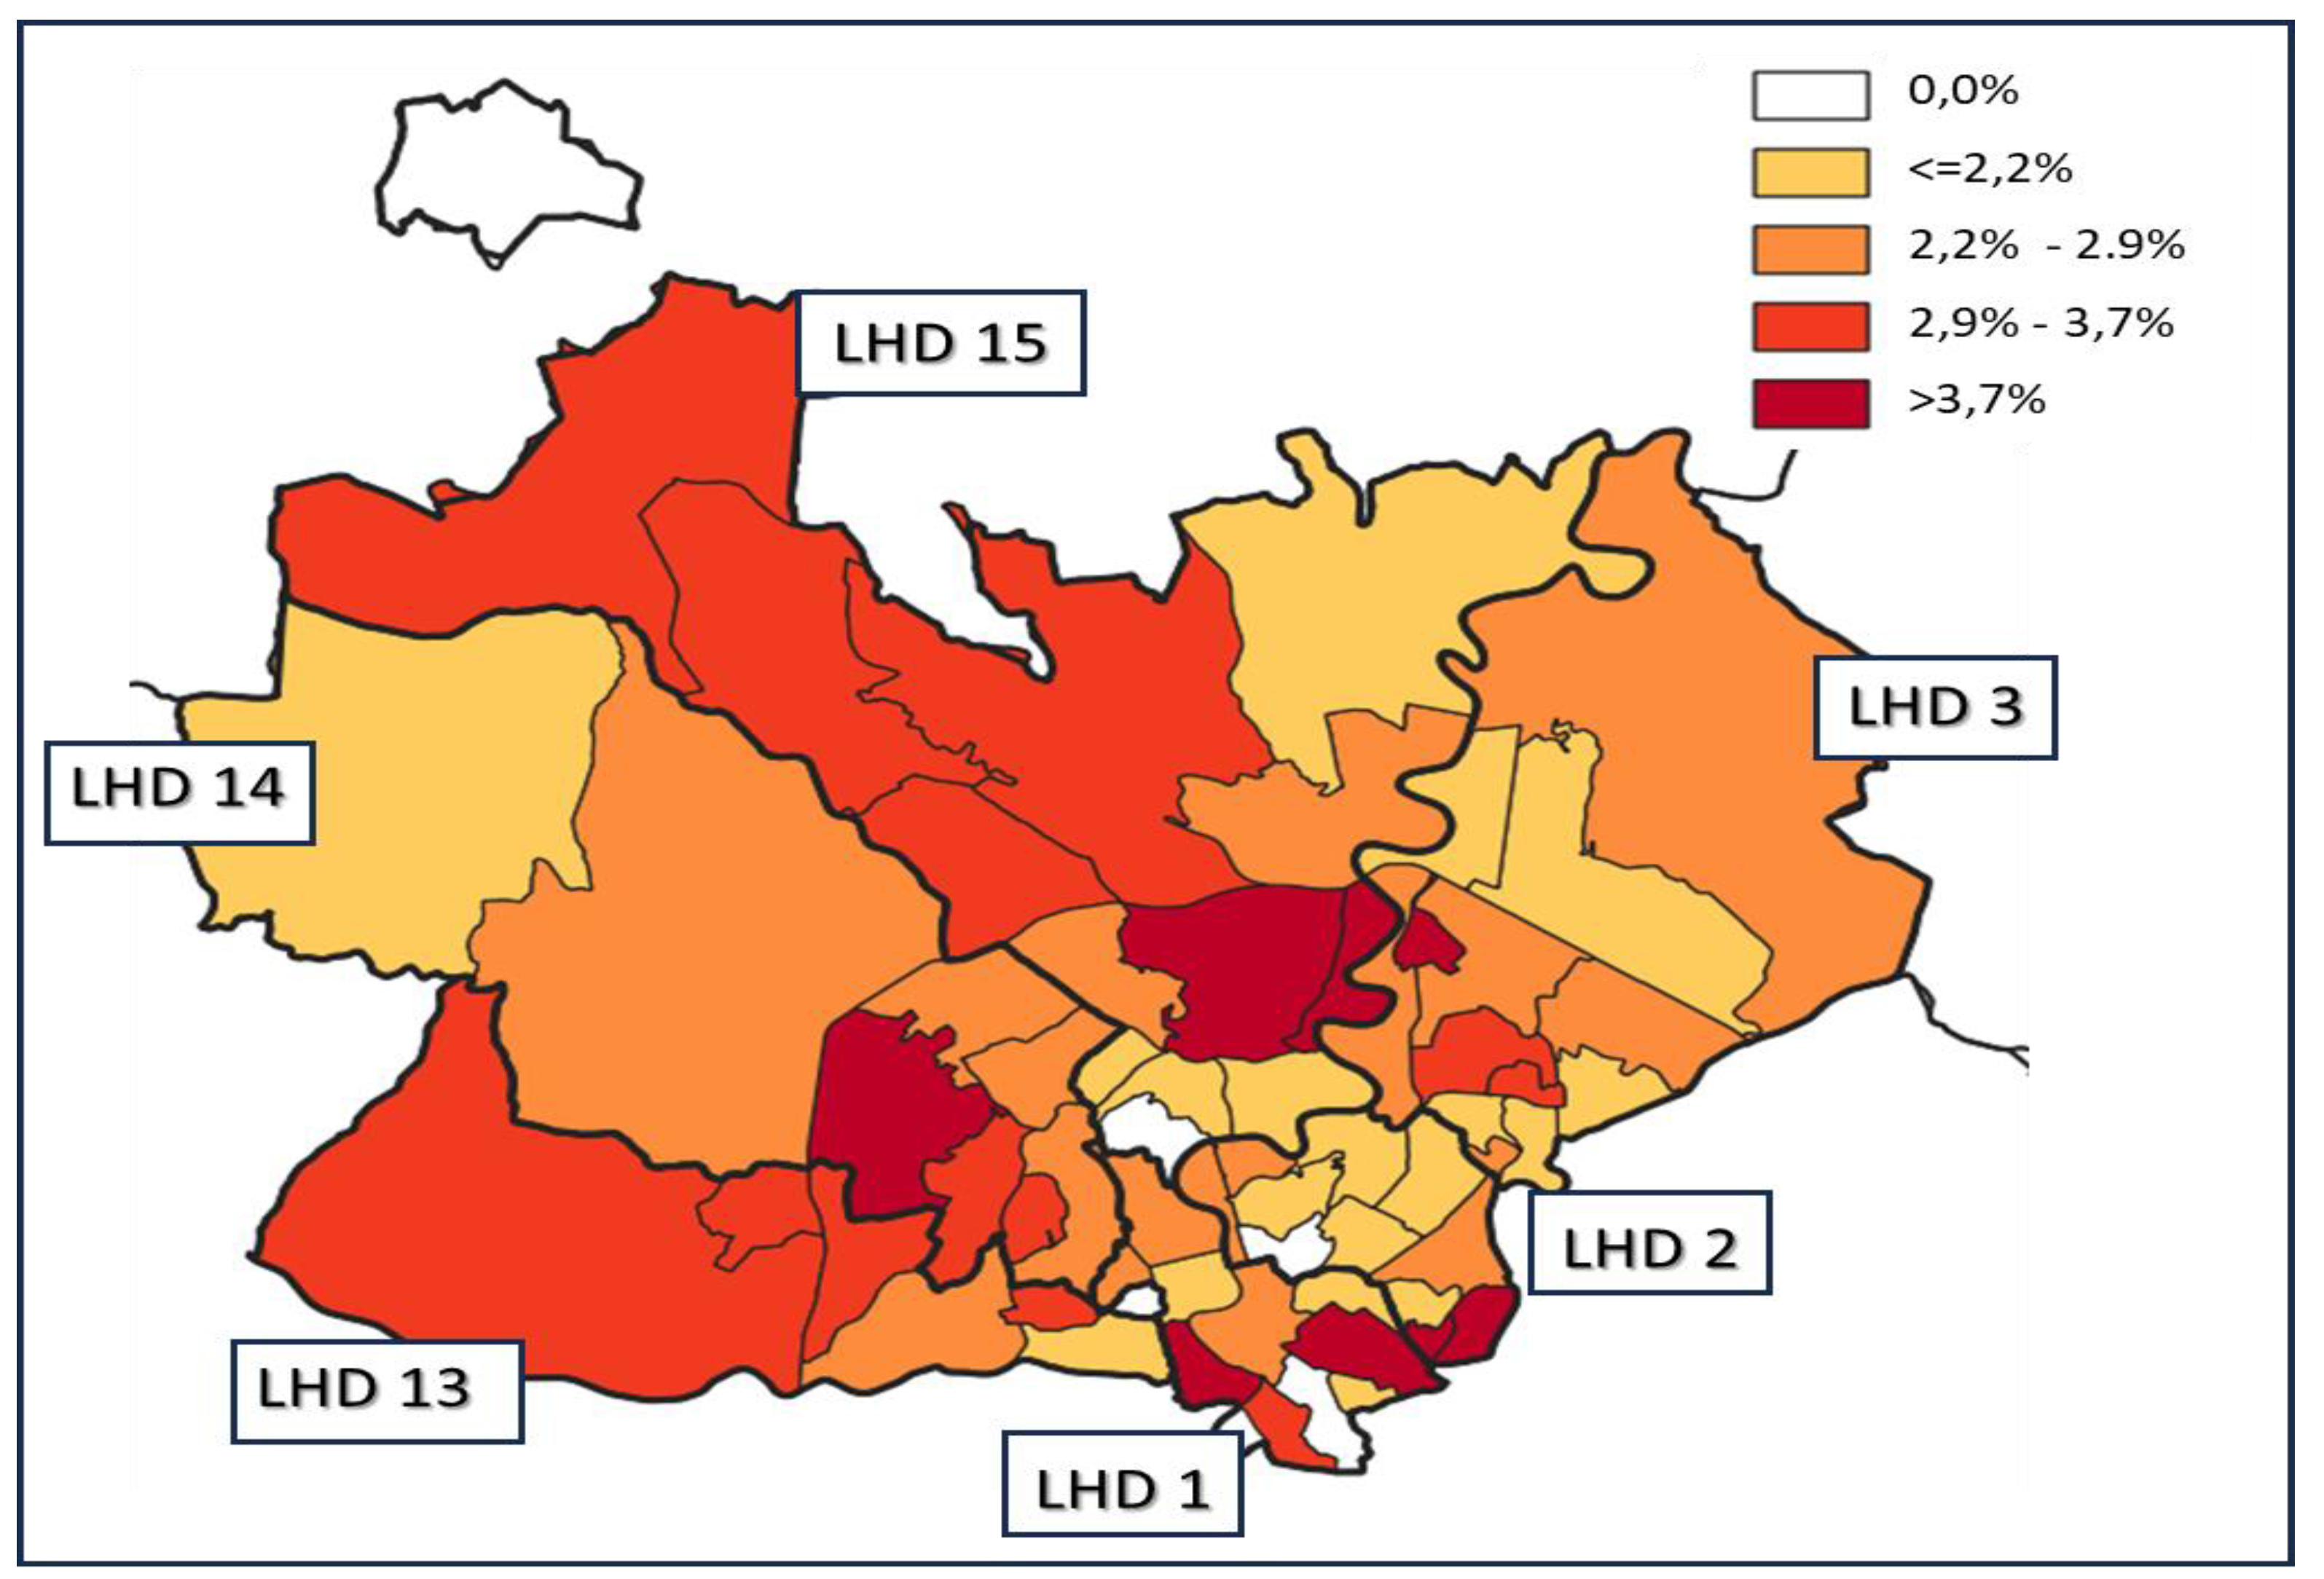

Table 1.
Characteristics of FU and no-FU patients in 2021.
| PATIENTS | NO FU | FU≥4 | FU≥5 | FU≥7 | FU≥10 | ||||||||
| N | % | N | % | N | % | N | % | N | % | N | % | ||
| Total | 72,781 | 100.0 | 70,743 | 100.0 | 2,038 | 100.0 | 977 | 100.0 | 349 | 100.0 | 130 | 100.0 | |
| Gender | Male | 35,123 | 48.3 | 34,054 | 48.1 | 1,069 | 52.5 | 507 | 51.9 | 187 | 53.6 | 75 | 57.7 |
| Female | 37,658 | 51.7 | 36,689 | 51.9 | 969 | 47.5 | 470 | 48.1 | 162 | 46.4 | 55 | 42.3 | |
| Age | 18-29 | 10,104 | 13.9 | 9,885 | 14.0 | 219 | 10.7 | 99 | 10.1 | 35 | 10.0 | 14 | 10.8 |
| 30-39 | 7,484 | 10.3 | 7,285 | 10.3 | 199 | 9.8 | 96 | 9.8 | 42 | 12.0 | 18 | 13.8 | |
| 40-49 | 10,512 | 14.4 | 10,243 | 14.5 | 269 | 13.2 | 133 | 13.6 | 55 | 15.8 | 21 | 16.2 | |
| 50-59 | 13,381 | 18.4 | 13,024 | 18.4 | 357 | 17.5 | 181 | 18.5 | 70 | 20.1 | 34 | 26.2 | |
| 60-69 | 10,235 | 14.1 | 9,933 | 14.0 | 302 | 14.8 | 147 | 15.0 | 57 | 16.3 | 21 | 16.2 | |
| 70-79 | 10,066 | 13.8 | 9,739 | 13.8 | 327 | 16.0 | 147 | 15.0 | 42 | 12.0 | 10 | 7.7 | |
| 80+ | 10,999 | 15.1 | 10,634 | 15.0 | 365 | 17.9 | 174 | 17.8 | 48 | 13.8 | 12 | 9.2 | |
| Socio-economic level | High | 16,680 | 22.9 | 16,297 | 23.0 | 383 | 18.8 | 177 | 18.1 | 66 | 18.9 | 26 | 20.0 |
| Medium-high | 17,916 | 24.6 | 17,473 | 24.7 | 443 | 21.7 | 206 | 21.1 | 73 | 20.9 | 28 | 21.5 | |
| Medium | 13,398 | 18.4 | 13,051 | 18.4 | 347 | 17.0 | 161 | 16.5 | 52 | 14.9 | 20 | 15.4 | |
| Medium-low | 11,695 | 16.1 | 11,346 | 16.0 | 349 | 17.1 | 165 | 16.9 | 53 | 15.2 | 24 | 18.5 | |
| Low | 13,092 | 18.0 | 12,576 | 17.8 | 516 | 25.3 | 268 | 27.4 | 105 | 30.1 | 32 | 24.6 | |
| Chronic conditions | No chronic conditions | 43,531 | 59.8 | 42,561 | 60.2 | 970 | 47.6 | 451 | 46.2 | 156 | 44.7 | 59 | 45.4 |
| One chronic condition | 15,718 | 21.6 | 15,249 | 21.6 | 469 | 23.0 | 226 | 23.1 | 83 | 23.8 | 40 | 30.8 | |
| Multiple chronic conditions (low-mid clinical complexity) |
9,345 | 12.8 | 9,035 | 12.8 | 310 | 15.2 | 144 | 14.7 | 45 | 12.9 | 9 | 6.9 | |
| Multiple chronic conditions (high clinical complexity) |
4,187 | 5.8 | 3,898 | 5.5 | 289 | 14.2 | 156 | 16.0 | 65 | 18.6 | 22 | 16.9 | |
Table 2.
Characteristics of ED attendances of FU and no-FU patients in 2021.
| ATTENDANCES | NO FU | FU≥4 | FU≥5 | FU≥7 | FU≥10 | ||||||||
| N | % | N | % | N | % | N | % | N | % | N | % | ||
| Total | 99,811 | 100.0 | 88,514 | 100.0 | 11,297 | 100.0 | 7,053 | 100.0 | 3,721 | 100.0 | 2,046 | 100.0 | |
| Triage admission code | Emergency | 5,150 | 5.2 | 4,528 | 5.1 | 622 | 5.5 | 345 | 4.9 | 175 | 4.7 | 95 | 4.6 |
| Urgency | 19,176 | 19.2 | 16,986 | 19.2 | 2,190 | 19.4 | 1,327 | 18.8 | 651 | 17.5 | 334 | 16.3 | |
| Deferrable Urgency | 35,505 | 35.6 | 31,605 | 35.7 | 3,900 | 34.5 | 2,269 | 32.2 | 1,157 | 31.1 | 610 | 29.8 | |
| Minor urgency | 36,530 | 36.6 | 32,861 | 37.1 | 3,669 | 32.5 | 2,389 | 33.9 | 1,208 | 32.5 | 712 | 34.8 | |
| Non urgency | 3,450 | 3.5 | 2,534 | 2.9 | 916 | 8.1 | 723 | 10.3 | 530 | 14.2 | 295 | 14.4 | |
| ICD-9-CM Diagnosis group on discharge | Infectious and parasitic diseases | 1,625 | 1.6 | 1,469 | 1.7 | 156 | 1.4 | 92 | 1.3 | 40 | 1.1 | 21 | 1.0 |
| Neoplasms | 675 | 0.7 | 532 | 0.6 | 143 | 1.3 | 86 | 1.2 | 39 | 1.0 | 20 | 1.0 | |
| Endocrine, nutritional and metabolic diseases, and immunity disorders | 686 | 0.7 | 580 | 0.7 | 106 | 0.9 | 63 | 0.9 | 29 | 0.8 | 11 | 0.5 | |
| Diseases of the blood and blood-forming organs | 1,150 | 1.2 | 894 | 1.0 | 256 | 2.3 | 184 | 2.6 | 96 | 2.6 | 54 | 2.6 | |
| Mental disorders | 3,173 | 3.2 | 2,315 | 2.6 | 858 | 7.6 | 656 | 9.3 | 444 | 11.9 | 325 | 15.9 | |
| Diseases of nervous system and sense organs | 3,596 | 3.6 | 3,165 | 3.6 | 431 | 3.8 | 268 | 3.8 | 139 | 3.7 | 66 | 3.2 | |
| Disease of the circulatory system | 8,514 | 8.5 | 7,592 | 8.6 | 922 | 8.2 | 478 | 6.8 | 197 | 5.3 | 92 | 4.5 | |
| Diseases of the respiratory system | 4,136 | 4.1 | 3,740 | 4.2 | 396 | 3.5 | 215 | 3.0 | 107 | 2.9 | 28 | 1.4 | |
| Diseases of the digestive system | 6,866 | 6.9 | 6,110 | 6.9 | 756 | 6.7 | 443 | 6.3 | 192 | 5.2 | 85 | 4.2 | |
| Diseases of the genitourinary system | 2,905 | 2.9 | 2,450 | 2.8 | 455 | 4.0 | 291 | 4.1 | 98 | 2.6 | 38 | 1.9 | |
| Complications of pregnancy, childbirth and puerperium | 675 | 0.7 | 622 | 0.7 | 53 | 0.5 | 34 | 0.5 | 5 | 0.1 | 3 | 0.1 | |
| Diseases of the skin and subcutaneous tissue | 961 | 1.0 | 876 | 1.0 | 85 | 0.8 | 39 | 0.6 | 19 | 0.5 | 6 | 0.3 | |
| Diseases of the musculoskeletal system and connective tissue | 6,153 | 6.2 | 5,651 | 6.4 | 502 | 4.4 | 262 | 3.7 | 127 | 3.4 | 63 | 3.1 | |
| Congenital anomalies | 566 | 0.6 | 495 | 0.6 | 71 | 0.6 | 47 | 0.7 | 20 | 0.5 | 12 | 0.6 | |
| Certain conditions originating in the perinatal period | 46 | 0.0 | 41 | 0.0 | 5 | 0.0 | 2 | 0.0 | 2 | 0.1 | 2 | 0.1 | |
| Symptoms, signs and ill-defined conditions | 21,504 | 21.5 | 18,781 | 21.2 | 2,723 | 24.1 | 1,713 | 24.3 | 856 | 23.0 | 425 | 20.8 | |
| Injury and poisoning | 27,269 | 27.3 | 25,818 | 29.2 | 1451 | 12.8 | 745 | 10.6 | 340 | 9.1 | 192 | 9.4 | |
| External causes of injury and supplemental classification | 2,601 | 2.6 | 1,770 | 2.0 | 831 | 7.4 | 669 | 9.5 | 485 | 13.0 | 258 | 12.6 | |
| Missing | 6,710 | 6.7 | 5,613 | 6.3 | 1,097 | 9.7 | 766 | 10.9 | 486 | 13.1 | 345 | 16.9 | |
| Main issue on admission | Coma | 13 | 0.0 | 10 | 0.0 | 3 | 0.0 | 1 | 0.0 | 1 | 0.0 | 1 | 0.0 |
| Shock | 12 | 0.0 | 12 | 0.0 | 0 | 0.0 | 0 | 0.0 | 0 | 0.0 | 0 | 0.0 | |
| Dyspnea | 3,626 | 3.6 | 3,222 | 3.6 | 404 | 3.6 | 221 | 3.1 | 107 | 2.9 | 40 | 2.0 | |
| Abdominal Pain | 8,087 | 8.1 | 7,053 | 8.0 | 1,034 | 9.2 | 674 | 9.6 | 347 | 9.3 | 190 | 9.3 | |
| Neck Pain | 164 | 0.2 | 145 | 0.2 | 19 | 0.2 | 9 | 0.1 | 1 | 0.0 | 0 | 0.0 | |
| Chest Pain | 5,362 | 5.4 | 4,784 | 5.4 | 578 | 5.1 | 319 | 4.5 | 168 | 4.5 | 84 | 4.1 | |
| Non-traumatic bleeding | 1,093 | 1.1 | 953 | 1.1 | 140 | 1.2 | 81 | 1.1 | 33 | 0.9 | 8 | 0.4 | |
| Fever | 3,206 | 3.2 | 2,895 | 3.3 | 311 | 2.8 | 186 | 2.6 | 62 | 1.7 | 23 | 1.1 | |
| Intoxication | 288 | 0.3 | 214 | 0.2 | 74 | 0.7 | 52 | 0.7 | 35 | 0.9 | 32 | 1.6 | |
| Hypertension | 1,122 | 1.1 | 996 | 1.1 | 126 | 1.1 | 75 | 1.1 | 37 | 1.0 | 18 | 0.9 | |
| Rhythm alteration | 1,829 | 1.8 | 1,642 | 1.9 | 187 | 1.7 | 102 | 1.4 | 32 | 0.9 | 14 | 0.7 | |
| Acute neurological syndrome | 871 | 0.9 | 799 | 0.9 | 72 | 0.6 | 42 | 0.6 | 16 | 0.4 | 8 | 0.4 | |
| Other nervous system symptoms | 2,236 | 2.2 | 2,010 | 2.3 | 226 | 2.0 | 133 | 1.9 | 77 | 2.1 | 43 | 2.1 | |
| Social issues | 51 | 0.1 | 20 | 0.0 | 31 | 0.3 | 27 | 0.4 | 22 | 0.6 | 18 | 0.9 | |
| Medico-legal checks | 53 | 0.1 | 38 | 0.0 | 15 | 0.1 | 11 | 0.2 | 9 | 0.2 | 7 | 0.3 | |
| Allergic reaction | 450 | 0.5 | 419 | 0.5 | 31 | 0.3 | 13 | 0.2 | 7 | 0.2 | 4 | 0.2 | |
| Trauma or burn | 28,670 | 28.7 | 27,344 | 30.9 | 1,326 | 11.7 | 680 | 9.6 | 298 | 8.0 | 167 | 8.2 | |
| Dermatological disorders | 313 | 0.3 | 286 | 0.3 | 27 | 0.2 | 12 | 0.2 | 7 | 0.2 | 4 | 0.2 | |
| Eye symptoms or disorders | 726 | 0.7 | 541 | 0.6 | 185 | 1.6 | 130 | 1.8 | 78 | 2.1 | 37 | 1.8 | |
| Dental disorders | 2,024 | 2.0 | 1,795 | 2.0 | 229 | 2.0 | 115 | 1.6 | 44 | 1.2 | 13 | 0.6 | |
| ENT symptoms or disorders | 1,108 | 1.1 | 980 | 1.1 | 128 | 1.1 | 70 | 1.0 | 28 | 0.8 | 10 | 0.5 | |
| Urological symptoms or disorders | 1,860 | 1.9 | 1,452 | 1.6 | 408 | 3.6 | 256 | 3.6 | 96 | 2.6 | 42 | 2.1 | |
| Psychomotor agitation | 1,594 | 1.6 | 1,021 | 1.2 | 573 | 5.1 | 438 | 6.2 | 294 | 7.9 | 229 | 11.2 | |
| Other | 35,048 | 35.1 | 29,879 | 33.8 | 5,169 | 45.8 | 3,406 | 48.3 | 1,922 | 51.7 | 1,054 | 51.5 | |
Table 3.
Multilevel logistic regression model predicting ED frequent usage.
| Predictor Variable | OR | 95% Confidence Limits | p Value | ||||
| Age (years) | 1.00 | 1.00 | 1.00 | 0.794 | |||
| Gender | Male | reference | - | - | - | ||
| Female | 0,87 | 0,79 | 0,95 | 0.002 | |||
| Chronic conditions | No chronic conditions | reference | - | - | - | ||
| One chronic condition | 1.37 | 1.20 | 1.56 | <0.001 | |||
| Multiple chronic conditions (low-mid clinical complexity) | 1.54 | 1.32 | 1.80 | <0.001 | |||
| Multiple chronic conditions (high clinical complexity) | 3.18 | 2.70 | 3.76 | <0.001 | |||
| Socio-economic level | High | reference | - | - | - | ||
| Medium-high | 1.07 | 0.92 | 1.25 | 0.335 | |||
| Medium | 1.12 | 0.95 | 1.31 | 0.166 | |||
| Medium-low | 1.29 | 1.09 | 1.51 | 0.004 | |||
| Low | 1.70 | 1.46 | 1.97 | <0.001 | |||
| Multilevel parameters | |||||||
| Intercept-only model | MOR | p (wald) | |||||
| LHD* | 1.08 | 0.127 | |||||
| GP* | 1.24 | 0.008 | |||||
| Full model | MOR | p (wald) | |||||
| LHD | 1.05 | 0.207 | |||||
| GP | 1.18 | 0.061 | |||||
*LHD: Local Health District; GP: General Practitioner.
Disclaimer/Publisher’s Note: The statements, opinions and data contained in all publications are solely those of the individual author(s) and contributor(s) and not of MDPI and/or the editor(s). MDPI and/or the editor(s) disclaim responsibility for any injury to people or property resulting from any ideas, methods, instructions or products referred to in the content. |
© 2025 by the authors. Licensee MDPI, Basel, Switzerland. This article is an open access article distributed under the terms and conditions of the Creative Commons Attribution (CC BY) license (http://creativecommons.org/licenses/by/4.0/).
Copyright: This open access article is published under a Creative Commons CC BY 4.0 license, which permit the free download, distribution, and reuse, provided that the author and preprint are cited in any reuse.