
Submitted:
05 August 2025
Posted:
06 August 2025
You are already at the latest version
Abstract
Power electronics convert and control electrical power in applications ranging from electric motors to telecommunications and computing. Ongoing efforts to miniaturize these systems and boost power density demand advanced thermal management solutions to maintain optimal cooling and temperature control. Spray cooling offers an effective means of removing high heat fluxes and keeping power electronics within safe operating temperatures. This study presents an experimental investigation of flash spray cooling in a closed-loop system using R410A refrigerant. In particular, two nozzles with different spraying angles are used to study the effects of the distance between the spray nozzle and a heated flat surface, as well as the mass flow rate of the coolant. Results indicate that three key flow-pattern factors—surface coverage, impingement intensity, and liquid film dynamics—govern the heat-transfer mechanisms and determine cooling efficiency. Flash spray cooling using refrigerants like R410A demonstrates strong potential as a high-performance thermal management strategy for next-generation power electronics.
Keywords:
spray cooling
; critical heat flux
; closed loop refrigeration
; R410A
; power electronics
1. Introduction
In recent years the development of the power electronics industry in technological areas such as communication technologies, renewable energy systems, electrical vehicles, electricity distribution, etc., has led to the need to develop innovative cooling techniques to dissipate significant amounts of heat. Power electronics are characterized by intense thermal energy generation, which leads to high temperature fluctuations resulting in thermal fatigue of the devices. For example, heat fluxes of the order of 1000 W/cm2 have been observed in laser diode arrays. Undermining efficient heat dissipation causes the appearance of overheating points, which lead electronic components to failure. Increasing the temperature of a component from 25 to 75 °C increases the failure rate by five times, while the reliability of power electronics is halved each time their temperature increases by 10 °C [1,2]. Innovative cooling techniques are required to support the continuous reduction in the volume of electronic devices and the increase in power density, keeping component temperatures below the permissible limits set by operational requirements, construction materials and the desired service life.
The new techniques developed utilize two-phase refrigerants, trying to exploit both sensible and latent heat, for more efficient heat dissipation. Among these techniques, cooling by refrigerant spray provides the ability to dissipate significant amounts of heat with relatively low refrigerant flows, while achieving uniform distribution of low temperatures on the surfaces of electronic components. Yan et al. [3] elaborate on four heat transfer mechanisms proposed previously [4,5,6,7], that predominate during spray cooling: a) evaporation at the surface of the liquid film, b) forced convection due to the impact of droplets on the heated surface, c) enhancement of nucleation sites on heated surface d) creation of secondary nucleation sites on the surface of spray droplets. Cheng et al. [8] report that secondary bubbles activated by secondary nucleation points are due to the impact and penetration of droplets into the liquid film. The incoming droplets carry along vapors created due to evaporation during their flight, which act as nucleation points for the formation of new small bubbles [3,9]. At the same time, the impact of droplets on the surface assists the release of bubbles [8]. In general, many researchers converge on the view that the dominant heat transfer mechanism during spray cooling is the creation of secondary nucleation points [4,6,7,10]. The flow phenomena that develop near the surface as well as the use of modified surfaces or additives in fluids operation, appear to have a significant effect on spray cooling performance [9]. Table 1 summarizes spray cooling efficiency results, such as Critical Heat Flux (CHF), Heat Transfer Coefficient (HTC) and surface temperature, for previous experimental investigations.
2. Experimental Device and Procedure
2.1. Spray Chamber and Heating System
A key element of the experimental device is the spray chamber (Figure 1.a and Figure 2). A spray system for cooling power electronic devices is expected to have a modular and compact design for production applications. For the present experiment a larger cavity is used to facilitate parametric investigation of the effect of several control-parameters, such as the use of different spray nozzles and the variation of the distance between the spray outlet and the heated surface. A rather compact cylindrical spray chamber with diameter 30 mm is used, which allows optical access to the spray through Plexiglas windows on two adjacent sides. The spray is formed by either of two Danfoss solid cone nozzles (OD 5 USgal/hr or 18.93 L/hr) with nominal spray angles for oil 60° or 45°, located at the top of the chamber, at a controlled distance from the heated surface. A round smooth copper surface of 17mm diameter, at the base of the chamber, substitutes for the surface of an electronic power device from which heat is dissipated. It is the upper surface of the heating system, the base of which incorporates four resistors with a total electrical power of 4 x 400 W (Figure 1.b and Figure 2), enclosed in an aluminum casing. The upper surface of the casing is tightly connected to a cooper block, with thermally conducting paste in between. Heat is conducted through the solid copper block, whose upper section is cylindrical (neck, Figure 1), thermally insulated around the perimeter with Peek insulating material, to ensure one-dimensional heat flow in its longitudinal direction. The Peek material reaches to the upper edge of the copper cylinder and descends radially to avoid flooding of the heated surface. To determine the heat flux along the copper neck, two K-type thermocouples are fixed on its central axis, at a distance of 7 mm from each other. The spray chamber and heating system are covered with thick layers of insulation material to prevent heat losses to the environment. During the operation of the experimental device the heat flux, conducted from the electrical resistors through the copper neck to the refrigerant, is regulated with a PID controller reading the output of a thermocouple located at the base of the copper block.
2.2. Refrigeration Loop
The experimental device consists of a closed, modified refrigeration circuit (Figure 3), which utilizes elements of a domestic air conditioning unit, with a thermal power of 3.5 kW (12000 Btu/hr). The circuit is equipped with appropriate devices and sensors to control and record the operation of the system as shown in Figure 3. The choice of refrigerant (R410A) was based on the appropriate fluid thermal and environmentally friendly characteristics [11,13].
The operation of the closed refrigeration loop can be described with the help of the indicative thermodynamic cycle presented in Figure 4 (capital letters correspond to the components in Figure 3). Point 1 represents the inlet to the compressor, A, which compresses the refrigerant vapor to high pressure and temperature (point 2). The overheated vapor from point 2 enters the condenser, B, exchanging heat with the ambient, and the heat exchanger, C, exchanging heat with the return loop to the compressor inlet (point 1). These two apparatuses are connected in parallel, with corresponding outlets 3 and 4, which are mixed at this location. The liquid mixture undergoes a pressure reduction through the expansion valve, D, and point 5 corresponds to the two phase mixture in the separator, E. Liquid from the separator is driven to the inlet of the spray nozzle, 6, whereas a part of the vapor in the separator, 10, may flow through suitable valves and a pressure regulator to the outlet of the spray chamber, 11. The liquid from point 6 undergoes expansion to a two phase mixture in the spray nozzle to point 7, and then adjusts its pressure to the pressure of the spray chamber to point 8. From point 8 to point 9 the refrigerant mixture is heated under constant pressure and temperature, cooling the heated surface. Point 9’ represents the two-phase mixture resulting from mixing the two-phase mixture of point 9 and the superheated vapor of point 11. From this point to the compressor inlet, 1, the mixture is heated to reach outside the two-phase area exchanging heat with the high temperature refrigerant in the heat exchanger, C.
2.3. Main Variables’ Estimation and Uncertainty
Two K-type thermocouples, as depicted in Figure 1.b, measured the temperature differential on the copper cylinder; these data were used to compute both the heat flux through the cylinder and the heat transfer coefficient at the cylinder–coolant interface. According to the Fourier law for one dimensional conduction, the heat flux q, is calculated using equation (1):
where ΔT and Δx are the temperature difference and distance between the two thermocouples, T2 and T1 respectively, in Figure 1.b. The vertical distance between the thermocouples is 7 mm. The surface temperature Tw and the heat transfer coefficient h can be calculated using the following equations (2) and (3):
where Δxw-1 is the distance between the thermocouple T1 and the upper surface of the copper cylinder. The temperature of the upper surface of the copper cylinder is Tw, while Tsat is the saturation temperature in the spray chamber, corresponding to the saturation pressure of the coolant.
Uncertainty of the thermocouple reading is approximately ± 2.5°C, across the temperature range of -30 °C to 250 °C. Pressure was measured with two Carel SPKT0 sensors: the E3P model (0.10–1.28 MPa range) has a full-scale uncertainty of ±0.01656 MPa, and the E6P model (0.00–4.50 MPa range) has a full-scale uncertainty of ±0.054 MPa. The uncertainty of the distance between the thermocouples T1 and T2 is ± 0.1 mm, while the flow meter sensor has a full uncertainty range of ± 5% across the the range of 0.3 to 3 L/min. According to the uncertainty estimation theory [20] the heat flux measurement uncertainty for an average value of 200 W/cm2, is ± 7.00 %, while the uncertainties of surface temperature Tw and heat transfer coefficient h are ± 8.16% and ± 10.8% respectively.
3. Experimental Results
3.1. 60° Spray Nozzle Results
Diagrams presented in Figure 5 depict the results for the 60° spray nozzle. Data curves on each diagram correspond to three different mass flow rates of the coolant, m, (4.5 g/s - blue, continuous line, 5.5 g/s - green, dashed line and 6.0 g/s - red, dotted dashed line). The pair of diagrams in each row refer to a different distance between the nozzle outlet and the surface, H = 15, 20, 25, 30 and 35 mm. The first column, (a) shows the correlation of heat flow rate, q, to overheating, i.e. the difference between the surface temperature and the saturation temperature. The second column (b) includes diagrams of the heat transfer coefficient, h, relative to the heat flow rate, q. Symbols of each measurement curve, as indicated in the legend, refer to the distance between the nozzle outlet and the heated surface, H (mm), to the nominal spray angle of the nozzle, θ (degrees), and the mass flow rate of the coolant, m (g/s).
Diagrams of the first column (a), illustrate the evolution of heat flow rate, q, with regard to overheating, ΔTsat. At low degrees of overheat, the progression is effectively linear. At small nozzle–surface distance levels, all mass flow rates produce curves with a nearly constant slope that terminates at progressively higher overheat values as the gap widens (see successive diagrams). Beyond this linear region, the slope between adjacent points falls off sharply. In contrast, the largest nozzle–surface distances yield an extended linear regime—reaching higher overheat values—but with a reduced, flow-rate-dependent slope. These cases also attain substantially greater overheat and heat flux at the curve endpoints. According to the previously presented equations, the slope of the line from the origin to each data point directly quantifies the heat transfer coefficient, h.
This quantitative relationship is shown in column (b) of the figure, where the heat transfer coefficient, h, is plotted versus heat flow rate, q. Initially, h rises from about 8–11 W/cm²·K as q increases. Beyond a certain q threshold, however, h falls off sharply at small nozzle–surface distance levels, while at larger gaps the decline is more gradual or even imperceptible. The peak h is then followed by a steep drop, indicating a severe breakdown of heat-transfer performance and likely the onset of surface drying and critical heat flux (CHF). Surface drying refers to the presence of vapor on the heated surface, which leads to severe degradation of heat transfer coefficient due to the significantly lower conductivity of the vapor. Surface drying may occur either due to intense vapor formation at the nucleation sites on the surface, within the liquid film formed over it (film boiling) or due to the disruption of the thin liquid film due to the evaporation at the surface of the liquid and droplet impingent. Consequently, it should be noted that the critical heat flux in spray cooling, despite the sharp drop in coefficient, h, for small variations of q, does not have the characteristics of an instantaneous burnout point, as in pool boiling, since the constant impact of droplets delays the immediate dry out of the surface with a stable film of vapor. In any case, the occurrence of surface drying at random locations leads to the reduction of the average heat transfer coefficient, abruptly at short distances of the nozzle, and more gradually at larger ones. It is interesting that for successive distances of the nozzle the taxonomy of curves for each flow rate does not show a consistent trend, probably due to the different contribution of the heat transfer mechanisms mentioned in the introduction [3], a feature which will be further discussed later. However, it seems that initially, increasing the distance of the nozzle from the surface results in a shift in the value of the critical heat flux to larger values, with a parallel small increase in the maximum heat transfer coefficient, although at the greatest distance studied, the values of the coefficient show small variations at much smaller values.
At a mass flux of 5.5 g/s and a distance of 30 mm, the heat transfer coefficient peaks at 13.4 W/cm²·K for a heat flux of q=173.6 W/cm². At 4.5 g/s and 20 mm, h reaches 13.0 W/cm²·K at q=174.9 W/cm². Increasing the distance to 35 mm (maximum distance level) delays CHF to approximately 240 W/cm² but reduces h to about 8 W/cm²·K.
3.2. 45° Spray Nozzle Results
Corresponding diagrams of the 45° spray nozzle are presented in Figure 6. Excluding nozzle spray angle, all other controlled experimental conditions are the same as for the 60° nozzle. On the left column of the figure, development trends are rather similar to those of the 60° nozzle, although the slope in the first part of the curves is always weaker. Change in the linear trend is in general less obvious and is prolonged to higher overheat values. The curves terminate at higher overheat values and lower heat flux levels. Similar trends are also observed in the diagrams of the heat transfer coefficient, in the right column of the figure, although its values are in all cases lower. Differences in the evolution between the three curves for the different mass flow rates are even smaller than for the 60° nozzle in most cases. The heat transfer coefficient initially increases almost imperceptibly as the heat flux is increased. Degradation of the heat transfer mechanisms is reached at lower heat fluxes although the decline of the heat transfer coefficient afterwards is more gradual.
Maximum value of the heat transfer coefficient, h=8.9 W/cm2K, is obtained for flow rate of 4.5 g/s, at a distance of 20 mm, and heat flux q=109.0 W/cm2. Again, a delay of the critical heat flux (q= ~220 W/cm2), at the greater distance of 35 mm, seems to be achieved, at the cost of a rather low heat transfer coefficient (h= ~5.5 W/cm2K).
4. Discussion
4.1. Effect of PID Tuning on Heat Flux
A notable decline in heat flux was observed in the final stages of some test cases, particularly when conditions approached or exceeded the degradation of the heat transfer and the critical heat flux (CHF) threshold. This behavior is illustrated in Figure 5.a and Figure 6.a, where heat flux initially increases with surface overheating but then peaks and subsequently declines. This phenomenon is closely linked to the thermal control strategy utilizing a PID controller, which regulates power input to the heating resistors based on a setpoint temperature, while the saturation temperature in the spray chamber remains constant at a specific pressure of the two-phase refrigerant mixture.
The heat flux transferred from the heated surface to the coolant is governed by the temperature difference between the PID setpoint and saturation temperature, in conjunction with the total thermal resistance of the system. The latter is the sum of the thermal resistance due to the conduction within the copper block and stem and that due to the convection coefficient formed by the two-phase heat transfer mechanisms between the surface and the coolant, connected in series. As the heat flux approaches CHF, a degradation of the heat transfer mechanism or even localized surface drying starts to develop, creating vapor patches which hinder heat transfer due to the significantly lower thermal conductivity of vapor in comparison with that of the surrounding liquid. This leads to an increase in total thermal resistance, throttling heat transfer.
Due to the low heat transfer coefficient, close and beyond the critical heat flux conditions, the total thermal resistance increases. Therefore, with the same PID setting and the same saturation temperature the higher overall heat resistance results in lower heat flux. The total thermal resistance sometimes becomes so large that despite the increase in the control temperature of the PID the overall heat flow rate decreases, as observed in the latter portions of the curves in Figure 5.a and Figure 6.a.
4.2. Effect of Nozzle-to-Surface Distance and Spray Angle
The distance between the spray nozzle and the heated surface (denoted as H) significantly influences both the critical heat flux and the heat transfer coefficient. As shown in Figure 5 and Figure 6, increasing the nozzle-surface distance results in a general shift of the CHF toward higher heat flux values.
For instance, with the larger angle nozzle (Figure 5), increasing H from 15 mm to 35 mm raises the CHF from approximately 175 W/cm² to around 240 W/cm². However, this comes at the cost of a reduced maximum heat transfer coefficient, which drops from about 13.4 W/cm²·K (at H = 30 mm) to ~8 W/cm²·K (at H = 35 mm), as seen in Figure 5.b. A similar effect is depicted for the 45° nozzle (Figure 6), although both h and CHF are generally lower across all distances due to the narrower spray cone.
Assuming a uniform spray distribution and using Danfoss SPKT0 solid-cone nozzles—whose nominal spray angles are specified with oil as the working fluid—the 60° nozzle would theoretically cover nearly 100% of the target surface at 15 mm and expand to about 450% of that area at 35 mm. In contrast, the 45° nozzle would cover only 53% at 15 mm and reach about 190% coverage at 35 mm. However, optical observations show that refrigerant spray behaves more like a cylindrical jet (Figure 3), producing a smaller wetted area at each distance. Besides the use of different liquid and inlet conditions this is due to evaporation of droplets before impact, especially in the periphery of the spray, narrowing of the jet by the chamber back-pressure [21], and recirculating flows near the surface which further distort the pattern. Consequently, the actual coverage is consistently lower than the nozzles’ oil-based specifications would imply.
These phenomena profoundly affect the four heat-transfer modes described in the introduction. At small nozzle–surface distances, the 45° nozzle’s spray strikes only the central zone – where droplet impact enhances heat transfer – while the peripheral region supports a radially outward liquid film that transfers heat primarily by surface evaporation. This film flow not only yields a lower local heat-transfer coefficient but also sweeps away developing nucleation sites. Consequently, the 45° nozzle’s average coefficient is lower than the 60° nozzle’s, whose wider spray covers more area despite slower droplets. The peripheral film under the 45° nozzle also dries out more rapidly, precipitating CHF at lower heat fluxes. As the nozzle-surface distance increases, both sprays broaden to envelop the entire surface – suppressing dry-patch formation and delaying CHF – but the reduced droplet velocity limits impact-enhanced heat transfer, so average heat-transfer coefficients decline for both nozzle angles.
4.3. Effect of Mass Flow Rate
Mass flow rate of the refrigerant spray (denoted as m) is also critical for spray thermal performance. For the 60° nozzle (Figure 5), the highest heat transfer coefficient of 13.4 W/cm²·K is achieved at m = 5.5 g/s and H = 30 mm. Similarly, at m = 4.5 g/s and H = 20 mm, a nearly equivalent h value of 13.0 W/cm²·K is observed. These peaks coincide with heat fluxes near 175 W/cm². At even higher mass flow (6.0 g/s), however, performance gains are limited or reversed. In contrast, for the 45° nozzle (Figure 6), the influence of mass flow rate is more subdued. The peak h of 8.9 W/cm²·K is observed at m = 4.5 g/s and H = 20 mm, with diminishing improvements at higher flow rates.
Overall, the results suggest that the flow patterns developing over the heated surface, and their effect on the activation of the four heat transfer mechanisms associated with spray cooling, play a decisive role in the achieved heat transfer coefficient and the delay of CHF effects. Three performance factors can be identified in this respect.
1. Uniform spray coverage is essential to engage all four heat-transfer mechanisms. When droplet impact is confined to the central region, the surrounding liquid film relies solely on surface evaporation and is prone to dry-spot formation—explaining the lower efficiency of the narrower-angle nozzle.
2. High-velocity droplet impingement enhances heat transfer by breaching the liquid film, activating all four mechanisms, and suppressing local dry-out.
3. A thin liquid film maximizes the efficacy of droplet-induced mechanisms, delivering high heat-transfer coefficients up to near-CHF conditions, beyond which random dry spots emerge.
These combined effects account for the peak coefficients observed with the high-angle nozzle at m = 5.5 g/s, H = 30 mm and m = 4.5 g/s, H = 25 mm—and their subsequent decline. Conversely, at larger nozzle–surface distances, low-velocity droplets promote a thick film that both reduces h and delays CHF.
In summary, optimal spray cooling demands uniform, high-intensity coverage at tuned mass flows to prevent thick-film formation. Practical implementations must also address spatial variations in heat-transfer modes to minimize surface temperature non-uniformities.
4.4. Comparison of the Present Results with Those of Lin et al. [13]
Comparison of results between similar experimental investigations can provide significant insight into the effect of the different experimental realizations. A comparison between the current experimental data and the results reported by Lin et al. [13] is attempted to evaluate the consistency and performance of the flash spray cooling system using R410A in a closed-loop configuration. Lin et al. utilized a similar spray cooling setup, also employing a flat heated surface and the same refrigerant. A full-cone spray nozzle (Spraying Systems Co. TG-XX), with 60° nominal spray angle for water, was installed within a somewhat larger cylindrical chamber of 50mm diameter. The heated copper surface was located 8 mm over the bottom of the chamber to reduce the influence of reflected droplets and avoid liquid accumulation on the surface. Figure 7 shows the present results for a coolant mass flow rate of m=5.5 g/s, in comparison with those of Lin et al. for m=6.7 g/s, for different nozzle-to-surface distances (H = 15, 20, 25, 30, 35 mm). The nominal spray angle for both experiments is 60°.
Figure 7.a compares the variation of heat flux, q, as a function of surface overheating, Δtsat, in the two investigations. Both sets of data exhibit similar trends: an almost initial linear increase in heat flux with overheating, followed by a gradual deviation from linearity as the CHF conditions are approached. The present results show slightly lower maximum heat flux values than those of Lin et al., and the slope of the curves is in general different.
Similarly, Figure 7.b illustrates the heat transfer coefficient, h, as a function of heat flux, q, for the same experimental conditions. An almost linear increase is observed for low q values, which after reaching a peak is followed by a decline indicating a degradation of heat transfer efficiency.
Comparing Lin et al. findings to the present results underscores the three key factors—surface coverage, droplet-impingement intensity, and film thickness—and their influence on the four spray-cooling heat-transfer mechanisms. Despite sharing a nominal spray angle, Lin et al. water nozzle operating with R410 refrigerant exhibits a larger effective spray angle (though still under 60°) than the Danfoss oil nozzle used here. Consequently, it delivers wider and more uniform surface coverage at comparable nozzle–surface distances with higher-velocity droplets.
This combination yields optimal performance at H = 25 mm, where a thin, continuously refreshed liquid film engages all four heat-transfer modes. In Figure 7a, the q-versus-ΔT curves become vertical—or even slope negatively—showing that a small overheat drives ever-increasing heat fluxes. These intense conditions translate into the markedly higher heat-transfer coefficients seen in Figure 7b, significantly exceeding our own results. As q rises further, however, film thinning and random dry-spot formation trigger CHF onset.
Similar but slightly less optimal behavior occurs at H = 20 mm. At H = 30 mm, reduced droplet count and lower velocities limit mechanism activation, resulting in lower h and earlier CHF at smaller q values. Overall, our trends and magnitudes align closely with Lin et al., validating both methodologies.
This comparison highlights the pivotal roles of spray coverage, impingement intensity, and film thickness in maximizing h and delaying CHF, reinforcing the broader applicability of flash spray cooling for power-electronics thermal management.
5. Concluding Remarks and Future Directions
This experimental investigation demonstrated the thermal performance of a flash spray cooling system using R410A in a closed-loop configuration, aiming to enhance heat dissipation for power electronics applications. Key variables such as nozzle spray angle, mass flow rate, and nozzle-to-surface distance were systematically examined. The results highlight the complex interplay between spray characteristics and cooling efficiency. Three factors characterizing the significance of flow patterns developed over the heated surface have been identified. Namely, the uniformity of the coverage of the heated surface by the spray, the intensity of the droplet impingement on the surface, and the thickness of the liquid film and flooding on the surface.
The 60° nozzle configuration consistently outperformed the 45° nozzle in terms of both critical heat flux (CHF) and heat transfer coefficient (HTC), particularly at intermediate mass flow rates (around 5.5 g/s) and nozzle distances of 20–30 mm. The findings underscore the importance of balancing spray impingement intensity and surface coverage to optimize nucleation and avoid premature surface drying. Increasing nozzle distance led to delayed CHF, albeit at the cost of reduced heat transfer coefficients due to diminished droplet momentum and increased liquid film stability.
Furthermore, the experimental results align closely with those reported in previous studies, notably Lin et al. [13], validating the robustness and repeatability of the experimental setup and confirming the applicability of flash spray cooling in high-heat-flux environments.
Looking forward, several directions can be pursued to extend this research:
- Surface Enhancement: Preliminary results on microstructured surfaces (e.g., hexagonal pyramids) suggest substantial improvements in both CHF and heat transfer coefficients. Further investigations could explore different surface geometries, wettability modifications, or nano-coatings to optimize droplet dynamics and nucleation site density.
- Dynamic Load Conditions: Most current tests were conducted under steady-state conditions. Studying transient thermal loads would offer more realistic insights into spray cooling behavior in practical electronic devices, particularly those subjected to pulsed or rapidly varying power demands.
- Droplet Characterization and Visualization: High-speed imaging and laser diagnostics (e.g., PIV or LIF) could provide deeper insights into the droplet impact dynamics, surface wetting behavior, and film formation, leading to better physical models of spray-surface interactions.
- Closed-loop Control Optimization: The PID control strategy could be further tuned or even replaced with model-predictive or adaptive control algorithms to respond more intelligently to the onset of CHF and mitigate surface drying conditions.
- Alternative Refrigerants: While R410A performed well in this study, exploration of low-GWP (Global Warming Potential) refrigerants or environmentally safer alternatives (e.g., R1234yf, CO₂) would align the system with future regulatory and sustainability targets.
In conclusion, flash spray cooling using refrigerants like R410A demonstrates strong potential as a high-performance thermal management strategy for next-generation power electronics. Optimizing nozzle configuration, refrigerant delivery, and surface design can yield significant gains in cooling efficiency and system reliability, paving the way for compact and robust electronic devices capable of handling higher thermal loads.
Acknowledgment
This work has received funding from the General Secretariat for Research and Innovation in the frame of Greece - China Joint RT&D Project T7ΔKI-00022, High Efficiency Heat Dissipation and Energy Conservation for Ultra-High Power Electronic Devices Based on Flashing Spray (SprayElectroCooling).
List of abbreviations
| CHF | Critical Heat Flux |
| h | Heat Transfer Coefficient (W/cm²·K) |
| q | Heat Flux (W/cm²) |
| ΔTsat | Surface Overheating (Tw − Tsat), Temperature difference between surface and refrigerant saturation temperature |
| PID | Proportional–Integral–Derivative (Controller) |
| R410A | Refrigerant type used in the experiments |
| H | Distance between nozzle and heated surface (mm) |
| m | Mass Flow Rate of Refrigerant (g/s) |
| Tw | Surface Temperature of Heated Copper Block (°C) |
| Tsat | Saturation Temperature of Refrigerant (°C) |
| θ | Spray Cone Angle (degrees) |
| HTC | Heat Transfer Coefficient |
| PEEK | Polyether Ether Ketone (insulating material) |
| L/min | Liters per Minute |
| MPa | Megapascal (unit of pressure) |
| GWP | Global Warming Potential |
| PIV | Particle Image Velocimetry |
| LIF | Laser-Induced Fluorescence |
References
- Oh, H.; Han, B.; McCluskey, P.; Han, C.; Youn, B.D. Physics-of-Failure, Condition Monitoring, and Prognostics of Insulated Gate Bipolar Transistor Modules: A Review. IEEE Trans Power Electron 2015, 30, 2413–2426. [CrossRef]
- Künzi, R. Thermal Design of Power Electronic Circuits. In Proceedings of the CERN Accelerator School: Power Converters, CAS 2014 - Proceedings; CERN, 2018; pp. 311–327.
- Yan, Z.; Zhao, R.; Duan, F.; Neng, T.; Chuan, K.; Fah, K.; Keong, P.; Sheng, Y. Spray Cooling. In Two Phase Flow, Phase Change and Numerical Modeling; 2011.
- Pais, M.R.; Chow, L.C.; Mahefkey, E.T. Surface Roughness and Its Effects on the Heat Transfer Mechanism of Spray Cooling. J Heat Transfer 1992, 114, 211–219. [CrossRef]
- Mesler, R.; Mailen, G. Nucleate Boiling in Thin Liquid Films. AlChE Journal 1977, 23, 954–957. [CrossRef]
- Yang, J.; Chow, L.C.; Pais, M.R. Nucleate Boiling Heat Transfer in Spray Cooling. Transactions of the ASME 1996, 118, 668–671.
- Rini, D.P.; Chen, R.H.; Chow, L.C. Bubble Behavior and Nucleate Boiling Heat Transfer in Saturated FC-72 Spray Cooling. J Heat Transfer 2002, 124, 63–72. [CrossRef]
- Cheng, W.L.; Zhang, W.W.; Chen, H.; Hu, L. Spray Cooling and Flash Evaporation Cooling: The Current Development and Application. Renewable and Sustainable Energy Reviews 2016, 55, 614–628. [CrossRef]
- Liang, G.; Mudawar, I. Review of Spray Cooling – Part 1: Single-Phase and Nucleate Boiling Regimes, and Critical Heat Flux. Int J Heat Mass Transf 2017, 115, 1174–1205. [CrossRef]
- Mesler, R. Discussion: “Surface Roughness and Its Effects on the Heat Transfer Mechanism of Spray Cooling” (Pais, M. R., Chow, L. C., and Mahefkey, E. T., 1992, ASME J. Heat Transfer, 114, Pp. 211–219). J Heat Transfer 1993, 115, 1083–1083. [CrossRef]
- Wang, S.; Zhou, Z.; Chen, B.; Thrassos, P.; Romeos, A.; Giannadakis, A. Dynamic Thermal Management of Flashing Spray Cooling by the Frequency Conversion of Compressor. Appl Therm Eng 2023, 218, 119322. [CrossRef]
- Zhou, Z.F.; Lin, Y.K.; Tang, H.L.; Fang, Y.; Chen, B.; Wang, Y.C. Heat Transfer Enhancement Due to Surface Modification in the Close-Loop R410A Flash Evaporation Spray Cooling. Int J Heat Mass Transf 2019, 139, 1047–1055. [CrossRef]
- Lin, Y.K.; Zhou, Z.F.; Fang, Y.; Tang, H.L.; Chen, B. Heat Transfer Performance and Optimization of a Close-Loop R410A Flash Evaporation Spray Cooling. Appl Therm Eng 2019, 159, 113966. [CrossRef]
- Bostanci, H.; Altalidi, S.S.; Nasrazadani, S. Two-Phase Spray Cooling with HFC-134a and HFO-1234yf on Practical Enhanced Surfaces. Appl Therm Eng 2018, 131, 150–158. [CrossRef]
- Liu, X.; Liu, J.; Xue, R.; Chen, L.; Hou, Y. Heat Transfer Optimization of R134a Phase Change Spray Cooling in a Closed Loop System. Exp Therm Fluid Sci 2018, 92, 248–258. [CrossRef]
- Chen, S.; Liu, J.; Liu, X.; Hou, Y. An Experimental Comparison of Heat Transfer Characteristic between R134-a and R22 in Spray Cooling. Exp Therm Fluid Sci 2015, 66, 206–212. [CrossRef]
- Yata, V.V.R.; Bostanci, H. Investigation of Spray Cooling Schemes for Dynamic Thermal Management. Proceedings of the 16th InterSociety Conference on Thermal and Thermomechanical Phenomena in Electronic Systems, ITherm 2017 2017, 744–751. [CrossRef]
- Yaddanapudi, S.J.; Bostanci, H. Spray Cooling With HFC-134a and HFO-1234yf for Thermal Management of Automotive Power Electronics. ASME International Mechanical Engineering Congress and Exposition, Proceedings (IMECE) 2016, 8B-2015. [CrossRef]
- Xu, H.; Si, C.; Shao, S.; Tian, C. Experimental Investigation on Heat Transfer of Spray Cooling with Isobutane (R600a). International Journal of Thermal Sciences 2014, 86, 21–27. [CrossRef]
- Moffat, R.J. Describing the Uncertainties in Experimental Results. Exp Therm Fluid Sci 1988, 1, 3–17. [CrossRef]
- Ji, R.J.; Zhu, D.Q.; Lin, X.W.; Zhou, Z.F.; Chen, B. Parametric Investigation on the Close-Loop R410A Flash Spray System for High Power Electronics Cooling under Low Temperature. Case Studies in Thermal Engineering 2023, 41, 102643. [CrossRef]
Figure 1.
Drawing of spray chamber (a) and heating system (b).
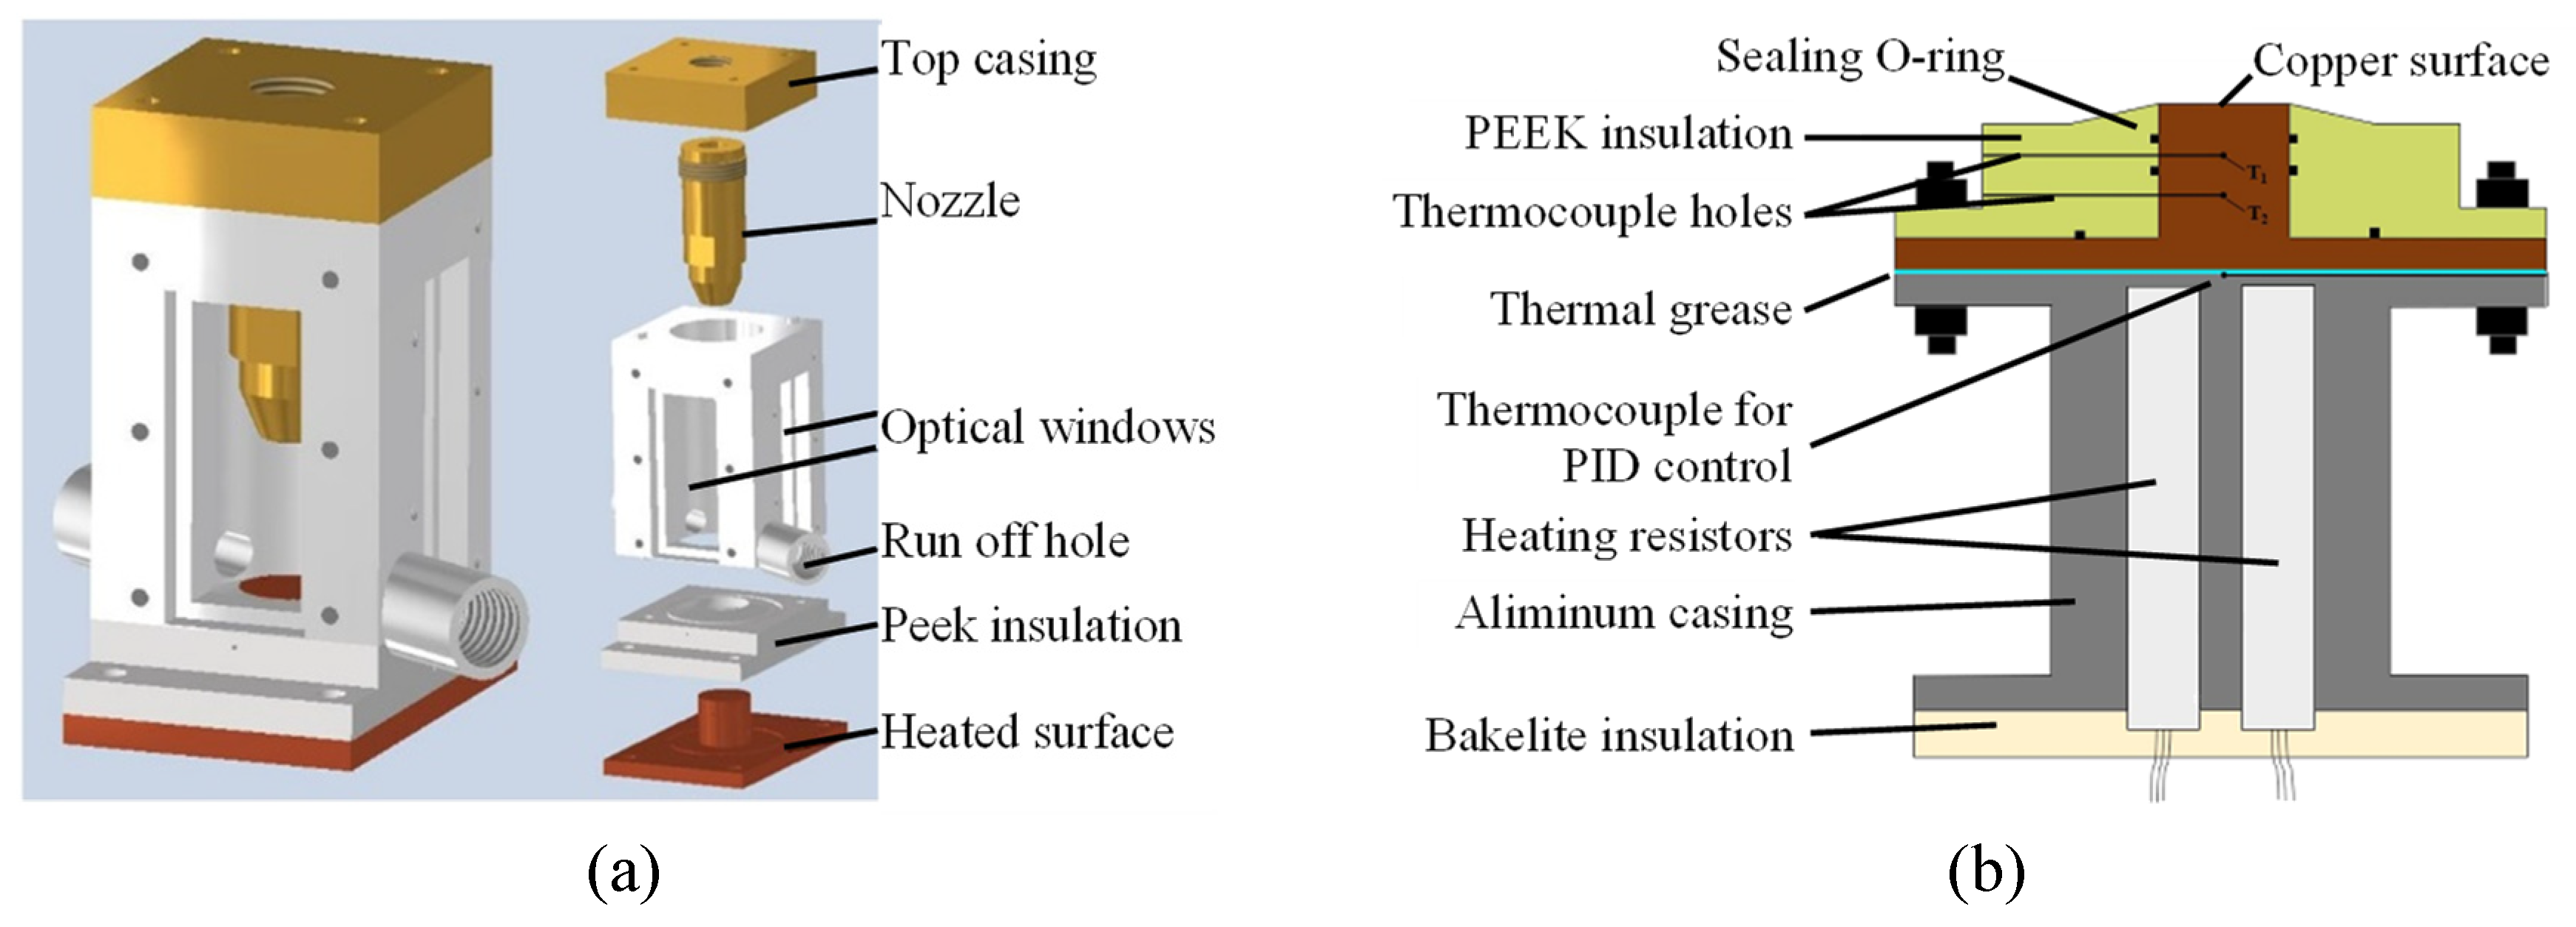
Figure 2.
Heating system and spray chamber.
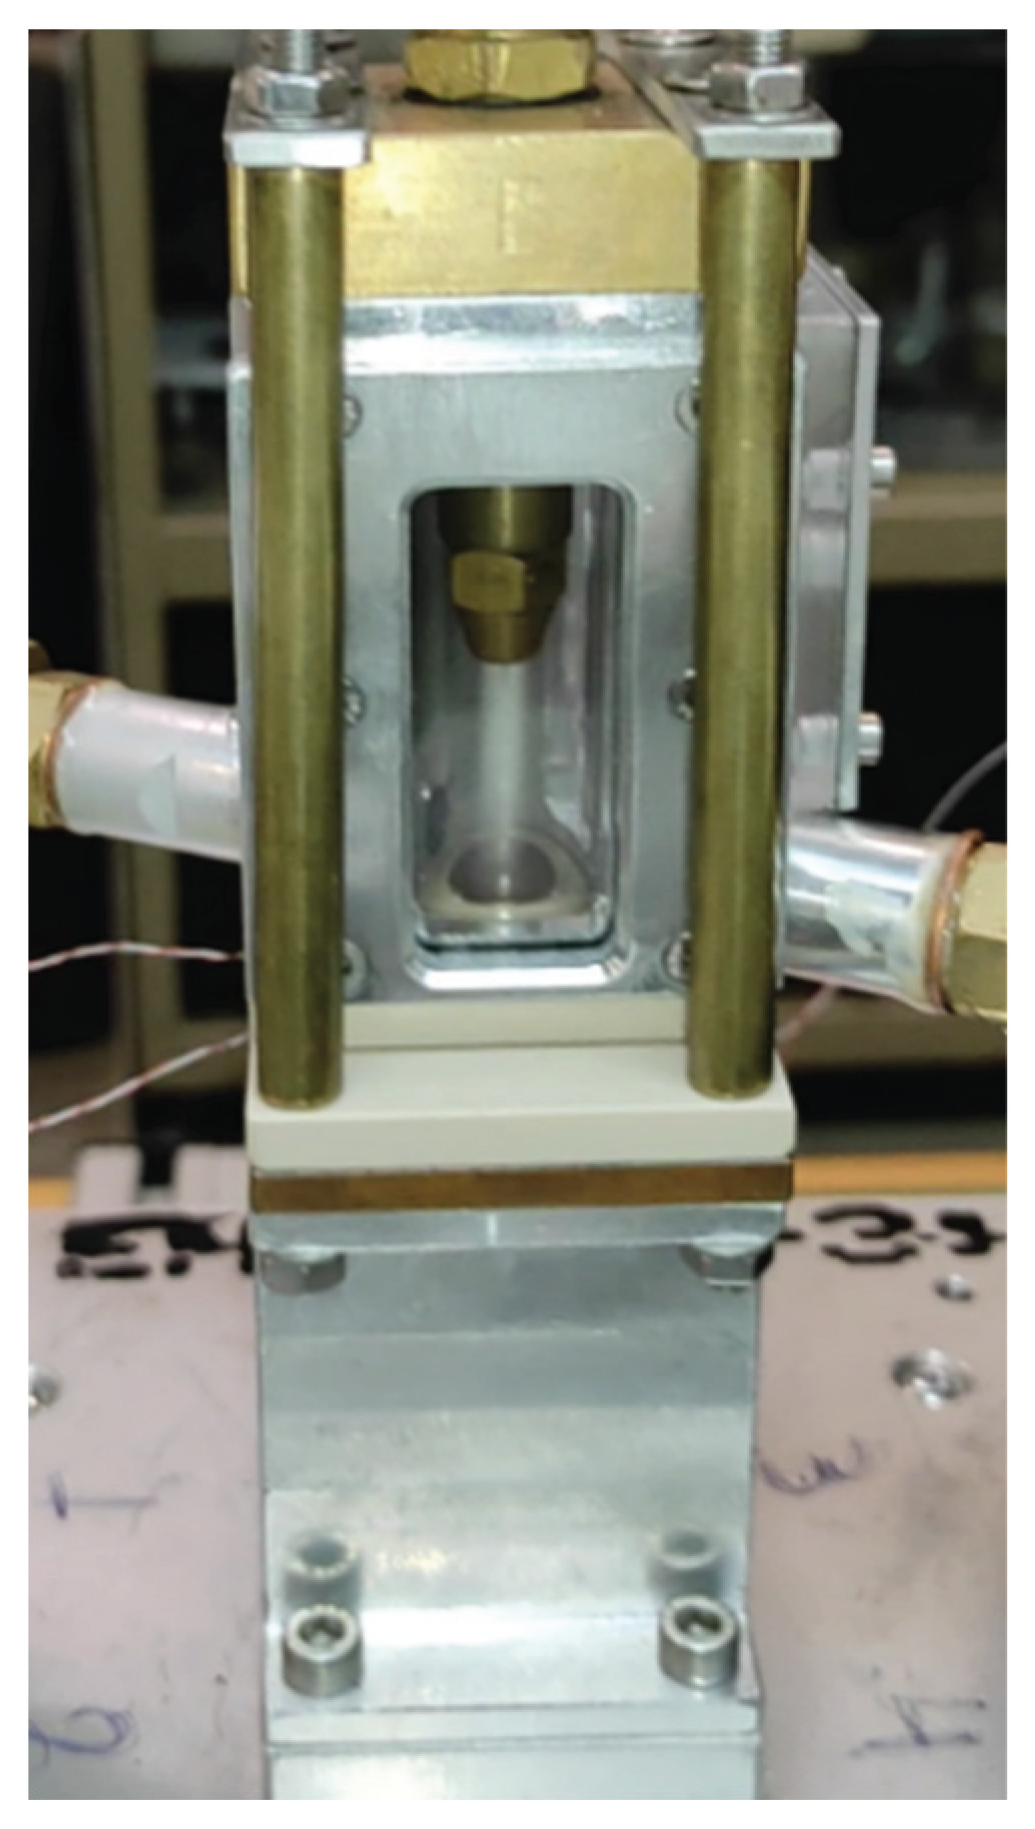
Figure 3.
Closed refrigeration loop.
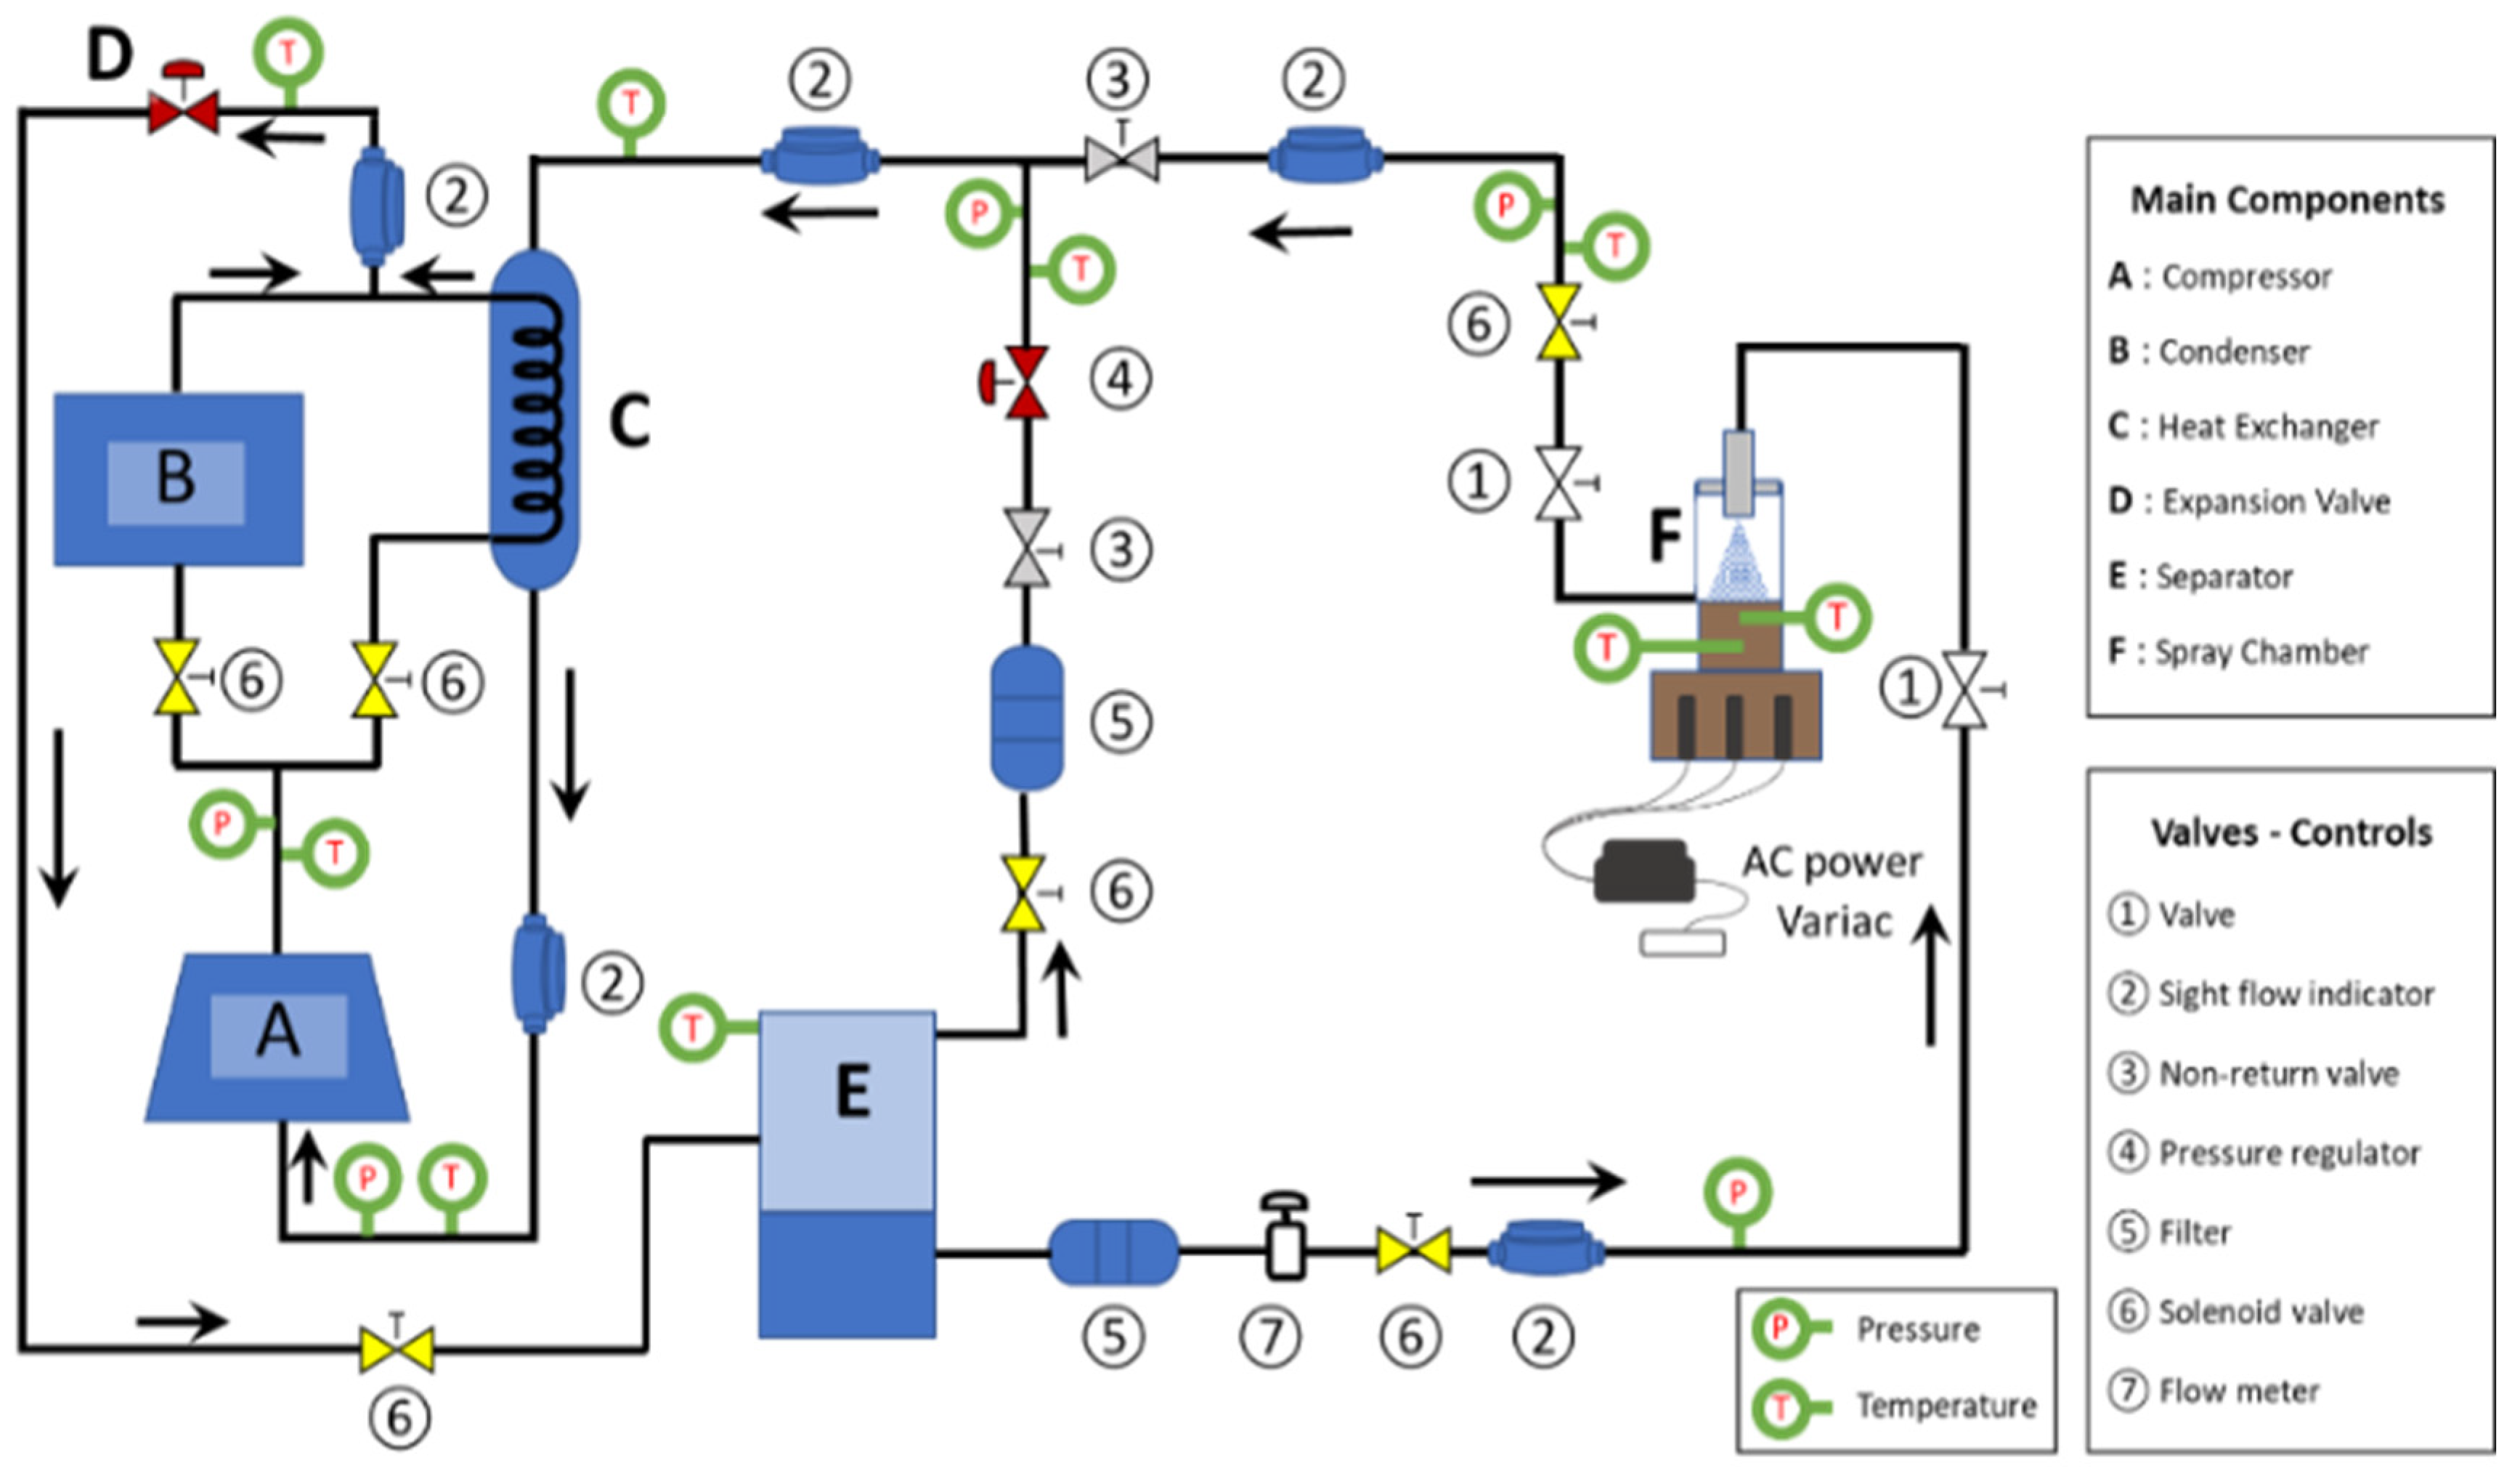
Figure 4.
Indicative refrigeration cycle.
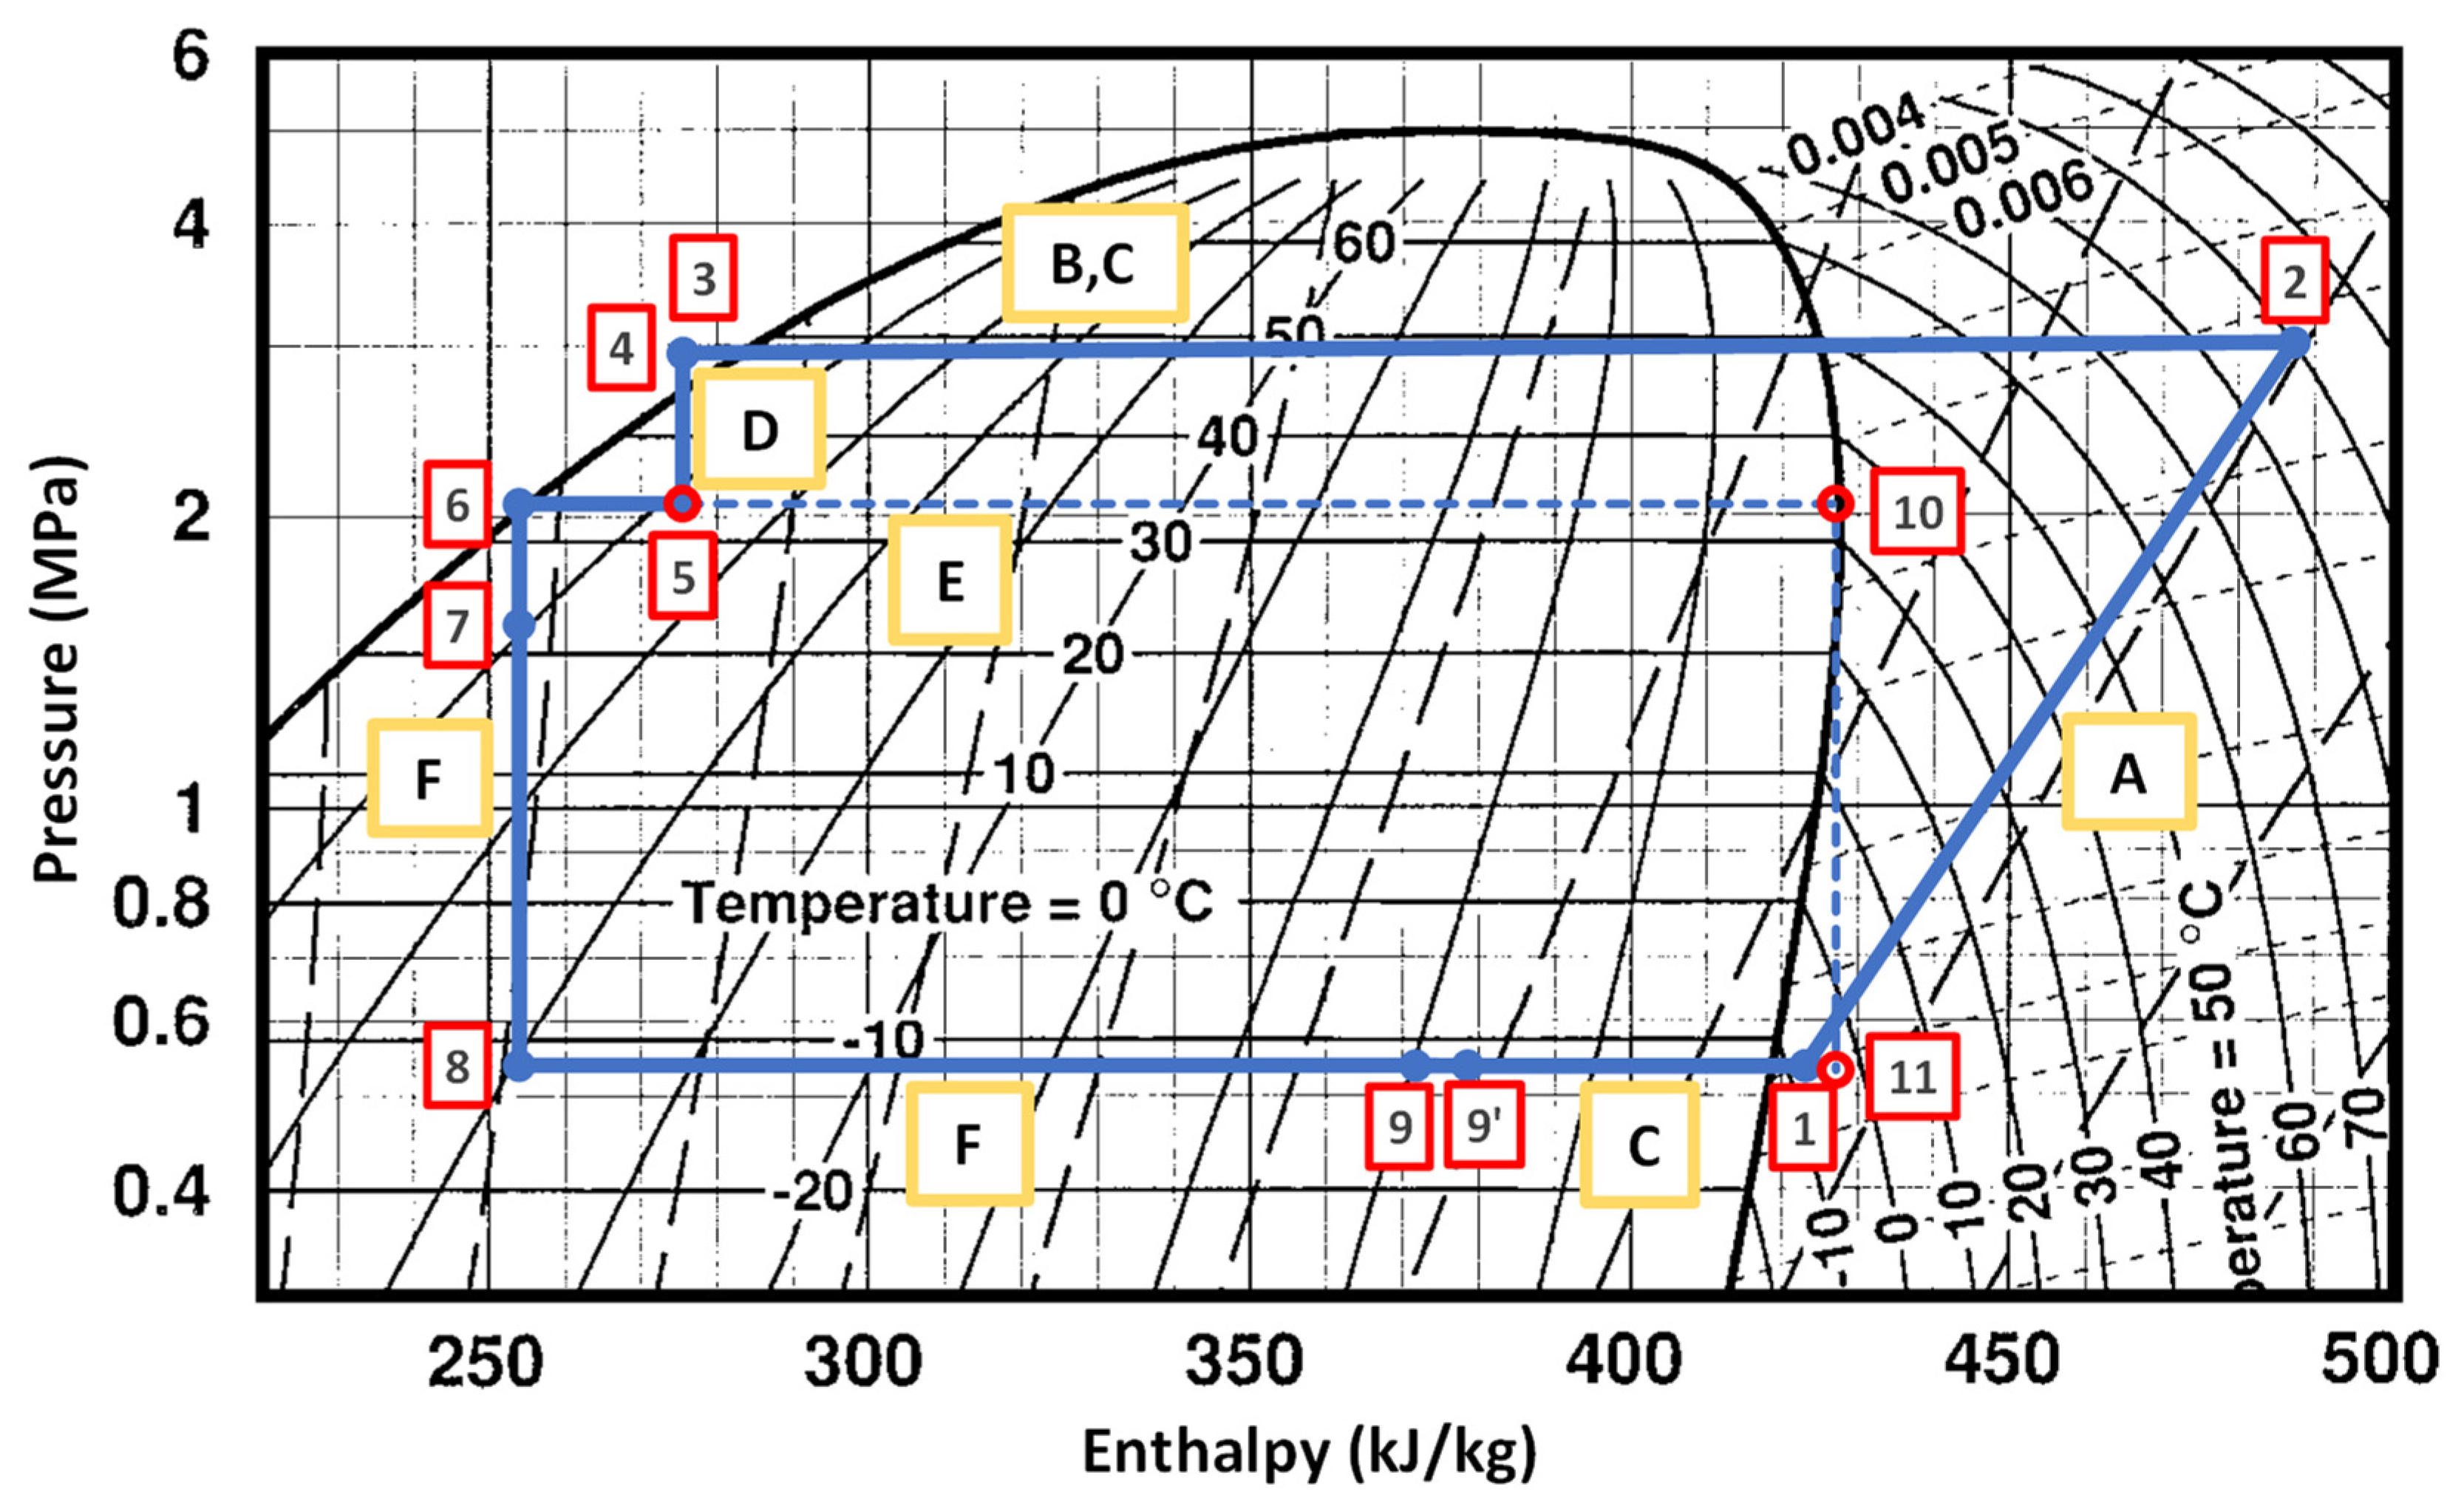
Figure 5.
(a) Heat flux, q, as a function of surface overheating, ΔTsat, and (b) Heat transfer coefficient, h, as a function of heat flux, q, for mass flows m=4.5, 5.5 and 6.0 g/s, for a flat surface at various distances, H, for the 60° nozzle.
Figure 5.
(a) Heat flux, q, as a function of surface overheating, ΔTsat, and (b) Heat transfer coefficient, h, as a function of heat flux, q, for mass flows m=4.5, 5.5 and 6.0 g/s, for a flat surface at various distances, H, for the 60° nozzle.
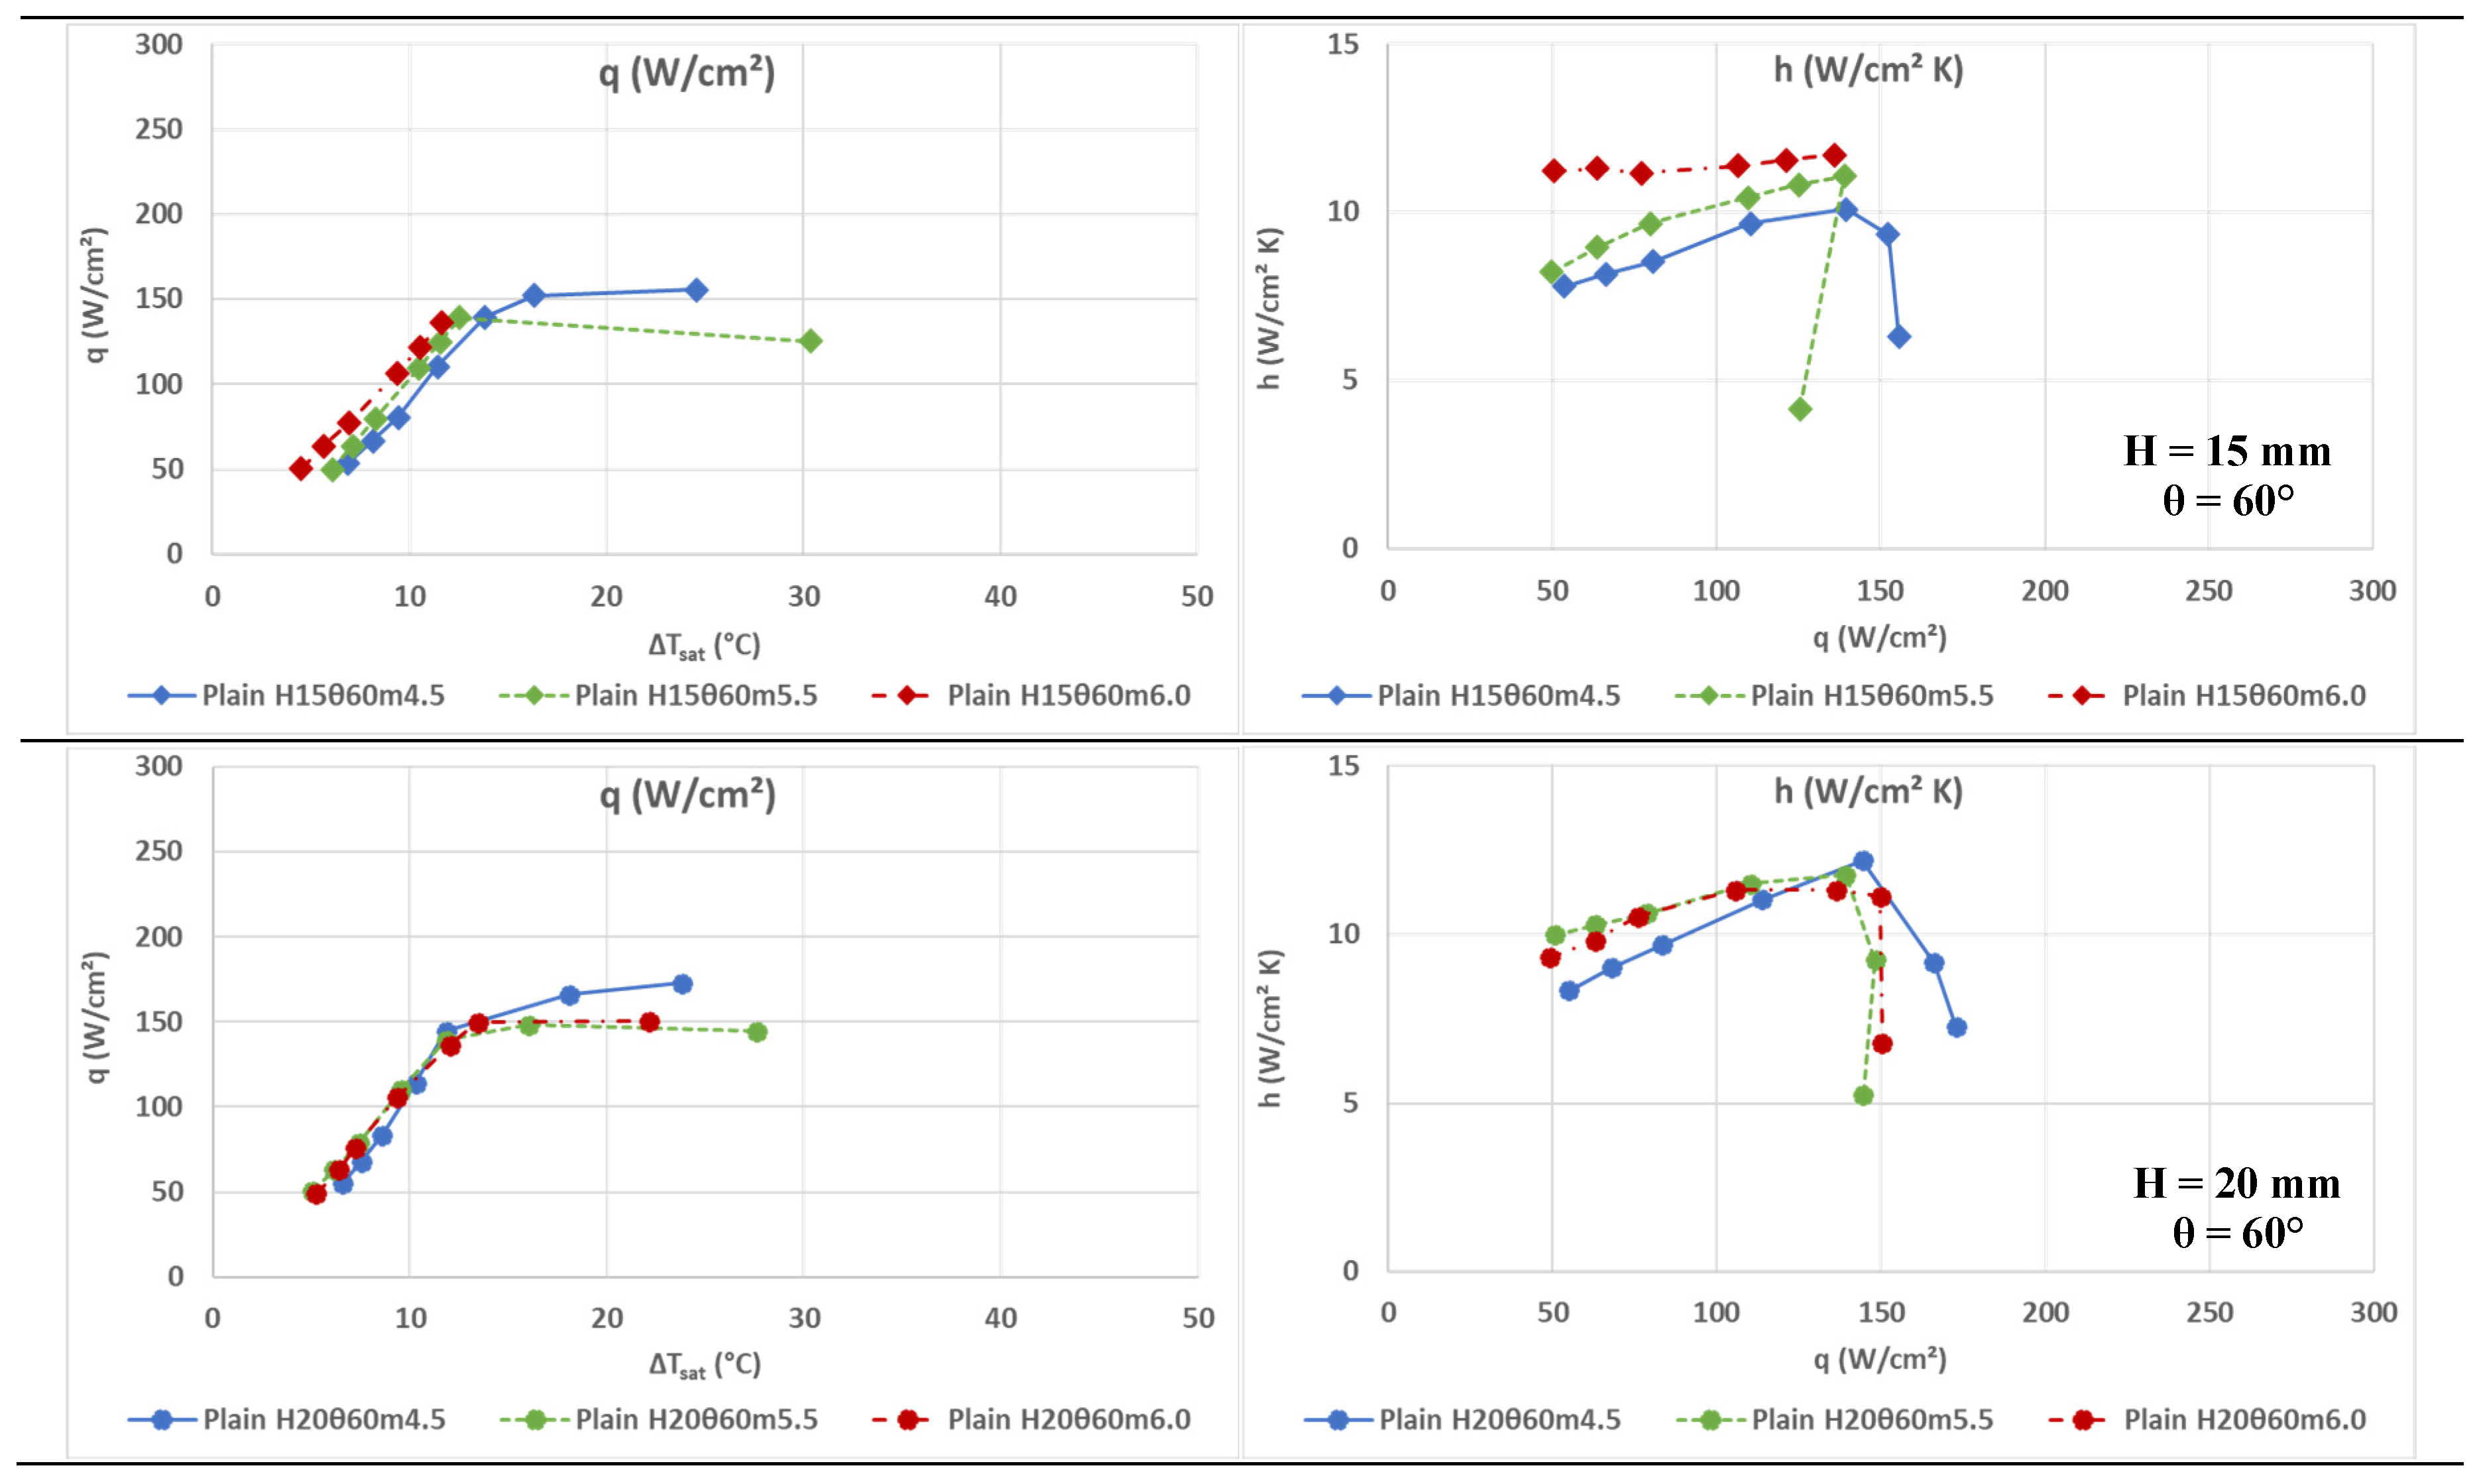
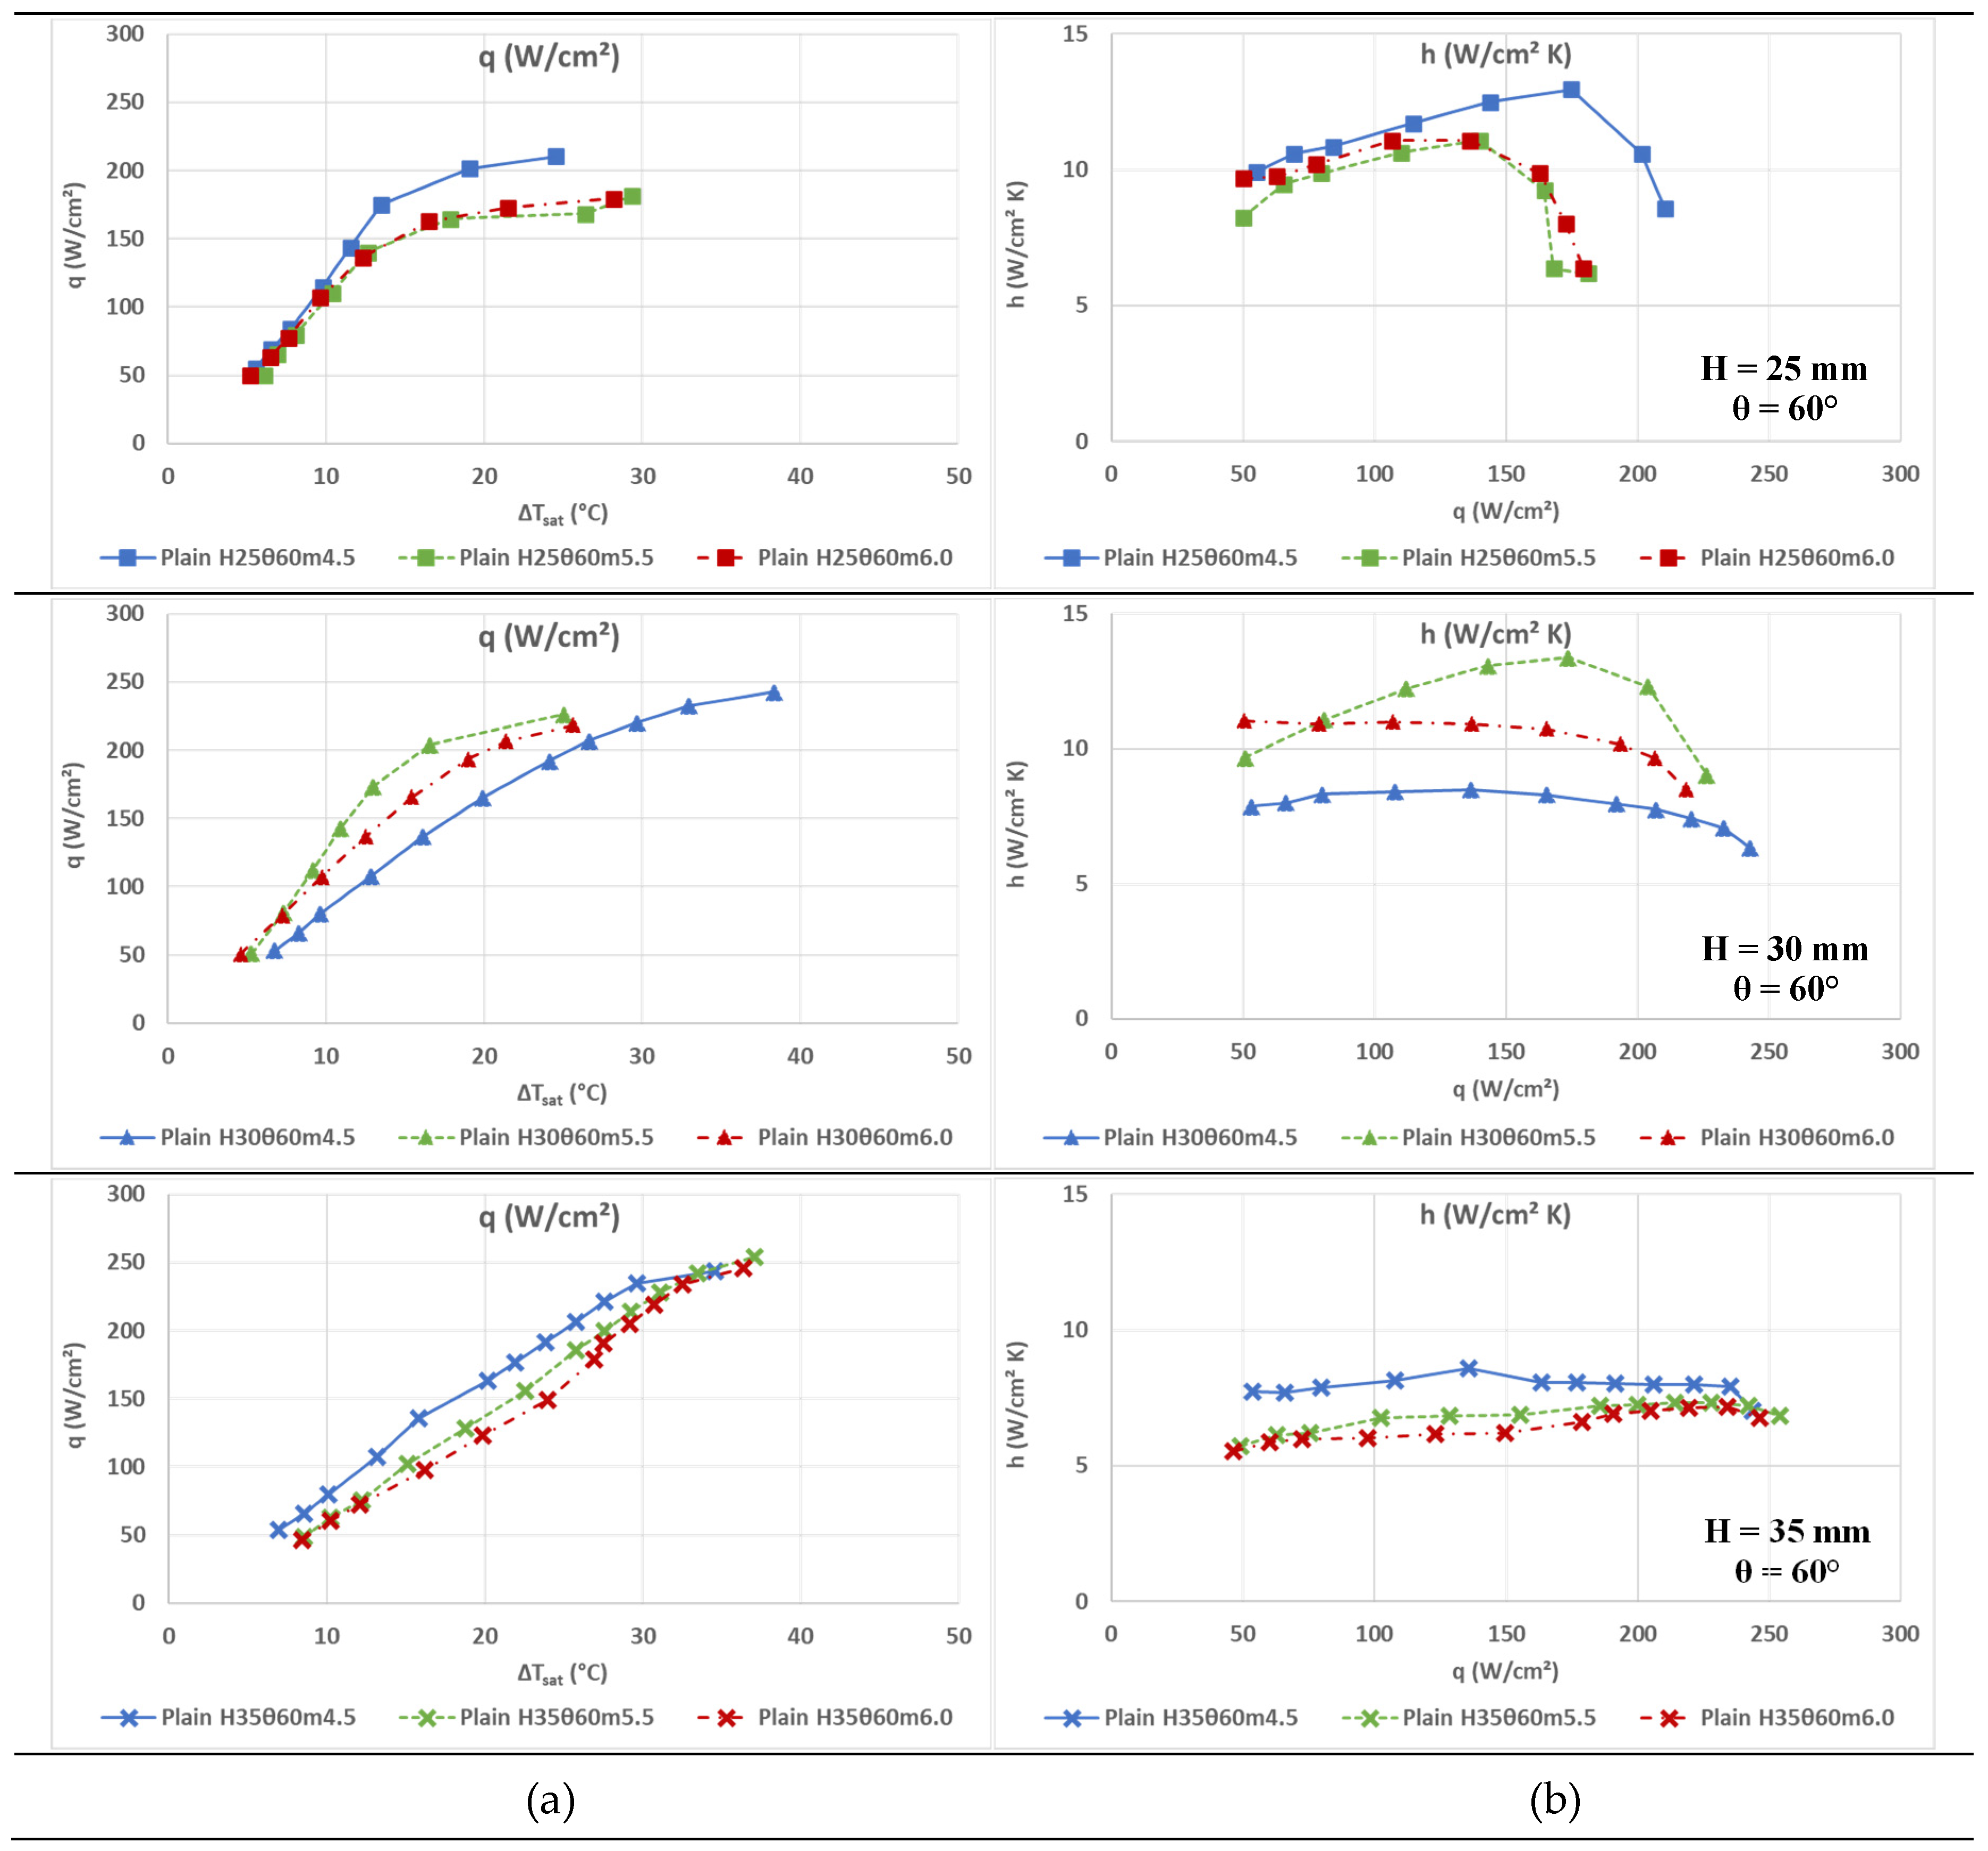
Figure 6.
(a) Heat flux, q, as a function of surface overheating, ΔTsat, and (b) Heat transfer coefficient, h, as a function of heat flux, q, for mass flows m=4.5, 5.5 and 6.0 g/s, for a flat surface at various distances, H, for the 45° nozzle.
Figure 6.
(a) Heat flux, q, as a function of surface overheating, ΔTsat, and (b) Heat transfer coefficient, h, as a function of heat flux, q, for mass flows m=4.5, 5.5 and 6.0 g/s, for a flat surface at various distances, H, for the 45° nozzle.
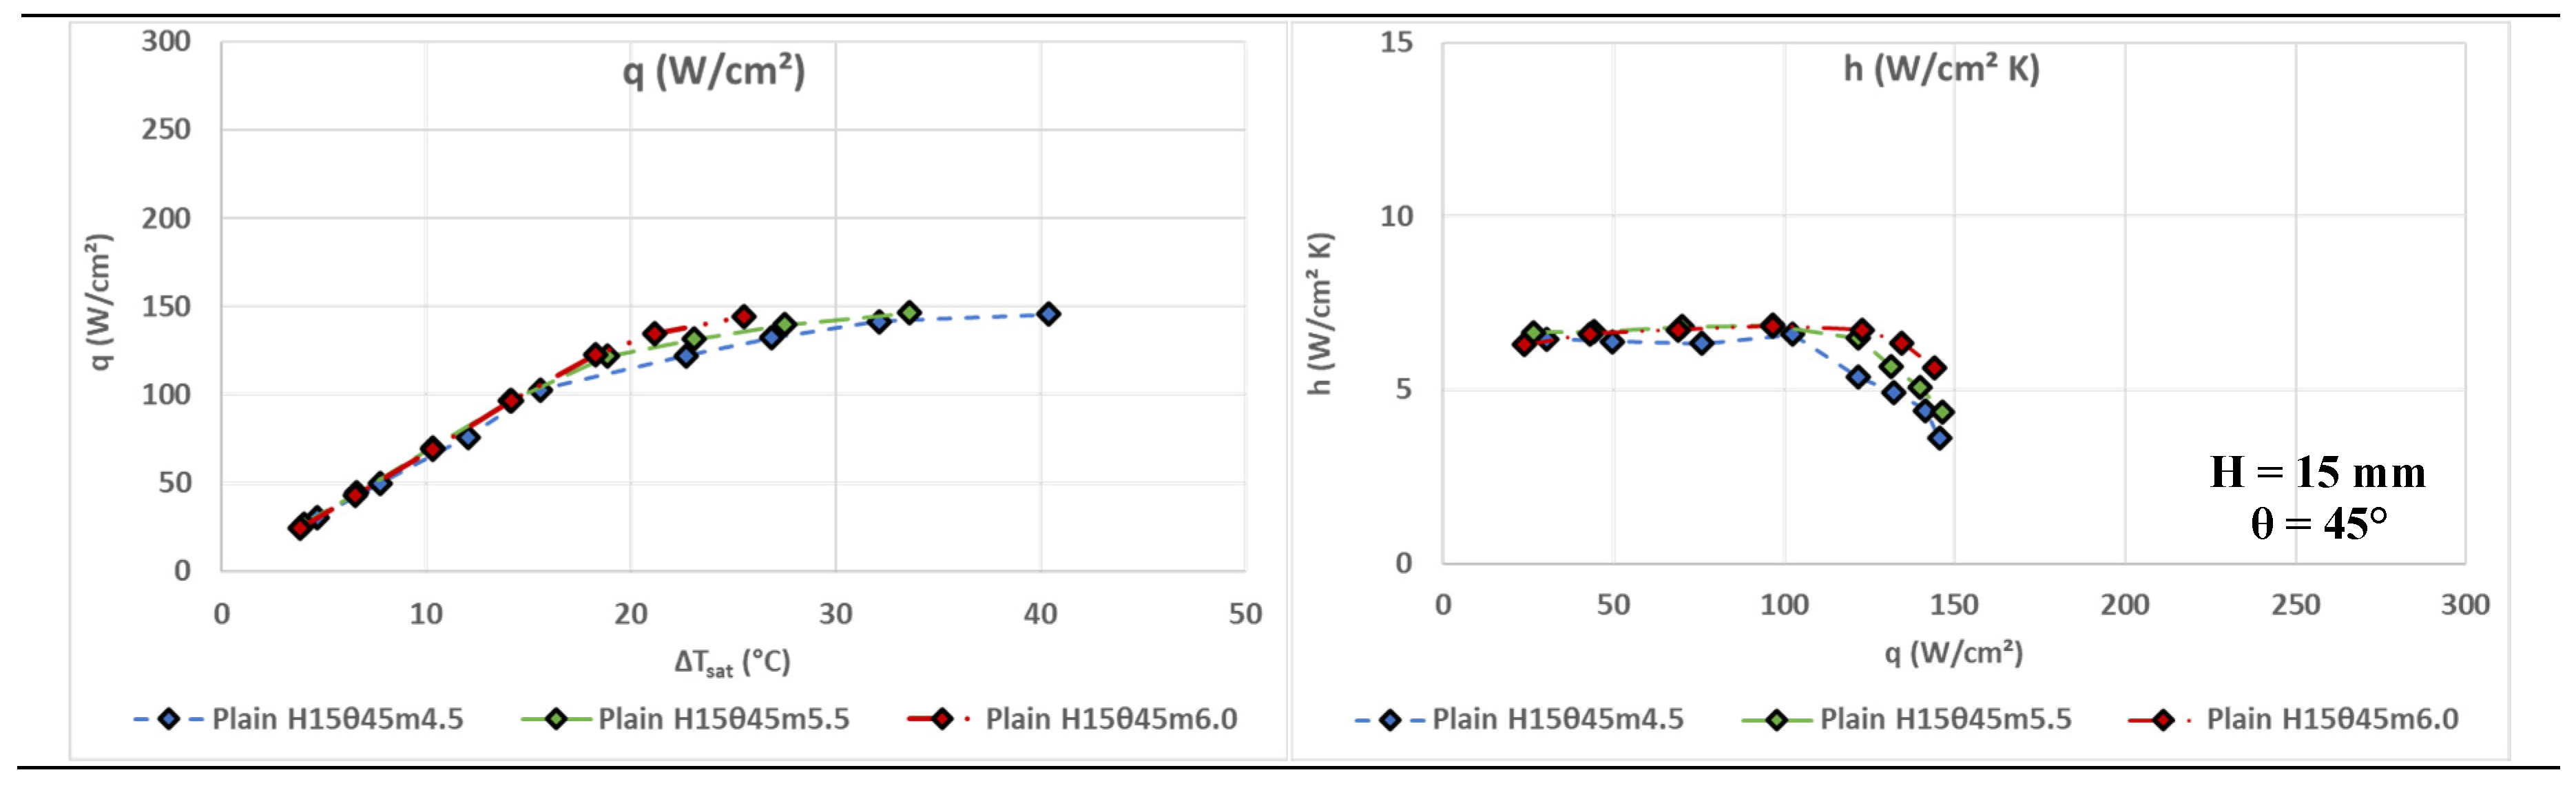
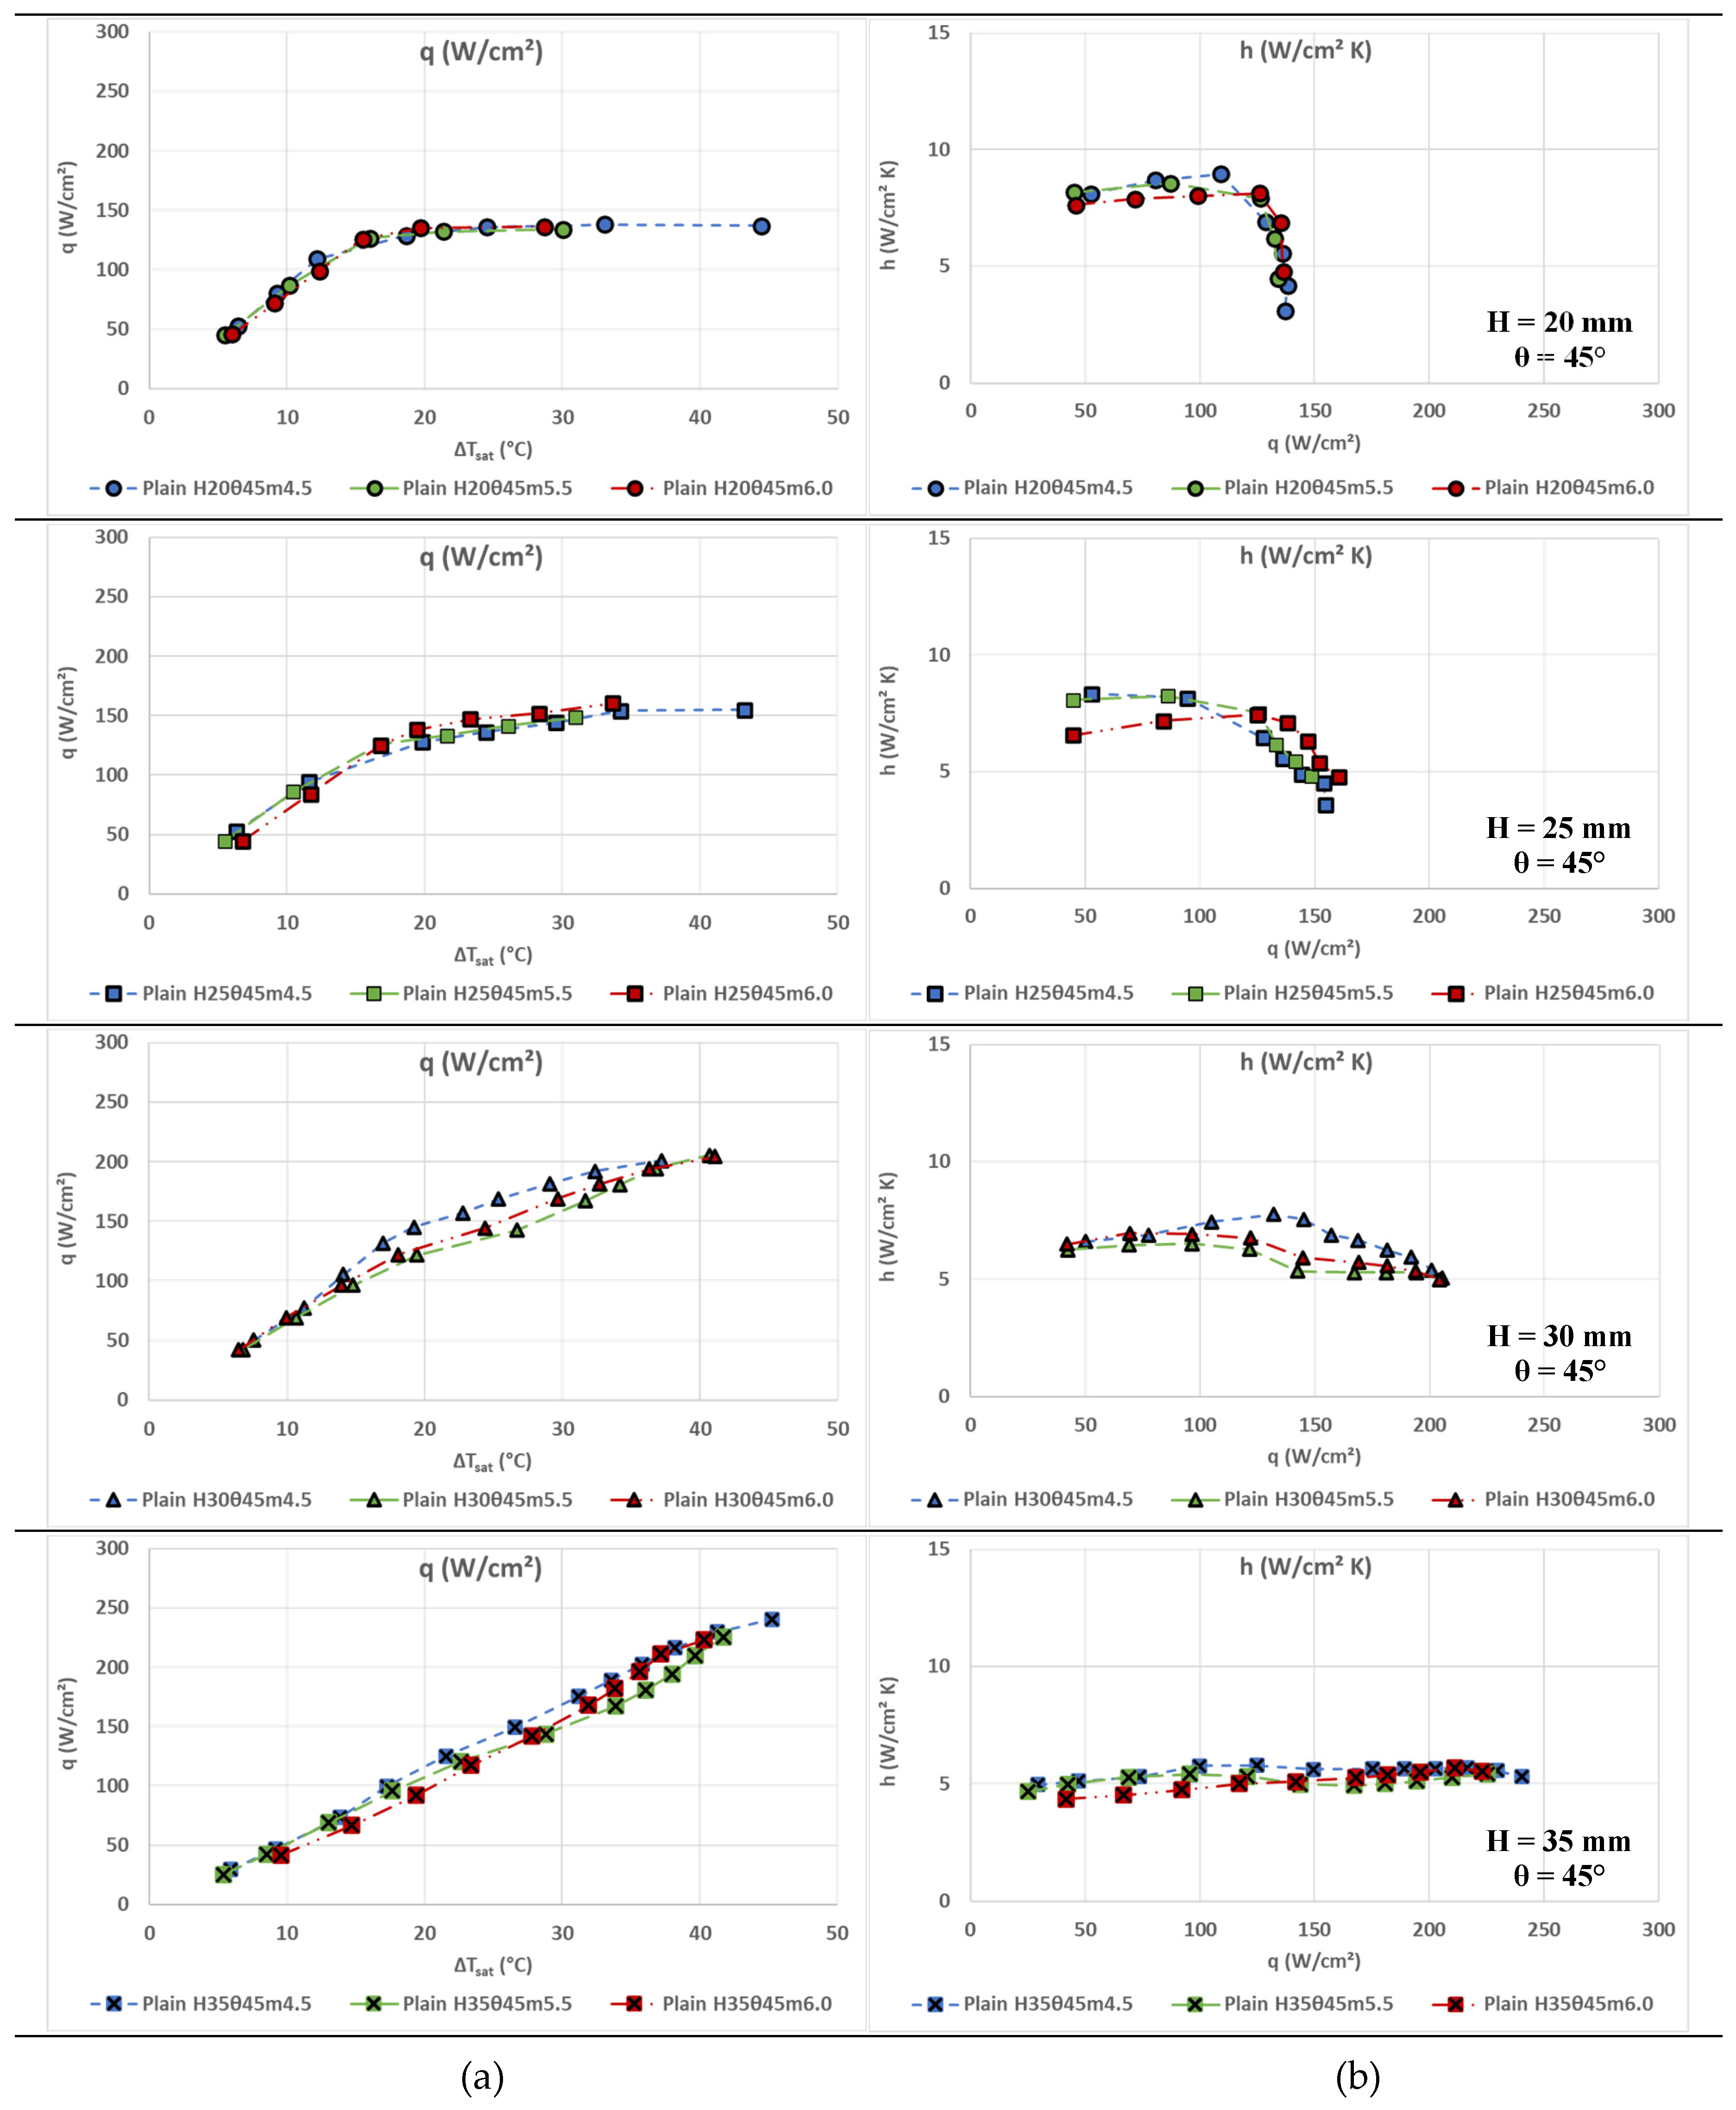
Figure 7.
Comparison of the present results with those of Lin et al. [13], for nozzle distances H=15, 20, 25, 30, 35 mm, for 60° nozzles. (a) Heat flux, q, as a function of surface overheating, ΔTsat, and (b) Heat transfer coefficient, h, as a function of heat flux, q. Refrigerant mass flow rate: Present results, 5.5 g/s, Lin et al., 6.7 g/s.
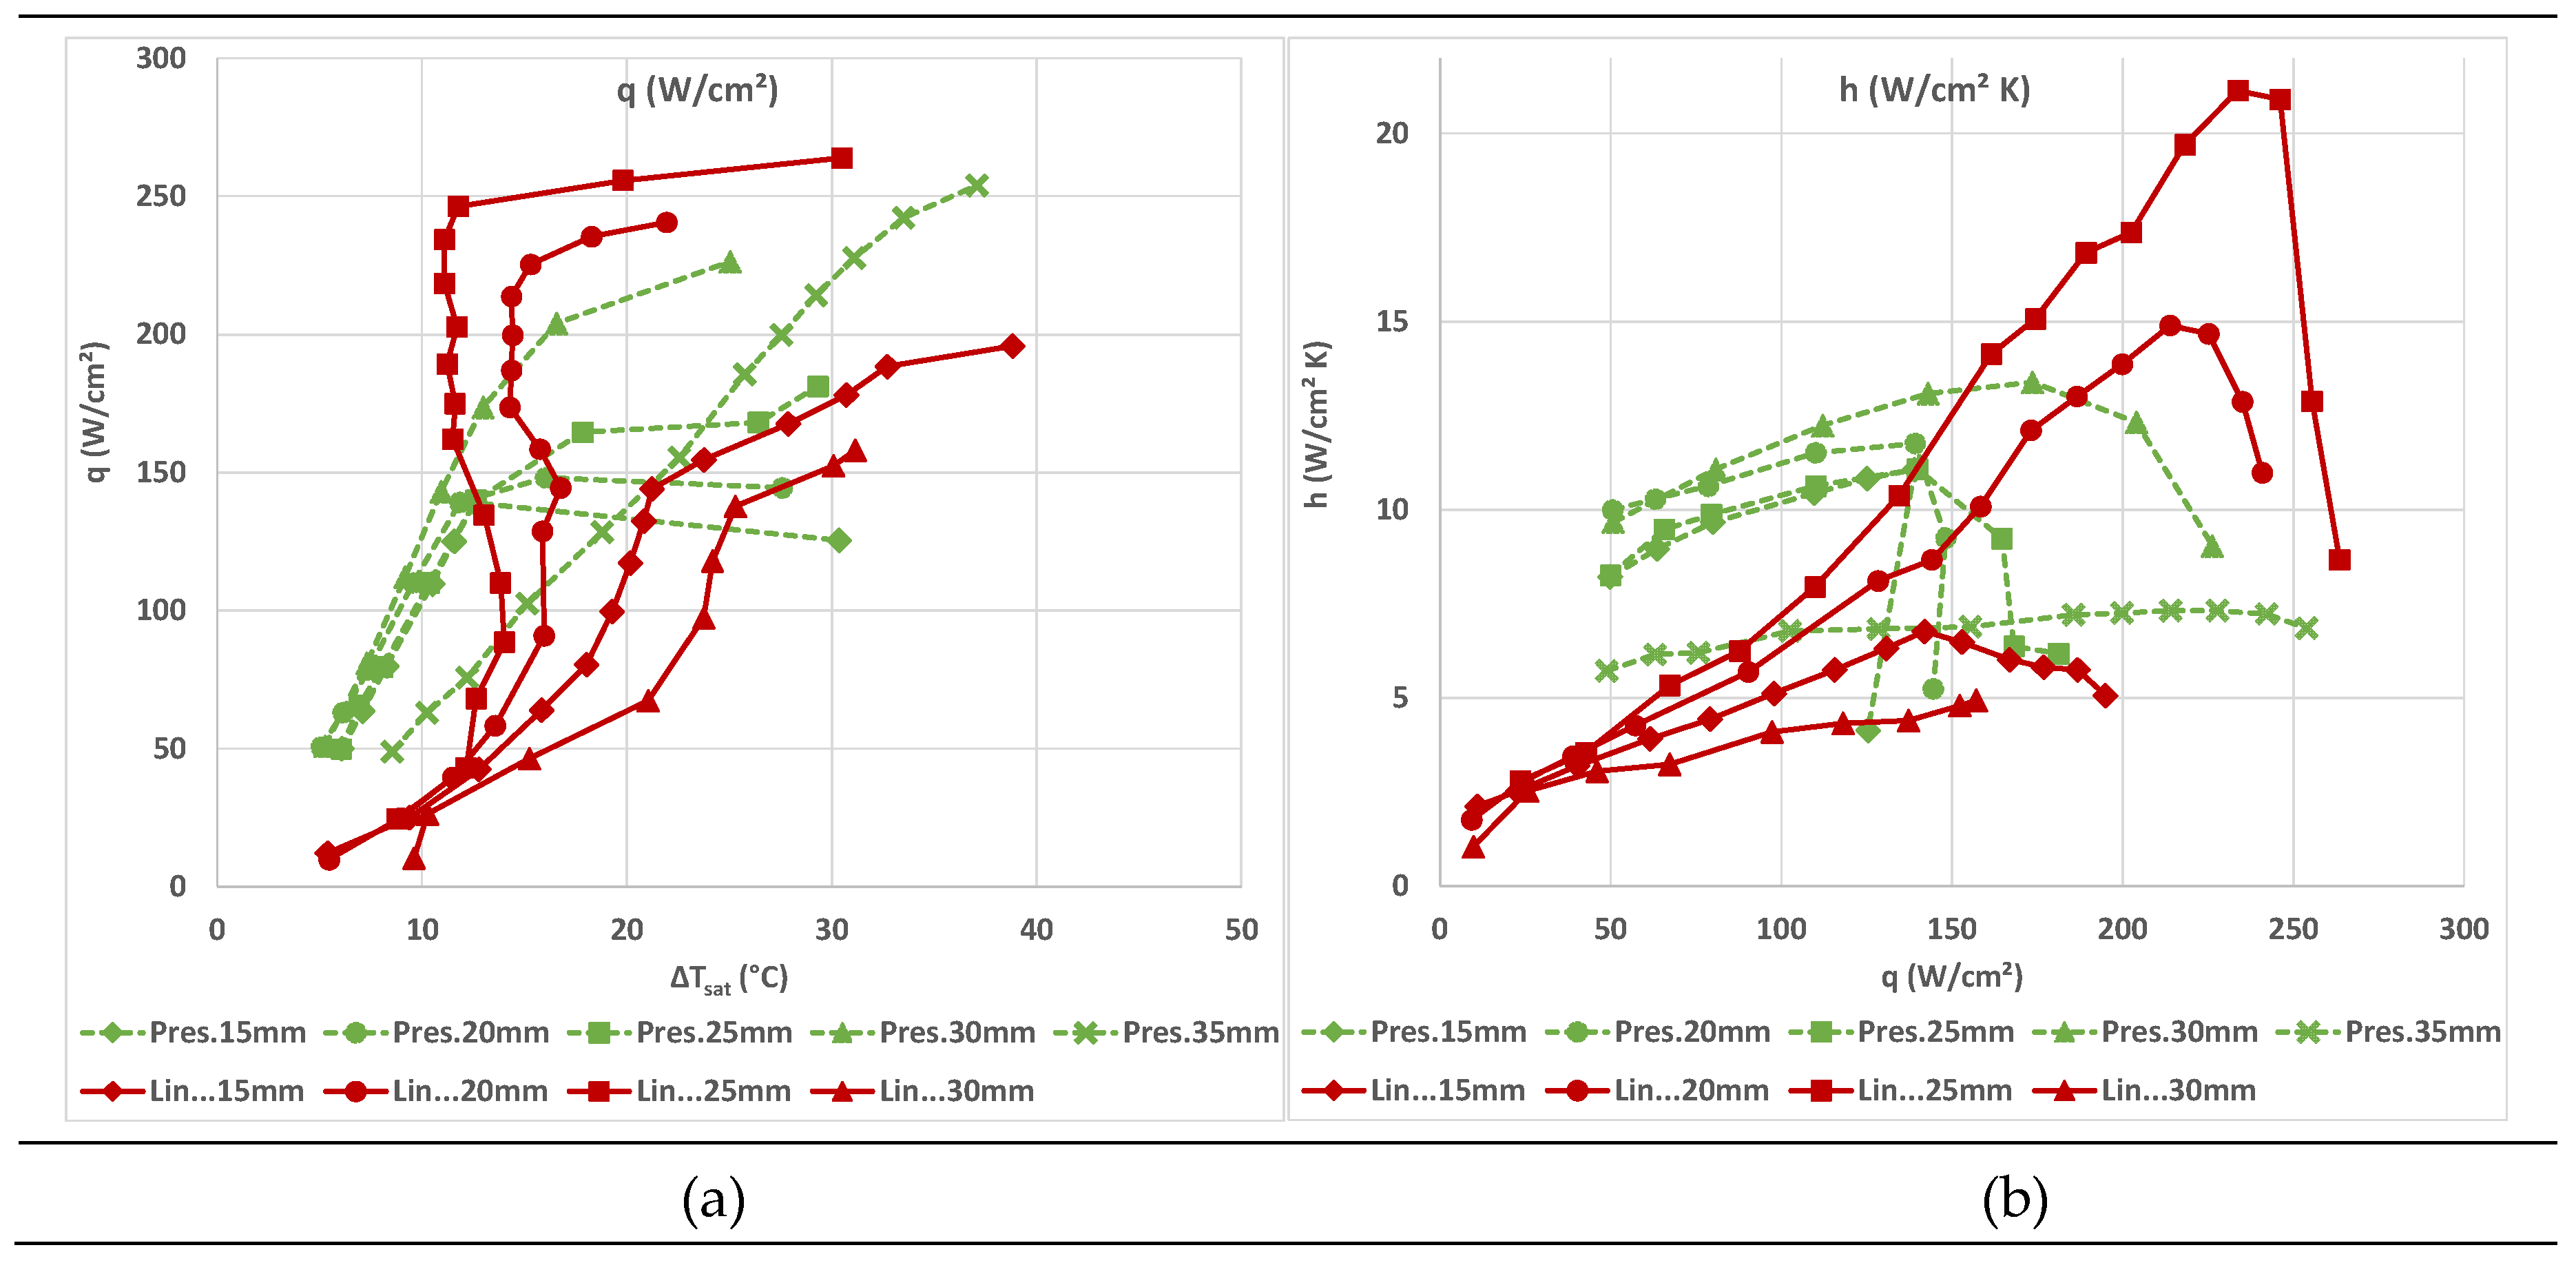

Table 1.
Results for spraying cooling from previous operations.
| Work | Refrigerant | Surface modification | Critical heat flux – CHF (W/cm2) | Heat transfer coefficient – HTC (W/cm2 °C) | Surface temperature (°C) |
|---|---|---|---|---|---|
| Wang et a., 2023 [11] | R410A | - | 175.0 | 9.04 | <35 |
| Zhou et al., 2019 [12] | R410A | YES | 330 | 30.0 | < 10 |
| Lin et al., 2019 [13] | R410A | - | 264 | 21.0 | < 30 |
| Bostanci et al., 2018 [14] | R-134a, HF0-1234yf |
YES | 370/ 300 |
8.0/ 6.4 |
40/ 43.4 |
| Liu et al., 2018 [15] | R-134a | YES | 102 | 3.1 | - |
| Chen et al., 2015 [16] | R-134a, R22 |
- | 117.2/ 276.1 |
||
| Yata & Bostanci, 2017 [17] | HFE-7100 | YES | 190 | 9.26 | ≈ 91,6 |
| Yaddanapudi & Bostanci, 2015 [18] | R-134a, HF0-1234yf |
YES (macro-structures) | 270/ 190 |
14.1/ 7.6 |
≈ 12 / ≈ 28 |
| Xu et al., 2014 [19] | R600a | - | 110 | 3.0 | 31.5 |
Disclaimer/Publisher’s Note: The statements, opinions and data contained in all publications are solely those of the individual author(s) and contributor(s) and not of MDPI and/or the editor(s). MDPI and/or the editor(s) disclaim responsibility for any injury to people or property resulting from any ideas, methods, instructions or products referred to in the content. |
© 2025 by the authors. Licensee MDPI, Basel, Switzerland. This article is an open access article distributed under the terms and conditions of the Creative Commons Attribution (CC BY) license (https://creativecommons.org/licenses/by/4.0/).
Copyright: This open access article is published under a Creative Commons CC BY 4.0 license, which permit the free download, distribution, and reuse, provided that the author and preprint are cited in any reuse.


