Submitted:
05 August 2025
Posted:
06 August 2025
You are already at the latest version
Abstract
Early fruit development in tomato is driven by complex gene expression patterns and metabolic reprogramming, a crucial phase that shapes the fruit's final size and structure. Previous studies using the Micro-Tom model have largely focused on later stages of development, especially ripening, leaving early developmental processes relatively unexplored. To address this knowledge gap, we performed RNA-seq analyses on Micro-Tom fruits harvested at three key developmental stages: 3, 5, and 8 days post-anthesis (DPA). Pairwise differential gene expression analyses revealed that the most extensive transcriptional reprogramming occurs during the transition from 5 to 8 DPA, while comparatively fewer changes were observed between 3 and 5 DPA. K-means clustering of 11,035 stably expressed genes revealed nine distinct expression profiles associated with specific developmental phases, including cell proliferation, transition, and cell expansion. Integrating transcriptomic and metabolomic datasets uncovered coordinated shifts in gene expression and metabolite accumulation, highlighting both conserved regulatory mechanisms and cultivar-specific pathways governing early fruit development. These findings advance our understanding of the molecular regulation of early fruit development in Micro-Tom tomatoes and provide a basis for future efforts to improve fruit quality and yield.
Keywords:
Micro-Tom tomato
; fruit development
; transcriptomics
; genome assembly
; gene expression
; protein interaction networks
1. Introduction
Tomato (Solanum lycopersicum) is an important model species for studying fleshy fruit development due to its extensive phenotypic diversity, particularly in fruit weight and tissue morphology [1]. This diversity provides valuable insights into the fundamental biological processes of fruit growth, ripening, and hormonal regulation. Fruit development in tomato follows a biphasic pattern comprising an initial phase of active cell division post-anthesis, followed by a phase of cell expansion without clear boundaries between these stages [2,3]. Hormones, notably gibberellins (GAs) and auxins, play critical roles in controlling fruit set and development. Gibberellins promote cell division, while auxins primarily promote cell expansion, influencing overall fruit size and morphogenesis [4].
The early developmental stages are critical for fruit formation and final fruit size. Shortly after anthesis, fertilization determines whether fruit development will continue or abort, a process known as fruit set [5,6]. The size and weight of the fruit largely depend on the number of cells in the pericarp, established during the cell division stage [7]. Following fertilization, the embryo within the ovule undergoes rapid cell division, reaching a multicellular embryonic stage around 3 to 6 days post-anthesis (DPA) [8]. Simultaneously, cells in the ovary wall begin dividing around 2 DPA, with cell division in the ovary wall nearly completed by 5 DPA, marking the onset of the cell expansion phase [8,9,10].
Several genes have been identified that affect fruit size by regulating cell division during these early developmental stages. Remarkably, despite the wide diversity in fruit size and shape observed across cultivated tomatoes, a limited set of genes seems to drive the major variations in fruit morphology among domesticated varieties [11,12]. Alleles of the major genes SUN, OVATE, LOCULE NUMBER, and FASCIATED individually explain up to 71% of the fruit shape variations in cultivated tomato (Rodríguez et al. 2011). Quantitative trait loci-associated genes Cell Number Regulator and SlKLUH (from QTLs fw2.2 and fw3.2, respectively) also influence fruit size through modulation of cell division rates [13].
The dwarf tomato cultivar Micro-Tom has emerged as a popular model system for genetic and developmental studies, due to its compact size (~15 cm in height), short life cycle (~70 days from germination to fruiting), and adaptability to high-density cultivation [14,15]. Originally bred as an ornamental variety, Micro-Tom carries distinctive mutations, including the dwarf (d) and self-pruning (sp) alleles, that underlie its reduced size and determinate growth habit [15]. These traits, along with the uniform ripening (u) gene, make it an ideal controlled experimental model, particularly for studying plant hormone interactions and responses to environmental stimuli [16]. The uniform ripening phenotype is especially advantageous for fruit development research, as it enables synchronized sampling of large quantities of fruit tissue for downstream analyses. Furthermore, Micro-Tom possesses a relatively compact diploid genome of approximately 900 Mb and is supported by extensive genetic and genomic resources, which have collectively facilitated major advances in elucidating the molecular and genetic regulation of fruit formation [17,18].
Transcriptomic studies in tomato, particularly those utilizing the Micro-Tom model, have provided valuable insights into gene expression and regulatory networks throughout different developmental stages. Tissue-specific transcriptome profiles have been mapped across essential reproductive organs, shedding light on the dynamics of gene regulation influencing fruit formation and maturation [19,20]. These studies have highlighted the complexity of gene regulatory networks driving the transition from ovary development to fruit maturation, including the roles of specific loci such as SUN and OVATE in determining fruit shape and the processes leading cellular expansion and endoreduplication [1].
More recently, cutting-edge approaches such as spatial transcriptomics [5,13] have begun to uncover the cellular heterogeneity and spatial organization of gene expression during fruit development. However, most studies focus on fruit ripening [2][23] and stress responses [24], with fewer transcriptomic analyses of early fruit development. An RNA-seq-based investigation of early tomato fruit development was performed in the 'Moneymaker' cultivar [13], providing insights into gene expression dynamics during the initial stages of fruit formation. This study identified key regulators involved in pericarp- and ovule-specific development post-fertilization, highlighting the roles of auxin biosynthesis genes and tissue-specific transcription factors. Nonetheless, comprehensive transcriptomic analyses focusing on the early stages of fruit development in the Micro-Tom cultivar remain lacking.
In this study, we used the most recent, high-quality assembly of the Micro-Tom tomato genome [17,18] to investigate transcriptomic changes associated with early fruit development. We selected three critical time points: 3 DPA, representing the cell division stage; 5 DPA, corresponding to the peak of cell proliferation; and 8 DPA, marking the transition to cell expansion. Focusing on predicted protein-coding genes, we identified nine distinct expression clusters and functionally correlated these transcriptional patterns with the biological processes occurring during each developmental stage. These findings were compared to known patterns from other tomato cultivars to generate a similarity map, thereby enhancing our understanding of conserved and cultivar-specific regulatory mechanisms governing early fruit development in Micro-Tom. Additionally, integration of untargeted metabolomic data derived from previously published GC-MS and LC-MS analyses provided complementary insights, revealing a strong concordance between transcript abundance and metabolite profiles during this critical developmental window.
2. Results
2.1. RNA-Seq Quality and Alignment Statistics
RNA-seq statistics indicate high-quality data suitable for downstream analysis. On average, 80.7 ± 4.2% of raw reads passed quality filtering and trimming, resulting in read libraries with a mean Q30 of 94.86 ± 0.17% (Table 1). These libraries were successfully aligned to the Micro-Tom reference genome [18] with an average of 91.8 ± 0.9% of reads mapping uniquely (Table 1). Gene body coverage analysis shows a characteristic bell-shaped distribution, typical of high-quality poly(A)-selected libraries [25] and does not indicate degradation or technical artifacts (Supplementary Figure S1). In addition, Principal Component Analysis (PCA) before and after Trimmed Mean of M-value (TMM) normalization show consistent clustering by developmental stage, with normalization having a minimal impact on overall sample relationships (Supplementary Figure S2). This indicates that the dataset was well balanced and free from major biases related to library size or composition.
2.2. Differential Expression Shows Stage-Specific Transcriptional Changes
To characterize gene expression dynamics during early fruit development, we performed pairwise differential expression analysis between 3 DPA vs. 5 DPA, 5 DPA vs. 8 DPA, and 3 DPA vs. 8 DPA (Supplementary File S1). Applying a threshold of |log2FC| > 1.5 and FDR < 0.01, we identified 368 upregulated and 120 downregulated genes between 3 and 5 DPA, 915 upregulated and 1,611 downregulated genes between 5 and 8 DPA, and 2,158 upregulated and 2,056 downregulated genes across the 3 to 8 DPA interval (Figure 1A). These differentially expressed genes (DEGs) represent 2.25%, 11.63%, and 19.4% of all genes expressed in the dataset, respectively, based on a total of 21,725 genes retained after filtering for low expression.
Venn diagram analyses of significant DEGs show high overlap between the 5 vs. 8 DPA comparison and the 3 vs. 8 DPA set: 702 upregulated and 1,050 downregulated genes are shared (Figure 1B,C). This suggests that the major transcriptional reprogramming occurs between 5 and 8 DPA, and the differences observed in the 3 vs. 8 DPA comparison largely reflect changes during the latter stages.
Gene Ontology (GO) enrichment analysis of Biological Process terms supports this interpretation (Supplementary File S1). Between 3 and 5 DPA (Supplementary Figure S3), upregulated genes are enriched in processes such as response to wounding, fatty acid biosynthesis, and cellulose production, suggesting early activation of membrane lipid metabolism and cell wall synthesis. No strong enriched downregulated terms were detected at this stage, consistent with a modest overall transcriptional shift.
In the 5 to 8 DPA transition (Supplementary Figure S4), upregulated genes were strongly associated with lipid storage, methylation, and pectin catabolism, reflecting increased energy allocation and active cell wall remodeling. Concurrently, downregulated genes were enriched in defense responses, microtubule-based movement, and carbohydrate metabolism, suggesting a reduction in stress-related and structural reorganization pathways as the tissue progresses toward functional specialization.
Across the 3 to 8 DPA interval (Supplementary Figure S5), upregulated genes were predominantly enriched for photosynthesis, chloroplast biogenesis, and fatty acid biosynthesis, highlighting the metabolic shift toward organellar development and energy capture. In contrast, downregulated genes were associated with protein phosphorylation, defense response to fungi, and cell wall modification, indicating a broad transcriptional reprogramming from stress adaptation and structural turnover to sustained biosynthesis and tissue maturation.
2.3. Distinct Expression Clusters Mark Developmental Transitions
To better understand the molecular processes and key factors involved early fruit development, we performed k-means clustering analysis for the three developmental stages (Figure 2, Supplementary File S2). This analysis identified nine distinct expression patterns (clusters), which highlight the dynamic and coordinated regulation of genes as the fruit transitions from cell proliferation to cell expansion. Additionally, GO enrichment analysis provided further insight into the biological processes underlying these expression patterns, which represent diverse trends of gene upregulation, downregulation, or stage-specific peaks in the 3-8 DPA interval (Figure 3, Supplementary File S2).
Cluster 1, consisting of 955 genes, shows high expression levels at 3 and 5 DPA, followed by a notable decrease at 8 DPA. This expression pattern suggests that these genes are strongly involved in early developmental processes, particularly those associated with DNA metabolic activities. GO enrichment analysis revealed that a substantial portion of these genes, including at least 55 proteins involved in DNA replication, play a crucial role in cell division.
Similarly, clusters 6 and 7, containing 1,252 and 2,038 genes, respectively, also exhibit a declining expression trend towards 8 DPA, although the decline is more gradual compared to the sharp drop observed in cluster 1. These clusters are enriched in genes related to RNA metabolic processes regulation. The observed decline in both DNA- and RNA-related processes at 8 DPA reflects a reduced need for high proliferative activity as the fruit shifts into the cell expansion phase. Taken together, the coordinated downregulation in clusters 1, 6, and 7 indicates a developmental transition from proliferation-related activities to processes more aligned with cell expansion and maturation.
A distinct set of genes shows a peak at 5 DPA (cluster 8, 605 genes), with the cell cycle being the top-enriched category, including 50 genes (Figure 4A). This peak coincides with the culmination of cell proliferation, suggesting that these genes play a key role in orchestrating the final rounds of cell division prior to the fruit's transition into the expansion phase. The predicted protein-protein interaction network of genes in this cluster, based on conserved interactions in the STRING database (Figure 4B) shows their potential roles in DNA replication, particularly within the S phase of the cell cycle, as well as mitosis, including members of the Anaphase Promoting Complex/Cyclosome (APC/C).
Clusters 4, 5, and 9 represent the largest expression groups, all exhibiting an upward trend in gene expression toward the 8 DPA timepoint (Figure 2). Cluster 5 (1,349 genes) display a more pronounced increase between 5 and 8 DPA and is enriched for protein transport functions, with 105 genes associated with this GO term. In contrast, cluster 4 (1,344 genes) shows a more gradual transition and is enriched in photosynthesis-related processes (76 genes) as well as broader cellular metabolic functions (667 genes). Cluster 9, the largest cluster with 2,332 genes, is enriched for small molecule metabolic processes. The late activation of genes in these clusters likely reflects a ramp-up in metabolic activity required to support fruit growth, highlighting the importance of energy production and metabolic support in ensuring proper maturation, fruit quality, and ripening.
- Figure 4. Heatmap and predicted interaction network of cell cycle–related genes from cluster 8. A- Heatmap showing the expression profiles of 50 cell cycle related genes from cluster 8 across the three developmental stages. Gene symbols are provided in parentheses for annotated genes The heatmap was generated using the Morpheus tool (https://software.broadinstitute.org/morpheus). B- Predicted protein–protein interaction network based on conserved interactions from homologs in other organisms, as retrieved from the STRING database. Line thickness represents the strength of evidence supporting each interaction.
2.4. Different Transcription Factors May Regulate Early Fruit Development
To investigate the transcription factors (TFs) potentially regulating early fruit development, we analyzed the putative promoter regions (2 kb upstream of coding sequences) of co-expressed genes within each cluster for enrichment of TF binding motifs (Supplementary File S3). Interestingly, only one TF with significantly enriched motifs (Bonferroni-Hochberg adjusted p-value < 0.05) was the MYB family member SLM2ch04g16973, whose binding motifs were found in the upstream regions of 13 genes in Cluster 6 (Figure 5). This TF corresponds to the gene Solyc04g077260 in the ITAG4.0 annotation of the Heinz tomato genome, and its function remains uncharacterized. The predicted targets of SLM2ch04g16973 include genes with diverse functions, such as protein kinases, RNA-binding proteins, proteasome-related proteins, and a histone acetyltransferase. This TF was filtered out in the DE analysis due to its higher adjusted p-value (0.023) in the 3 vs. 5 DPA comparison, but it is slightly more expressed at 3 DPA than at both 5 and 8 DPA (Supplementary Figure S6). The predominant expression of its putative target genes at 3 DPA further supports a potential role for SLM2ch04g16973 in early fruit development, deserving further investigation.
To gain insights into the transcriptional regulatory landscape during early fruit development in Micro-Tom tomato, we focused on the expression patterns of TFs across developmental stages. Of the 1,623 predicted TFs in the Micro-Tom genome, 586 (36.1%) were detected in our filtered dataset, and these were distributed among the nine expression clusters (Supplementary Figure S7, Supplementary File S3). Among the detected TFs, several families such as bHLH, MYB, NAC, WRKY, ERF, C2H2, and HD-ZIP were represented by many members (Supplementary File S3), reflecting their broad regulatory functions. For instance, the Auxin Response Factor (ARF) and C3H zinc finger families showed strong representation in Cluster 1, which is characterized by higher expression at 3 DPA (Supplementary Figure S7). This expression pattern may indicate a regulatory role early in fruit development, potentially contributing to the onset of fruit-specific transcriptional programs.
Although many TF families were broadly represented across clusters, a hypergeometric enrichment analysis revealed that only members of the MIKC-MADS family were significantly overrepresented in a specific cluster, Cluster 9, which comprises genes with increasing expression over time (Supplementary Figure S7). This result suggests that MIKC-MADS TFs may play a particularly important role during the later stages of early fruit development, possibly regulating key transcriptional switches involved in floral organ identity and fruit maturation.
2.5. Integration of Metabolite Clusters with Gene Expression
To better understand the coordination between metabolic and transcriptional programs during early fruit development, we integrated our gene expression clusters with the metabolite profiles reported by [26]. In that study, 72 metabolites identified via LC-MS and 46 via GC-MS were quantified at 3, 5, and 8 DPA in the same biological system. By leveraging this dataset, we aimed to identify temporal relationships between metabolite accumulation and gene expression, which could point to co-regulated pathways or feedback mechanisms linking metabolism to developmental gene regulation. Using hierarchical clustering, we organized these metabolites into seven distinct clusters based on their temporal patterns (Figure 6, Supplementary File S4). These metabolite profiles closely mirrored gene expression dynamics during tomato fruit development. By correlating the metabolite clusters with their corresponding gene expression clusters, we uncovered distinct temporal patterns that further highlight key developmental transitions and suggest potential feedback regulation between metabolism and gene expression.
Cluster M1 comprises compounds such as serine, asparagine, several flavonoid derivatives, tryptophan, and succinic acid. These metabolites correspond to gene cluster 5, which follows a “mid/low–low–high” expression pattern, peaking at 8 DPA. GO enrichment analysis of this gene cluster highlights functions related to protein localization and vesicle-mediated transport, suggesting a temporal association between metabolite accumulation and gene expression.
In cluster M2, primary metabolites, including quinic acid, GABA, several amino acids, and energy-related compounds such as pyruvate, 2-oxoglutarate, fumarate, and glyoxylate, are found. These metabolites align with gene cluster 9, which exhibits a “low–mid/low–high” expression pattern. Genes in this cluster are enriched for biosynthetic and energy metabolism processes, including translation and small molecule synthesis, which coincide with the later accumulation of these metabolites.
Cluster M3 includes hydroxybenzoic acid-hexose, caffeoyl-hexoside 5, malic acid, and various glycosides such as feruloyl-glucoside 3. These metabolites correspond to gene cluster 2, which follows a “high–low–high” expression pattern. GO enrichment of genes in this cluster identifies functions related to redox activity and secondary metabolism, consistent with the observed fluctuations in metabolite levels.
Metabolite cluster M4 is composed of caffeoyl derivatives, quinic acid isomers, flavonoids, and coumaric acid derivatives. These metabolites are associated with gene cluster 6, which exhibits a “high–low–low” expression pattern, with strong early expression that declines at later developmental stages. Genes in this cluster are enriched in regulatory processes, indicating a potential relationship between early gene expression and metabolite accumulation.
Cluster M5, containing beta-alanine, caffeoyl-glucarate, fructose, and feruloyl-glucoside 1, corresponds to gene cluster 4, which follows a “low–mid–high” expression pattern. GO enrichment analysis highlights functions related to photosynthesis and chloroplast organization, suggesting that gene expression and metabolite accumulation are temporally aligned during fruit maturation.
Metabolite cluster M6 includes Que-hexose, quinic acid 3-caffeoyl trans, and quercitrin, which are associated with gene cluster 1. This cluster follows a “high–high–low” expression profile, with early gene expression linked to DNA metabolism and cell proliferation. The corresponding metabolites show a similar early peak, followed by a decline, suggesting synchronization between metabolite levels and cell division activity.
Finally, in cluster M7, which includes salicylic acid and sucrose, corresponds to gene cluster 8. This gene cluster follows a “low–high–low” pattern with a transient peak at 5 DPA. GO enrichment identifies genes related to cell cycle regulation, coinciding with the temporary accumulation of these metabolites.
Across all clusters, hierarchical clustering of metabolite profiles and gene expression profiles reveals strong temporal coordination, were early-stage metabolites align with clusters enriched in regulatory and proliferative functions, and late-stage metabolites associated with genes driving biosynthetic and metabolic processes. This coordinated behavior reinforces the functional integration between transcriptional programs and metabolic transitions during early tomato fruit development.
3. Discussion
Our comprehensive transcriptomic analysis of Micro-Tom tomato revealed a dynamic and tightly regulated gene expression landscape during early fruit development. The nine expression clusters reflect a clear developmental progression from cell division to cellular expansion, with early stages enriched for DNA and RNA metabolic processes, consistent with active cell proliferation. In contrast, later stages showed upregulation of genes involved in biosynthesis, energy metabolism, and cell wall modification, marking the fruit’s transition toward maturation.
Comparisons with transcriptomic data from the “Moneymaker” cultivar [13] reveal both conserved developmental pathways and cultivar-specific regulatory features. In both cultivars, hormone signaling genes, particularly those involved in auxin and gibberellin responses, are key regulators during early fruit development. Similarly, genes associated with cell cycle progression and DNA replication are upregulated in early stages in both datasets, highlighting a shared transcriptional program supporting fruit initiation. However, carbohydrate metabolism genes peaked earlier in Moneymaker (2 to 5 DPA), while their expression was delayed in Micro-Tom (8 DPA), suggesting that the timing of metabolic transitions may differ between cultivars and potentially influence fruit growth dynamics and physiological traits.
A comparison of transcription factors expression supports this pattern of both overlap and divergence. Both studies identified MADS-box and AP2 family genes as central players in early development. In our dataset, MIKC-MADS TFs showed later upregulation, consistent with the findings of [13], who reported M-type MADS expression in ovules at 5 DPA. In contrast, TF families such as TALE, which were prominent in their pericarp-specific analysis, were less represented in our whole-fruit dataset, likely reflecting differences in tissue resolution or genetic background. These findings suggest a conserved regulatory core modulated by cultivar-specific transcriptional programs.
Several insights also emerged from the integration of transcriptomic and metabolomic profiles. Gene expression Cluster 8, which peaks at 5 DPA, aligns with the accumulation of sucrose and salicylic acid (SA). Sucrose is known to act as a metabolic checkpoint, promoting the G1/S transition during cell cycle, and in Arabidopsis, can rapidly induce D-type cyclins in sugar-starved cells [27]. This supports the idea that sucrose availability at this stage may act as a developmental cue for proliferation in tomato fruit.
Salicylic acid may also play a regulatory role at this stage. While high SA levels are associated with stress responses and growth inhibition, moderate concentrations can promote cell division, particularly through crosstalk with auxin and ROS [28]. Given its peak at 5 DPA, SA may act alongside sugars to fine-tune the balance between proliferation and differentiation.
Most amino acids accumulated at 8 DPA, coinciding with the onset of cellular expansion and increased metabolic demand. Flavor-associated amino acids such as glutamate and aspartate, though abundant in later ripening stages [29], also showed early fluctuations, suggesting that amino acid metabolism is already active during the initial phases of fruit development - even if its sensory impact becomes more pronounced later.
Metabolite cluster M2, which includes key carbon intermediates like 2-oxoglutarate, fumarate, and pyruvate, correlated with gene cluster 9, enriched in genes linked to carbon metabolism. This association points to increased mitochondrial activity and metabolic flux, supporting both biosynthesis and energy production during cell wall development and storage compound accumulation [30].
Although our analysis identified several candidate regulators (e.g., MYB family member SLM2ch04g16973), experimental validation is necessary to confirm their roles in development. Approaches such as ChIP-seq or CRISPR-Cas9-mediated knockouts could help determine their downstream targets and regulatory impact during fruit development.
Finally, future studies incorporating spatial transcriptomics and metabolomics could resolve tissue-specific gene-metabolite interactions that are obscured in whole-organ profiling. Such data may clarify whether the observed differences in hormone signaling, sugar and amino acid metabolism are adaptive responses, tissue dilution effects, or inherent to the cultivar. A deeper understanding of these regulatory mechanisms could inform targeted breeding strategies to improve fruit quality, size, and stress resilience in tomato [23].
4. Materials and Methods
4.1. RNA Sequencing
Sequencing libraries were obtained from our previous work [26]. Briefly, stranded total RNA libraries were prepared from samples of developing Micro-Tom fruits collected at 3, 5, and 8 DPA, using three biological replicates per stage, each consisting of a pool of 12 fruits. Sequencing was performed by Fasteris Co., Ltd. (Switzerland) using the Illumina NovaSeq 6000 platform, generating 150 base pairs (bp) paired-end reads. Raw reads were processed with TrimGalore (version 0.6.10) (github.com/FelixKrueger/TrimGalore), using default parameters for adapter trimming and quality filtering. Quality assessment of the processed reads was conducted using FastQC (version 0.12.1) (bioinformatics.babraham.ac.uk/projects/fastqc) and RSeQC (version 5.0.1) [31] before proceeding to downstream analyses.
4.2. Read Mapping and Transcript Quantification
Processed reads were mapped to the most recent assembly of the Micro-Tom genome [18] (NCBI accession GCF_036512215.1) using the STAR aligner (version 2.7.11b) [32], with default parameters optimized for paired-end reads. Gene quantification was achieved by enabling the “--quantMode GeneCounts” option during mapping, which generates read counts per gene directly from the aligner. The count table was then filtered to eliminate low-expressed genes by eliminating genes with less than 10 total reads across at least 3 samples.
4.3. Differential Expression Analysis
Differential expression analysis was conducted using the RNFuzzyApp package (gitlab.com/habermann_lab/rna-seq-analysis-app, cloned in June 5th, 2024) in R (version 4.3.3). Raw gene counts were normalized using the Trimmed Mean of M-values (TMM) method [33]. The resulting expression matrix was analyzed using the TCC method [34], with statistical testing performed by DESeq2 [35]. A False Discovery Rate (FDR) cutoff of 0.01 was applied to identify significantly differentially expressed genes, with |log2FC| > 1.5.
4.4. Expression Clustering
Clustering of expression patterns was performed using a separately filtered set optimized for clustering. Starting from the TMM-normalized counts, genes were retained if they had a minimum of 5 read counts in every sample, resulting in 11,035 consistently expressed genes. The expression values were transformed using a log2(x + 1) function to stabilize variance and then standardized using Z-score normalization. The average expression value for each gene at each time point was calculated for clustering purposes. K-means clustering was executed in R using the kmeans function, specifying nine clusters (k = 9) and setting the maximum number of iterations to 50. A random seed of 123 was used to ensure reproducibility of the clustering results. The k = 9 value was selected based on elbow criterion and cluster stability across 100 random starts (testing k = 2–15).
4.5. Functional Enrichment Analysis
Functional enrichment analysis was conducted using the STRING database (version 12.0) [36] and the clusterProfiler R package [37]. The proteome encoded by the Micro-Tom genome was annotated within STRING to facilitate the analysis and is accessible at https://version-12-0.string-db.org/organism/STRG0A81OUP. Gene IDs from each cluster were uploaded to the STRING workspace to create gene sets. For the DE genes, the enricher function of clusterProfiler was used with the STRING annotation. The total number of expressed genes from the normalized, filtered expression matrices served as the background for statistical enrichment analysis. Overrepresented Gene Ontology (GO) terms and pathways were identified for each cluster using built-in enrichment functions, applying statistical significance cutoffs of p < 0.05 and Benjamini–Hochberg FDR < 0.05 in all cases.
4.6. Transcription Factor Prediction and Analysis
Transcription factors (TFs) were identified through BLASTP similarity searches against known TFs in the PlantRegMap database [38] and via de novo prediction using the planttfhunter R package (version 1.6.0) [39]. Expression values of the identified TFs were transformed using a robust Z-score (subtract median and divide by median absolute deviation). Hierarchical clustering was performed using one minus Pearson correlation as the distance metric, enabling the assessment of expression pattern similarities among TFs during fruit development stages.
4.7. Transcription Factor Motif Mapping and Enrichment Analysis
This analysis was performed similarly to what is described by [40]. Known TF binding motifs for S. lycopersicum were obtained from CisBP v2.00 [41] and JASPAR 2022 [42]. These motifs were mapped to the 2-kb upstream regions of all annotated genes in the genome using FIMO v5.5.7 [43] with default parameters. We retained the top 7,000 scoring motif matches, discarding lower-scoring hits. For each TF motif, hypergeometric tests were used to assess whether the number of motif instances found in genes of a given cluster (Clusters 1–9) was significantly higher than expected based on its total number of occurrences across all expressed genes. Benjamini-Hochberg correction was applied to control the false discovery rate (FDR < 0.05). Representative sequence logos showing nucleotide frequencies at each position were generated using WebLogo (http://weblogo.berkeley.edu/logo.cgi).
4.8. Integration of Metabolomics Data
Normalized metabolite intensities at 3, 5, and 8 DPA [26] were scaled to Z-scores. We performed k-means clustering on the Z-scored matrix, testing k = 2–10 and selecting k = 7 based on the elbow criterion and cluster stability across 100 random starts. To link metabolite clusters (1–7) to gene clusters (1–9), we computed the Spearman correlation between the centroid profiles (mean Z-score at each timepoint) of each metabolite cluster and each gene cluster. Clusters were associated by high Spearman correlation coefficients (>0.8) supported by visual pattern confirmation.
5. Conclusions
In summary, our integrative analysis of transcriptomic and metabolomic data in Micro-Tom tomato revealed distinct gene expression clusters associated with key developmental transitions during early fruit development. These clusters highlight a tightly regulated progression from cell division to expansion, driven by coordinated changes in hormone signaling, transcription factor activity, and metabolic pathways. Our findings also uncover both conserved regulatory mechanisms shared with other tomato cultivars and cultivar-specific differences in transcriptional and metabolic programs.
By linking metabolite accumulation to gene expression dynamics, this study provides new insights into the molecular mechanisms regulating fruit formation. The observed associations between sugars, amino acids, and cell cycle regulators suggest potential metabolic checkpoints that influence early fruit growth. These findings lay the groundwork for future functional studies, such as mutant validation (CRISPR), chromatin accessibility assays (ChIP-seq), and spatial transcriptomics, to further dissect critical regulatory networks.
These insights can directly inform breeding programs aimed at enhancing fruit size, nutritional quality, and resilience to environmental stress, as well as guide biotechnological strategies using precision breeding techniques such as CRISPR/Cas.
Supplementary Materials
The following supporting information can be downloaded at the website of this paper posted on Preprints.org, Figure S1: RNA-seq read coverage of gene bodies; Figure S2: PCA analysis of RNA-seq samples before and after normalization; Figure S3: Dotplot of GO enrichment analysis for upregulated genes in the 3 vs. 5 DPA comparison; Figure S4: Dotplots of GO enrichment analysis for up- and downregulated genes in the 5 vs. 8 DPA comparison; Figure S5: Dotplots of GO enrichment analysis for up- and downregulated genes in the 3 vs. 8 DPA comparison; Figure S6: Expression plot of the MYB family member SLM2ch04g16973 at each timepoint; Figure S7: Expression profiles of transcription factors and cluster membership across the three timepoints; File S1: Complete Differential Expression analysis results and GO enrichment results; File S2: Gene expression clustering results; File S3: Transcription factor motif enrichment analysis results; File S4: Metabolite abundance clustering results.
Author Contributions
Conceptualization, N.B.E. and P.B.F.; methodology, P.B.F., S.L.F., P.N.O., A.S.M.C.; formal analysis, P.B.F.; investigation, P.B.F. and S.L.F.; writing original draft preparation, P.B.F.; writing, review and editing, S.L.F., P.N.O., A.S.M.C, and N.B.E.; visualization, P.B.F.; project administration, N.B.E.; funding acquisition, N.B.E. All authors have read and agreed to the published version of the manuscript.
Funding
This research was funded by FAPESP, grant numbers 2017/10333-8 (N.B.E.), 2021/06611-8 (P.N.O.).
Data Availability Statement
The datasets generated and/or analyzed during the current study are not publicly available, as they will be integrated with additional data for a subsequent publication.
Acknowledgments
We thank the São Paulo Research Foundation (FAPESP) for funding this project (grant number 2017/10333-8).
Conflicts of Interest
The authors declare no conflicts of interest.
References
- Musseau, C.; Just, D.; Jorly, J.; Gévaudant, F.; Moing, A.; Chevalier, C.; Lemaire-Chamley, M.; Rothan, C.; Fernandez, L. Identification of Two New Mechanisms That Regulate Fruit Growth by Cell Expansion in Tomato. Front. Plant Sci. 2017, 8. [Google Scholar] [CrossRef]
- Mauxion, J.-P.; Chevalier, C.; Gonzalez, N. Complex Cellular and Molecular Events Determining Fruit Size. Trends Plant Sci. 2021, 26, 1023–1038. [Google Scholar] [CrossRef]
- Mumtaz, M.A.; Li, F.; Zhang, X.; Tao, J.; Ge, P.; Wang, Y.; Wang, Y.; Gai, W.; Dong, H.; Zhang, Y. Altered Brassinolide Sensitivity1 Regulates Fruit Size in Association with Phytohormones Modulation in Tomato. Horticulturae 2022, 8, 1008. [Google Scholar] [CrossRef]
- Serrani, J.C.; Sanjuán, R.; Ruiz-Rivero, O.; Fos, M.; García-Martínez, J.L. Gibberellin Regulation of Fruit Set and Growth in Tomato. Plant Physiol. 2007, 145, 246–257. [Google Scholar] [CrossRef] [PubMed]
- Shinozaki, Y.; Hao, S.; Kojima, M.; Sakakibara, H.; Ozeki-Iida, Y.; Zheng, Y.; Fei, Z.; Zhong, S.; Giovannoni, J.J.; Rose, J.K.C.; et al. Ethylene Suppresses Tomato (Solanum Lycopersicum) Fruit Set through Modification of Gibberellin Metabolism. Plant J.: Cell Mol. Biol. 2015, 83, 237–251. [Google Scholar] [CrossRef] [PubMed]
- Ruan, Y.-L.; Patrick, J.W.; Bouzayen, M.; Osorio, S.; Fernie, A.R. Molecular Regulation of Seed and Fruit Set. Trends Plant Sci. 2012, 17, 656–665. [Google Scholar] [CrossRef]
- Baldet, P.; Hernould, M.; Laporte, F.; Mounet, F.; Just, D.; Mouras, A.; Chevalier, C.; Rothan, C. The Expression of Cell Proliferation-Related Genes in Early Developing Flowers Is Affected by a Fruit Load Reduction in Tomato Plants. J. Exp. Bot. 2006, 57, 961–970. [Google Scholar] [CrossRef]
- Xiao, H.; Radovich, C.; Welty, N.; Hsu, J.; Li, D.; Meulia, T.; van der Knaap, E. Integration of Tomato Reproductive Developmental Landmarks and Expression Profiles, and the Effect of SUN on Fruit Shape. BMC Plant Biol. 2009, 9, 49. [Google Scholar] [CrossRef]
- Fuentes, L.; Figueroa, C.R.; Valdenegro, M. Recent Advances in Hormonal Regulation and Cross-Talk during Non-Climacteric Fruit Development and Ripening. Horticulturae 2019, 5, 45. [Google Scholar] [CrossRef]
- Niu, S.; He, Y.; Yan, S.; Sun, Z.; Cai, R.; Zhang, Y. Histological, Transcriptomic, and Gene Functional Analyses Reveal the Regulatory Events Underlying Gibberellin-Induced Parthenocarpy in Tomato. Hortic. Plant J. 2024, 10, 156–170. [Google Scholar] [CrossRef]
- van der Knaap, E.; Chakrabarti, M.; Chu, Y.H.; Clevenger, J.P.; Illa-Berenguer, E.; Huang, Z.; Keyhaninejad, N.; Mu, Q.; Sun, L.; Wang, Y.; et al. What Lies beyond the Eye: The Molecular Mechanisms Regulating Tomato Fruit Weight and Shape. Front. Plant Sci. 2014, 5. [Google Scholar] [CrossRef]
- Mata-Nicolás, E.; Montero-Pau, J.; Gimeno-Paez, E.; Garcia-Carpintero, V.; Ziarsolo, P.; Menda, N.; Mueller, L.A.; Blanca, J.; Cañizares, J.; van der Knaap, E.; et al. Exploiting the Diversity of Tomato: The Development of a Phenotypically and Genetically Detailed Germplasm Collection. Hortic. Res. 2020, 7, 1–14. [Google Scholar] [CrossRef] [PubMed]
- Zhang, S.; Xu, M.; Qiu, Z.; Wang, K.; Du, Y.; Gu, L.; Cui, X. Spatiotemporal Transcriptome Provides Insights into Early Fruit Development of Tomato (Solanum Lycopersicum). Sci. Rep. 2016, 6, 23173. [Google Scholar] [CrossRef] [PubMed]
- Meissner, R.; Jacobson, Y.; Melamed, S.; Levyatuv, S.; Shalev, G.; Ashri, A.; Elkind, Y.; Levy, A. A New Model System for Tomato Genetics. Plant J. 1997, 12, 1465–1472. [Google Scholar] [CrossRef]
- Matsukura, C.; Aoki, K.; Fukuda, N.; Mizoguchi, T.; Asamizu, E.; Saito, T.; Shibata, D.; Ezura, H. Comprehensive Resources for Tomato Functional Genomics Based on the Miniature Model Tomato Micro-Tom. Curr. Genomics 2008, 9, 436. [Google Scholar] [CrossRef]
- Powell, A.L.T.; Nguyen, C.V.; Hill, T.; Cheng, K.L.; Figueroa-Balderas, R.; Aktas, H.; Ashrafi, H.; Pons, C.; Fernández-Muñoz, R.; Vicente, A.; et al. Uniform Ripening Encodes a Golden 2-like Transcription Factor Regulating Tomato Fruit Chloroplast Development. Science 2012, 336, 1711–1715. [Google Scholar] [CrossRef]
- Nagasaki, H.; Shirasawa, K.; Hoshikawa, K.; Isobe, S.; Ezura, H.; Aoki, K.; Hirakawa, H. Genomic Variation across Distribution of Micro-Tom, a Model Cultivar of Tomato (Solanum Lycopersicum). DNA Res. 2024, 31, dsae016. [Google Scholar] [CrossRef]
- Shirasawa, K.; Ariizumi, T. Near-Complete Genome Assembly of Tomato (Solanum Lycopersicum) Cultivar Micro-Tom. Plant Biotechnol. 2024. advpub. [Google Scholar] [CrossRef]
- Matas, A.J.; Yeats, T.H.; Buda, G.J.; Zheng, Y.; Chatterjee, S.; Tohge, T.; Ponnala, L.; Adato, A.; Aharoni, A.; Stark, R.; et al. Tissue- and Cell-Type Specific Transcriptome Profiling of Expanding Tomato Fruit Provides Insights into Metabolic and Regulatory Specialization and Cuticle Formation. Plant Cell 2011, 23, 3893–3910. [Google Scholar] [CrossRef]
- Sato, S.; Tabata, S.; Hirakawa, H.; Asamizu, E.; Shirasawa, K.; Isobe, S.; Kaneko, T.; Nakamura, Y.; Shibata, D.; Aoki, K.; et al. The Tomato Genome Sequence Provides Insights into Fleshy Fruit Evolution. Nat. 2012 485:7400 2012, 485, 635–641. [Google Scholar] [CrossRef]
- Li, J.; Tao, X.; Li, L.; Mao, L.; Luo, Z.; Khan, Z.U.; Ying, T. Comprehensive RNA-Seq Analysis on the Regulation of Tomato Ripening by Exogenous Auxin. PLOS One 2016, 11, e0156453. [Google Scholar] [CrossRef]
- Mitalo, O.W.; Kang, S.W.; Tran, L.T.; Kubo, Y.; Ariizumi, T.; Ezura, H. Transcriptomic Analysis in Tomato Fruit Reveals Divergences in Genes Involved in Cold Stress Response and Fruit Ripening. Front. Plant Sci. 2023, 14. [Google Scholar] [CrossRef] [PubMed]
- Zhao, X.; Li, F.; Ding, J.; Fu, X.; Shang, J.; Kong, X.; Li, X.; Li, L.; Zhang, X. Comparative RNA-Seq Analysis of Tomato (Solanum Lycopersicum L.) Provides Insights into Natural and Postharvest Ripening. Postharvest Biol. Technol. 2024, 216, 113079. [Google Scholar] [CrossRef]
- Nicolas, P.; Shinozaki, Y.; Powell, A.; Philippe, G.; Snyder, S.I.; Bao, K.; Zheng, Y.; Xu, Y.; Courtney, L.; Vrebalov, J.; et al. Spatiotemporal Dynamics of the Tomato Fruit Transcriptome under Prolonged Water Stress. Plant Physiol. 2022, 190, 2557–2578. [Google Scholar] [CrossRef] [PubMed]
- Sigurgeirsson, B.; Emanuelsson, O.; Lundeberg, J. Sequencing Degraded RNA Addressed by 3’ Tag Counting. PLOS One 2014, 9, e91851. [Google Scholar] [CrossRef] [PubMed]
- de Oliveira, P.N.; de Souza, L.P.; Ferreira, P.B.; Mauxion, J.P.; da Silva, L.F.C.; Chang, A.I.; Saleme, M. de L.S.; Zhu, F.; García, S.S.; De Beukelaer, H.; et al. Modulating the Activity of the APC/C Regulator SISAMBA Improves the Sugar and Antioxidant Content of Tomato Fruits. Plant Biotechnology Journal n/a. [CrossRef]
- Riou-Khamlichi, C.; Menges, M.; Healy, J.M.; Murray, J.A. Sugar Control of the Plant Cell Cycle: Differential Regulation of Arabidopsis D-Type Cyclin Gene Expression. Mol. Cell. Biol. 2000, 20, 4513–4521. [Google Scholar] [CrossRef]
- Li, A.; Sun, X.; Liu, L. Action of Salicylic Acid on Plant Growth. Front. Plant Sci. 2022, 13. [Google Scholar] [CrossRef]
- Sorrequieta, A.; Ferraro, G.; Boggio, S.B.; Valle, E.M. Free Amino Acid Production during Tomato Fruit Ripening: A Focus on L-Glutamate. Amino Acids 2010, 38, 1523–1532. [Google Scholar] [CrossRef]
- Guo, J.; Dong, L.; Kandel, S.L.; Jiao, Y.; Shi, L.; Yang, Y.; Shi, A.; Mou, B. Transcriptomic and Metabolomic Analysis Provides Insights into the Fruit Quality and Yield Improvement in Tomato under Soilless Substrate-Based Cultivation. Agronomy 2022, 12, 923. [Google Scholar] [CrossRef]
- Wang, L.; Wang, S.; Li, W. RSeQC: Quality Control of RNA-Seq Experiments. Bioinformatics 2012, 28, 2184–2185. [Google Scholar] [CrossRef]
- Dobin, A.; Davis, C.A.; Schlesinger, F.; Drenkow, J.; Zaleski, C.; Jha, S.; Batut, P.; Chaisson, M.; Gingeras, T.R. STAR: Ultrafast Universal RNA-Seq Aligner. Bioinform. (oxf. Engl.) 2013, 29, 15–21. [Google Scholar] [CrossRef] [PubMed]
- Robinson, M.D.; Oshlack, A. A Scaling Normalization Method for Differential Expression Analysis of RNA-Seq Data. Genome Biol. 2010, 11, R25. [Google Scholar] [CrossRef]
- Sun, J.; Nishiyama, T.; Shimizu, K.; Kadota, K. TCC: An R Package for Comparing Tag Count Data with Robust Normalization Strategies. BMC Bioinf. 2013, 14, 219. [Google Scholar] [CrossRef] [PubMed]
- Love, M.I.; Huber, W.; Anders, S. Moderated Estimation of Fold Change and Dispersion for RNA-Seq Data with DESeq2. Genome Biol. 2014, 15, 550. [Google Scholar] [CrossRef] [PubMed]
- Szklarczyk, D.; Kirsch, R.; Koutrouli, M.; Nastou, K.; Mehryary, F.; Hachilif, R.; Gable, A.L.; Fang, T.; Doncheva, N.T.; Pyysalo, S.; et al. The STRING Database in 2023: Protein-Protein Association Networks and Functional Enrichment Analyses for Any Sequenced Genome of Interest. Nucleic Acids Res. 2023, 51, D638–D646. [Google Scholar] [CrossRef] [PubMed]
- Xu, S.; Hu, E.; Cai, Y.; Xie, Z.; Luo, X.; Zhan, L.; Tang, W.; Wang, Q.; Liu, B.; Wang, R.; et al. Using clusterProfiler to Characterize Multiomics Data. Nat. Protoc. 2024, 19, 3292–3320. [Google Scholar] [CrossRef]
- Tian, F.; Yang, D.-C.; Meng, Y.-Q.; Jin, J.; Gao, G. PlantRegMap: Charting Functional Regulatory Maps in Plants. Nucleic Acids Res. 2020, 48, D1104–D1113. [Google Scholar] [CrossRef]
- Almeida-Silva, F.; Peer, Y.V. de Planttfhunter: Identification and Classification of Plant Transcription Factors. 2023.
- Gryffroy, L.; Ceulemans, E.; Manosalva Pérez, N.; Venegas-Molina, J.; Jaramillo-Madrid, A.C.; Rodrigues, S.D.; De Milde, L.; Jonckheere, V.; Van Montagu, M.; De Coninck, B.; et al. Rhizogenic Agrobacterium Protein RolB Interacts with the TOPLESS Repressor Proteins to Reprogram Plant Immunity and Development. Proc. Natl. Acad. Sci. U. S. A. 2023, 120, e2210300120. [Google Scholar] [CrossRef]
- Weirauch, M.T.; Yang, A.; Albu, M.; Cote, A.G.; Montenegro-Montero, A.; Drewe, P.; Najafabadi, H.S.; Lambert, S.A.; Mann, I.; Cook, K.; et al. Determination and Inference of Eukaryotic Transcription Factor Sequence Specificity. Cell 2014, 158, 1431–1443. [Google Scholar] [CrossRef]
- Castro-Mondragon, J.A.; Riudavets-Puig, R.; Rauluseviciute, I.; Berhanu Lemma, R.; Turchi, L.; Blanc-Mathieu, R.; Lucas, J.; Boddie, P.; Khan, A.; Manosalva Pérez, N.; et al. JASPAR 2022: The 9th Release of the Open-Access Database of Transcription Factor Binding Profiles. Nucleic Acids Res. 2022, 50, D165–D173. [Google Scholar] [CrossRef]
- Grant, C.E.; Bailey, T.L.; Noble, W.S. FIMO: Scanning for Occurrences of a given Motif. Bioinformatics 2011, 27, 1017–1018. [Google Scholar] [CrossRef]
Figure 1.
Description of differential gene expression. (a) Number of significant up- and down-regulated genes and their percentage in relation to all expressed genes in the dataset (21,725). (b) Venn Diagram of significant up-regulated genes between comparisons. (c) Venn Diagram of significant down-regulated genes between comparisons.
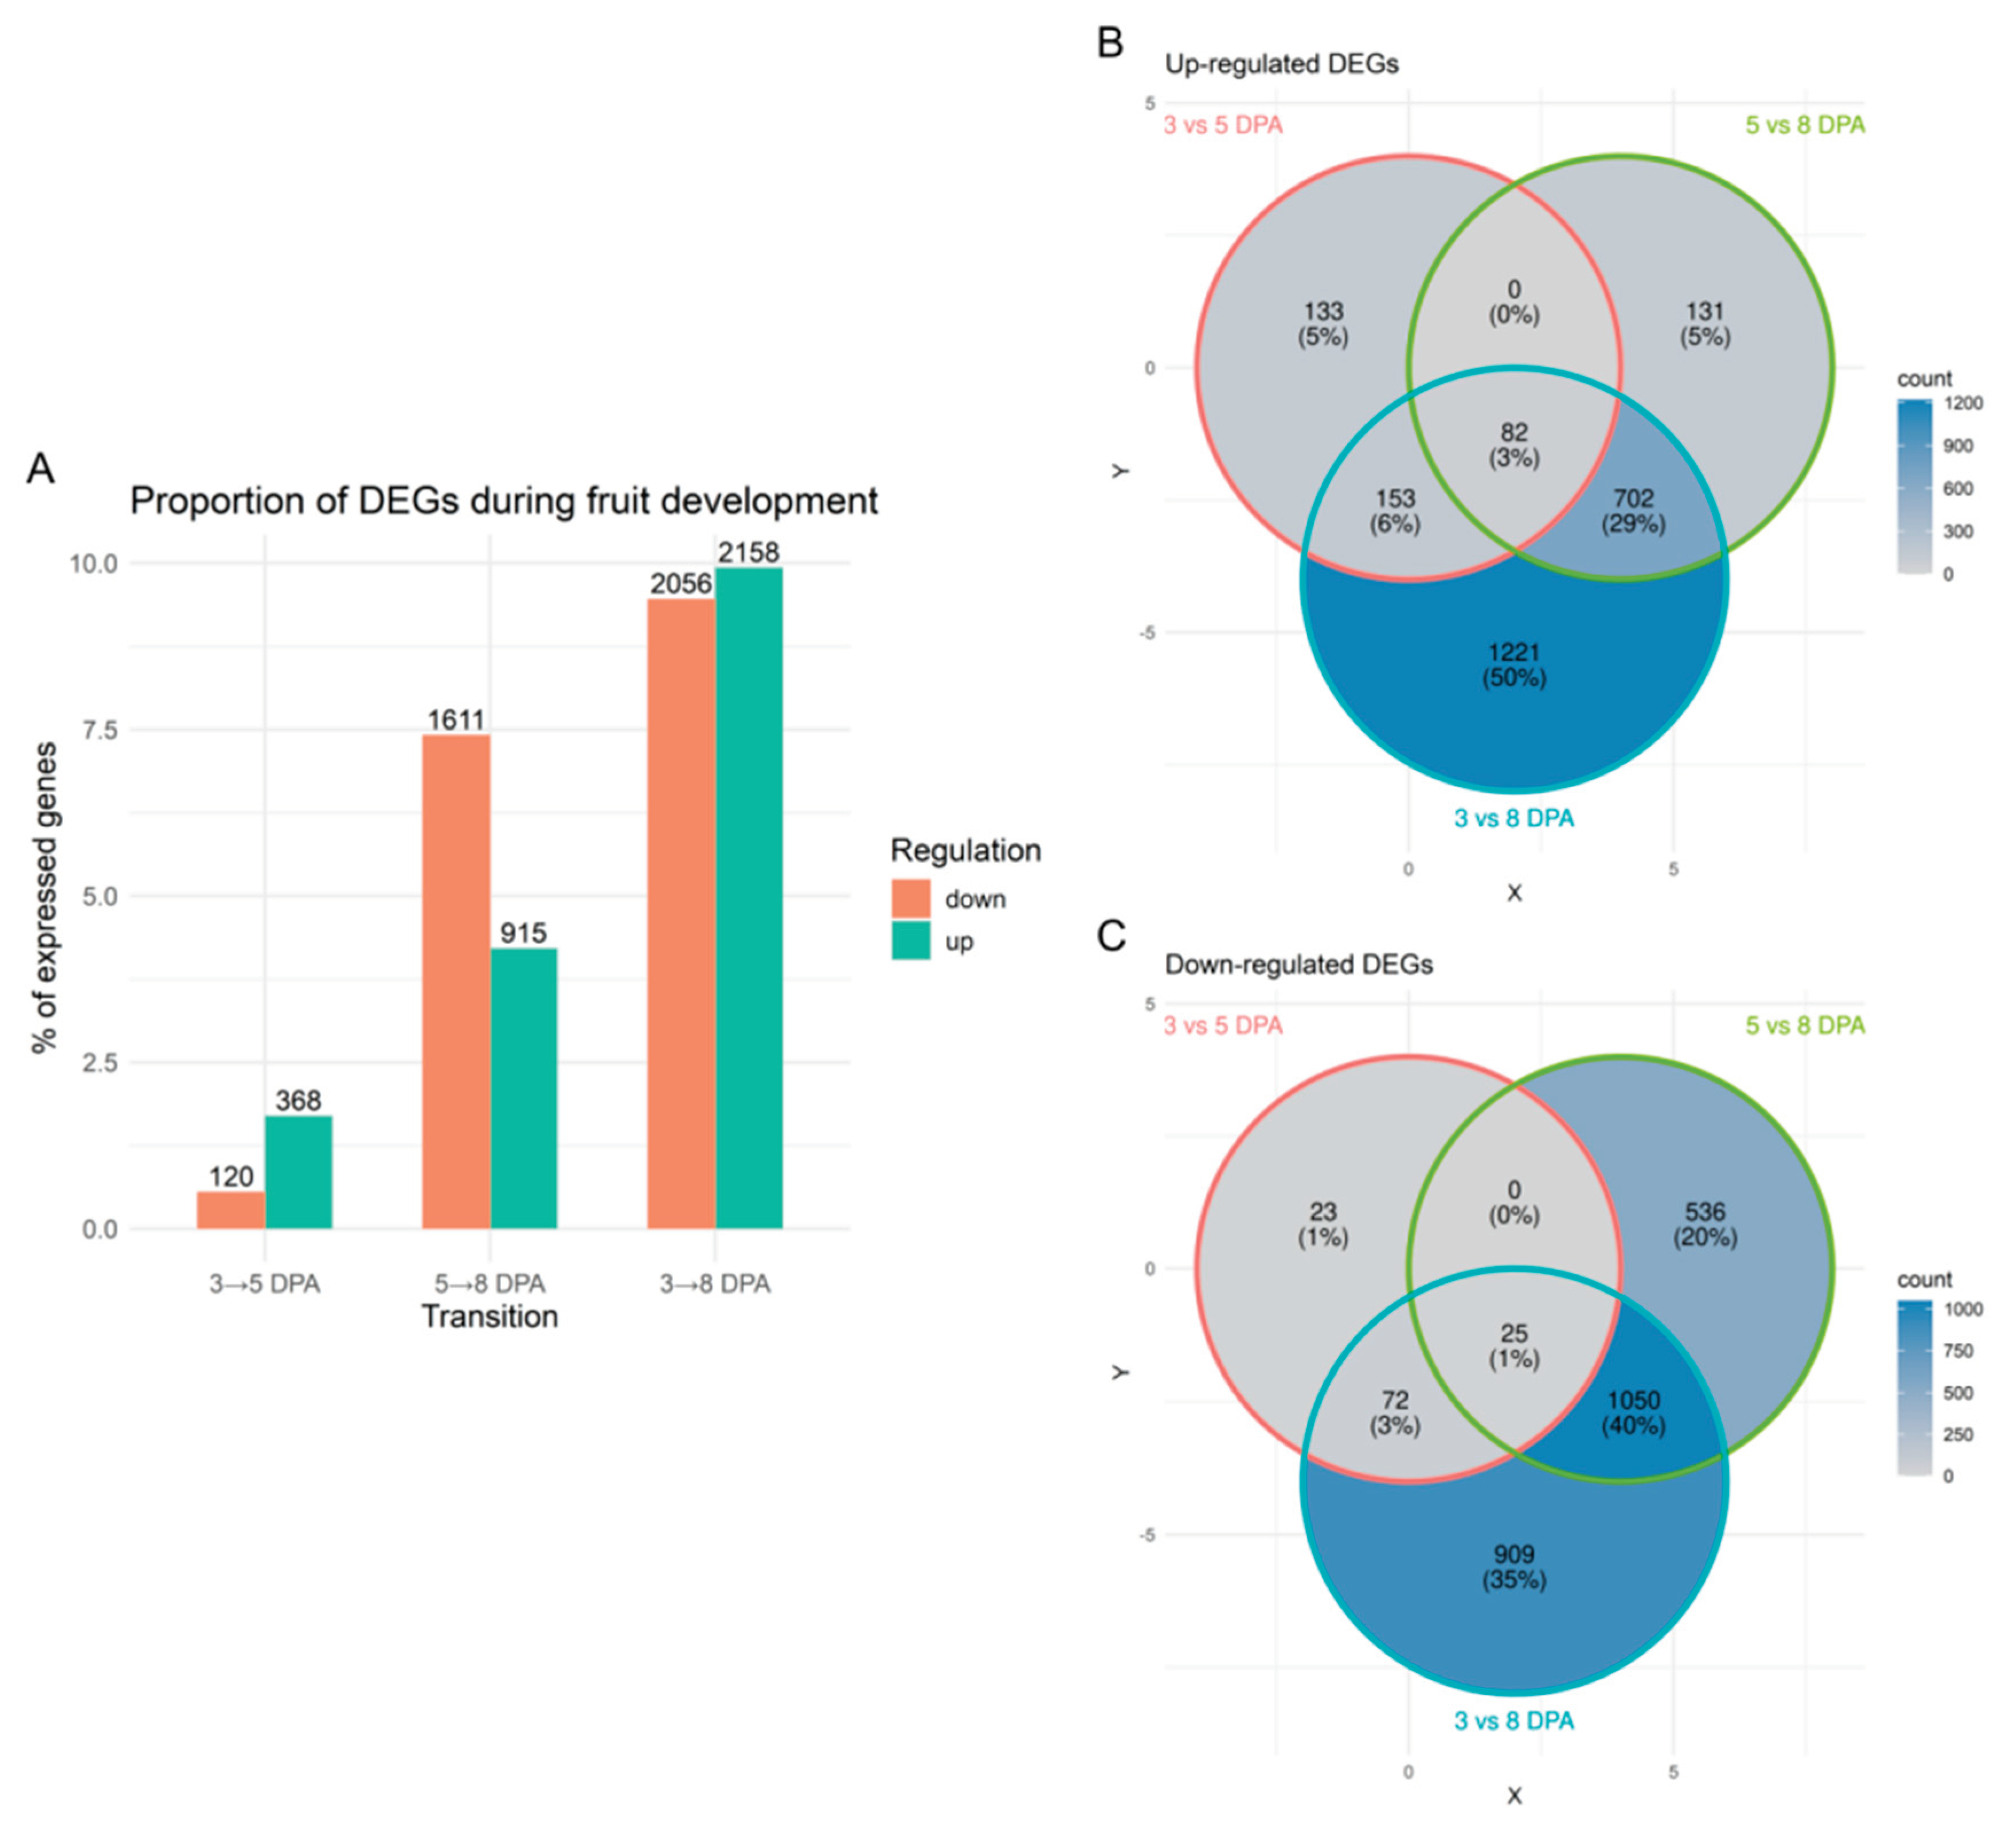
Figure 2.
Expression clustering analysis of genes during three developmental stages (3 DPA, 5 DPA, and 8 DPA). Clusters are labeled from Cluster 1 through Cluster 9. Each panel represents a unique cluster, with the average scaled counts at the y-axis (TMM normalization followed by log2(x + 1) transformation and Z-score scaling) across the time points (x-axis). The number of genes within each cluster is shown in parentheses next to the cluster number. Each timepoint comprises three biological replicates. T1 = 3 DPA, T2 = 5 DPA, and T3 = 8 DPA.

Figure 3.
Functional enrichment bubble plot showing the top 10 enriched categories across gene expression clusters. The x-axis represents clusters, while the y-axis lists enriched functional categories (GO functional classification). Each bubble represents a specific category enriched within a given cluster. Larger bubbles indicate stronger enrichment (higher enrichment factor), while colors correspond to the statistical significance (-log10(FDR-adjusted p-value)), with lighter colors representing higher significance levels. The complete enrichment analysis results are available in Supplementary File S1.
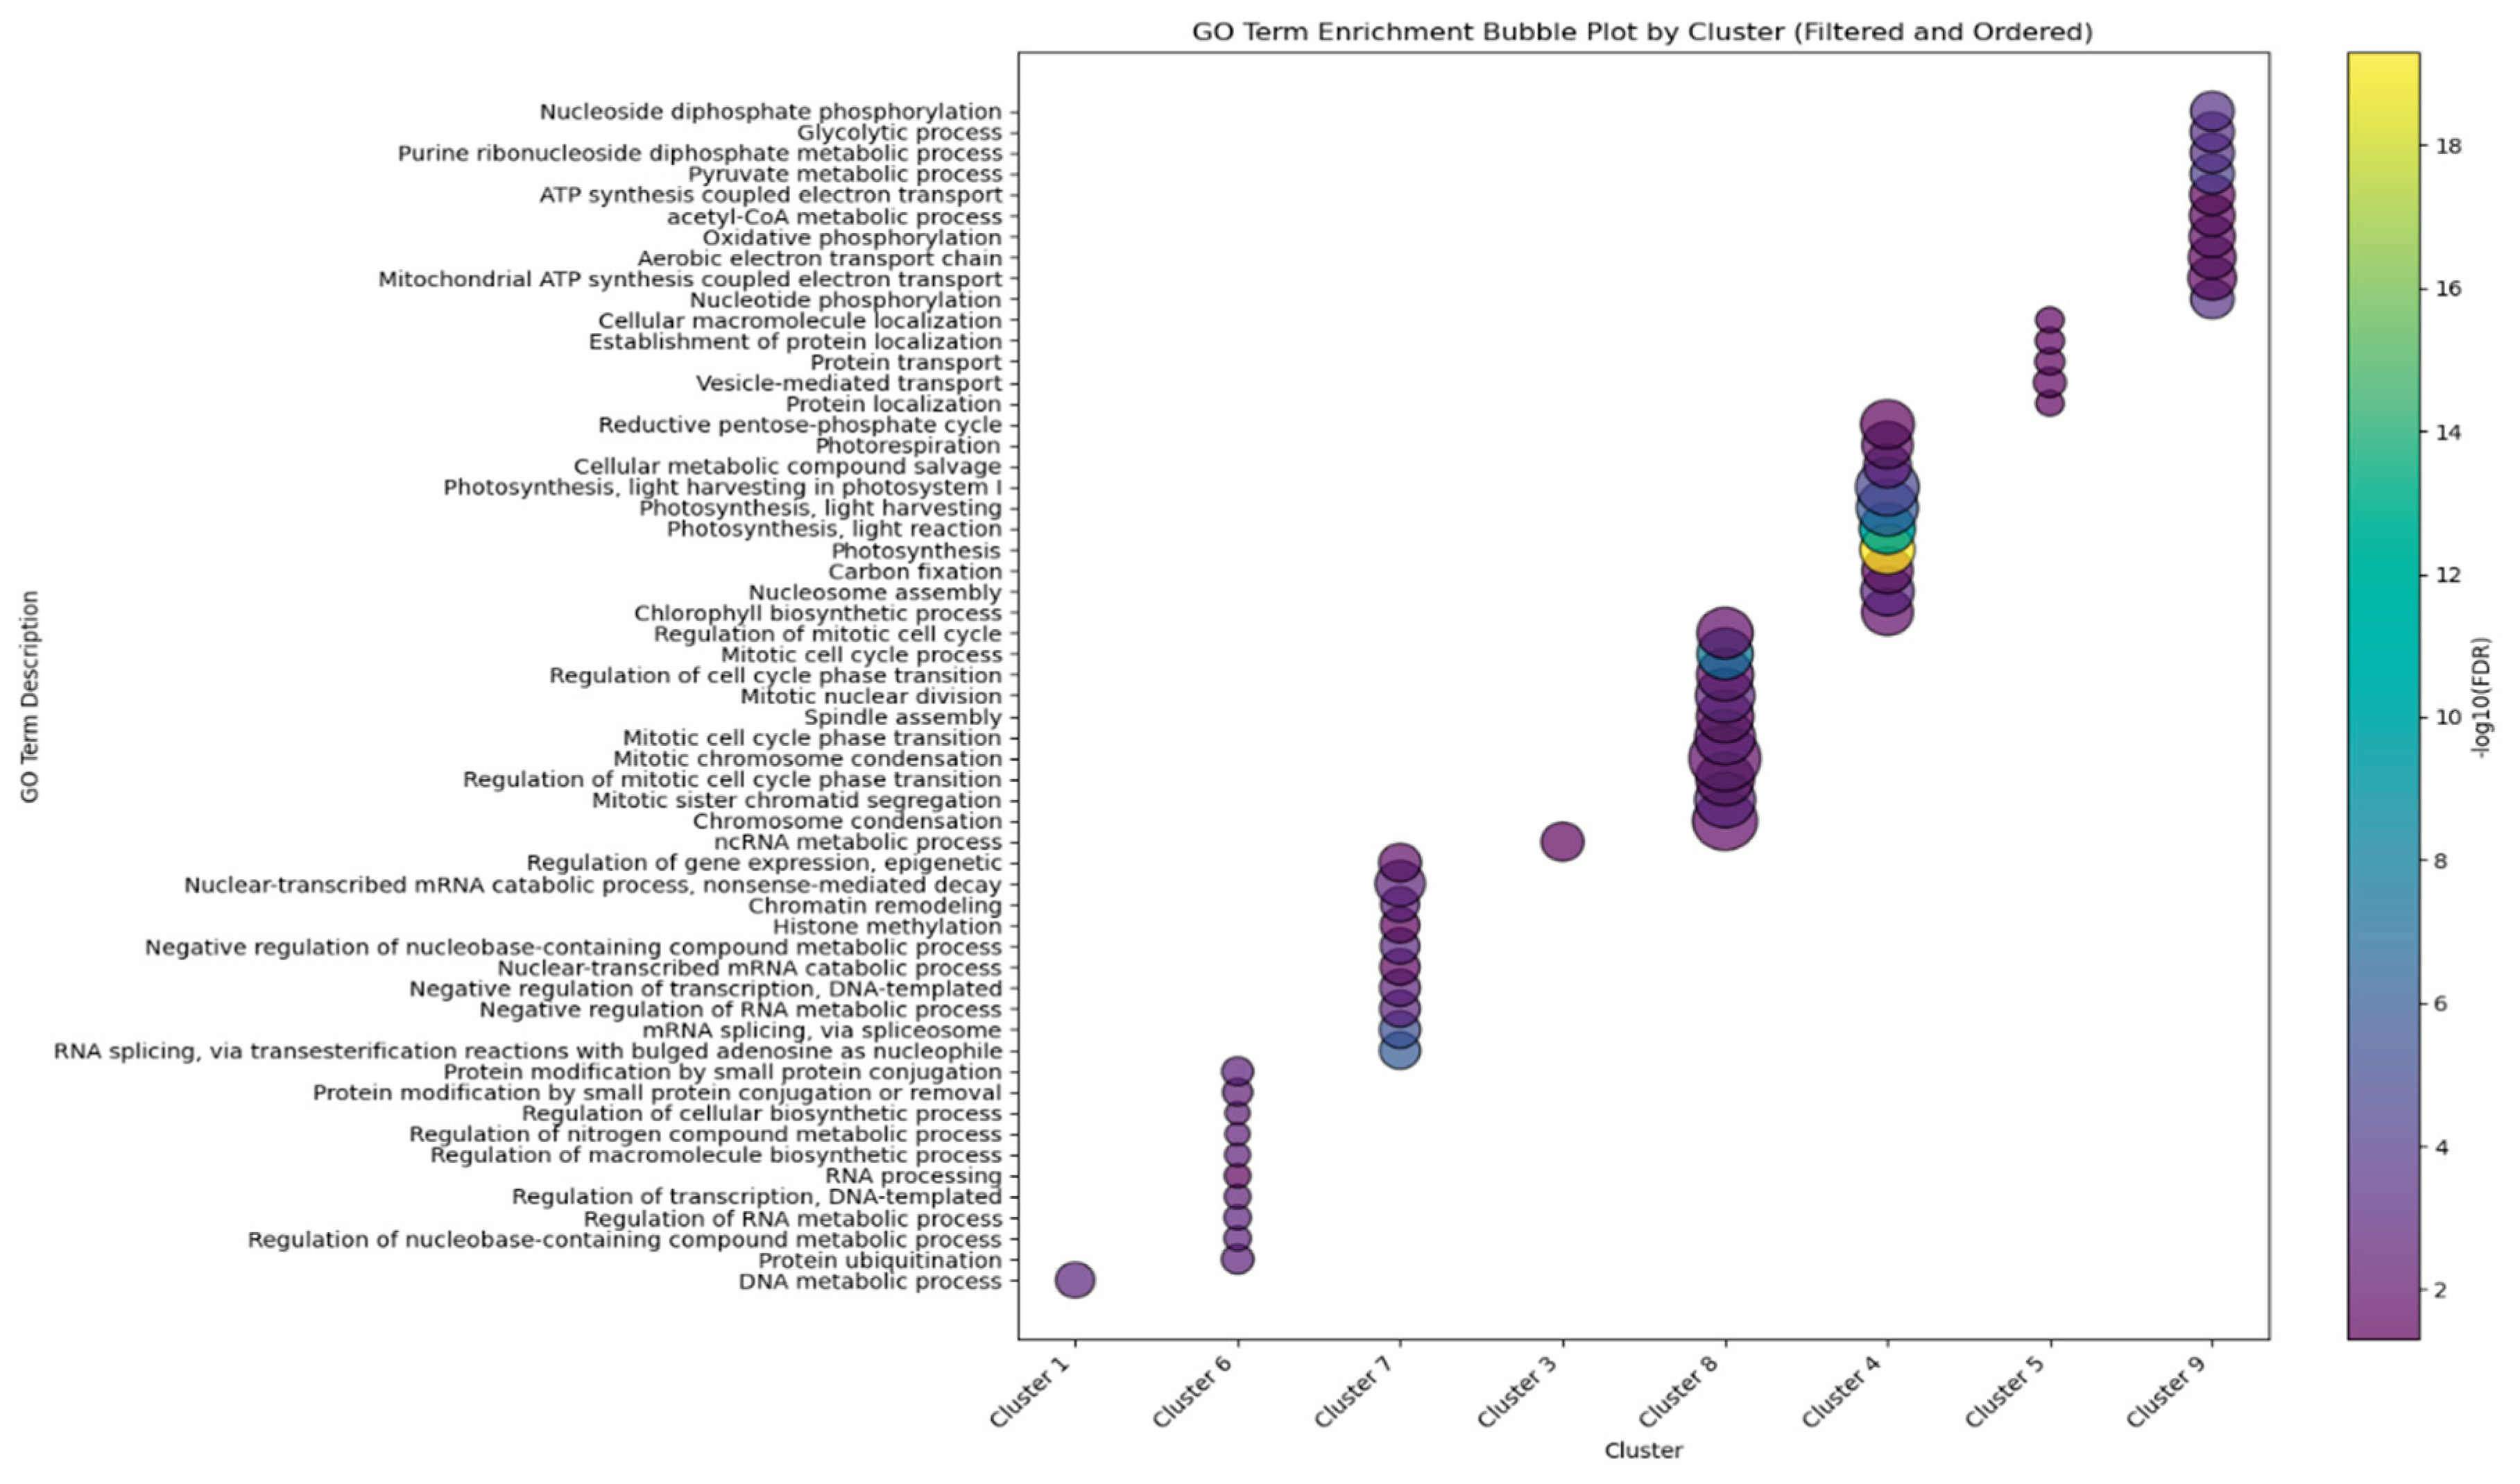
Figure 5.
Predicted targets of the MYB TF SLM2ch04g16973 in Cluster 6. A: Heatmap of target gene expression at all three timepoints; B: Sequence logo of the motifs found in the 2 kb upstream sequence of the target genes; C: Predicted binding motif for TF SLM2ch04g16973, from the JASPAR annotation of gene Solyc04g077260; D: List of the target genes, ITAG4.0 annotation, and matched motif positions in the upstream regions. Motifs were identified using FIMO against JASPAR and CIS-BP database for S. lycopersicum TFs. Heatmap was produced with the Morpheus (https://software.broadinstitute.org/morpheus/).
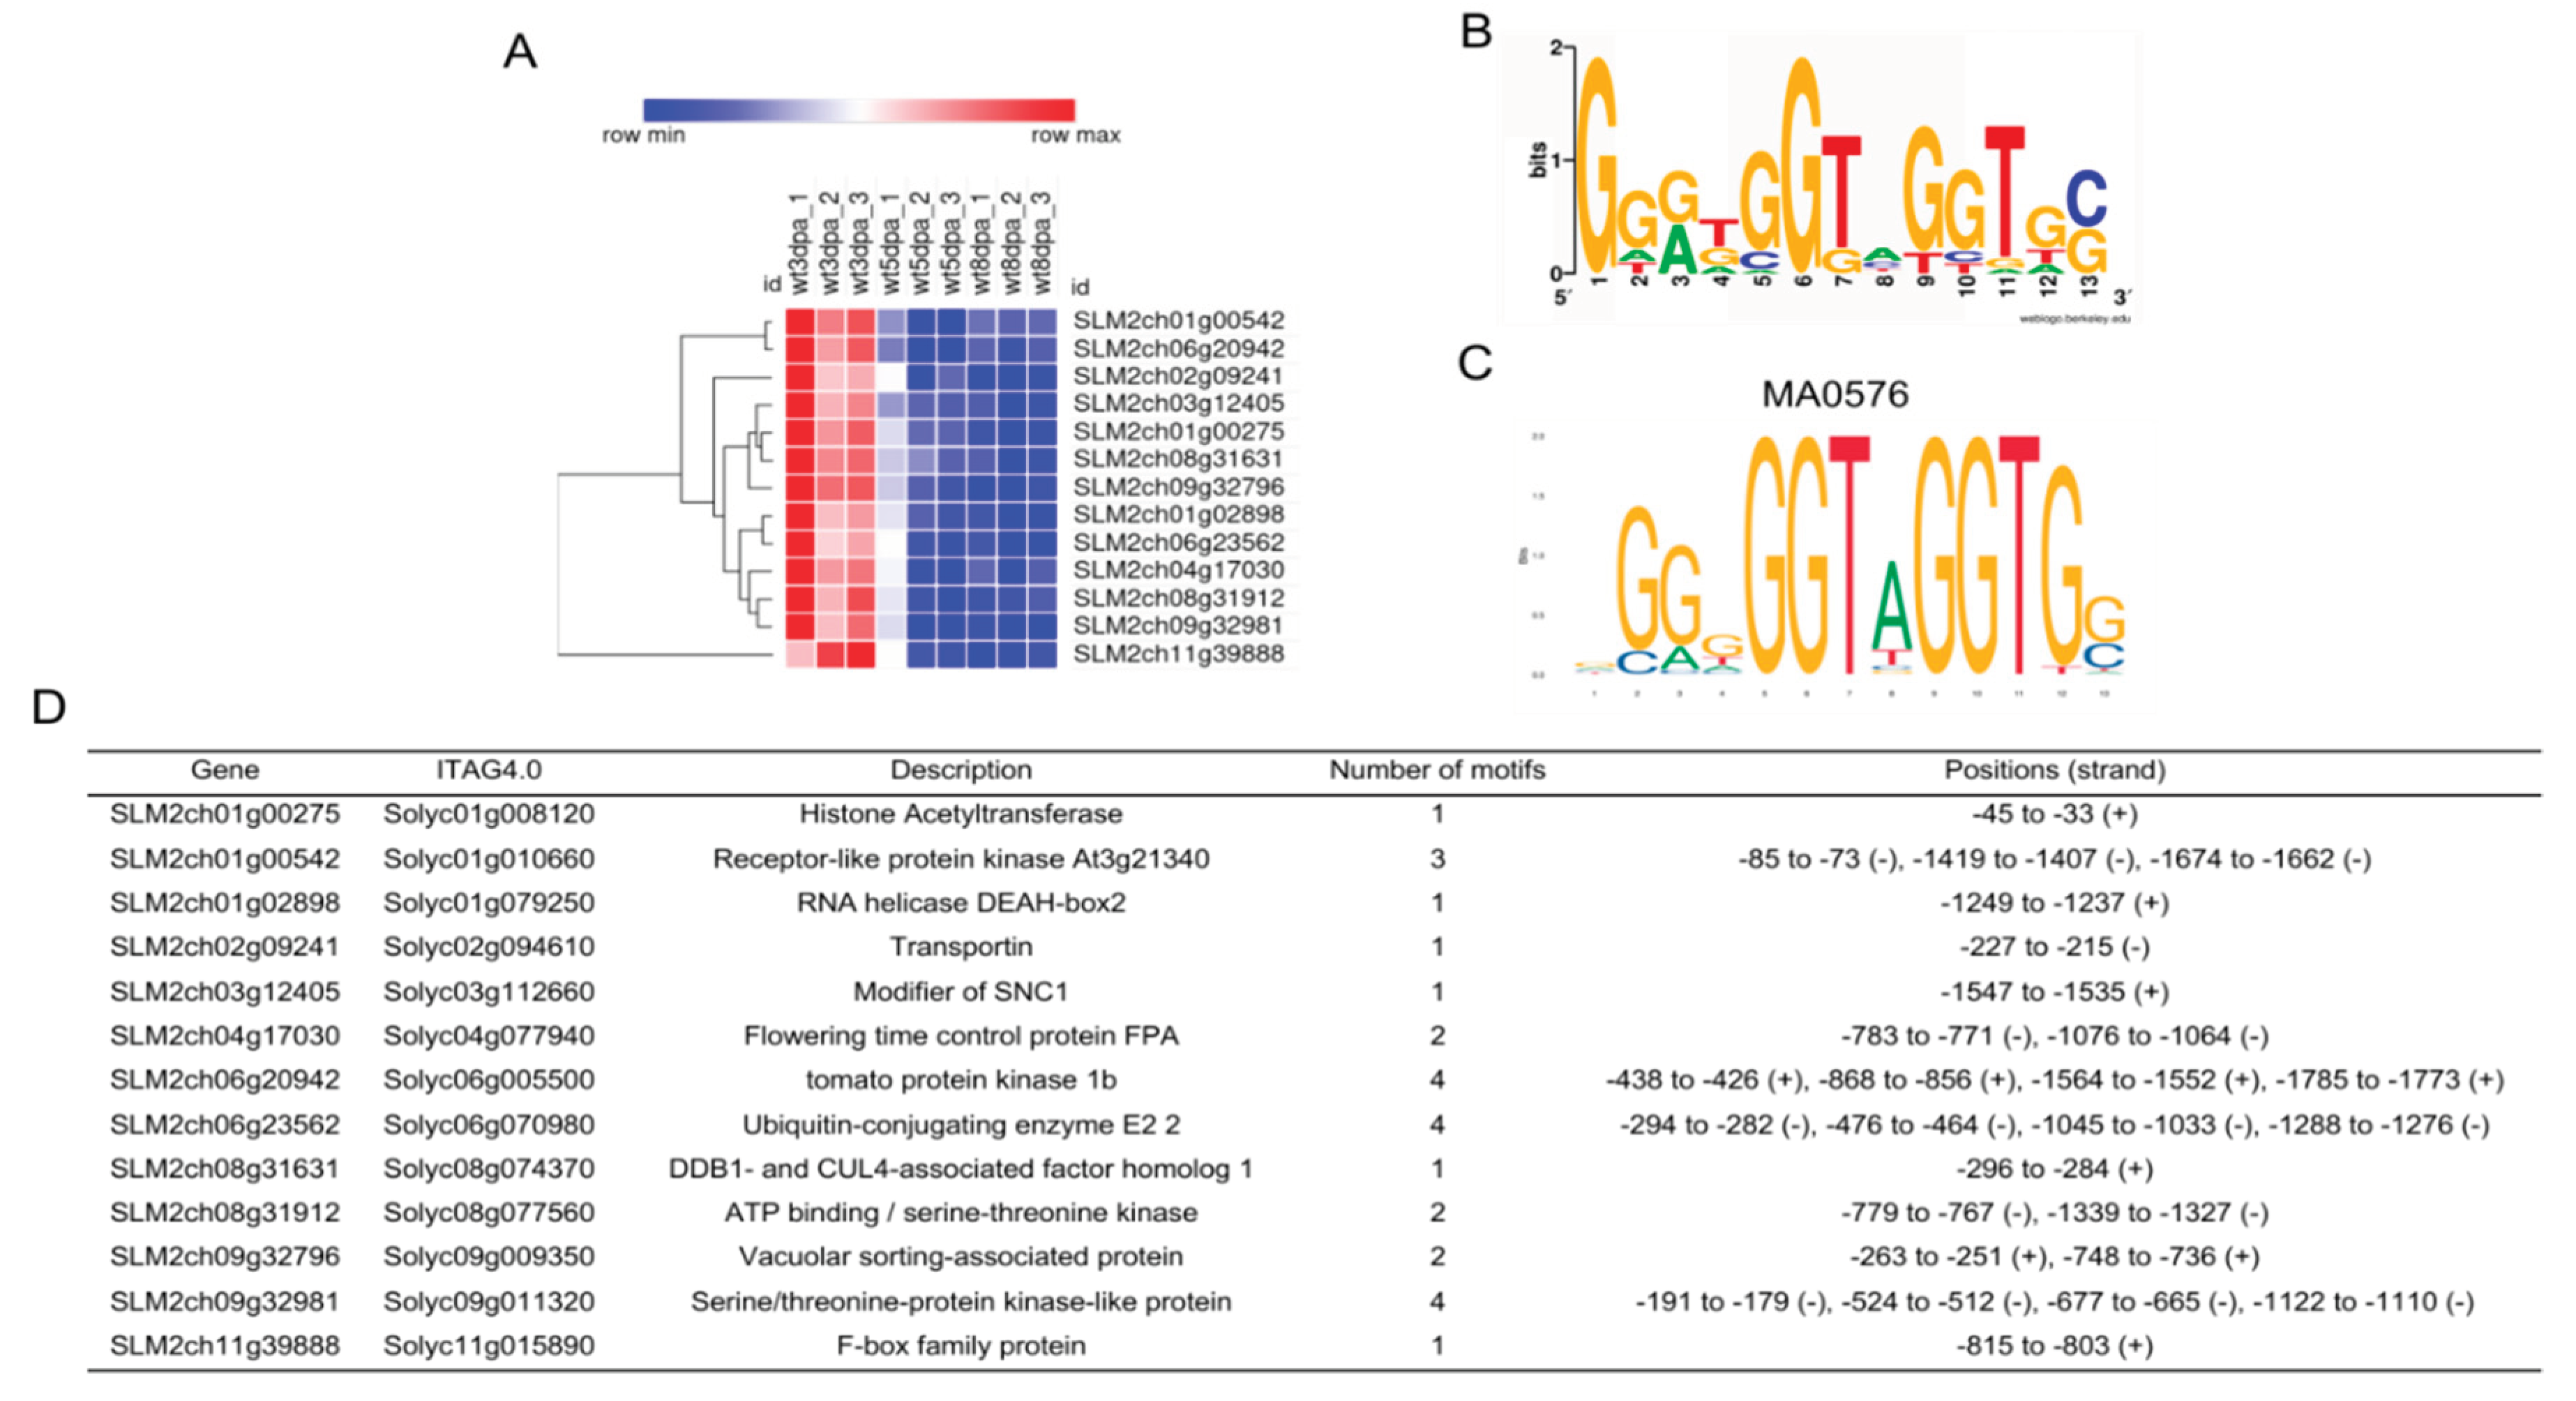
Figure 6.
Clustering analysis of metabolites during three developmental stages of tomato fruits (3 DPA, 5 DPA, and 8 DPA). Clusters are labeled from Cluster M1 through Cluster M7 (left, green). Correlated gene clusters are pictured on next to each metabolite cluster, in blue. Gene and metabolite cluster associations were determined using Spearman correlation between average Z-score profiles. The y-axis indicates normalized expression changes, while the x-axis marks the time points. In the right, the number of metabolites in each cluster are plotted in representative functional classes. The complete results are in Supplementary File S4.
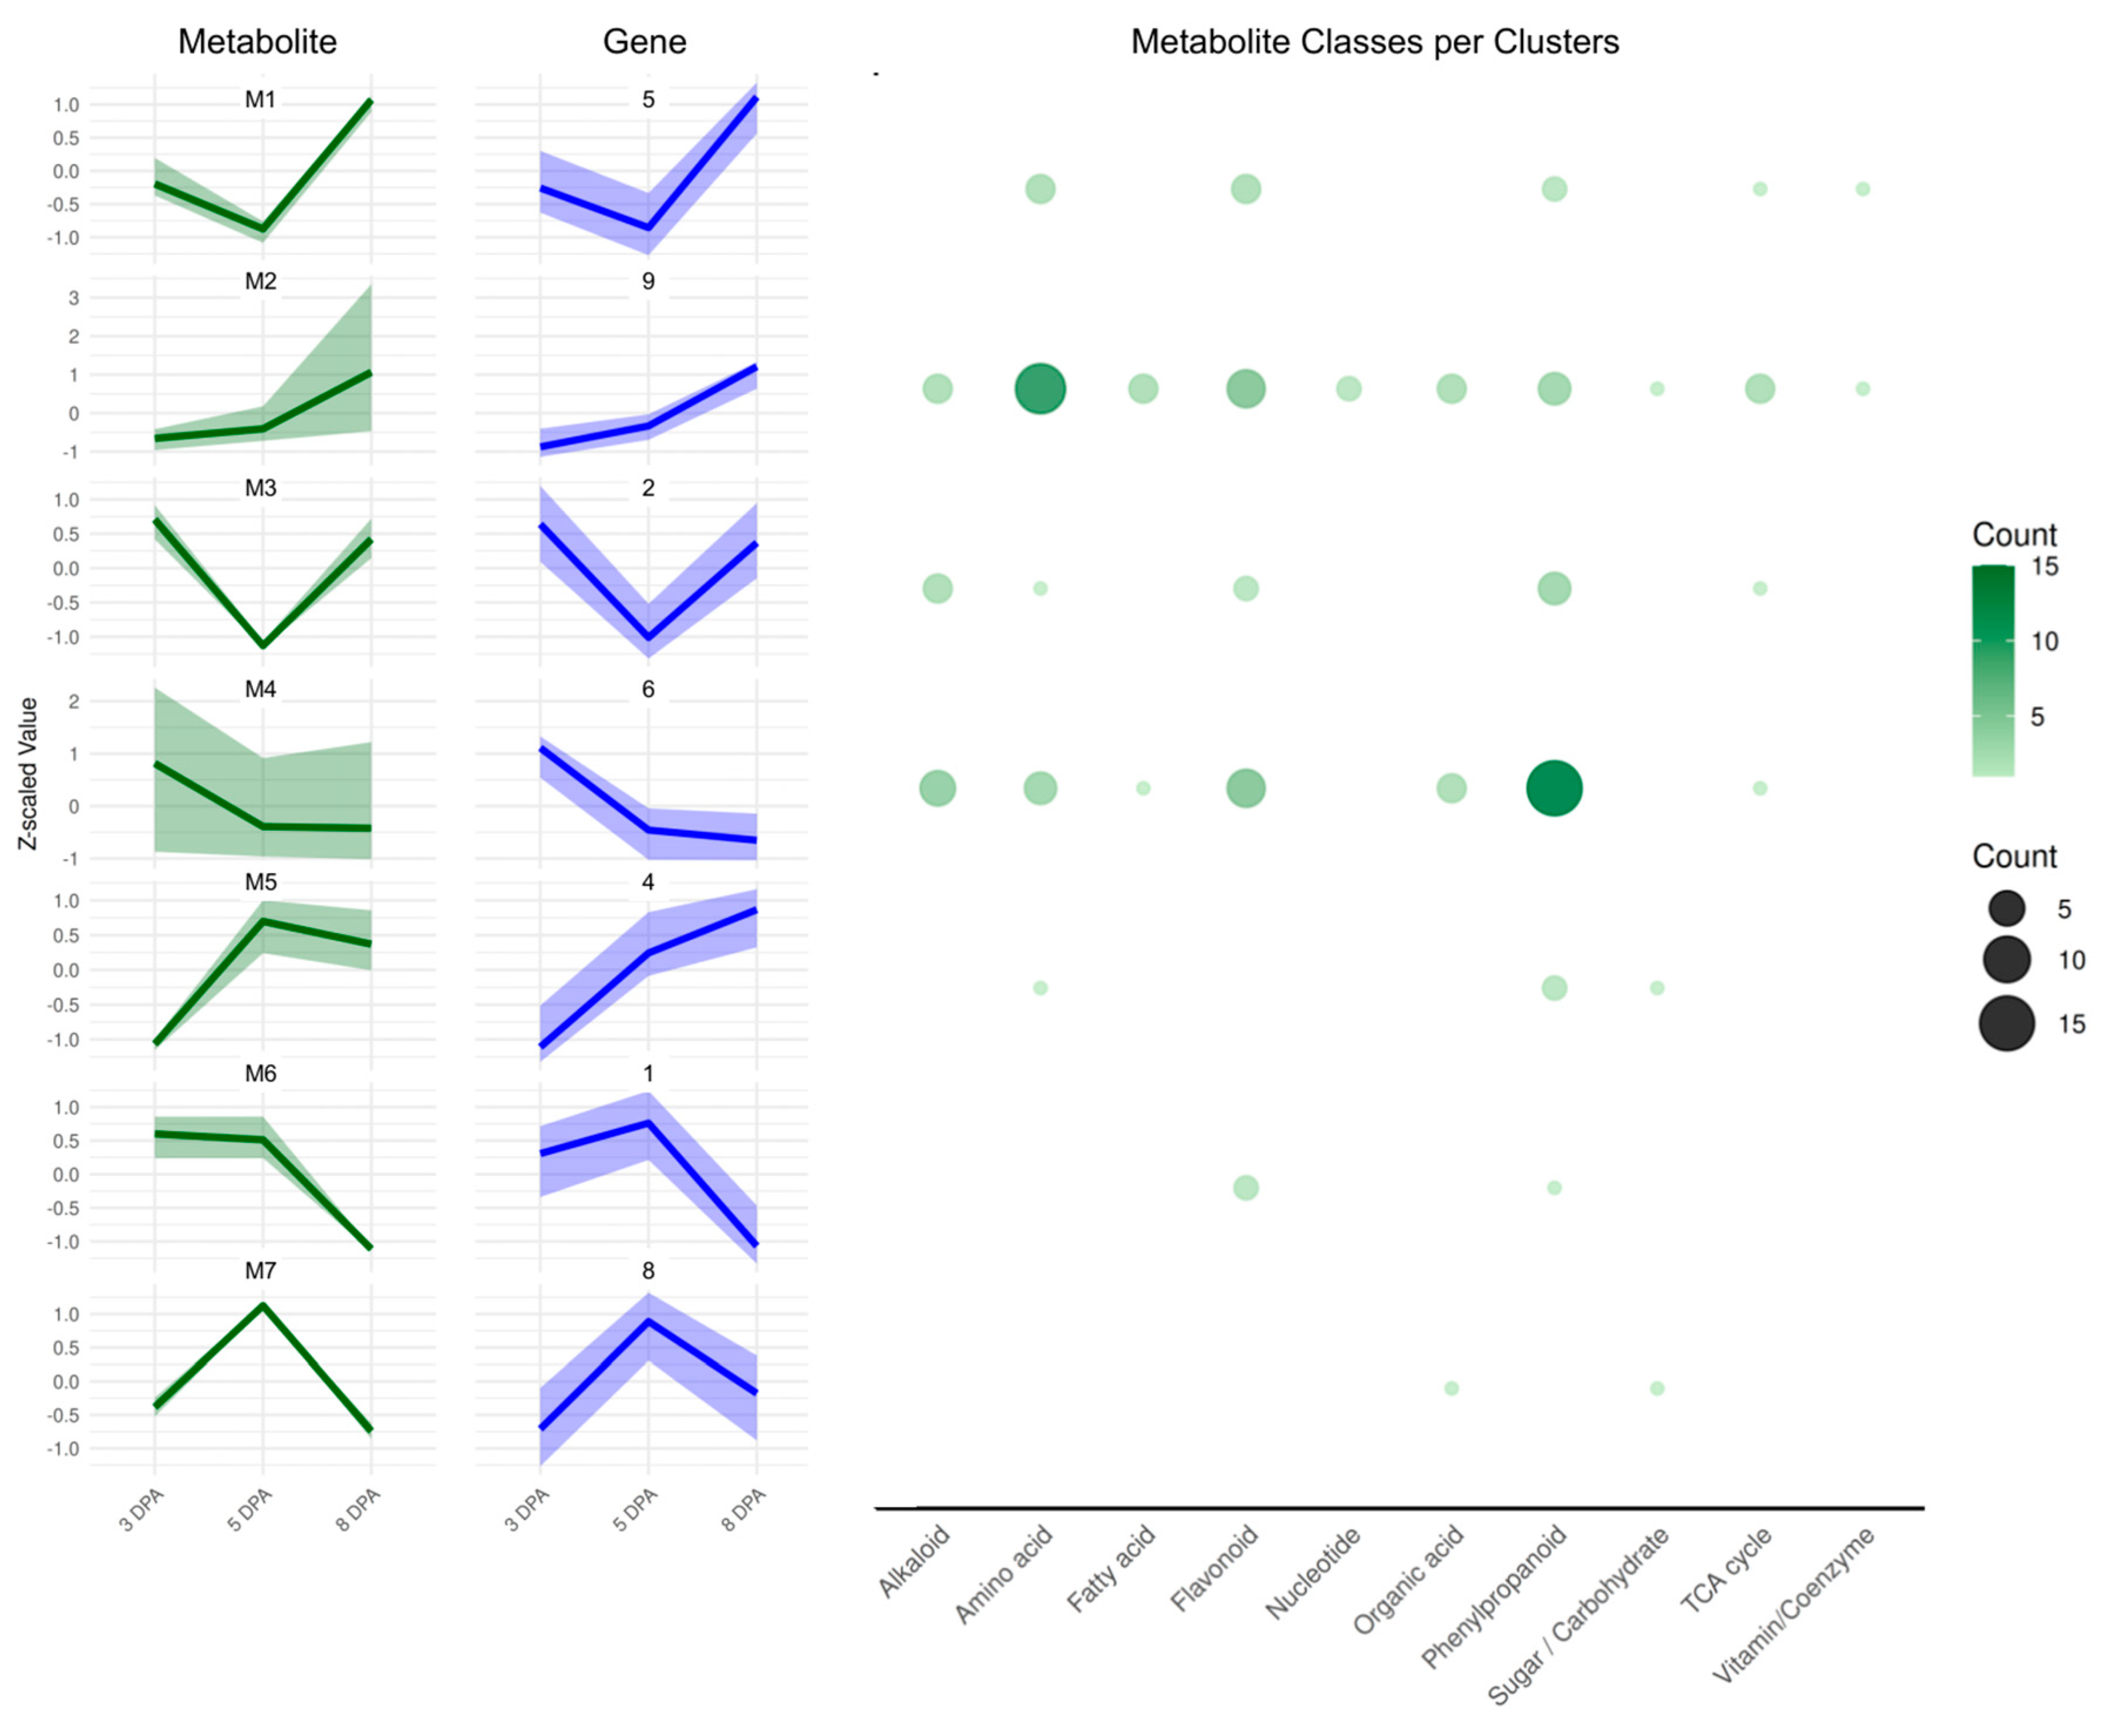

Table 1.
Summary of RNA-seq quality and alignment statistics for Micro-Tom samples at three developmental stages.
Table 1.
Summary of RNA-seq quality and alignment statistics for Micro-Tom samples at three developmental stages.
| Sample | Raw read pairs | Clean read pairs | Q30 % (Before) | Q30 % (After) | Uniquely mapped % | Multi-mapping % | Unmapped % |
|---|---|---|---|---|---|---|---|
| 3DPA_R1 | 38108973 | 33199719 | 91.49 | 94.61 | 90.86 | 4.69 | 4.44 |
| 3DPA_R2 | 36774120 | 30619852 | 91.42 | 94.76 | 92.44 | 4.21 | 3.34 |
| 3DPA_R3 | 43253948 | 33210737 | 90.26 | 95.03 | 92.41 | 4.26 | 3.33 |
| 5DPA_R1 | 36012854 | 28486863 | 91.16 | 95.10 | 92.21 | 4.56 | 3.22 |
| 5DPA_R2 | 39869504 | 32194417 | 89.80 | 94.76 | 90.62 | 4.49 | 4.90 |
| 5DPA_R3 | 35938412 | 28865298 | 90.46 | 94.79 | 90.37 | 4.49 | 5.14 |
| 8DPA_R1 | 38193796 | 32379259 | 91.89 | 94.91 | 92.76 | 4.46 | 2.78 |
| 8DPA_R2 | 38321852 | 27953423 | 89.58 | 95.05 | 91.90 | 4.69 | 3.41 |
| 8DPA_R3 | 35581593 | 28852087 | 90.92 | 94.67 | 92.78 | 4.59 | 2.63 |
Disclaimer/Publisher’s Note: The statements, opinions and data contained in all publications are solely those of the individual author(s) and contributor(s) and not of MDPI and/or the editor(s). MDPI and/or the editor(s) disclaim responsibility for any injury to people or property resulting from any ideas, methods, instructions or products referred to in the content. |
© 2025 by the authors. Licensee MDPI, Basel, Switzerland. This article is an open access article distributed under the terms and conditions of the Creative Commons Attribution (CC BY) license (http://creativecommons.org/licenses/by/4.0/).
Copyright: This open access article is published under a Creative Commons CC BY 4.0 license, which permit the free download, distribution, and reuse, provided that the author and preprint are cited in any reuse.


