Submitted:
04 August 2025
Posted:
06 August 2025
You are already at the latest version
Abstract
The Earth–Moon system has undergone continuous evolution across all timescales since its formation. Earth's rotation is gradually slowing, the Moon's rotation is decelerating, and the Moon is slowly receding from Earth. These progressive changes affect key planetary parameters, including the length of day (LOD), the number of days per year (DOY), and the Earth–Moon distance (DOM). Building on the author's earlier work, this paper presents a set of mathematical equations to model these dynamics and predict LOD, DOY, and DOM over time. The results derived from this model show strong agreement with historical data, offering a robust framework for understanding the long-term evolution of the Earth–Moon system. To address the longstanding Lunar crisis—where conventional tidal friction models predict an unrealistically close Earth–Moon proximity in the distant past and many assumptions and parameters must be introduced to help reconcile the models with observations—this study proposes a novel hypothesis: a significantly lower volume of surface liquid water in Earth's early history may have reduced tidal dissipation. The subsequent increase in oceanic volume could be attributed to the capture of a large icy comet, a scenario supported by precedent such as the 1994 collision of Comet Shoemaker–Levy 9 with Jupiter. This mechanism offers a plausible resolution to the tidal friction discrepancy and deepens our understanding of planetary evolution.
Keywords:
length of day
; days of year
; Moon’s distance
; Moon receding
; Earth-Moon system
1. Introduction
The Earth–Moon system is a cosmic choreography that has quietly nurtured life for billions of years. Its gradual evolution carries profound implications for ecosystems, climate, and human civilization. Earth is the cradle of all known life, and any alteration to its fundamental conditions affects every facet of its biosphere— including the very existence of humanity itself.
Since its formation, the Earth–Moon system has evolved across every timescale. Earth’s rotation is slowing, causing the solar day to lengthen, while the Moon steadily recedes, diminishing tidal intensity and altering tidal rhythms. These dynamic shifts have continuously shaped Earth’s ecosystems. Monitoring and understanding such changes are not merely a matter of scientific interest—it is essential for forecasting and adapting to the future of our planet.
In modern cosmology, dark matter and dark energy are estimated to constitute roughly 95% of the universe’s total matter–energy content, leaving only 5% as observable matter. Based on this 95:5 ratio, I applied fluid mechanics principles to dark matter and dark energy, proposing the Dark Matter Field Fluid Model, which I presented at the Division of Particles and Fields Meeting in 2004 (American Physical Society, University of California at Riverside). The model aligns remarkably well with current observations and with the evolutionary history of the Earth–Moon system [1,2].
Recently, however, news reports have highlighted an unexpected phenomenon [3]: Earth’s rotation appears to be speeding up slightly, making days marginally shorter than 24 hours. Though the difference is measured in milliseconds, it’s a measurable trend that scientists are closely monitoring. July 22nd marked one of the shortest days ever recorded. If this acceleration continues, timekeepers may need to implement a “negative leap second” to adjust atomic clocks—a correction that has never before been required.
Several readers have reached out with questions about my earlier work on the evolution of the Earth–Moon system, specifically whether the model can predict future changes such as the length of Earth’s Day, the number of solar days per year, and the Moon’s distance from Earth. In response, this paper revisits that foundational work and derives explicit equations to calculate the evolutions of the following parameters:
- Length of Day (LOD)
- Days of Year (DOY)
- Distance of Moon (DOM)
These equations, grounded in the Dark Matter Field Fluid model, offer predictive insights that may be of broad interest to researchers in planetary science, astronomy, geophysics, as well as to scientifically curious members of the general public.
2. Derivation of Mathematic Equations of LOD, DOY and DOM in the Earth-Moon System
Building on the Dark Matter Field Fluid (DMFF) model presented in Pan [1,2], this section develops a set of equations to predict the long-term evolution of the Earth–Moon system. According to the DMFF hypothesis, the universe is uniformly filled with a subtle form of dark matter exhibiting both field and fluid properties. This fine-grained dark matter penetrates and saturates ordinary matter, rendering celestial bodies as “sponge-like” objects moving through a cosmic fluid, akin to porous spheres drifting through water.
Based on the Dark Matter Field Fluid (DMFF) model, the Moon’s rotation and recession are linked by the following equation:
Where:
- ω is the Moon’s rotation velocity.
- is the Moon’s rotation deceleration rate.
- R is the Moon’s distance to the Earth (center to center).
- is the Moon’s receding rate.
Equation (1) includes only measurable quantities, all of which can be obtained with high precision using advanced instruments. Its significance lies in the fact that it relies solely on currently observable data, without invoking assumptions or unknown parameters.
The DMFF model further reveals that the Earth’s rotation and the Moon’s recession are linked by the following equation:
Where:
- ω1 is the Earth’s rotation velocity.
- is the earth rotation deceleration rate.
- R2 is the Moon’s distance to the Earth (center to center).
- is the Moon’s receding rate.
- is the dark matter field fluid saturation index (= 0.64) calculated from current data.
- r1 is the radius of Earth.
- r2 is the radius of Moon.
Equation (2) also contains only observed data, free from assumptions. The parameter n can be extracted directly from current measurements. For detailed calculations, refer to Reference [2]. After inserting the relevant data into Equations (1) and (2), the resulting values are –1.54 and –1.53, respectively. These align closely with the theoretical value of –1.67, falling well within the margin of observational error. This strong agreement provides compelling support for the DMFF model.
In contrast, the tidal friction theory of Earth-Moon system evolution does not yield equations analogous to Equations (1) and (2).
Under this framework, the rotational dynamics and mutual separation of the Earth and Moon can be described with exponential functions derived from fluid resistance and internal saturation effects.
2.1. Rotation Rate and Length of Day (LOD) of Earth
The rotational rate ω of a spherical body such as Earth evolves as:
where:
-
η is the dark matter field fluid constant(~ 4.39*10-22 s-1 m-1)
- n is the dark matter field fluid saturation index (~ 0.64)
- r is the radius of the object
- t is time.
- ω0 is the initial rotational rate (rad/s)
By substituting observed Earth–Moon parameters:
The time t is in billion years.
Thus, the Length of Day becomes:
The time t is in billion years. This equation uses the current Earth age of 4.5 Ga and current LOD of 24 hours as reference.
2.2. Solar Days of Year (DOY)
Assuming the Earth’s orbital period around the Sun remains stable (i.e., the Length of Year is constant), the number of solar days per year can be estimated by:
The time t is in billion years and this equation uses the current Earth age of 4.5 Ga and current DOY of 365.25 days as reference. This formulation reflects how a slowing rotation leads to fewer solar days in a fixed orbital year.
2.3. Moon–Earth Distance (DOM)
The model predicts that the Moon’s orbital radius evolves as:
Based on current observational constraints, the Moon’s center-to-center Earth distance evolves as:
The time t is in billion years and this equation uses the current Earth age of 4.5 Ga and DOM of 392509 km (center to center) as reference. The Moon’s surface-to-surface Earth distance evolves as:
The time t is in billion years and this equation uses the current Earth age of 4.5 Ga and DOM of 384400 km (surface to surface) as reference.
3. Comparative Data and Model Validation
Three figures support these calculations. Figure 1 shows the evolution of the Length of Day (LOD) for Earth. The plot on the left spans a 10-billion-year range, where the ‘x’ markers represent observed data and the solid line represents the LOD calculated using Equation (5). Data are from Scrutton et al. [4] and Sonett et al. [5]. The plot on the right is a closer look at the period between 3.5 and 4.6 billion years ago. The calculated values align very well with the observed data.
According to the calculations, the LOD was approximately 8 hours when the Earth-Moon system was first formed. The model also predicts that the LOD will increase to 30 hours in a billion years from now.
Figure 1.
LOD evolution over 10 billion years. Observed data points (×) align well with Equation (5); right is the expansion of the left.
Figure 1.
LOD evolution over 10 billion years. Observed data points (×) align well with Equation (5); right is the expansion of the left.
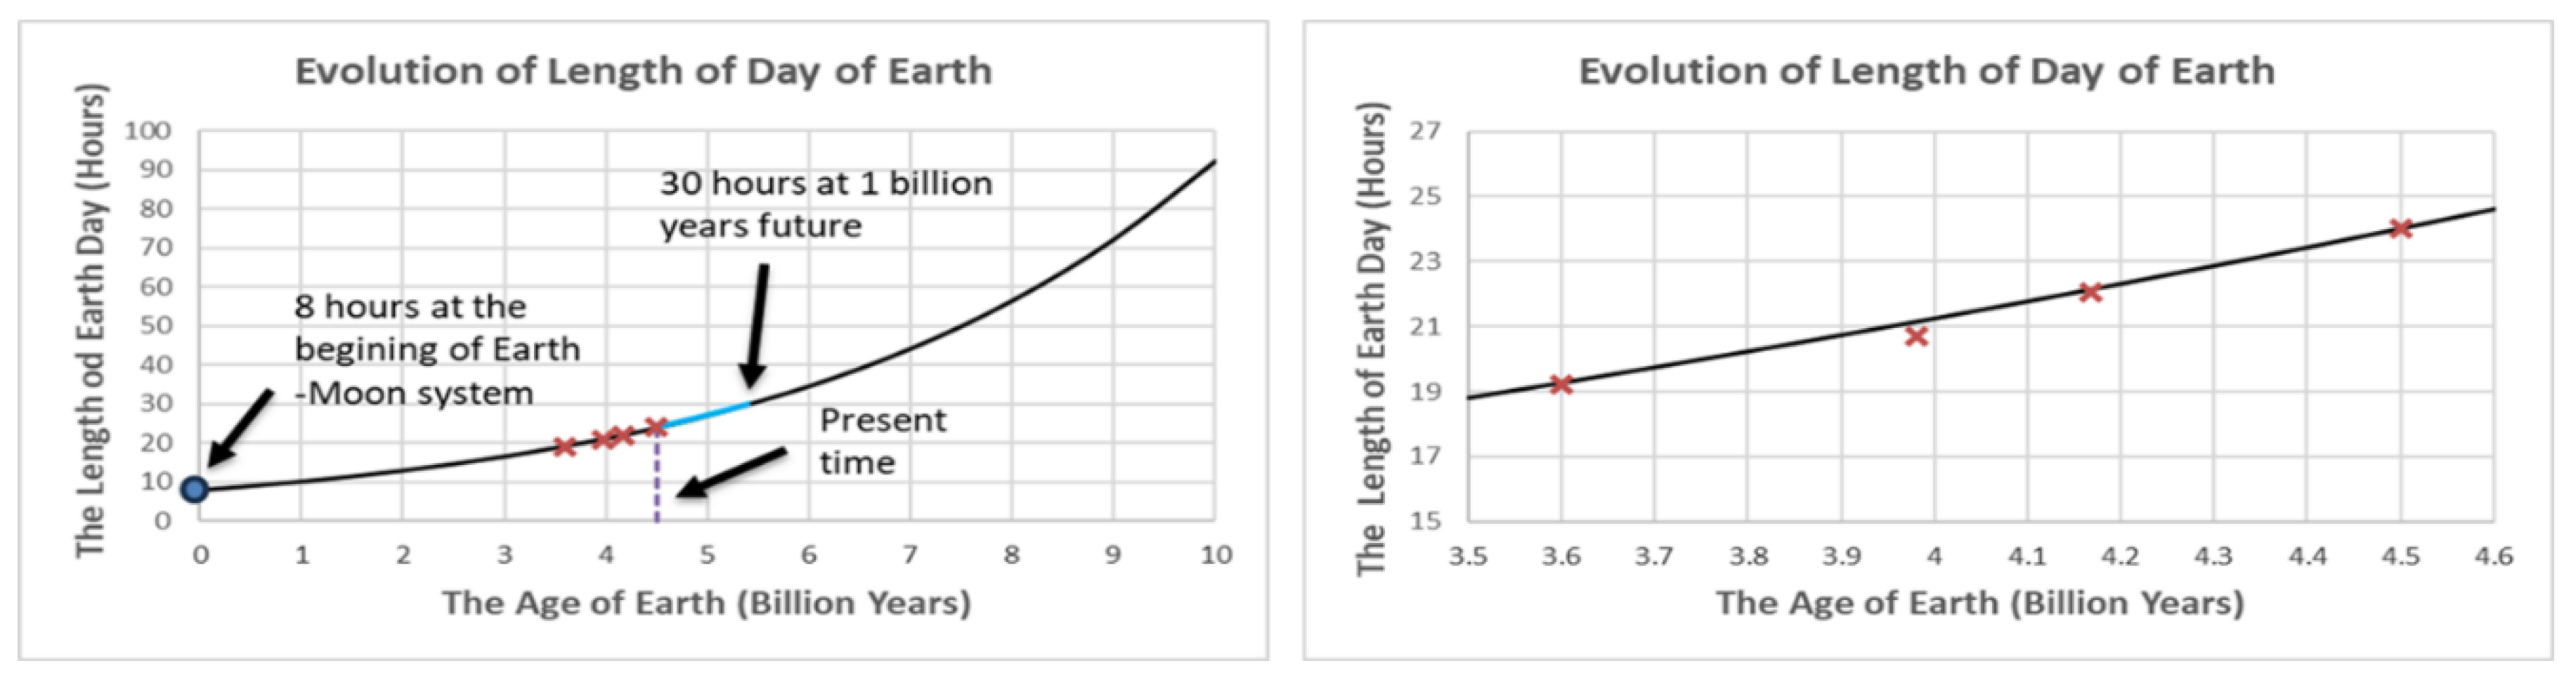
Figure 2 shows the evolution of the Earth’s days of year (DOY) from the formation of the Earth-Moon system to 10 billion years. The solid line represents the calculated values from Equation (6), while the observed data marked as ‘●’ is also plotted for comparison. The data are from Wells (3.9 ~ 4.435 billion years range) [6], Sonett (3.6 billion years) [5] and current age (4.5 billion years). The calculation and data show strong agreement. The plot on the right is an expanded view of the left, focusing on the period from 3.5 to 4.6 billion years. At the beginning of the Earth-Moon system, there were approximately 1100 days per year. Looking ahead, this value is projected to be 323 days per year in another billion years.
Figure 2.
DOY evolution over 10 billion years. Observed data points (●) align well with Equation (6). At system inception, Earth had ~1,100 solar days/year. After 1 billion more years, this will drop to ~ 323 days/year.
Figure 2.
DOY evolution over 10 billion years. Observed data points (●) align well with Equation (6). At system inception, Earth had ~1,100 solar days/year. After 1 billion more years, this will drop to ~ 323 days/year.
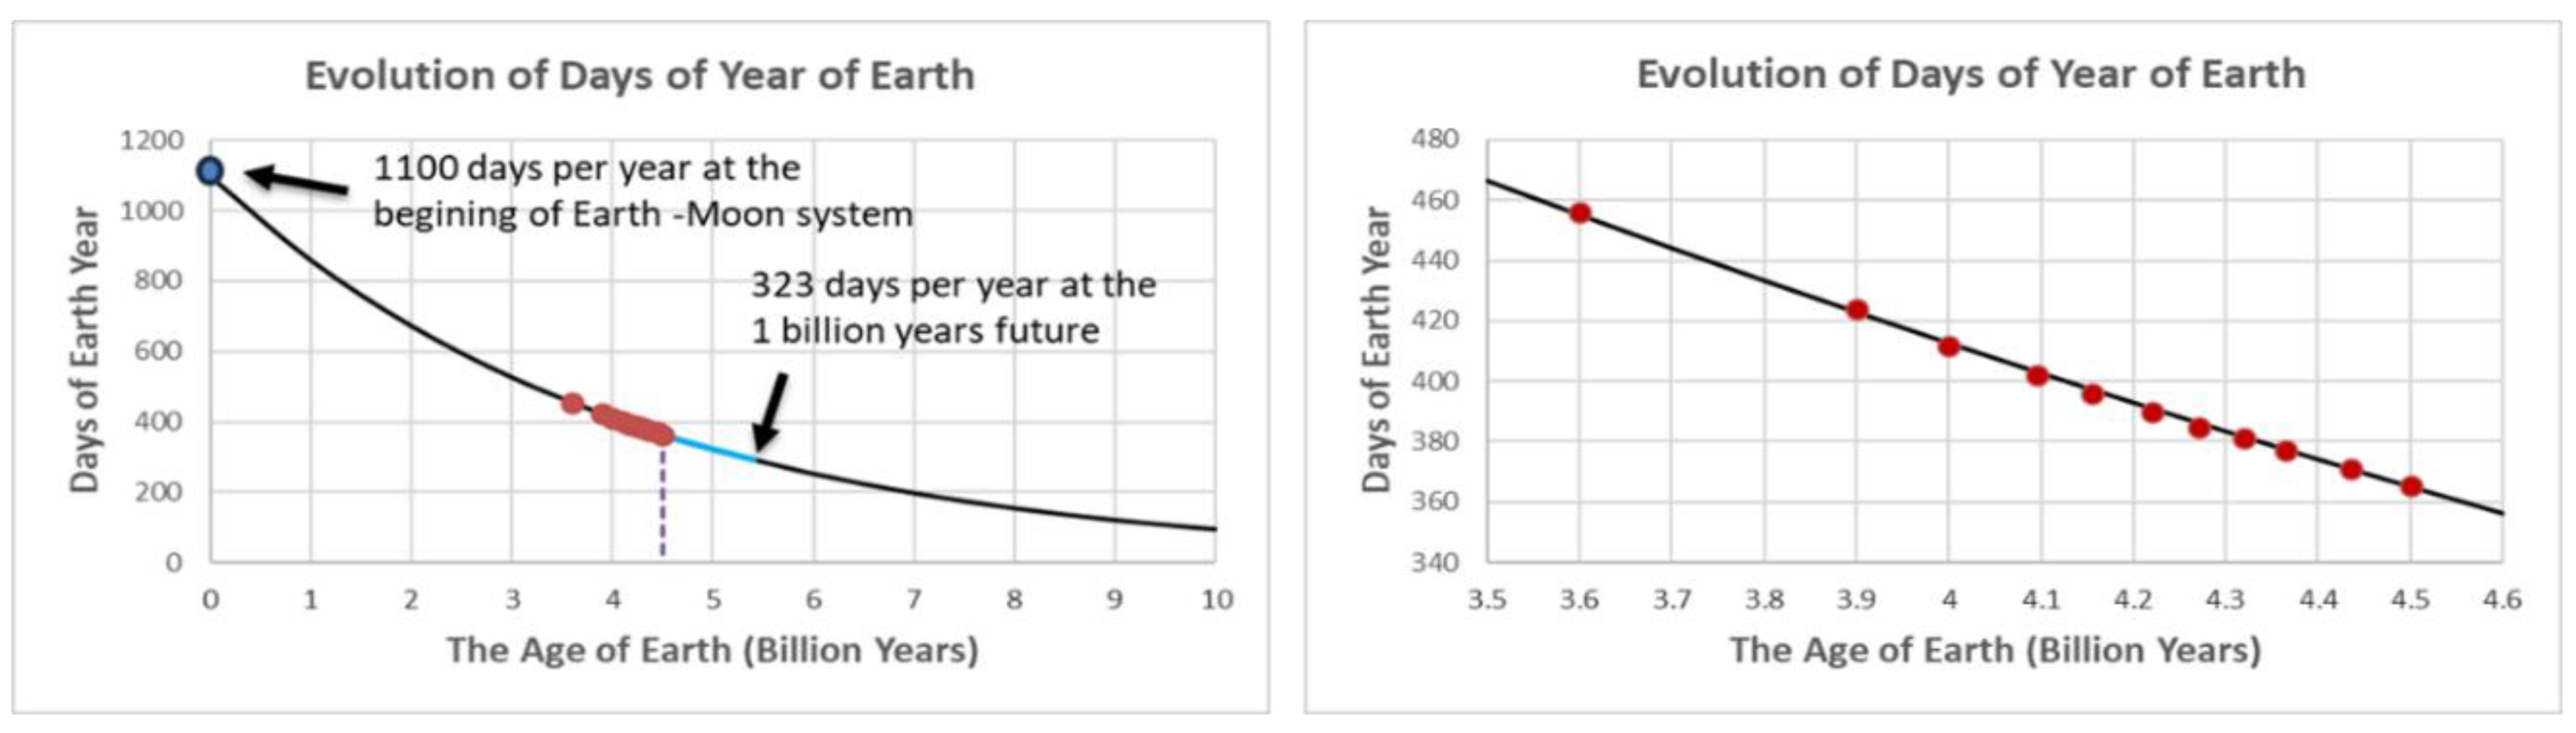
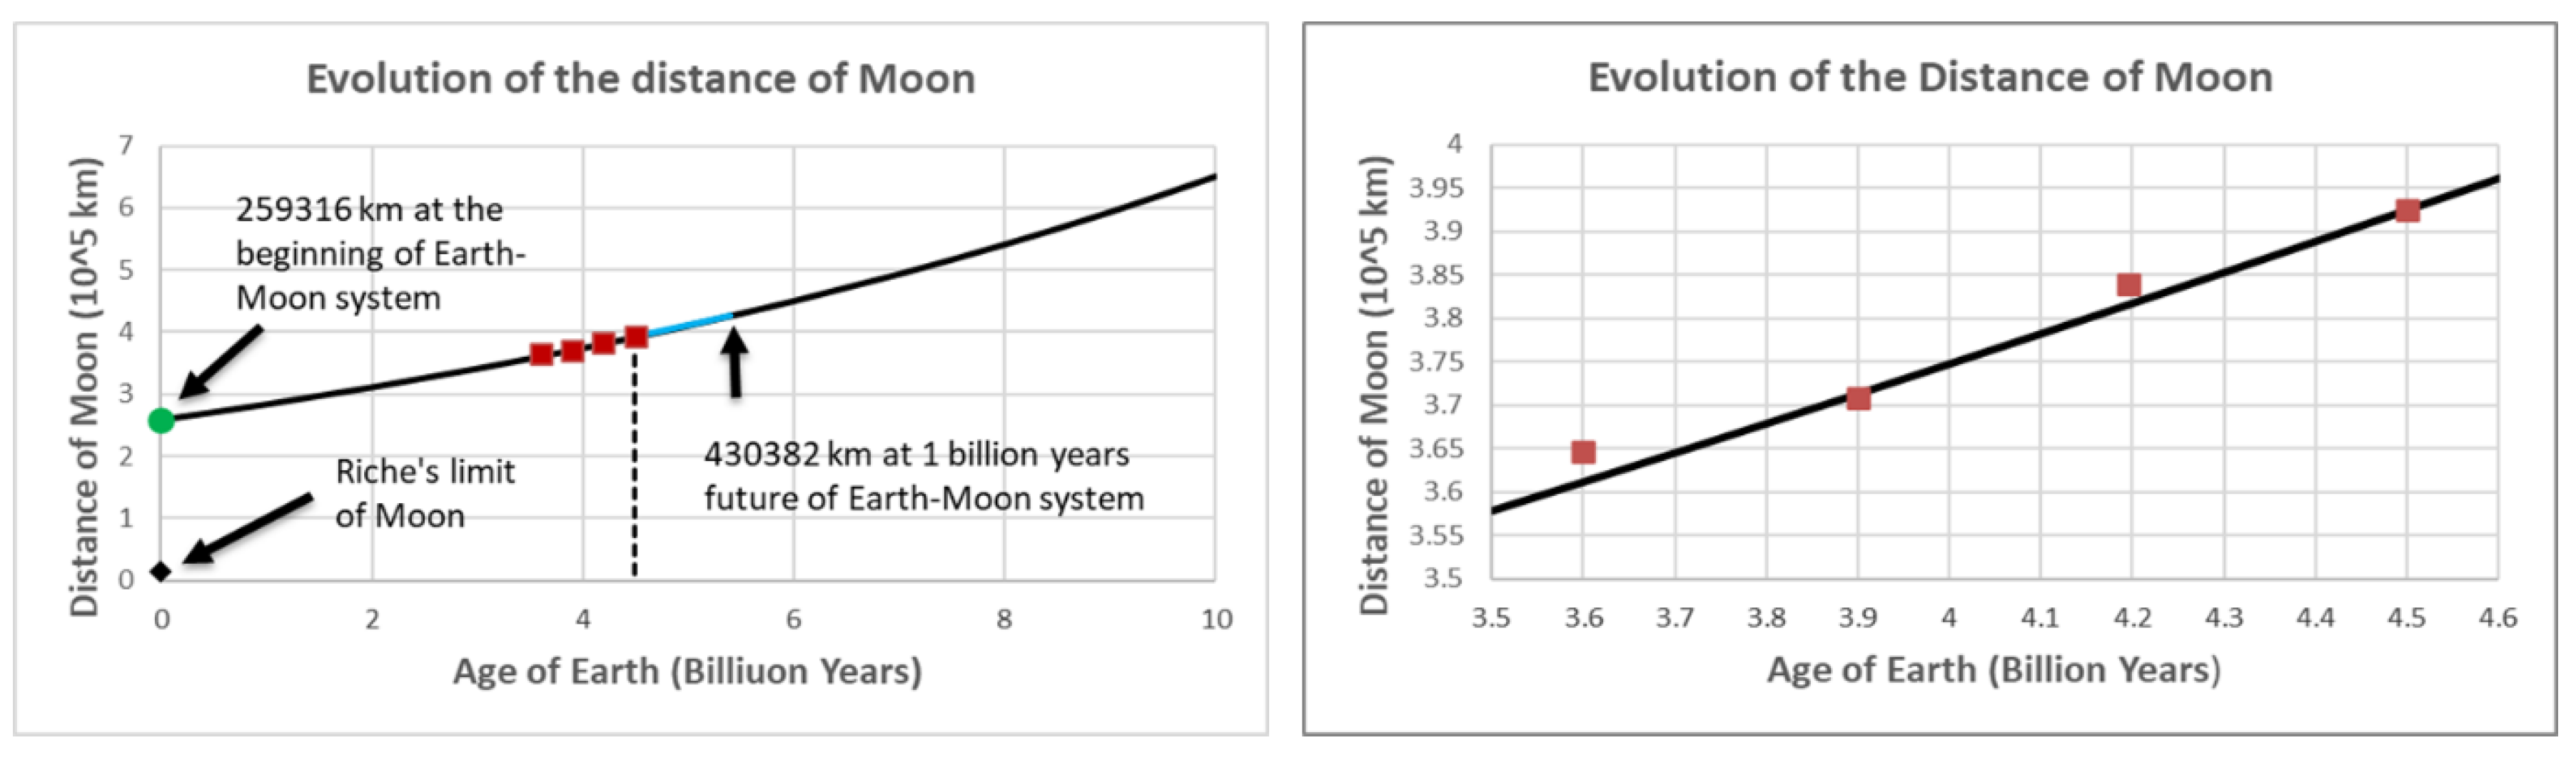
Figure 3 illustrates the evolution of the distance between the Earth and the Moon, from the formation of the Earth-Moon system to 10 billion years in the future. The solid line represents the calculated results from Equation (8), while the plotted points ‘■’ show observed data. Data are from Kvale [7].
Our model suggests that at the origin of the Earth-Moon system, approximately 4.5 billion years ago (Ga), the center-to-center distance was roughly 259,316 km. This translates to a surface-to-surface distance of 251,207 km, which is significantly greater than the Roche limit of 15,500 km. This projected initial distance of 25,1207 km aligns remarkably well with the estimate 250,000 km found in Chaisson & McMillan’s astronomy textbook [8], even though that value was likely a rounded assumption rather than a model-based calculation.
Figure 3.
Moon–Earth distance (center to center) evolution over 10 billion years. Observed data points (■) align well with Equation (8). The modeled values agree closely with observational estimates and provide a robust alternative to textbook assumptions.
Figure 3.
Moon–Earth distance (center to center) evolution over 10 billion years. Observed data points (■) align well with Equation (8). The modeled values agree closely with observational estimates and provide a robust alternative to textbook assumptions.
According to the Dark Matter Field Fluid model, the Moon’s recession is accelerating—a prediction that aligns with current observations. In contrast, the tidal friction theory attributes the Moon’s recession to the tidal force through the gravitational interactions between Earth and the Moon. The mathematic formula of the tidal force is:
Where:
- G is the gravitational constant.
- M is the mass of the Earth.
- m is the mass of the Moon.
- R is the distance of the Moon from the Earth.
- Δr is the distance between the near and far side oceanic angular momentum exchange.
For a tidal force-distance relationship of the inverse-cube relationship form Ftidal ~ 1/R3, the force increases rapidly as we trace time backward, with the Moon positioned much closer to Earth than it is today. Under such conditions, the Moon would have crossed inside Earth’s Roche limit and been torn apart by gravitational forces approximately 4.5 billion years ago. Yet, this catastrophic event never occurred. This discrepancy is known as the “geological time scale difficulty” or the “Lunar crisis.” To resolve it, numerous assumptions and parameters about early Earth-Moon conditions must be introduced; While these adjustments help reconcile the models with observations, some critics view the assumptions and parameters as somewhat contrived or ad hoc.
If Earth’s surface temperature in the distant past was sufficiently high to sustain a comparable amount of surface liquid water as today, then tidal friction would have been much greater than it is now under the inverse-cube relationship form Ftidal ~ 1/R3 with very basic sense of physics. This increased friction would have led to stronger tidal dissipation and a more rapid recession of the Moon in the distant past. Any attempt to reduce the tidal dissipation by introducing assumptions and parameters does not make any sense under the inverse-cube relationship form Ftidal ~ 1/R3. I think that the only plausible explanation for the reduced tidal dissipation in Earth’s past is a significantly smaller volume of surface liquid water. If that were the case, then the subsequent increase in surface water must have resulted from the capture of a sizable icy comet. Such an event is not unprecedented—consider the collision of Comet Shoemaker–Levy 9 with Jupiter in 1994, which illustrates the feasibility of large cometary impacts.
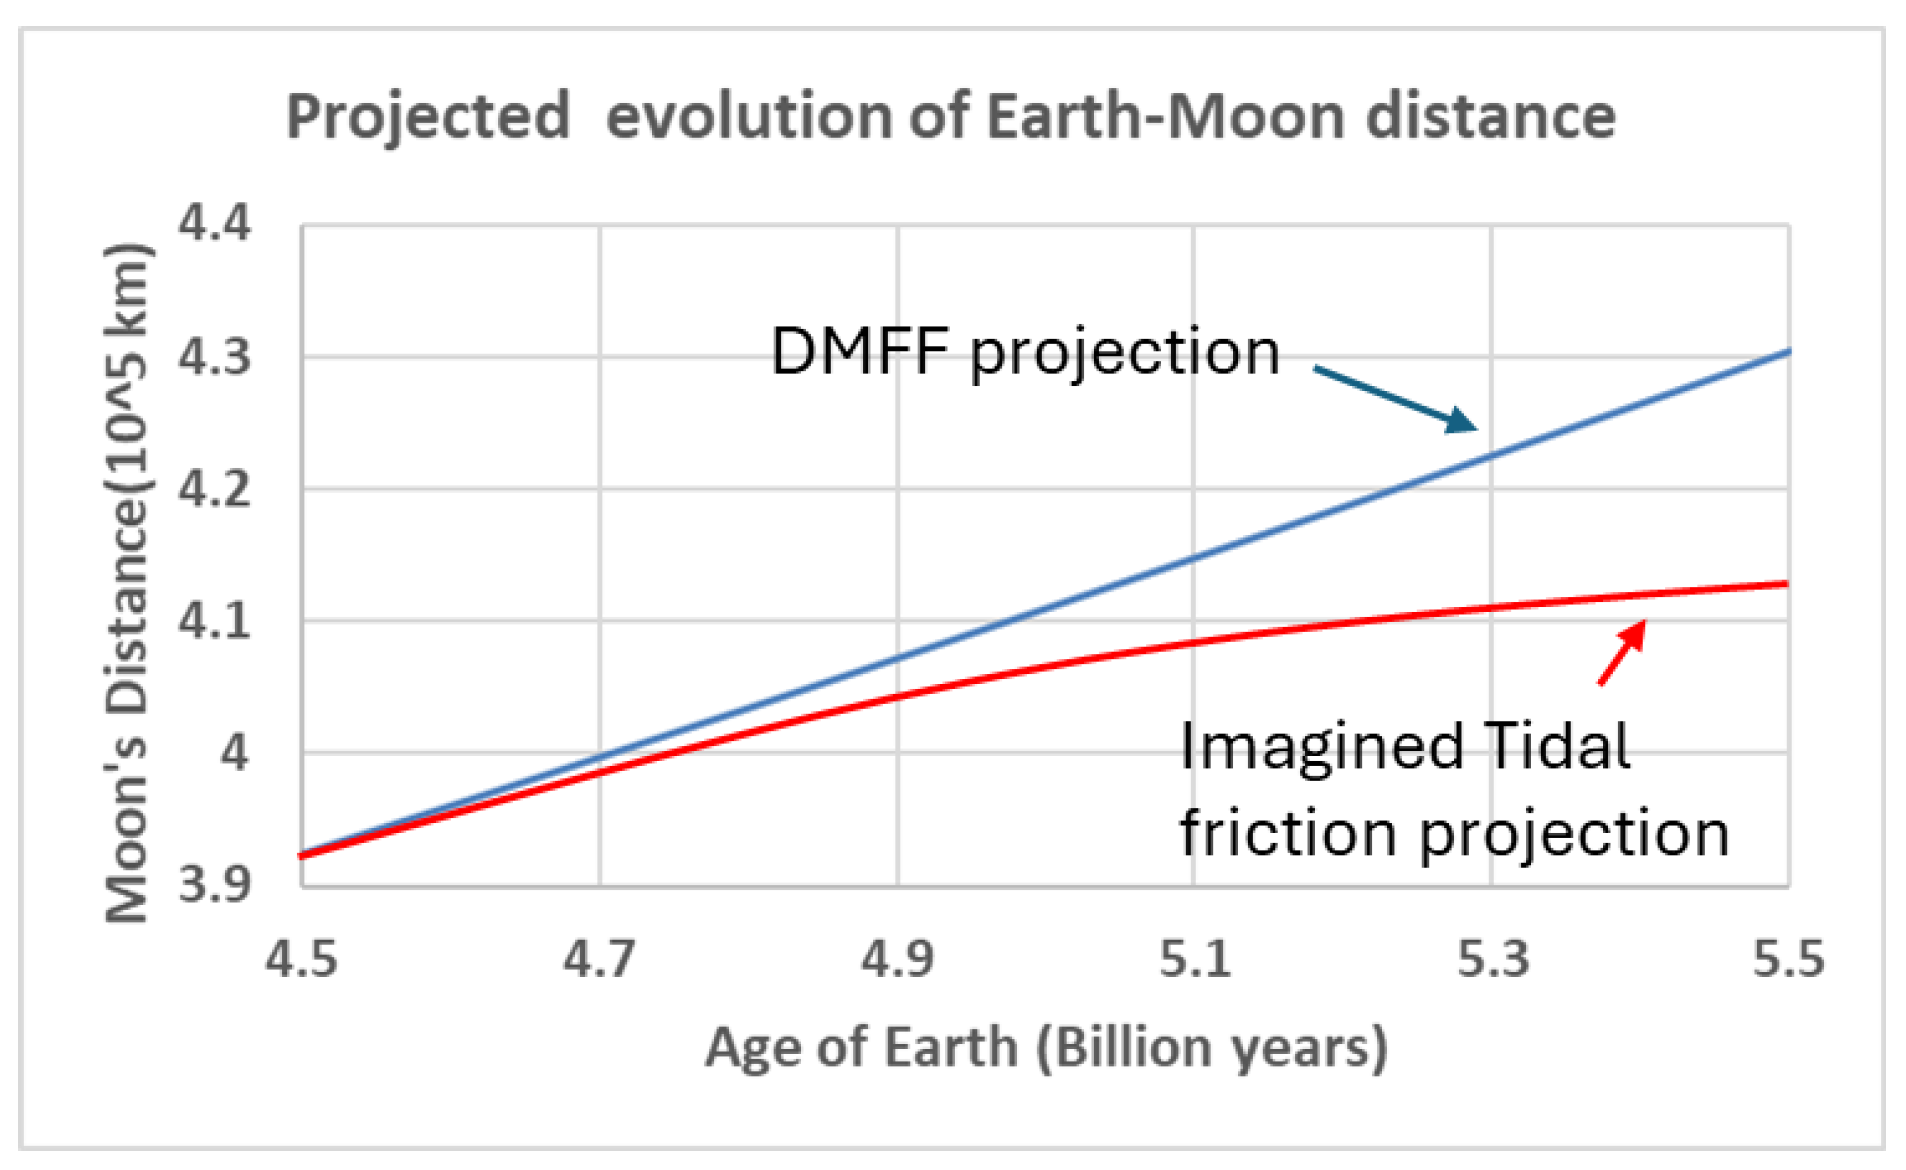
Figure 4 illustrates the projected evolution of the Earth–Moon distance over the next 1 billion years. The blue line represents calculations derived from Equation (8) of the Dark Matter Field Fluid model, showing an almost linear trend throughout the time span. In contrast, the red line depicts a conceptual projection based on the tidal friction model. Due to the absence of a precise mathematical formula for this model, the red curve serves only as a general illustration informed by the inverse-cube relationship Ftidal ~ 1/R3, not the actual numbers by the model. As the Moon recedes, the tidal force should diminish quickly, resulting in a gradual reduction in tidal friction. As a result, the curve is expected to flatten significantly over time—an outcome that contradicts the predictions of the Dark Matter Field Fluid model.
Figure 4.
Projected The Moon–Earth distance (center to center) evolution over 1 billion years by DMFF model (blue line) and the imagined tidal friction model (red line), respectively.
Figure 4.
Projected The Moon–Earth distance (center to center) evolution over 1 billion years by DMFF model (blue line) and the imagined tidal friction model (red line), respectively.
Future observations will help determine which model more accurately describes the dynamics of the Earth-Moon system. And if, millions of years from now, the data supports the DMFF model—future generations of humans, please give me a thumbs-up.
4. Confidence and Limitations
The agreement between observed data and theoretical curves supports strong confidence in the reliability of predictions for the next billion years, assuming no major disruptions (e.g., solar instability, internal planetary shifts, big meteorite collisions, etc.). Beyond that timeframe, caution is warranted due to accumulating uncertainties.
5. Discussion
The quantitative modeling presented here provides a predictive framework for understanding the long-term evolution of the Earth–Moon system, using the Dark Matter Field Fluid hypothesis as a foundation. The derived equations for the Length of Day (LOD), Days of Year (DOY), and Distance of the Moon (DOM) show strong agreement with empirical data from geological records, fossil indicators, and astronomical measurements. This reinforces the plausibility and robustness of the DMFF model as a tool for interpreting planetary rotational dynamics and orbital behavior.
The exponential forms of Equations (3) through (9) suggest a smoothly continuous evolution in Earth’s rotation and lunar recession. Notably, the calculated past values for the range of 3.5 to 4.5 Ga align well with sedimentary and coral growth data. Likewise, the modeled initial Moon–Earth distance (~250,000–260,000 km) not only agrees with common textbook estimates but provides a more physically grounded justification based on dynamic viscosity and saturation parameters within the DMFF framework.
5.1. Physical Interpretation and Cross-Validation
The alignment between modeled predictions and observed values across key variables—LOD, DOY, and DOM—reinforces the notion that these dynamics are not only interlinked and stable but may also be governed by deeper fluid-field principles. Particularly striking is the model’s capacity to forecast long-term planetary evolution: if current trends continue, we may see a 30-hour day, a reduction to approximately 323 days per year, and ongoing lunar recession leading to a distance of 43,0382 km. The Moon would appear smaller and dimmer in the sky—all within a billion-year timeframe.
5.2. Contemporary Anomalies and Limitations
However, recent observations of temporary increases in Earth’s rotation speed—resulting in days slightly shorter than 24 hours—introduce complexity. These fluctuations, though minor, highlight that Earth’s rotational evolution may not be purely monotonic. Instead, it can be influenced by factors such as:
- Redistribution of Earth’s mass via glacial melting or seismic activity
- Changes in mantle-core coupling
- Atmospheric and oceanic angular momentum exchange
Such short-term anomalies do not contradict the long-term deceleration trend but suggest that planetary rotation is sensitive to both internal and external perturbations. These factors underline the importance of treating the exponential model as a first-order approximation, ideal for geologic and cosmologic scales rather than daily fluctuations.
5.3. Implications and Philosophical Reflection
The Earth–Moon system is more than a mechanical configuration—it is a planetary partnership that has nurtured biological rhythms, regulated climate stability, and fostered human consciousness itself. Understanding its evolution is not only a technical endeavor but also a philosophical one: it invites contemplation on the fragility and adaptability of life within an ever-changing cosmic framework.
6. Conclusions
The Dark Matter Field Fluid model offers a compelling reinterpretation of planetary evolution, revealing how cosmic viscosity may govern the Earth–Moon system’s rotational and orbital dynamics. Through the development of mathematically consistent and observationally validated equations, we have traced the subtle, long-term transformation of Earth’s length of day, the number of days in a year, and the Moon’s recession over billions of years.
This framework not only matches paleontological and astronomical data with precision but also challenges conventional tidal friction paradigms by introducing a novel cosmic influence—dark matter as a saturated field medium. The exponential trends predicted by the model suggest a gradual, coherent evolution of the Earth–Moon system, inviting future researchers to investigate the broader implications for other planetary bodies and satellite systems.
Ultimately, this work underscores the value of interdisciplinary insight—bridging fluid dynamics, cosmology, and planetary science—to illuminate the hidden patterns that shape our celestial neighborhood. It affirms the principle that even the subtlest forces, when viewed through a new lens, can lead to profound revelations about the universe and our place within it.
In the tidal friction model accounting for low tidal dissipation at the remote past, the only plausible scenario is that Earth had a significantly smaller volume of surface liquid water in the distant past, and later acquired a substantial amount through the capture of a large icy comet.
References
- Pan, H. , “Application of fluid mechanics to dark matter”. Internat. J. Modern Phys. A 2005, 20, 3135. [Google Scholar] [CrossRef]
- Pan, H. , “The Evolution of the Earth-Moon System Based on the Dark Matter Field Fluid Model”. International Journal of Physics 2020, 8, 14–20. [Google Scholar] [CrossRef]
- Carter, J. , Earth will spin faster today to create 2nd-shortest day in history, 2025. https://www.space.com/astronomy/earth/earth-will-spin-faster-on-july-22-to-create-2nd-shortest-day-in-history.
- Scrutton, C. , Brosche, P., Sundermann, J., (Editors.), Tidal Friction and the Earth’s Rotation. Springer-Verlag, Berlin, pp. 154, 1978.
- Sonett, C. , Kvale, E. , Chan, M., and Demko, T., Late Proterozoic and Paleozoic Tides, Retreat of the Moon, and Rotation of the Earth. Science 1996, 273, 100. [Google Scholar] [CrossRef]
- Wells, J. , “Coral growth and geochronometry”. Nature 1963, 197, 948. [Google Scholar] [CrossRef]
- Kvale, E. , Johnson, H. , Sonett, C., Archer, A., and Zawistoski, A., “Calculating lunar retreat rates using tidal rhythmites”, J. Sediment. Res. 1999, 69, 1154–1999. [Google Scholar] [CrossRef]
- Chaisson, E. , and McMillan, S., “Astronomy Today”, 1993, Prentice Hall, Englewood Cliffs, NJ 07632.
Disclaimer/Publisher’s Note: The statements, opinions and data contained in all publications are solely those of the individual author(s) and contributor(s) and not of MDPI and/or the editor(s). MDPI and/or the editor(s) disclaim responsibility for any injury to people or property resulting from any ideas, methods, instructions or products referred to in the content. |
© 2025 by the author. Licensee MDPI, Basel, Switzerland. This article is an open access article distributed under the terms and conditions of the Creative Commons Attribution (CC BY) license (https://creativecommons.org/licenses/by/4.0/).
Copyright: This open access article is published under a Creative Commons CC BY 4.0 license, which permit the free download, distribution, and reuse, provided that the author and preprint are cited in any reuse.


