Submitted:
04 August 2025
Posted:
05 August 2025
You are already at the latest version
Abstract
Outdoor ice rinks have long been a staple for inexpensive exercise and entertainment in cold environments. However, the possible deterioration of or impact on outdoor ice rinks from a changing climate is poorly understood due to no or little monitoring data of such facilities. To investigate long-term changes in ice rinks over recent decades, an energy-balance-based ice rink model (with three versions considering precipitation and melt) was applied to a simulated ice rink for two representative area – Dorset of south-central Ontario and Experimental Lakes Area (ELA) of northwestern Ontario, Canada. The model was calibrated and tested using one year ice rink data (since limited data are available) and applied to a 40-year period starting in 1978 to reproduce the dates of rink-on and rink-off, rink duration in a season, and ice-water-equivalent under daily climate inputs, and to illustrate any changing trend in these variables, i.e., the ice rink responses to changed climate. Results showed no clear trend in any ice rink features over four decades, attributed to winter temperature that did not increase substantially (a weak driver), no change in rain-on-ice and snowfall-on-rink, and reduced wind speed (possibly slowing ice melting). This is the first trial of a physically-based rink model to evaluate outdoor ice rinks. More in-situ monitoring is necessary.
Keywords:
physically-based model
; trend analysis
; rain-on-ice
; snowfall-on-rink
; ice melt
1. Introduction
People’s love for outdoor skating runs widely and long time in Canada and many other regions, dating back hundreds of years [1; Hardy 1997, 2; Robidoux 2012, 3; Lorenz 2015, 4; Bennett 2018, 5; Hardy and Holman 2018, 6; Koller 2024]. Outdoor ice skating is a part of Canada’s culture and identity [2; Robidoux 2012, 3; Lorenz 2015, 4; Bennett 2018]. Notable hockey players like Gordie Howe [7; Clark 2018], Maurice Richard [8; Field 2014], Wayne Gretzky [9; Gretzky 2001, 10; Doeden 2007] and Sidney Crosby [11; Allain 2011] all sharpened their skating skills on frozen ponds and backyard rinks in Canada [12; Cantelon 2006, 13; Holman 2007]. Outdoor ice skating isn’t just a sport, it provides a sense of community. Skating often acts as a place for social gatherings and events [2; Robidoux 2012, 5; Hardy and Holman 2018].
For ice on natural lakes or rivers, there have been a few studies on their changes. For example, small lakes across southern Quebec, Ontario, Manitoba, and Saskatchewan are breaking up earlier and freezing up later [14; Brown and Duguay 2010]; river ice has been breaking up earlier across all of Canada from 1950-2016 [15; Chen and She 2020]; ice cover duration has decreased in most regions of the world [16; Sharma et al. 2021]. However, it is largely unknown how the ice condition (thickness or depth) and operation duration length of an outdoor ice rink have been affected by climate change, as there is no systematic or routine measurement or monitoring of the ice rinks to provide in-situ data. Further, there are few analyses or simulation studies that evaluate climate change’s impacts on ice rinks.
The few ice rink studies that assessed the impacts of climate change, used a temperature threshold to determine the beginning time of ice rink season (e.g., the mean temperature of consecutive 3 days being below -5°C), and suggested that ice rink condition or skating availability is affected by climate warming [17; Damyanov et al. 2012, 18; Dickau et al. 2020, 19; McLeman et al. 2023]. Although the ice rink season is controlled by air temperature to a certain extent, the rink thickness (growth and decay process) and operation duration are also influenced by other factors such as snowfall and rainfall during the winter season. The actual responses of an ice rink to climate change is likely more complicated, which requires more analysis and investigation.
Since there are limited observation data on operating outdoor ice rinks, such as their duration, to directly reveal the actual rink deviations due to climate change, a physically-based ice rink model was developed and then run to evaluate the responses. Even though an ice rink model may not be able to fully reproduce the real ice rink processes, it can assist in assessing the response or trend under climate change. To our best knowledge, this is the first such model developed. Thus, we conducted a physically-based simulation of ice rink process (from its beginning to termination) to understand the possible effects of climate change on ice rink operation, and to provide initial quantitative information and modelling tool for researchers and ice rink managers.
2. Study Area, Data, and Methods
A typical outdoor ice rink, targeted in this study, is one that is built and managed by a family, small residential community, or township, using simple and local resources (not necessarily by a professional engineer or big association; Figure 1). A basic approach of set-up and operation of an ice rink is to first find a relatively lower and flat area, maybe restrict the area by wood framing or earth containment, spray or pour water onto the area at the beginning of winter season when the air temperature is cold enough to formulate the first ice layer/rink, then start to use the ice layer as a rink, and maintain it through the winter. It is maintained by shoveling off fresh snow, adding water to relevel the surface and cover skate marks, and removing ice bumps, if needed.
Our modelling trial does not consider all the details of ice rink building and operation, as it is not possible to cover all the details in a model. We only focus on the major and common features of the ice rink process. We aim to build an initial ice rink model so that it can be used to assess the impacts of climate change, for a selected region.
2.1. Study Area
An ice rink is simulated for Dorset, Ontario, Canada, so that the 41-year period of meteorological data (1978-2018, observed at the DESC meteorological station, the red triangle in Figure 2a) was used to run the model. Daily IWE and ice depth of the rink are simulated for each winter season (November 1 to May 31). The rink operation duration of each year is obtained from the simulated IWE results, and any changing trend or pattern in the dates of rink-on, rink-off, and rink duration is found out by statistical analysis, for each model version. The Dorset site represents an area eastern of Lake Huron, with frequent snowfall events and substantial “rain-on-ice” events.
To have an increased representation of landscape or weather condition for the simulation work, a second site – the Experimental Lakes Area (ELA) in northwestern Ontario – was chosen to conduct a similar ice rink simulation, which represents a colder area with less rain-on-ice events (north of the Great Lakes; Figure 2a). The ice rink was simulated for 39 years (1978 -2016), using local climate data as inputs [23; International Institute for Sustainable Development]. The local meteorological station was located at ELA (red circle in Figure 2a).
2.2. Initial Testing of the Ice Rink Model
The commonly operated or used outdoor rinks in communities or personal properties are rarely monitored on a regular basis or documented for scientific research. There are very limited data of ice rink dates (start, end) and ice conditions (thickness, hardness, snow status) which could be used for model testing or calibration. The RinkWatch https://www.rinkwatch.org/ (last accessed 7 May 2025) [21; Wilfred Laurier University] is a citizen science-based initiative to provide rink information; this resource provided access to several years of ice rinks data in North America.
The Dorset area of Ontario, Canada (Figure 2a) was selected as an example site in this study since the necessary meteorology data were available as inputs for the model from the climate station operated by the Ontario Ministry of Environment, Conservation and Parks [22; King’s Printer for Ontario 2024]. More importantly, the area is cold enough in the winter to have ice outdoors (Figure 3). We found two nearby ice rinks with daily rink data, but only for the winter of 2012-2013: the Annie Williams Park rink is in Bracebridge Ontario and operated by the township, and Port Sydney Ontario rink (Huntsville Township) is operated by Stephenson Lions Club; and a third ice rink more away from Dorset (Parkview NIR, North York, Ontario) which has 4-year (2012-2016) of data. The first two rinks are about 30-40 km west of Dorset, and the third rink is about 200 km southwest of Dorset (Figure 2b). The simulated end date of the rink model is compared with the recorded end date at two rinks (5 March 2013 at Stephenson Lions Club rink and 13 March 2013 at Annie Williams Park; five dates of five winters at Parkview NIR) for a basic model testing.
2.3. Assumptions or Prior Settings for the Ice Rink and Its Modelling
The proposed model is applied to numerous years for two locations. For any given year or season, a criterion is used to set the beginning day of an ice rink. A similar definition as used by Damyanov et al. [17; 2012] is utilized to define the beginning of the outdoor ice rink: the last day of the first three consecutive winter days with a daily-mean air temperature below -5 0C, which is based on the requirement of several consecutive cold days to lay the initial ice foundation of a rink. That beginning day usually occurs in December in Ontario, Canada, where the model is applied. On that first day, enough volume of water is sprayed over the selected rink area using a water pipe, sprinkler, etc. For consistency in comparing model results, an initial layer thickness of 30 mm is assumed to appear (or formulize) on the area, which is the first ice depth of the artificially formulated ice rink. The situation of a natural pond or a bay of lake being frozen into ice rink is not considered in our modelling work.
2.4. Physically-Based Ice Rink Model
A daily time-step ice rink model was developed by slightly modifying the water-balance- and energy-balance-based process model utilized for a snowpack [20; Yao et al. 2018]. The main changes are the consideration albedo for the ice surface, ice sublimation, and ice melting (e.g., shifting from snowpack to ice rink body). Calculations of daily ice-water-equivalent (IWE) and ice depth are described below.
A daily IWE (ice water equivalent) balance equation is:
where IWEi+1 is the IWE value (mm) at the end of any calculation day i (for a year under calculation), IWEi is the value at the end of the previous day, Spray is the artificially sprayed water on the first day to formulize the rink foundation and so its value is 30 mm for the first calculation day but 0.0 for any other day in a rink season (thus a first ice of 30 mm IWE was formulized), Snow is the volume of snowfall (if any, in mm.d-1) in the day which is supposed to stay on the ice and transform into ice (depending on model version and the specific method to determine its value, see below 2.3), Rain is the rainfall (if any, in mm.d-1) within the present day and supposed to become part of the ice rink (depending on model version or treatment method), Subl is the ice loss (in mm.d-1) through ice sublimation (solid ice changes to vapour), and Melt is the ice loss (in mm.d-1) through ice melting into liquid water. The melting mainly happened on the surface or upper portion of ice rink, due to warmer temperature, radiation or rain-on-ice. The melted water is supposed to flow away from the ice rink in our model.
IWEi+1 = IWEi + Spray + Snow + Rain - Subl - Melt
The outflowing of water from melted ice may not be easy to estimate. Our first option to it is to suppose that the ice-melted water will flow out of the rink without staying. This may shorten the simulated ice rink duration, because the refreezing of melted water would again become ice and prolong the ice rink duration. However, a second option (not evaluated) of letting the melted water stay on ice will definitely extend the ice rink duration. Then, the only way for ice to decay in this situation is ice sublimation that is quite slow, while ice melting plus the melted water flowing away is much faster to decay the ice rink.
For each day, the ice depth is easily obtained by converting the IWE to depth by using the ice density (0.917 kg.m-3; for example, 30 mm of IWE has an ice depth of 32.7 mm).
The ice sublimation rate (mm.d-1) is calculated by an empirical formula [20; Yao et al. 2018]:
where W is wind speed (m/s), Vs is saturated vapour pressure (mb), and Va is the actual vapour pressure (mb) in present day. Va = Vs·RH, here RH is relative humidity. The coefficient constants 0.1 and 0.09 were selected for local purpose. Vs is estimated with the Buck equation [32; Buck, 1981]:
where the Ta is the mean daily air temperature (in oC).
Subl = 0.1 + 0.09·W (Vs - Va)
Vs = 6.1121·exp((18.678-Ta/234.5)(Ta/(257.14+Ta)))
Daily ice melt (mm.d-1) was determined by the total available energy of separate energy sources as follows:
where α is ice albedo of shortwave radiation and is taken as a fix value that is to be calibrated for this study, S is shortwave radiation (MJ.m-2.d-1), as measured on site at a climate station, Ln is net long-wave radiation, measured on site or estimated from temperature data [e.g., 29 Yao et al. 2014], Qc is convective energy (diffusion or convection of heat), calculated from air temperature and wind speed, Qa is advective energy (transport of heat by bulk motion of a fluid), calculated from temperature and wind, Qr is energy coming with rainfall, calculated from temperature and precipitation; and λ and ρw are the latent heat coefficient and water density, respectively. The total available energy in a day was converted to melted water thickness by using the λ and ρw.
Melt = [(1 - α) S + Ln + Qc + Qa + Qr]/(λ∙ρw)
The convective and advective melting energy are calculated as follows:
where Ta is air temperature, W is the wind speed, RM is a reduction factor, Tmin is the minimum temperature in a day (in oC), The coefficients c (0.12) and d (0.08) are considered constants. The value of RM is a function of atmospheric stability and is estimated from Richard’s Number RI:
where RI is a linearized estimate as follows:
Qc = c ∙ Ta ∙ W ∙ RM
Qa = d ∙ Tmin ∙ W ∙ RM
RM = 1.0 - 7.7 RI for (0 ≤ RM ≤ 1.6)
RI = 0.095 ∙ Ta / W2
The last component in Equation (4), the melting energy due to rainfall, is calculated as:
where Pr is the rainfall in a day, and e is a coefficient (a value 47.0 was given for local area [20; Yao et al. 2018]).
Qr = e ∙ Ta ∙ Pr
With daily input data of air temperature, precipitation, relative humidity, short-wave radiation, long-wave radiation, and wind speed, the ice rink process is calculated by running equations (1) to (9), for each day of the ice rink season (from the beginning day until the last day when the ice depth reduces to zero).
2.5. Model Versions with Varying Scenarios
Although actual ice rinks have had different management/maintenance practices, a few simplified treatments or management measures have to be presumed for the purpose of modelling. In terms of the snow and rain components in equation 1, three different versions of the model are created and evaluated. The assumptions for each version are stated below.
2.5.1. Version I: Adding Rain as Ice and Ignoring Snow
After the starting of an ice rink, any rain falling on the ice will become ice and therefore join to the ice rink body, without flowing out of the rink. The volume of Rain in equation 1 is converted to ice or IWE. Any fresh snow fall will be completely blown away by wind or swiped out by operators, not staying on the rink surface. As a result, the snow melting of the fresh snow and its contribution to the ice body are ignored in the process modelling (Snow in Equation 1 is zero). The interruption of snow layer with the energy balance calculation of the ice rink is thus ignored too. For convenience and simplicity of phase converting, the density of water, ice and new snow were fixed at 1000.0, 917.0, and 100.0 kg/m3.
2.5.2. Version II: No Rain Addition and Adding Some Snow as Ice
Any rain-on-rink will not stay on ice and flows away from the rink, so the Rain in Equation 1 is zero for any day during ice rink operation. Fresh snowfall would not fully stay on ice rink (at least some of it will be blown out by wind or swiped away by operator). It is difficult to know or determine how much fresh snow stays and becomes ice (due to temporary snowmelt and then freezing in a same day). For simplicity, if the snowfall is less than 2.0 mm (water equivalent) (snow depth of 2 cm around), the snow will stick to ice and become into ice, and the Snow in Equation 1 is given the value of snowfall; if the snowfall is larger than 2.0 mm, 2.0 mm of snow will stay on the ice (Snow = 2.0 mm) and all remaining snow will be blown out.
2.5.3. Version III: Neither Rain Nor Snow Addition
Neither snow nor rain in a day will stay, and both will not become ice (i.e., Rain = 0, Snow = 0). This scenario would probably not occur in reality. It is considering here as an “extreme” scenario to compare with other two model versions and help evaluate or explain the rink responses to climate change.
2.6. Trend Analysis
Trends in the modelled ice rink data were assessed using the Theil-Sen’s Slope [24; Theil 1950, 25; Sen 1968] to compute the rate of change, and the Mann-Kendall Test [26; Mann 1945, 27; Kendall and Gibbons 1990] to determine the significance level. A significant trend was considered when p < 0.05. A moderately significant trend was considered when p < 0.1. Hydrometeorological input data was also evaluated for trends. These data (Figure 3) included annual mean winter temperatures (December through March) at Dorset and ELA (Figure 3a), mean wind speed at Dorset (Figure 3b), annual lake-ice duration at Dorset (Figure 3c), snowpack duration at Muskoka airport (Figure 3c) and mean winter snow depth at Muskoka airport (Figure 3b) (see Figure 2b for the airport location). Muskoka snow data were obtained from Environment Canada and Climate Change [28; 2024]. These long-term changes in meteorology and lake ice could be potentially drivers to the ice rink trends.
3. Results
3.1. Model Testing
Only one parameter was adjusted slightly: the ice albedo of solar radiation being set at 0.48 for the model. For the winter 2012-2013 and by using model version I, simulated IWE at Dorset area, indicated a rink-starting date of 24 December 2012, and an ending date of 8 March 2013 (Figure 4, Table 1). The modelled end date was very similar to the recorded end dates of 5 March 2013 at Stephenson Lions Club rink, 13 March at Annie Williams Park rink, and 8 March at Parkview NIR. For the four years 2012-2016 at Parkview, model version I gave small errors from the observation (< 5 days, except for 2016). Although there was limited data for comparison, the first model is initiatively or tentatively acceptable for ice rink process simulation considering unknown factors such as actual operation style/action, site difference among rinks, and model assumptions.
The model version II gave a rink ending date of 9 March 2013, just one day difference from the version I (Figure 4, Table 1), performing well for year 2013. It had greater errors of ending date for other three years (5-18 days). The IWE with version II had greater abrupt changes in the season than version I. The model version III gave a much earlier ending date of 22 February 2013, with 19 days difference from the observed date March 13. Its ending dates in all years at three rinks had much greater mistakes (-32 to +14 days, except for Parkview 2016). The varying treatment approaches of snowfall and rain-on-ice in three versions produced quite varying ice rink thickness or rink dates. Although it is not proper or confident to conclude on the accuracy and applicability of the model versions only based limited few years’ data, probably the versions I and II would provide better performance than version III. More model tests are desired if monitoring data are available.
3.2. Comparing Three Versions by Simulations of Six Winters (2011 to 2016)
Large differences are seen among the versions of the model (Figure 4 and Figure 5). The first two versions have quite similar in ice duration (Figure 5b), with Version II having the longest duration. However, the mean IWE over each season is quite different between two versions (e.g., thinner vs. thicker in 2012-13, while thicker vs. thinner in 2015-16) (Figure 5c). Version III differed substantially from the other two versions, giving much shorter ice duration and thinner ice thickness (Figure 5). Similarly, as mentioned in section 3.1, the results of version III for the six years seemed less reliable since IWE was too small and its rink duration was too short. On average of the six years, compared to Version I, the percent difference of Version II was 6.9% in rink duration and -18.4% in IWE; the difference of Version III was -9.3% in rink duration and -50% in IWE (Figure 5).
The large discrepancies between Versions 1 and 2, particularly for the 2013-14 and 2015-16 winters, reflected the different treatments of rain-on-ice and snow-on-ice in the model versions and their effects. The small amount of rains in 2013-14 winter (56.5 mm) versus the large amount of rains in 2015-16 winter (215.9 mm) caused a relatively thinner ice rink in 2013-14 vs. a thicker rink in 2015-16 under Version I, as this version took rain to become ice. Similarly for Version II which took partial snow to become ice, the large snowfall in 2013-14 (223.0 mm) caused a thicker ice rink, while the small snowfall in 2015-16 (117.5 mm) caused a thinner rink. As a result, the different treatments of rain or snow determined different sensitivity or response to rain or snow contribution in the modelling, and thus produced the discrepancy in IWE within a winter season.
3.3. Long-Term Simulation at Dorset and ELA
The simulated rink-on date for Dorset over the 42-year period of record (1978-2018) and for ELA over the 39-year period of record (1978-2016) showed substantial inter-annual variability (Figure 6a). There was rink-on variability at Dorset was about one-third more than modelled for ELA. The variability increased by 52% and 41% over the last two decades compared to the first two decades at Dorset and ELA, respectively (Table A1).
The model versions produced varying rink-off results for Dorset (Figure 6b and Table A1) compared to ELA (Figure 6c and Table A1). At Dorset, versions I and II were on average the same date (with variance from 2.5 weeks earlier in 2015 to 5 weeks later in 1980). Version III rink-off results were on average 3 weeks earlier than versions I and II (Figure 6b), with a maximum difference of three months in 2007. For ELA, model versions I and III were on average almost the same (1 day different) with a maximum difference of 10 days (earlier for Version III in 1984) (Figure 6c). Version II was on average 2 weeks later than Versions I and III (almost 6 weeks later in 2001).
Deviation in rink duration reflects rink-off variation: shorter for Version III at Dorset and longer for Version II at ELA. For the modelled applied to Dorset, typically the mean modelled season IWE is most for Version II, the average for Version I and almost always the least for Version III (Table A1). For ELA, Version II produced almost twice the mean IWE compared to Versions I and III, that yielded quite similar mean IWE (Table A1).
3.4. Trend Analysis
There are varying changes in the ice rink characteristics over the period of record (Figures 7a and 7b). The rink-on date is later at both locations, which corresponds to a warming (Figure 7d); the trends for rink-on and winter temperature at ELA were moderately significant. The modelled rink-off dates were also later, except for Version II at Dorset. The modelled duration is generally getting shorter for the three model versions at the two locations, with Version III at Dorset getting shorter (moderate significant; Figure 7b). The rain-over amount is increasing at Dorset (moderately significantly for model Version II; Figure 7c), and the snow-over amount is increasing at ELA (Figure 7d). The snow-over amount is decreasing at Dorset for Version II. The snow cover duration was increasing at Muskoka (Figure 7c) and the wind speed at Dorset was significantly decreasing (Figures 7c and 7d). The lake-ice duration over the same 41-year period monitored at Dorset [29; Yao et. 2014] was decreasing (Figure 7c), but not significantly.
4. Discussion and Conclusions
Three versions of the outdoor ice rink model, as applied to two sites in Ontario of Canada, illustrated a same result on ice rink changes (although some minor differences). There are limited changes for the trends in the rink-on, rink-off dates, rink operation duration or rink-water-equivalent, over about 40 years since 1978 (Figure 6 and Figure 7; Table A1). These results do not support an unproven image in public opinion – deteriorated ice rink condition due to warming climate [30; Roos 2017], while this opinion is not ubiquitous [31; Anisimov and Orttung 2019]. Although the proposed model is in an initial stage, this study is one of few trials related to outdoor ice rink changes.
The no-trend phenomenon of ice rink duration over 43 years was supported by the no-trend in either the total sublimation in a winter season or the total ice melting, two key deterministic factors for ice rink duration (Figure 8). As the ice loss drivers, the seasonal sublimation was basically flat over time without any clear trend; and the seasonal ice melting fluctuated over time, having no trend (except an occasional increase in 2015-16).
A partial reason leading to the simulation result of limited changes is that while winter temperatures are warming over four decades (Figure 7c) with more rain-over at Dorset (Figure 7c), wind speed did decrease significantly at Dorset (Figure 7c) leading to less convective and advective melting energy (equation 5 and 6). More data are necessary to evaluate trends and provide ground-truth in situ observation of long-term operation of outdoor ice rinks. These currently have limited (hard to find) data; RinkWatch is a resource [22] and additional data would be useful. Further model evaluation with such data would be useful [29; Yao et al 2018].
Although the simulation results may be opposite to general public thought, it is argued that prediction of ice rink change only based on air temperature [17,18,19] would not be practical. Rather, the effects of other climatic drivers, such as, rain or snow fall over ice rink and wind condition should be considered at the same time. Before further testing and new data become available, the simulation trials in this study still indicated a possible situation – the outdoor ice rink might have not really deteriorated in past decades under changed climate, for some regions such as Ontario of Canada.
A drawback or limitation for this current study is the lack of sound model calibration and evaluation, as there is limited real ice rink data being monitored for ice condition or operation duration. Such a monitored rink may exist, but such data are not currently available. Even if such an ice rink is available, its operation procedure could be different from the assumptions set herein; these data need to be monitored and archived.
The assumptions used in this modelling have not been tested, and they may be questionable. Assuming the flow-away of ice-melted water may not accurately apply to real ice rink situation, as some melted water stays on the ice and returns to ice body via refreezing. The assumptions with various model versions: rainfall becoming ice immediately might be improper. If a kind of storm rain happens in the winter, it is hard for all of the rain-water remains on ice without partly flowing out. Although there are a few assumptions and simplifications, the simulations for long term period to detect trend and impact could still make sense provided that these treatments keep consistent in the simulations for all years. More data and modeling are necessary, but the model and versions presented herein ae a start to assess how ice rinks may change due to a changing climate. These ice rinks (Figure 1) are part of the culture in cold climates [1; Hardy 1997, 2; Robidoux 2012, 3; Lorenz 2015, 4; Bennett 2018, 5; Hardy and Holman 2018, 6; Koller 2024]. This research is relevant for those who enjoy and thrive in such environments.
Future work could include (i) improvement of ice rink model by testing assumptions, adding more details in energy budget, and expanding calibration/validation; (ii) finding or establishing ice rink monitoring program which can provide ice depth recording and really support a comprehensive model testing; and (iii) investigating more sites and areas in different climate regions.
Author Contributions
Conceptualization, H.Y. and S.R.F.; methodology, H.Y. and S.R.F.; software, H.Y.; validation, H.Y.; formal analysis, H.Y. and S.R.F.; investigation, H.Y. and S.R.F.; writing—original draft preparation, H.Y. and S.R.F.; writing—review and editing, H.Y. and S.R.F.; visualization, S.R.F. and H.Y. All authors have read and agreed to the published version of the manuscript.
Funding
This research was partially inspired by an initially related project funded by the U.S. Geological Survey National Institutes for Water Resources (U.S. Department of the Interior), grant number 2020CO153B “Evaluating the Future of Colorado’s Outdoor Ice Rinks in A Changing Climate,” through the Colorado Water Center. The views and conclusions contained in this document are those of the authors and should not be interpreted as necessarily representing the official policies, either expressed or implied, of the U.S. Government.
Data Availability Statement
The Rink Watch Data are available from Wilfred Laurier University [21] at https://www.rinkwatch.org/ (last accessed 9 May 2025). The Dorset meteorological data are available from King’s Printer for Ontario [22; 2024] Data Catalogue: Ontario Ministry of Environment, Conservation and Parks: Inland Lakes and Streams – Physical Conditions at https://data.ontario.ca/dataset/inland-lakes-and-streams-physical-conditions (last accessed 23 December 2024). The Experimental Lakes Area climate data were provided by Scott Higgins at International Institute for Sustainable Development. The Muskoka airport data were obtained from Environment Canada and Climate Change https://climate.weather.gc.ca/ (last accessed 23 December 2024).
Acknowledgments
Some related investigations were undertaken by Yuri Wang and Megan Sears, both at Colorado State University. We thank Gordon Murray of the Ottawa, Ontario area for the outdoor ice rink photograph. Thanks are due to Scott Higgins for providing the ELA data.
Conflicts of Interest
The authors declare no conflicts of interest.
Abbreviations
The following abbreviation is used in this manuscript:
| IWE | Ice Water Equivalent |
Appendix A: Model Results Summary
The statistics for the three different model versions for the two study sites are presented for the various metrics in Table A1. While it is difficult to assess which one is more accurate or reliable due to data limitation and that this is the first use of the model, the current results of the model version I are encouraging (Table A1). Compared to Version I considering the average of 40-years if climate data , Version II models a delayed ice rink termination and a thicker rink, while Version III models much earlier rink ending date and much thinner rink (Table A1).

Table A1.
Model summary statistics for the entire time series (mean, standard deviation) and the first two and last two decades (standard deviation) for Dorset and ELA.
Table A1.
Model summary statistics for the entire time series (mean, standard deviation) and the first two and last two decades (standard deviation) for Dorset and ELA.
| Statistic | Rink-on | Rink-off | Duration | Mean IWE | Total Rain-on | Total Snow-on |
|---|---|---|---|---|---|---|
| Dorset | ||||||
| Version I mean | 6 Dec | 2 Mar | 106 | 40.4 | 75.7 | N/A |
| Std. Dev. | 12.8 | 12.0 | 18.6 | 15.7 | 48.3 | N/A |
| SD 1st 20 yrs | 9.7 | 14.1 | 18.6 | 12.7 | 43.5 | N/A |
| SD 2nd 20 yrs | 14.8 | 9.6 | 19.3 | 18.2 | 54.3 | N/A |
| Version II mean | 6 Dec | 21 Mar | 105.5 | 47.4 | 70.2 | 187 |
| Std. Dev. | 12.8 | 10.0 | 19.8 | 13.6 | 37.1 | 56.2 |
| SD 1st 20 yrs | 9.7 | 11.1 | 17.3 | 12.7 | 32.7 | 61.2 |
| D 2nd 20 yrs | 14.8 | 9.3 | 22.0 | 15.0 | 42.0 | 46.8 |
| Version III mean | 6 Dec | 28 Feb | 84.5 | 19.8 | 48.8 | N/A |
| Std. Dev. | 12.8 | 18.8 | 22.4 | 3.9 | 32.4 | N/A |
| SD 1st 20 yrs | 9.7 | 11.9 | 18.1 | 4.0 | 35.4 | N/A |
| SD 2nd 20 yrs | 14.8 | 22.8 | 23.8 | 3.8 | 30.8 | N/A |
| ELA | ||||||
| Version I mean | 17 Nov | 06 Mar | 108.7 | 20.9 | 3.0 | 97.7 |
| Std. Dev. | 9.5 | 13.1 | 14.3 | 4.0 | 5.8 | 33.3 |
| SD 1st 20 yrs | 7.3 | 15.0 | 13.8 | 3.5 | 2.8 | 33.0 |
| SD 2nd 20 yrs | 10.1 | 11.6 | 14.5 | 3.7 | 7.3 | 35.3 |
| Version II mean | 17 Nov | 21 Mar | 02 May | 45.7 | 5.0 | 111 |
| Std. Dev. | 9.5 | 13.3 | 16.2 | 9.1 | 6.8 | 35.2 |
| SD 1st 20 yrs | 7.3 | 13.7 | 13.3 | 8.4 | 6.0 | 32.1 |
| SD 2nd 20 yrs | 10.1 | 13.9 | 18.2 | 9.7 | 7.5 | 38.8 |
| Version III mean | 17 Nov | 05 Mar | 107.7 | 19.7 | 2.5 | 97.4 |
| Std. Dev. | 9.5 | 13.4 | 14.7 | 3.6 | 4.1 | 33.3 |
| SD 1st 20 yrs | 7.3 | 15.1 | 14.1 | 4.0 | 2.8 | 33.0 |
| SD 2nd 20 yrs | 10.1 | 12.0 | 15.0 | 2.5 | 4.8 | 35.5 |
Appendix B: Example of Daily Energy Budgets
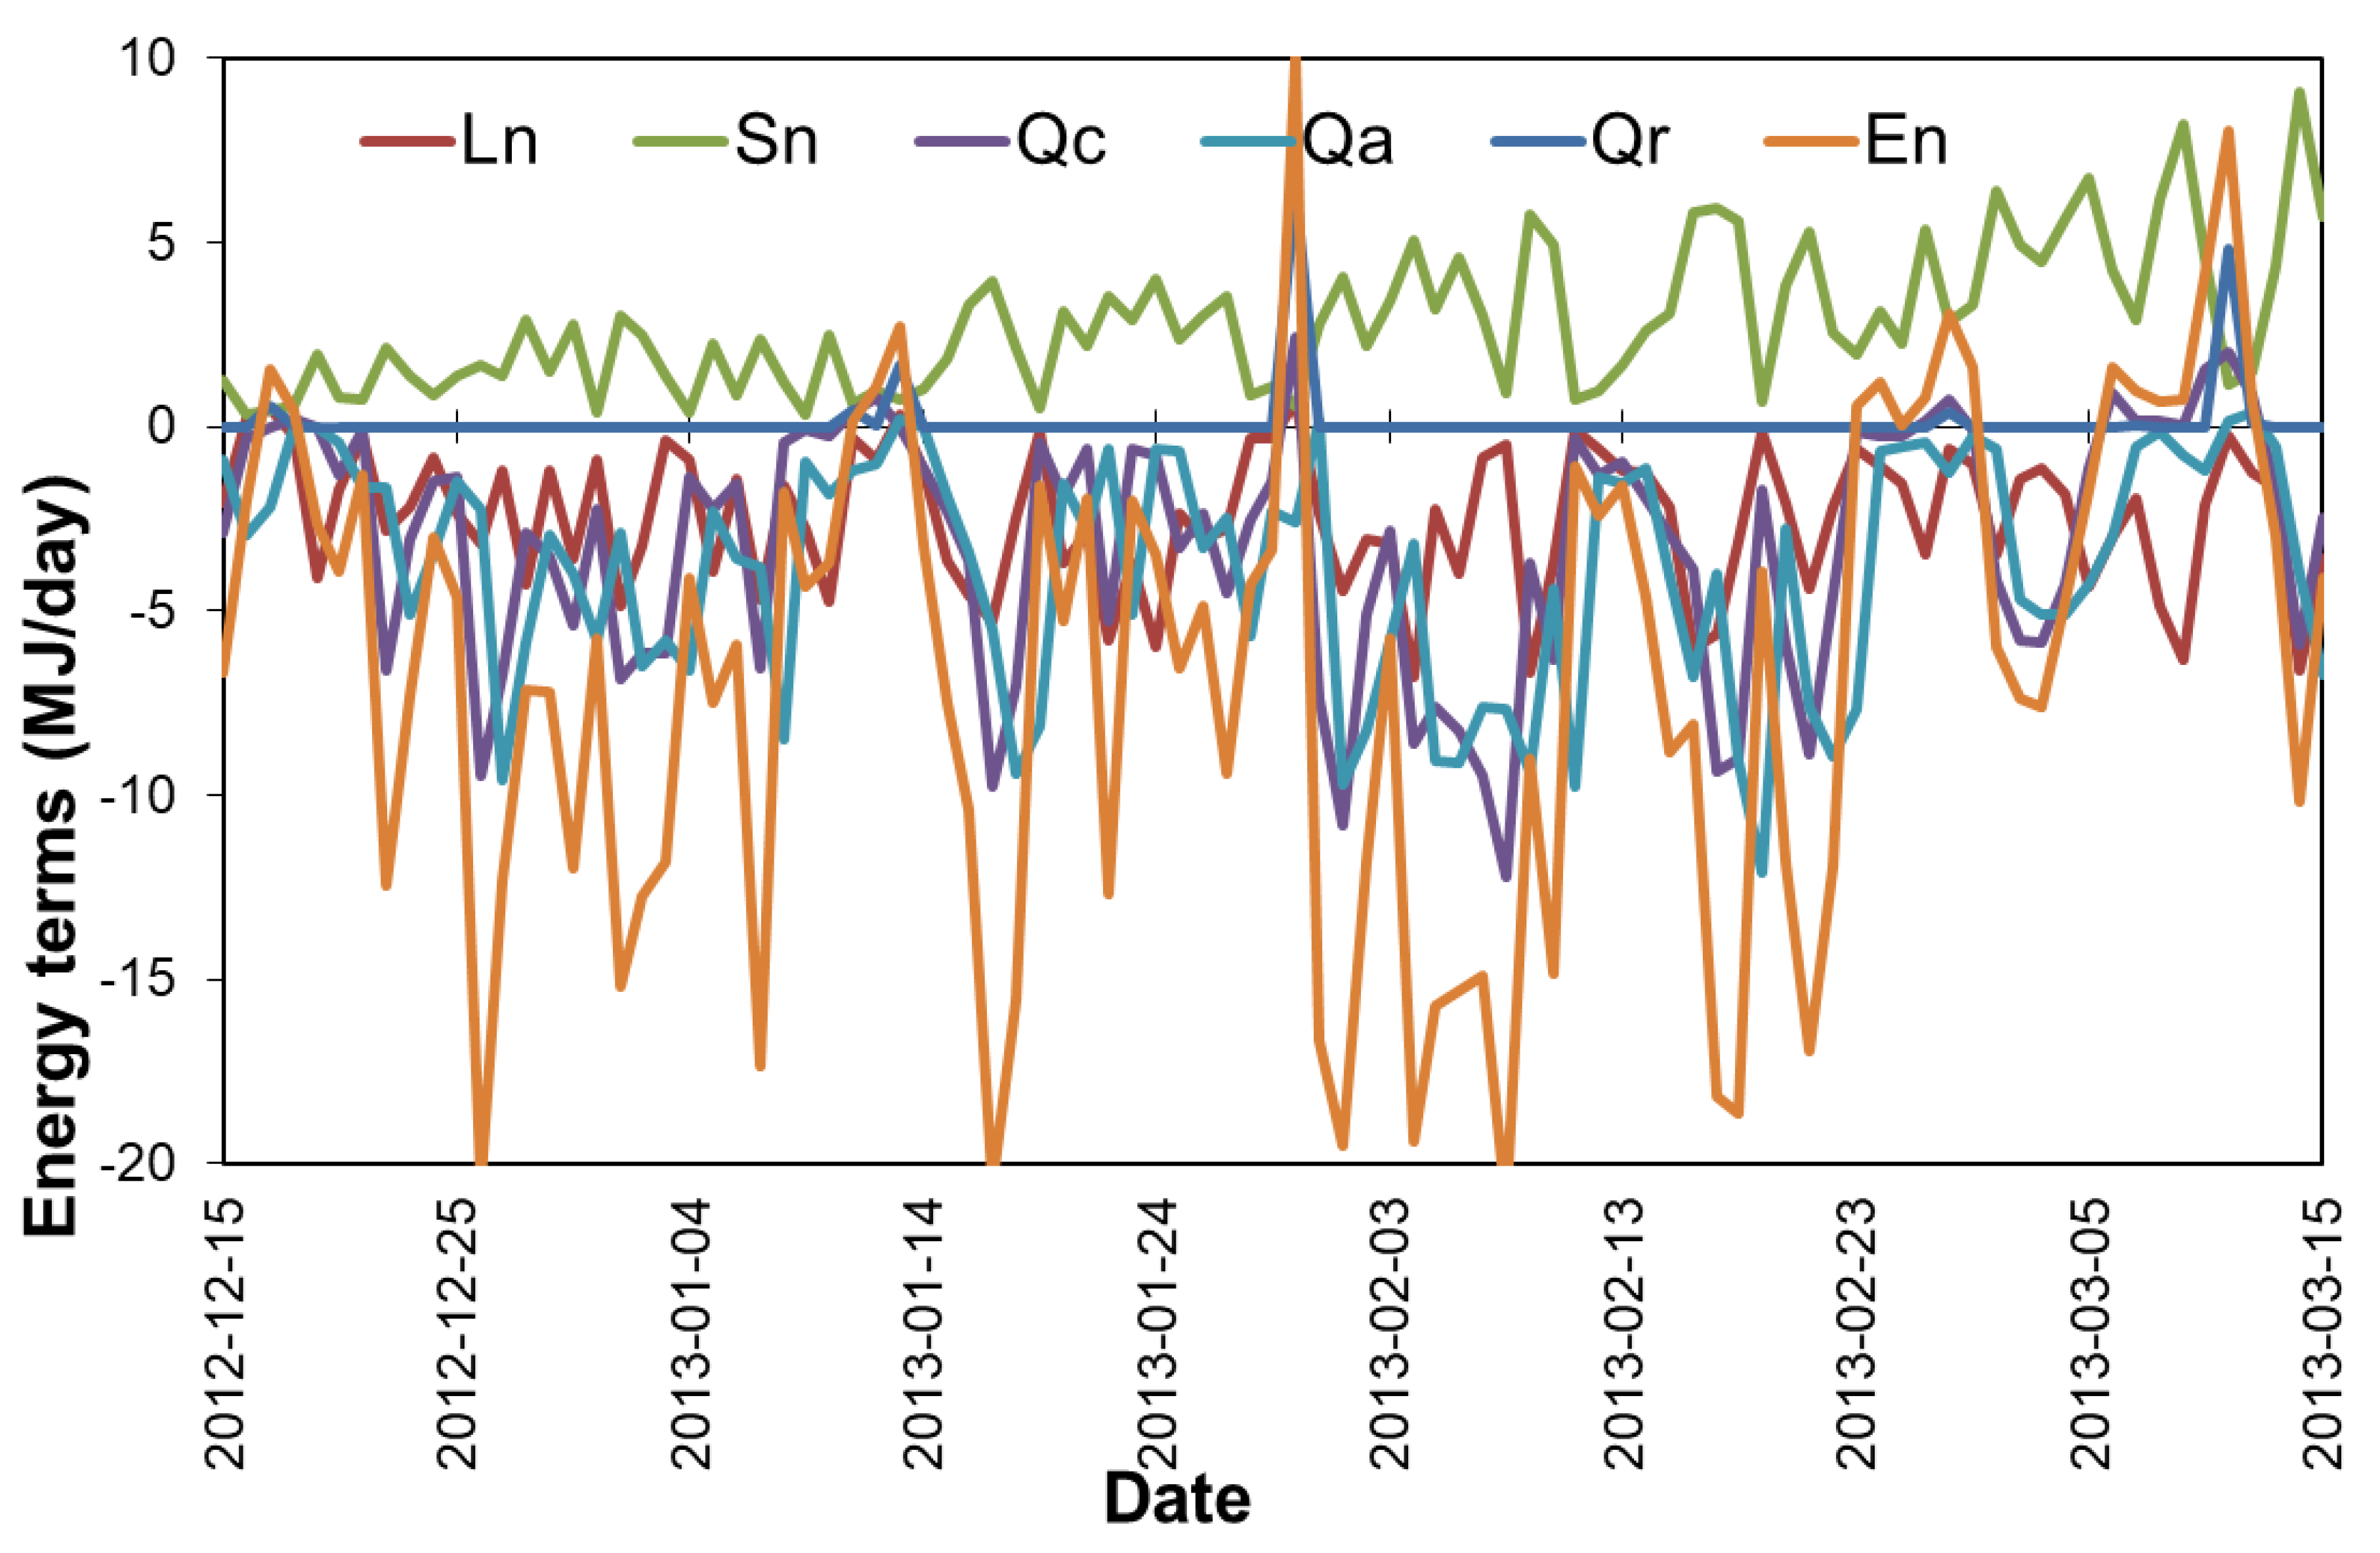
To illustrate the calculated energy budget process in a season, daily energy values (MJ/day) of five budget terms (net long-wave radiation Ln , net solar radiation Sn, convective energy Qc, advective energy Qa and rain energy Qr, and their total net energy En) are plotted in Figure A1, for a selected winter season 2012-13. Daily Sn is positive and increasing over the season, Qr is positive when there is rain but zero for most days, other three terms are negative for most days. When the En is positive (during rainy days or in the last stage under warmer temperature), ice rink melting happens.
Figure A1.
Daily energy budget terms for the winter season 2012-13 (Dec 15 to Mar 15): Sn – net solar radiation, Ln – net long-wave radiation, Qc – connective energy, Qa – advective energy, Qr – rain energy, and En – total net energy.
Figure A1.
Daily energy budget terms for the winter season 2012-13 (Dec 15 to Mar 15): Sn – net solar radiation, Ln – net long-wave radiation, Qc – connective energy, Qa – advective energy, Qr – rain energy, and En – total net energy.
References
- Hardy, S. Memory, performance, and history: the making of American ice hockey at St. Paul’s School, 1860–1915. The International Journal of the History of Sport 1997, 14, 97–115. [Google Scholar] [CrossRef]
- Robidoux, M.A. Stickhandling through the margins: First Nations hockey in Canada; University of Toronto Press, 2012. [Google Scholar]
- Lorenz, S.L. Constructing a Cultural History of Canadian Hockey. The International Journal of the History of Sport 2015, 32, 2107–2113. [Google Scholar] [CrossRef]
- Bennett, P. Re-Imagining the Creation: Popular Mythology, the Mi’kmaq, and the Origins of Canadian Hockey. In (J. Ellison and J. Anderson, eds.), Hockey: Challenging Canada’s Game (Gatineau, QC: Canadian Museum of History/ University of Ottawa Press, 2018), pp. 45–60.
- Hardy, S.; Holman, A.C. Hockey: A global history; University of Illinois Press, 2018. [Google Scholar]
- Koller, C. The Beginnings of the International Ice Hockey Federation. The International Journal of the History of Sport 2024, 1–18. [Google Scholar] [CrossRef]
- Clark, M.J. Making ‘Mr. Hockey’: Race, Gender, Class, and Nation in Media Representations of Gordie Howe. Ph.D. dissertation, School of Kinesiology & Health Studies, Queen University (Kingston ON Canada) 2018. http://hdl.handle.net/1974/25662.
- Field, R. Representing “The Rocket”: The Filmic Use of Maurice Richard in Canadian History. Journal of Sport History 2014, 41, 15–28. [Google Scholar] [CrossRef]
- Gretzky, W. On Family, Hockey and Healing; Random House Canada, 2001; ISBN 978-0-679-31114-0. [Google Scholar]
- Doeden, M. Wayne Gretzky. Twenty-First Century Books 2007. 0822. [Google Scholar]
- Allain, K.A. Kid Crosby or Golden Boy: Sidney Crosby, Canadian national identity, and the policing of hockey masculinity. International Review for the Sociology of Sport 2011, 46, 3–22. [Google Scholar] [CrossRef]
- Cantelon, H. Have Skates, Will Travel: Canada, International Hockey, and the Changing Hockey Labour Market. Chapter 11 in (D. Whitson and R. Gruneau, eds.) Artificial Ice: Hockey, Culture, and Commerce, Toronto: University of Toronto Press, 2006, pp. 215–236. [CrossRef]
- Holman, A.C. The Canadian hockey player problem: Cultural reckoning and national identities in American collegiate sport, 1947–1980. Canadian Historical Review 2007, 88, 439–468. [Google Scholar] [CrossRef]
- Brown, L.C.; Duguay, C.R. The response and role of ice cover in lake-climate interactions. Progress in Physical Geography: Earth and Environment 2010, 34, 671–704. [Google Scholar] [CrossRef]
- Chen, Y.; She, Y. Long-term variations of river ice breakup timing across Canada and its response to climate change. Cold Regions Science and Technology 2020, 176, 103091. [Google Scholar] [CrossRef]
- Sharma, S. , Richardson, D.C., Woolway, R.I., Imrit, M.A., Bouffard, D., Blagrave, K., et al. Loss of ice cover, shifting phenology, and more extreme events in Northern Hemisphere lakes. Journal of Geophysical Research: Biogeosciences 2021, 126, e2021JG006348. [Google Scholar] [CrossRef]
- Damyanov, N.N. , Matthews, H.D., Mysak, L.A. Observed decreases in the Canadian outdoor skating season due to recent winter warming. Environmental Research Letters 2012, 7, 014028. [Google Scholar] [CrossRef]
- McLeman, R.; Golian, S.; Murphy, C.; Robertson, C. Future prospects for backyard skating rinks look bleak in a warming climate. Canadian Geographies / Géographies Canadiennes 2023, 1–19. [Google Scholar] [CrossRef]
- Dickau, M.; Matthews, D.; Guertin, É.; Seto, D. Projections of declining outdoor skating availability in Montreal due to global warming. Environmental Research Communications 2020, 2, 051001. [Google Scholar] [CrossRef]
- Yao, H.; Field, T.; McConnell, C.; Beaton, A.; James, A.L. Comparison of five snow water equivalent estimation methods across categories. Hydrological Processes 2018, 32, 1894–1908. [Google Scholar] [CrossRef]
- Wilfred Laurier University. RinkWatch. https://www.rinkwatch.org/ (last accessed 21 Dec 2024).
- King’s Printer for Ontario. Ontario’s Data Catalogue: Ontario Ministry of Environment, Conservation and Parks: Inland Lakes and Streams – Physical Conditions 2024. https://data.ontario.ca/dataset/inland-lakes-and-streams-physical-conditions. (last accessed 23 December 2024).
- International Institute for Sustainable Development. Experimental Lakes Area data provided by Scott Higgins, 2024.
- Theil, H. A rank-invariant method of linear and polynomial regression analysis. Proc. R. Neth. Acad. Sci. 1950, 53, 386–392. [Google Scholar]
- Sen, P.K. Estimates of the Regression Coefficient Based on Kendall’s Tau. Am. Stat. Assoc. J. 1968, 63, 1379–1389. [Google Scholar] [CrossRef]
- Mann, H.B. Nonparametric Tests Against Trends. Econometrica 1945, 13, 245–259. [Google Scholar] [CrossRef]
- Kendall, M.; Gibbons, J.D. Rank Correlation Methods, 5th ed.; Edward Arnold: London, UK, 1990. [Google Scholar]
- Environment Canada and Climate Change. Historical Climate Data. https://climate.weather.gc.ca/ (last accessed 23 December 2024).
- Yao, H.; Samal, N.R.; Joehnk, K.D.; Fang, X.; Bruce, L.C.; Pierson, D.C.; Rusak, J.A. Comparing ice and temperature simulations by four dynamic lake models in Harp Lake: past performance and future predictions. Hydrological Processes 2014, 28, 4587–4601. [Google Scholar] [CrossRef]
- Roos, J. Breaking the Ice: Slowly Warming to the Topic of Climate Change. Ph.D. Dissertation, Lund University, 2017.
- Anisimov, O.; Orttung, R. Climate change in Northern Russia through the prism of public perception. Ambio 2019, 48, 661–671. [Google Scholar] [CrossRef] [PubMed]
- Buck, A.L. New equations for computing vapor pressure and enhancement factor. J. Appl. Meteorol. 1981, 20, 1527–1532. [Google Scholar] [CrossRef]
Figure 1.
Photographs showing outdoor ice rinks (upper photo from Steven Fassnacht; lower photo from Gordon Murray 2024).
Figure 1.
Photographs showing outdoor ice rinks (upper photo from Steven Fassnacht; lower photo from Gordon Murray 2024).
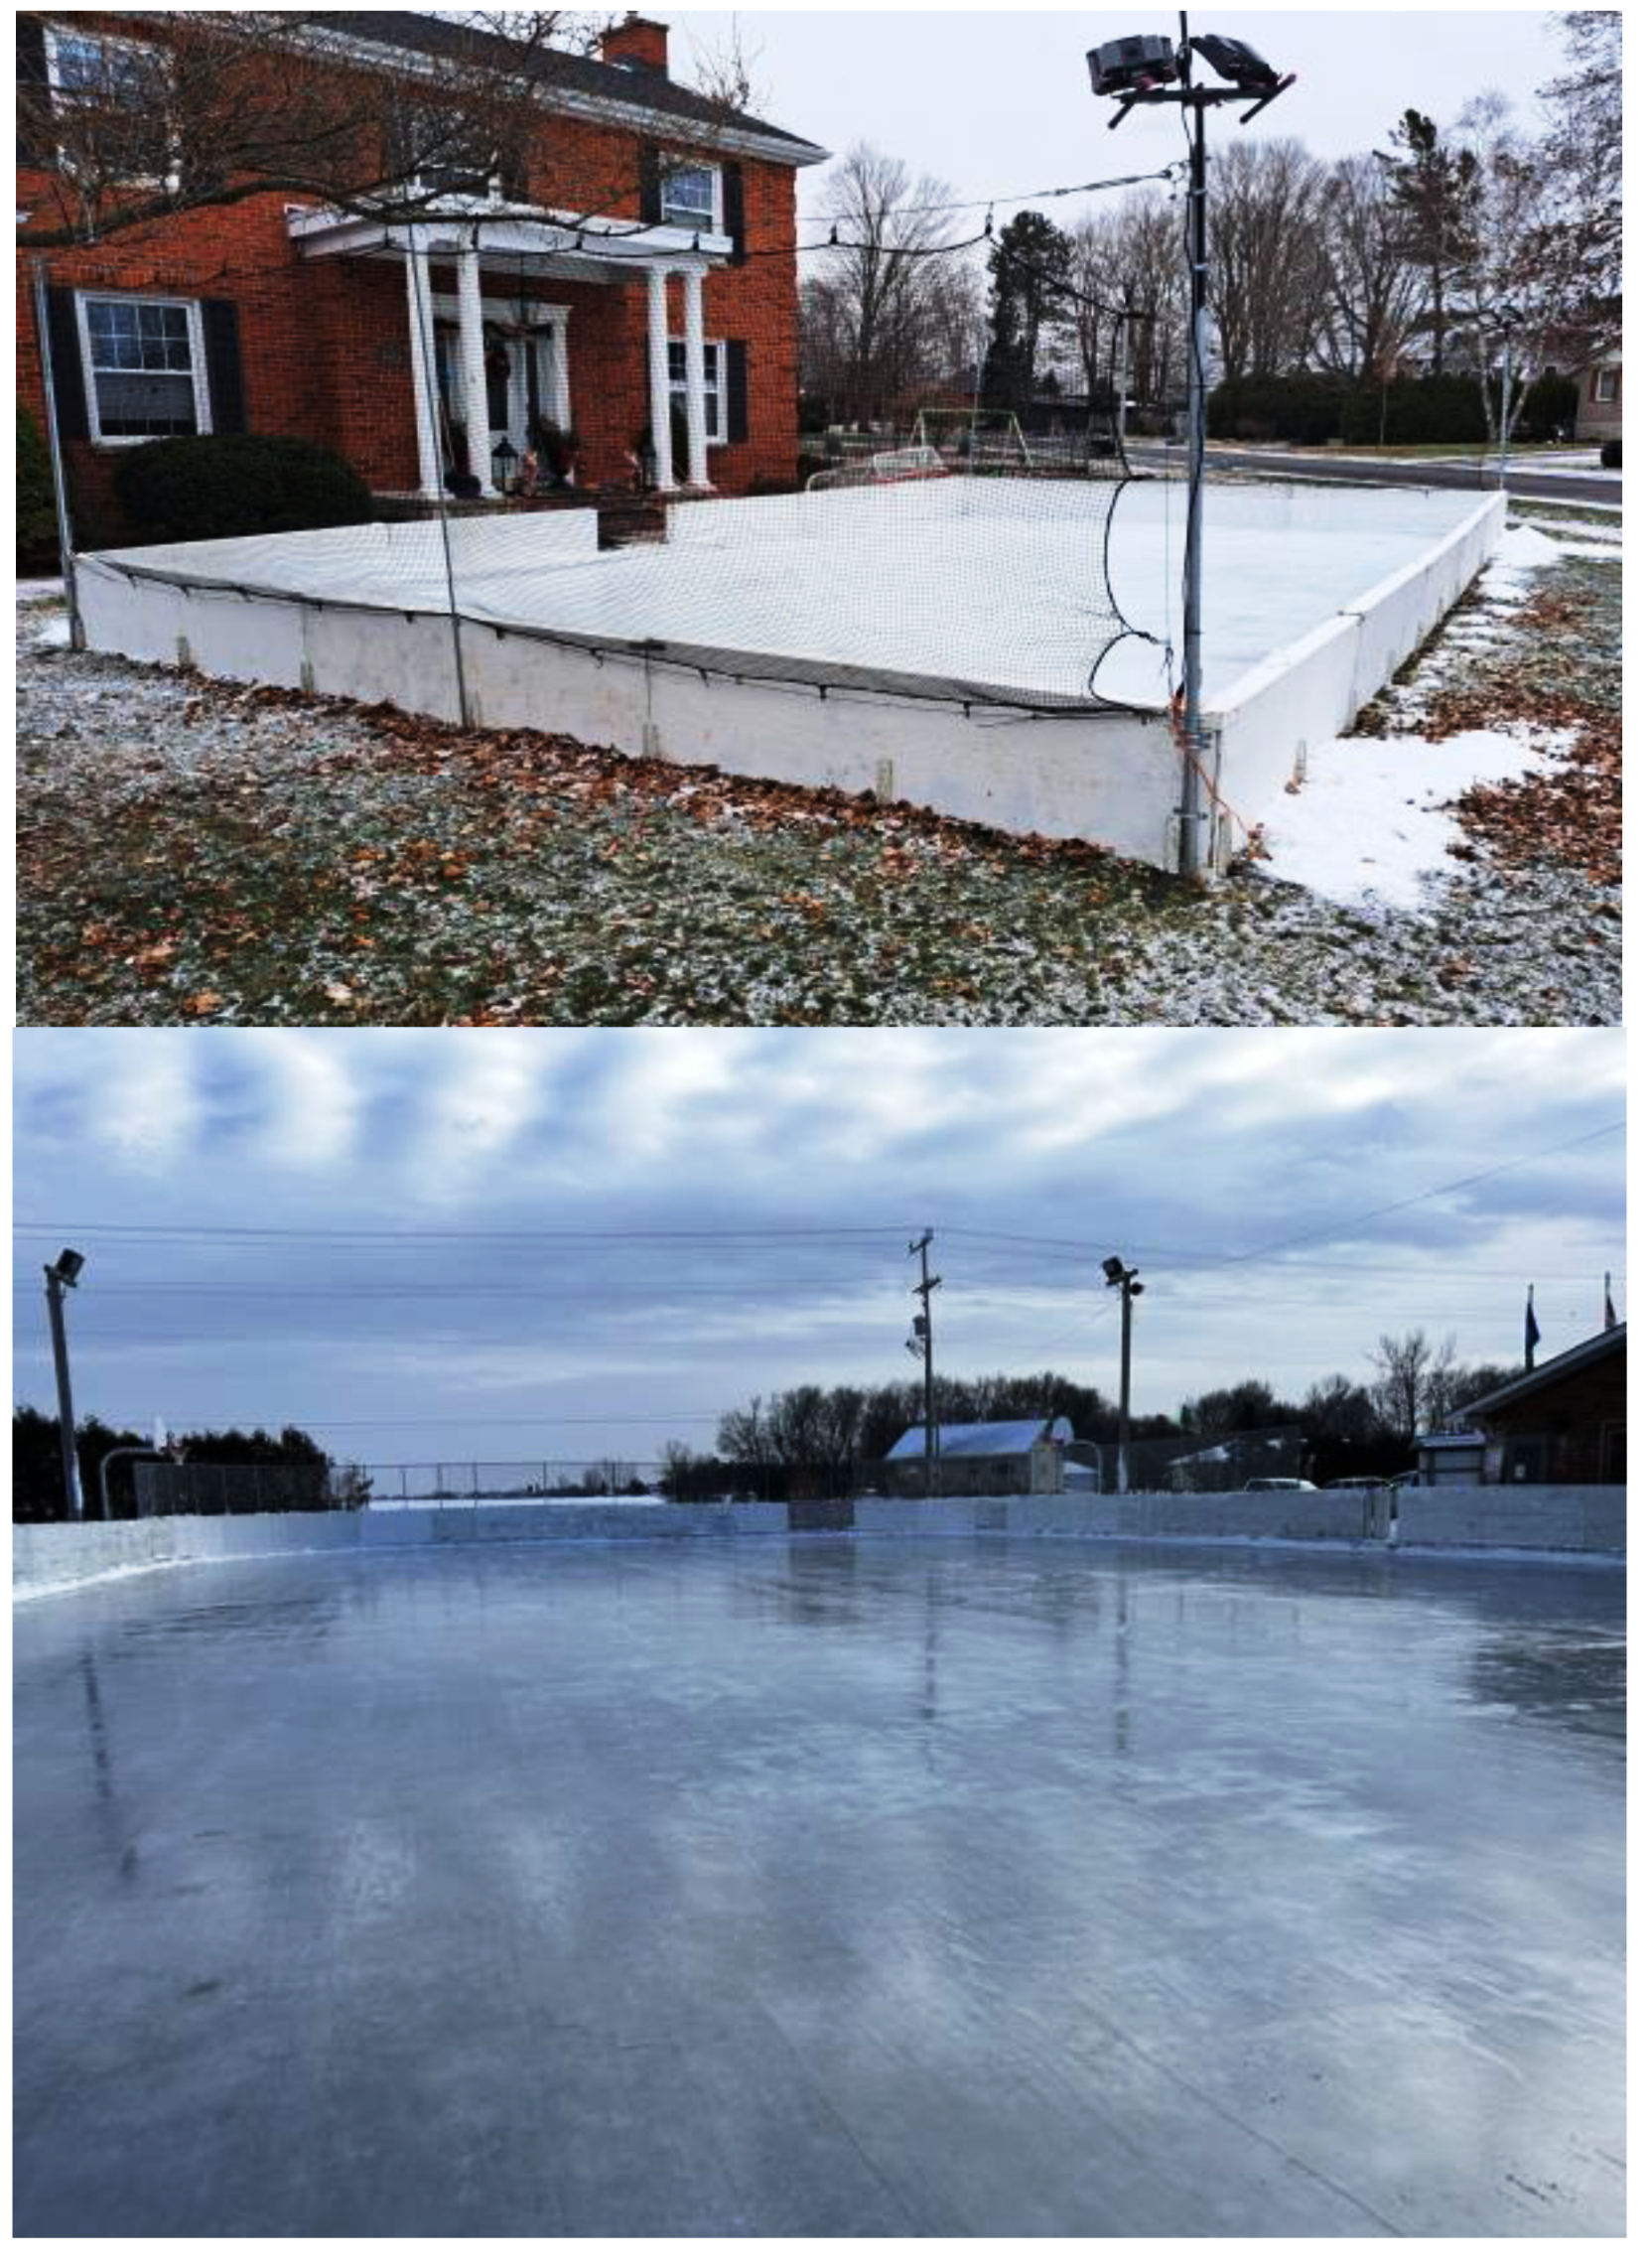
Figure 2.
(a) Location of two studied sites (Dorset in south-central Ontario and ELA in northwestern Ontario). (b) Location of meteorological station at Dorset Environment Science Centre, the Muskoka airport, and the to ice rinks (Annie Williams Park rink in Bracebridge, Stephenson Lions rink in Port Sydney), in central Ontario of Canada. The Parkview NIR rink is located in North York, within the city of Toronto (The base maps are from https://www.google.com/maps/).
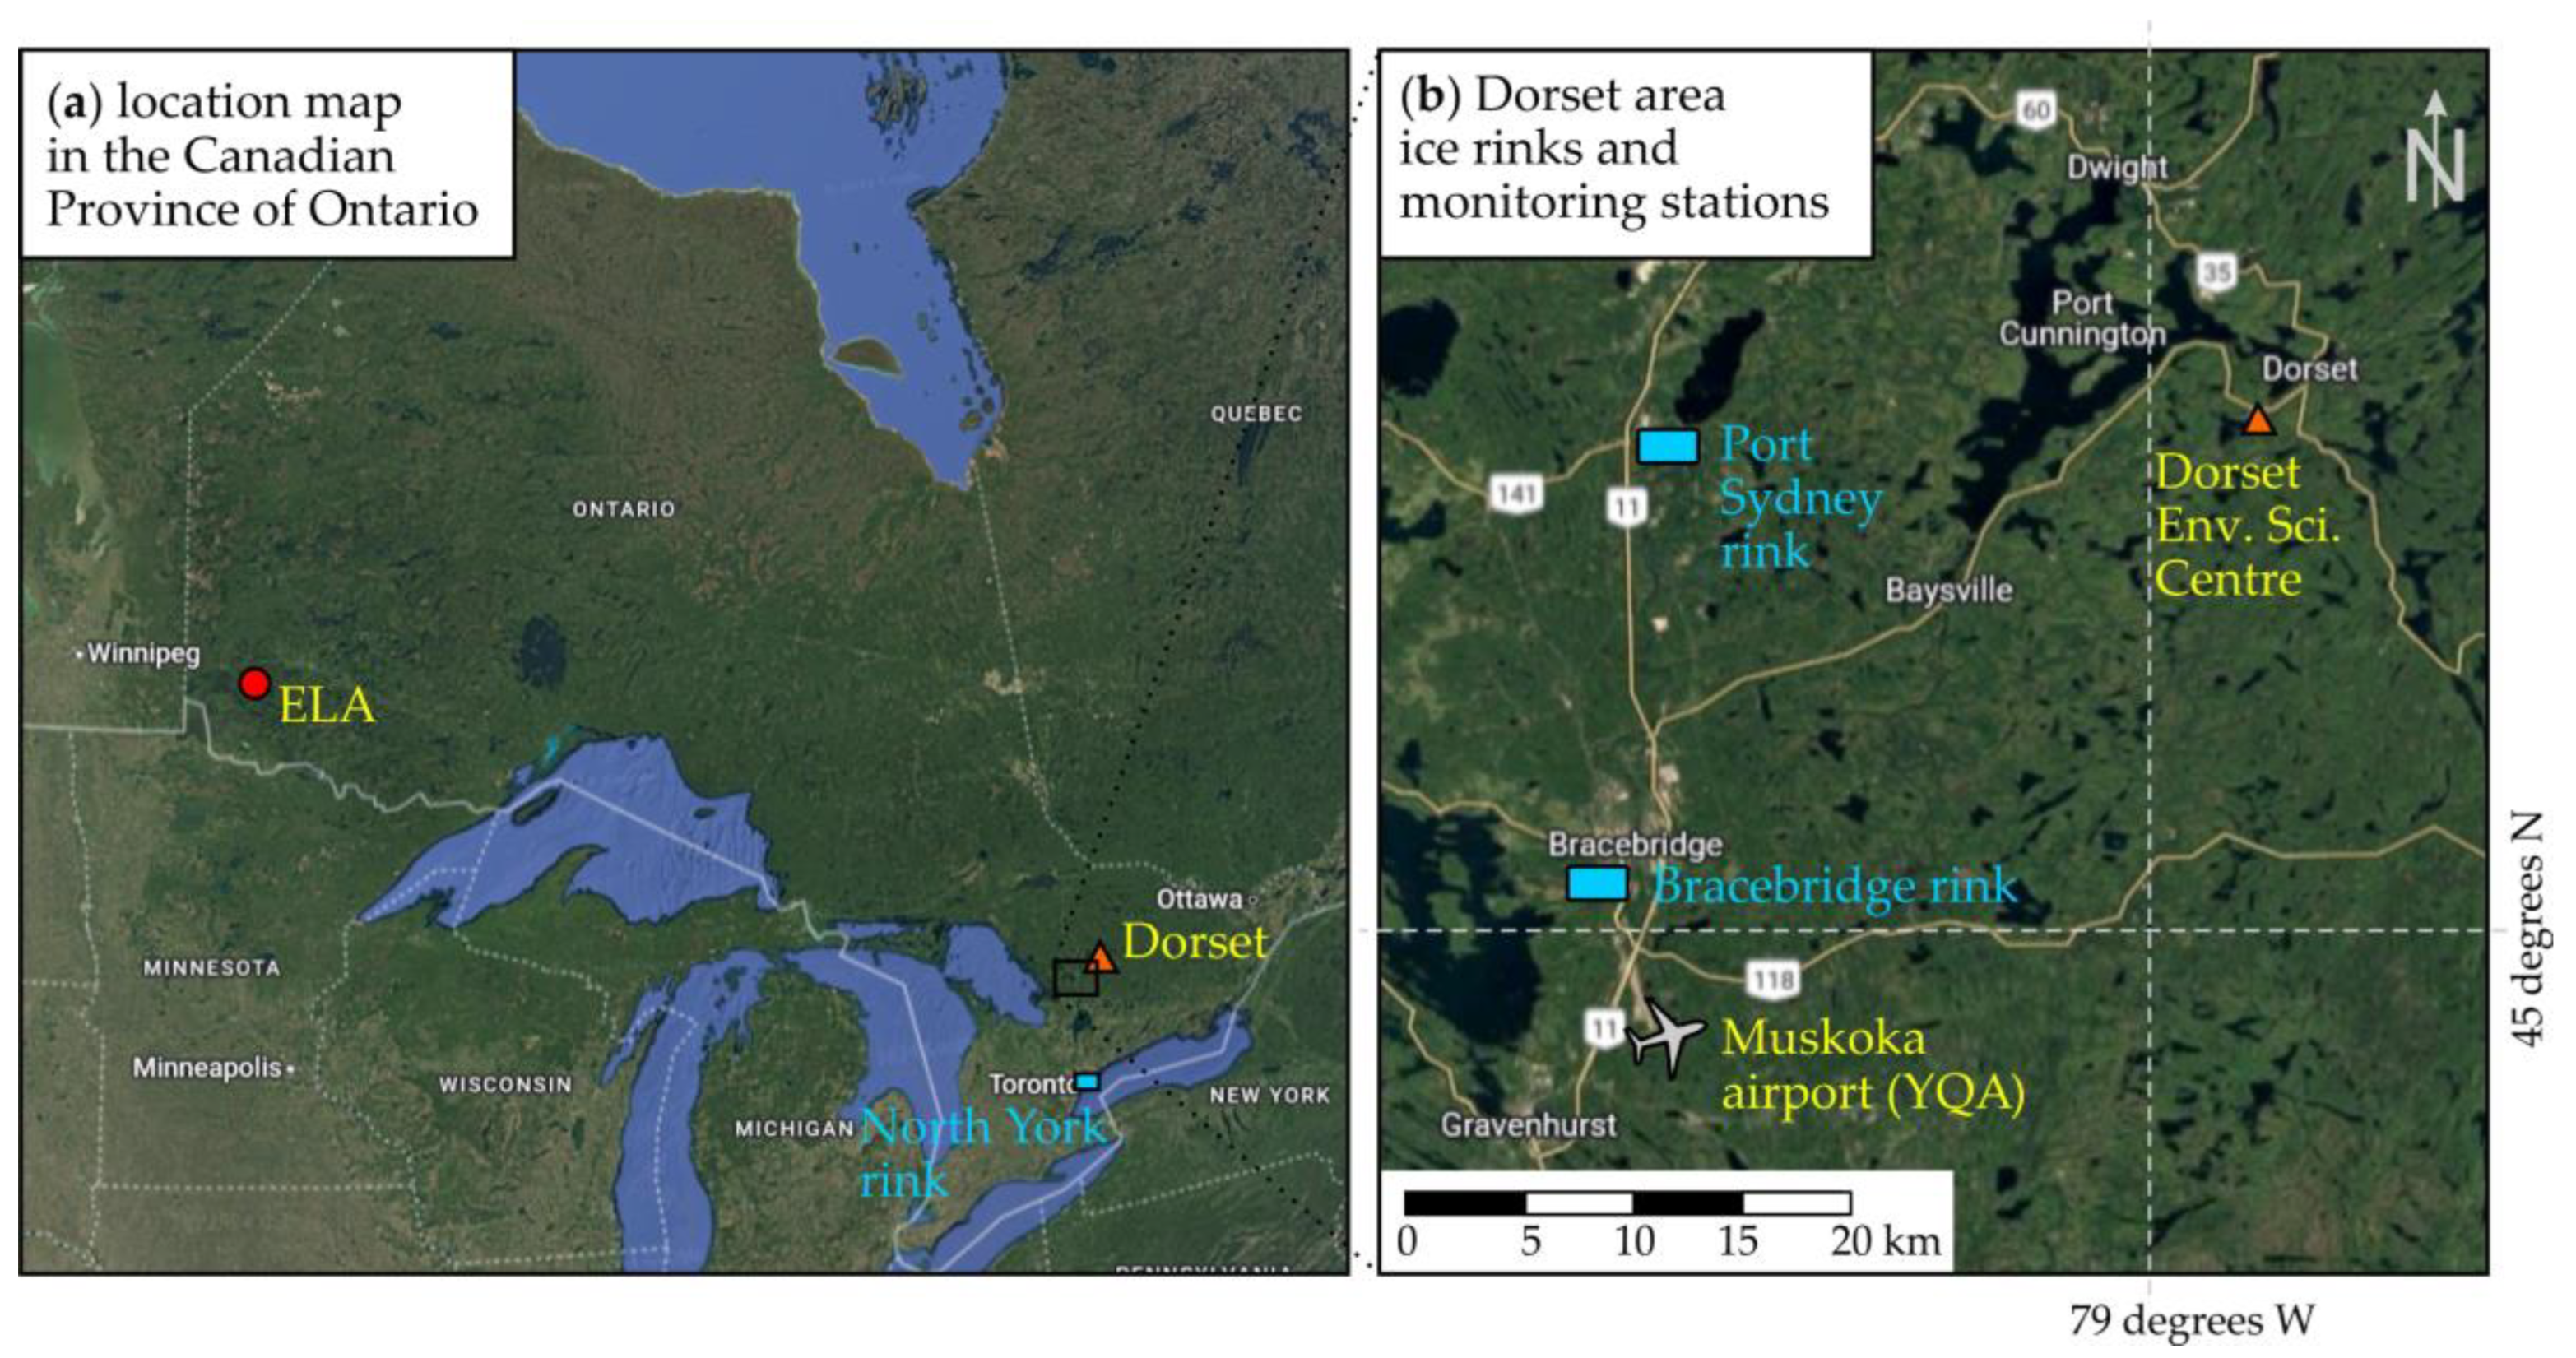
Figure 3.
Hydrometeorological data presenting the (a) mean winter (December through March) temperature at Dorset and ELA, (b) mean wind speed at Dorset and mean snow depth at the Muskoka airport for each year, (c) duration of lake-ice cover at Dorset and snow cover season at the Muskoka airport for each year (see Figure 2 for location map).
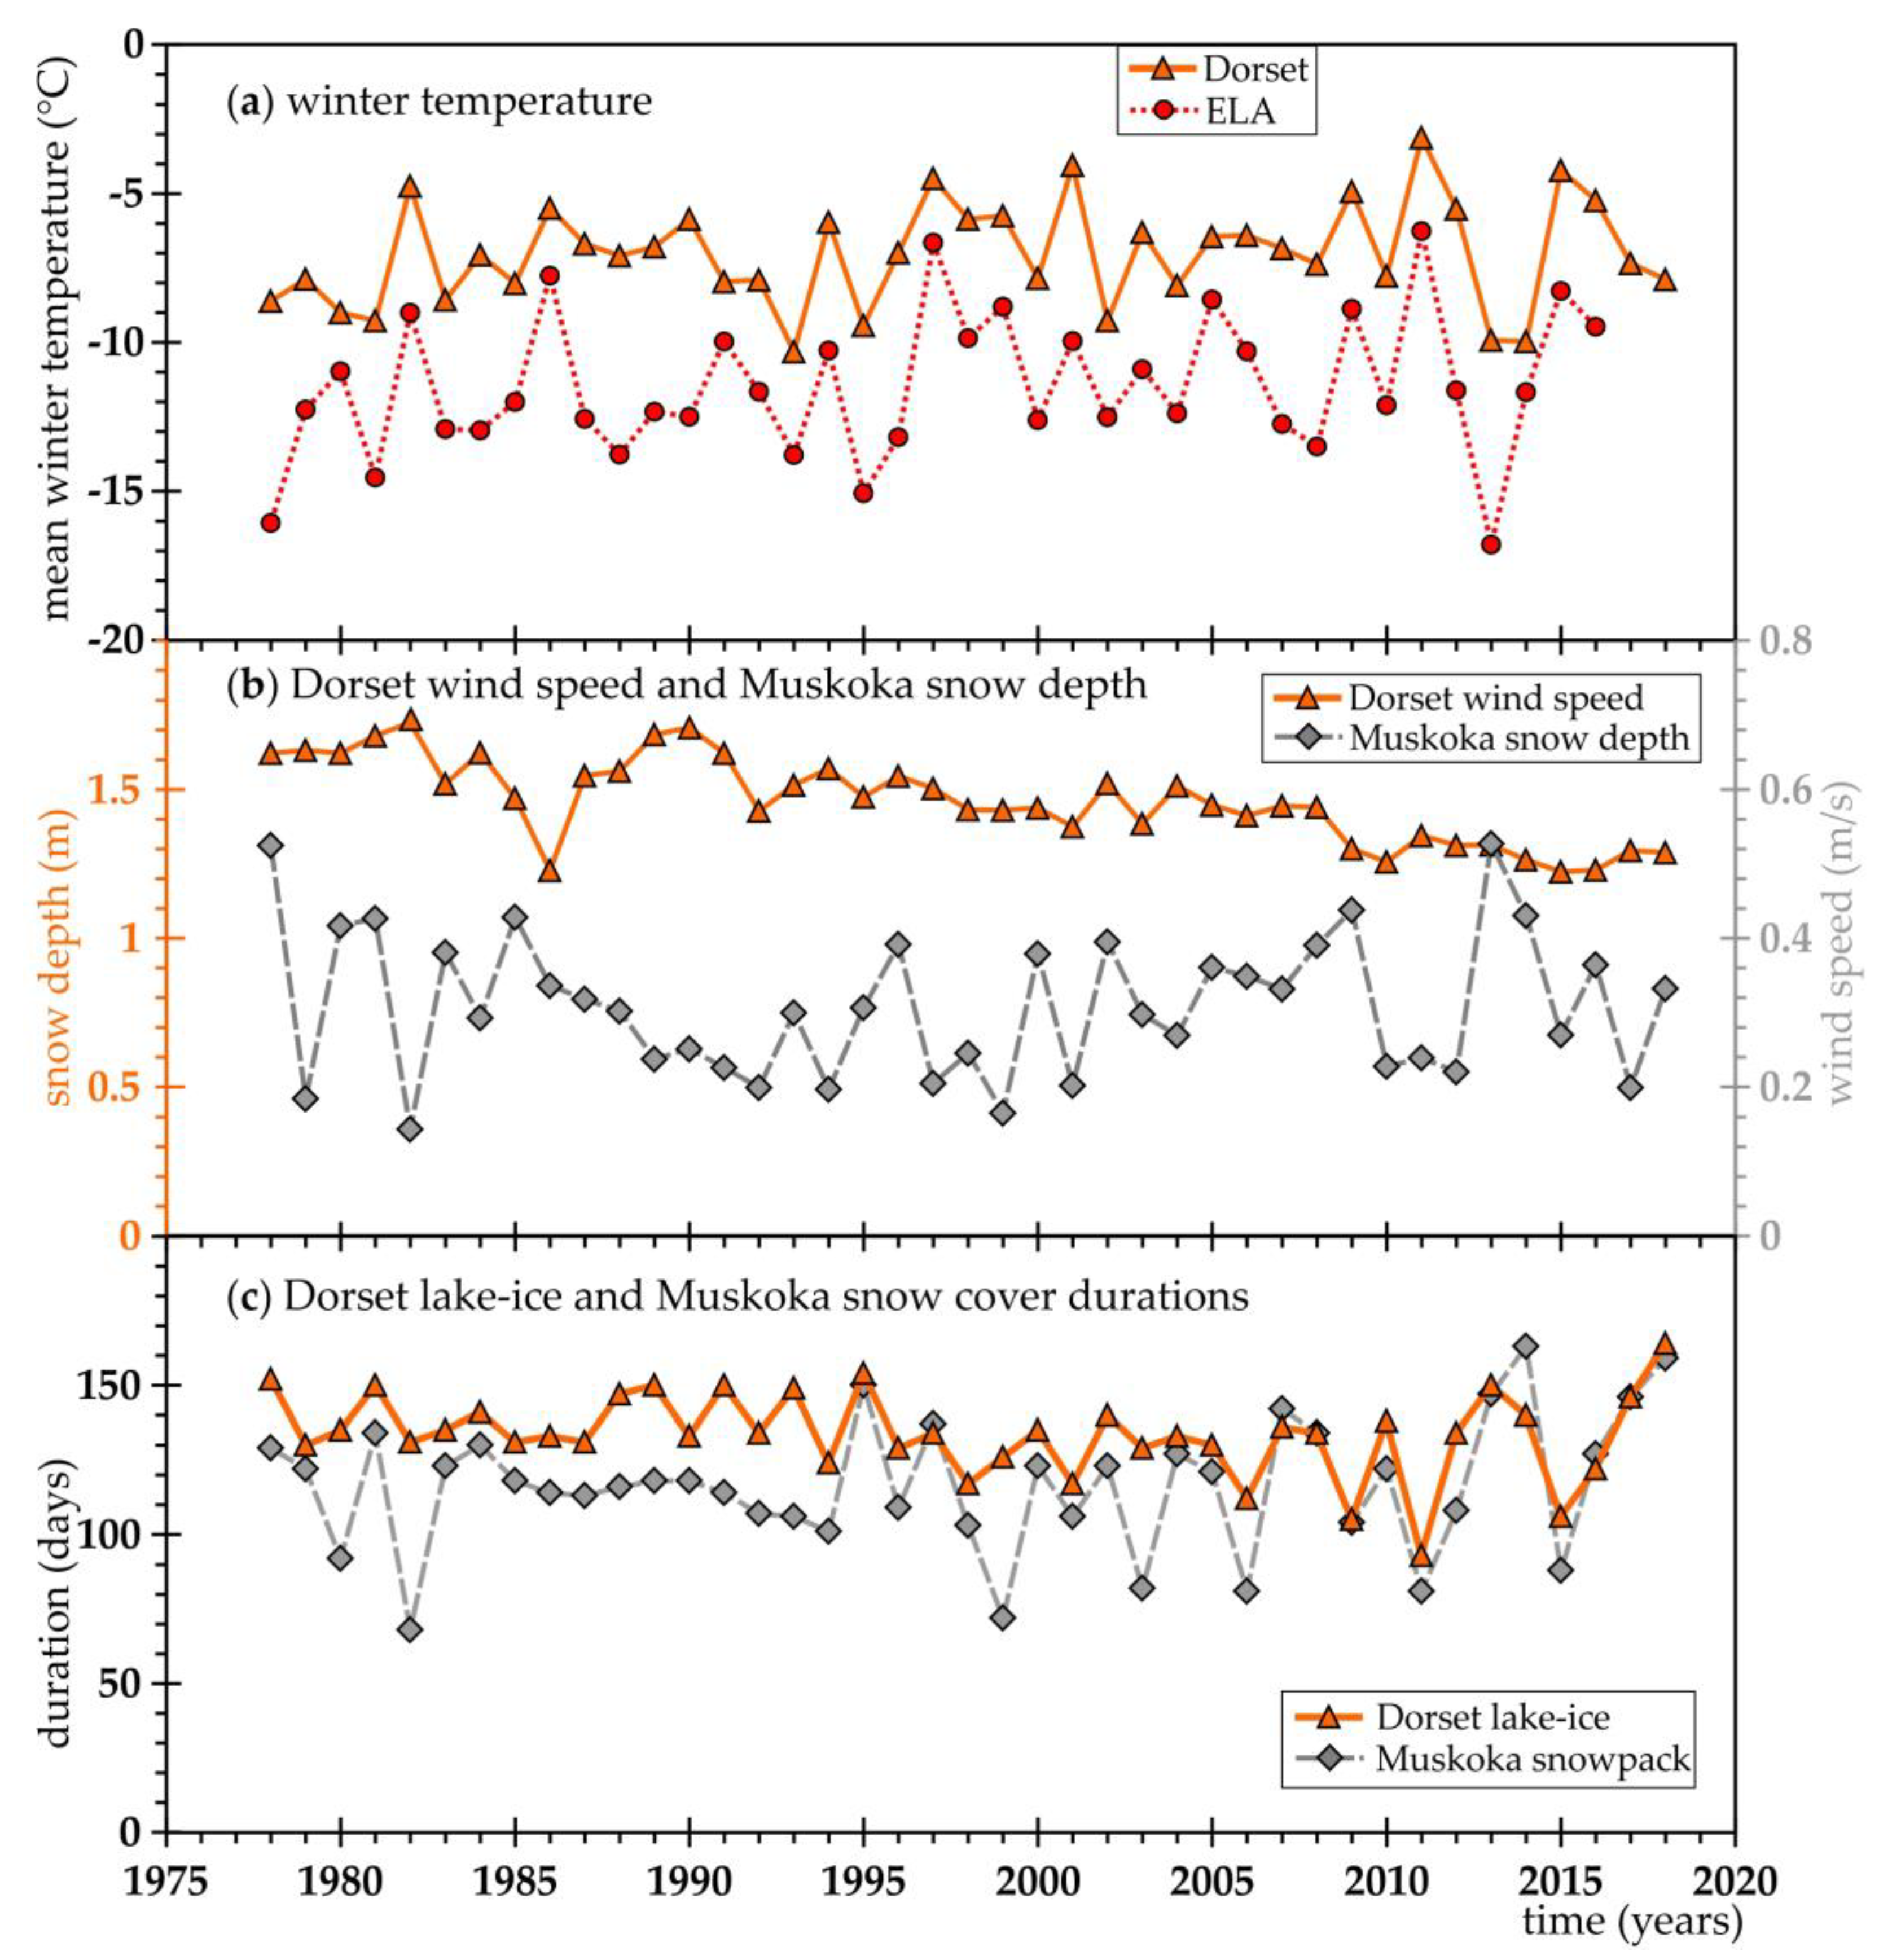
Figure 4.
Simulated daily IWE by three model versions for the 2012-13 season using the Dorset meteorological data and the last skateable day observation at the Stephenson Lions Club, Parkview NIR and Annie Williams Park rinks.
Figure 4.
Simulated daily IWE by three model versions for the 2012-13 season using the Dorset meteorological data and the last skateable day observation at the Stephenson Lions Club, Parkview NIR and Annie Williams Park rinks.
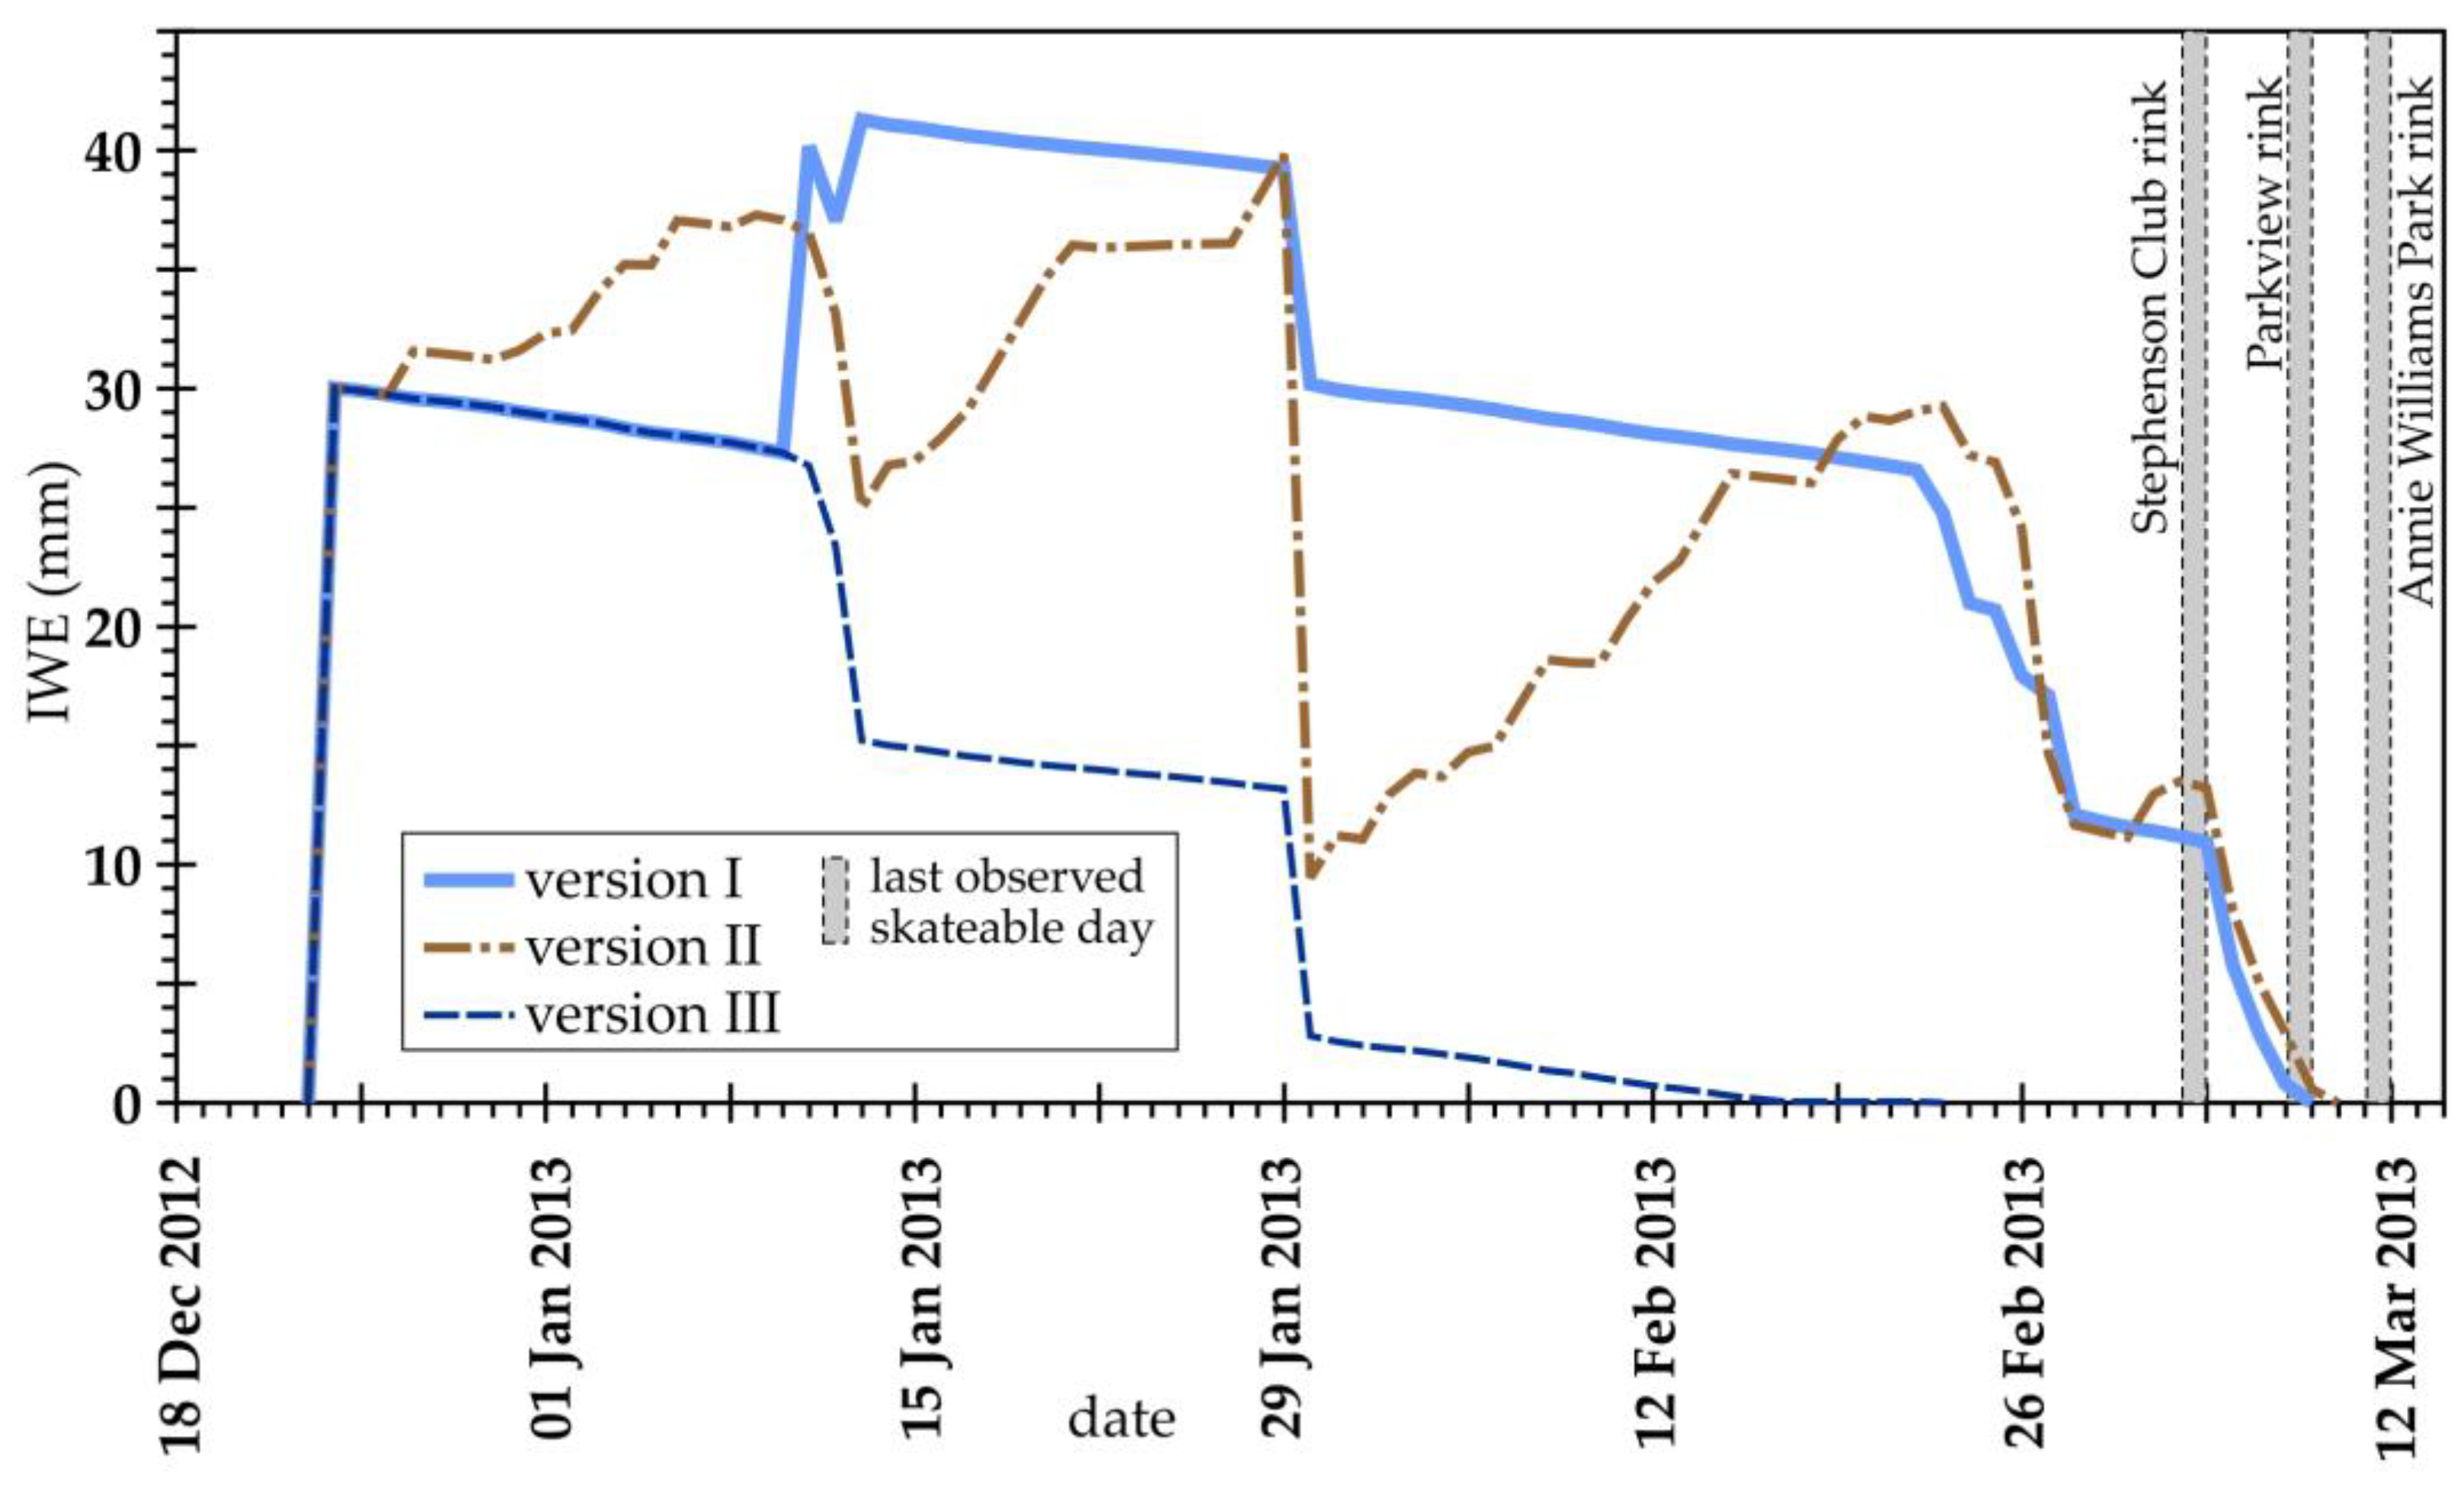
Figure 5.
Simulated IWE processes of six winter seasons for three model versions for Dorset illustrated as (a) the daily time series of IWE, (b) modelled ice rink duration, and (c) modelled mean IWE.
Figure 5.
Simulated IWE processes of six winter seasons for three model versions for Dorset illustrated as (a) the daily time series of IWE, (b) modelled ice rink duration, and (c) modelled mean IWE.
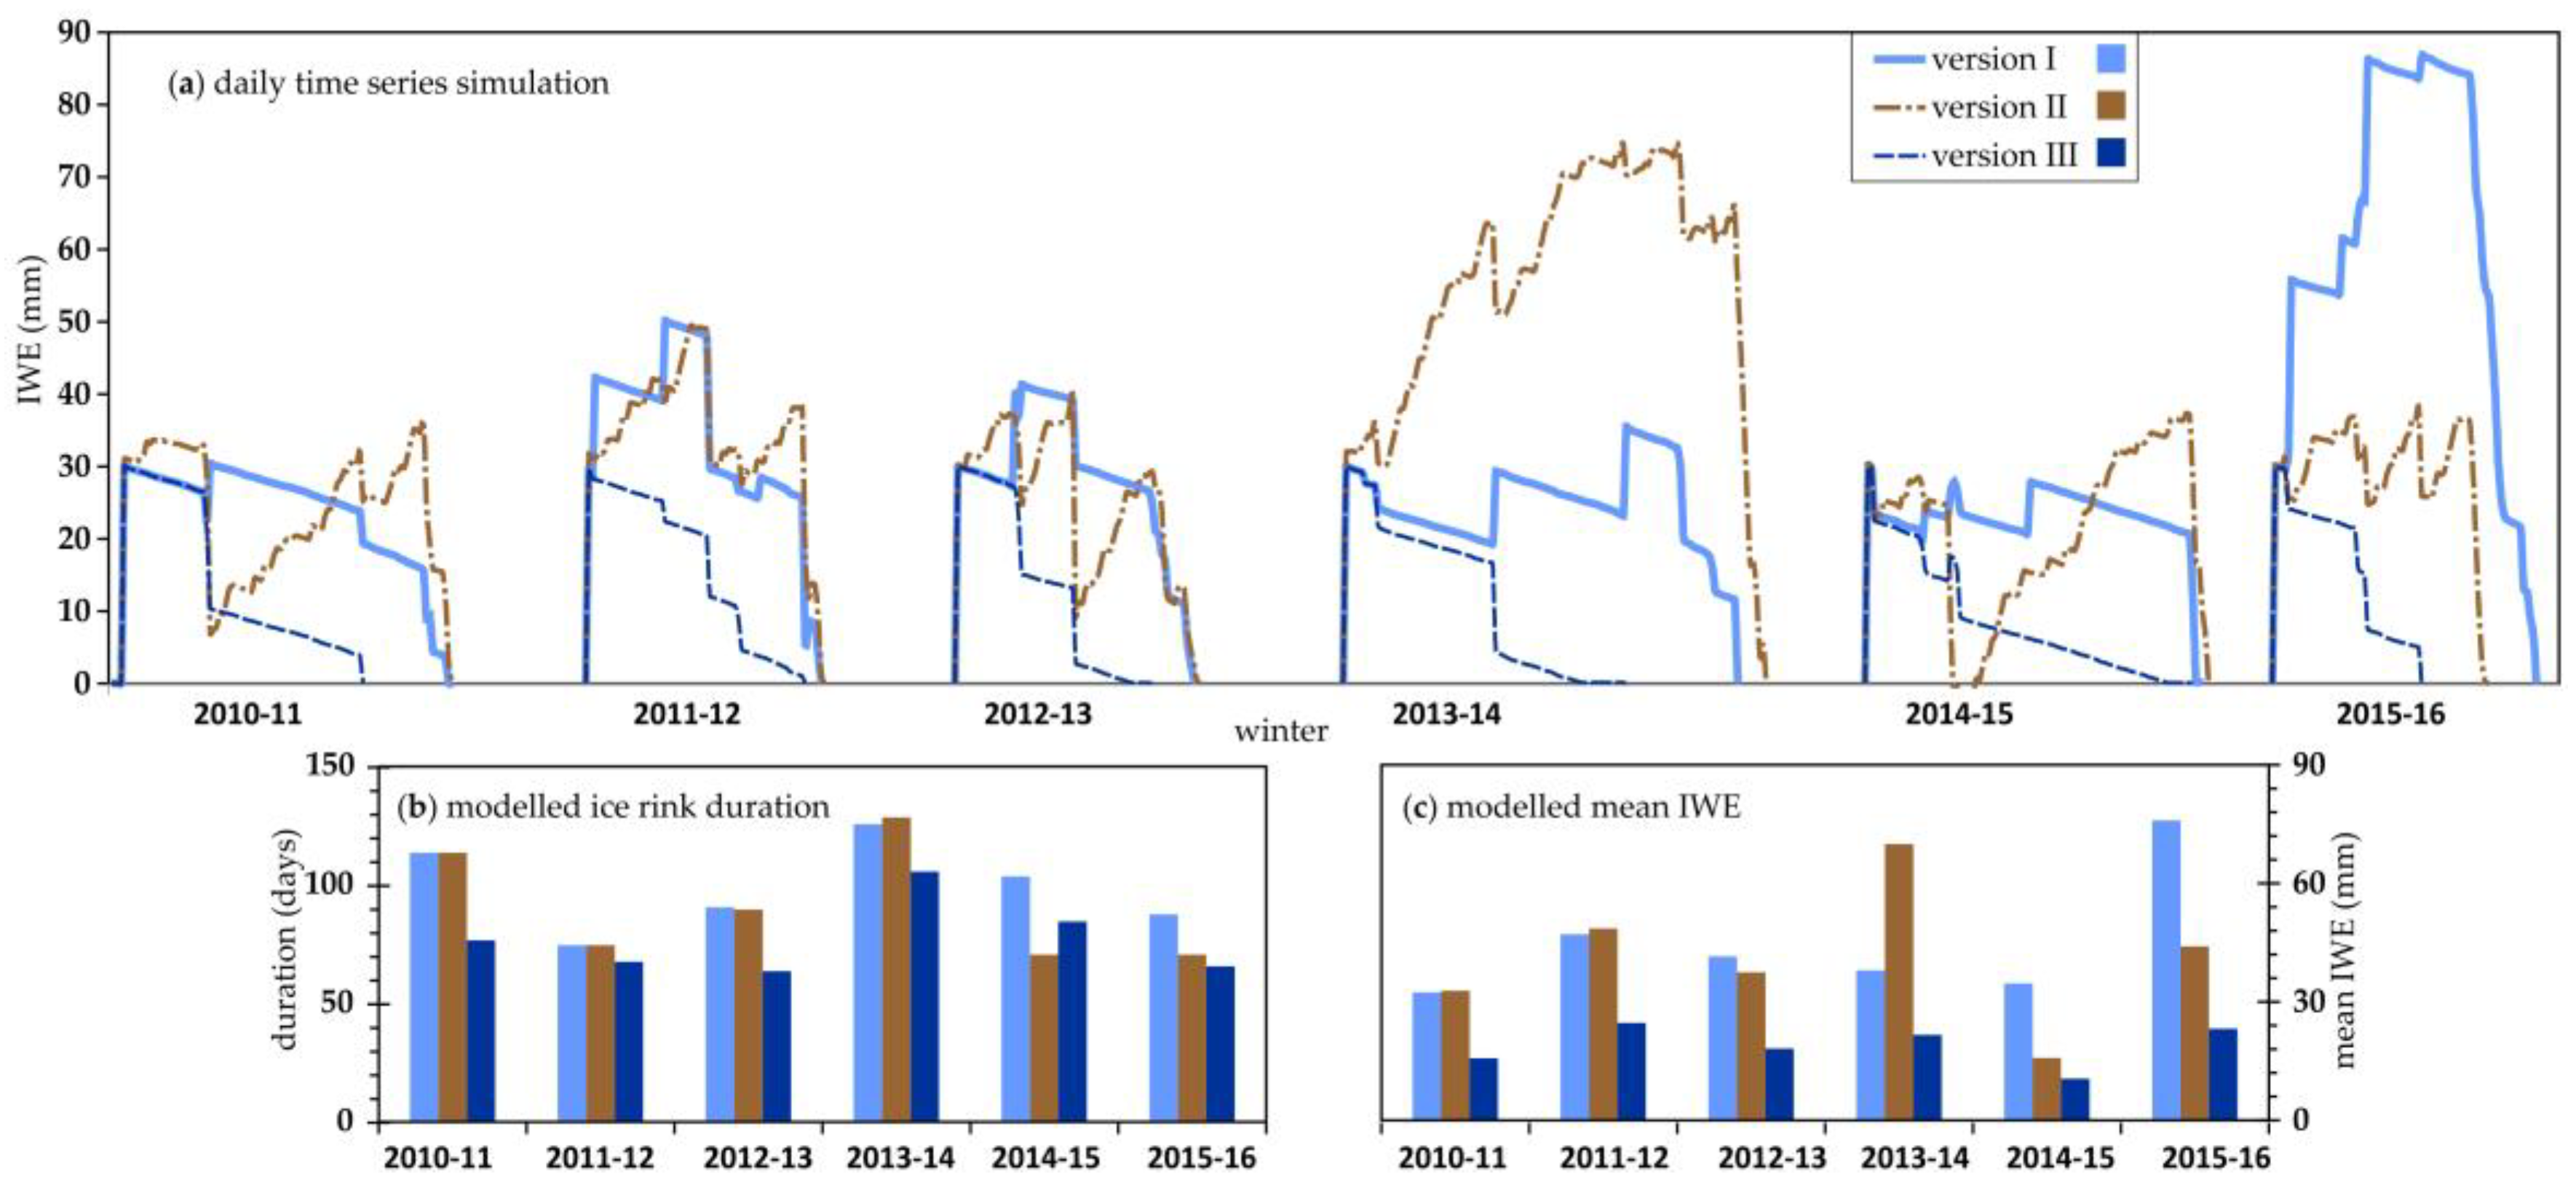
Figure 6.
Long-term simulated (a) rink-on date for Dorset and ELA, (b) rink-off date for the three model versions at Dorset, and (c) rink-off date for the three model versions at ELA.
Figure 6.
Long-term simulated (a) rink-on date for Dorset and ELA, (b) rink-off date for the three model versions at Dorset, and (c) rink-off date for the three model versions at ELA.
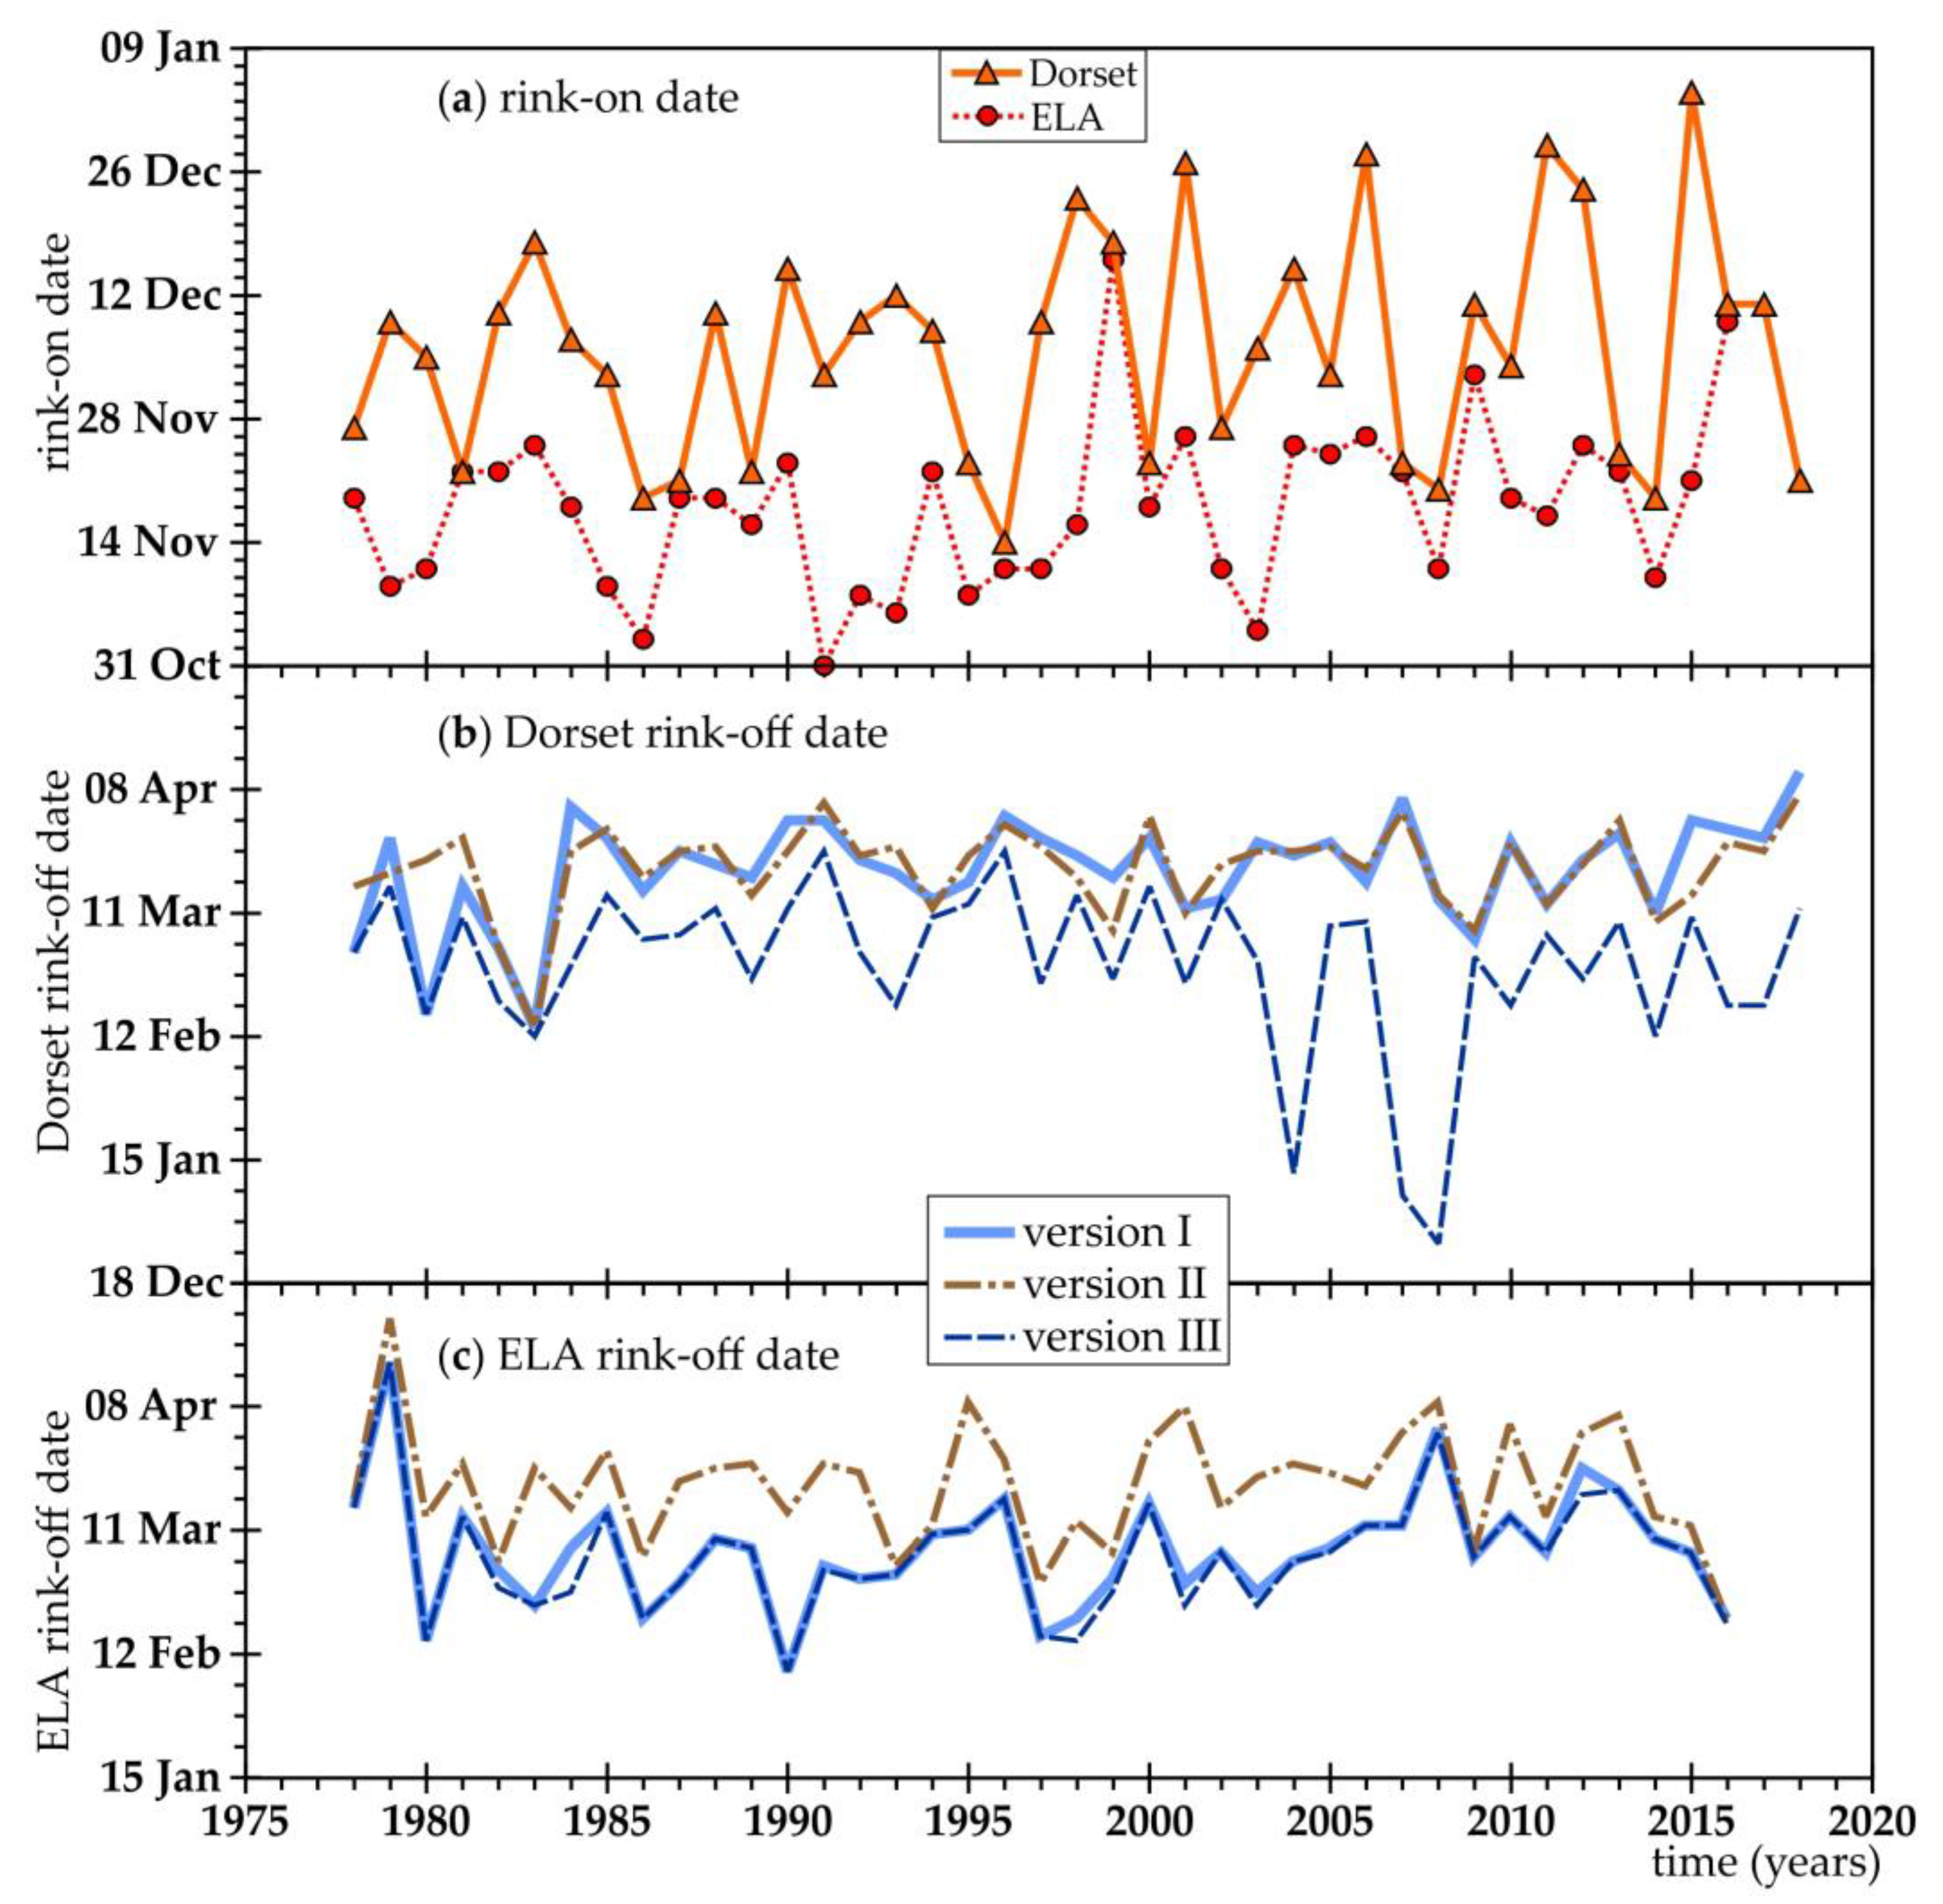
Figure 7.
Trends for (a) the simulated ice rink metrics at Dorset (1978-2018), (b) the simulated ice rink metrics at ELA (1978-2016), (c) the snow and ice properties, and (d) the meteorological data. Significant trends (p < 0.05) are shown by bars outlined with a solid line and a ‘*’ sign, while the moderately significant trends (p < 0.1) are shown by bars without solid line and a ‘+’ sign.
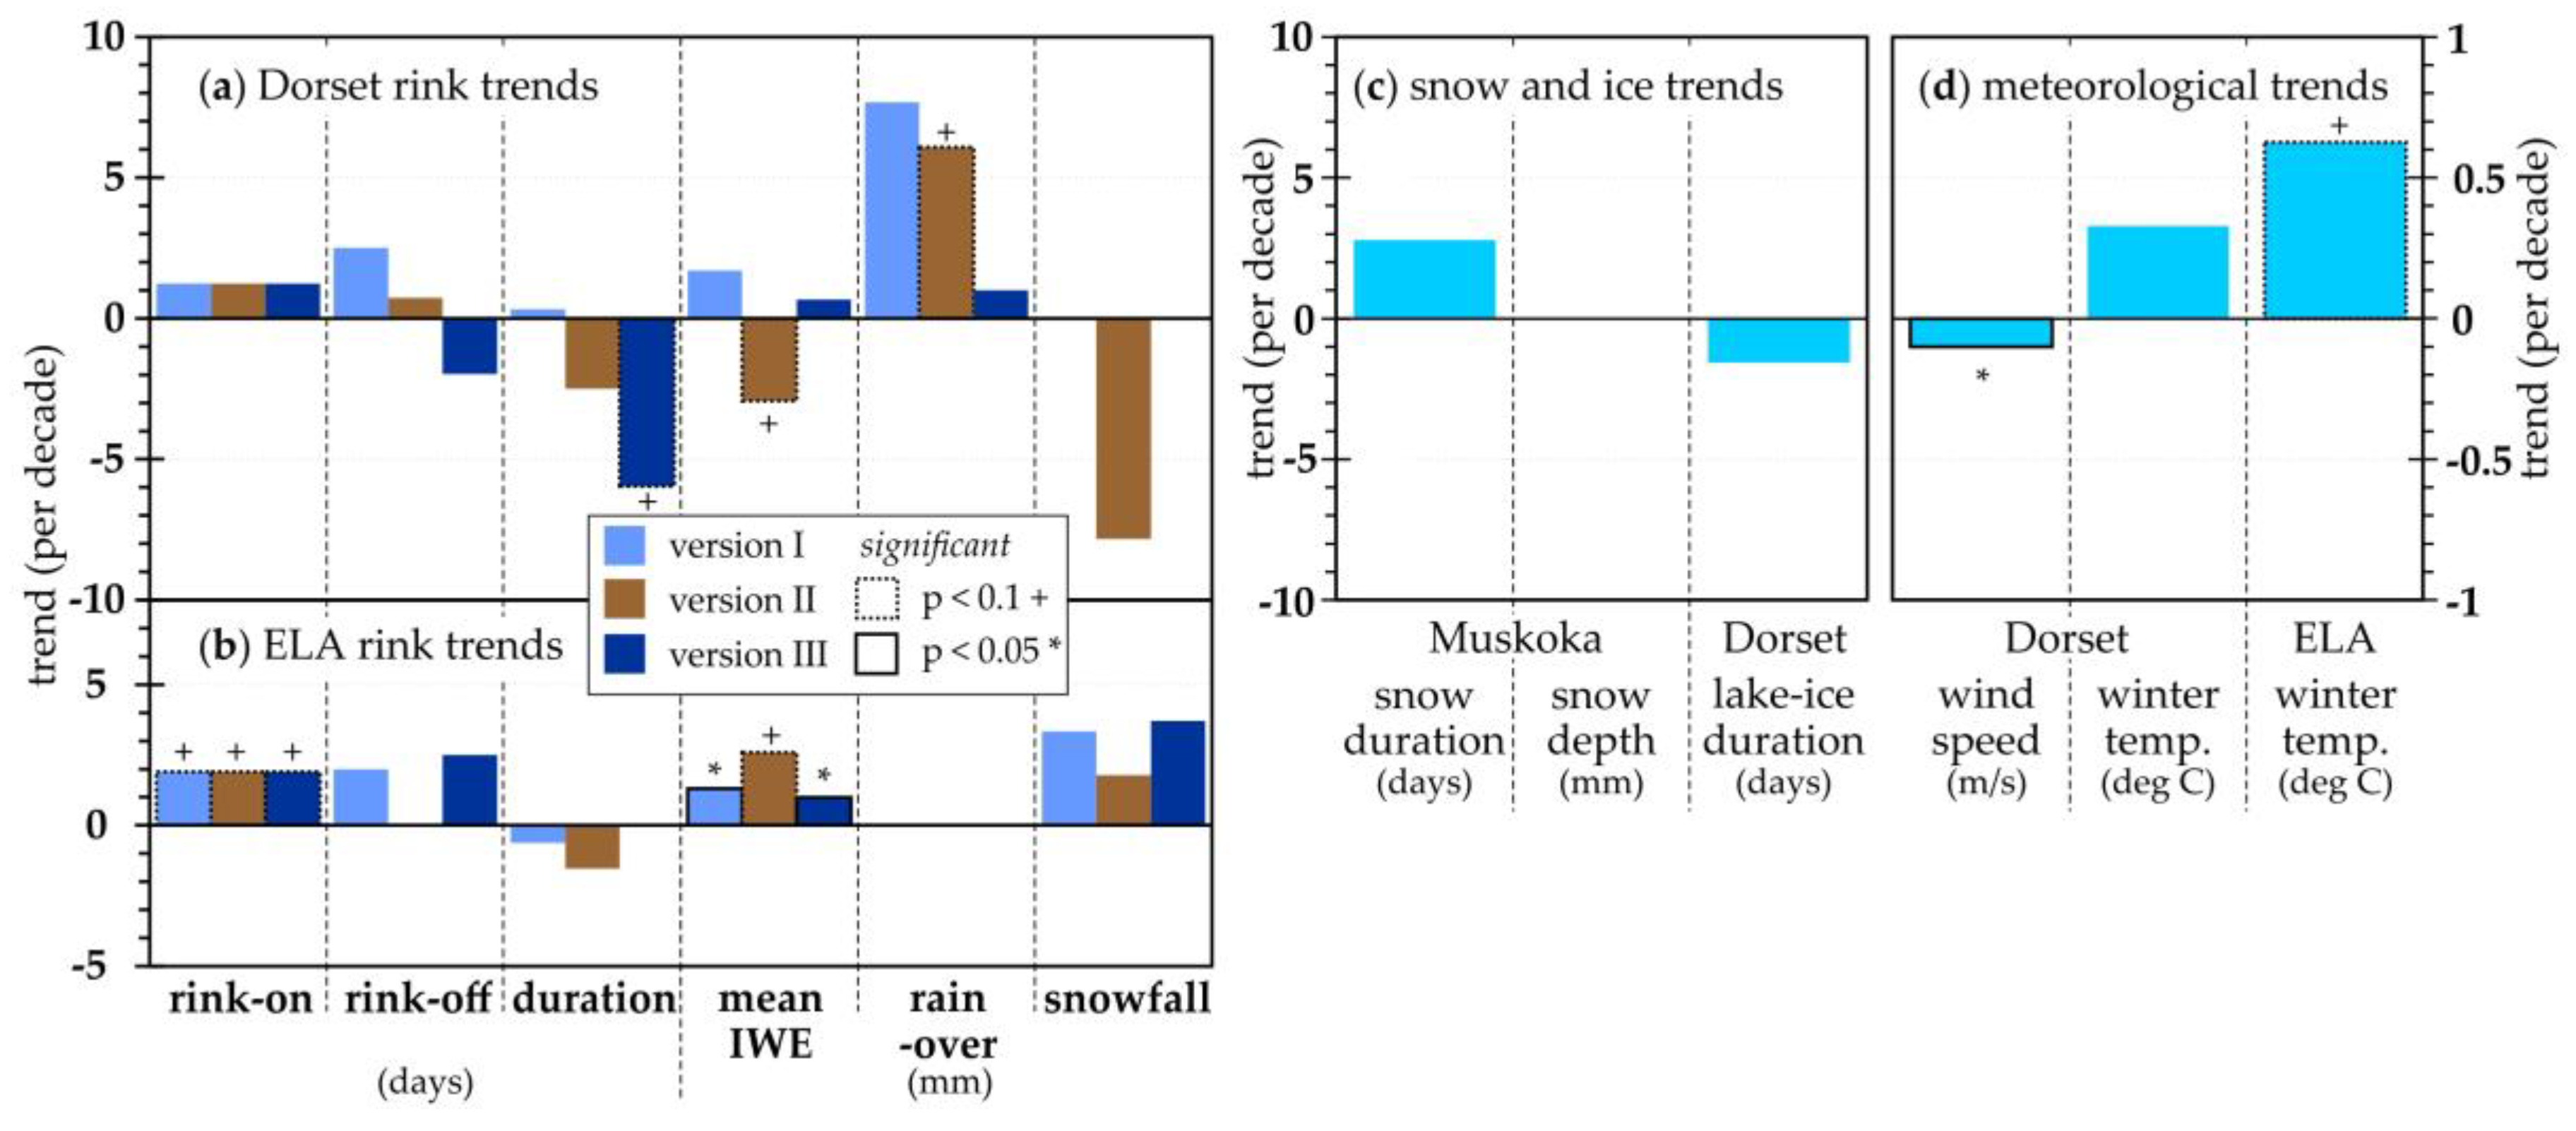
Figure 8.
Total sublimation, ice rink melting and rink duration per season at the Dorset simulation site for 43 years.
Figure 8.
Total sublimation, ice rink melting and rink duration per season at the Dorset simulation site for 43 years.
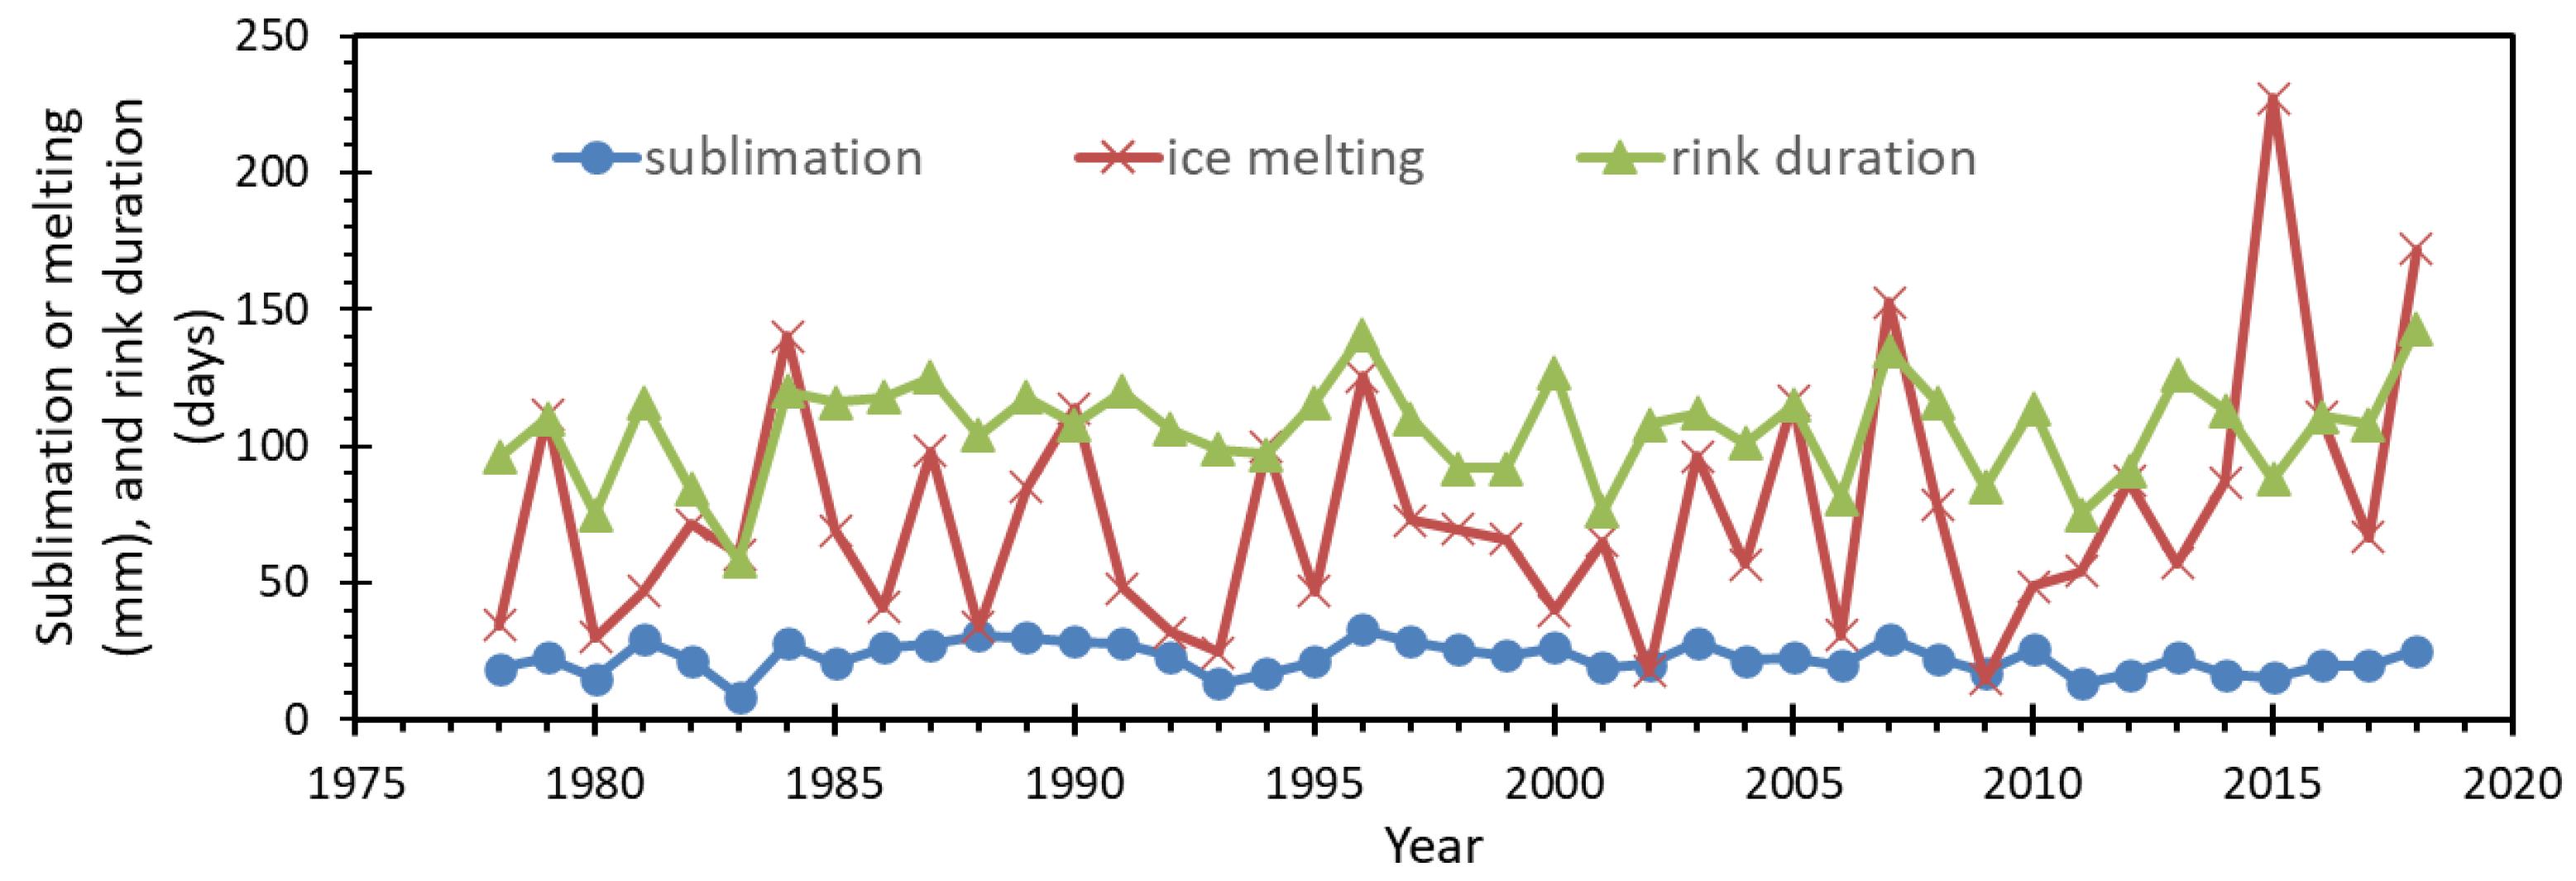
Table 1.
Comparison of simulated and observed rink ending dates (numbers in the bracket are simulation errors in days: positive meant delayed, negative meant advanced).
Table 1.
Comparison of simulated and observed rink ending dates (numbers in the bracket are simulation errors in days: positive meant delayed, negative meant advanced).
| Rink | Observed | Model I | Model II | Model III |
|---|---|---|---|---|
| Stephenson Lions | 5 Mar 2013 |
8 Mar 2013 (3) | 9 Mar 2013 (4) | 22 Feb 2013 (-13) |
| Annie Williams | 13 Mar 2013 | 8 Mar 2013 (-5) | 9 Mar 2013 (-4) | 22 Feb 2014 (-19) |
| Parkview | 8 Mar 2013 | 8-Mar-2013 (0) | 9 Mar 2013 (1) | 22 Mar 2013 (14) |
| 24 Mar 2014 | 28-Mar-2014 (4) | 5 Apr 2014 (12) | 20 Feb 2014 (-32) | |
| 9 Mar 2015 | 11-Mar-2015 (2) | 14 Mar 2015 (5) | 1 Mar 2015 (-8) | |
| 21 Feb 2016 | 26 Mar 2016 (33) | 11 Mar 2016 (18) | 19 Feb 2016 (-2) |
Disclaimer/Publisher’s Note: The statements, opinions and data contained in all publications are solely those of the individual author(s) and contributor(s) and not of MDPI and/or the editor(s). MDPI and/or the editor(s) disclaim responsibility for any injury to people or property resulting from any ideas, methods, instructions or products referred to in the content. |
© 2025 by the authors. Licensee MDPI, Basel, Switzerland. This article is an open access article distributed under the terms and conditions of the Creative Commons Attribution (CC BY) license (http://creativecommons.org/licenses/by/4.0/).
Copyright: This open access article is published under a Creative Commons CC BY 4.0 license, which permit the free download, distribution, and reuse, provided that the author and preprint are cited in any reuse.


