Submitted:
01 August 2025
Posted:
05 August 2025
You are already at the latest version
Abstract
Abnormal skin pigmentation can cause significant aesthetic concerns and impact quality of life. As melanin determines pigmentation, melanogenesis is a key target to manage pigmentation disorders. This study investigated the effects of extracts from the rhizome of Iris florentina L. on melanogenesis. Active phytochemicals were identified by combining LC-MS-MS metabolic profiling with subsequent bioassay-directed fractionation of chro-matographic eluent collected into 96-well plates. Fractions 41–43 increased melanin and contained germanaism B, providing evidence that it is a melanogenesis stimulator. In contrast, fractions 90–93 reduced melanin and contained iriflorental and iripallidal, iden-tified as prospective melanogenesis inhibitors. To explore extract-based applications, the plant was subjected to ethanolic, chloroform, and supercritical carbon dioxide (SC-CO2) extractions and tested in skin equivalent tissues. The ethanolic extract (rich in germana-ism B) increased pigmentation, while the chloroform extract (higher in iriflorental and iripallidal) decreased it. The SC-CO₂ extract, with minimal germanaism B and enriched iriflorental and iripallidal, showed stronger depigmenting effect. This study is the first to report that rhizome of Iris florentina L. contains phytochemicals with opposing effects on melanogenesis. Through different extraction processes, targeted extracts from a single bo-tanical can address both hyper- and hypopigmentation, offering a novel approach to pig-mentation modulation.
Keywords:
Iris florentina
; melanogenesis
; skin pigmentation
; bioassay-directed (guided) fraction
; LC-MS
; extraction
1. Introduction
Skin pigmentation varies widely in human populations due to the presence of a chemically inert pigment called melanin. The melanin is produced deep inside the skin and deposited in a mosaic manner at the surface of the skin [1,2], in which both the amount and distribution of melanin are responsible for skin color variation [3]. Besides its role in defining ethnicity and geographical origins of people, melanin has an essential function in protecting skin against ultraviolet (UV) radiation [4]. Although the melanin is critical for providing a self-defense mechanism against harmful environmental factors, there have been many studies on regulating the synthesis and transfer of melanin to ameliorate aesthetic problems caused by hyper- or hypo-pigmentation of the skin [5,6,7]. The regulation of melanin synthesis is incredibly intricate, yet it has become an important strategy across skincare, dermatology, and pharmaceutical industries, driving the development of products that help reduce unwanted skin pigmentation [8]. Growing commercial interest in skin pigmentation modulation has also led to a diverse market for both skin darkening and lightening products.
Skin darkening is often desirable to improve appearance or create a more even skin tone. Tanning, commonly achieved through UV exposure, increases skin darkening but also accelerates skin aging and raises the risk of skin cancer. [9,10]. Therefore, the ability to generate darker skin tone without incurring photo-damage has led to development of “self-tanning” applications [11]. DHA-based products and bronzers are widely used to give the appearance of a tan without affecting actual pigmentation [12]. Other strategies involve stimulating melanin production through melanogenesis pathways using synthetic or natural agents. For example, afamelanotide activates the α-MSH/MC1R pathway [13], while SIK inhibitors boost MITF and TRPM1 independently [14]. Compounds like forskolin and IBMX enhance melanin synthesis by modulating cAMP signaling downstream of α-MSH/MC1R [15,16,17]. Many darkening agents were also isolated from numerous plant sources such as Glycyrrhiza glabra, Vigna angularis, citrus plants, etc., which induce melanogenesis by stimulating melanogenic protein expression and pathways in both in vitro or in vivo systems [2,18].
On the other end of the spectrum, skin lightening products are commercially available for cosmetic purposes to achieve a lighter skin tone and are widely used to address hyper-pigmentary conditions such as melasma, dark spots, and solar lentigo [19,20]. As skin pigmentation is mainly determined by the content of melanin in melanosomes and the distribution of melanosomes in keratinocytes, the down-regulation of melanogenesis and melanosome transfer to keratinocytes are often contemplated as primary targets for skin lightening agents [21]. Tyrosinase, a rate-limiting enzyme in melanin synthesis, is a key target for many inhibitors, including hydroquinone [22], L-ascorbic acid [23], kojic acid [24], arbutin [25], azelaic acid [26], ellagic acid [27], tranexamic acid [28], resorcinol derivatives [29]. In addition, melanosome transfer inhibitors such as protease-activated receptor 2 (PAR-2) inhibitors [30], niacinamide [31], and cytidine [6,32] have demonstrated skin lightening effects without impacting melanin synthesis.
In some cultures, a tanned skin tone is considered desirable, while in others, a lighter skin tone is traditionally associated with beauty [33]. Along with an increased demand for plant-based ingredients in the last few decades, there is an opposing trend that rejects synthetic counterparts in the beauty industry. Iris florentina L., a white flowered variant of Iris germanica, is distributed predominantly in European countries, including France, Spain, and Italy. Its rhizome, commonly known as the orris root have been used as a perfume ingredient [34]. Although several norisoprenoids have been isolated from Iris florentina L., there has not been much systemic phytochemical and biological activity studies in a realm of dermatology, especially in skin pigmentation [35,36]. In this context, we report for the first time [37] that extracts of Iris florentina L. rhizome demonstrated the dual effects on melanogenesis, showing both stimulatory and inhibitory effects. Specifically, we identified germanaism B as a melanin synthesis inducing compound and iriflorental and iripallidal as melanogenesis inhibiting agents. These results suggest that extracts from Iris florentina L. rhizome may be a versatile botanical resource for development as both skin lightening and darkening agents.
2. Results and Discussion
2.1. Phytochemical Analysis
For screening purposes, metabolites were isolated from dried Iris florentina L. rhizome by two different extraction methods: (A) using 70:30 ethanol:water and (B) using chloroform. Each method was selected for the ability to extract hydrophilic or lipophilic constituents, respectively. Both extracts were analyzed by LC-MS to characterize their phytochemical composition. Analysis revealed the presence of many compounds, and the ten most abundant peaks common to both extracts were characterized. These consisted primarily of flavonoids, including various isoflavones and their glycosides. Identification was based on chromatographic retention time, UV-Vis spectrum, and mass spectrum of each peak. Accurate mass analysis was also performed to verify elemental composition within 5ppm mass error.
The identified compounds include Irisolone 4′-O-diglucoside, Iridin, Germanaism A, Germanaism B, Irilone 4′-O-glucoside, Irisolidone 7-O-glucoside, Irigenin, Irisolidone, Iriflorental, and Iripallidal (Figure 1 and Table 1). Some of these compounds have been reported to exhibit biological activities such as antioxidant, α-amylase inhibitory, and antimicrobial effects [38,39,40]. However, the biological activities of several of these compounds remain largely uncharacterized and require further investigation. Figure 1 shows the chromatograms of the 70:30 ethanol:water extract (A) and the chloroform extract (B). As illustrated, the 70:30 ethanol:water extract predominantly yielded more abundant hydrophilic compounds and did not show peaks corresponding to Iriflorental (9) and Iripallidal (10), which are more lipophilic. In contrast, these lipophilic compounds were clearly observed in the chloroform extract, which contained fewer, less abundant hydrophilic constituents. The identified compounds are listed in Table 1.
2.2. Identification of Melanogenesis-Modulating Phytochemicals via Bioassay-Direct Fractionation
Bioassay directed fractionation (BDF) is a common technique for fractionation of crude plant extracts and determination of bioactivity for collected fractions [41]. Active fractions can then be more fully characterized by instrumental analysis. To identify phytochemicals in the rhizome of Iris florentina L. that influence melanogenesis, 90:10 ethanol:water extract was first separated using a reverse-phase HPLC system fitted with orthogonal detectors and the chromatographic effluent then directed to a fraction collector having a 96-well plate. Fractions were subsequently dried and tested for their effects on melanogenesis using mouse B16/F10 melanoma (B16) cells, with melanogenesis stimulated by 50 nM of α-MSH. B16 cells are a sensitive and reliable platform for screening small molecules that modulate melanogenesis. Figure 2 presents the alignment of LC-MS chromatographic data Figure 2A) with bioassay results from % pigmentation (Figure 2B) normalized by cell viability. This comparison reflects the relative melanin content and melanogenic activity across the collected fractions. A prominent chromatographic peak at a retention time of 13.56 minutes, corresponding to fraction 41-43, showed increased melanogenesis activity and was identified as germanaism B (3). In contrast, fractions 90 and 93, eluting at 29.67 and 30.49 minutes were identified as Iriflorental (9) and Iripallidal (10), respectively, and showed inhibitory effects on melanin production. The chemical structures of germanaism B, iriflorental, and iripallidal are shown in Figure 3.
2.3. Confirmation of Melanogenesis-Modulating Activity of Purified Phytochemicals
To validate the melanogenesis-stimulating and -inhibiting effects of the compounds identified above, purified germanaism B and iriflorental, were tested in B16 melanoma cells. Figure 4 presents the percentage of pigmentation following treatment with various concentrations of the compounds. Germanaism B exhibited a clear, dose-dependent stimulatory effect on melanogenesis (Figure 4), increasing pigmentation by 53.6% and 62.3% at concentrations of 50 and 16.67 μg/ml, respectively. In contrast, iriflorental showed strong inhibitory activity on melanin production at all tested concentrations. At 50 and 16.67 μg/ml, it reduced pigmentation to 44.4% and 42.7%, respectively, compared to the vehicle control (set at 100%). Notably, its inhibitory effect at these concentrations even surpassed that of the reference compound, phenylthiourea (PTU) at 50 μM. Unfortunately, iripallidal could not be evaluated due to challenges in purification. No cytotoxicity was observed for either compound at any of the tested concentrations (data not shown). These findings confirm that the rhizome of Iris florentina L. contains phytochemicals with opposing effects on melanogenesis, distinguished by their differing hydrophilic and lipophilic properties. This clear contrast in both bioactivity and solvent solubilities highlights the potential to selectively fractionate the extract into components with either stimulatory or inhibitory effects on melanogenesis, offering opportunities for targeted applications in opposite directions.
2.4. Evaluation of Hydrophilic and Lipophilic Extracts on Melanin Synthesis in 3D Skin Equivalent Models.
To evaluate the effect of extract solubility on melanogenesis, 70:30 ethanol:water and chloroform extracts were tested using 3D skin equivalent tissues, MelanoDerm™ (MEL). MEL is a three-dimensional human skin tissue model that serves as a physiologically relevant alternative to animal testing, which is prohibited in many countries. This tissue consists of normal primary epidermal keratinocytes and melanocytes derived from a highly pigmented donor, seeded at a 10:1 ratio to closely mimic native human skin architecture. It is designed to promote melanin synthesis during the maintenance period and is used to evaluate the effects of test articles on melanogenesis.
The extracts were topically applied to the skin tissues on alternate days over a three-week period at concentrations of 4% and 2% (w/w), respectively. On the last day of treatment, melanin contents were quantified, and top-view images of the tissues were taken to visually assess pigmentation (Figure 5). 70:30 ethanol:water extract increased melanin content by 22.6% and 13.9% when treated at 4% (w/w) and 2% (w/w), respectively. In contrast, 4% (w/w) treatment of chloroform extract decreased melanin content to 82.6% compared to vehicle control (100%). Macroscopic topical images of the tissues revealed visible differences in pigmentation after treatment. The 70:30 ethanol:water extract darkened the tissues, whereas the chloroform extract lightened them compared to the vehicle control, which is consistent with their respective effects on melanin content. As demonstrated by UV-HPLC (Figure 1) and BDF assay results (Figure 3), the two extracts are chemically distinct: the 70:30 ethanol:water extract is enriched in germanaism B, a compound known to stimulate melanin production, while the chloroform extract contains higher levels of iriflorental and iripallidal, both recognized inhibitors of melanogenesis. These results clearly indicate that different extraction processes, based on solvent polarity and solubility, can effectively separate melanogenesis-stimulating and -inhibiting compounds from the plant, enabling targeted approaches for different pigmentary conditions.
As chloroform is classified as a carcinogen and prohibited in topical applications due to its toxicity, supercritical CO₂ (SC-CO₂) extraction was adopted as a safer and environmentally friendly alternative. This method efficiently isolates lipophilic bioactive compounds from the plant without leaving harmful solvent residues. As shown in Figure 6, treatment with the SC-CO₂ extract at 0.2% (w/w) reduced melanin content to 77.8% relative to the vehicle control (100%). A top-view image of the tissues confirmed a visible reduction in pigmentation following treatment. These findings suggest that the SC-CO₂ extract achieved superior skin-lightening efficacy compared to the chloroform extract, despite being applied at a 20-fold lower concentration (0.2% vs. 4%, w/w). This enhanced performance is likely attributed to a greater yield of active lipophilic compounds. LC-UV and LC-MS chromatograms (Figure 7) show that the SC-CO₂ extract contained substantially reduced levels of germanaism B and was enriched in iriflorental and iripallidal. Kojic acid, used as a positive control, also significantly reduced melanin content, supporting the validity of the study. No cytotoxicity was observed with either extract treatment (data not shown). Overall, these results demonstrate that distinct extraction processes of Iris florentina L. rhizome, optimized for hydrophilic or lipophilic compound isolation, can yield bioactives with differential effects on skin pigmentation, while offering safer and more sustainable options for topical applications.
3. Materials and Methods
3.1. Plant Material and Authetication
Iris ×germanica L. var. florentina Dykes (often referred to as Iris florentina) is a variety within the Iris ×germanica L. species. Iris florentina L. rhizomes were sourced from a commercial nursery (Companion Plants, Athens, Ohio) then grown and harvested in Amway-owned Trout Lake Farm-East located in Ephrata, WA, USA using organic farming practices. Verification of plant morphology characteristics was made using benchmarks provided by the American Iris Society to help authenticate as Iris florentina L. when flower presented in the field. However, as current chemical test (such as HPTLC) and genetic (DNA) test did not conclusively differentiate Iris florentina from other Iris germanica varieties. A further comparative investigation using whole genome sequencing was conducted by collaborating with NSF International (Petaluma, CA, USA). Chloroplast DNA sequences were used to locate single nucleotide polymorphisms (SNPs) for several different non-florentina Iris germanica cultivars and Iris florentina specimens. Twenty-one positions were initially identified in an algorithmic search, and eleven were confirmed by observation. Primers were developed for five of these sequences and used for DNA testing. Of these, three SNPs successfully differentiated Iris florentina specimens from other non-florentina Iris germanica varieties tested.
3.2. Extraction
Rhizomes of Iris Florentina L. were harvested from the field and washed with water. After washing, hairy roots were manually removed using hand clippers. The rhizomes were then sliced into 2–5 mm thick sections using a kitchen knife until the majority of the rhizome tissue was separated from the plant and air-dried and milled to a fine powder.
Chloroform and hydroethanolic extracts (70:30 and 90:10 ethanol:water, v/v) were prepared. Hydroethanolic solvents were prepared by mixing ethanol with distilled water in the appropriate ratios. Dried plant material (50 g) was added to 300 mL of each solvent in separate flasks and stirred overnight at room temperature. The mixtures were then filtered through Whatman No. 1 filter paper, and the filtrates were concentrated under reduced pressure using a rotary evaporator. The collected extract was dried, stored at -80 °C, and later dissolved in DMSO at a concentration of 10 mg/mL for future use.
SC-CO₂ extraction was performed using a Waters MV-10 ASFETM System. A 25mL vessel was loaded with 13g of dried and ground plant material. The extraction was conducted at a constant temperature of 55°C and a pressure of 100 bar for 15 minutes. A flow rate of 8 ml/min CO₂ and 2 ml/min ethanol cosolvent was used. Following the extraction, the system was depressurized gradually to atmospheric pressure. The collected extract was then dried, stored at –80 °C, and subsequently dissolved in DMSO at a concentration of 10 mg/mL for future use.
3.3. Reagents
Water, acetonitrile, and isopropanol were Optima LC-MS grade from Fisher Scientific. Formic Acid was LC-MS grade from Sigma-Aldrich (St. Louis, Missouri, USA). Mobile phase solvents were prepared as 0.1% formic acid solutions in water (Solvent A) or acetonitrile (Solvent B). DMSO was HPLC grade from Fisher Scientific (Pittsburgh, Pennsylvania, USA). Germanaism B and iriflorental reference standards were isolated from methanol extracts of Iris florentina L. rhizome by the Center for Natural Products Research, University of Mississippi, with structural confirmation by 1H and 13C NMR, and high-resolution mass spectrometry.
3.4. Instrumentation
LC-MS analyses and BDF were performed using a Waters Synapt G2 instrument equipped with an Acquity H-class UPLC. Effluent from column was directed to a Photodiode Array Detector (PDA), and subsequently to the electrospray (ES) ionization source of the mass spectrometer. UV data was acquired from 200-800 nm at 1.2 nm resolution at a sampling rate of 5 scans/sec. Mass spectral data was collected in both positive and negative ion modes at 20,000 resolving power (FWHM) from m/z 50-1200 at 0.25 scans/s. Within each run, alternating low energy (4V) and high energy (20V) collision induced dissociation scans were collected, using argon as collision gas (MSe mode). Leucine-enkephalin was used as the lock mass for accurate mass analysis. For presentation, data were displayed as either UV-Vis total wavelength chromatograms (sum of all acquired wavelength intensities) or high resolution MS selected ion monitoring mass chromatograms.
3.5. LC-MS Analysis
Sample extracts were prepared at 10 mg/mL in DMSO and sonicated for 20 min to solubilize. Process samples were diluted 1:10 in isopropanol. All samples were filtered through a 0.2 µm Whatman Anotop 25 syringe filter into autosampler vials for assay. The column was a Waters Acquity HSS T3, 1.8 µm, 2.1 X 100 mm and the column oven was maintained at 40˚C. The solvent program was ramped linearly as follows: 90%A / 10%B at time 0, to 100%B at 6 min, hold at 100%B to 8 min, then to 90%A / 10%B at 8.01 min, and hold at 90%A / 10%B for 10 min. A flow rate of 0.4 ml/min and an injection volume of 2 µL were used. Tentative identification of compounds was based on both the UV-Vis spectrum and mass spectrum of each peak compared to authenticated reference standards or on-line spectral databases. Accurate mass analyses of ions were performed to within 5ppm for elemental composition verification.
3.6. Bioassay Directed Fractionation
Sample extracts were prepared at 50mg/mL in DMSO and sonicated for 20min. Samples solutions were then filtered through 0.2µm Whatman Anotop 25 syringe filter into autosampler vials for assay. The LC-MS system was modified to incorporate a 10:1 splitter that was positioned between the UV detector and MS ion source. The majority of LC effluent was directed to a Waters Fraction Collector II fitted with a 96-deep well plate into which fractions were collected by time at intervals of 20 sec/well for the first 32 minutes of each run (96 wells/run). The LC column used for BDF was a XBridge Shield RP18, 5µm, 4.6 X 250mm maintained at ambient temperature (22˚C). The solvent program was ramped linearly as follows: 95%A / 5%B at time 0, to 100%B at 30min, hold at 100%B to 32min, then to 95%A / 5%B at 32.1min and hold 95%A / 5%B until 36min. The flow rate was 0.8 mL/min and an injection volume of 10 µL/injection was used (0.5 mg solids/injection). Effluent from four consecutive LC runs was collected per plate (2 mg solids/plate). Plates were then dried under nitrogen at 40˚C to remove acetonitrile and residual water was removed by freeze drying. Plates were stored at -80˚C until ready to assay for pigmentation response.
3.7. Cell Culture
B16-F10 (B16) cells obtained from ATCC (Manassas, Virginia, USA) were cultured at 37 °C in a humidified incubator with 95% air and 5% CO₂. Cells were maintained in Dulbecco’s Modified Eagle’s Medium (DMEM) containing 4.5 g/L glucose, L-glutamine, and sodium pyruvate, supplemented with 10% fetal bovine serum (FBS) and 1% penicillin-streptomycin (100×). Subculturing was performed in T75 flasks every three to four days, ensuring confluency did not exceed 70% to maintain consistent growth. All experiments were conducted using cells between passages four and six [42].
3.8. Melanin Contents of B16 Cells
B16 cells (6000 cells/well) were pre-cultured in 96-well plates in DMEM medium supplemented with 10% FBS and 1% P/S for 24 hours. For treatments, cells were treated with the vehicle or the testing articles in 0.2 ml DMEM-phenol free medium supplemented with 10% FBS, 1% P/S, 2 mM L-glutamine, and 50 nM α-MSH (Sigma-Aldrich; St. Louis, Missouri, USA) for 96 hours. The absorbance at 405 nm was measured, and 3-(4,5-dimethylthiazol-2-yl)-2,5-diphenyltetrazolium bromide (MTT) assay was performed to examine the viability of cells [43,44]. The percentage of pigmentation was determined by normalizing the optical density (O.D) to the percentage of cell viability.
3.9. Skin Equivalent Tissue Maintenance and Treatment
The MelanoDerm™ (MEL) skin equivalents (Mattek Corp; Ashland, Massachusetts, USA) derived from African-American skin (MEL-B) were placed in an incubator containing 5% CO2 at 37oC. The tissues were maintained in the LLMM medium. The testing articles were dissolved in vehicle control solution (90% PBS + 5% EtOH + 5% Propylene glycol) at desired concentrations. After 3 hours of incubation, 25 μL of vehicle control, positive control, and the testing articles were applied topically to the skin equivalents every other day for three weeks. The tissues were washed with PBS between the treatments and replenished with 5 ml of fresh media every other day. On the final day, tissues were collected for visual analysis, melanin extraction, and cytotoxicity assessment. An MTT assay was performed to evaluate tissue viability. [7,45]
3.10. Melanin Content of Skin Equivalent Tissue
Melanin content in treated MEL-B was determined as previously reported [46]. Briefly, the frozen tissues were immersed in 0.38 ml of 1% SDS, 50 μM EDTA, and 10 mM Tris, pH 6.8, and 20 μl of protease K was added at 5 mg/ml. Digestion proceeded overnight at 45°C, and an additional 20 μl of protease K was added for an additional 4 hours of incubation. Then, 40 μl of 500 mM sodium carbonate and 10 μl of 30% H2O2 were added to the homogenates. The samples were incubated at 80°C for 30 min and cooled to room temperature. Chloroform/ methanol (2:1) mixture was prepared and 100 μl was added to each sample. After centrifugation at 10,000g for 30 min, top phases were collected, and the optical density was measured at 450 nm. Synthetic melanin (Sigma-Aldrich; St. Louis, MO, USA) was subjected to the same procedure as a control, and a standard curve was constructed
4. Conclusions
There is a growing global demand for safe and effective solutions to modulate skin pigmentation, driven by both aesthetic preferences and medical needs. While some individuals seek to lighten hyperpigmented areas or achieve a brighter complexion, others desire darker skin tones or treatment for hypopigmented conditions. This study aimed to investigate the effects of extracts from the rhizome of Iris florentina L. (orris root) on its ability to modulate melanogenesis. The BDF results demonstrated that the more hydrophilic fraction of the plant extract, which contains germanaism B, stimulated melanogenesis, while the more lipophilic fraction, enriched with iriflorental and iripallidal, inhibited melanin synthesis. These findings support a practical strategy for developing extracts that selectively separate these compounds, enabling targeted applications to either promote or suppress skin pigmentation. The hydrophilic fraction, obtained using a 70:30 ethanol:water extraction, was enriched with germanaism B and significantly stimulated melanin production in a 3D skin equivalent model. In contrast, the lipophilic fraction, extracted using chloroform and SC-CO₂ methods, was enriched with iriflorental and iripallidal resulted in a clear reduction of melanin content. Notably, the supercritical CO₂ extract achieved comparable depigmenting effects at a 20-fold lower concentration than the crude chloroform extract, while avoiding the use of toxic solvents. These results suggest that Iris florentina L. rhizome is a promising botanical source for developing both skin-darkening and skin-lightening agents, depending on the extraction strategy employed. This dual functionality highlights the feasibility of creating differentiated skincare or dermatological products from a single botanical origin. Future studies should aim to elucidate the mechanisms by which germanaism B promotes, and iriflorental and iripallidal inhibit, melanogenesis. A better understanding of these mechanisms could support the identification of additional agents from distinct sources that act through different pathways, potentially enabling synergistic combinations with germanaism B, iriflorental, or iripallidal for enhanced regulation of melanogenesis. In parallel, the effects of other phytochemicals identified in this study (Figure 1 and Table 1) should be further explored, as several compounds have demonstrated preliminary bioactivity, yet their potential skin health benefits remain largely unknown. Finally, efforts should be directed toward developing alternative, scalable, and cost-effective extraction methods, as current supercritical CO₂ systems can be resource intensive. Establishing a unified extraction protocol capable of yielding both active fractions would further streamline ingredient production and improve commercial feasibility.
5. Patents
A patent application related to this work has been filed under the Patent Cooperation Treaty: Application No. PCT/US2022/031882.
Author Contributions
Conceptualization, S.Y., L.R., S.M., D.S. and S.B.; methodology, S.Y., L.R., S.M., D.S. and X.L.; validation, ,S.Y., L.R., S.M., D.S., X.L. and S.B.; formal analysis, S.Y., L.R., S.M., D.S., X.L., and S.B.; investigation, S.Y., L.R., S.M., D.S., X.L. and S.B.; resources, S.Y., L.R., S.M., D.S. X.L. and S.B.; data curation, S.Y., L.R., S.M., D.S., and X.L.; writing—original draft preparation, S.Y.; writing—review and editing, S.Y., L.R., S.M., D.S., X.L., and S.B; visualization, S.Y., L.R., S.M., and D.S.; supervision, S.Y., L.R., S.M, S.B..; project administration, S.Y., S.B.; funding acquisition, S.Y., L.R., S.M., and S.B. All authors have read and agreed to the published version of the manuscript.
Funding
This research received no external funding.
Institutional Review Board Statement
Not applicable.
Informed Consent Statement
Not applicable.
Data Availability Statement
The data presented in this study are available on request from the corresponding author due to company confidentiality policies and internal data handling procedures, and may be shared with permission from the company.
Acknowledgments
We thank Dr. Ikhlas A. Khan (University of Mississippi, USA) for kindly providing purified germanaism B and iriflorental used in this study. During the preparation of this manuscript, the authors utilized ChatGPT-4o-mini to assist with language editing and polishing in selected sections. The authors have reviewed and edited the output and take full responsibility for the content of this publication.
Conflicts of Interest
The authors declare no conflicts of interest.
Abbreviations
The following abbreviations are used in this manuscript:
| SC-CO2 | Supercritical carbon dioxide |
| LC | Liquid chromatography |
| MS | Mass spectrometry |
| UV | Ultraviolet |
| DHA | Dihydroxyacetone |
| α-MSH | Alpha melanocyte-stimulating hormone |
| MC1R | Melanocortin 1 receptor |
| SIK | Salt-inducible kinase |
| MITF | Microphthalmia-associated transcription factor |
| TRPM1 | Transient receptor potential cation channel subfamily M member 1 |
| IBMX | 3-isobutyl-1-methylxanthine |
| cAMP | Cyclic adenosine monophosphate |
| PAR-2 | Protease-activated receptor 2 |
| UV-Vis | Ultraviolet-Visible |
| BDF | Bioassay directed fractionation |
| HPLC | High-performance liquid chromatography |
| PTU | Phenylthiourea |
| MEL | MelanoDerm™ |
| MEL-B | MelanoDerm™ derived from African American skin |
| HPTLC | High-performance thin-layer chromatography |
| SNPs | Single nucleotide polymorphisms |
| DMSO | Dimethyl sulfoxide |
| NMR | Nuclear magnetic resonance |
| DMEM | Dulbecco’s modified eagle’s medium |
| FBS | Fetal bovine serum |
| MTT | 3-(4,5-dimethylthiazol-2-yl)-2,5-diphenyltetrazolium bromide |
References
- Costin, G.E.; Hearing, V.J. Human skin pigmentation: melanocytes modulate skin color in response to stress. FASEB journal : official publication of the Federation of American Societies for Experimental Biology 2007, 21, 976–994. [Google Scholar] [CrossRef]
- Ali, S.A.; Naaz, I.; Zaidi, K.U.; Ali, A.S. Recent Updates in Melanocyte Function: The Use of Promising Bioactive Compounds for the Treatment of Hypopigmentary Disorders. Mini reviews in medicinal chemistry 2017, 17, 785–798. [Google Scholar] [CrossRef]
- Rees, J.L. The genetics of sun sensitivity in humans. American journal of human genetics 2004, 75, 739–751. [Google Scholar] [CrossRef]
- Alaluf, S.; Atkins, D.; Barrett, K.; Blount, M.; Carter, N.; Heath, A. Ethnic variation in melanin content and composition in photoexposed and photoprotected human skin. Pigment cell research 2002, 15, 112–118. [Google Scholar] [CrossRef]
- Horibe, I.; Satoh, Y.; Shiota, Y.; Kumagai, A.; Horike, N.; Takemori, H.; Uesato, S.; Sugie, S.; Obata, K.; Kawahara, H.; et al. Induction of melanogenesis by 4'-O-methylated flavonoids in B16F10 melanoma cells. Journal of natural medicines 2013, 67, 705–710. [Google Scholar] [CrossRef]
- Baswan, S.M.; Leverett, J.; Pawelek, J. Clinical evaluation of the lightening effect of cytidine on hyperpigmented skin. Journal of cosmetic dermatology 2019, 18, 278–285. [Google Scholar] [CrossRef]
- Baswan, S.M.; Yim, S.; Leverett, J.; Scholten, J.; Pawelek, J. Cytidine decreases melanin content in a reconstituted three-dimensional human epidermal model. Archives of dermatological research 2019, 311, 249–250. [Google Scholar] [CrossRef] [PubMed]
- Chan, C.F.; Huang, C.C.; Lee, M.Y.; Lin, Y.S. Fermented broth in tyrosinase- and melanogenesis inhibition. Molecules 2014, 19, 13122–13135. [Google Scholar] [CrossRef] [PubMed]
- D'Orazio, J.; Jarrett, S.; Amaro-Ortiz, A.; Scott, T. UV radiation and the skin. International journal of molecular sciences 2013, 14, 12222–12248. [Google Scholar] [CrossRef] [PubMed]
- Warthan, M.M.; Uchida, T.; Wagner, R.F., Jr. UV light tanning as a type of substance-related disorder. Archives of dermatology 2005, 141, 963–966. [Google Scholar] [CrossRef]
- Fu, J.M.; Dusza, S.W.; Halpern, A.C. Sunless tanning. Journal of the American Academy of Dermatology 2004, 50, 706–713. [Google Scholar] [CrossRef]
- Garone, M.; Howard, J.; Fabrikant, J. A review of common tanning methods. The Journal of clinical and aesthetic dermatology 2015, 8, 43–47. [Google Scholar] [PubMed]
- Hadley, M.E.; Dorr, R.T. Melanocortin peptide therapeutics: historical milestones, clinical studies and commercialization. Peptides 2006, 27, 921–930. [Google Scholar] [CrossRef] [PubMed]
- Patel, K.; Foretz, M.; Marion, A.; Campbell, D.G.; Gourlay, R.; Boudaba, N.; Tournier, E.; Titchenell, P.; Peggie, M.; Deak, M.; et al. The LKB1-salt-inducible kinase pathway functions as a key gluconeogenic suppressor in the liver. Nature communications 2014, 5, 4535. [Google Scholar] [CrossRef] [PubMed]
- Passeron, T.; Namiki, T.; Passeron, H.J.; Le Pape, E.; Hearing, V.J. Forskolin protects keratinocytes from UVB-induced apoptosis and increases DNA repair independent of its effects on melanogenesis. The Journal of investigative dermatology 2009, 129, 162–166. [Google Scholar] [CrossRef]
- Soderling, S.H.; Beavo, J.A. Regulation of cAMP and cGMP signaling: new phosphodiesterases and new functions. Current opinion in cell biology 2000, 12, 174–179. [Google Scholar] [CrossRef]
- McNaughton, B.R.; Gareiss, P.C.; Jacobs, S.E.; Fricke, A.F.; Scott, G.A.; Miller, B.L. A potent activator of melanogenesis identified from small-molecule screening. ChemMedChem 2009, 4, 1583–1589. [Google Scholar] [CrossRef]
- Rachmin, I.; Ostrowski, S.M.; Weng, Q.Y.; Fisher, D.E. Topical treatment strategies to manipulate human skin pigmentation. Advanced drug delivery reviews 2020. [Google Scholar] [CrossRef]
- Gillbro, J.M.; Olsson, M.J. The melanogenesis and mechanisms of skin-lightening agents--existing and new approaches. International journal of cosmetic science 2011, 33, 210–221. [Google Scholar] [CrossRef]
- Bae, Y.C.; Rettig, S.; Weiss, E.; Bernstein, L.; Geronemus, R. Treatment of Post-Inflammatory Hyperpigmentation in Patients With Darker Skin Types Using a Low Energy 1,927 nm Non-Ablative Fractional Laser: A Retrospective Photographic Review Analysis. Lasers in surgery and medicine 2020, 52, 7–12. [Google Scholar] [CrossRef]
- Smit, N.; Vicanova, J.; Pavel, S. The hunt for natural skin whitening agents. International journal of molecular sciences 2009, 10, 5326–5349. [Google Scholar] [CrossRef] [PubMed]
- Hashimoto, A.; Ichihashi, M.; Mishima, Y. [The mechanism of depigmentation by hydroquinone: a study on suppression and recovery processes of tyrosinase activity in the pigment cells in vivo and in vitro]. Nihon Hifuka Gakkai zasshi. The Japanese journal of dermatology 1984, 94, 797–804. [Google Scholar]
- Huang, C.H.; Sung, H.C.; Hsiao, C.Y.; Hu, S.; Ko, Y.S. Transdermal delivery of three vitamin C derivatives by Er:YAG and carbon dioxide laser pretreatment. Lasers in medical science 2013, 28, 807–814. [Google Scholar] [CrossRef]
- Goncalez, M.L.; Correa, M.A.; Chorilli, M. Skin delivery of kojic acid-loaded nanotechnology-based drug delivery systems for the treatment of skin aging. BioMed research international 2013, 2013, 271276. [Google Scholar] [CrossRef] [PubMed]
- Maeda, K.; Fukuda, M. Arbutin: mechanism of its depigmenting action in human melanocyte culture. The Journal of pharmacology and experimental therapeutics 1996, 276, 765–769. [Google Scholar] [CrossRef]
- Breathnach, A.C.; Nazzaro-Porro, M.; Passi, S.; Zina, G. Azelaic acid therapy in disorders of pigmentation. Clinics in dermatology 1989, 7, 106–119. [Google Scholar] [CrossRef] [PubMed]
- Ortiz-Ruiz, C.V.; Berna, J.; Tudela, J.; Varon, R.; Garcia-Canovas, F. Action of ellagic acid on the melanin biosynthesis pathway. Journal of dermatological science 2016, 82, 115–122. [Google Scholar] [CrossRef]
- Tse, T.W.; Hui, E. Tranexamic acid: an important adjuvant in the treatment of melasma. Journal of cosmetic dermatology 2013, 12, 57–66. [Google Scholar] [CrossRef]
- Stratford, M.R.; Ramsden, C.A.; Riley, P.A. Mechanistic studies of the inactivation of tyrosinase by resorcinol. Bioorganic & medicinal chemistry 2013, 21, 1166–1173. [Google Scholar] [CrossRef]
- Seiberg, M.; Paine, C.; Sharlow, E.; Andrade-Gordon, P.; Costanzo, M.; Eisinger, M.; Shapiro, S.S. The protease-activated receptor 2 regulates pigmentation via keratinocyte-melanocyte interactions. Experimental cell research 2000, 254, 25–32. [Google Scholar] [CrossRef]
- Hakozaki, T.; Minwalla, L.; Zhuang, J.; Chhoa, M.; Matsubara, A.; Miyamoto, K.; Greatens, A.; Hillebrand, G.G.; Bissett, D.L.; Boissy, R.E. The effect of niacinamide on reducing cutaneous pigmentation and suppression of melanosome transfer. The British journal of dermatology 2002, 147, 20–31. [Google Scholar] [CrossRef]
- Diwakar, G.; Klump, V.; Lazova, R.; Pawelek, J. Evidence for glycosylation as a regulator of the pigmentary system: key roles of sialyl(alpha2-6)gal/GalNAc-terminated glycans in melanin synthesis and transfer. Glycoconjugate journal 2015, 32, 413–420. [Google Scholar] [CrossRef] [PubMed]
- Cheng, M.C.; Lee, T.H.; Chu, Y.T.; Syu, L.L.; Hsu, S.J.; Cheng, C.H.; Wu, J.; Lee, C.K. Melanogenesis Inhibitors from the Rhizoma of Ligusticum Sinense in B16-F10 Melanoma Cells In Vitro and Zebrafish In Vivo. International journal of molecular sciences 2018, 19. [Google Scholar] [CrossRef] [PubMed]
- Bicchi, C.; Joulain, D. A comprehensive review on essential oils and extracts from Iris rhizomes. Phytochemistry Reviews 2024. [Google Scholar] [CrossRef]
- Yokosuka, A.; Koyama, Y.; Mimaki, Y. Chemical Constituents of the Underground Parts of Iris florentina and their Cytotoxic Activity. Natural product communications 2015, 10, 955–958. [Google Scholar] [CrossRef]
- Krick, W.; Marner, F.-J.; Jaenicke, L. Isolation and Structure Determination of the Precursors of a-and y-Irone and Homologous Compounds from Iris pallida and Iris florentina. Zeitschrift für Naturforschung C 1983, 38, 179. [Google Scholar] [CrossRef]
- Rozga, L.A.; Tu, M.; Missler, S.R.; Yim, S.; Mulder, T.; Solberg, R.; Smith, A.; Baswan, S. Orris root extracts, compositions, and methods for skin applications. 2024/07/25 2024.
- Schutz, C.; Quitschau, M.; Hamburger, M.; Potterat, O. Profiling of isoflavonoids in Iris germanica rhizome extracts by microprobe NMR and HPLC-PDA-MS analysis. Fitoterapia 2011, 82, 1021–1026. [Google Scholar] [CrossRef]
- Hoang, L.; Benes, F.; Fenclova, M.; Kronusova, O.; Svarcova, V.; Rehorova, K.; Svecova, E.B.; Vosatka, M.; Hajslova, J.; Kastanek, P.; et al. Phytochemical Composition and In Vitro Biological Activity of Iris spp. (Iridaceae): A New Source of Bioactive Constituents for the Inhibition of Oral Bacterial Biofilms. Antibiotics (Basel) 2020, 9. [Google Scholar] [CrossRef]
- Ibrahim, S.; Al-Ahdal, A.; Khedr, A.; Mohamed, G. Antioxidant α-amylase inhibitors flavonoids from Iris germanica rhizomes. Revista Brasileira de Farmacognosia 2017, 27, 170–174. [Google Scholar] [CrossRef]
- Abubakar, A.R.; Haque, M. Preparation of Medicinal Plants: Basic Extraction and Fractionation Procedures for Experimental Purposes. J Pharm Bioallied Sci 2020, 12, 1–10. [Google Scholar] [CrossRef]
- Chang, N.F.; Chen, Y.S.; Lin, Y.J.; Tai, T.H.; Chen, A.N.; Huang, C.H.; Lin, C.C. Study of Hydroquinone Mediated Cytotoxicity and Hypopigmentation Effects from UVB-Irradiated Arbutin and DeoxyArbutin. International journal of molecular sciences 2017, 18. [Google Scholar] [CrossRef] [PubMed]
- Yim, S.; Lee, J.; Jo, H.; Scholten, J.; Willingham, R.; Nicoll, J.; Baswan, S.M. Chrysanthemum Morifolium Extract And Ascorbic Acid-2-Glucoside (AA2G) Blend Inhibits UVA-Induced Delayed Cyclobutane Pyrimidine Dimer (CPD) Production In Melanocytes. Clinical, cosmetic and investigational dermatology 2019, 12, 823–832. [Google Scholar] [CrossRef] [PubMed]
- Fotakis, G.; Timbrell, J.A. In vitro cytotoxicity assays: comparison of LDH, neutral red, MTT and protein assay in hepatoma cell lines following exposure to cadmium chloride. Toxicology letters 2006, 160, 171–177. [Google Scholar] [CrossRef] [PubMed]
- Ni-Komatsu, L.; Tong, C.; Chen, G.; Brindzei, N.; Orlow, S.J. Identification of quinolines that inhibit melanogenesis by altering tyrosinase family trafficking. Molecular pharmacology 2008, 74, 1576–1586. [Google Scholar] [CrossRef]
- Takeyama, R.; Takekoshi, S.; Nagata, H.; Osamura, R.Y.; Kawana, S. Quercetin-induced melanogenesis in a reconstituted three-dimensional human epidermal model. Journal of molecular histology 2004, 35, 157–165. [Google Scholar] [CrossRef]
Figure 1.
UV-Vis total wavelength chromatograms of Iris florentina L. rhizome 70:30 ethanol:water extract (A) and chloroform extract (B) metabolite profile comparison. Numbered peaks are listed in Table 1.
Figure 1.
UV-Vis total wavelength chromatograms of Iris florentina L. rhizome 70:30 ethanol:water extract (A) and chloroform extract (B) metabolite profile comparison. Numbered peaks are listed in Table 1.
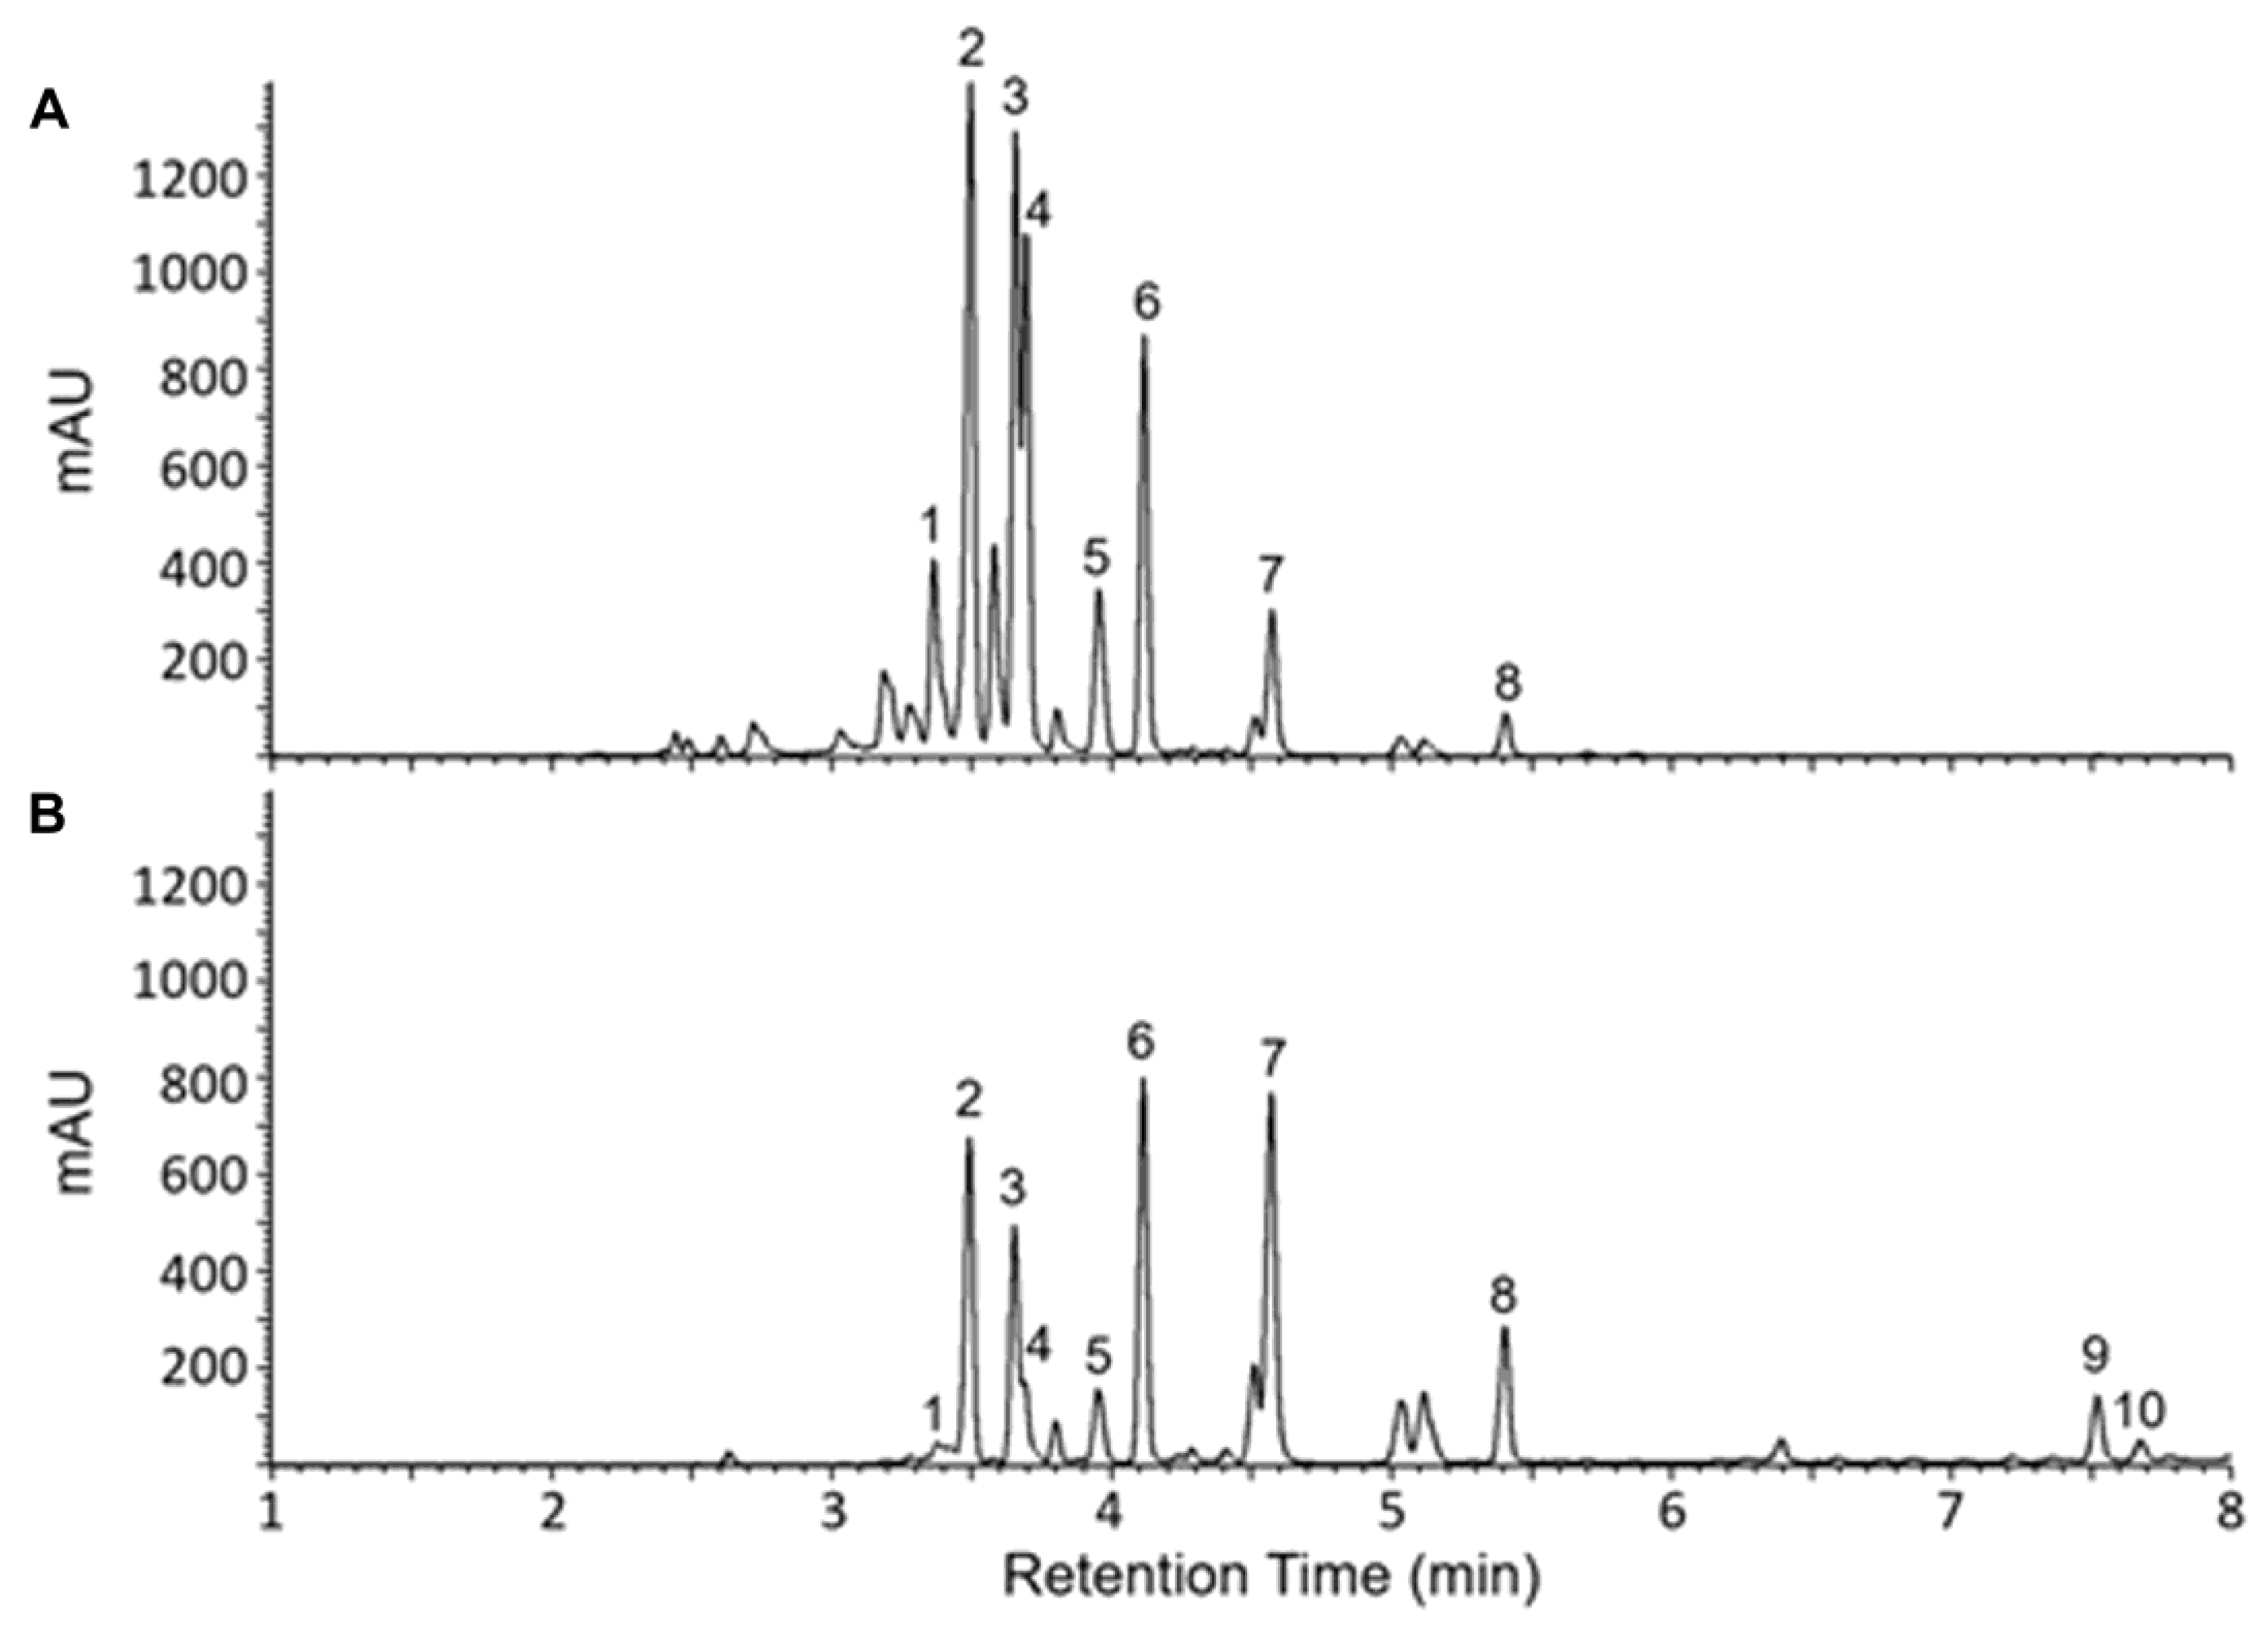
Figure 2.
BDF results for a 90:10 ethanol:water extract of Iris florentina L. rhizome. (A) LC-UV chromatogram at 260nm showing phytochemical peak profile. (B) time-aligned bar graph (each bar representing a fraction from the LC effluent collected for 20 seconds), showing pigmentation responses using B16 cell culture assay.
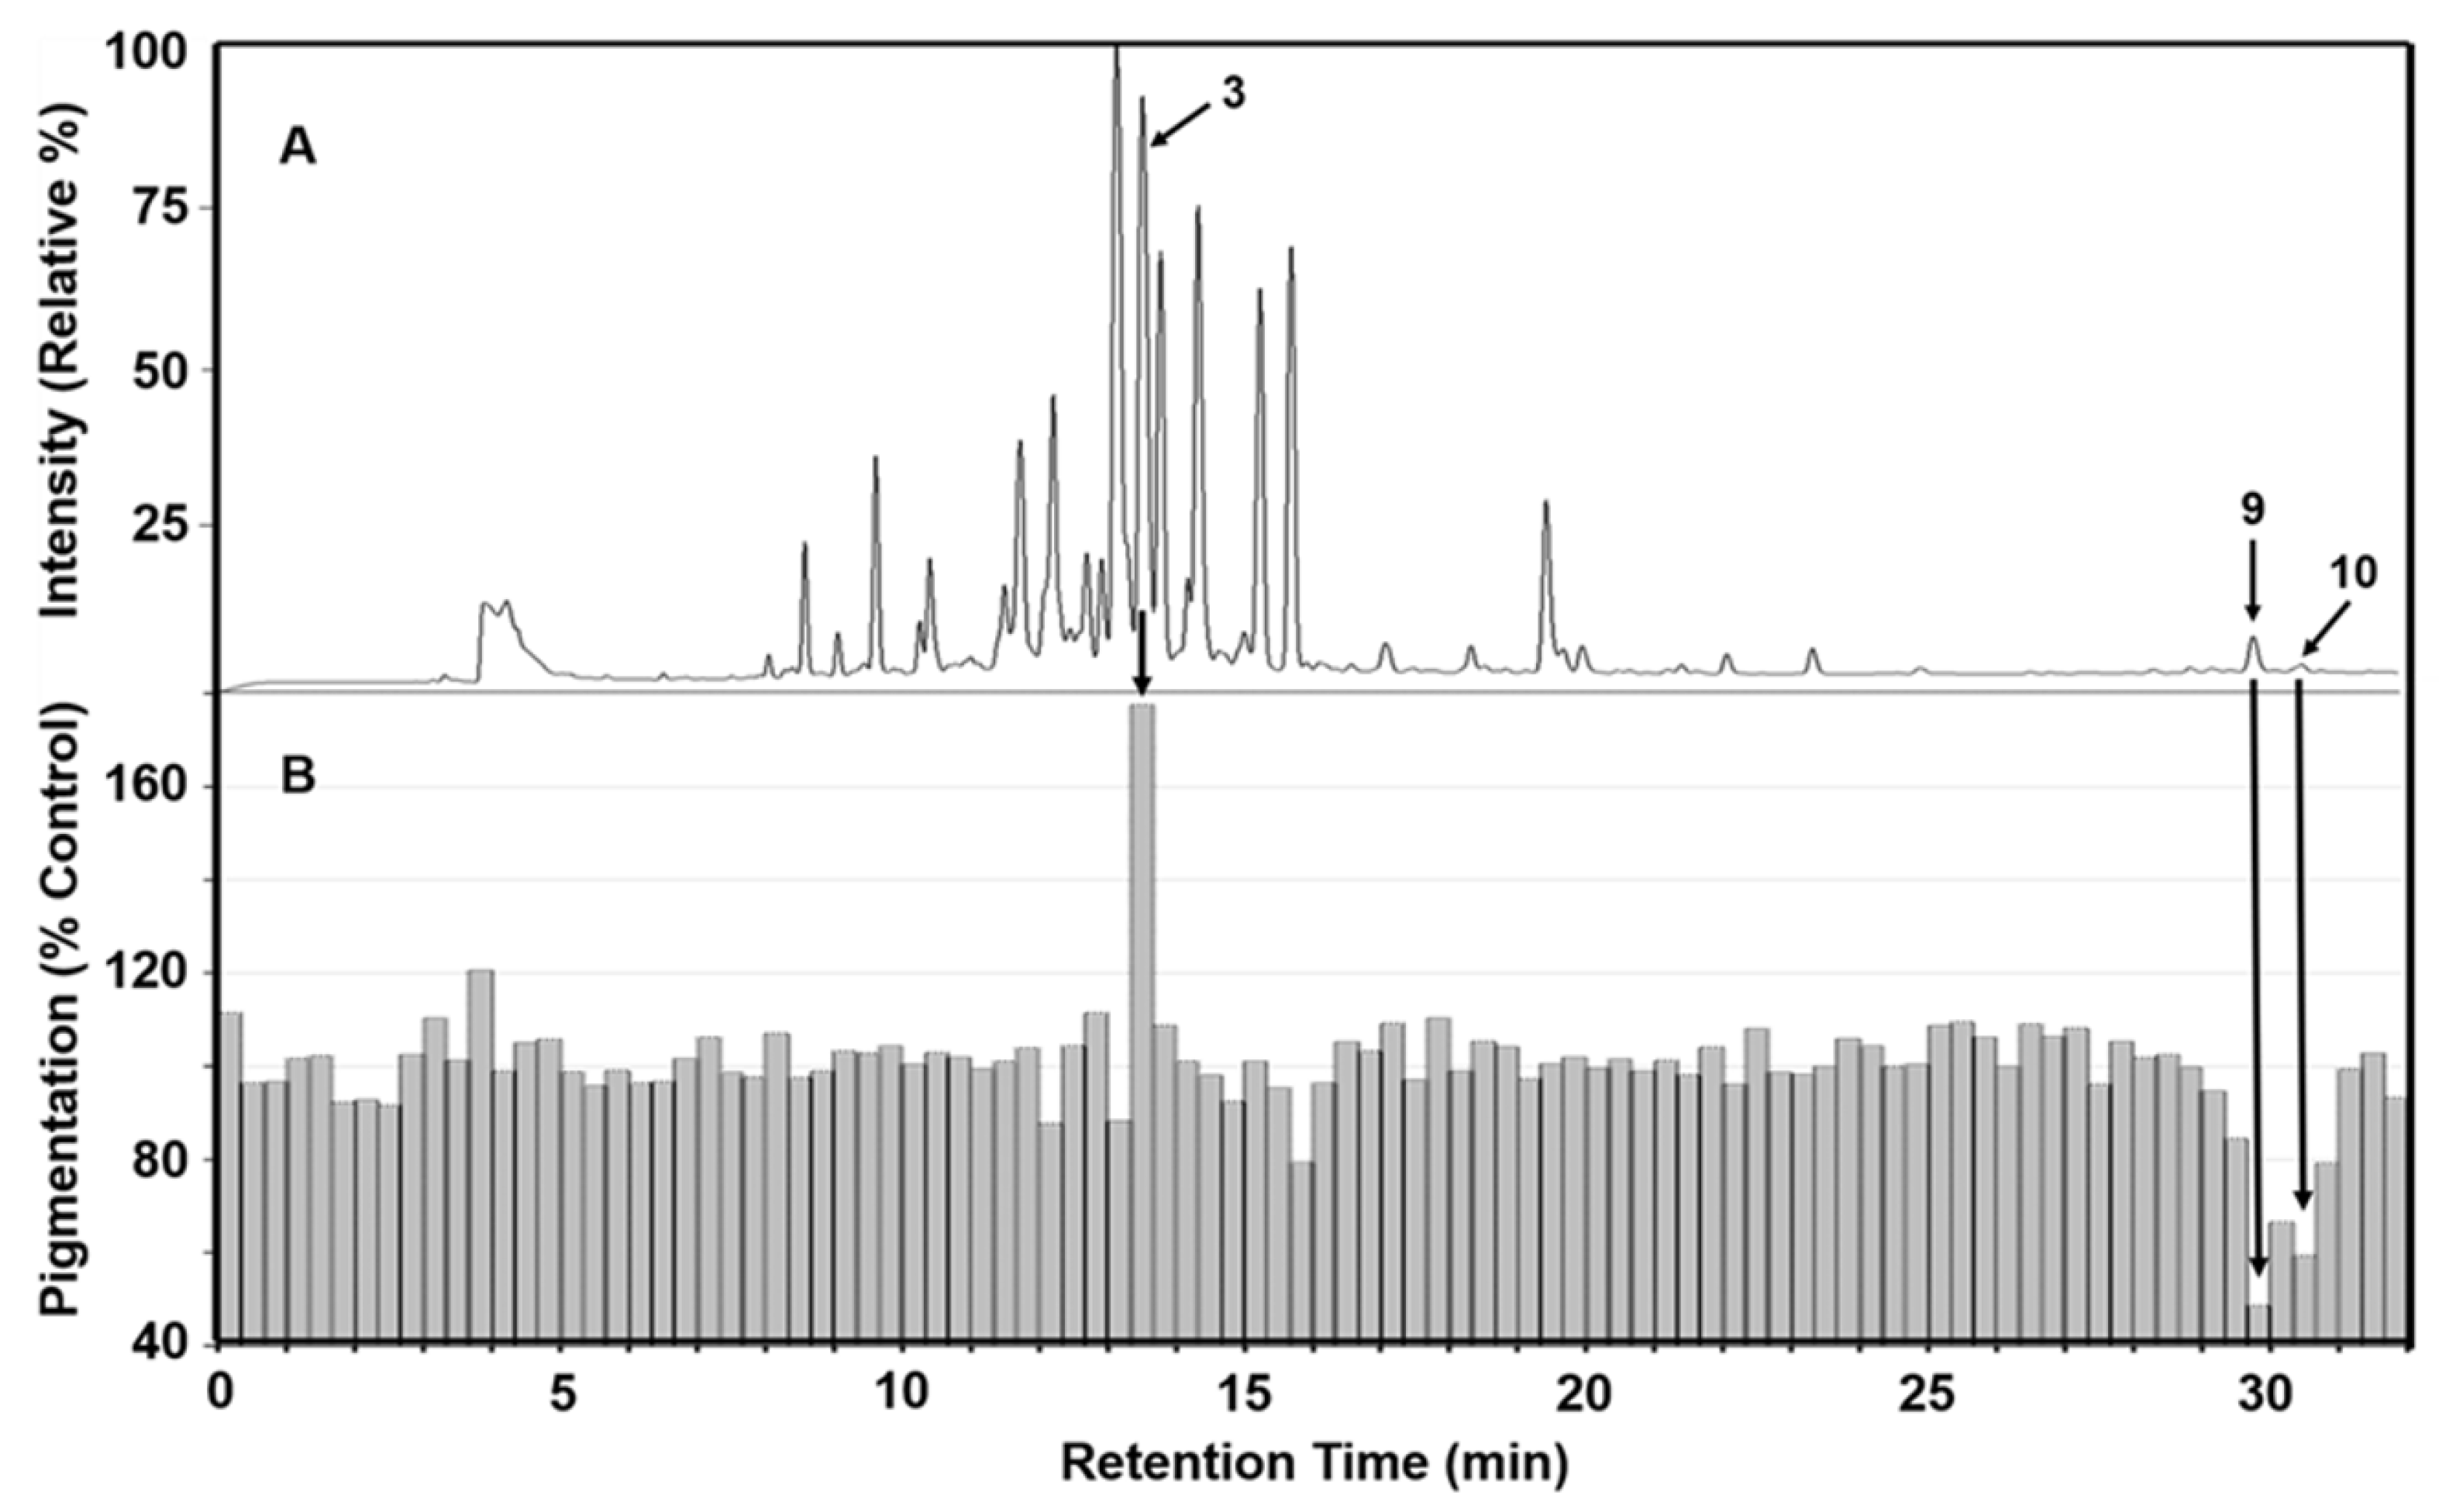
Figure 3.
Chemical structures of germanaism B, iriflorental, and iripallidal.
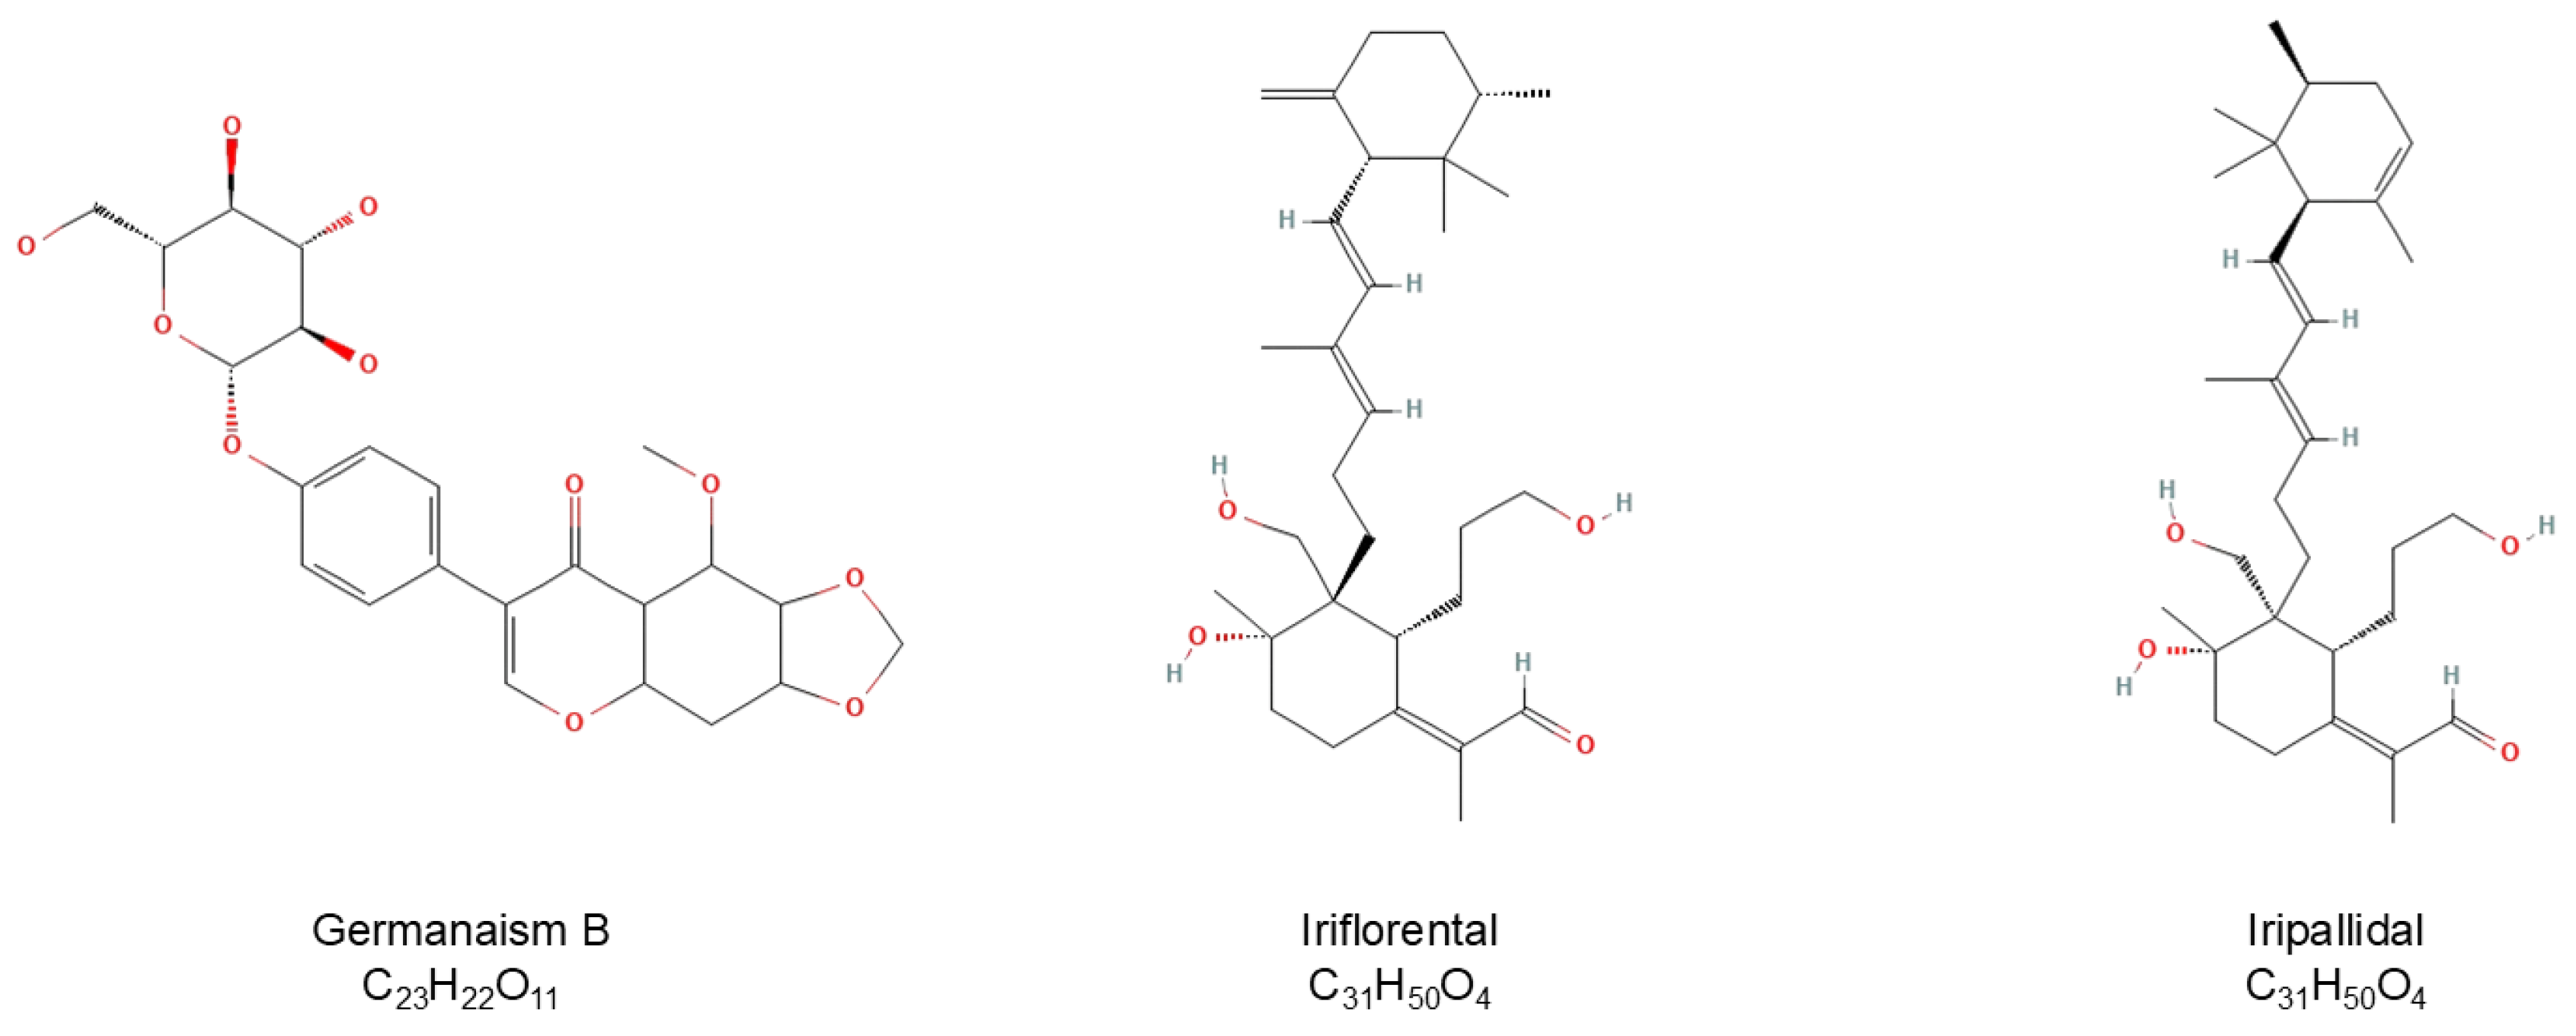
Figure 4.
Effects of germanaism B and iriflorental on cellular melanin production. B16 cells were stimulated with 50 nM of α-MSH for 72 hours in the absence or presence of the compounds. Relative Pigmentation (% Control) was calculated based on changes in optical density, normalized by cell viability. *Significant with respect to the Vehicle. Statistics were analyzed with Microsoft Excel software utilizing a Student’s one-tailed t-test assuming equal levels of variance. Statistically significant values were defined as p < 0.05.
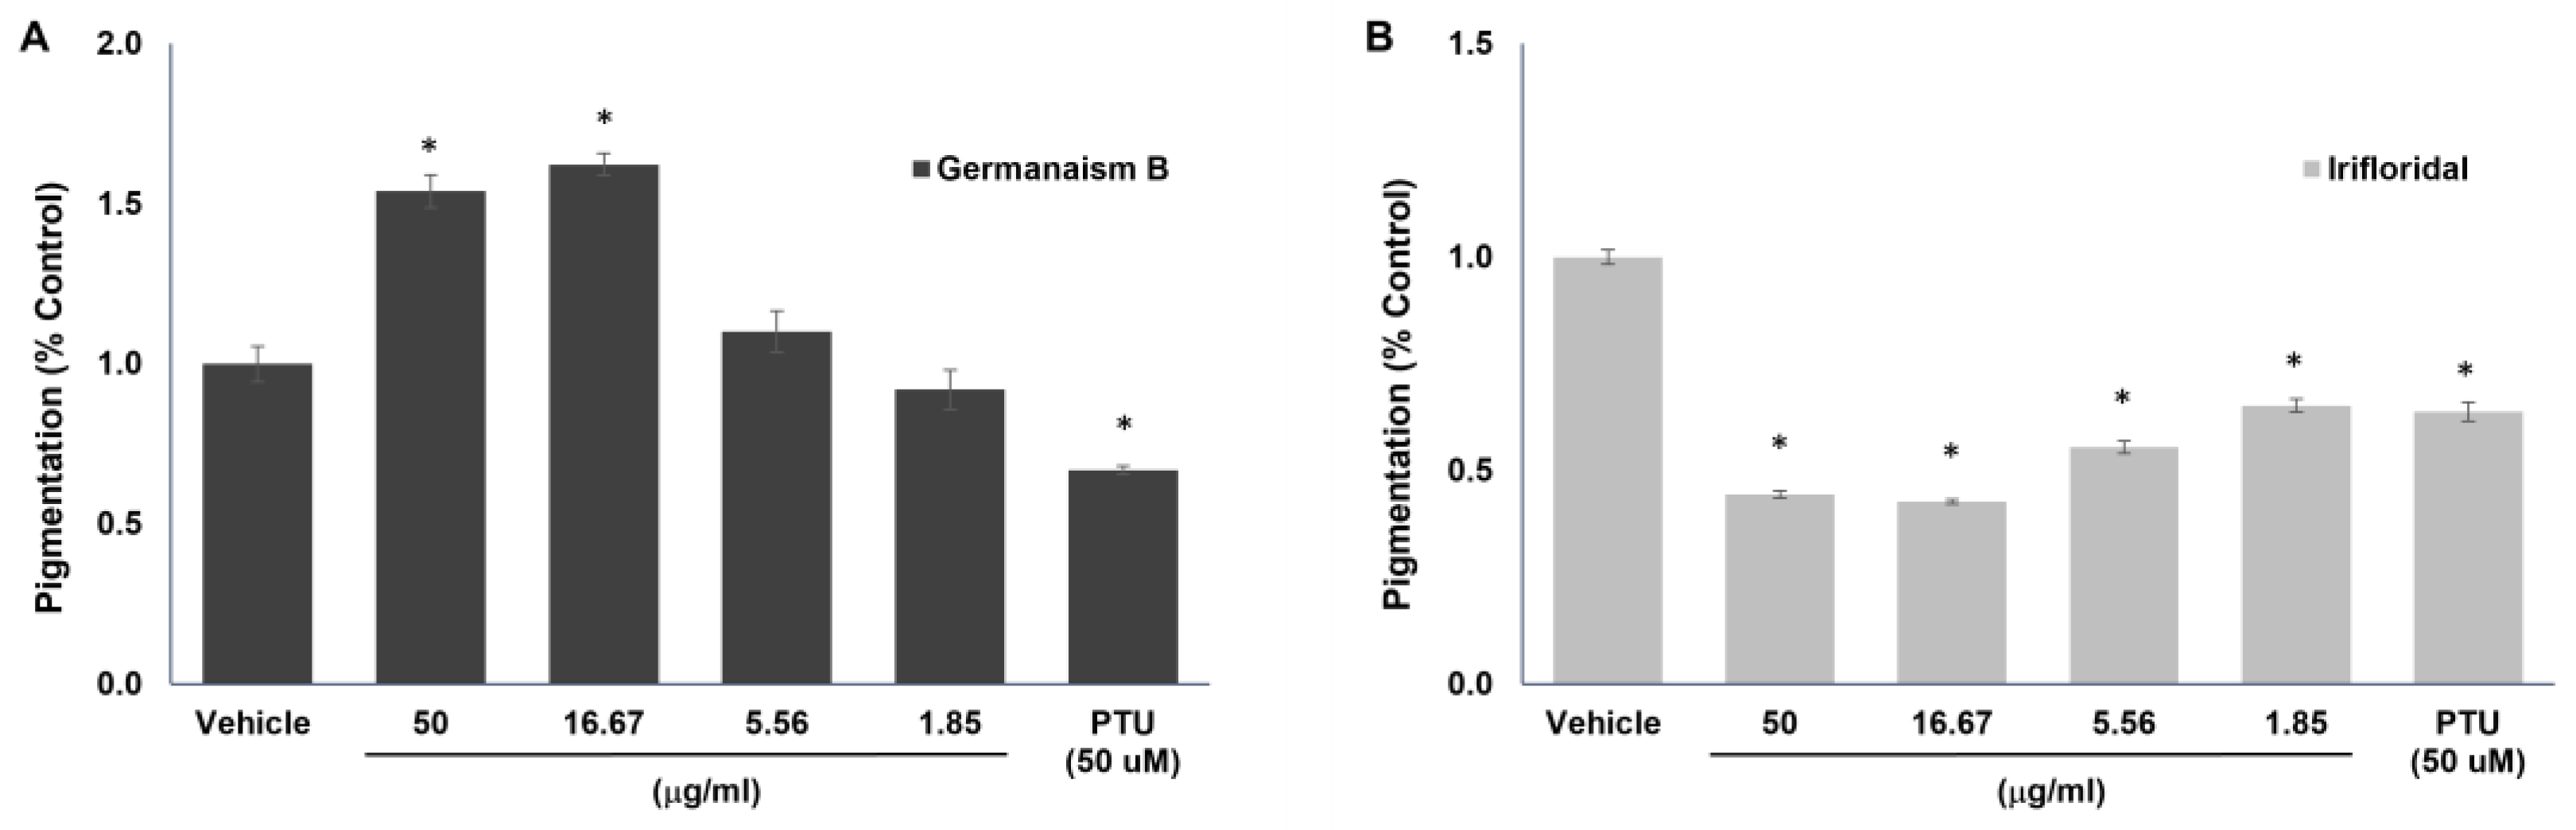
Figure 5.
Effects of 70:30 ethanol:water and chloroform extracts on melanin content in a 3D skin equivalent model. MelanoDerm™ tissues were topically treated with 4%, 2% (w/w) of each extract, positive and vehicle controls, on alternate days for three weeks. At the end of the treatment period, tissue melanin content and viability were assessed. Representative macroscopic top-view images of the tissues were captured on the final day of treatment. Data are presented as relative melanin content compared to vehicle controls. *Significant with respect to the Vehicle. Statistics were analyzed with Microsoft Excel software utilizing a Student’s one-tailed t-test assuming equal levels of variance. Statistically significant values were defined as p < 0.05.
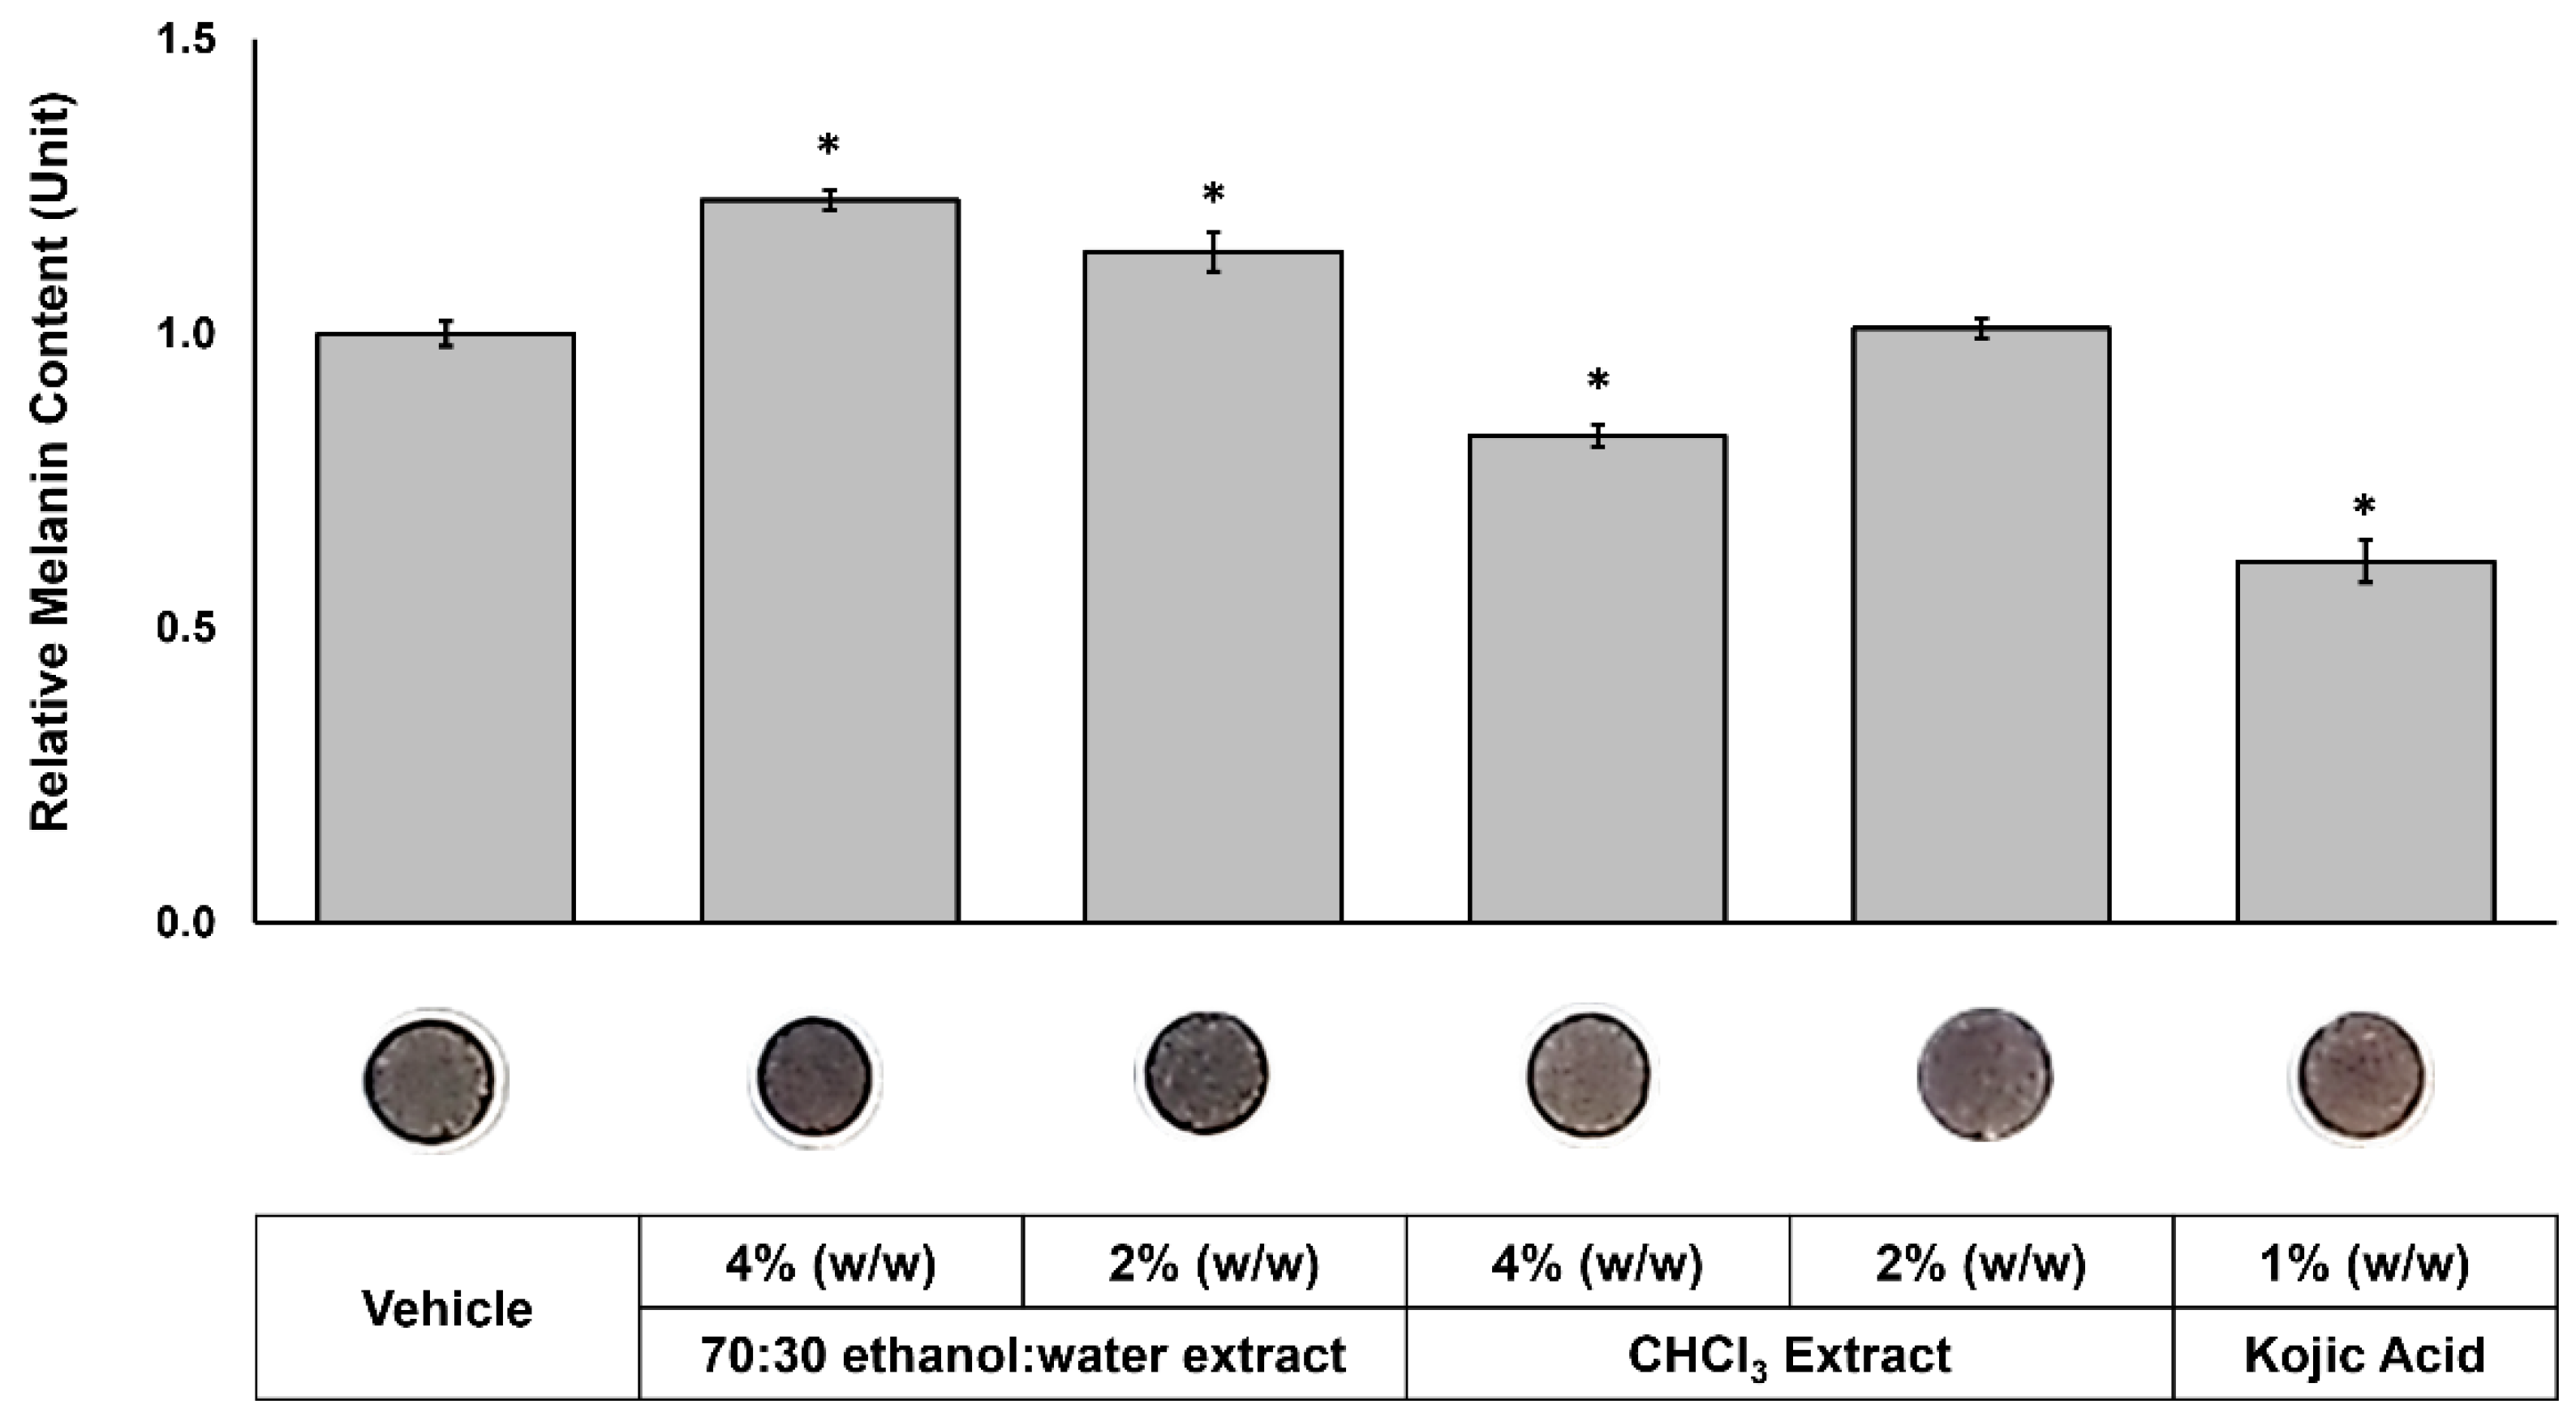
Figure 6.
Effects of SC-CO₂ extract on melanin content in a 3D skin equivalent model. MelanoDerm™ tissues were topically treated with 0.2% (w/w) of extract, positive and vehicle controls, on alternate days for three weeks. Data are presented as relative melanin content compared to vehicle controls. *Significant with respect to the Vehicle. Statistics were analyzed with Microsoft Excel software utilizing a Student’s one-tailed t-test assuming equal levels of variance. Statistically significant values were defined as p < 0.05.
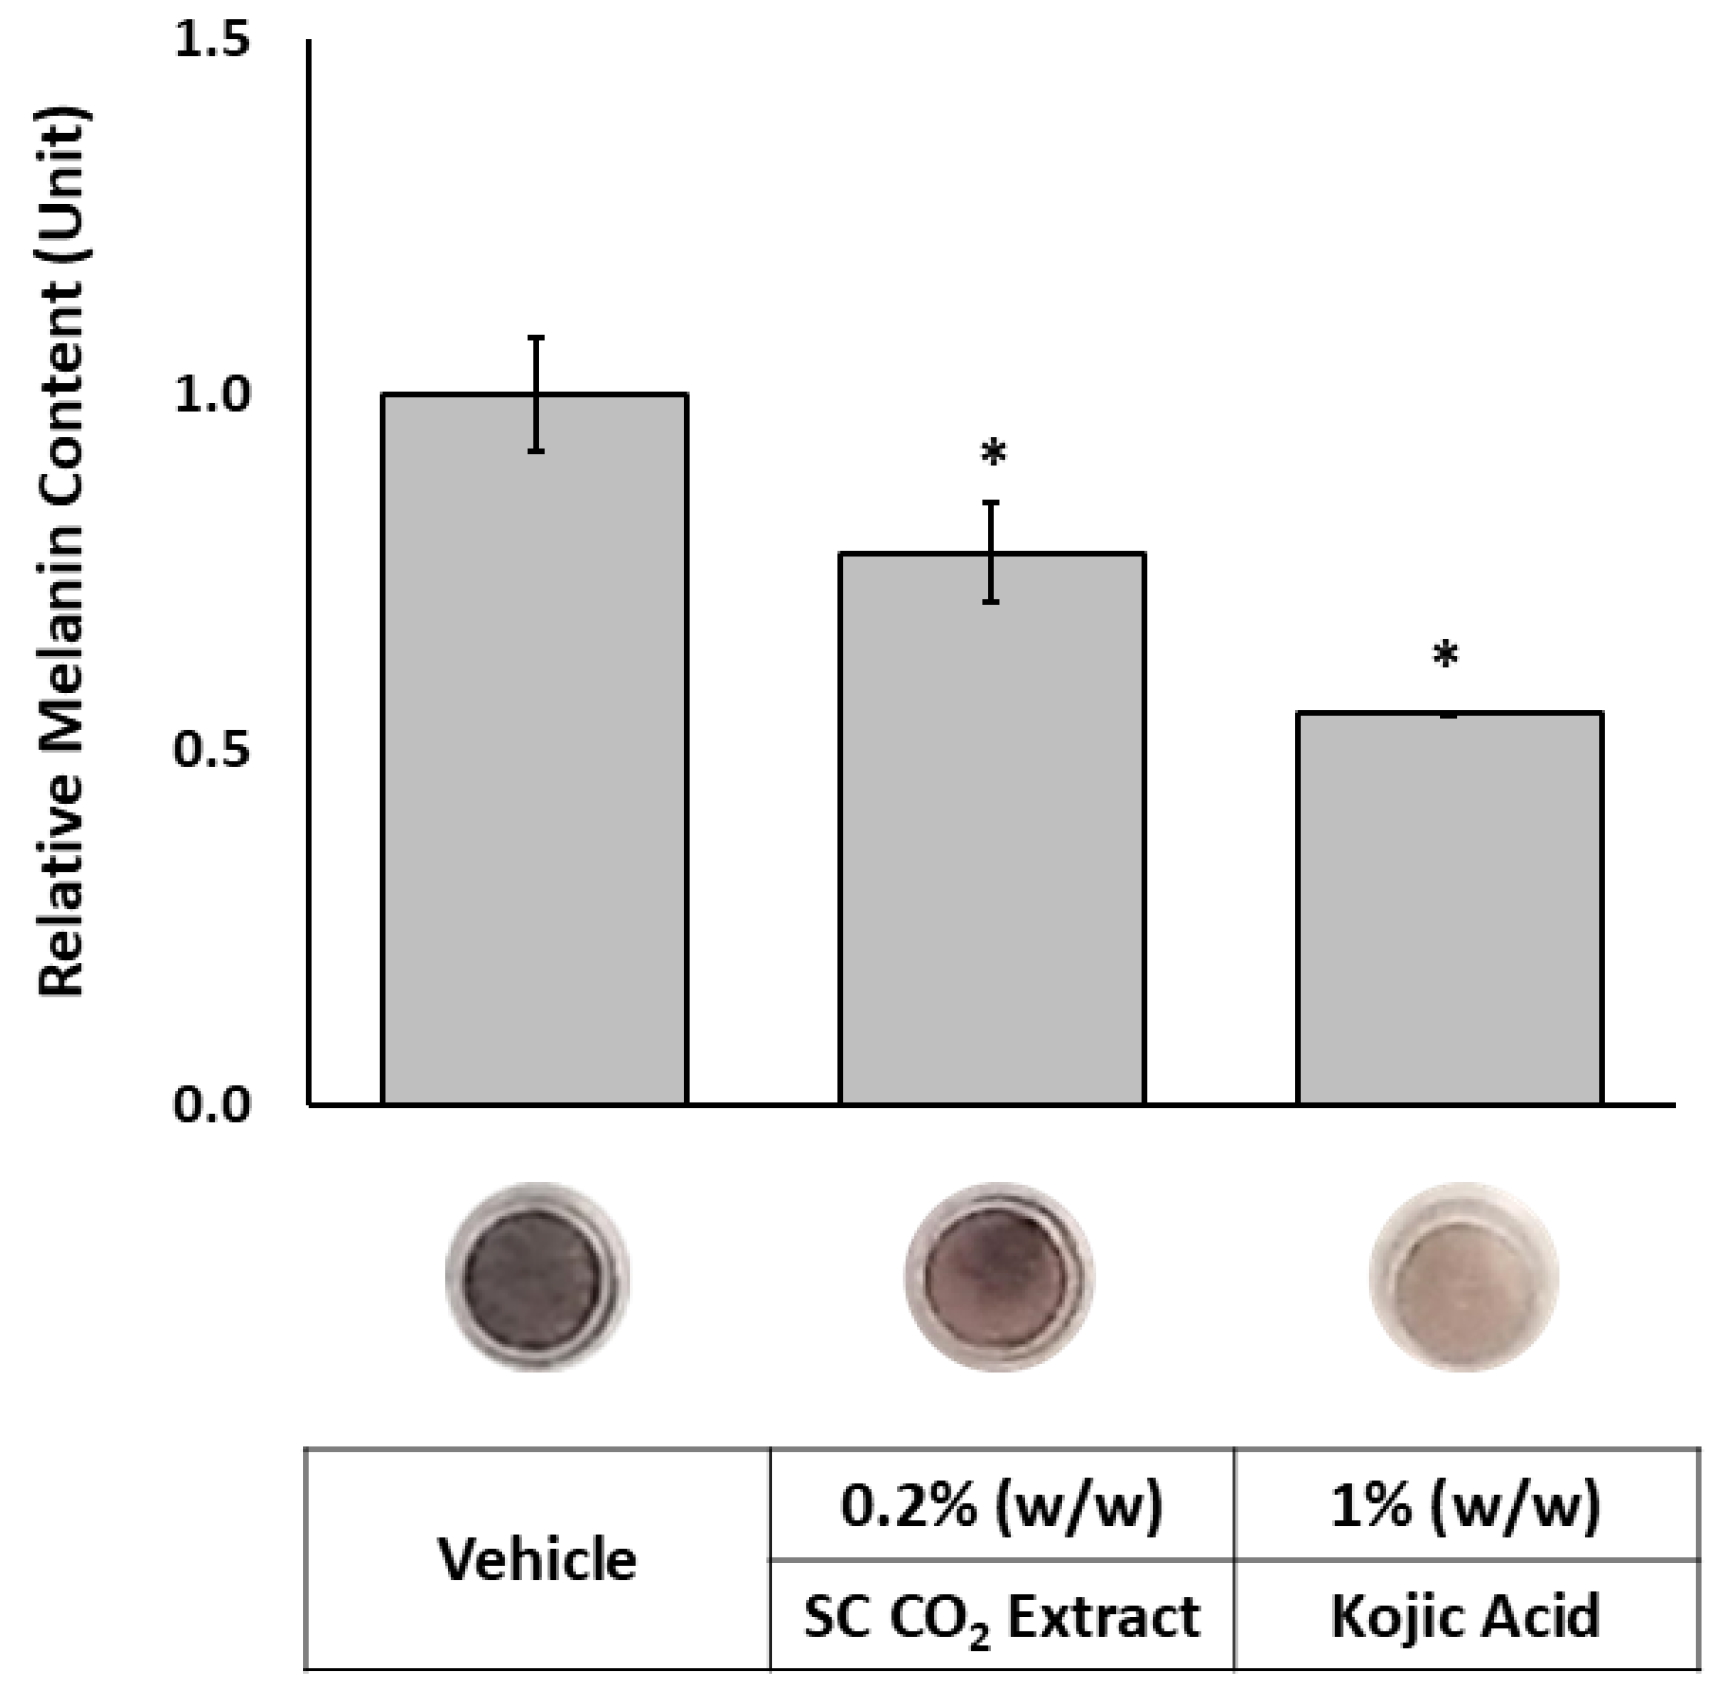
Figure 7.
LC-UV at 260nm (top) and LC-MS selected ion monitoring (bottom) chromatograms of SC-CO₂ extract. Selected ion monitoring is at m/z 487.368, representing the protonated molecular ion for both iriflorental and iripallidal. .
Figure 7.
LC-UV at 260nm (top) and LC-MS selected ion monitoring (bottom) chromatograms of SC-CO₂ extract. Selected ion monitoring is at m/z 487.368, representing the protonated molecular ion for both iriflorental and iripallidal. .
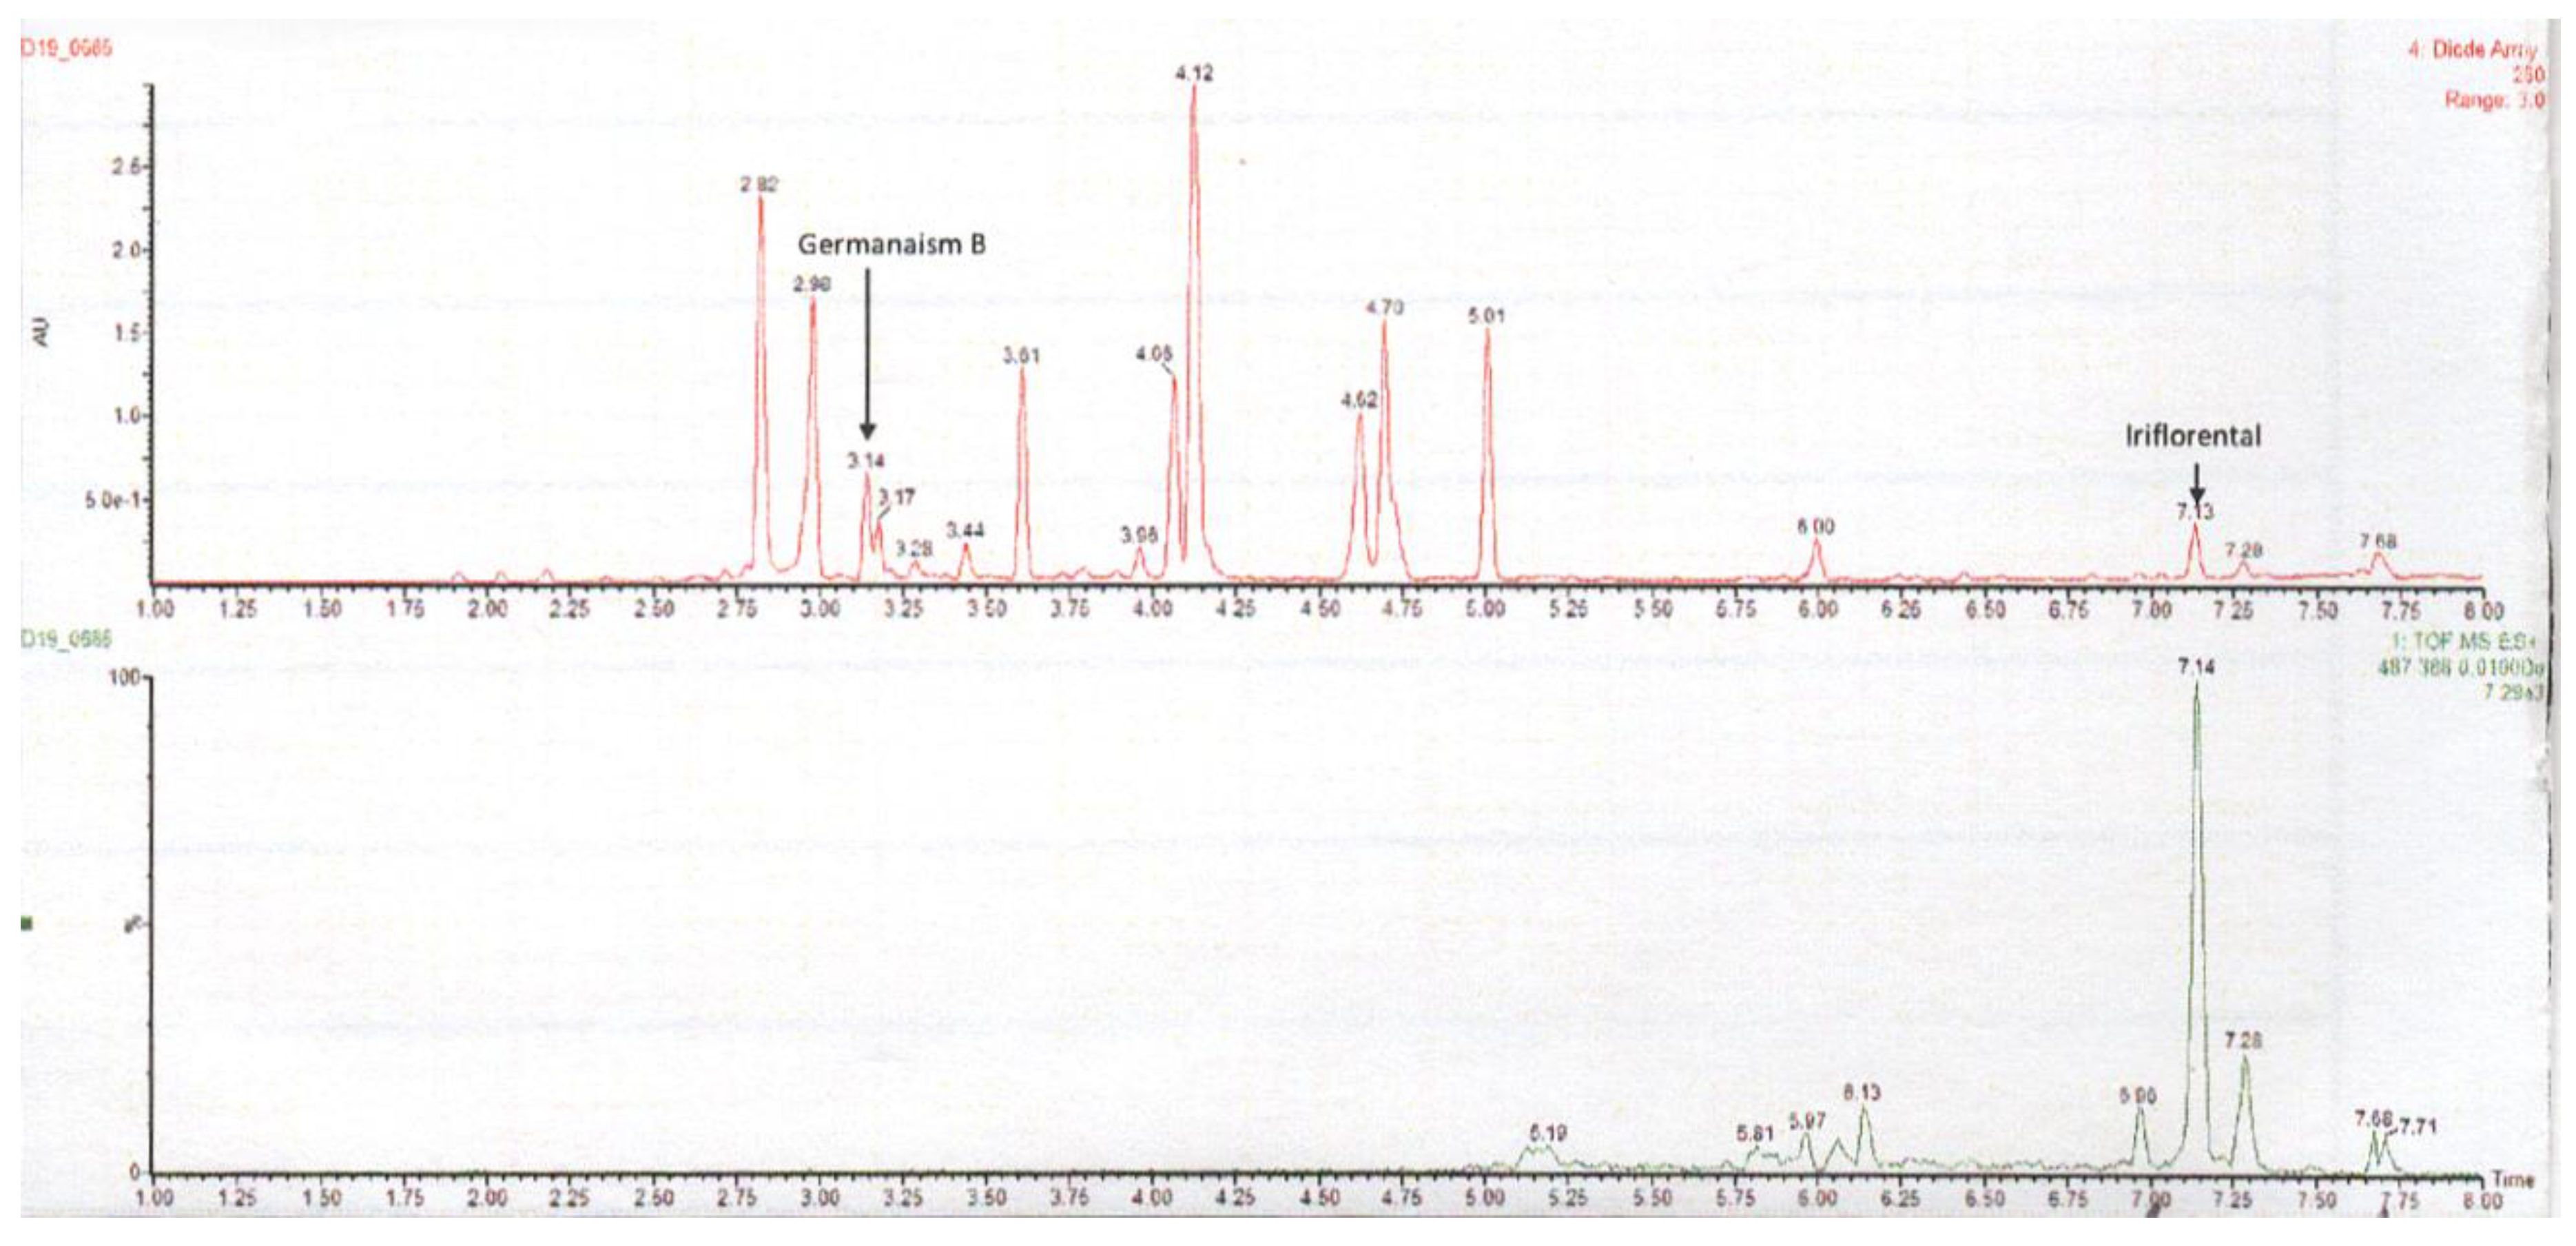

Table 1.
Identified hydrophilic and lipophilic compounds in Iris florentina L. rhizome extract by UV-HPLC.
Table 1.
Identified hydrophilic and lipophilic compounds in Iris florentina L. rhizome extract by UV-HPLC.
| Peak No. | Compound | CAS No | tR (min) | Molecular Formula |
Measured [M+H]+ |
Calculated [M+H]+ | Mass Error (ppm) |
| 1 | Irisolone 4'-O-diglucoside | 50938-05-1 | 3.36 | C29H32O16 | 637.1769 | 637.1763 | 0.9 |
| 2 | Iridin | 491-74-7 | 3.49 | C24H26O13 | 523.1449 | 523.1452 | -0.6 |
| 3 | Germanaism B | 123648-56-6 | 3.65 | C23H22O11 | 475.1237 | 475.1240 | -0.6 |
| 4 | Germanaism A | 471271-89-3 | 3.69 | C24H24O12 | 505.1343 | 505.1346 | -0.6 |
| 5 | Irilone 4'-O-glucoside | 50868-47-8 | 3.95 | C22H20O11 | 461.1073 | 461.1084 | -2.4 |
| 6 | Irisolidone 7-O-glucoside | 126308-74-5 | 4.11 | C23H24O11 | 477.1398 | 477.1397 | 0.2 |
| 7 | Irigenin | 548-76-5 | 4.57 | C18H16O8 | 361.0914 | 361.0923 | -2.5 |
| 8 | Irisolidone | 2345-17-7 | 5.4 | C17H14O6 | 315.0868 | 315.0869 | -0.3 |
| 9 | Iriflorental | 86293-26-7 | 7.52 | C31H50O4 | 487.3780 | 487.3787 | -1.4 |
| 10 | Iripallidal | 86293-27-8 | 7.68 | C31H50O4 | 487.3779 | 487.3787 | -1.6 |
Disclaimer/Publisher’s Note: The statements, opinions and data contained in all publications are solely those of the individual author(s) and contributor(s) and not of MDPI and/or the editor(s). MDPI and/or the editor(s) disclaim responsibility for any injury to people or property resulting from any ideas, methods, instructions or products referred to in the content. |
© 2025 by the authors. Licensee MDPI, Basel, Switzerland. This article is an open access article distributed under the terms and conditions of the Creative Commons Attribution (CC BY) license (http://creativecommons.org/licenses/by/4.0/).
Copyright: This open access article is published under a Creative Commons CC BY 4.0 license, which permit the free download, distribution, and reuse, provided that the author and preprint are cited in any reuse.


