Submitted:
02 August 2025
Posted:
05 August 2025
You are already at the latest version
Abstract
To investigate low-carbon design strategies for Hi-tech Park, the impact of solar energy utilization potential and heat island effect on energy consumption of buildings is taken as the entry point for low-carbon design of science park. Through an analysis of the spatial characteristics of 20 block-style hi-tech parks in the Yangtze River Delta region of China, two types of idealized park models comprising a total of 18 variations are established. The simulation process involved six key shape parameters to describe the specific shape of the park quantitatively. The Ladybug Tools, Radiance, and URBANopt software are used to simulate the potential for photovoltaic power generation and the energy consumption of the park complex. Net Energy Use Intensity (NEUI) and Potential Renewable Energy Utilization Rate (PURRE) are selected as the final evaluation indexes to represent the integrated energy performance of the park. By comparing the energy performance of the 18 idealized models, it is found that the park buildings with circular spatial structure and courtyard form layout have the lowest NEUI. Finally, based on the analysis results, four major low-carbon design strategies are proposed: high-density development, courtyard layout, supporting function centralized layout, and carbon sink enhancement.
Keywords:
science and technology industrial park
; solar power generation potential
; building energy consumption
; low carbon design strategies
1. Introduction
With the implementation of “Carbon Peaking and Carbon Neutrality Goals” of China, science and technology industrial parks, as concentrated areas of resource consumption and carbon emissions, have become a key focus for energy conservation and emission reduction. The popularization of building-integrated photovoltaic technology and the continuous decline in the cost of photovoltaic applications have made large-scale solar energy utilization an excellent option for those parks, which primarily consume electricity.
However, many park designs often overlook the impact of the urban heat island effect and solar energy utilization on building energy consumption, preventing the full realization of the carbon reduction potential. Additionally, study on low-carbon design for parks is relatively scarce, and many newly constructed parks lack clear guidance and set low-carbon targets blindly. In reality, science and technology industrial parks possess significant carbon reduction advantages. From the perspective of energy consumption, studies have shown that those parks, which are mainly composed of high-tech industries and service sectors, have few high-energy-consuming industries, relatively low energy demand, and primarily consume electricity, making the decarbonization of electricity highly effective [1]. In terms of low-carbon pathways, hi-tech parks cover large areas with numerous buildings, receiving substantial solar radiation, making it highly feasible to apply PV technology on building roofs and facades. Although the development of low-carbon hi-tech parks faces challenges from the urban heat island effect, which impacts overall park energy consumption, there is also a great opportunity to fully utilize solar energy for carbon reduction. From a planning and layout perspective, rational functional layout is a basic requirement for park planning [2]. On this basis, how to plan rational building layout, volume, and form, adopt energy-saving building materials and system designs, and strive for better photovoltaic utilization benefits while reducing the impact of the heat island effect on park energy consumption is the focus of this study.
Many developed countries began to pay attention to the study and development of solar energy after the first oil crisis and conducted a large number of related studies. Izquierdo et al. [3] were the first to systematically propose a method for evaluating the solar energy utilization potential of urban buildings. They believed that an integrated evaluation of solar energy utilization potential for urban buildings could be divided into three steps: first, assessing the physical potential by analyzing the amount of solar radiation that building surfaces can receive; second, assessing the geographical potential by further screening the surfaces that can receive solar radiation based on the installable area of solar energy devices on building surfaces; and finally, assessing the technical potential by calculating the power generation or heat production potential based on the conversion efficiency and system performance of solar energy devices.
In China, past study on the planning and development of high-tech parks has mainly focused on spatial layout, with large-scale park planning being the primary study object [4,5,6]. As the functional complexity of high-tech parks has increased and their planning positioning has become more precise, study on the spatial design of different types of parks based on various spatial and industrial types has gradually increased. Zhang [7] conducted study on the public space design of science and technology parks in high-density environments in Shenzhen, summarizing the patterns, functional content, spatial treatment, and usage of three-dimensional public spaces in high-density science and technology parks. Yang [8] specifically studied the three-dimensional public space in science and technology parks, arguing that science and technology parks should selectively integrate with urban roads of appropriate scale. Wu et al. [9] conducted a comparative study of the spatial morphology of science and technology parks under the new business model of “Internet +”. They found a complex relationship between environmental quality and green space area, and concluded that rational site design is crucial for improving environmental quality.
Study on low-carbon design for science and technology parks in China is still in its infancy. Current study mainly discusses the feasibility and effectiveness of technical pathways and construction plans [10,11], while study on how low-carbon design concepts influence the site layout and spatial form of building clusters is almost non-existent. Therefore, this paper takes the impact of solar energy utilization potential and the urban heat island effect on building energy consumption as the entry point for low-carbon design of science and technology parks, aiming to propose low-carbon design strategies with strong energy orientation for science and technology parks in the Yangtze River Delta region of China.
The key study points of this study are threefold. First, through the analysis of the spatial characteristics of 20 block - type science and technology parks in the Yangtze River Delta region of China, 18 idealized park models were established. Second, an integrated energy evaluation system for science and technology parks was constructed, with Net Energy Use Intensity (NEUI) and Potential Renewable Energy Utilization Rate (PURRE) selected as the ultimate evaluation indicators to represent the overall energy performance of the parks. Third, through simulation, it was found that the parks with circular spatial structure and courtyard form layout had the lowest integrated energy consumption, and four major low - carbon design strategies for science and technology parks were proposed to provide design guidance.
2. Simulation Methods
2.1. Idealized Models of Science and Technology Industrial Park
To facilitate subsequent simulation analysis, idealized park models were first abstracted from actual science and technology industrial park case studies. The spatial structure of a science and technology park refers to the spatial positioning and combination of various elements that constitute the park, which is the result of the interaction between different buildings and environmental factors. The focus of this study is on three key elements that can clearly describe the functional and spatial characteristics of a science and technology park: the park center, study and development or production clusters, and supporting facilities.
By analyzing the spatial characteristics of 20 block - type science and technology parks in the Yangtze River Delta region of China, it is found that the spatial composition of those parks follows a common logic, with building layouts exhibiting two tendencies: centripetal and de - centralized. The first is the circular spatial structure (Figure 1a), where supporting functions or landscape elements form the park center, and study and development or production clusters are arranged in a circle around the center, creating a center - periphery spatial structure. This pattern is more common in medium - and large - sized science and technology parks. The second is the evenly distributed cluster structure (Figure 1b), where the park is de - centralized or the centripetal relationship of the park center is weakened. The building clusters are placed side by side, and the spatial layout pursues a flat structure. This pattern is more common in small - and medium - sized science and technology parks.
Based on the industrial characteristics, basic spatial features, and surveyed building parameters of block - type science and technology parks in the Yangtze River Delta region of China, and considering the urban traffic regulations on block size and road network layout, the following rules are applied to abstract idealized park building cluster models from actual cases to represent a category of spatial characteristics:
- Unified Park Plot and Floor Area Ratio: The model area is a rectangular plot measuring 300m × 300m (total area of 9hm²), with urban roads surrounding the four boundaries of the plot. The FAR of the plot is set at 1.6;
- Building Density: The building density should be no less than 25% and no more than 50%;
- Functional Proportion: The proportion of building functions is approximately 80:15:5 for study and development office area, commercial and catering supporting area, and cultural service supporting area, respectively. Other building functions are ignored;
- Building Form: The building form is simplified, with shapes mainly being rectangular, “L” - shaped, and “C” - shaped. All buildings have a due - south orientation. The buildings are primarily multi - story, with a maximum height of 50m for any single building;
- Floor Height: The first floor of any building is 4.5m high. For buildings with study and development office functions, the floor height is 4.2m, while for those with supporting functions, it is 4.5m;
- Building Layout Relationship: Building clusters are formed through three geometric operations: array, symmetry, and enclosure. The overall layout of the building cluster follows the principle of being lower in the south and higher in the north;
- Supporting Function Layout Principle: When supporting functions are centrally arranged, they are located in the center of the site. When they are dispersed, they are evenly distributed. When both arrangements are combined, the dispersed supporting functions are placed around the periphery of the site.
Two types of layouts are ultimately derived: circular shaped layout and evenly distributed cluster layout. Four variations (A1, A2, B1, B2) of each type resulted in a total of 18 idealized park building cluster models (Figure 2) to represent science and technology industrial parks with various spatial characteristics.
2.2. Integrated Energy Performance Evaluation System
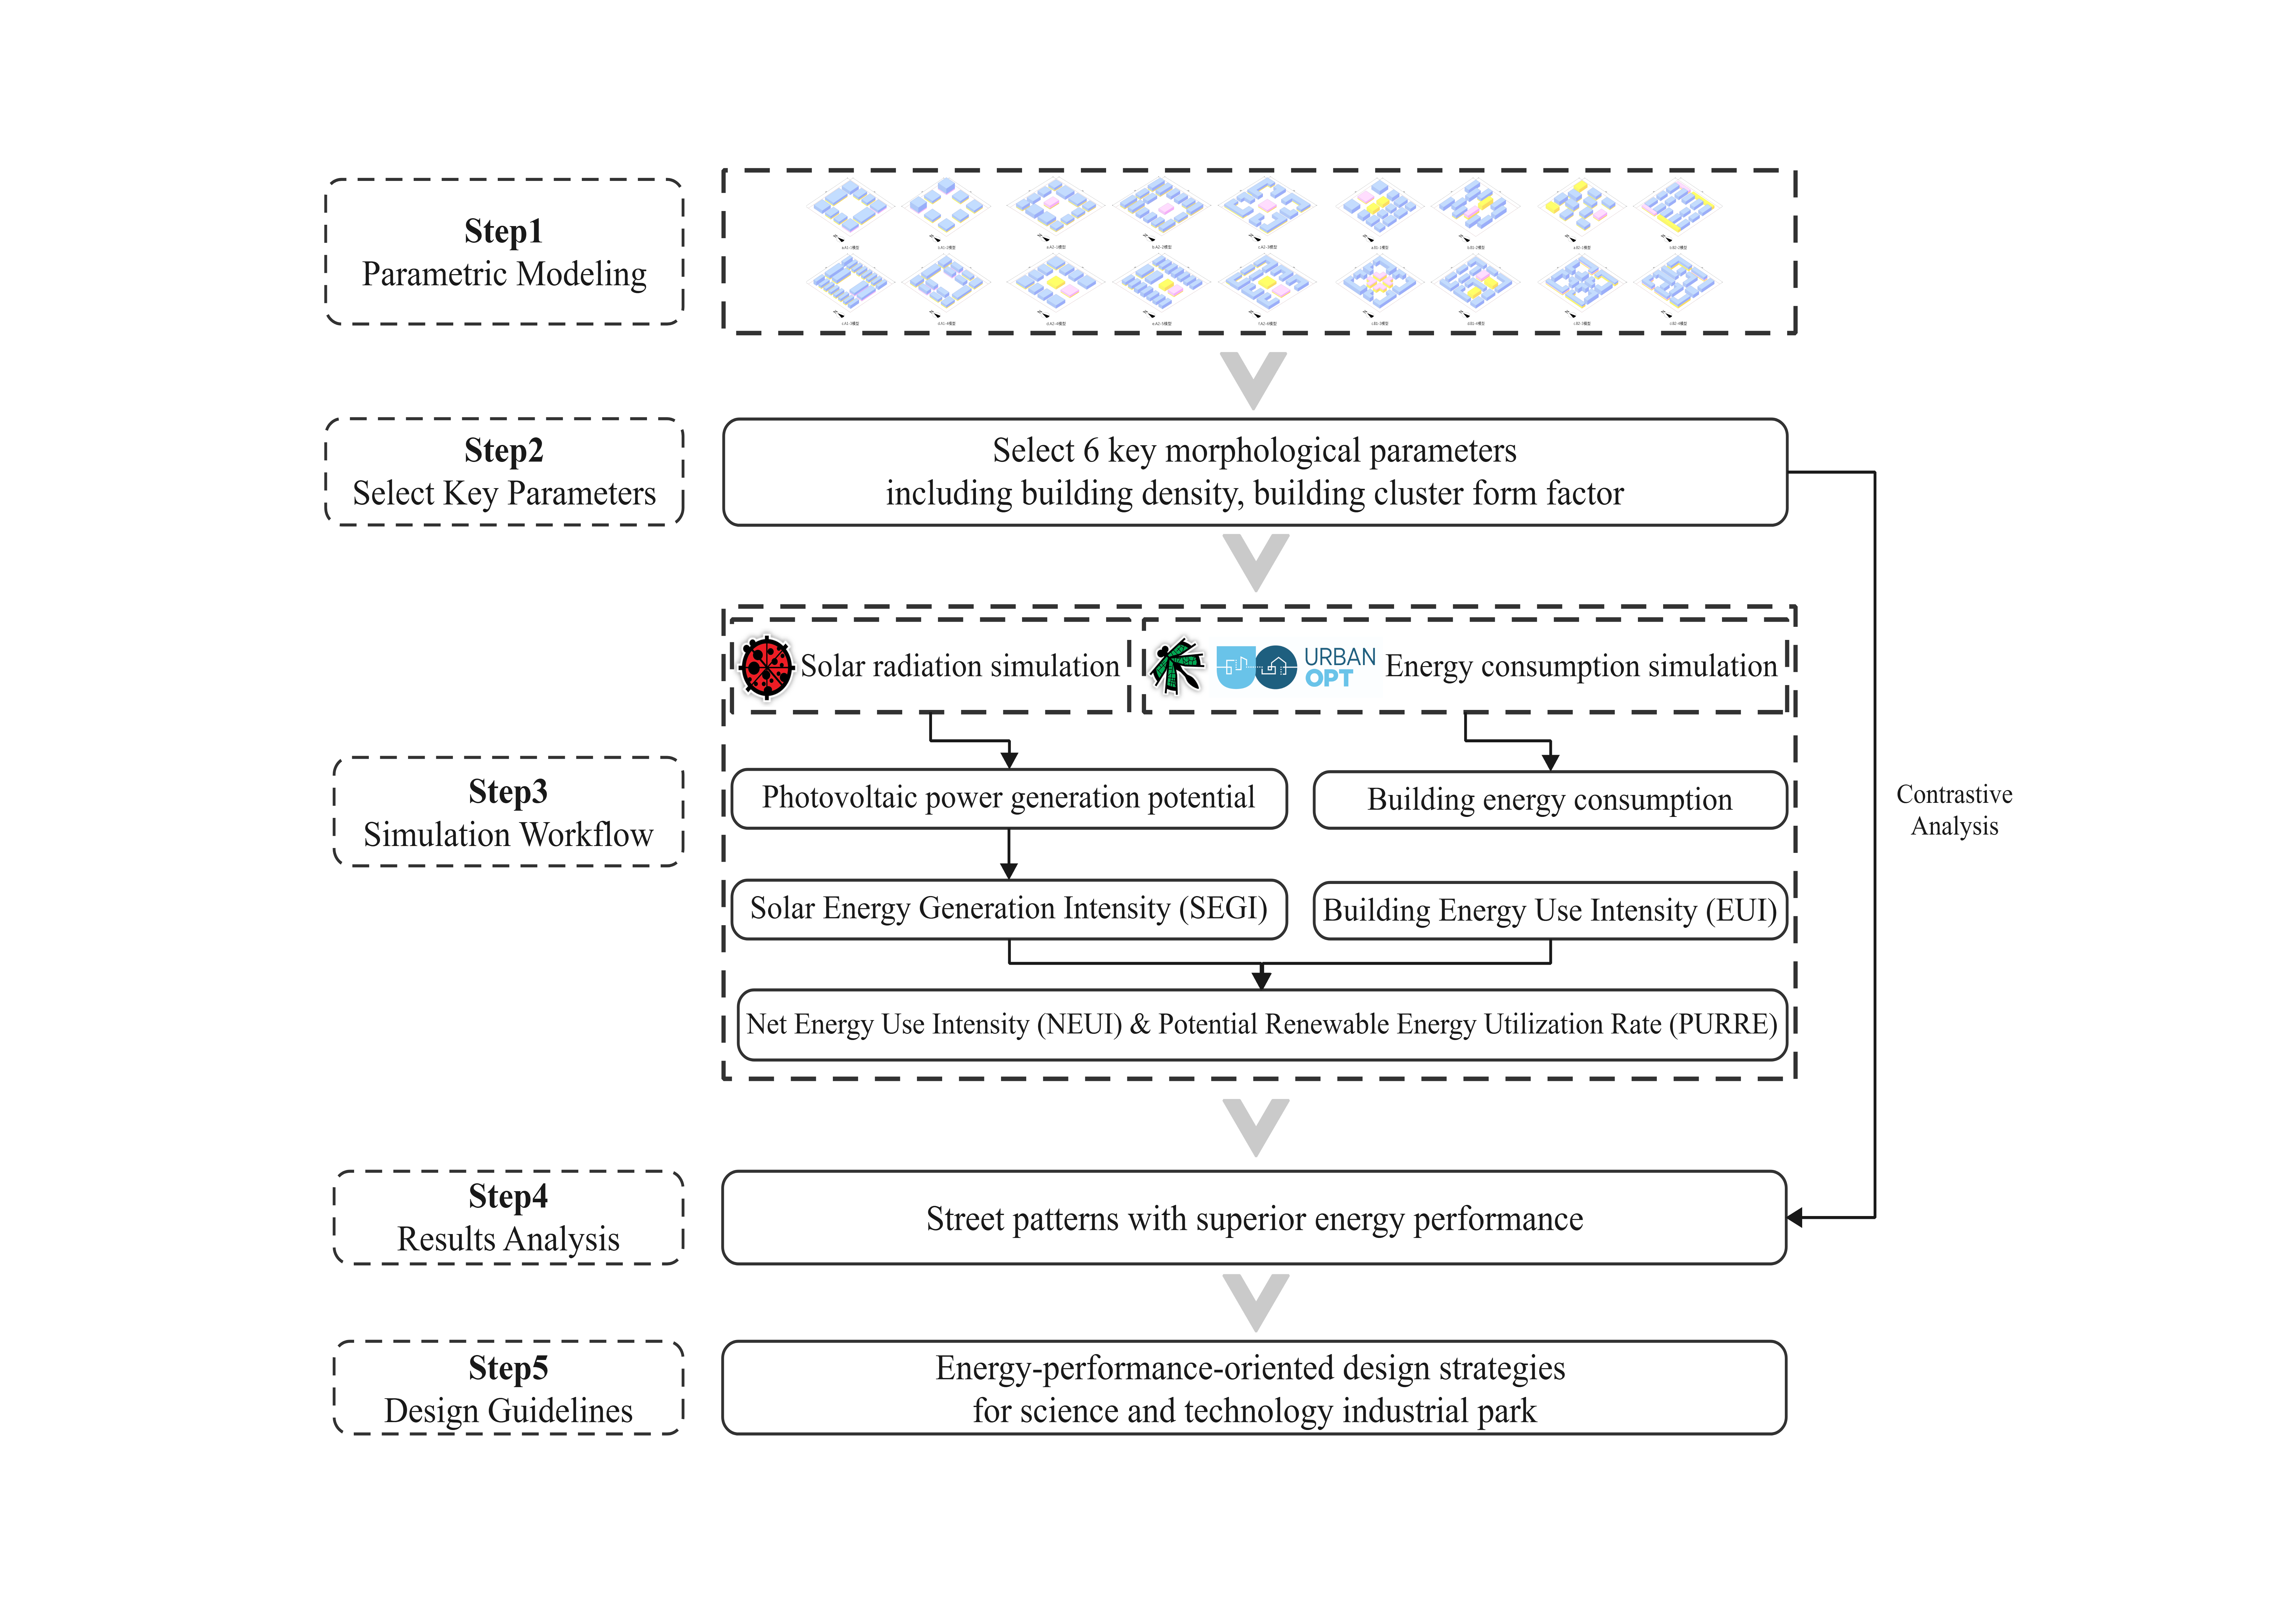
Building upon the idealized park models, we propose an integrated energy performance system for block-scale science and technology industrial parks that explicitly incorporates urban heat island effects. The specific steps of the assessment framework are illustrated in Figure 3:
- Parametric Modeling: Geometric attributes of the idealized models are translated into parametric modeling within Rhinoceros and Grasshopper by extruding footprint polylines into volumetric building envelopes;
- Select Key Parameters: To systematically capture the spatial layout characteristics of science and technology industrial parks and to ensure broad applicability during early-stage planning and design, six key morphological parameters are identified as study variables.
- Simulation Workflow: The energy consumption simulation of parks is conducted using energy simulation software such as Ladybug, Radiance, and URBANopt to assess the photovoltaic power generation potential and the impact of the urban heat island effect. Based on the simulation results, the photovoltaic power generation intensity, energy use intensity, and integrated energy performance indicators are calculated.
- Results Analysis: By comparing the integrated energy performance of various idealized park models, the street patterns with superior energy performance are identified.
- Design Guidelines: Based on the analysis results of the study, planning and design strategies for science and technology industrial parks are proposed, which focus on optimizing the integrated energy performance of the building complex.
To facilitate subsequent simulation analyses and comparisons while controlling extraneous variables, all idealized park models are assumed to be located within a consistent urban environment, with Shanghai’s standard-year weather file uniformly adopted as the baseline meteorological dataset.
2.3. Quantification of Key Morphological Parameters
Block-scale morphological parameters can quantitatively describe district-level building clusters from both urban-planning and architectural-design perspectives, and they adequately capture the spatial-layout characteristics of block-type science and technology parks.
Following the synthesis of existing study [12,13,14], indicators influencing photovoltaic potential fall into two categories: development intensity and block spatial form. Similarly, factors affecting building-cluster energy demand can be grouped into four categories: development intensity, block spatial form, land-use composition, and landscape greenery [14].
Aligned with the study objectives, we focus on the first two categories—development intensity and spatial form to examine their impacts on overall energy performance while accounting for heat-island effects and micro-climate influences. To ensure broad applicability in planning practice, six key parameters are selected. Their definitions and calculation methods are summarized in Table 1. For all eighteen idealized models, the six parameters are computed after maximizing plantable green space within allowable limits: Green-Space Ratio was rounded to the upper bound of the prescribed range, capped at 40 % and floored at 30 %.
3. Simulation Results
3.1. Photovoltaic Potential Assessment and Simulation Results
3.1.1. Photovoltaic Potential Evaluation Metric
Active building photovoltaics have become the preferred renewable-energy technology in most newly developed science and technology parks and thus constitute a highly representative solar-energy strategy. Accordingly, the study adopts photovoltaic potential as the sole indicator of renewable-energy availability for block-scale hi-tech parks.
Solar Energy Generation Intensity (SEGI) is introduced as the metric for evaluating photovoltaic potential. SEGI is defined as the annual maximum photovoltaic yield per unit gross floor area of the building cluster, expressed in kWh/(m2·a). It is calculated as:
where:
- EGT = annual total photovoltaic electricity output [kWh/a]
- AT = total gross floor area of the building cluster [m²]
3.1.2. Photovoltaic Potential Calculation
In accordance with Chinese photovoltaic regulations and established calculation methods [12,13], the annual electricity yield of the photovoltaic system on each building surface is computed using the following equation:
where:
- EP = annual electricity yield of the photovoltaic system on the building surface [kWh/a]
- HA = annual solar irradiation on the corresponding building surface [kWh/(m2·a)]
- Apv = installable area of photovoltaic modules on the corresponding building surface [m²]
- η = photovoltaic conversion efficiency [%]
- K = integrated efficiency coefficient [%]
- Rd = degradation rate of the photovoltaic system [%]
- N = lifecycle of the photovoltaic system [a]
In the calculation of HA, only the surfaces with annual solar irradiation exceeding the threshold are considered. The Apv is computed using the following equation:
where:
- Arf = area of the roof or corresponding facade [m²]
- Crf = installation coefficient, equal to Cr for roof surfaces and 1.0 for facades
- CT = proportion of the roof or corresponding facade area with solar irradiation exceeding the threshold [%]
Given the significant differences in installable area for photovoltaic systems on roofs versus facades, and the notable impact of installation methods and angles on photovoltaic utilization, it is stipulated that photovoltaic modules are installed parallel to each building surface. The electricity generation of the photovoltaic systems on the roofs and each facade direction is calculated separately and then summed to obtain the total photovoltaic electricity generation (EGT) for the building cluster. The overall SEGI is subsequently computed using Equation (1). The simulation workflow is illustrated in Figure 4.
3.1.3. Simulated Photovoltaic Potential
The SEGI values were calculated for the 18 idealized park building cluster models following the aforementioned approach. As shown in Figure 5, the total SEGI values of the 18 idealized park building clusters exhibit significant differences. The minimum total SEGI value is found in the evenly distributed cluster layout, specifically in the B1-2 type park building cluster, with a value of 30.60 kWh/(m²·a). The maximum total SEGI value is observed in the circular layout, specifically in the A2-6 type park building cluster, with a value of 40.14 kWh/(m²·a), which is approximately 1.31 times the minimum value. The A2-3 and A2-6 type park building clusters have notably higher total SEGI values than other types, primarily because these clusters have higher building density and more uniform building volume distribution, resulting in less shading between buildings and self-shading, which allows for more effective utilization of solar radiation and thus higher photovoltaic generation potential.
In terms of average values, the average total SEGI for circular layout park building clusters is 35.31 kWh/(m²·a), while for evenly distributed cluster layout park building clusters, it is 34.52 kWh/(m²·a), with the former being higher than the latter. However, when comparing the median values, the median total SEGI for circular layout park building clusters is 33.99 kWh/(m²·a), lower than the evenly distributed cluster layout’s median of 35.31 kWh/(m²·a). The chart results reflect that the photovoltaic potential under circular layout is more significantly influenced by the block morphology, and adopting a rational layout can potentially achieve photovoltaic utilization effects beyond expectations. In contrast, in the evenly distributed cluster layout, the layout’s positive impact on overall photovoltaic potential is limited, and it is more important to avoid the negative effects of shading between buildings.
3.2. Energy Use Intensity Assessment and Simulation Results
3.2.1. Energy Use Intensity Evaluation Metric
The study adopts Energy Use Intensity (EUI) as the evaluation metric, defined as the ratio of the building cluster’s annual total energy consumption (primarily cooling, heating, lighting, and equipment energy use) to its total floor area, expressed in kWh/(m²·a). It provides a straightforward indication of the overall energy use of the park’s building cluster. The EUI calculation in this study, which accounts for the impact of the urban heat island effect on building energy consumption, is as follows:
where:
EUT = Total annual energy consumption of the building cluster [kWh/a]
AT = Total floor area of the building cluster [m²]
3.2.2. Energy Use Intensity Evaluation Calculation
The energy consumption simulation workflow constructed in this study comprehensively considers the impact of both building cluster morphology and microclimate factors on energy use. It is built using the Ladybug Tools suite, primarily using the Dragonfly module for microclimate calculations and model setup, and Honeybee module for setting occupancy behaviors, operation schedules, and thermal envelope parameters. The final simulation is executed via the URBANopt platform, yielding the cooling, heating, lighting, and other electrical equipment energy consumption for each idealized park building cluster. These are summed to obtain the total energy consumption, from which EUI is calculated using Equation (4).
The specific simulation process employs the Urban Weather Generator (UWG) component within the Dragonfly module. The simulation workflow is illustrated in Figure 6.
The study primarily refers to Chinese national standards to set parameters such as the thermal transmittance (K-value) of opaque and transparent envelope components, solar heat gain coefficient (SHGC), and visible light transmittance. Based on existing envelope construction sets, a new set is established for study purposes, with specific values for each part of the envelope detailed in Table 2. When inputting these parameters, the thermal transmittance K-value is first converted into the corresponding thermal resistance R-value before being entered into the relevant functional component. The two values are equivalent in representing the thermal performance of the same envelope component.
Human behavior and equipment schedules involve multiple parameters in energy simulation, including occupancy rates, metabolic heat gains, lighting schedules, lighting power density, and equipment schedules. Since this study primarily focuses on the impact of block morphology on building energy consumption, human behavior and equipment parameters for the three types of functional spaces are set as constants to minimize their influence on the study. For HVAC room temperature settings, the study refers to Chinese green building and energy-saving standards, setting the winter heating temperature at 20°C for office spaces and 18°C for other spaces, with heating activated below these temperatures. The summer cooling temperature is uniformly set at 26°C, with cooling activated above this temperature.
The Dragonfly tool is used in conjunction with building facade information to rapidly convert 3D building massing models into energy models that include both facade and thermal zone information. To meet the 3D modeling requirements for energy simulation, the facade information needed includes the number of floors, floor-to-floor height, and window-to-wall ratio. Buildings with the same function have certain similarities in floor-to-floor height and window-to-wall ratio. To eliminate differences in building energy performance caused by variations in these parameters in real buildings, these values are uniformly set during modeling. The facade information for each functional space is detailed in Table 3.
The Dragonfly tool is employed to perform batch modeling of building volumes based on facade information, and to assign corresponding thermal zones according to function, as well as to configure human behavior and operation schedules, equipment parameters, and envelope parameters. Considering the significant differences in thermal zone partitioning in public buildings, thermal zones with the same function are merged to enhance modeling and simulation efficiency. Additionally, building protrusions and recesses within 2 meters are simplified during modeling, and no shading devices are adopted for any of the idealized building cluster samples.
The study utilizes the Urban Weather Generator (UWG) to meet the needs of performance-oriented building cluster thermal environment planning. Initially developed by Bueno [15] in 2012, UWG is a physics-based simulation model designed to quantify energy exchanges between the environment and climate. Subsequent improvements by various scholars have enabled it to assess urban heat island effects and building energy consumption at the block scale. The reliability of this model in performance-oriented early block planning has been repeatedly verified across diverse climatic environments and block morphologies [16,17,18].
To incorporate microclimate impacts into the energy simulation process, the study constructs a microclimate assessment module on the Grasshopper platform using the Dragonfly module. First, the DF Model containing all building modeling information established in the first process block is read. Subsequently, the standard meteorological year data file for Shanghai is imported, and parameters such as traffic intensity, vegetation, and sensible heat are set. Finally, the influence of block morphology on the microclimate is calculated using the built-in UWG functions in Dragonfly, and new EPW files are generated based on the altered temperature, humidity, and other meteorological data. These files are then used for the final energy simulation. The microclimate parameters affecting building energy consumption are shown in Table 4. Since this study primarily focuses on the impact of building cluster morphology on overall energy consumption, conditions such as vegetation and paving are uniformly set, and the green-space ratio is calculated according to the formula in Table 1.
The disaggregated energy demand of a park building cluster is quantified for four end-uses: cooling, heating, lighting, and other equipment. The simulation engine delivers 8760 hourly values for each end-use, which are then aggregated to annual totals. The overall annual energy consumption of the cluster is the sum of these individual end-use demands.
3.2.3. Simulated Energy Use Intensity
Figure 7 presents the total energy performance of each park under the influence of the urban heat-island effect. The 18 idealized park building clusters exhibit only marginal variation in total EUI. The lowest value, 101.26 kWh/(m²·a), is found in the circular cluster A2-5, whereas the highest, 108.08 kWh m⁻² yr⁻¹, occurs in the same layout type (A2-3). The absolute difference is 6.82 kWh/(m²·a), corresponding to a 6.74 % increase from the minimum. Disaggregated results reveal that, for a fixed gross floor area and nearly identical functional mixes, lighting and other-equipment EUIs remain almost constant and together account for roughly half of the total demand. Cooling and heating EUI drive the observed differences, with cooling demand markedly exceeding heating demand. Circular layouts yield a slightly lower mean total EUI (114.74 kWh/(m²·a)) than evenly distributed clusters (115.36 kWh/(m²·a)). Nevertheless, the circular layout also presents the widest spread, encompassing both the maximum and minimum values, indicating that its energy performance is more sensitive to detailed morphological choices.
3.3. Integrated Energy Performance Assessment and Results
3.3.1. Integrated Energy Performance Metrics
This study evaluates the integrated energy performance of idealized park building clusters from two complementary perspectives. First, Net Energy Use Intensity (NEUI) is employed to quantify the net energy demand under varying spatial layouts. Second, Potential Utilization Rate of Renewable Energy (PURRE) is introduced to gauge the prospective degree of on-site energy self-sufficiency afforded by each layout. The synthesis of these two metrics yields a comprehensive assessment of the energy performance of the eighteen idealized clusters.
1. Net Energy Use Intensity (NEUI)
Net energy use intensity (NEUI) is defined, under specified conditions, as the annual difference per unit floor area between energy consumption and renewable generation, each multiplied by its respective energy-conversion factor. It quantifies the absolute net energy demand of a park building cluster once renewable generation is accounted for, directly revealing the potential surplus or deficit between production and use. Consequently, NEUI serves as a core metric for evaluating integrated energy performance.
As this study treats solar PV as the sole renewable source, NEUI is computed as the difference between the heat-island-adjusted Energy Use Intensity (EUI) and the Solar Energy Generation Intensity (SEGI). A lower NEUI indicates a lower absolute net energy demand. The calculation is as follows:
2. Potential Utilization Ratio of Renewable Energy (PURRE)
The renewable-energy utilization ratio denotes the percentage of annual on-site solar electricity generation relative to total energy consumption on a per-unit-floor-area basis, thereby reflecting the energy self-sufficiency level of a park building cluster. In this study, full utilization of the generated solar energy is assumed. Hence, the concept of renewable-energy utilization ratio is extended to “potential” utilization, signifying the ratio of photovoltaic potential (SEGI) to total energy demand (EUI) rather than the ratio of actual PV output to demand.
Potential Utilization Ratio of Renewable Energy (PURRE) is therefore calculated as the quotient of Solar Energy Generation Intensity (SEGI) and heat-island-adjusted Energy Use Intensity (EUI). The calculation is as follows:
3.3.2. Integrated Energy Performance Calculation Results
Figure 8 presents the NEUI values for the 18 idealized park building clusters. A pronounced spread is evident: the minimum NEUI of 72.09 kWh/(m²·a) occurs in the circular cluster A2-6, whereas the maximum of 85.93 kWh/(m²·a) is observed in the evenly distributed cluster B2-1, yielding an absolute difference of 13.84 kWh/(m²·a) (a 20 % increase from the minimum). When the 18 idealized clusters are ranked separately—first by descending total SEGI and then by ascending NEUI—A2-6, A2-3, and B2-2 recur in the top five of both lists. This repetition demonstrates that photovoltaic generation potential exerts a strong influence on net energy use intensity. Clusters with NEUI < 80 kWh/(m²·a) typically adopt grid or courtyard layouts, distributing buildings evenly across the site without excessive clustering or pronounced height variations—thereby limiting mutual shading while maintaining relatively high building density. Moreover, the overall distribution for ring-shaped clusters remains below that of evenly distributed ones, indicating that, on average, ring-shaped layouts deliver superior energy performance for science-and-technology parks.
Figure 9 presents the Potential Utilization Ratio of Renewable Energy (PURRE) for the 18 idealized park building clusters. The majority of values cluster around 30%, and none exceed 40%. Ranked from highest to lowest, the top four cases—A2-6, A2-3, B2-2 and A2-4—are all courtyard or hybrid layouts with relatively high building densities. Mean PURRE is marginally higher in circular clusters (30.8%) than in evenly distributed clusters (29.9%). Overall, half of the circular cases fall below 30%, yet a few achieve markedly higher self-sufficiency, indicating that judicious planning can unlock greater renewable-energy potential. Conversely, evenly distributed clusters exhibit more uniform PURRE values—just above 30%—with some under-performing examples. Collectively, circular science park layouts offer the larger potential for renewable-energy utilization.
Synthesizing the above findings for all 18 park building clusters, the circular layouts A2-6, A2-3 and B2-2 demonstrate superior integrated energy performance. Among these, A2-6 stands out distinctly: it shows the lowest NEUI, the highest PURRE and only a moderate total EUI, signifying that this cluster already possesses strong energy-saving potential during the planning stage.
4. Low-Carbon Design Strategies
4.1. Morphological Characteristics of Superior Integrated Energy Performance
Four exemplary clusters—A2-3, A2-4, A2-6 and B2-2—exhibit the best integrated energy performance among the 18 prototypes. For new block-scale science and technology park developed at medium intensity (FAR ≈ 1.6), the following morphological attributes should be targeted during the earliest design stage to secure superior integrated energy performance:
- Development intensity: Within allowable limits, maximize building density. The high-performing cases are all high-density parks at ~40 % site coverage; for new developments, a target range of 35–40 % is recommended.
- Spatial structure: Adopt a circular layout as the primary form. The park core should combine supporting facilities with or within landscaping, while the outer circle integrates research and development clusters and ancillary functions. Buildings should be arranged in courtyard or hybrid courtyard layout.
- Morphological parameters: Under the study’s prescribed FAR of 1.6, an average building height of 16–18 m (four to five stories) is optimal; where multi-stories height limits permit 20–24 m, the lower bound within this range yields improved energy performance. The building-cluster shape coefficient should be minimized—expected to fall between 0.15 and 0.20 after facade articulation. For predominantly mid-rise technology parks, long facades should be oriented north–south and the height-to-depth ratio kept to about 0.3. North–south inter-building spacing should generally not be less than 20 m for medium-intensity sites (FAR 1.0–3.0), and should be maximized beyond this threshold to reduce mutual shading.
- Building form: Prefer rectangular or square footprints of 2000–4000 m². Avoid complex multi-height assemblies. Stagger blocks along the north–south axis and limit continuous facade length to local code maxima.
4.2. Energy-Performance-Driven Low-Carbon Design Strategies
Drawing on the above findings and contemporary design practices for newly built science-and-technology parks, four low-carbon layout and design strategies are proposed.
4.2.1. High-density Development Strategy
For block-scale science-and-technology parks, land area is typically constrained and floor-area ratios are fixed by statutory plans. To meet low-carbon targets while conserving land, building density should be moderately increased within these limits. The preceding analysis indicates that a medium-intensity park (FAR 1.0–3.0) achieves favorable carbon performance at a building density of 35–40%. Densities above 40 % often complicate traffic organization and limit the diversity of building products; hence, they are not recommended.
Within such high-density settings, several key morphological parameters must be carefully controlled. North–south inter-building spacing should be adjusted in accordance with local codes and spatial form. To minimize energy demand, average building height should be kept as low as practicable, with minimal height variation among blocks, and should be dynamically aligned with the prescribed FAR and density. For a FAR of 2.0, an average height at the lower end of the 20–24 m range is advised, with story heights reduced wherever possible. The height-to-depth ratio should be maintained around 0.3, buildings elongated east–west, and spatial continuity achieved mainly through horizontal adjacency rather than vertical stacking. Individual buildings should adopt simple rectangular or square footprints with limited articulations; L- or C-shaped blocks must retain a principal north–south orientation. The building-cluster form factor should be kept close to 0.15.
4.2.2. Courtyard Layout Strategy
Circular layouts outperform evenly distributed clusters in overall energy terms, and the A2 type —whose center combines supporting facilities with landscape—produces the greatest number of cases exhibiting low NEUI and high PURRE. Consequently, planners should prioritize circular courtyard layouts and concentrate supporting facilities within the core to create an integrated public-service module framed by landscape.
In hot-summer and cold-winter zones, individual buildings should be oriented north–south; detailed solar simulations should fine-tune azimuths, while facades should face the prevailing annual wind vector with a deviation of ≤ 10°. Along summer wind corridors, clusters should be staggered—short, open rows upwind, taller, denser rows downwind; conversely, winter wind corridors should be closed. Open spaces should be sited on the quieter side of traffic arteries, and continuous street facades should act as acoustic barriers.
Besides, spaces of similar energy demand should be grouped horizontally or vertically. Low-performance areas (e.g., restrooms, stairwells) should occupy unfavorable orientations or peripheral zones; moderate-performance spaces (e.g., open-plan offices) should exploit favorable orientations to secure natural ventilation and daylight; high-performance spaces (e.g., research labs) should be located on the least exposed facade or at the building core so that mechanical conditioning is confined to where it is most needed. Larger footprints should incorporate courtyards or atria to optimize daylighting and thermal comfort. Semi-indoor or shaded outdoor spaces—designed as thermal buffers—should be integrated to extend transitional-season comfort in the hot-summer and cold-winter climate.
4.2.3. Supporting Function Centralized Layout Strategy
Supporting facilities are essential to the efficient operation of science and technology parks and typically account for 15–20 % of gross floor area, primarily in the form of retail and public services. Clustering identical or similar functions enables targeted, energy-conservation measures tailored to uniform load profiles. The preceding simulations show that A2-type parks, in which ancillary functions are centrally grouped, consistently achieve superior energy performance, confirming the carbon-saving benefits of concentrated support facilities. When site constraints preclude a central location, designers should consolidate these functions in one corner or along one edge of the plot, shaping modestly enclosed courtyards or interior streets that enhance spatial quality while preserving the energy advantages of aggregation.
4.2.4. Carbon Sink Enhancement Strategy
Elevating the green-space ratio simultaneously mitigates the energy penalty imposed by the urban heat-island effect and augments carbon sink. For high-density science-and-technology parks, a green-space ratio of 25–30% is optimal; where site constraints limit this to 20–25%, vertical and rooftop greening must be aggressively deployed.
To maximize the landscape system’s carbon sequestration potential, interventions should focus on carbon-sink expansion, multi-layer greening, and low-carbon, resource-efficient technologies.
Carbon-sink expansion entails selecting high-sequestration species and achieving a layered planting mix — tree : shrub : grass ≈ 4:3:3 by count or cover—that maximizes biomass and soil carbon storage [20].
Multi-layer greening emphasizes vertical complexity: ground-level planting is designed to be ecologically coherent, visually permeable and integrated with the urban green network, while facades and structures are exploited to create three-dimensional green systems.
Finally, low-carbon landscape technologies—including rainwater harvesting, grey-water reuse, permeable paving and waste-sorting systems—are deployed to conserve water and enhance adaptive capacity; permeable pavements along roads and plazas, for example, recharge fire-protection and irrigation cisterns, thereby reducing potable water demand and increasing resilience.
5. Conclusions
This study develops an integrated energy-performance assessment framework for block-scale science-and-technology parks by explicitly coupling solar-utilization potential with urban-heat-island impacts. After constructing idealized park building-cluster models, we analyzed energy-performance signatures and quantified the influence of six key morphological parameters, deriving low-carbon layout strategies for parks and complementary low-carbon measures for individual buildings. The main conclusions are:
- Based on a survey of existing parks, science-and-technology parks were classified into two spatial typologies—circular and evenly distributed clusters—from which 18 idealized models are generated to represent mid-rise, block-scale developments.
- An assessment methodology incorporating heat-island effects is established. First, six morphological parameters are selected to characterize each idealized model. Then, Ladybug Tools couple with Radiance simulated surface irradiance and photovoltaic potential, while Dragonfly generates microclimate-adjusted weather files for URBANopt-driven energy simulations. Finally, Net Energy Use Intensity (NEUI) and Potential Utilization Ratio of Renewable Energy (PURRE) are adopted as composite performance indicators.
- Comparative analyses reveal that circular layouts generally achieve lower NEUI and higher PURRE than evenly distributed ones; among specific configurations, courtyard layouts deliver the lowest NEUI and scattered layouts the highest. Four low-carbon design strategies are therefore proposed: high-density development guided by morphological-parameter control, courtyard-based spatial layout, centralized placement of supporting facilities, and carbon-sink enhancement through green technologies.
Author Contributions
Conceptualization, H.Y. and M.D.; methodology, M.D.; software, M.D and Y.C.; validation, H.Y., Y.C.; formal analysis, H.Y. and Y.C.; investigation, M.D.; resources, M.D.; data curation, M.D.; writing—original draft preparation, Y.C. and M.D.; writing—review and editing, H.Y. and Y.C.; visualization, M.D and Y.C.; supervision, H.Y.; project administration, H.Y.; funding acquisition, H.Y. All authors have read and agreed to the published version of the manuscript.
Data Availability Statement
The data presented in this study are available on request from the corresponding author.
Conflicts of Interest
The authors declare no conflicts of interest.
Abbreviations
The following abbreviations are used in this manuscript:
| FAR | Floor Area Ratio |
| BD | Building Density |
| GSP | Green Space Ratio |
| ABS | Average North–South Building Spacing |
| ABH | Average Building Height |
| HDR | Height-to-Depth Ratio |
| SF | Building-Cluster Shape Factor |
| SEGI | Solar Energy Generation Intensity |
| EUI | Energy Use Intensity |
| UWG | Urban weather Generator |
| SHGC | Solar Heat Gain Coefficient |
| NEUI | Net Energy Use Intensity |
| PURRE | Potential Renewable Energy Utilization Rate |
References
- Lyu, B. Low-Carbon Development Theory and Practice of Industrial Parks; China Development Press: Beijing, China, 2016. [In Chinese].
- Li, F.; Gong, C.; Yang, K. Application of Low-Carbon Ecological Strategies in Modern Industrial Park Planning and Architectural Design. Decorative Decoration World 2022, 12, 22–24. [In Chinese].
- Izquierdo S, Rodrigues M, Fueyo N. A method for estimating the geographical distribution of the available roof surface area for large-scale photovoltaic energy-potential evaluations. Solar Energy. 2008;82(10):929-39. [CrossRef]
- Gu, C. China’s High-Tech Industries and Parks; CITIC Press: Beijing, China, 1999; pp. 5–21. [In Chinese].
- Tang, X. Research on the Spatial Layout of Shanghai Industrial Parks and Their Integration with New Town Development [Ph.D. Dissertation]; East China Normal University: Shanghai, China, 2014. [In Chinese].
- Xu, J.; Zhang, X. Research and Planning Design of China’s Industrial Parks; Tongji University Press: Shanghai, China, 2015. [In Chinese].
- Zhang, H. Research for Public Space Systems Design of High-Density Science and Technology Park [Master’s Thesis]; Shenzhen University: Shenzhen, China, 2019. [In Chinese].
- Yang, Z. Research on Three Dimensional Design of Public Space in High-Density Science and Technology Industrial Park [Master’s Thesis]; South China University of Technology: Guangzhou, China, 2021. [In Chinese].
- Wu, Y.; Song, S. Comparative Study on the Spatial Form of “Internet +” Emerging Industrial Parks in Hangzhou West Innovation Corridor——Taking Xixi Park of Alibaba, the First Phase of ZOTP and Dream Town as Examples. Architecture & Culture 2018, 10, 83–85. [In Chinese].
- Xu, S. Current Situation and Prospect of Green Low Carbon Park. Shanghai Energy Conservation 2019, 6, 438–440. [In Chinese].
- Liu, Y.; Wang, X.; Wang, J.; Zeng, X.; Wang, W. Exploration on the Construction Scheme of Near-zero Energy Consumption and Near-zero Carbon Smart Park. Intelligent Building & Smart City 2023, 10, 12–15. [In Chinese].
- Wang, J. Research on the Distribution and Evaluation of Solar Photovoltaic Potential in Urban Block Scale [Master’s Thesis]; Huazhong University of Science and Technology: Wuhan, China, 2018. [In Chinese].
- Tian, J. Research on Solar Photovoltaic Potential of Urban Residential Areas [Master’s Thesis]; Huazhong University of Science and Technology: Wuhan, China, 2020. [In Chinese].
- National Development and Reform Commission; Ministry of Housing and Urban-Rural Development. Notice on Issuing the Development Plan for the Yangtze River Delta Urban Agglomeration [EB/OL]. (2016-06-03) [2023-08-15]. Available online: https://www.ndrc.gov.cn/xxgk/zcfb/ghwb/201606/t20160603_962187.html (accessed: 15 August 2023). [In Chinese].
- GB 55015-2021. General Code for Building Energy Efficiency and Renewable Energy Utilization; China Architecture & Building Press: Beijing, China, 2021. [In Chinese].
- JGJ/T 449-2018. Standard for Green Performance Calculation of Civil Buildings; China Architecture & Building Press: Beijing, China, 2018. [In Chinese].
- Unzeta BB. Study and prediction of the energy interactions between buildings and the urban climate [Ph.D. dissertation]. Cambridge (MA): Massachusetts Institute of Technology; 2012.
- Bande L, Afshari A, Al Masri D, Jha M, Norford L, Tsoupos A, et al. Validation of UWG and ENVI-Met Models in an Abu Dhabi District, Based on Site Measurements. Sustainability. 2019;11(16):4378. [CrossRef]
- Salvati A, Monti P, Coch Roura H, Cecere C. Climatic performance of urban textures: Analysis tools for a Mediterranean urban context. Energy and Buildings. 2019;185:162-79. [CrossRef]
- Zhang, H.; Cui, K. Design Guidelines for Green Public Buildings Adapted to Hot-Summer/Cold-Winter Climate; China Architecture & Building Press: Beijing, China, 2021. [In Chinese].
Figure 1.
Two types of layout structures in science and technology parks: (a) Circular spatial structure; (b) Evenly distributed cluster structure.
Figure 1.
Two types of layout structures in science and technology parks: (a) Circular spatial structure; (b) Evenly distributed cluster structure.
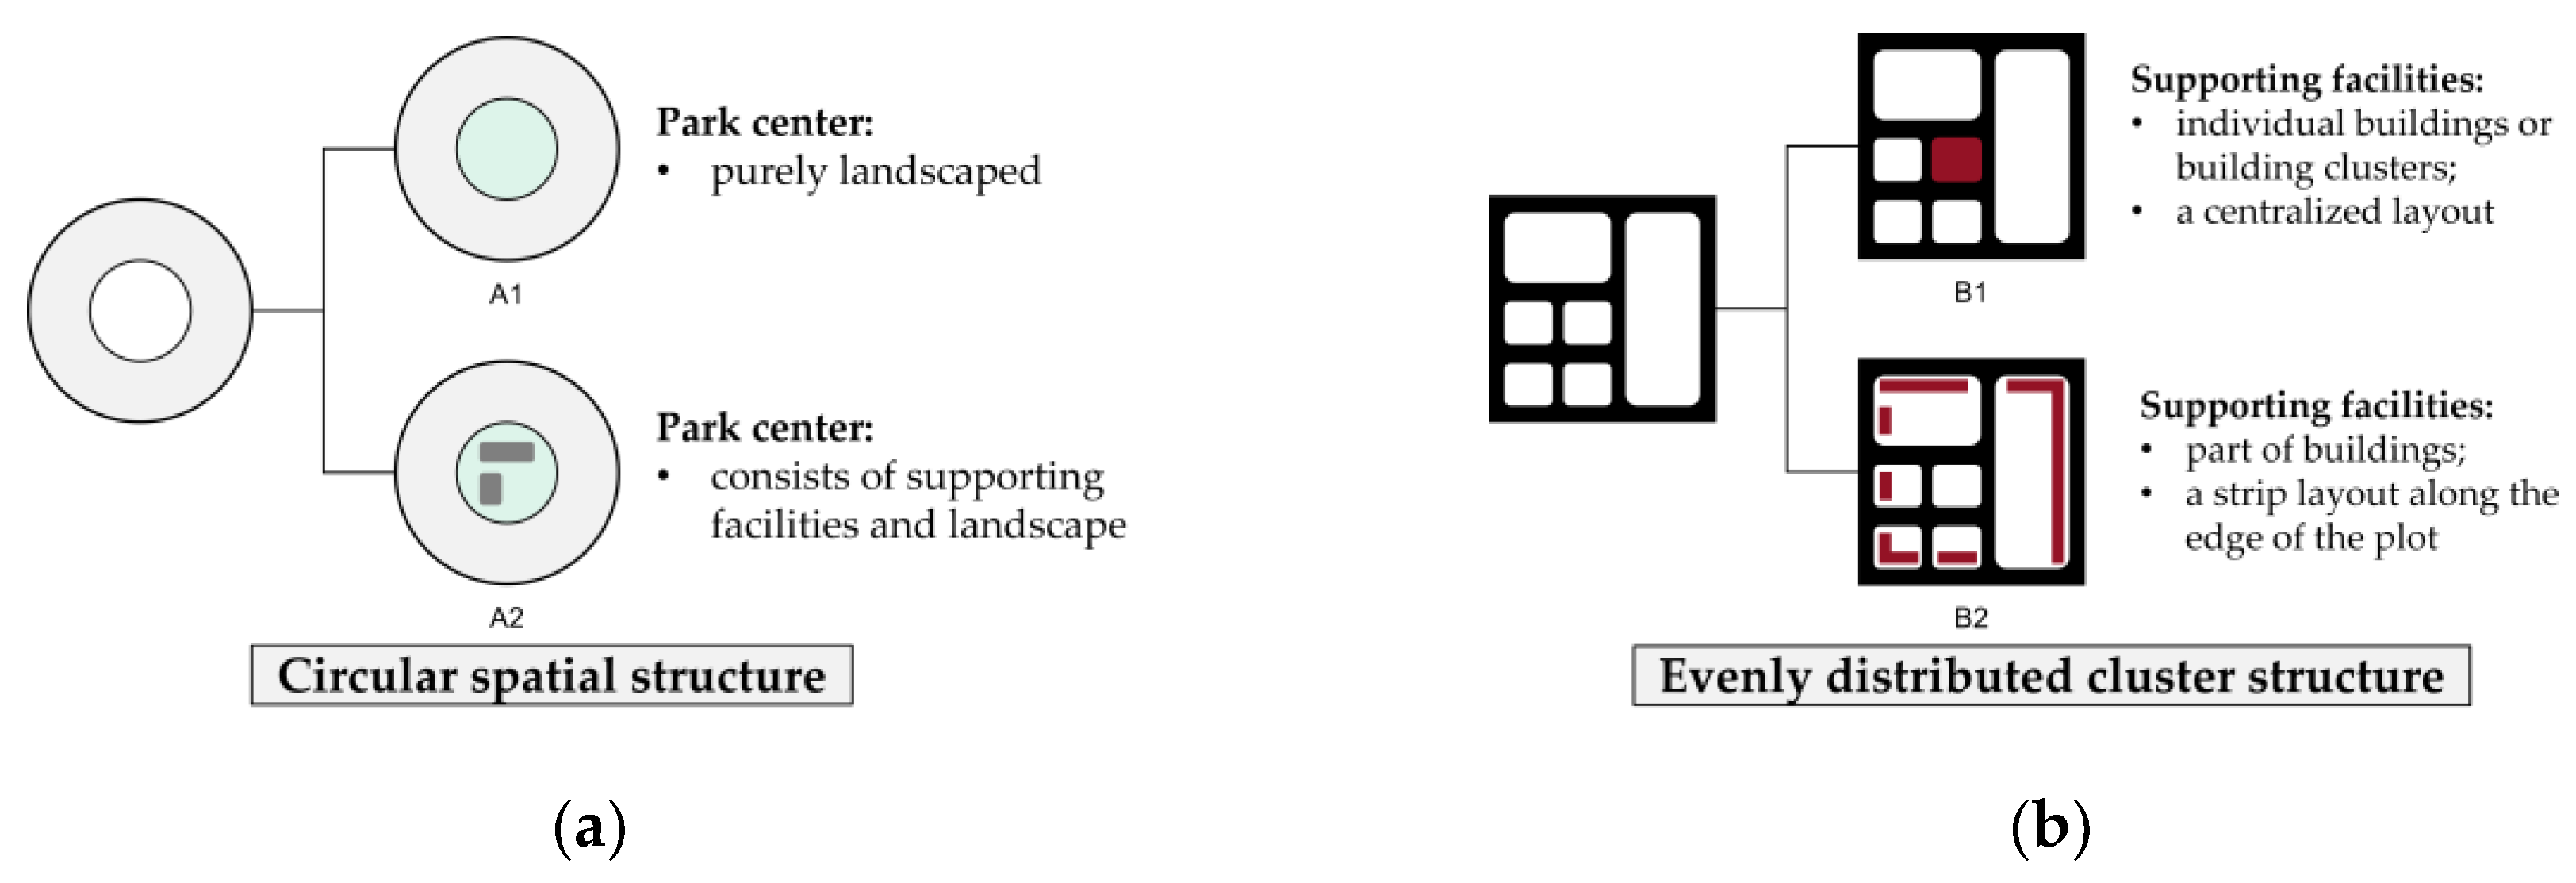
Figure 2.
18 idealized park building cluster models.
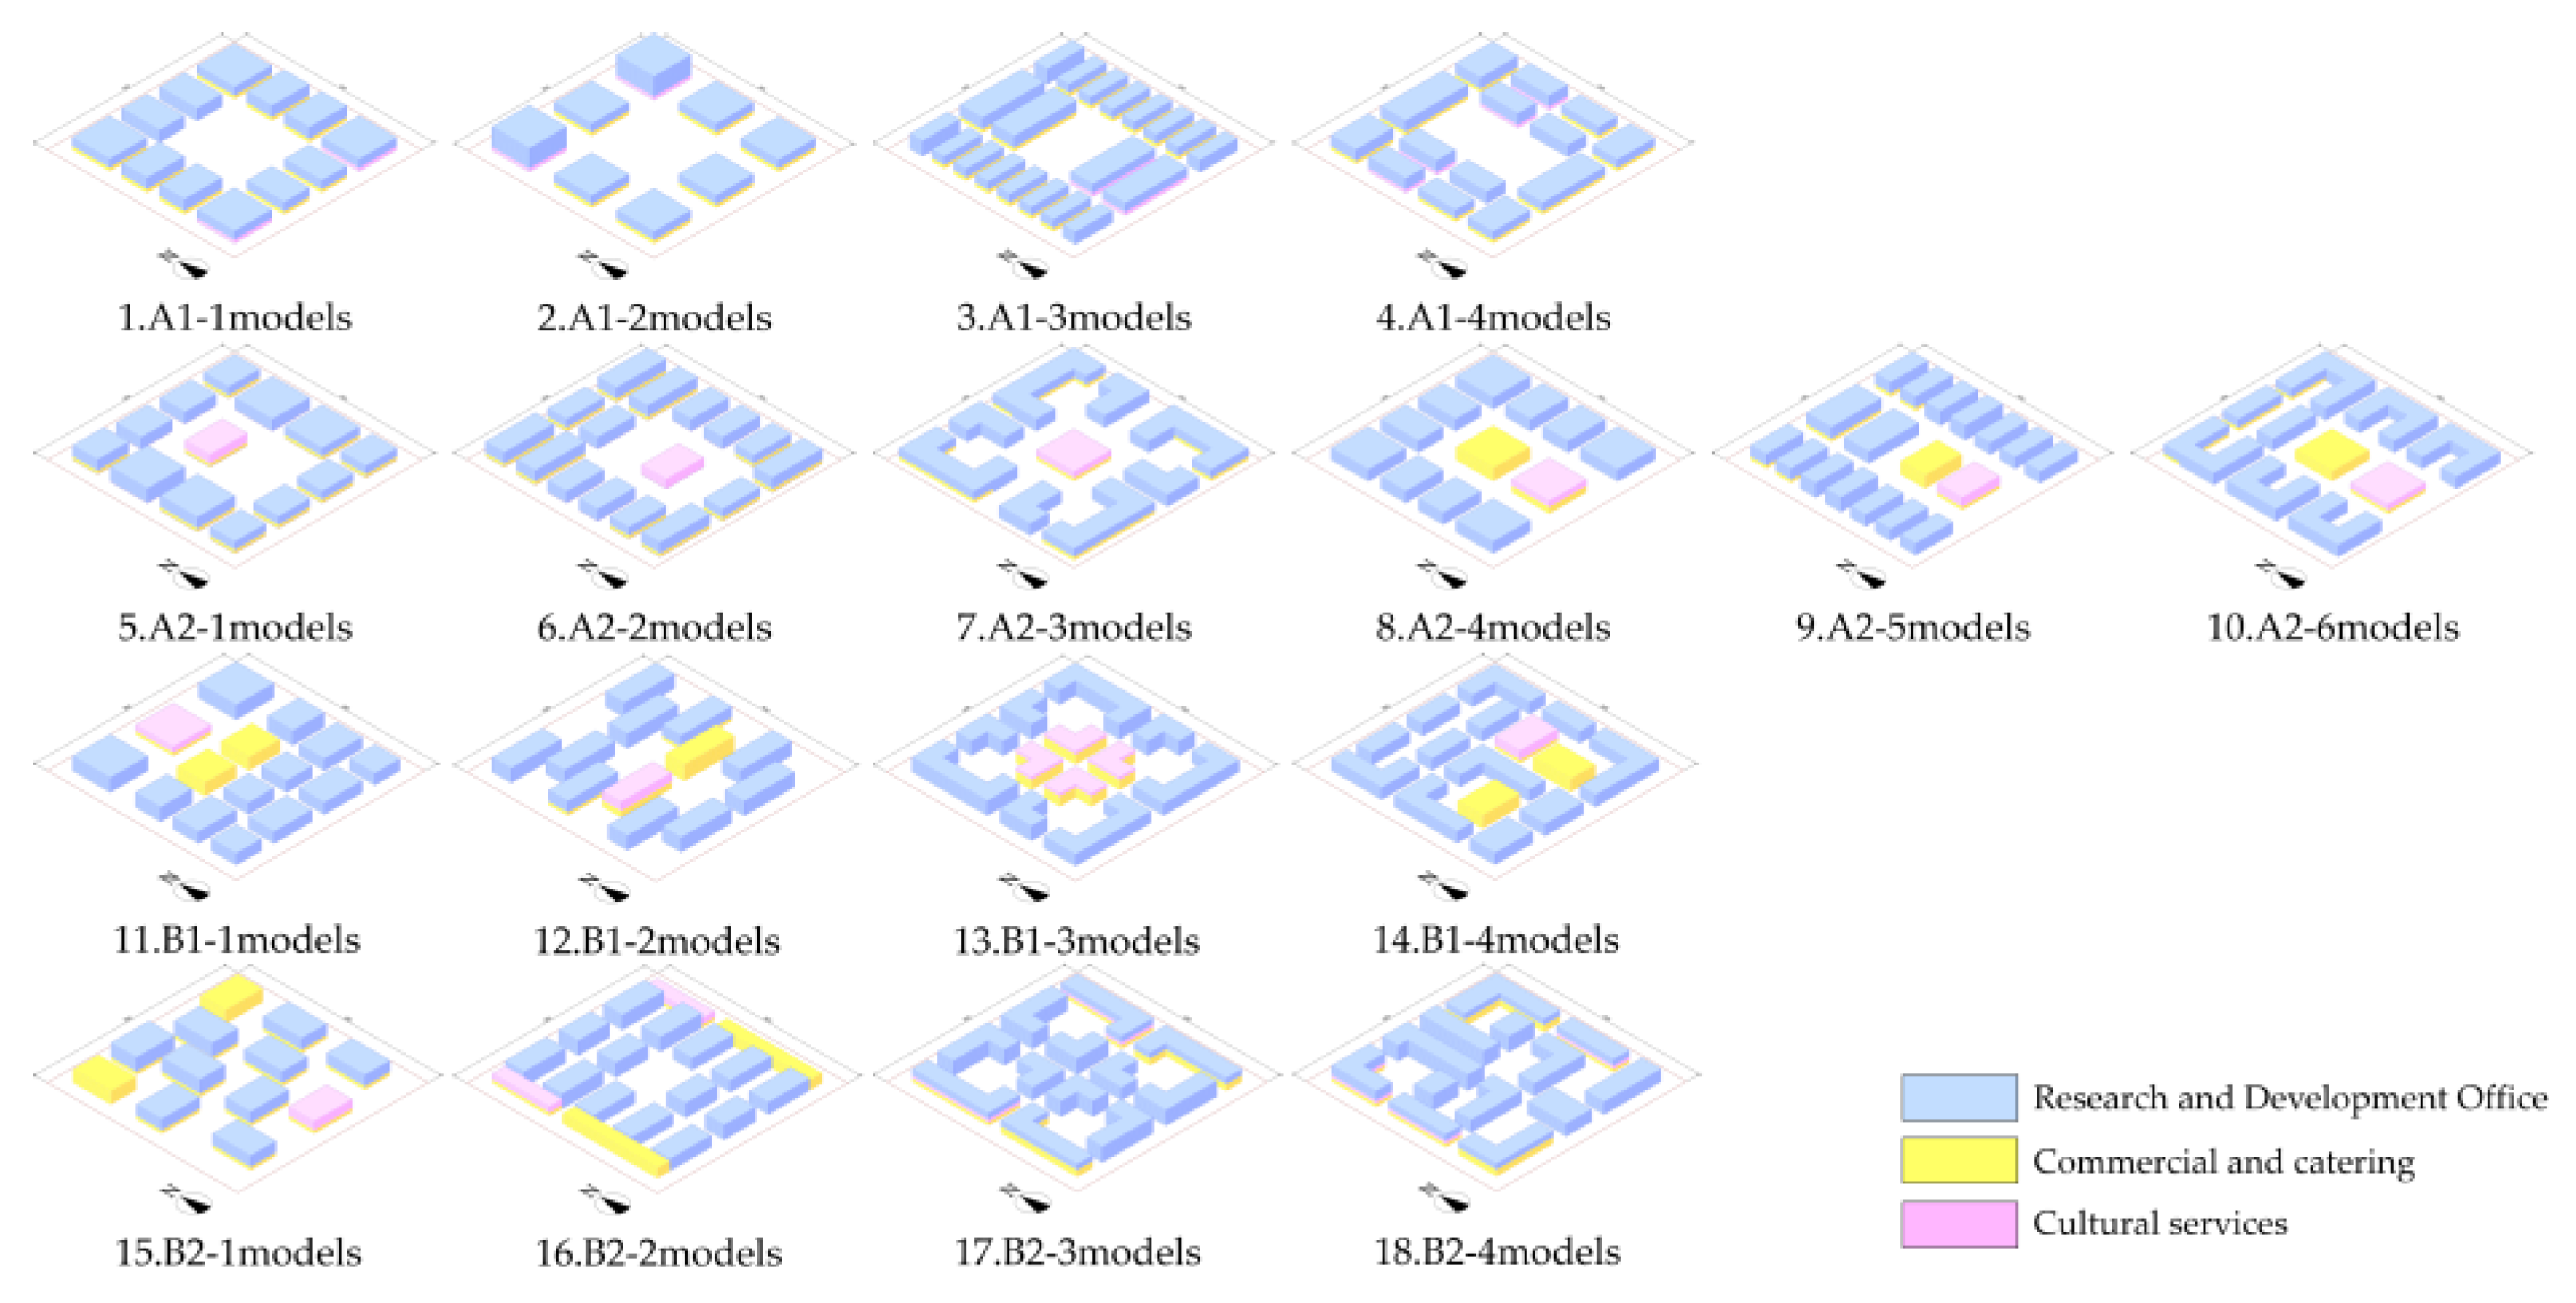
Figure 3.
Integrated Energy Performance Evaluation System.
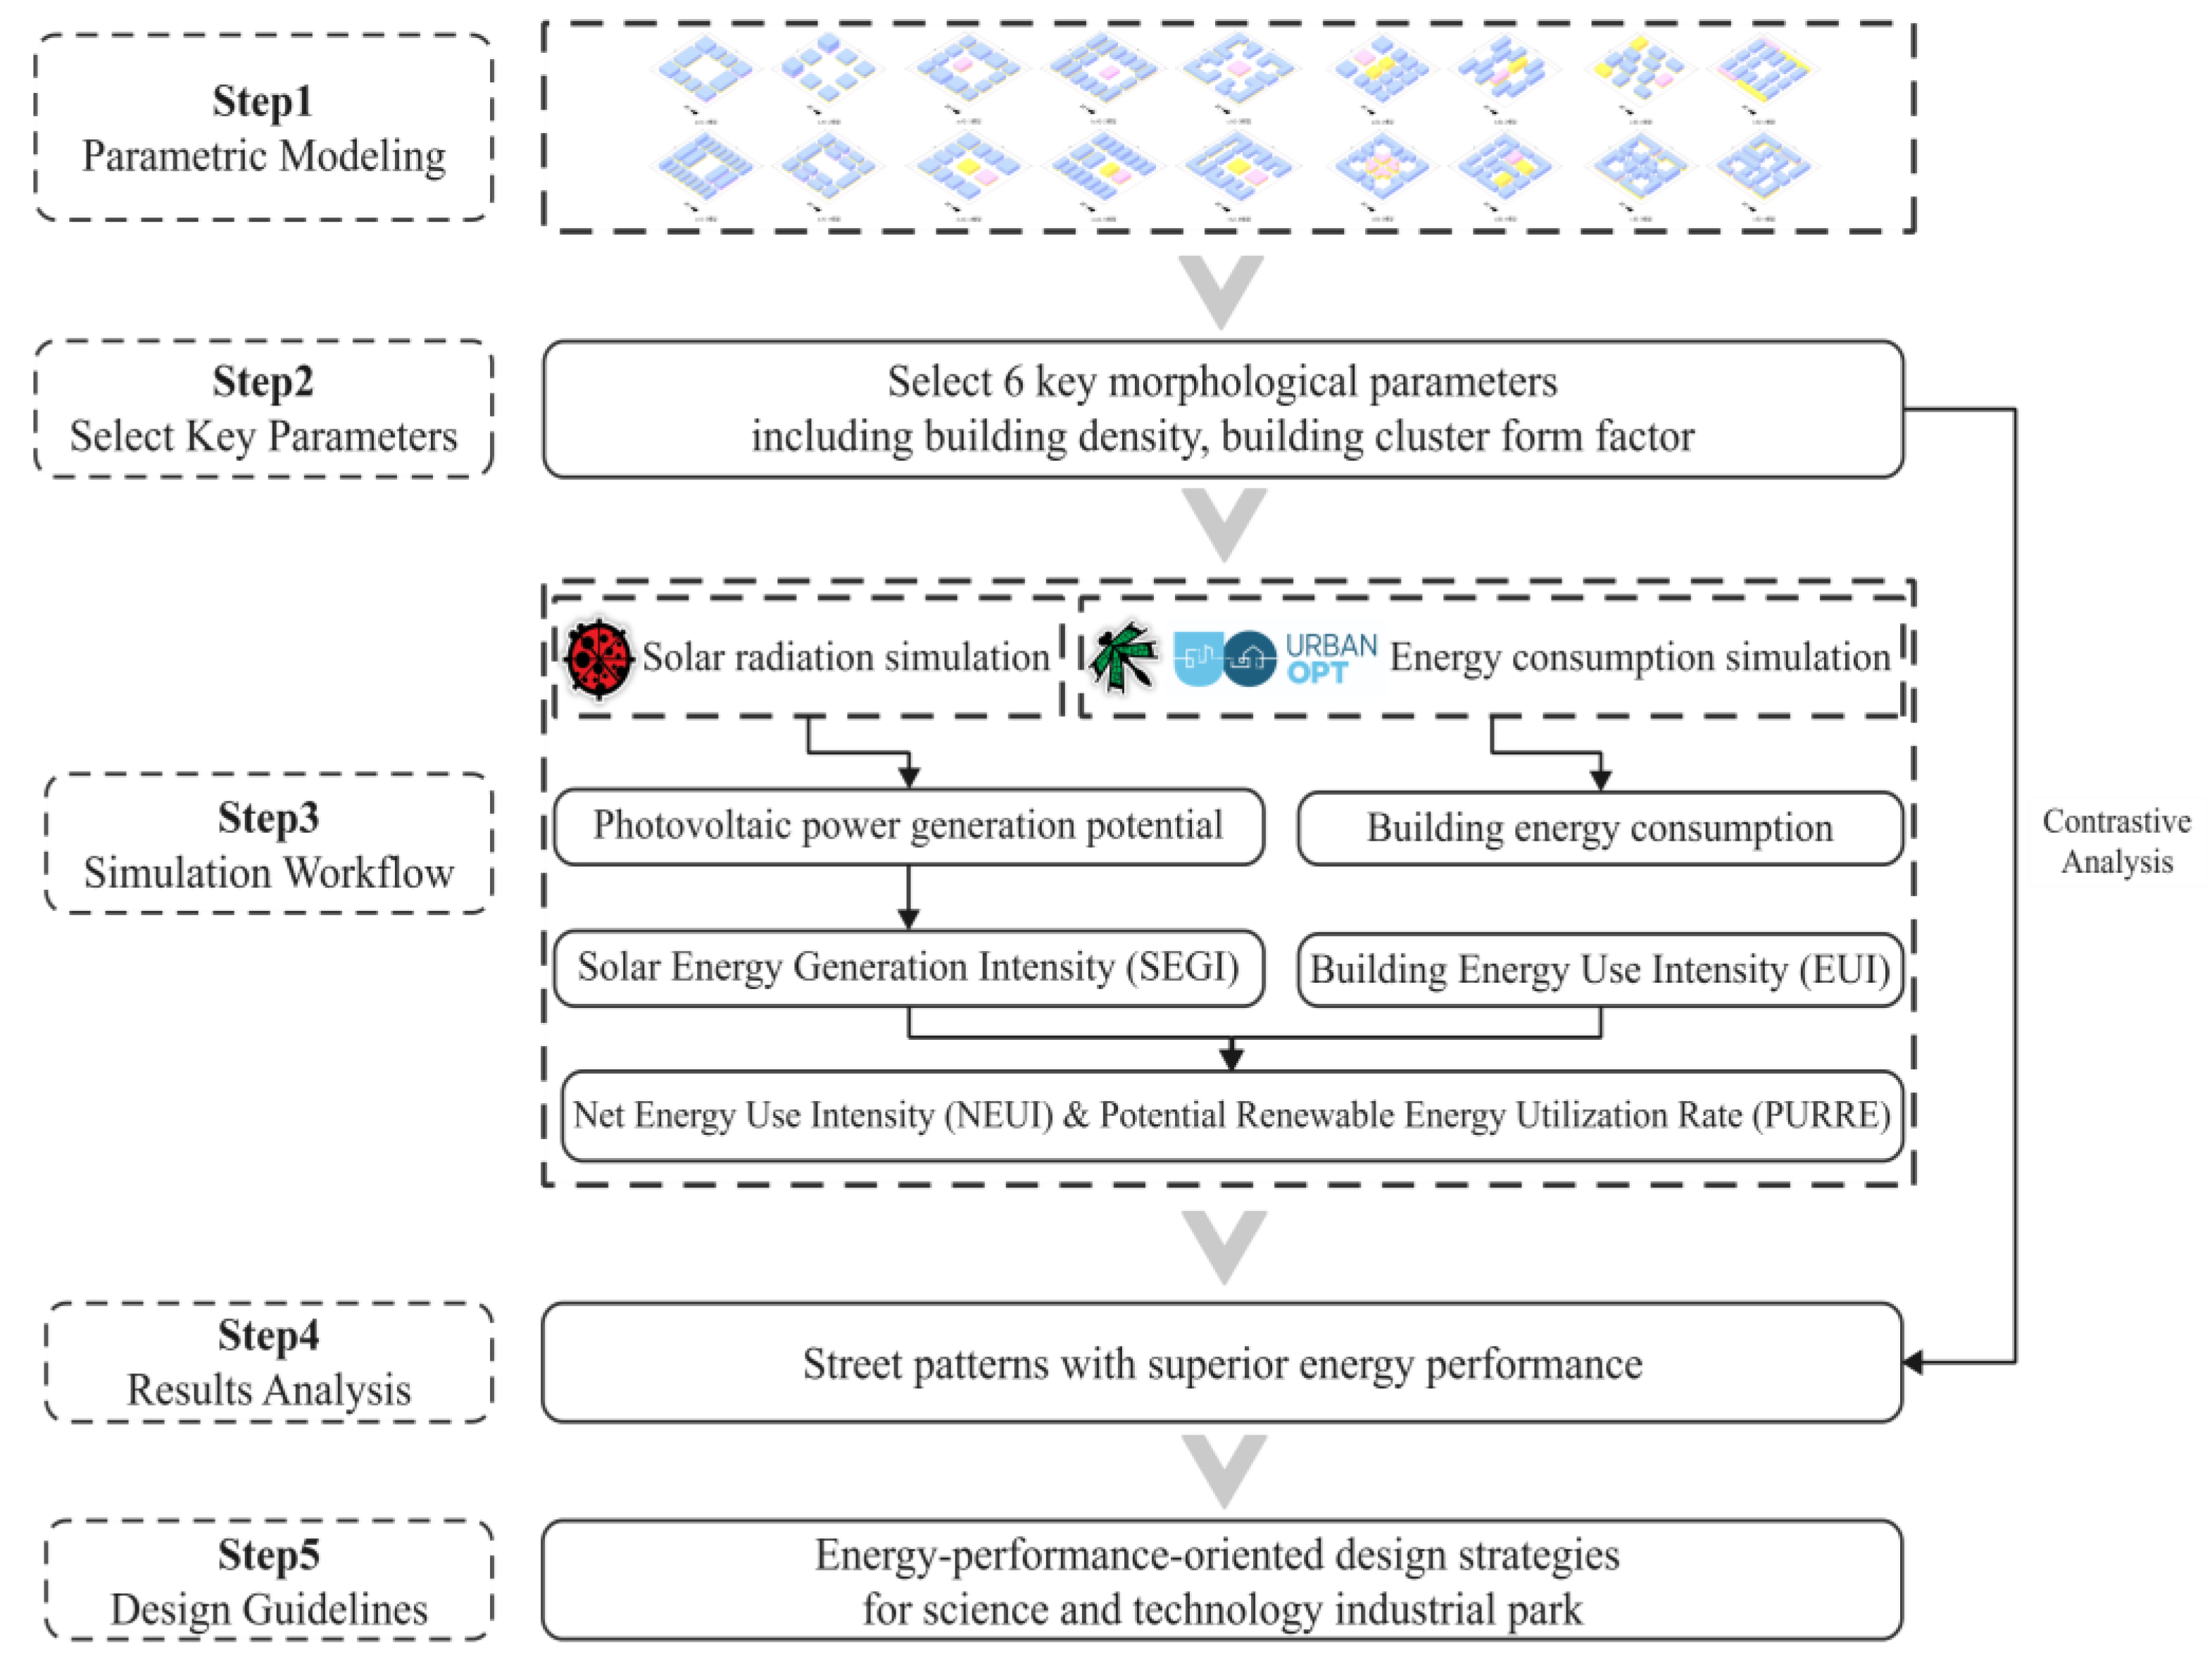
Figure 4.
Simulation workflow for photovoltaic potential.
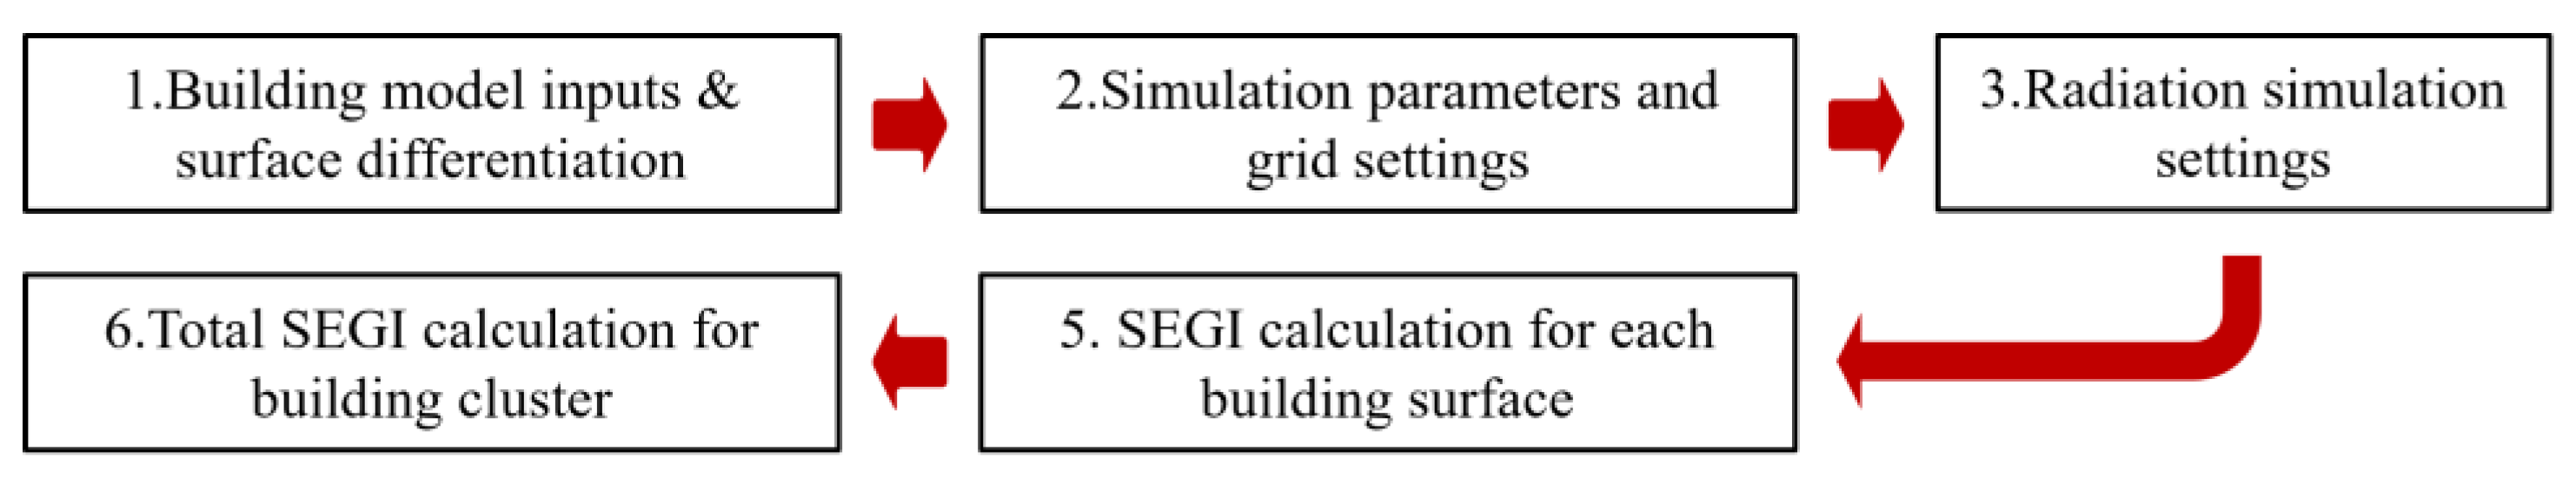
Figure 5.
Total SEGI for the 18 idealized park building clusters.
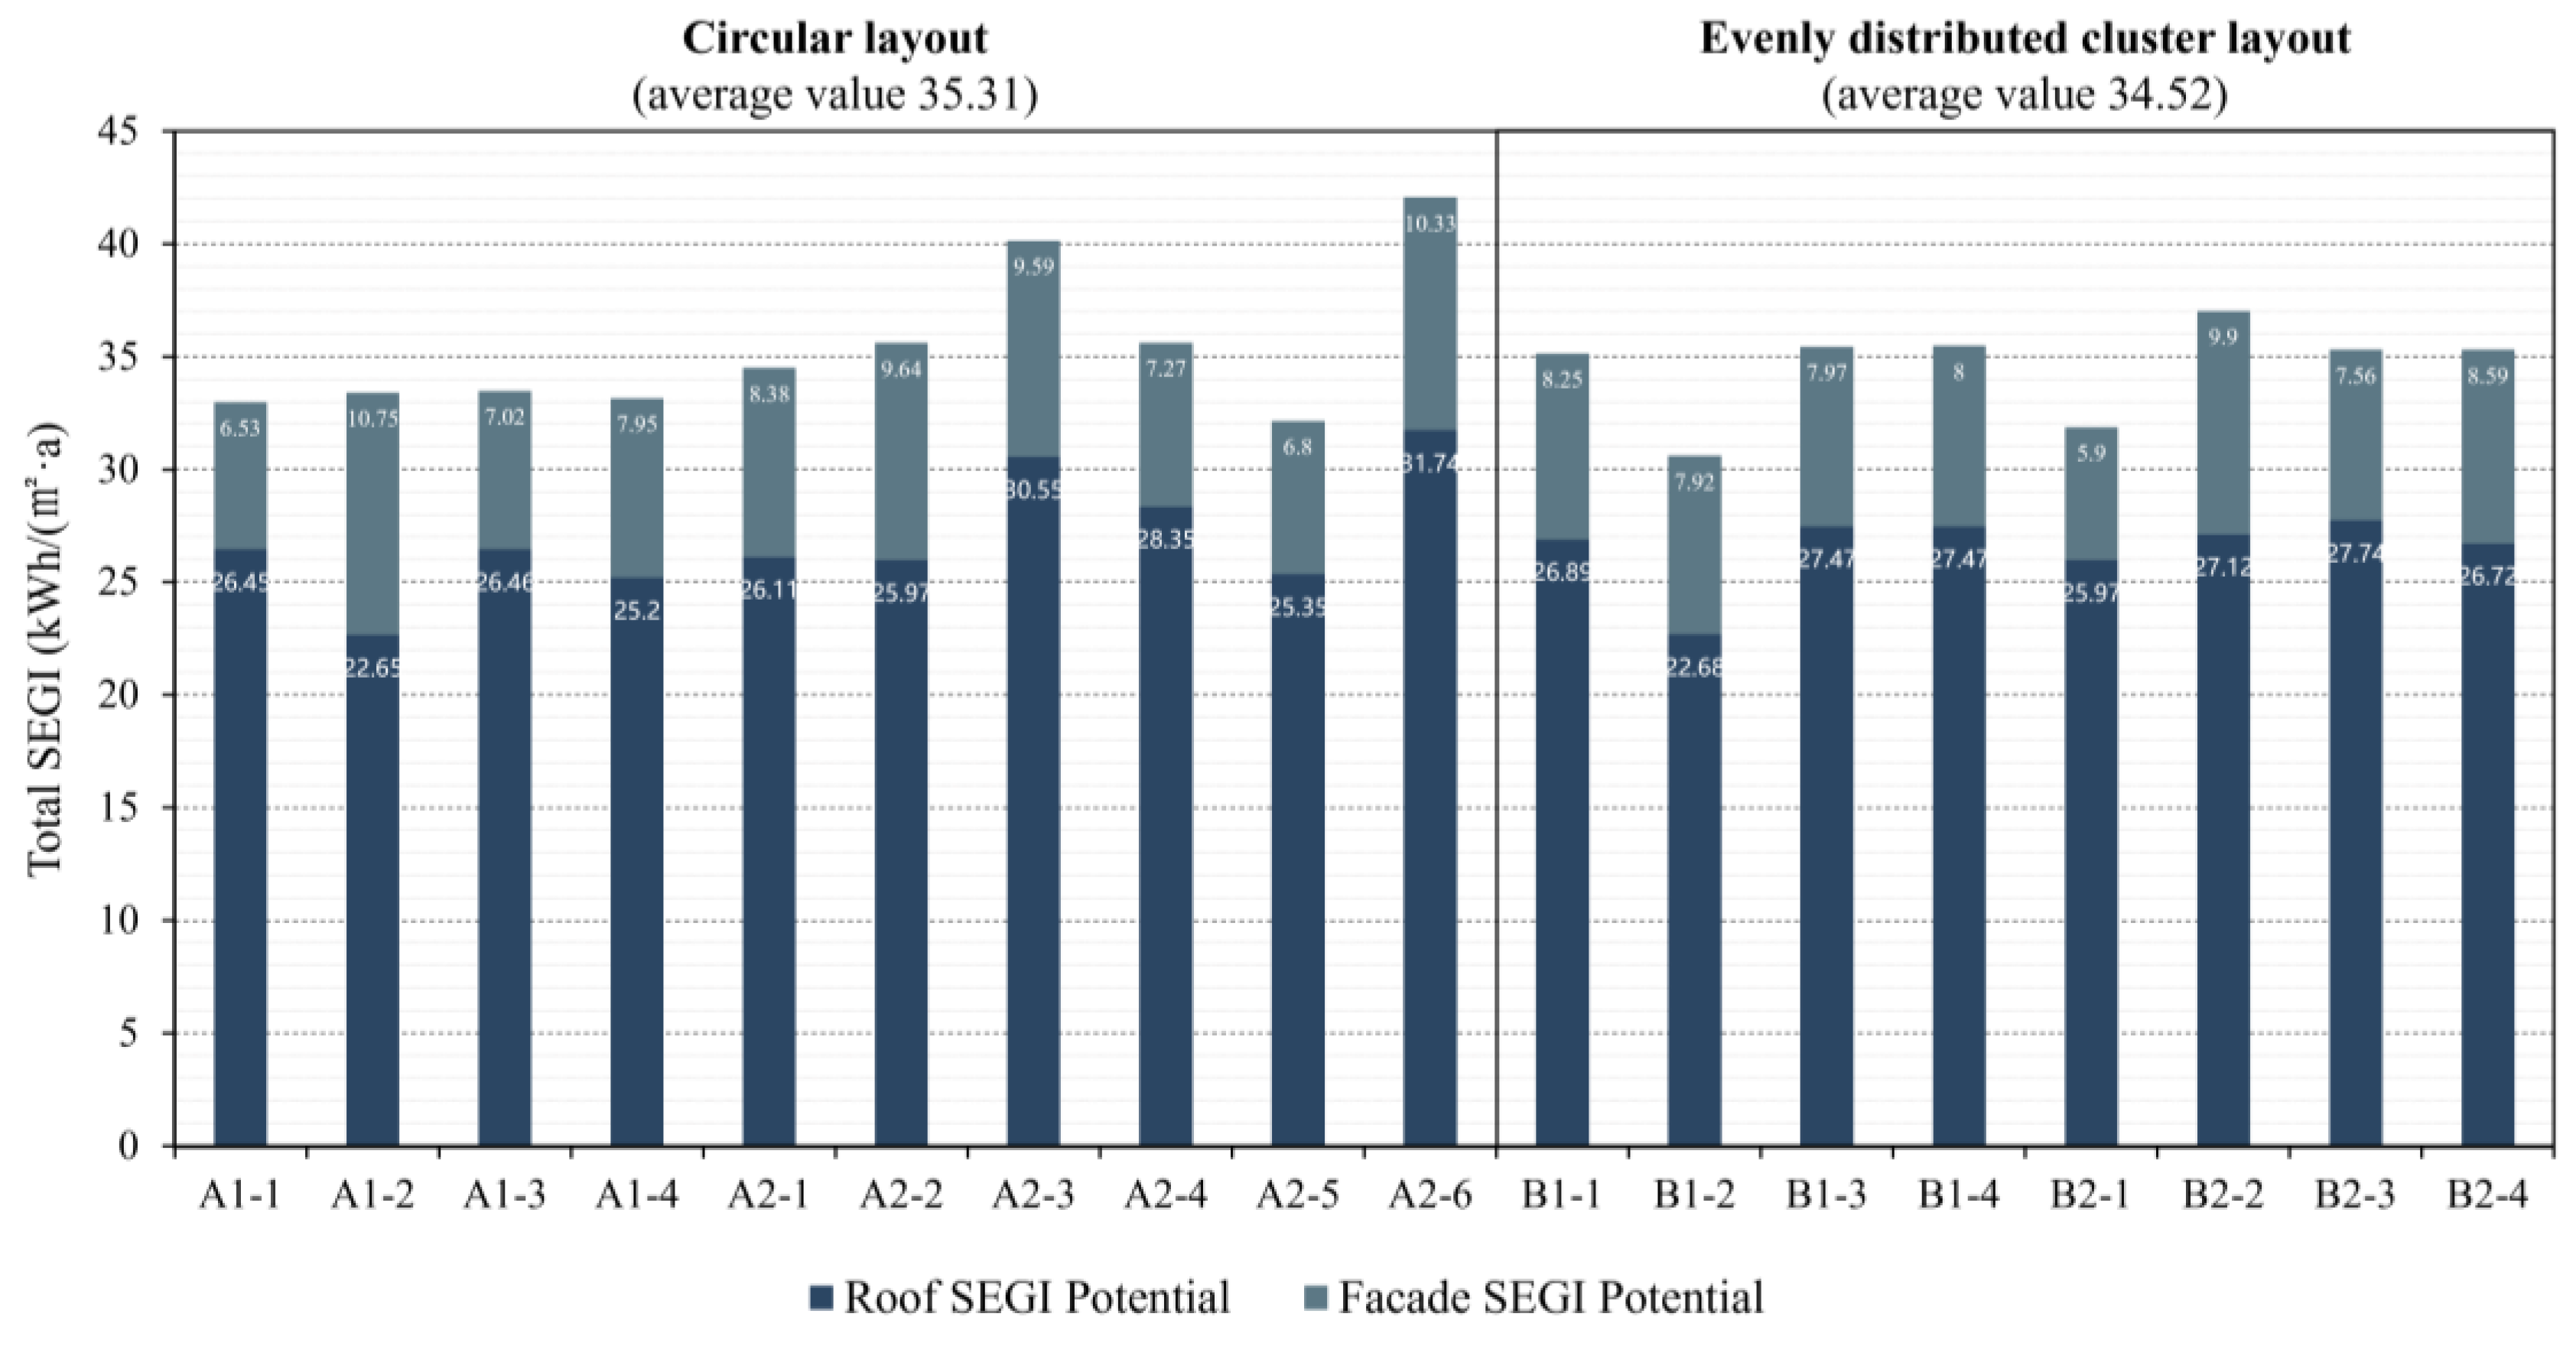
Figure 6.
Energy use simulation workflow.
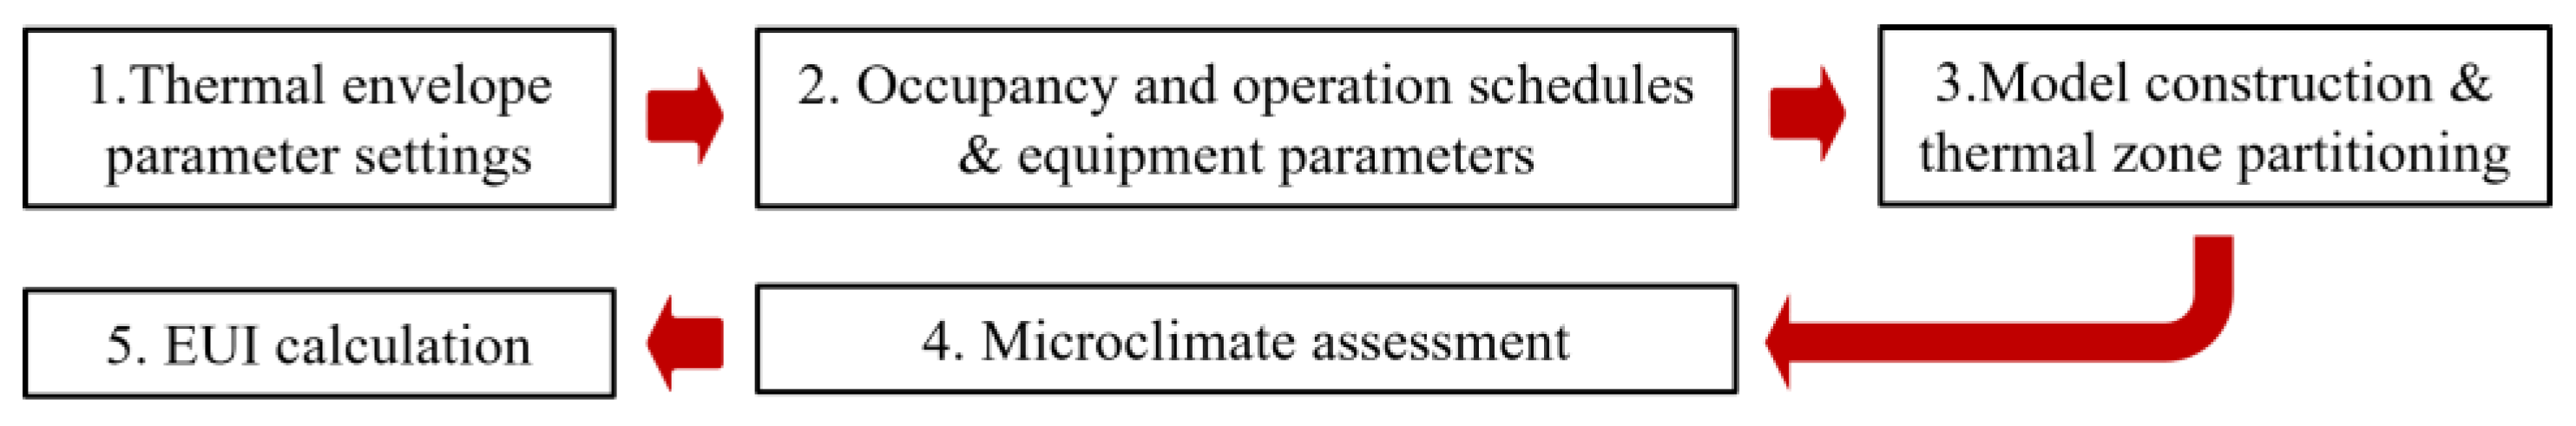
Figure 7.
Total EUI for the 18 idealized park building clusters.
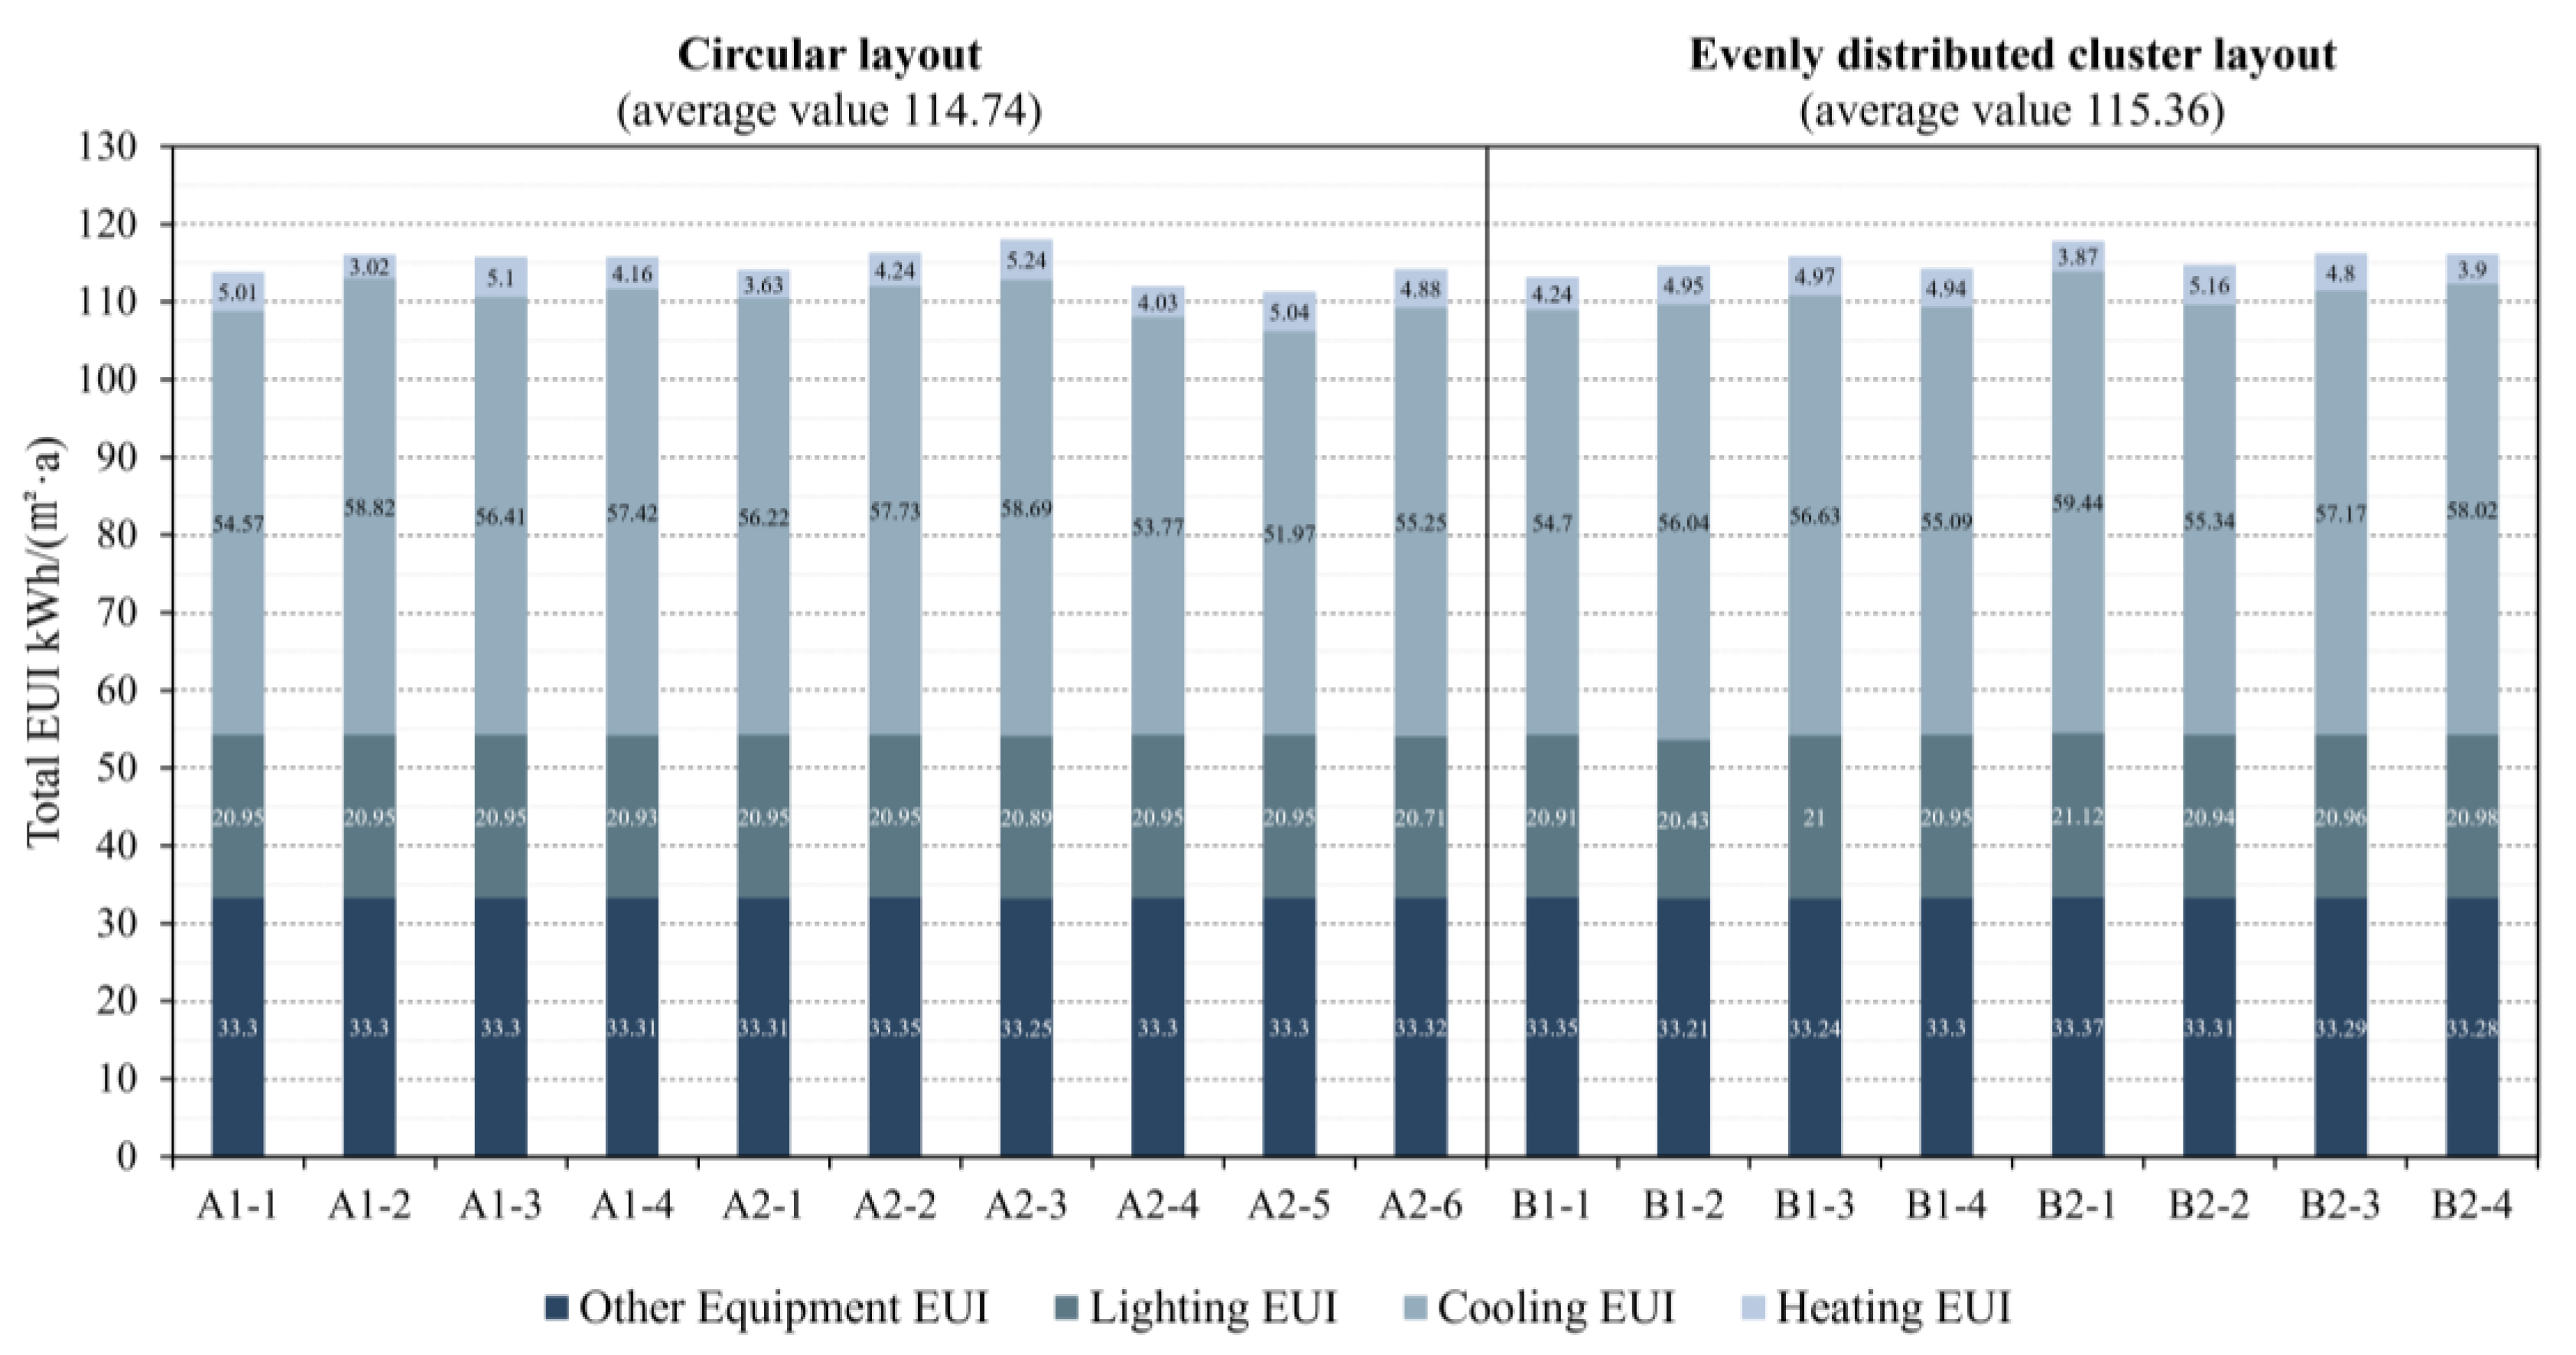
Figure 8.
NEUI for the 18 idealized park building clusters.
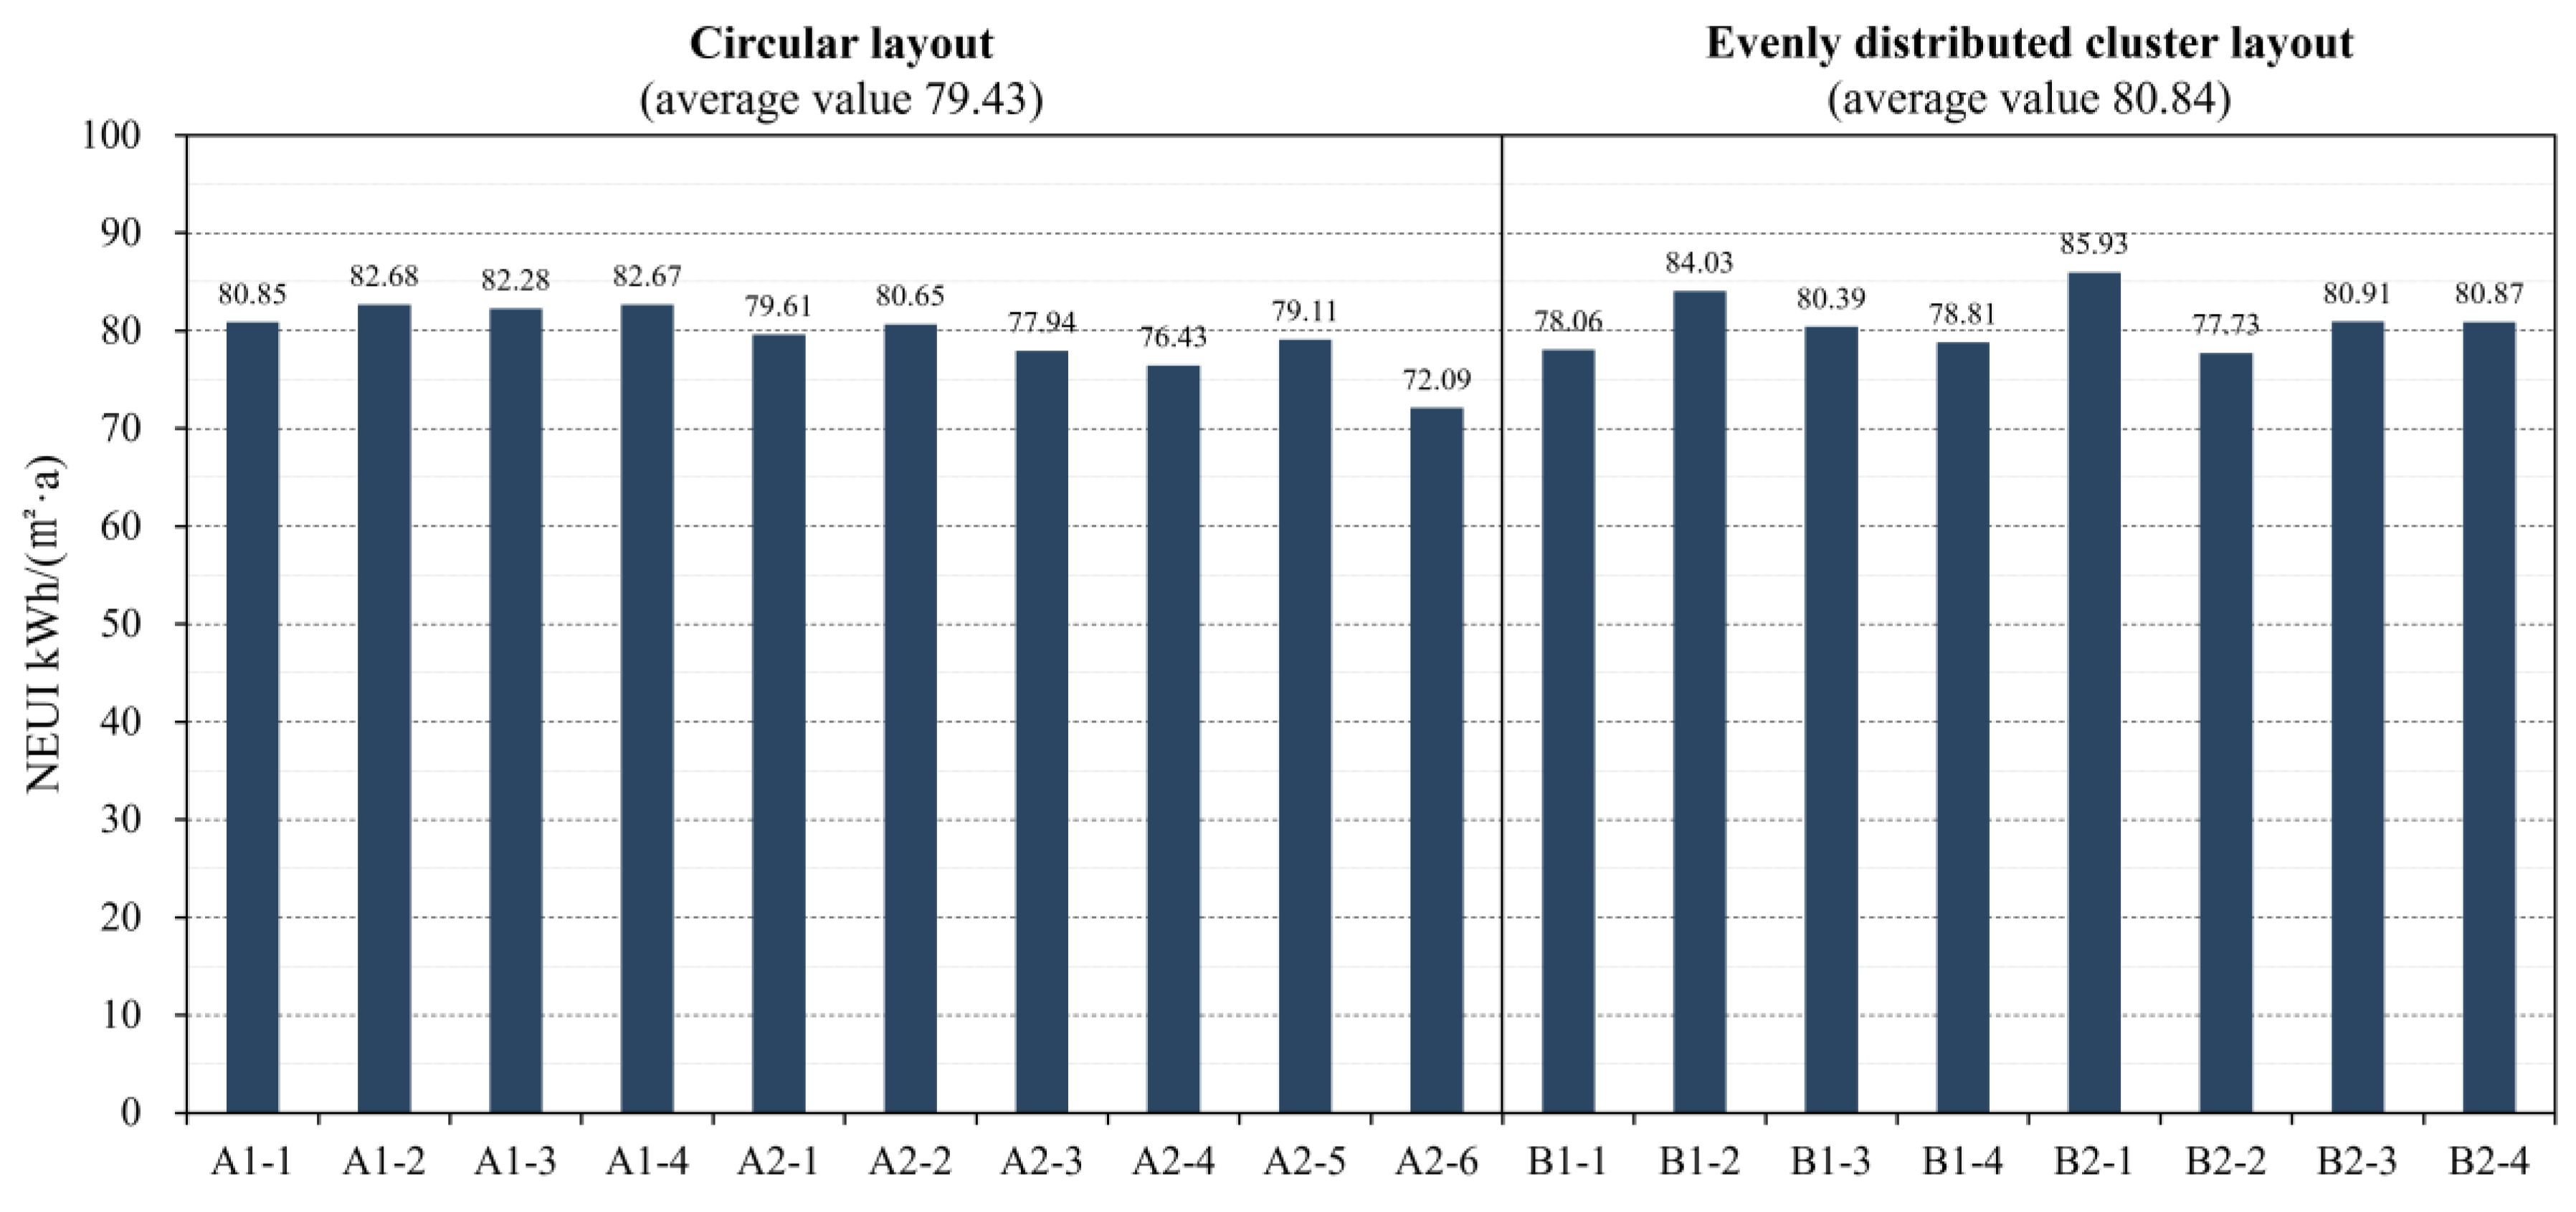
Figure 9.
PURRE for the 18 idealized park building clusters.
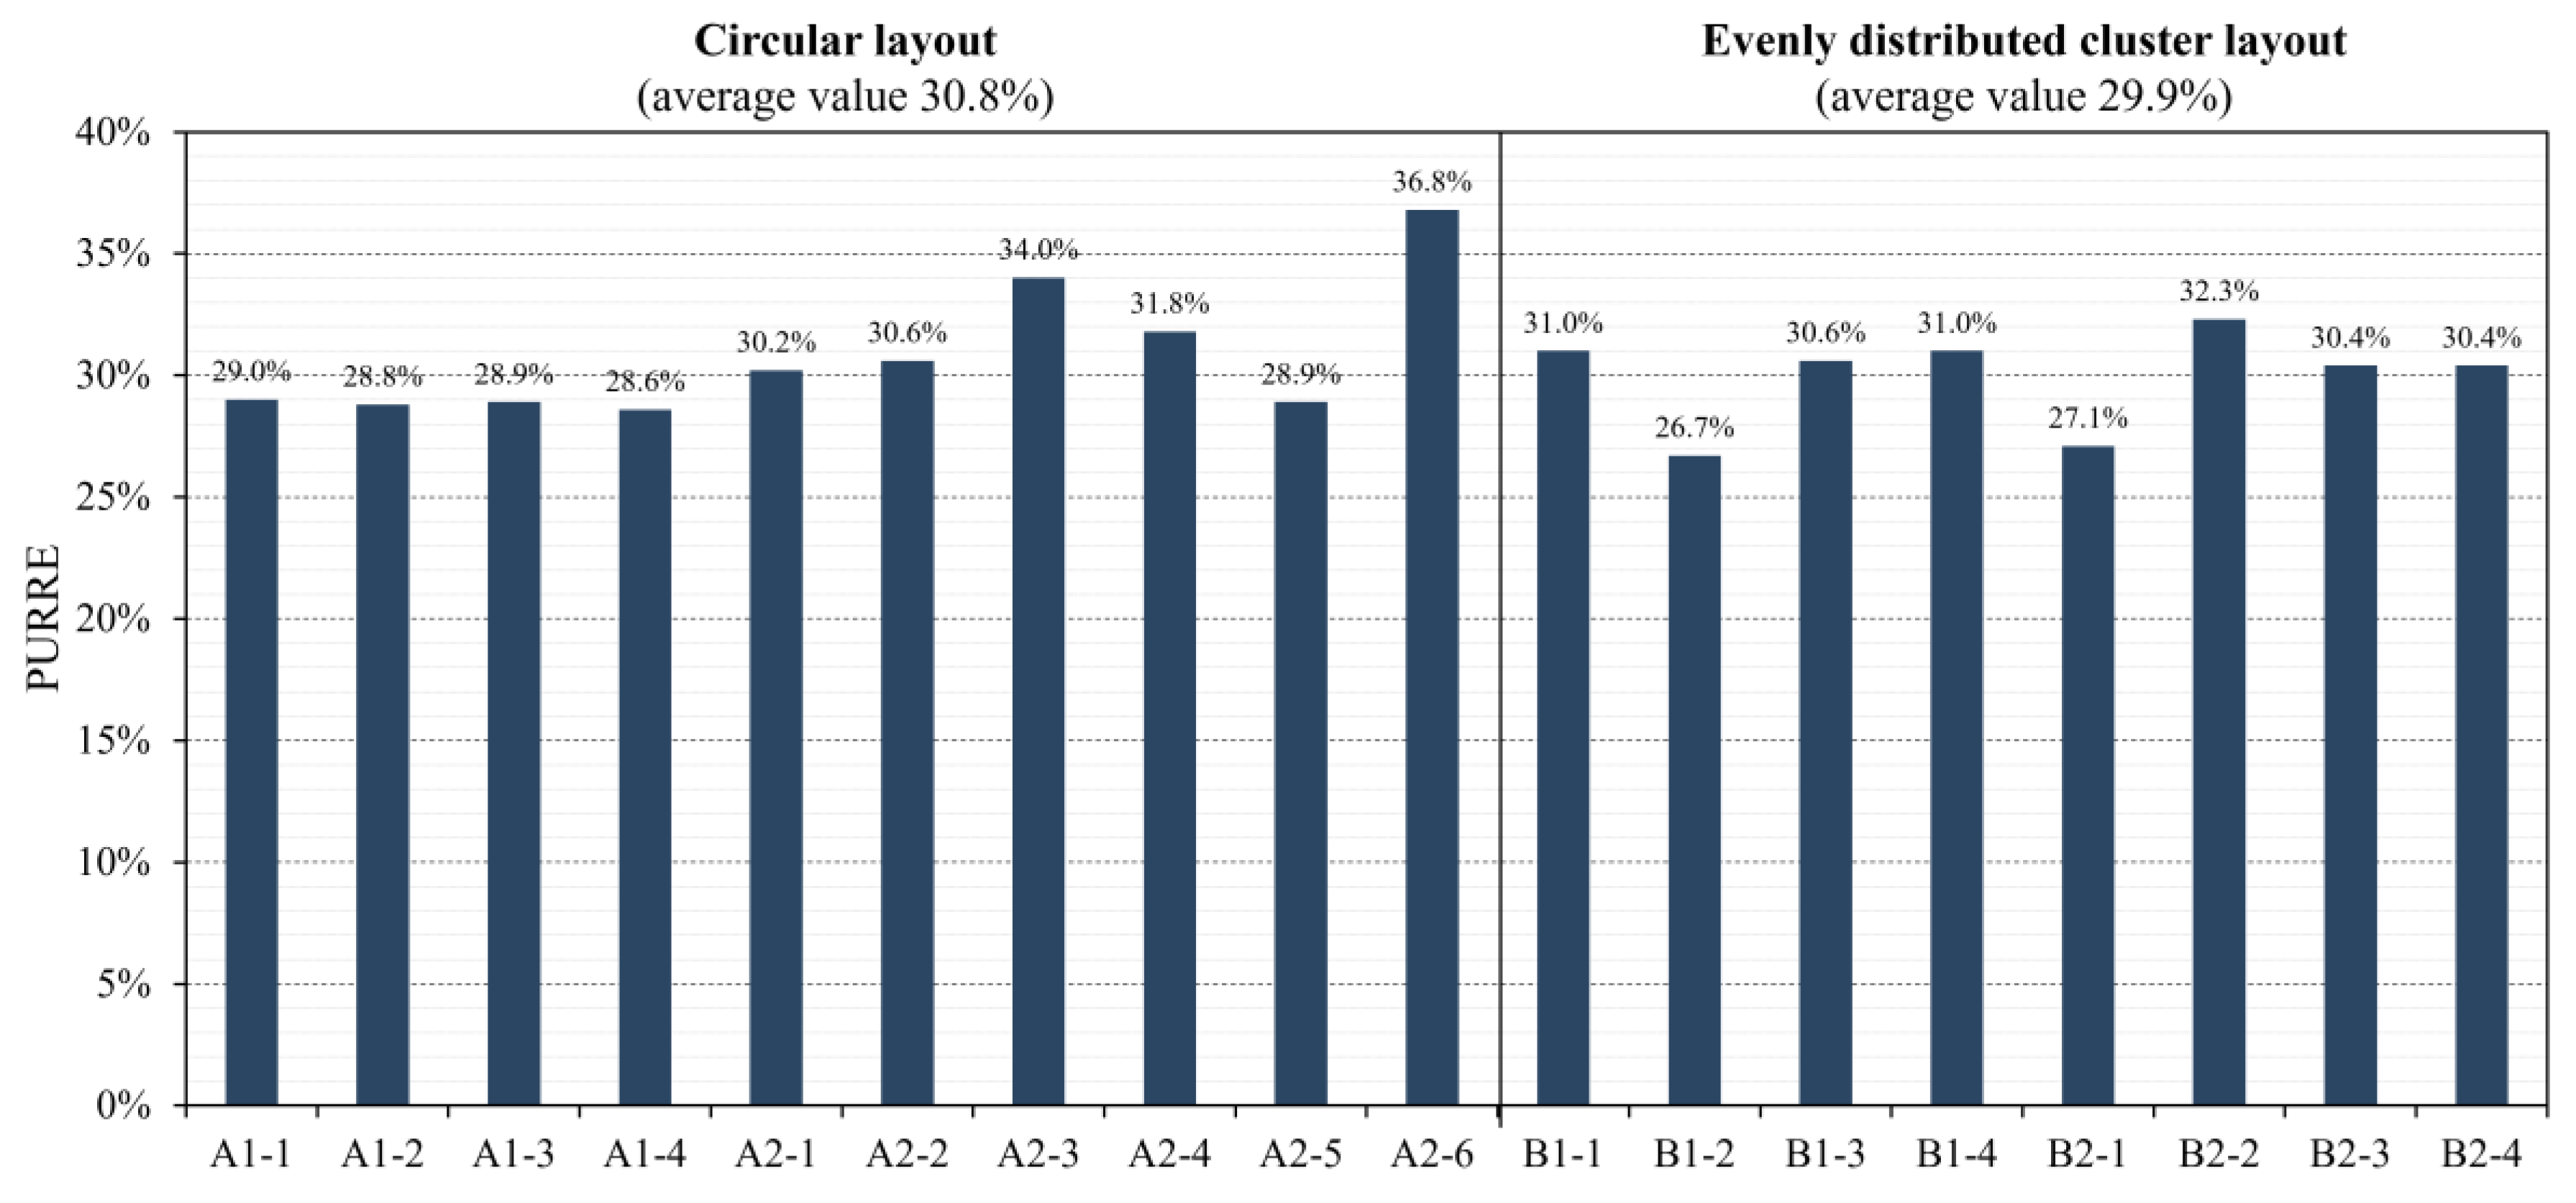

Table 1.
Six key morphological parameters of park building clusters.
|
Morphological Parameters |
Equations / Prescribed Limits | Definitions | Schematic Diagram |
| Building Density (BD) | The ratio (%) of the aggregate footprint area of all buildings to the gross site area within a given land parcel. It indicates the compactness of park development. | 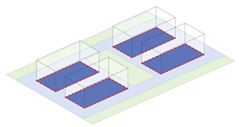 |
|
| Green Space Ratio (GSP) |
|
The percentage of the total area of all green spaces to the gross site area within a given land parcel, indicating the degree of landscaping and vegetative coverage. | 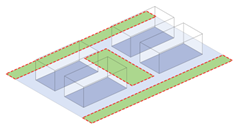 |
| Average North–South Building Spacing (ABS) | The minimum perpendicular distance between the exterior facades of two adjacent buildings or structures measured along the north–south axis; distances exceeding 50m are excluded from the calculation. This metric indicates the vertical morphology of the building cluster. | 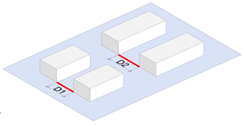 |
|
| Average Building Height (ABH) | The average height of all individual buildings within a given site, reflecting the overall vertical profile of the buildings. | 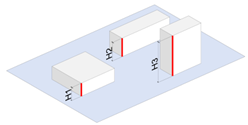 |
|
| Height-to-Depth Ratio (HDR) | The volume-weighted average height of the building cluster divided by its volume-weighted average depth, quantifying the vertical-to-horizontal proportions of the park. | 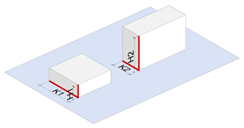 |
|
| Building-Cluster Shape Factor (SF) | The ratio of the external envelope area exposed to outdoor air to the enclosed volume of the building, indicating the geometric complexity of the built form and the extent of the heat-exchange surface. | 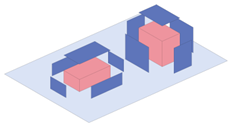 |
Where: C = footprint area of the ground floor (m²). A = site area (m²). H = building height (m). S = external surface area of a single building (m²). V = volume of a single building (m³). D = perpendicular (north–south) distance between adjacent buildings (m). K = short-edge length of the building (m).
Table 2.
Building Cluster Envelope Parameters.
| Envelope Component | K-value [W/m2·K] | SHGC |
| roof | 0.4 | / |
| exterior wall | 0.8 | / |
| floor | 0.8 | / |
| exterior window | 2.2 | 0.4 |
Table 3.
Window opening information settings.
| Functional type | Orientation | Window-to-wall ratio | Sill height | Window height | Window spacing | Floor-to-Floor Height |
| study and development office |
South facade | 0.25 | 0.9m | 2.4m | 3m | 4.2m |
| North facade | 0.25 | |||||
| East facade | 0.2 | |||||
| West facade | 0.2 | |||||
| commercial and catering |
South facade | 0.2 | 0.9m | 2.4m | 3m | 4.5m |
| North facade | 0.2 | |||||
| East facade | 0.1 | |||||
| West facade | 0.1 | |||||
| cultural services | South facade | 0.3 | 0.9m | 2.7m | 4.5m | 4.2m |
| North facade | 0.2 | |||||
| East facade | 0.15 | |||||
| West facade | 0.15 |
Table 4.
Microclimate Simulation Parameters.
| Data type | Value | Data source / Basis |
| meteorological data | Shanghai Standard Weather Data |
https://www.ladybug.tools/epwmap/ |
| sensible heat (excl. buildings) |
5W/m2 | UWG recommended value |
| greenspace ratio | calculated from Table 1 | as determined in this study |
| road albedo | 0.05 | the study by Boccalatte et al. [19] |
| vegetation albedo | 0.25 | the study by Boccalatte et al. [19] |
Disclaimer/Publisher’s Note: The statements, opinions and data contained in all publications are solely those of the individual author(s) and contributor(s) and not of MDPI and/or the editor(s). MDPI and/or the editor(s) disclaim responsibility for any injury to people or property resulting from any ideas, methods, instructions or products referred to in the content. |
© 2025 by the authors. Licensee MDPI, Basel, Switzerland. This article is an open access article distributed under the terms and conditions of the Creative Commons Attribution (CC BY) license (http://creativecommons.org/licenses/by/4.0/).
Copyright: This open access article is published under a Creative Commons CC BY 4.0 license, which permit the free download, distribution, and reuse, provided that the author and preprint are cited in any reuse.


