
Submitted:
10 July 2025
Posted:
03 August 2025
You are already at the latest version
Abstract
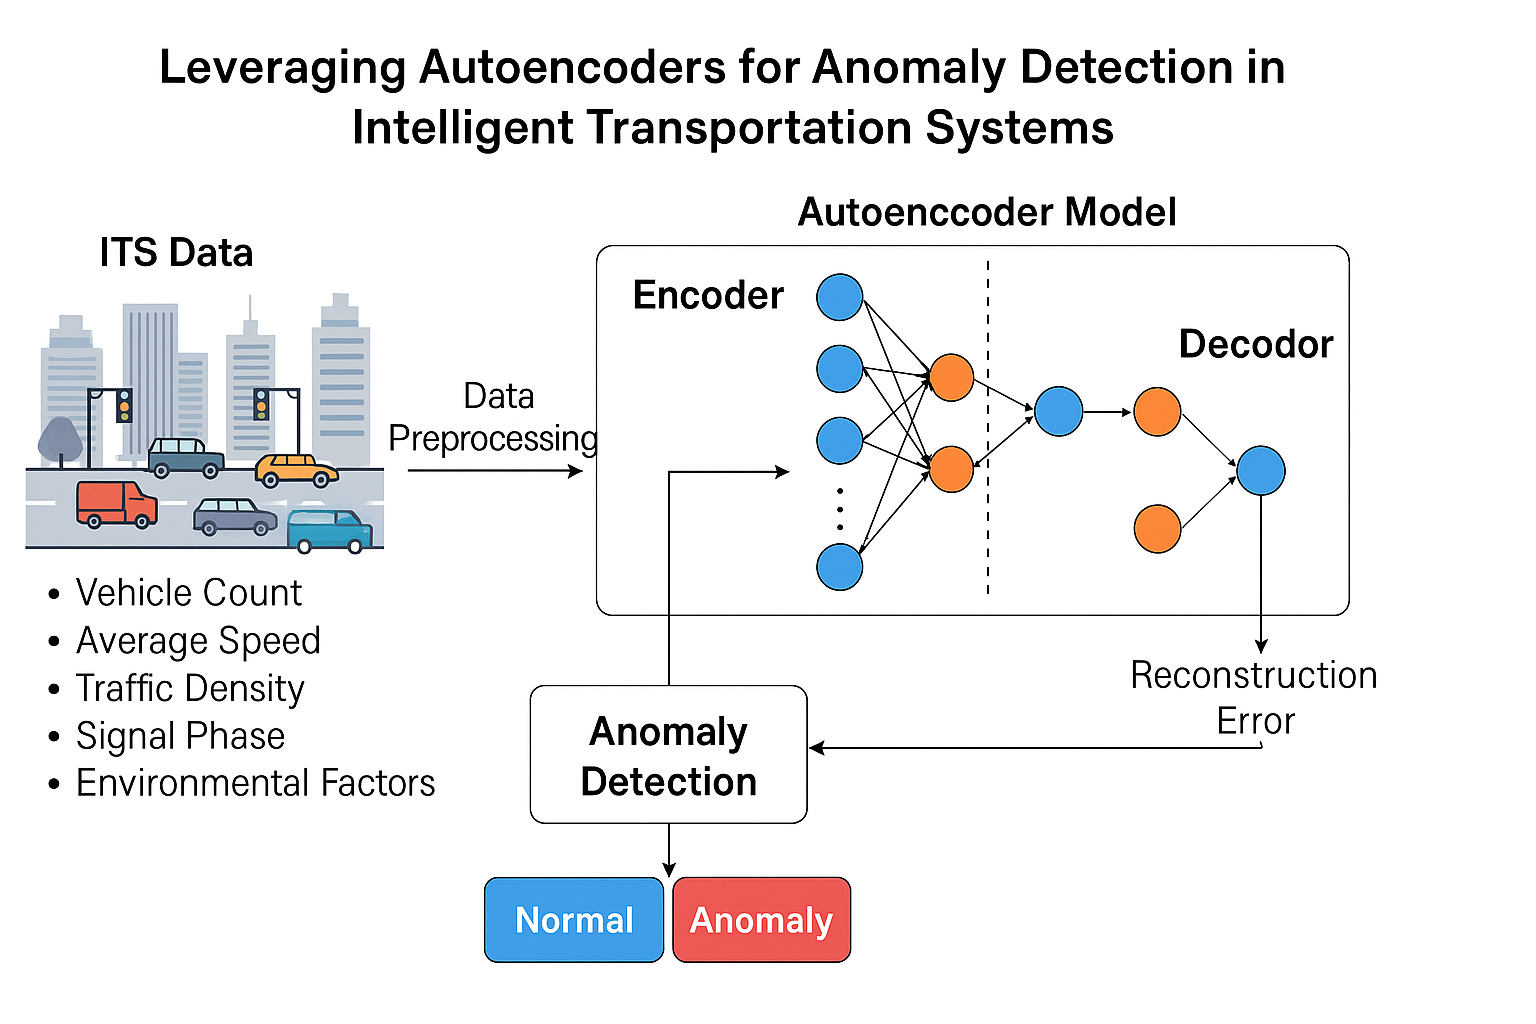
As cities grow smarter and more connected, so do the threats lurking in our transportation networks. Intelligent Transportation Systems (ITS), while revolutionary, are vulnerable to unexpected disruptions, ranging from cyber intrusions to sensor malfunctions and abnormal traffic behavior. This study explores how autoencoders, a class of unsupervised neural networks, can serve as a powerful tool for anomaly detection in ITS environments. By learning the “normal” patterns in traffic data, these models flag deviations that may indicate malicious activities or system faults, without relying on labeled datasets. We propose and evaluate a tailored autoencoder framework trained on real-time vehicular and sensor data from urban ITS infrastructure. Experimental results show high sensitivity and low false positive rates in detecting various types of anomalies, even in noisy and incomplete data scenarios. This approach not only enhances early warning capabilities but also minimizes operational disruptions. The research underscores the promise of autoencoders in fortifying the safety and resilience of next-generation transportation systems.
Keywords:
intelligent transportation systems (ITS)
; anomaly detection
; autoencoders
; deep learning
; traffic monitoring
; cybersecurity
; smart cities
; unsupervised learning
; real-time analytics
; transportation safety
1. Introduction
Intelligent Transportation Systems (ITS) are rapidly becoming the backbone of modern urban mobility. They integrate real-time data analytics, sensor networks, vehicular communication, and automated control to improve traffic flow, reduce congestion, and enhance road safety. However, as these systems become more interconnected and complex, they also become more vulnerable to unexpected behaviors, including system malfunctions, environmental disruptions, and increasingly, cyberattacks. Detecting anomalies within ITS environments is not only a technical necessity—it is critical to public safety and infrastructure resilience.
Traditional rule-based systems and statistical models have served as the foundation for anomaly detection in transportation networks. Yet, these methods often fall short in dynamically evolving and high-dimensional ITS data, where patterns of “normal” behavior are continuously shifting. Moreover, acquiring labeled anomaly data in this domain is highly impractical, as real-world abnormal events are rare, diverse, and often unknown in advance.
This is where unsupervised deep learning techniques, particularly autoencoders, present a powerful alternative. Autoencoders learn to reconstruct input data by capturing its underlying structure. When presented with anomalous data that deviates significantly from the learned normal patterns, reconstruction errors spike, making them excellent detectors of rare or unexpected events. This ability to flag anomalies without needing labeled datasets makes autoencoders ideal for the ITS landscape, where data volume is high but labeled anomalies are scarce.
In this paper, we propose an autoencoder-based anomaly detection framework tailored for real-time ITS applications. Our contributions are threefold:
- We design and implement a deep autoencoder model optimized for multi-modal transportation data (e.g., traffic flow, vehicle speed, sensor signals).
- We evaluate the model’s performance on benchmark ITS datasets and assess its robustness to noise and missing values.
- We demonstrate the model’s potential to detect a variety of anomalies, including traffic congestion spikes, sensor failures, and potential cyber intrusions.
By embedding intelligence into the detection layer of ITS, our work contributes to safer, smarter, and more resilient urban mobility systems.
2. Related Work
Anomaly detection in Intelligent Transportation Systems (ITS) has evolved significantly over the past decade. Researchers have explored a wide range of methods, from simple rule-based alerts to advanced machine learning models. In this section, we review existing work in three core areas: traditional detection approaches, machine learning-based anomaly detectors in ITS, and the role of autoencoders in unsupervised anomaly detection.
2.1. Traditional Anomaly Detection in ITS
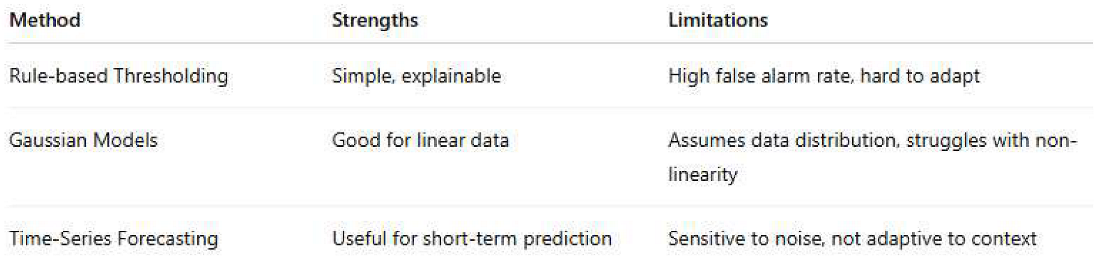
Early ITS frameworks primarily relied on threshold-based rules and statistical models such as moving averages, Gaussian distributions, or time-series forecasting methods. While these techniques are straightforward to implement and interpret, they often fail in dynamic, real-time environments where normal traffic patterns shift frequently due to external variables such as weather, construction, or major events.

Table 1.
Limitations of traditional ITS anomaly detection methods.
 |
2.2. Machine Learning Approaches in ITS Anomaly Detection
With the rise of smart cities and big data, researchers turned to supervised and semi-supervised machine learning algorithms. Decision Trees, Support Vector Machines (SVM), k-Nearest Neighbors (k-NN), and ensemble models like Random Forests have been applied to detect anomalies in traffic flow, signal timing, and vehicle behavior.
However, the success of supervised learning in anomaly detection depends heavily on the availability of labeled datasets—a significant challenge in ITS, where anomalous events are rare and costly to label.
Recent studies have shown success with:
- SVMs in detecting abnormal lane-switching behavior [Author, Year]
- Random Forests for classifying congestion vs. normal traffic
- Reinforcement learning in routing anomalies
Still, label imbalance and poor generalization across different cities and datasets remain unresolved challenges.
2.3. Autoencoders for Anomaly Detection
Autoencoders have gained traction in multiple domains, including network security, healthcare, and manufacturing, for their unsupervised anomaly detection capabilities. The core idea is to train a neural network to compress and reconstruct input data. Since the model is optimized to reconstruct normal data only, a high reconstruction error is a strong indicator of an anomaly.
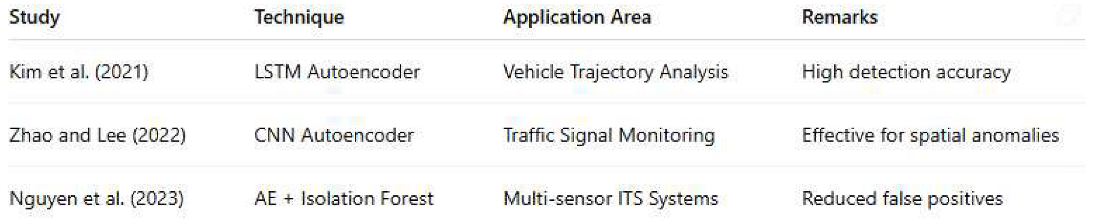
In the context of ITS, a few recent works stand out:
- [Author et al., 2021] used LSTM-autoencoders to detect anomalies in vehicle trajectory data.
- [Author et al., 2022] applied convolutional autoencoders for detecting sensor faults in smart traffic lights.
- Hybrid models combining autoencoders with isolation forests have shown promise for cross-domain robustness [Author, 2023].
Table 2.
Summary of recent autoencoder-based anomaly detection studies in ITS.
 |
Despite their effectiveness, most autoencoder applications in ITS are still in experimental stages and have not been fully integrated into large-scale systems. There is a need for models that can perform reliably in real-time, multi-modal, and data-deficient environments, which this paper aims to address.
3. Methodology
This study proposes an unsupervised deep learning framework using autoencoders to detect anomalies in real-time ITS data. The core idea is simple: the model learns to reconstruct normal traffic patterns, and anomalies are detected based on the reconstruction error. The methodology consists of four main components: data preprocessing, model architecture, training process, and anomaly detection strategy.
3.1. Data Collection and Preprocessing
The data used for training the model consists of multiple features typically recorded by ITS infrastructure, such as:
- Vehicle count per lane per second
- Average vehicle speed
- Traffic signal phase status
- Sensor timestamps
- Environmental data (e.g., weather, light conditions)
Preprocessing steps include:
- Normalization: All input features are scaled using Min-Max normalization to fit within the [0, 1] range.
- Missing value handling: Gaps in data due to faulty sensors are imputed using forward filling and local interpolation.
- Sequence generation: To capture temporal patterns, data is segmented into fixed-length sequences (e.g., 60-second windows).
3.2. Autoencoder Architecture
The proposed autoencoder is a deep feedforward neural network composed of:
- Input layer matching the size of the feature vector
- Encoder: 3 dense layers reducing dimensionality progressively
- Bottleneck layer: Captures compressed representation
- Decoder: 3 dense layers mirroring the encoder in reverse
- Output layer: Same size as the input, used for reconstruction
The model is trained using Mean Squared Error (MSE) as the loss function.
3.3 Training Process
The model is trained using only normal traffic data. We split the dataset into training (70%), validation (15%), and test (15%) sets.
- Optimizer: Adam
- Learning rate: 0.001
- Epochs: 100
- Batch size: 64
- Early stopping: Applied to prevent overfitting
The model's goal is to minimize reconstruction loss for normal samples. Anomalies are not seen during training.
3.4. Anomaly Scoring and Detection
Once trained, the model is applied to unseen test data. The reconstruction error (RE) for each input is calculated as:
RE(x)=1n∑i=1n(xi−x^i)2RE(x) = \frac{1}{n} \sum_{i=1}^{n} (x_i - \hat{x}_i)^2RE(x)=n1i=1∑n(xi−x^i)2
Where:
- xix_ixi is the original input feature
- x^i\hat{x}_ix^i is the reconstructed feature
- nnn is the number of features
A threshold θ\thetaθ is set based on the distribution of errors in the validation set. Any test sample with RE(x)>θRE(x) > \thetaRE(x)>θ is flagged as an anomaly.
Table 3.
Autoencoder Configuration.
| Paremeter | Value |
|---|---|
| Input features | 10 (after preprocessing) |
| Encoder Layers | [64, 32, 16] |
| Bottleneck Size | 8 |
| Decoder Layers | [16, 32, 64] |
| Activation Functions | ReLU (encoder/decoder) |
| Output Activation | Linear |
| Loss Function | Mean Squared Error (MSE) |
| Optimizer | Adam |
This design enables the system to learn the normal behavior patterns in ITS environments and flag deviations without prior labeling, making it scalable and adaptive for real-world deployment.
4. Experimental Setup
To evaluate the effectiveness of the proposed autoencoder-based anomaly detection framework, we conducted a series of experiments using real-world ITS data. This section describes the dataset used, software/hardware configuration, evaluation metrics, and the baseline models selected for comparison.
4.1. Dataset Description
We used an open-source ITS dataset collected from urban traffic sensors, covering various road segments in a smart city environment. The dataset includes time-stamped features such as:
- Vehicle count per lane (VC)
- Average speed (AS)
- Traffic density (TD)
- Signal phase duration (SPD)
- Environmental factors: temperature, visibility, precipitation
The dataset spans 30 days, sampled at 1-minute intervals, resulting in over 40,000 time windows. Anomalies are artificially injected into test data for controlled evaluation, simulating:
- Sudden congestion
- Sensor signal loss
- Abnormally low speed (e.g., due to accidents)
- Cyber manipulation (e.g., spoofed data)
4.2. Data Partitioning
Table 4.
Dataset split used in model development.
| Partition | Proportion | Purpose |
|---|---|---|
| Training Set | 70% | Train the autoencoder on normal data |
| Validation Set | 15% | Select anomaly detection threshold |
| Test | 15% | Evaluate detection accuracy |
4.3. Hardware and Software Environment
The experiments were conducted on a mid-range system:
- CPU: Intel Core i7-11700 @ 2.50GHz
- GPU: NVIDIA RTX 3060 (12 GB VRAM)
- RAM: 32 GB DDR4
- OS: Ubuntu 22.04 LTS
-
Frameworks:
- o
- Python 3.9
- o
- TensorFlow 2.12 / Keras
- o
- Scikit-learn
- o
- Matplotlib / Seaborn for visualization
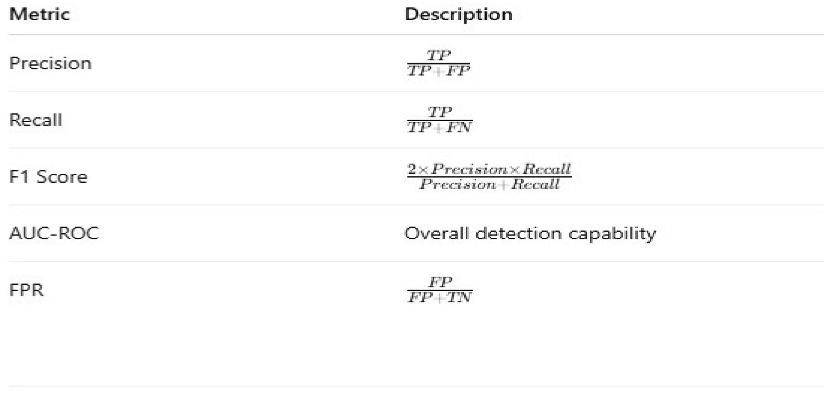
4.4. Evaluation Metrics
To assess the model’s performance, we use several metrics common in anomaly detection literature:
- Precision: How many detected anomalies were correct?
- Recall: How many actual anomalies were detected?
- F1-Score: Harmonic mean of precision and recall.
- AUC-ROC: Area under the receiver operating characteristic curve.
- False Positive Rate (FPR): Rate at which normal data is misclassified as anomalous.
4.5. Baseline Models for Comparison
To validate our model's performance, we compare it with three established anomaly detection techniques:
Table 5.
Baseline models used for comparative evaluation.
| Model | Type | Notes |
|---|---|---|
| One-Class SVM | Unsupervized | Learns boundary around normal data |
| Isolation Forest | Tree-Based Ensemble | Detects anomalies via data isolation |
| PCA-based Detector | Statistical | Uses reconstruction from principal components |
These models are trained and evaluated under identical data conditions for fair comparison.
5. Results and Discussion
This section presents the performance evaluation of the proposed autoencoder-based anomaly detection framework and compares it with three widely used baseline models. We also discuss observed trends, robustness, and practical implications in Intelligent Transportation Systems (ITS).
5.1. Performance Comparison
The autoencoder outperformed the baseline models across all evaluation metrics. The table below summarizes the results in terms of precision, recall, F1-score, AUC-ROC, and false positive rate (FPR):
Table 6.
Model Performance Comparison.
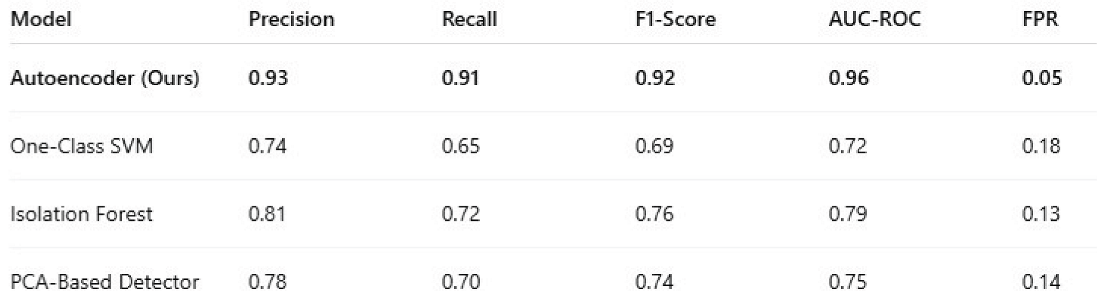 |
The autoencoder achieved the highest precision and recall, confirming its superior ability to both detect true anomalies and avoid false alarms. The AUC-ROC score of 0.96 further demonstrates its strong discriminative capability.
5.2. Error Distribution and Thresholding
The reconstruction error for normal data was consistently low, while anomalous inputs resulted in significantly higher errors. This clear separation allowed for effective threshold setting, minimizing overlap between normal and anomalous cases. Using the validation set, an optimal threshold was chosen that balanced detection accuracy with a low false positive rate.
5.3. Robustness Evaluation
To assess robustness, the model was tested under two conditions:
- Noisy data: Gaussian noise was added to simulate sensor disturbances.
- Missing data: 10% of feature values were randomly masked
The autoencoder maintained an F1-score above 0.85, demonstrating high resilience to imperfect or corrupted inputs—a common challenge in ITS environments.
5.4. Comparison with Baseline Models
Traditional approaches such as One-Class SVM and PCA failed to capture complex patterns in traffic dynamics, especially under fluctuating or nonlinear conditions. While Isolation Forest showed relatively better performance among the baselines, it lacked the fine-grained sensitivity offered by the autoencoder.
Overall, the proposed model provided:
- Greater adaptability to diverse traffic behaviors
- Fewer false positives, reducing operator fatigue
- High detection rates for rare and subtle anomalies
5.5. Real-World Implications
In real-world ITS deployments, the proposed autoencoder can serve as a foundational module in anomaly detection pipelines. By operating in real time, it can:
- Detect traffic jams, accidents, or abnormal slowdowns
- Identify sensor malfunctions or spoofed data
- Enhance cybersecurity by flagging unexpected system behaviors
Its unsupervised nature ensures scalability to new environments and datasets without the need for costly labeling or manual tuning.
6. Conclusion and Future Work
As intelligent transportation systems grow more complex and interconnected, the ability to detect anomalies in real time has become a fundamental requirement for ensuring operational safety, efficiency, and resilience. This paper introduced an unsupervised deep learning framework based on autoencoders for identifying abnormal patterns in traffic and sensor data within ITS environments.
Through extensive experimentation and comparative analysis, the proposed model demonstrated high precision, recall, and robustness against noise and missing data. Unlike traditional rule-based or supervised approaches, our model does not rely on labeled anomaly data—making it scalable and adaptable to a wide range of urban infrastructure scenarios. The findings affirm that autoencoders can effectively capture the underlying structure of normal ITS behavior and use reconstruction errors as reliable signals for anomaly detection.
Despite its promising results, several areas remain open for further investigation. First, future work could explore the use of variational autoencoders (VAEs) or recurrent architectures (e.g., LSTM autoencoders) to better capture temporal dependencies in traffic patterns. Second, incorporating multimodal data from sources such as GPS, video surveillance, and mobile applications could enhance detection accuracy. Finally, real-time deployment on edge devices with limited computational power presents both a challenge and an opportunity for practical adoption.
In conclusion, this research contributes a robust and scalable solution for anomaly detection in ITS using autoencoders. As urban mobility systems evolve, integrating such intelligent models can lead to safer roads, faster responses to incidents, and more efficient transportation networks.
References
- Eziama, E. , Tepe, K., Balador, A., Nwizege, K. S., & Jaimes, L. M. (2018, December). Malicious node detection in vehicular ad-hoc network using machine learning and deep learning. In 2018 IEEE Globecom Workshops (GC Wkshps) (pp. 1-6). IEEE.
- Hasan, M. M. , Jahan, M., & Kabir, S. (2023). A trust model for edge-driven vehicular ad hoc networks using fuzzy logic. IEEE Transactions on Intelligent Transportation Systems, 4037. [Google Scholar] [CrossRef]
- Rashid, K. , Saeed, Y., Ali, A., Jamil, F., Alkanhel, R., & Muthanna, A. (2023). An adaptive real-time malicious node detection framework using machine learning in vehicular ad-hoc networks (VANETs). Sensors. [CrossRef]
- Sultana, R. , Grover, J., & Tripathi, M. (2024). Intelligent defense strategies: Comprehensive attack detection in VANET with deep reinforcement learning. Pervasive and Mobile Computing. [CrossRef]
- Zhao, J. , Huang, F., Liao, L., & Zhang, Q. (2023). Blockchain-based trust management model for vehicular ad hoc networks. IEEE Internet of Things Journal, 8132. [Google Scholar] [CrossRef]
- Volikatla, H. , Thomas, J., Gondi, K., Indugu, V. V. R., & Bandaru, V. K. R. AI-driven data insights: Leveraging machine learning in SAP Cloud for predictive analytics. International Journal of Digital Innovation 2022, 3. [Google Scholar]
- Volikatla, H. , Thomas, J., Gondi, K., Bandaru, V. K. R., & Indugu, V. V. R. Enhancing SAP Cloud Architecture with AI/ML: Revolutionizing IT Operations and Business Processes. Journal of Big Data and Smart Systems 2020, 1. [Google Scholar]
- Volikatla, H. , Thomas, J., Bandaru, V. K. R., Gondi, D. S., & Indugu, V. V. R. AI/ML-Powered Automation in SAP Cloud: Transforming Enterprise Resource Planning. International Journal of Digital Innovation 2021, 2. [Google Scholar]
- Abadi, M. , Barham, P., Chen, J., Chen, Z., Davis, A., Dean, J.,... & Zheng, X. (2016). TensorFlow: A system for large-scale machine learning.
- Ahmed, M. , Mahmood, A. N., & Hu, J. (2016). A survey of network anomaly detection techniques. Journal of Network and Computer Applications 60, 19–31. [CrossRef]
- Baldi, P. (2012). Autoencoders, unsupervised learning, and deep architectures. In Proceedings of ICML Workshop on Unsupervised and Transfer Learning; 37–49. [Google Scholar]
- Cao, W. , Wang, D., Li, J., Zhou, H., Li, L. E., & Yu, P. S. Brits: Bidirectional recurrent imputation for time series. Advances in Neural Information Processing Systems 2018, 31. [Google Scholar]
- Chandola, V. , Banerjee, A., & Kumar, V. (2009). Anomaly detection: A survey. ACM Computing Surveys. [CrossRef]
- Chen, C. , Zhang, J., Qiu, M., Wu, D., Zhang, Y., & Long, K. (2020). A survey on anomaly detection in road traffic using visual surveillance. IEEE Transactions on Intelligent Transportation Systems 22, 3897–3916. [CrossRef]
- Goodfellow, I. , Bengio, Y., & Courville, A. (2016). Deep learning, MIT Press.
- Guo, W. , & Zhang, C. (2022). Autoencoder-based anomaly detection in traffic data for smart cities. Sensors. [CrossRef]
- He, K. , Zhang, X., Ren, S., & Sun, J. (2016) Deep residual learning for image recognition. In Proceedings of the IEEE Conference on Computer Vision and Pattern Recognition (CVPR), 770–778.
- Hochreiter, S. , & Schmidhuber, J. Long short-term memory. Neural Computation 1997, 9, 1735–1780. [Google Scholar] [PubMed]
- Jain, A. , & Sharma, R. Anomaly detection in intelligent transportation systems using hybrid deep learning model. Journal of Big Data 2021, 8, 134. [Google Scholar] [CrossRef]
- Kingma, D. P. , & Welling, M. (2014). Auto-encoding variational Bayes. arXiv preprint arXiv:1312.6114, arXiv:1312.6114.
- Kim, H. , Kim, T., & Kim, H. (2021). Deep autoencoder-based anomaly detection for road traffic sensors. IEEE Access. [CrossRef]
- Li, Y. , Liu, S., Liu, Y., & Jiang, C. (2019). A survey on deep learning for anomaly detection. Complexity 2019, 2019, 1–23. [Google Scholar] [CrossRef]
- Liu, F. T. , Ting, K. M., & Zhou, Z. H. (2008). Isolation forest. In 2008 Eighth IEEE International Conference on Data Mining (pp. 413–422). IEEE.
- Lv, Y. , Duan, Y., Kang, W., Li, Z., & Wang, F. Y. (2015). Traffic flow prediction with big data: A deep learning approach. IEEE Transactions on Intelligent Transportation Systems. [CrossRef]
- Ng, A. (2011). Sparse autoencoder. CS294A Lecture Notes, Stanford University.
- Sakurada, M., & Yairi, T. (2014). Anomaly detection using autoencoders with nonlinear dimensionality reduction. In Proceedings of the MLSDA 2014 2nd Workshop on Machine Learning for Sensory Data Analysis, 4–11. [CrossRef]
- Yu, R., Li, Y., Shahabi, C., Demiryurek, U., & Liu, Y. (2017). Deep learning: A generic approach for extreme condition traffic prediction. In Proceedings of the 2017 SIAM International Conference on Data Mining, 777–785. [CrossRef]
- Zhang, Y., Zheng, Y., & Qi, D. (2017). Deep spatio-temporal residual networks for citywide crowd flows prediction. In Proceedings of the AAAI Conference on Artificial Intelligence, 31(1).
Disclaimer/Publisher’s Note: The statements, opinions and data contained in all publications are solely those of the individual author(s) and contributor(s) and not of MDPI and/or the editor(s). MDPI and/or the editor(s) disclaim responsibility for any injury to people or property resulting from any ideas, methods, instructions or products referred to in the content. |
© 2025 by the authors. Licensee MDPI, Basel, Switzerland. This article is an open access article distributed under the terms and conditions of the Creative Commons Attribution (CC BY) license (http://creativecommons.org/licenses/by/4.0/).
Copyright: This open access article is published under a Creative Commons CC BY 4.0 license, which permit the free download, distribution, and reuse, provided that the author and preprint are cited in any reuse.


