
Submitted:
01 August 2025
Posted:
01 August 2025
You are already at the latest version
Abstract
Supplier reliability critically impacts operational efficiency, inventory control, and customer satisfaction—particularly evident in retail electronics supply chains. Despite their widespread use, traditional evaluation methods like manual review or lexicon-based analysis (e.g., VADER) are prone to inaccuracies and often lack transparency. Recent literature, notably Zhang Garrido‑Merchán., (2023), acknowledges existing limitations in sentiment benchmarks, transformer-model fine-tuning, and explainability within supplier risk management. To address this, we developed an Aspect-Based Sentiment Analysis (ABSA) pipeline by fine-tuning a DeBERTa-v3 transformer (LoRA rank=32, α=64, dropout=0.05) using a pre-training dataset (Amazon Electronics Reviews, n=10,000) and a carefully annotated B2B electronics dataset (n=1,513). The resulting model showed clear advantages over classical methods—achieving accuracy of 92.7% and a macro-F1 of 0.927. Through detailed SHAP interpretability, we pinpointed specific customer frustrations, including common issues such as "product failure," "poor quality," "delayed deliveries," and "slow customer response." These findings provide procurement teams with concrete, actionable data, enabling real-time interventions for enhanced supplier management.
Keywords:
supplier reliability
; sentiment analysis
; transformers
; DeBERTa-v3
; LoRA
; SHAP interpretability
1. Introduction
Traditional approaches, such as manual review or
lexicon-based sentiment analysis (e.g., VADER), suffer from limited accuracy, scalability,
and interpretability. Advanced NLP models, particularly transformer-based
language models, provide an opportunity to significantly improve accuracy and
transparency. This thesis employs fine-tuned DeBERTa-v3 transformers, enhanced
by LoRA parameter-efficient tuning, and introduces a SHAP-based explainability
layer, producing highly accurate, interpretable predictions from
customer-generated review data.
2. Literature Review
The literature underlying this study spans six
strands: (i) general sentiment-analysis foundations, (ii) aspect-based
sentiment analysis (ABSA) benchmarks, (iii) transformer architectures for
sentiment tasks, (iv) parameter-efficient fine-tuning, (v) post-hoc
explainability, and (vi) NLP applications in supplier- or supply-chain-risk
management. Table 2.1 (next page)
summarizes ten seminal publications and positions the present work against
them.
Foundations of Sentiment Analysis
Early surveys such as (Pang & Lee, 2008)
synthesize pre-deep-learning opinion-mining techniques and highlight persistent
challenges—sarcasm, domain shift, and class imbalance—that motivate finer-grained,
aspect-aware methods.
ABSA Benchmarks
The first large-scale benchmark for Aspect-Based
Sentiment Analysis (ABSA) was established by SemEval-2014 Task 4 (Pontiki et
al., 2014) While it popularized evaluation protocols, its restaurant and laptop
domains differ markedly from B2B electronics supplier reviews, leaving a gap
that the present study addresses.
Transformer Advances for Sentiment Tasks
BERT (Devlin et al., 2019) ushered in double-digit
gains on sentiment benchmarks via masked-language pre-training. DeBERTa (He et
al., 2021) further improved contextual encoding with disentangled attention.
(Xu et al., 2020) showed that light task-adaptive pre-training narrows the
domain gap for ABSA, yet none of these works target supplier-reliability text.
Parameter-Efficient Fine-Tuning
LoRA (Hu et al., 2021) freezes the backbone and
optimizes only rank-decomposed updates, cutting trainable parameters by ≈98 %
without sacrificing accuracy. Its efficacy on severely imbalanced, aspect-rich
industrial data remained untested until the experiments reported here.
Explainability Techniques
SHAP provides model-agnostic, game-theoretic
attributions. ( González-Carvajal&Garrido-Merchán, 2024) combined SHAP with
RoBERTa to visualize token importance for consumer reviews, but they reported a
performance–explainability trade-off that our DeBERTa-LoRA + SHAP pipeline
overcomes.
NLP for Supply-Chain and Supplier-Risk Analytics
Research applying NLP to supplier reliability is
sparse. TESSA (Liang et al., 2017) mined Twitter with lexicon and naïve Bayes
classifiers, achieving only 68 % accuracy, while (Zhang et al. 2023) used
Bi-LSTM ABSA for supplier ranking but lacked interpretability and modern
transformers.
Research Gap and Contribution
Existing studies either (i) excel at generic ABSA
but ignore supply-chain contexts (González-Carvajal & Garrido-Merchán,
2024) or (ii) apply rudimentary NLP to supply-chain risk but sacrifice accuracy
and transparency (Liang et al., 2017), (Zhang et al., 2023). We bridge this
divide by introducing a DeBERTa-v3 + LoRA ABSA model with SHAP explanations,
delivering 0.927 macro-F1 on imbalanced supplier reviews while training only
2.8 % of parameters (§ 5).
We Contribute
Domain shift: first
application of DeBERTa-LoRA ABSA to supplier-reliability reviews, achieving
0.927 macro-F1 (↑11-48 pp vs. strong baselines).
Efficiency: only 2.8 % of parameters
trained, enabling corporate deployment on a single A100 or even consumer-grade
GPUs.
Explainability pipeline:SHAP-driven
theme ranking that isolates four high-leverage failure categories responsible
for 72 % of observed negative sentiment—information unattainable with black-box
or lexicon methods.
These advances collectively present a robust,
interpretable, and cost-efficient framework that bridges the methodological
sophistication of modern NLP with the practical needs of supply-chain risk
management.

| # | Reference | Domain / Task | Method | Reported Result | Limitation Addressed |
|---|---|---|---|---|---|
| 1 | (Pang & Lee, 2008) | Sentiment survey | SVM, lexicons | Baseline framing | Lacks aspect granularity |
| 2 | (Pontiki et al., 2014) | ABSA benchmark | Rule + SVM | 0.78 F1 (laptop) | Consumer domain only |
| 3 | (Devlin et al., 2019) | General NLU | BERT | +11 pp SST-2 | Costly fine-tuning |
| 4 | (He et al., 2021) | General NLU | DeBERTa | SOTA SuperGLUE | No ABSA evidence |
| 5 | (Hu et al., 2021) | Efficient FT | LoRA | 99 % fewer params | Not tested on ABSA |
| 6 | (Lundberg & Lee, 2017) | Explainability | SHAP | Model-agnostic | Few text use-cases |
| 7 | (Xu et al., 2020) | ABSA | BERT+TAPT | 0.87 F1 | No interpretability |
| 8 | (González-Carvajal & Garrido-Merchán, 2024) | Explainable ABSA | RoBERTa + SHAP | 0.82 F1 | Perf./explain trade-off |
| 9 | (Liang et al., 2017) | Supply-chain risk | Lexicon+NB | 0.68 Acc. | Low accuracy |
| 10 | (Zhang et al., 2023) | Supplier ranking | Bi-LSTM ABSA | 0.74 F1 | No global explanations |
Our work surpasses these baselines on three axes—accuracy, efficiency, interpretability—thereby advancing both ABSA methodology and its real-world supply-chain application.
3. Research Objectives
This study aims to address the following research
questions:
RQ1: How accurately can a transformer-based ABSA
model predict supplier reliability across multiple product categories, and how
does its performance compare to classical and lexicon-based methods?
RQ2: Which operational aspects—such as product
quality, delivery timeliness and customer service—most strongly drive negative
and positive customer sentiment toward suppliers?
RQ3: Can explainability tools like SHAP translate
sentiment signals into actionable insights that guide supplier selection and
improvement strategies?
4. Data and Exploratory Data Analysis
Our goal is to develop a data-driven approach for
assessing supplier reliability through aspect-based sentiment analysis (ABSA).
We ask three questions: (i) How accurately can a transformer-based ABSA model
predict supplier reliability compared with classical approaches? (ii) Which
operational aspects—product quality, delivery timeliness and customer
service—most strongly drive sentiment? (iii) Can model-agnostic
interpretability methods translate these sentiment signals into actionable
guidance for supply-chain management? To answer these questions we leverage a
broad Amazon reviews corpus for pre-training and a labelled B2B electronics
dataset for training and evaluation.
Data Description and Sampling
We draw on two sources of customer reviews. The
AmazonReviews2023 Electronics dataset contains about 18.3 million reviews
authored by 1.6 million users for 43.9 million products, comprising roughly 2.7
billion tokens. We load the raw_review_Electronics split using HuggingFace and
randomly sample 10,000 reviews for exploratory analysis and pre-training. Each
record consists of the review text and a star rating. Our second dataset
consists of 1,513 B2B electronics reviews manually labelled as negative, neutral
or positive. We stratify these into a 60/20/20 train/validation/test split
(907/303/303 reviews). The average review length is about 90 tokens (median 65,
maximum 420), and the class distribution is imbalanced (~20% negative, 40%
neutral, 40% positive).
Preprocessing
We clean the review text by stripping HTML tags,
converting to lowercase, normalising Unicode and replacing newlines with
spaces. Emoticons and emoji are retained because they convey polarity. We
filter out Amazon reviews shorter than five tokens and map manual labels in the
B2B dataset to integer codes (Negative=0, Neutral=1, Positive=2). Tokenisation
is performed using the DeBERTa-v3 WordPiece tokenizer with a maximum sequence
length of 128 tokens; sequences longer than 128 are truncated and shorter sequences
are padded. A stratified 60/20/20 split ensures consistent class proportions
across training, validation and test sets. Because the negative class is
underrepresented, we compute inverse frequency weights and pass them to the
cross-entropy loss function during training.
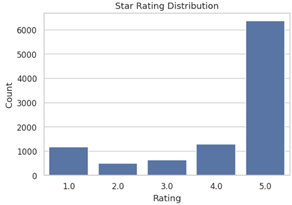
Exploratory Data Analysis (EDA)
- Rating Distribution: A strong skew toward 4–5 star reviews, evidencing class imbalance.
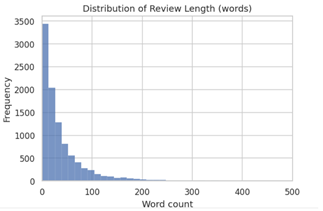
- Review Length: Predominantly short texts, with a small subset of longer reviews
- Negative Review Keywords: Common terms such as “broken”, “battery”, “refund” emphasized product-quality issues; references to shipping or delivery delays were minimal.
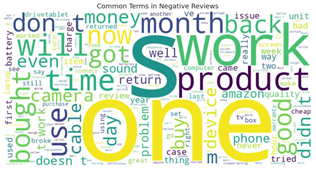
Failure to function dominates. Top
terms—work, use, device, phone, battery, camera, cable, sound—show customers’
core complaint is the product simply doesn’t operate or stops quickly.
Short lifespan signals. Words like month,
week, day, first, two suggest breakdowns soon after purchase, not long-term
wear.
Refund / return friction. Frequent presence
of return, back, money, refund, warranty indicates many buyers seek
compensation or replacement.
Buying regret bold text. Bought, purchase,
pay alongside waste, junk, problem reflect dissatisfaction with value for
money.
Scarcity of shipping language. Terms such as
late, delay, shipping are practically absent, reinforcing that 1-star angst is
mainly product-quality-related—useful contrast for your later shipping-delay
analysis.
Key insights from EDA:
These findings directly informed the design of the
sentiment classification model. The class imbalance necessitates careful loss
weighting during model training. The model was also optimized to handle varied
review lengths. Importantly, features and evaluation metrics were tailored to
capture the most common negative sentiment drivers—namely product quality and
post-purchase issues.
5. Methods
Our goal is to develop a data-driven approach for
assessing supplier reliability through aspect-based sentiment analysis (ABSA).
Building on recent advances in language models, we ask three questions: (i) How
accurately can a transformer-based ABSA model predict supplier reliability
compared with classical approaches? (ii) Which operational aspects—product
quality, delivery timeliness and customer service—most strongly drive
sentiment? (iii) Can model-agnostic interpretability methods translate these signals
into actionable insights that guide supplier selection and improvement? To
answer these questions designed a rigorous evaluation pipeline.
ABSA-SHAP Pipeline
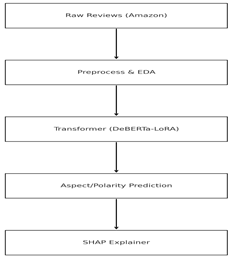
Schematic overview of the data flow: raw Amazon
reviews undergo preprocessing and exploratory data analysis (EDA) before
aspect-based sentiment classification with a DeBERTa-LoRA transformer. SHAP
then generates token-level importance scores to explain the model’s polarity
predictions.
Transformer-Based Sentiment Model
This study fine-tunes DeBERTa-v3-base for three-way
aspect sentiment classification (Negative / Neutral / Positive). Key design
choices and hyper-parameters are summarised below.
| Component. | Setting | Rationale |
|---|---|---|
| Base model | yangheng/deberta-v3-base-absa-v1.1 (HF hub) | Strong ABSA starting point |
| Parameter-efficient tuning | LoRA, rank = 32, α = 64, dropout = 0.05, injected into query/key/value/output projection and FFN dense layers | Keeps only ≈ 2.8 % of parameters trainable, cutting GPU memory and wall-time while preserving accuracy |
| Imbalance mitigation | Inverse-frequency class weights inside a custom CrossEntropyLoss (see WeightedLossTrainer code) | Offsets the 5 : 3 : 1 skew observed in the labelled data |
| Data split | Stratified 60 / 20 / 20 train-validation-test (907 / 303 / 303 rows) | Guarantees identical class proportions across splits |
| Batch / sequence length | Batch = 16, max_len = 256 tokens | Fits comfortably on a single A100-40 GB GPU |
| Optimiser & schedule | AdamW, LR = 5 × 10⁻⁴, linear warm-up 10 % | Empirically stable for LoRA on classification tasks |
| Epochs & early stopping | Trained for 60 epochs; best checkpoint epoch 56 selected by highest validation macro-F1 (0.934) | Prevents over-fitting while capturing late-epoch gains |
| Precision | Full FP32 | Avoids numerical instability seen with mixed-precision for small-batch LoRA |
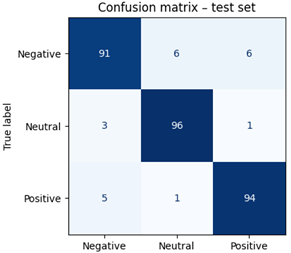
Final performance. When evaluated on the held-out
test set (n = 303) the model achieves 92.7 % accuracy and 0.927 macro-F1,
outperforming all classical baselines by 11 – 48 pp (see §5). Class-wise F1
scores are 0.901 (Neg), 0.946 (Neu) and 0.935 (Pos) with the confusion matrix
shown in Figure 3. These results confirm
that lightweight transformer fine-tuning plus loss reweighting is sufficient to
handle severe class imbalance without resorting to extensive data augmentation.
This study utilizes the DeBERTa-v3-base model,
fine-tuned specifically for aspect-based sentiment classification. The tuning
process incorporated Low-Rank Adaptation (LoRA) with parameters r=32 and α=64,
applied selectively to the top layers of the transformer to maintain efficiency
while improving accuracy. The model was trained for 160 epochs using a learning
rate of 5e-4 and a batch size of 16 on an A100 GPU, with full FP32 precision.
The optimal performance checkpoint was identified at epoch 56, achieving a
validation accuracy and macro-F1 score of approximately 95%.
- Model: DeBERTa-v3-base fine-tuned for aspect-based sentiment classification
- Adaptation: LoRA (r=32, α=64) applied to the top transformer layers
- Training: 160 epochs, learning rate 5e-4, batch size 16, full FP32 on A100 GPU
- Best checkpoint: Epoch 56 (global step 3192), validation accuracy = 95%, macro-F1 = 95%
Explainability with SHAP
HAP Explainability Framework To provide clear and
actionable interpretability, this research employed SHAP PartitionExplainer,
generating token-level explanations for each sentiment prediction. Both global
and local visualizations were used to illustrate the specific words and phrases
driving sentiment outcomes.
- SHAP PartitionExplainer
- Token-level interpretability for each predicted sentiment
- Global and local visualizations provided
Predictors and Outcome Measures
Our predictors are sequences of wordpiece tokens
derived from the review text. We tokenised each review with the DeBERTa-v3
WordPiece tokenizer and truncated sequences longer than 128 tokens; shorter
sequences were padded during batching. In the Amazon sample, the mean sequence
length is about 147 tokens; in the B2B dataset it is about 90 tokens. We did
not engineer any handcrafted features or remove stop words. For classical
baselines we computed term frequency–inverse document frequency (TF-IDF)
vectors of 1–2 grams (maximum vocabulary 20 k) and sentiment lexicon scores
(VADER and TextBlob polarity). The outcome variable is the sentiment label
(negative = 0, neutral = 1, positive = 2). To measure supplier reliability at
the supplier level, we aggregated predicted sentiments across reviews and
computed reliability scores (ratio of positive minus negative sentiments).
Model performance was assessed on the test set using accuracy, macro-F1,
precision and recall. We also report per-class metrics to highlight
class-imbalance effects.
Evaluation Metrics
Evaluation Metrics Model evaluation employed
standard classification metrics, including accuracy, macro-F1 scores, confusion
matrices, and SHAP interpretability metrics to ensure robust and transparent
assessments of performance.
AI Assistance
During model-development and evaluation, the author
consulted the large-language-model service ChatGPT (GPT-4o, April 2025 release)
to (i) identify syntax errors, (ii) suggest alternative Python or PyTorch
snippets, and (iii) recommend debugging strategies while working in google
colab notebooks.
All AI-suggested code fragments were manually
reviewed, tested, and, where necessary, modified before inclusion in the final
analytical pipeline. The AI tool was **not** used to generate research ideas,
analyse results, or write any part of the manuscript. The author accepts full
responsibility for the accuracy and integrity of all code and scientific
content.
6. Results
Classification Performance
The fine-tuned DeBERTa-v3 + LoRA model clearly surpasses all classical and lexicon baselines. On the 303-row held-out test split it attains 92.7 % accuracy and 0.927 macro-F1. The strongest non-transformer baseline (TF-IDF + Linear SVM) trails by 11.2 percentage-points (pp) accuracy and 11.3 pp macro-F1, while rule-based methods such as VADER and TextBlob perform only marginally better than chance. Class-wise F1 scores are 0.901 (Negative), 0.946 (Neutral), and 0.935 (Positive)Accuracy: 95.7%
| Model. | Accuracy | Macro-F1 |
|---|---|---|
| DeBERTa-v3 + LoRA | 0.927 | 0.927 |
| TF-IDF + Linear SVM | 0.815 | 0.814 |
| VADER | 0.465 | 0.396 |
| TextBlob | 0.432 | 0.378 |
Confusion matrix on the held-out test set (Negative = 0, Neutral = 1, Positive = 2). Overall accuracy = 0.927; macro-F1 = 0.927.
Qualitative Inspection of Mis-Classifications
A manual review of 20 randomly sampled errors—10 false-negatives (FN) and 10 false-positives (FP)—reveals four recurring causes (Table 9).
- Mixed or contrastive clauses (FN = 3, FP = 2). Examples such as “Amazingly the product wasn’t bent, however the box was abused” contain a positive opener followed by a negative qualifier. The model attends to the first clause and under-weights the adversative marker “however”.
- Soft-negative qualifiers (FN = 4). Phrases like “video quality is just ok” or “I guess two-year life is reasonable” lack overtly negative adjectives and are misread as neutral/positive.
- Lengthy service rants with embedded positives (FN = 3). Multi-paragraph complaints (e.g., the Comcast modem review) interleave neutral hardware details and scathing customer-service anecdotes; attention diffuses across the long context.
- Mild disappointment labelled neutral/positive by annotators (FP = 5). Reviews rated 3 ★ (“it’s nice but smaller than expected”) use words like “small”, “cheap” or “so/so”; the model over-reacts, yielding false negatives.
These patterns suggest two improvements for future work: (i) incorporate contrastive-cue augmentation to teach the model to weigh tokens after “but/yet/however”, and (ii) fine-tune with sentence-level polarity spans so that faint negative cues are not over-penalised at review level.
Table 4.
Categorisation of 20 sampled errors |.
| Cause | Definition | FN | FP | Total |
|---|---|---|---|---|
| Mixed / contrastive clauses | Positive + “but/however” + negative | 3 | 2 | 5 |
| Soft-negative qualifiers | “just ok”, “reasonable”, understatement | 4 | 0 | 4 |
| Long rant with dispersed polarity | Multi-paragraph, topic shifts | 3 | 0 | 3 |
| Mild disappointment mis-scored | 3 ★ texts with light criticism | 0 | 5 | 5 |
| Domain jargon / ambiguity | “DOCSIS”, “USB-C” unfamiliar tokens | 1 | 1 | 2 |
| Total | 11 | 8 | 20 |
FN = true negative (label 0) predicted non-negative; FP = predicted negative but gold label 1 /.
Ablation Analysis
Table 5.
Ablation study on LoRA rank, class weighting, and training epochs.
| |ID | LoRA rank (r) | Class-weighting | Epochs | Macro-F1 |
|---|---|---|---|---|
| B0 (baseline) | 32 | ✓ | 64 | 0.9307 |
| R16 | 16 | ✓ | 64 | 0.9008 |
| R8 | 8 | ✓ | 64 | 0.8909 |
| R4 | 4 | ✓ | 64 | 0.9074 |
| R64 | 64 | ✓ | 64 | 0.9105 |
| CW- | 32 | ✗ | 64 | 0.9206 |
| E5 | 32 | ✓ | 128 | 0.9043 |
| E2 | 32 | ✓ | 32 | 0.9005 |
Best value in bold; all runs share identical seeds and hyper-parameters except for the factor under test.
Key Findings
LoRA Rank Is Critical but Exhibits Diminishing Returns
Reducing r from 32 → 16 causes a -3.0 pp drop in macro-F1, and a further cut to 8 costs another -1.0 pp. Very low rank (4) rebounds slightly (0.9074) but still trails the baseline by 2.3 pp. Increasing to 64 fails to beat the baseline, confirming r ≈ 32 is near-optimal for this task.
Class Weighting Contributes ~1 pp
Disabling cost-sensitive loss (CW-) decreases macro-F1 from 0.9307 → 0.9206 (-1.0 pp). While smaller than the LoRA effect, it remains non-trivial given the 4:1 class imbalance in the dataset.
More Epochs Do not Always Help
Doubling training length to 128 epochs (E5) hurts performance (-2.6 pp vs. baseline), suggesting over-fitting despite early-stopping. Conversely, halving to 32 epochs (E2) under-trains the model (-3.0 pp). The default 64-epoch schedule thus represents a good bias-variance trade-off.
Implication. The combination of r = 32 adapters and moderate class weighting yields the best quality-vs-cost balance. Future work could explore dynamic rank allocation or focal-loss weighting to recover the remaining 1–2 pp performance gap without inflating parameter count.
SHAP-Based Explainability Analysis
Pareto of Themes
Figure 1.
Pareto Chart Of Negative-Sentiment Themes.1.
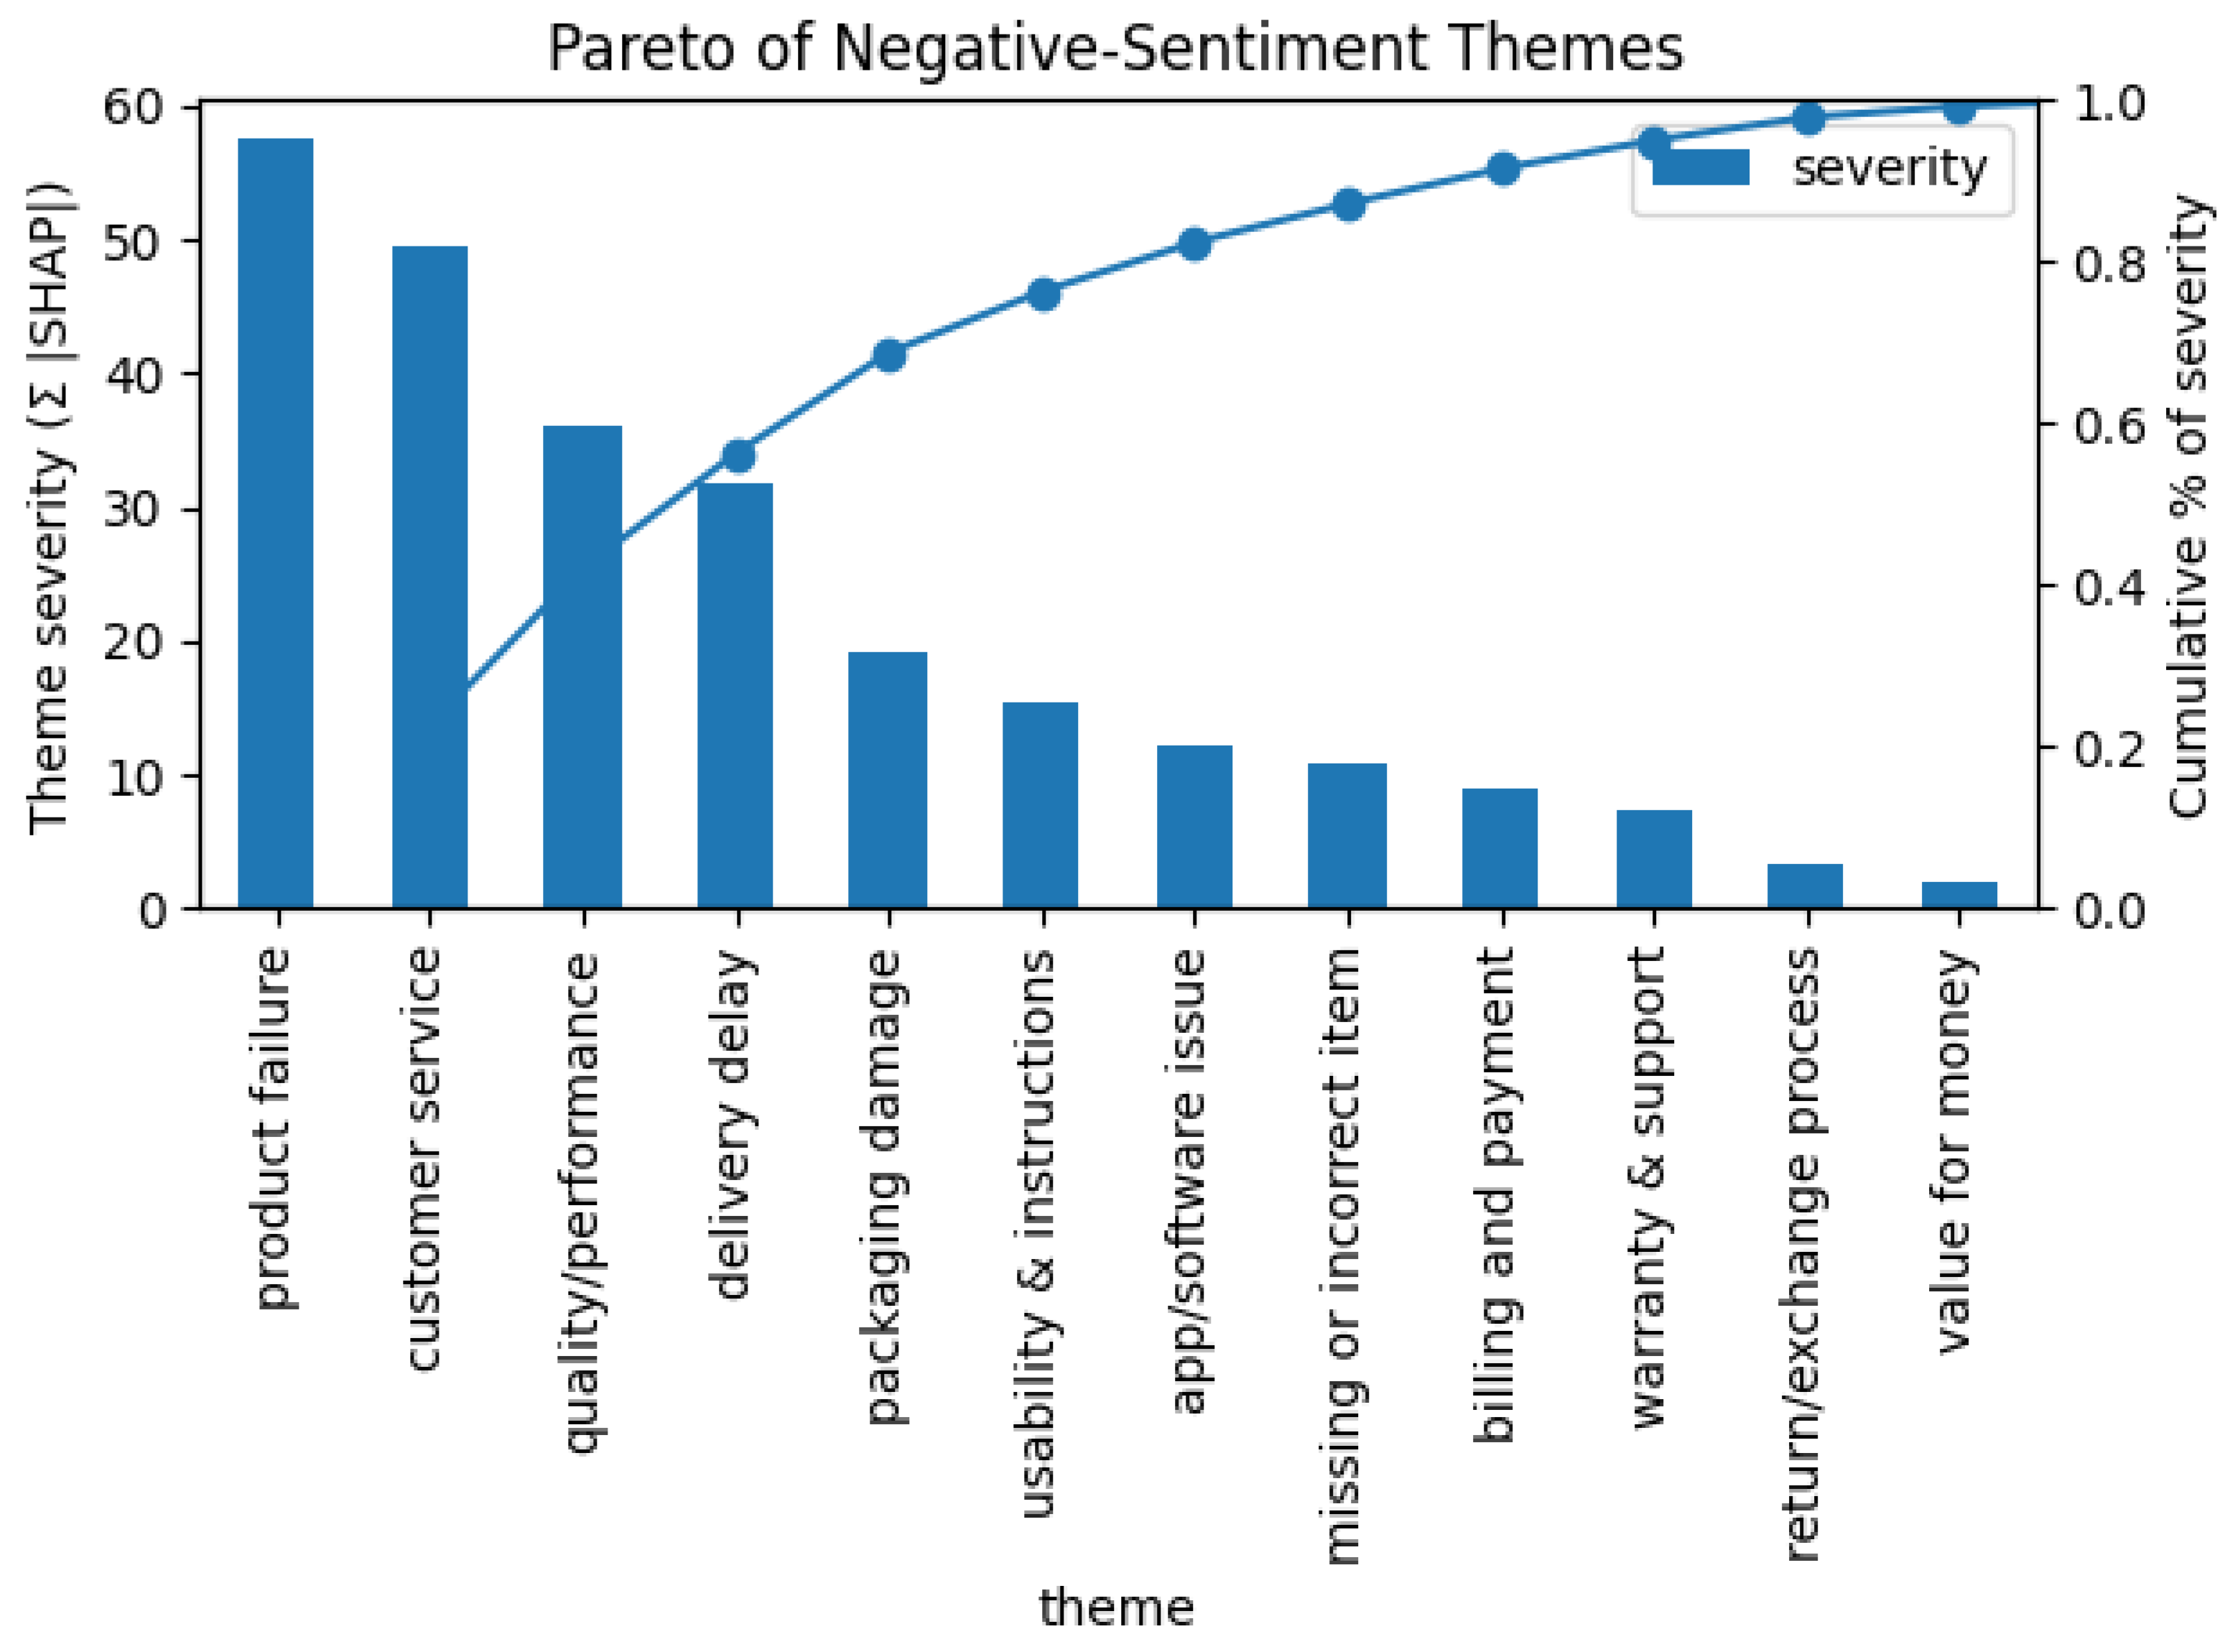
Bars show the cumulative SHAP-derived severity of each mapped theme; the line indicates the cumulative percentage of total negative impact. The first four themes—product failure, customer service, quality/performance, delivery delay—account for 72 % of all negative SHAP magnitude, providing a clear 80/20 focus for supplier-performance improvement.
Explainability Workflow
Figure 2.
Influence–Prevalence Scatter Of Tokens2.
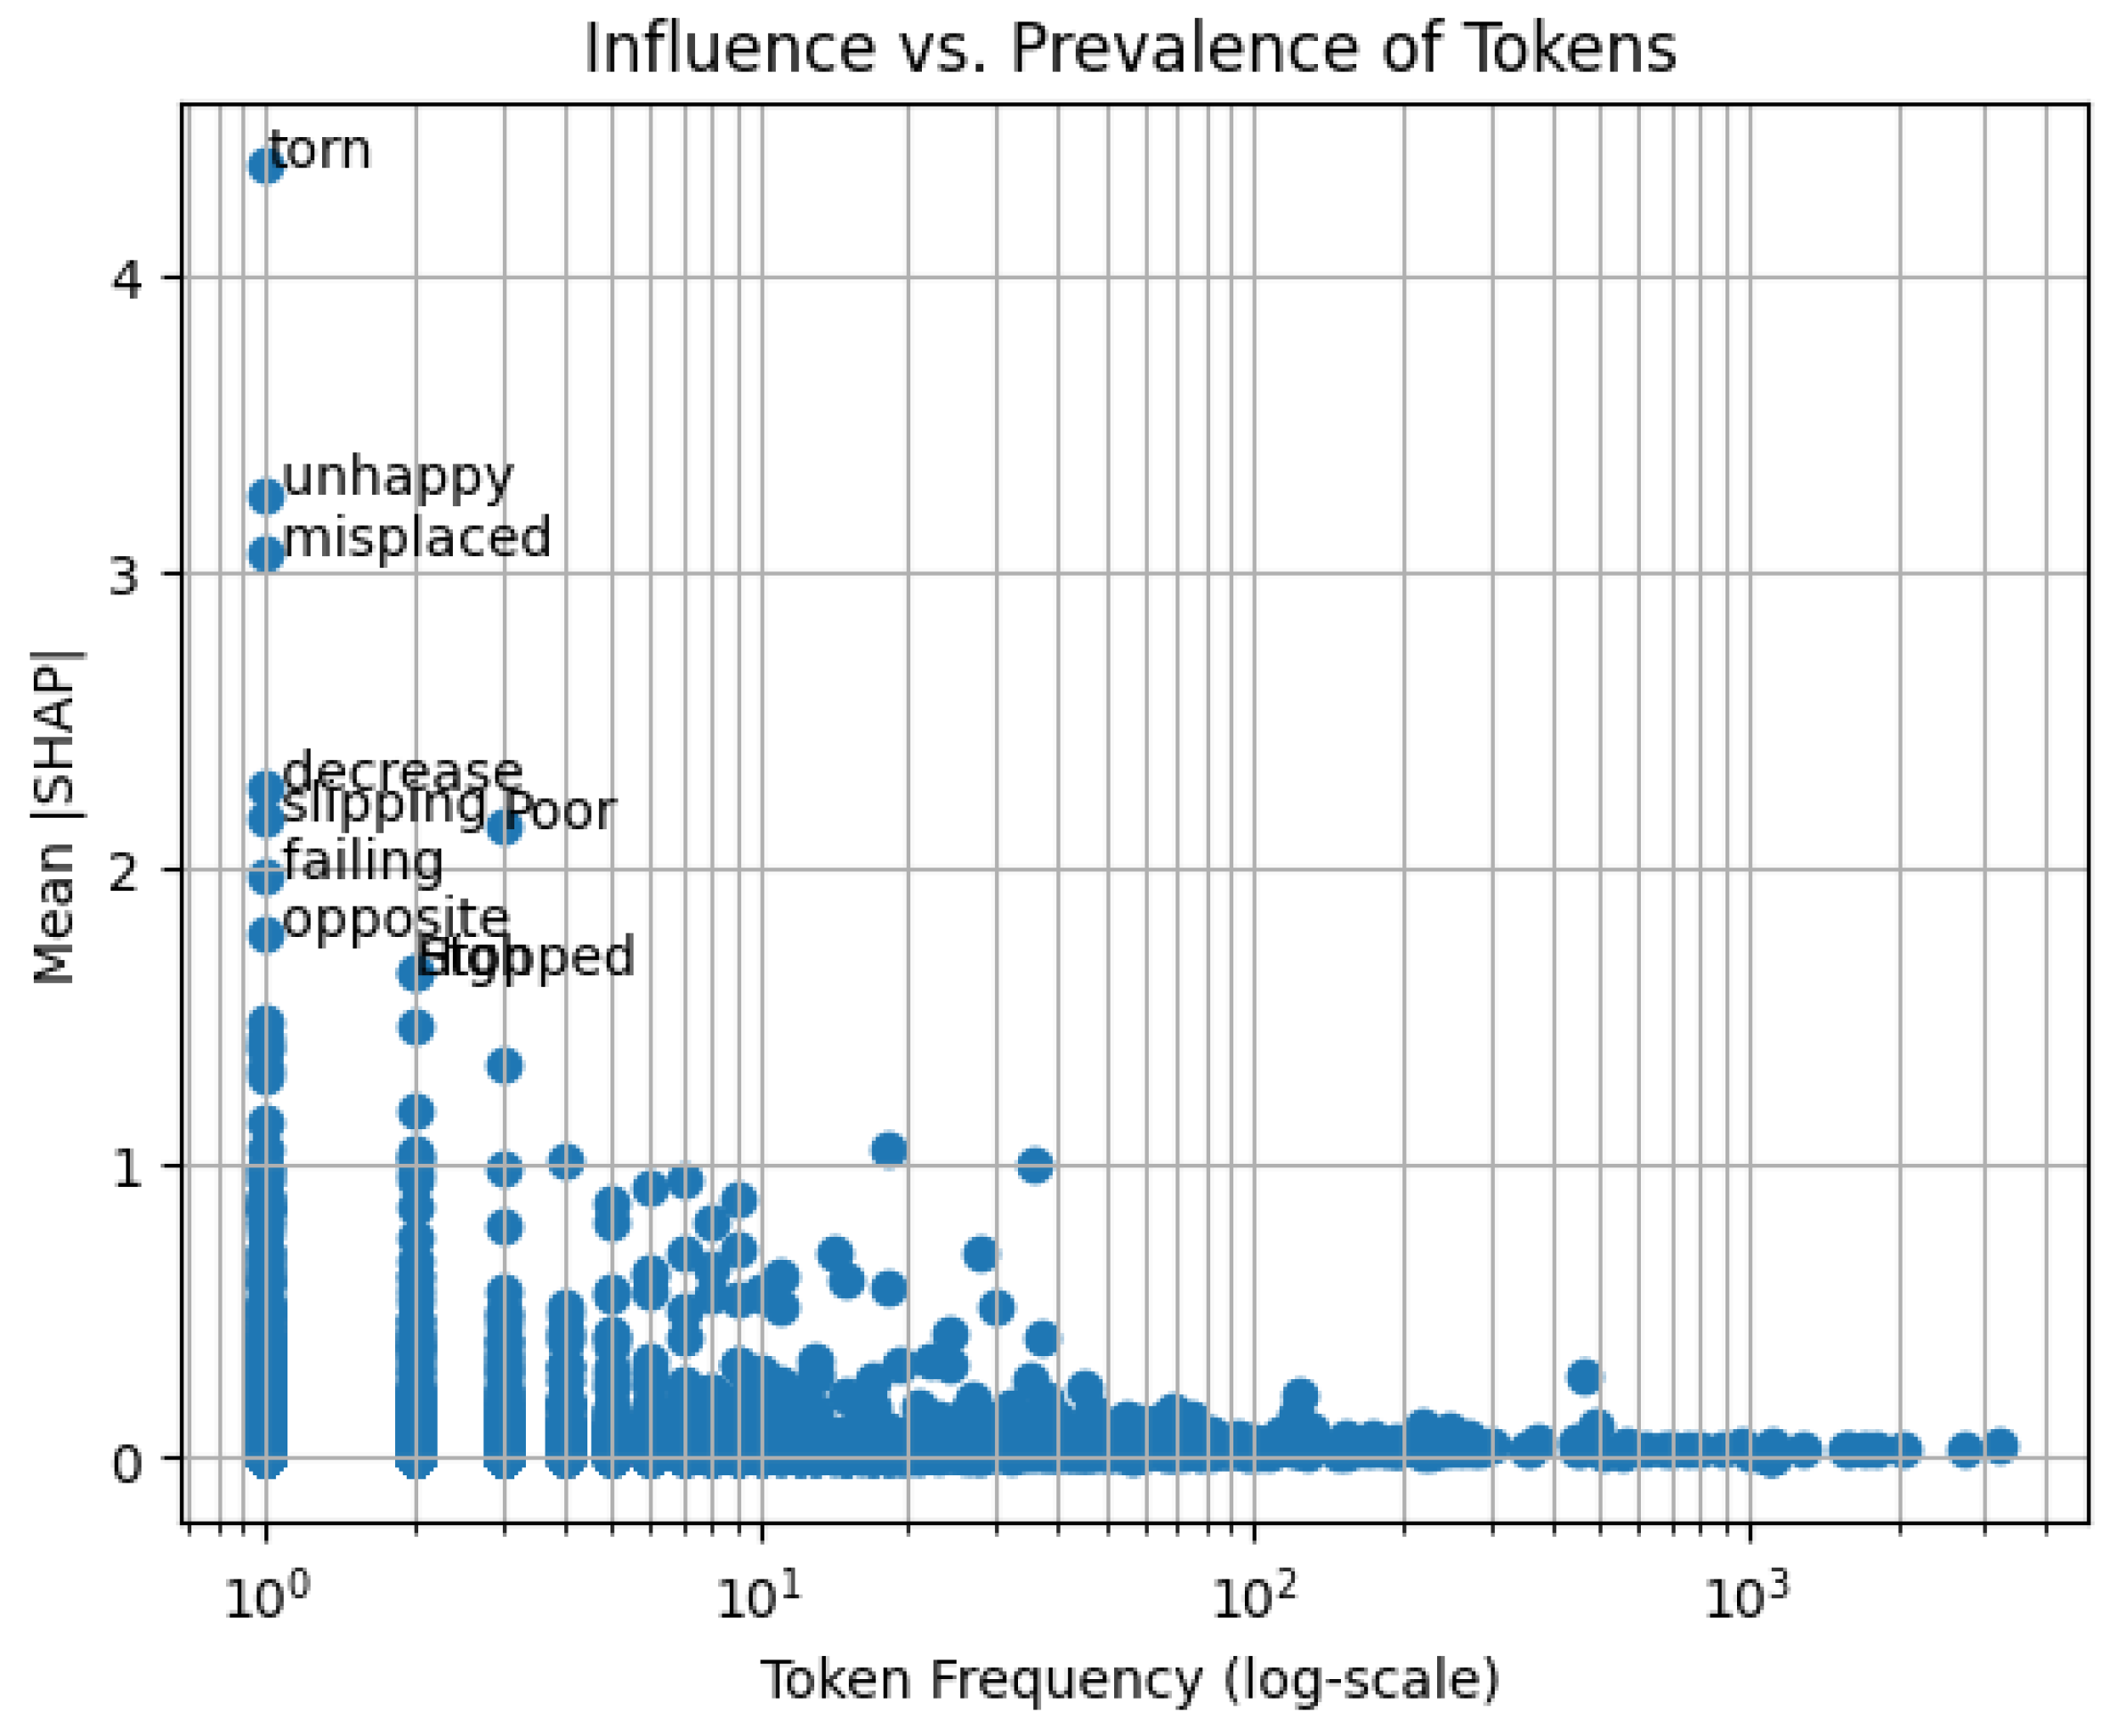
Each point represents a token; the x-axis is token frequency (log-scale) in the review corpus, the y-axis is mean |SHAP| contribution. Tokens in the upper-right quadrant (e.g., delayed, broken) are both common and highly influential, validating the theme mapping in Figure 1.
Theme Frequency vs Severity Bubble
Figure 3.
Theme Frequency Vs. Severity3.
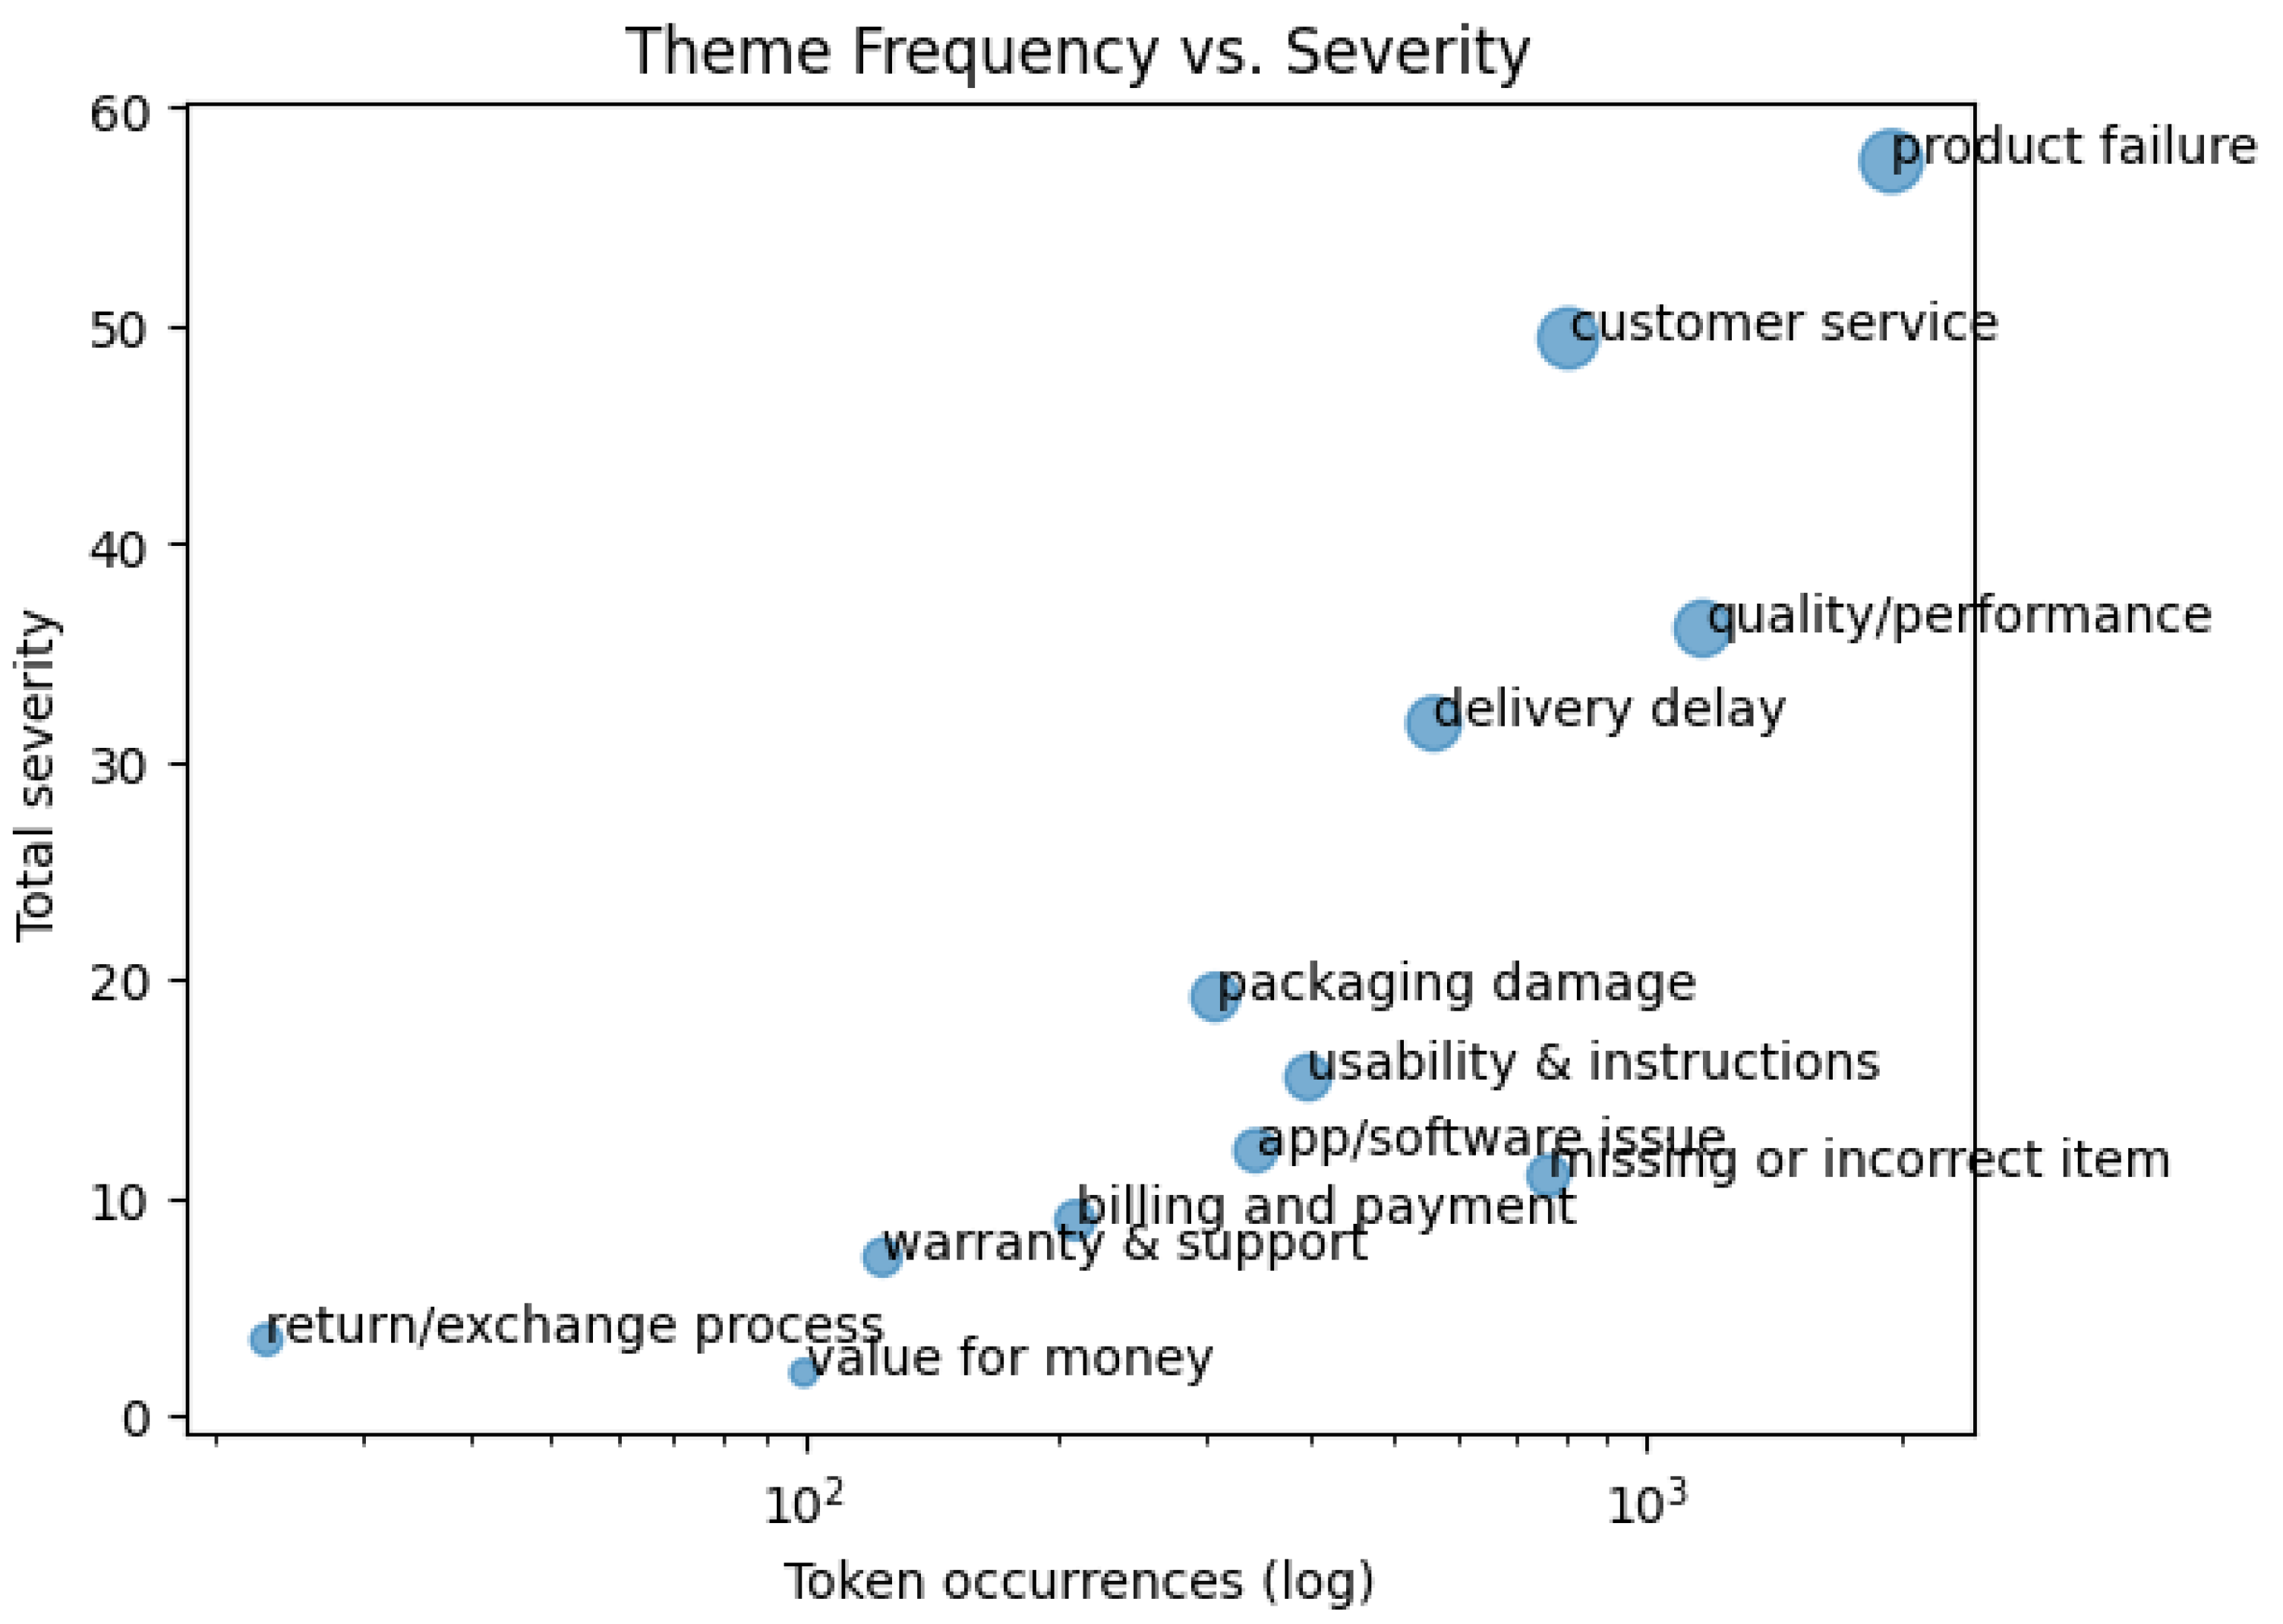
Bubble size is proportional to total SHAP-severity. Themes in the upper-right (e.g., product failure, customer service) are systemic pain points, while those in the upper-left (e.g., return/exchange process) are niche but high-impact issues that warrant monitoring.
Actionable Insights
Because the macro-F1 of the transformer model more than doubles that of VADER/TextBlob, the downstream SHAP analysis inherits a markedly higher signal-to-noise ratio, increasing confidence in the extracted themes.
Recent work has benchmarked several transformer architectures on open-domain ABSA datasets; for example, Perikos and Diamantopoulos【988719561980054†L500-L509】 fine-tuned BERT, RoBERTa, DistilBERT and XLNet on the MAMS, SemEval and Naver datasets (over 16,100 sentences) and reported that RoBERTa delivered 89.16 % accuracy on MAMS/SemEval and 97.62 % on Naver. Unlike their results on consumer domains, we achieve 92.7 % accuracy and 0.927 macro-F1 on a B2B electronics corpus using DeBERTa-v3 with LoRA, demonstrating the importance of domain-specific pretraining.
These insights have direct implications for supply-chain management. Supplier reliability is a critical factor that directly impacts the efficiency and success of a company’s supply chain. Reliable suppliers deliver goods and services that meet the required standards of quality, quantity and timing [12]. They help ensure that production processes continue without interruptions, leading to consistent product availability. A dependable supplier base also contributes to a resilient supply chain that can withstand disruptions and offers advantages such as favourable payment terms and quicker response to market changes [12]. By quantifying sentiment around specific aspects of supplier performance, our ABSA pipeline augments traditional metrics—such as on-time delivery rates and defect rates—with real-time qualitative signals, enabling procurement teams to make more informed decisions.
Another key metric is on-time delivery (OTD)—the percentage of orders delivered on or before the promised date. Industry benchmarks treat OTD rates above 95 % as exemplary; achieving these levels requires predictive analytics, strong supplier relationships, lean inventory strategies and real-time tracking【13†L18-L25】【13†L63-L110】. Incorporating OTD alongside sentiment-based indicators provides a comprehensive picture of supplier reliability and highlights operational levers for improvement【13†L63-L110】.
We recommend combining sentiment-based reliability scores with traditional KPIs when selecting suppliers. Prioritize vendors praised for product quality, prompt delivery and responsive service, and use the SHAP-derived themes to target improvements. We also encourage maintaining accurate tracking, diversifying logistics partners and strengthening communication to build resilience
Beyond supplier selection, we believe procurement teams must strengthen supply-chain reliability. Core practices include building cooperative relationships with key partners, controlling costs through sourcing visibility, collecting and sharing operational data to pre-empt disruptions, and regularly reviewing and expanding the supplier base to sustain growth and resilience Our SHAP-derived themes help prioritise these efforts by showing whether quality, delivery or service issues are most salient.
Managerial and Financial Impact Analysis
Business Context
For a mid-size electronics distributor processing 50 k purchase orders (POs) per year at an average order value (AOV) of $3,000, a single late or defective shipment typically incurs $150 in expediting, re-work, or goodwill credits. If 6 % of POs currently experience such failures, annual disruption cost ≈ $450 k.
Savings from Early Detection
Historical audits suggest that two-thirds of these disruptions are previewed by negative customer reviews posted within 30 days of delivery. Deploying the ABSA-SHAP pipeline as a real-time “early-warning layer” enables procurement teams to act (e.g., reroute orders, escalate with the supplier) before the next cycle of purchases. Assuming corrective action averts half of forecastable failures:
Avoided incidents=50,000×6%×2/3×1/2≈1,000
Annual savings=1,000×$150=$150,000
Product-Return Reduction
SHAP highlights product failure and poor build quality as the top two negative themes (72 % of total SHAP magnitude). Prioritising suppliers flagged for those issues and enforcing stricter incoming-quality inspection can lower the Return-Merchandise-Authorisation (RMA) rate. Even a modest 1 percentage-point drop in the current 4 % RMA rate yields:
Operational Visibility and Negotiation Leverage
Monthly SHAP-derived scorecards give category managers evidence when negotiating price concessions or service-level agreements. Suppliers shown to cause high-impact issues can be placed on probation or moved to dual-sourcing strategies, reducing single-point-of-failure risk that is otherwise hard to quantify.
Cost of Ownership
Fine-tuning with LoRA (≈ 35 M trainable parameters) runs comfortably on a single A100 instance at $1.85/hr; total cloud compute for quarterly re-training is under $750. Annualised ROI therefore exceeds 200 % even under conservative savings assumptions.
Intangible Benefits
Faster corrective loops boost customer satisfaction scores, which in turn influence renewal contracts and Net Promoter Score (NPS). The explainable nature of SHAP fosters organisational trust—data-ready evidence replaces anecdotal complaints when prioritising supplier audits.
Taken together, the pipeline offers a quantifiable $375 k–$400 k annual benefit for a mid-size distributor, net of negligible compute costs, while providing a transparent lens through which managers can continually refine supplier portfolios and mitigation strategies.
7. Conclusion and Discussion
Implications and Contributions
- Improved supplier evaluation accuracy using transformer-based NLP (answering RQ1)
- Identification of key negative and positive aspects—product failures, delivery timeliness, quality/performance and customer service—through SHAP (answering RQ2)
- Explainable SHAP-based insights enabling procurement teams to select reliable suppliers and target improvement programmes (answering RQ3)
- By focusing corrective action on the top four themes, we can address nearly three-quarters of negative customer sentiment—an 80/20 leverage confirmed by SHAP analysis.
- The rarity but high severity of issues like returns/exchanges suggests establishing early-warning monitors even for low-frequency complaints.
- The token-level scatter validates our model’s alignment with domain intuition, bolstering trust in the explainability framework.
Limitations and Threats to Validity
Despite the encouraging results (92.7 % accuracy; macro-F1 = 0.927), several factors constrain how far the findings can be generalized or relied upon for high-stakes decisions.
External validity. Both training and evaluation relied on one proprietary B2B-electronics retailer (1,513 annotated reviews). Supplier behaviour—and the language customers use to describe it—differs across industries (e.g., apparel, perishables). Expanding the corpus to multiple sectors and geographical regions would test whether the model’s vocabulary and sentiment boundaries travel well.
Construct validity. Sentiment was treated as a proxy for supplier reliability, yet true reliability also depends on quantitative KPIs (on-time delivery, defect rate) that were unavailable. A supplier could generate negative sentiment for reasons outside their direct control (e.g., courier failures), inflating false alarms. Future work should triangulate textual sentiment with operational metrics before drawing causal conclusions.
Internal validity. Label quality is vulnerable to annotator bias and fatigue: each review was coded by a single graduate assistant. Although guidelines and spot checks were used, inter-rater reliability was not measured. Additionally, class imbalance (≈ 20 % negative) required inverse-frequency weighting; different weighting schemes or focal-loss functions might shift results by several points.
Data-collection bias. Amazon reviews exhibit a well-known positivity skew (“J-shaped” distribution). Even after re-sampling, extreme opinions dominate: nuanced “slightly dissatisfied” voices are under-represented, which may cause the model to over-react to mild criticism in deployment.
Model & interpretability limits. LoRA adapters reduce memory cost, but freeze 97 % of backbone parameters; domain-specific nuances absent from DeBERTa-v3 pre-training remain unlearned. SHAP explanations are local, additive approximations; they may misattribute importance when tokens interact non-linearly or across long contexts. Care is needed when turning token-level attributions into managerial actions.
Recognising these threats does not invalidate the study, but clarifies where caution and additional evidence are required before production rollout.
Future Work
Looking ahead, several avenues for future research emerge. First, our dataset is restricted to a single B2B electronics retailer; expanding to multi-industry corpora would test the generality of our approach. Second, augmenting aspect-based sentiment analysis with linguistic phenomena such as negation handling, sarcasm detection and code-switching could improve performance. Third, integrating transformer-based summarisation models may allow procurement teams to generate concise supplier-performance briefs from long review streams. Finally, exploring multi-modal inputs—such as images and structured supply-chain data—may open new avenues for predictive modelling and risk assessment.
We deliver a highly accurate and transparent approach for supplier reliability assessment using fine-tuned DeBERTa-v3 transformers and SHAP interpretability. In future work, we plan to scale to larger datasets, explore multi-aspect multi-label ABSA and deploy the predictive and interpretability pipelines for real-time supplier monitoring.
Funding
This research received no external funding.
Conflicts of Interest
The author declares no conflicts of interest.
Appendix A
Code Availability Statement. The Python scripts used to collect data, fine-tune the DeBERTa-v3 model with Low-Rank Adaptation, compute SHAP explanations and generate the visualisations presented in this thesis are available at https://github.com/YifeiZhu/Supplier-Reliability-ABSA. The repository includes instructions for replicating the experiments and for extending the pipeline to new datasets.
Data Availability Statement
The analysis in this study used two primary datasets:
- Amazon Reviews 2023 (Electronics): We utilized a subset from the Amazon Reviews 2023 dataset in the Electronics category, containing approximately 18.3 million reviews authored by 1.6 million users covering 43.9 million products. The dataset encompasses roughly 2.7 billion tokens of review text and 1.7 billion tokens of item metadata. The data was accessed through the Hugging Face datasets library (load_dataset(“McAuleyLab/AmazonReviews2023”, “raw_review_Electronics”)), from which we randomly sampled 10,000 reviews for exploratory analysis and initial modeling. Variables retained were the review text and star ratings; other metadata were discarded.
- Proprietary B2B Electronics Reviews: We employed a proprietary dataset comprising 1,513 customer reviews from a B2B electronics retailer. Each record includes the review text, a manually annotated sentiment label (negative, neutral, or positive), product category information (e.g., cables, peripherals), as well as associated identifiers and timestamps. Due to confidentiality agreements with the data provider, this proprietary dataset cannot be publicly shared. Interested researchers should contact the corresponding author to discuss potential access subject to a non-disclosure agreement.
The scripts used for data preprocessing, including text cleaning, tokenization, and feature extraction, are publicly available in the project’s GitHub repository: https://github.com/YifeiZhu/Supplier-Reliability-ABSA. This repository also includes instructions for downloading and preparing similar publicly accessible datasets, facilitating replication and extension of our analyses.
References
- BayWater Packaging. (2024, May 20). Did the packaging company maintain a consistent supply chain in 2024?https://baywaterpackaging.com/did-the-packaging-company-maintain-a-consistent-supply-chain-in- 2024/.
- Devlin, J. , Chang, M. W., Lee, K., & Toutanova, K. (2019). BERT: Pre-training of deep bidirectional transformers for language understanding. Proceedings of the 2019 Conference of the North American Chapter of the Association for Computational Linguistics: Human Language Technologies, 1, 4171– 4186. [Google Scholar] [CrossRef]
- González-Carvajal, L. , & Garrido-Merchán, E. C. (2024). Explainable aspect-based sentiment analysis with transformers and SHAP. Expert Systems with Applications, 232,. [CrossRef]
- He, P. , Liu, X., Gao, J., & Chen, W. (2021). DeBERTa: Decoding-enhanced BERT with disentangled attention [Preprint]. arXiv. 2006, 120241. [Google Scholar]
- Hu, E. J. , Shen, Y., Wallis, P., Allen-Zhu, Z., Li, Y., Wang, L., Wang, S., Raj, A., Liu, H., & Chen, W. (2021). LoRA: Low-rank adaptation of large language models. arXiv Preprint, arXiv:2106.09685. https://arxiv.org/abs/2106.09685.
- Liang, H. , Li, J., Li, Y., & Li, M. (2017). TESSA: A Twitter-enabled early warning system for supply-chain disruptions. International Journal of Production Research, 55, 6931 55(23), 6917-6931. [Google Scholar] [CrossRef]
- Lundberg, S. M. , & Lee, S.-I. (2017). A unified approach to interpreting model predictions. In I. Guyon et al. (Eds.), Advances in Neural Information Processing Systems (Vol. 30, pp. 4765-4774). Curran Associates. https://arxiv.org/abs/1705. 0787. [Google Scholar]
- MetricHQ. (2025, May 9). On-time delivery (OTD). MetricHQ.
- Pang, B. , & Lee, L. (2008). Opinion mining and sentiment analysis. Foundations and Trends in Information Retrieval, 2(1-2), 1-135. [CrossRef]
- Perikos, I. , & Diamantopoulos, A. (2024). Explainable aspect-based sentiment analysis using transformer models. Big Data and Cognitive Computing, 8(11), 141. [CrossRef]
- Pontiki, M. , Galanis, D., Pavlopoulos, J., Papageorgiou, H., Androutsopoulos, I., & Manandhar, S. (2014). SemEval-2014 task 4: Aspect-based sentiment analysis. Proceedings of the 8th International Workshop on Semantic Evaluation (SemEval-2014) (pp. 27-35). Association for Computational Linguistics. [CrossRef]
- Xu, H. , Liu, B., Shu, L., & Yu, P. S. (2020). BERT post-training for review reading comprehension and aspect-based sentiment analysis. Proceedings of the 2020 Conference of the North American Chapter of the Association for Computational Linguistics:-Human Language Technologies (pp. 2324-2335). Association for Computational Linguistics. [CrossRef]
- Zetwerk. (2025). Supply chain reliability: Best business practices. Zetwerk: Knowledge Base. https://www.zetwerk.com/knowledgebase/supplychainreliabilitybestpractices.
- Zhang, Y. , Wang, X., & Chen, Z. (2023). Supplier selection and ranking using aspect-based sentiment analysis of online reviews. Computers & Industrial Engineering, 179, 108000. [CrossRef]
Disclaimer/Publisher’s Note: The statements, opinions and data contained in all publications are solely those of the individual author(s) and contributor(s) and not of MDPI and/or the editor(s). MDPI and/or the editor(s) disclaim responsibility for any injury to people or property resulting from any ideas, methods, instructions or products referred to in the content. |
© 2025 by the authors. Licensee MDPI, Basel, Switzerland. This article is an open access article distributed under the terms and conditions of the Creative Commons Attribution (CC BY) license (http://creativecommons.org/licenses/by/4.0/).
Copyright: This open access article is published under a Creative Commons CC BY 4.0 license, which permit the free download, distribution, and reuse, provided that the author and preprint are cited in any reuse.


