Submitted:
30 July 2025
Posted:
06 August 2025
You are already at the latest version
Abstract
Mitochondrial disorders are a diverse group of inherited diseases caused by defects in oxidative phosphorylation, the primary way cells produce energy. These disorders often affect multiple organ systems, particularly those with high energy demands, such as the brain, muscles, and heart. Although increasingly recognized worldwide, mitochondrial diseases are still underdiagnosed in resource-limited areas. This prospective observational study aimed to describe the clinical, biochemical, imaging, electrophysiological, and genetic features of 48 patients suspected of having mitochondrial disease at a tertiary care center in Eastern India. Participants were classified into four main clinical syndromes: mitochondrial encephalomyopathy with lactic acidosis and stroke-like episodes; Leber hereditary optic neuropathy; Leigh syndrome; and chronic progressive external ophthalmoplegia. The average age was 20.4 years (standard deviation 12.3; range 5–60), with a slight male predominance. Molecular testing confirmed known pathogenic mutations in mitochondrial transfer RNA genes, mitochondrial respiratory complex genes, and ATP synthase subunits, depending on the syndrome. Patients exhibited characteristic abnormalities on brain imaging, including stroke-like lesions in the temporal and parietal lobes or symmetrical involvement of the basal ganglia. Biochemical tests revealed elevated lactate levels in blood and cerebrospinal fluid. Electroencephalography often showed slowing or epileptiform discharges in those with brain involvement. Machine learning techniques helped identify clinical patterns, demonstrating their potential to aid in diagnosis. We offer one of the most comprehensive overviews of mitochondrial diseases in South Asia to date, highlighting the need for accessible molecular diagnostics and the usefulness of computational tools in understanding complex disease phenotypes.
Keywords:
mitochondrial disease
; oxidative phosphorylation
; genetic diagnosis
; Leigh syndrome
; MELAS
; Leber hereditary optic neuropathy
; chronic progressive external ophthalmoplegia
; neuroimaging
; South Asia
; machine learning
Introduction
Mitochondria are essential organelles that generate adenosine triphosphate (ATP), the primary cellular energy currency, through oxidative phosphorylation (OXPHOS). Beyond ATP production, mitochondria play key roles in calcium homeostasis, regulate apoptosis, modulate reactive oxygen species (ROS), and contribute to innate immunity. [1] Dysfunction in any of these processes may result in mitochondrial diseases, a broad group of conditions that disproportionately affect high-energy-demand tissues, including the brain, retina, myocardium, and skeletal muscle. [2]
Primary mitochondrial diseases (PMDs) represent a clinically and genetically heterogeneous group of disorders caused by pathogenic variants in either mitochondrial DNA (mtDNA) or nuclear DNA(nDNA)—the latter encoding over 1,000 mitochondrial proteins. [3] The phenotypic spectrum includes syndromic presentations such as MELAS (mitochondrial encephalomyopathy, lactic acidosis, and stroke-like episodes), MERRF (myoclonic epilepsy with ragged red fibers), Leigh syndrome, and CPEO (chronic progressive external ophthalmoplegia). Common neurological manifestations include seizures, encephalopathy, ataxia, developmental delay, stroke-like episodes, spasticity, and psychiatric symptoms. At the same time, systemic involvement may manifest as cardiomyopathy, endocrine dysfunction, sensorineural hearing loss, and gastrointestinal dysmotility. [4,5]
Although historically considered rare, mitochondrial diseases are now recognized among the most prevalent inherited metabolic disorders. Recent population-based studies estimate a minimum point prevalence ranging from 1 in 5,000 to 1 in 10,000 individuals, depending on the region studied. [6] In Australia, Skladal et al. [7] estimated a prevalence of 5 per 100,000 for pediatric cases and 13.1 per 100,000 for adult-onset mitochondrial disorders, with a minimum birth prevalence of 1 in 7,634 for disease onset at any age. Similarly, data from Japan, reported by Ibayashi et al. [8] indicate that between April 2018 and March 2019, 3,629 individuals were diagnosed with mitochondrial diseases, resulting in a prevalence of approximately 2.9 per 100,000 in the general population. In the northeast of England, the prevalence of clinically affected adults with mitochondrial disease was estimated at 9.6 per 100,000, with an overall genetic carrier frequency of 1 in 200 for mtDNA mutations. [9]
Despite these advances, the diagnosis of PMDs remains challenging due to their extreme clinical and genetic heterogeneity, variable tissue expression (heteroplasmy), and the presence of threshold effects. These diagnostic barriers are particularly exacerbated in resource-constrained settings, such as those in the South Asian region. A recent systematic review by Hettiarachchi et al. [10] highlights significant underreporting of mitochondrial disorders in countries such as India, Pakistan, Sri Lanka, and Bangladesh, where published data are mostly limited to case reports and genetic testing remains largely inaccessible. Of 89 citations identified through PubMed, only 18 studies—mostly case reports—met quality standards for inclusion, and no comprehensive population-based studies were found, making it difficult to determine the true burden of disease. [10]
To address this diagnostic and epidemiological gap, we conducted a prospective observational study at a tertiary neurology center in Eastern India. We aimed to systematically characterize the clinical, biochemical, neuroimaging, and molecular features of patients with suspected mitochondrial disease. Additionally, we applied machine learning tools to explore phenotype-based clustering and diagnostic classification, representing one of the first real-world cohort-based studies from South Asia to integrate multimodal data for PMD evaluation in a resource-limited setting.
Methods
Ethics Statement
This study was conducted in accordance with the ethical principles outlined in the Declaration of Helsinki. Written informed consent was obtained from all participants or their parents or legal guardians in the case of minors. The Institutional Ethics Committee approved the study protocol. Additionally, specific consent for genetic testing was obtained in accordance with the ethical guidelines issued by the Indian Council of Medical Research (ICMR, 2017; Section 10.4.5).
Study Design and Participant Selection
We conducted a retrospective observational study at a tertiary neurology referral center from March 2016 to January 2024. All patients presenting with clinical features suggestive of mitochondrial disease were screened for the condition. Inclusion criteria included any combination of one or more signs of neuraxial involvement, such as stunted growth or short stature, unexplained recurrent stroke at a young age, recurrent seizures, cerebellar ataxia, cognitive decline or early-onset dementia, peripheral neuropathy, progressive external ophthalmoplegia, visual loss or retinopathy, bilateral sensorineural deafness, skeletal myopathy, cardiomyopathy or arrhythmias, hepatopathy, or diabetes mellitus. Patients had to have a minimum score of 2 on the modified version of the Nijmegen mitochondrial disease criteria to qualify for inclusion. [11] Those with similar clinical manifestations but a confirmed diagnosis of a non-mitochondrial disorder were excluded.
The reporting of this study followed the STROBE (Strengthening the Reporting of Observational Studies in Epidemiology) guidelines. A flow diagram outlining the inclusion process is presented in Figure 1.
Clinical Diagnosis of Mitochondrial Disorders and Baseline Data Collection
Baseline demographic, clinical, and laboratory data were collected from all enrolled participants. Neurological status was assessed using the Glasgow Coma Scale(GCS) and the modified Rankin Scale (mRS), which provide standardized measures of consciousness and functional disability, respectively. Peripheral blood samples were analyzed for biochemical, serological, and immunological markers using standard enzymatic assays. The mode of inheritance was determined through detailed family history obtained via a structured questionnaire and confirmed with pedigree chart analysis.
Patients were classified into defined mitochondrial syndromes based on characteristic constellations of clinical, neuroimaging, and laboratory features. Diagnostic criteria from established literature were employed, including Rahman’s criteria for Leigh syndrome, [12] the Hirano criteria for MELAS, [13] and the standardized diagnostic guidelines for Leber hereditary optic neuropathy (LHON) proposed by the Research Committee on the Epidemiology of Intractable Diseases of Retinochoroidal and Optic Nerve Atrophy in collaboration with the Japanese Neuro-ophthalmological Society. [14] Diagnoses of CPEO, CPEO-plus, and Kearns–Sayre syndrome were made on a clinical basis, often as diagnoses of exclusion after ruling out alternative neuromuscular junction and primary myopathic disorders.
All patients underwent a rigorous differential diagnostic workup to exclude alternative etiologies before confirming a clinical diagnosis of mitochondrial disease.
Neuroradiological Evaluation and Assessment of Angiographic Landscape
All participants underwent initial neuroimaging according to institutional protocols, which included non-contrast computed tomography (CT), CT angiography, and magnetic resonance imaging (MRI) with adjunctive MR angiography and MR spectroscopy, depending on the clinical context. MRI scans were acquired using either 1.5- or 3.0-Tesla systems, ensuring adequate spatial and tissue resolution for structural and metabolic assessment.
When vascular abnormalities were suspected or further characterization was required, six-vessel cerebral digital subtraction angiography (DSA) was performed. Prior to DSA, renal function was assessed via serum urea and creatinine levels to mitigate the risk of contrast-induced nephropathy. Following the acquisition, advanced image reconstruction techniques, including three-dimensional (3D) and four-dimensional (4D) post-processing, were employed to generate virtual reality (VR) models and maximum intensity projection (MIP) images, thereby enhancing the visualization of both parenchymal and vascular abnormalities.
Muscle Biopsy
Muscle biopsy was performed in a subset of patients who provided informed consent for the procedure. Tissue samples were obtained from clinically appropriate sites and processed for both histopathological and immunohistochemical analysis. Staining was performed using the modified Gomori trichrome technique to detect ragged red fibers, a hallmark of mitochondrial myopathy. Additional experimental and technical details regarding tissue handling, staining protocols, and interpretative criteria are provided in the supplementary material.
Molecular Genetic Testing of Mitochondrial DNA (mtDNA)
Molecular genetic testing was conducted on patients suspected of having mitochondrial disorders after comprehensive clinical, biochemical, and neuroradiological assessments. The methods used aimed to detect point mutations, including single-nucleotide substitutions and small deletions, related to mitochondrial disease. A summary of the specific mutations targeted and their diagnostic significance is included in Table S1 of supplementary material.
For mutation detection, we utilized allele-specific polymerase chain reaction, also known as the amplification-refractory mutation system (ARMS). This technique, based on the principles of random amplified polymorphic DNA and restriction fragment length polymorphism, was chosen for its high sensitivity, suitability for in-house implementation, and cost-effectiveness in resource-limited settings. ARMS-polymerase chain reaction (PCR) enables the detection of single-base substitutions or small deletions using primers tailored to specific loci of interest.
The panel of tested mutations was restricted to those with documented prevalence in the eastern population of South and Southeast Asia, as established in prior regional genetic studies (Table S1 of supplementary material).
Nuclear DNA isolation
Genomic DNA was isolated from 2 mL of fresh or frozen peripheral blood using a standard salting-out protocol optimized for high-yield extraction of nuclear DNA. Blood samples were transferred into 15 mL centrifuge tubes and lysed by adding 2.5 times the volume of ice-cold Lysis Buffer I. The buffer consisted of 155 mM ammonium chloride (8.29 g/100 mL), 10 mM potassium bicarbonate (0.84 g/100 mL), and 1 mM EDTA (0.2 mL of 0.5 M EDTA, pH 8.0 per 100 mL). The mixture was incubated on ice for 10 minutes with intermittent vortexing to ensure optimal red blood cell lysis. Following incubation, samples were centrifuged at 3,500 rpm for 15 minutes. The supernatant was discarded, and the lysis step was repeated until a clear, red blood cell–free pellet was obtained.
The pellet was then resuspended in an equal volume of Lysis Buffer II, composed of 10 mM Tris-HCl (pH 8.0; 1 mL of 1 M Tris-HCl in 100 mL), 2 mM EDTA (0.4 mL of 0.5 M EDTA, pH 8.0), and 0.4 M NaCl (2.34 g in 100 mL final volume). The sample was vigorously vortexed to ensure complete dissolution. Subsequently, 100 µL of Proteinase K solution (prepared in 1% SDS and 2 mM EDTA) and 80 µL of 10% SDS were added. The mixture was incubated overnight at 37°C to facilitate protein digestion.
After enzymatic digestion, 1 mL of 6 M NaCl was added, and the solution was vortexed thoroughly. The sample was then centrifuged at 4,500 rpm for 15 minutes. The resulting supernatant was transferred to a fresh 2 mL microcentrifuge tube, and DNA was precipitated by adding 2.5 volumes of chilled absolute ethanol. Following 1 hour of incubation at –80°C, the tubes were centrifuged at 13,000 rpm for 20 minutes. The supernatant was discarded, and the DNA pellet was washed three times with 70% ethanol, followed by air-drying.
The purified genomic DNA was finally dissolved in 200 µL of 2.5 mM Tris-HCl (pH 8.0). DNA yield and purity were assessed spectrophotometrically by measuring absorbance at 260 and 280 nm.
Mitochondrial DNA Isolation
Mitochondrial DNA (mtDNA) was isolated following a modified protocol based on the method described by Clayton and Shadel. After red blood cell lysis using Lysis Buffer I, as detailed above, the remaining white blood cells were utilized for mtDNA extraction. The white blood cell pellet was resuspended in 1 mL of ice-cold homogenization buffer containing 0.25 M sucrose, 10 mM EDTA, and 30 mM Tris-HCl (pH 7.5). The suspension was homogenized using a combination of vortexing and sonication.
The homogenate was centrifuged at 1,000 × g for 15 minutes at 4°C to remove unbroken cells and nuclei. The supernatant was collected, and the pellet was re-homogenized in 600 µL of chilled homogenization buffer, followed by a second centrifugation at 1,000 × g for 10 minutes at 4°C. The resulting supernatant was combined with the previous supernatant and subjected to high-speed centrifugation at 12,000 × g for 30 minutes at 4°C to isolate the mitochondrial pellet.
The mitochondrial fraction was then lysed using Lysis Buffer II as previously described. The lysate was transferred to a fresh centrifuge tube, and 2.5 volumes of absolute chilled ethanol were added to precipitate the DNA. After a 1-hour incubation at –80°C, samples were centrifuged at 13,000 rpm for 20 minutes. The supernatant was discarded, and the resulting DNA pellet was washed three times with 70% ethanol, followed by air-drying.
The purified mitochondrial DNA was resuspended in 100 µL of 2.5 mM Tris-HCl (pH 8.0). DNA purity and concentration were assessed using spectrophotometric analysis, as indicated by the A260/A280 ratio.
Determination of DNA Concentration and Purity by Spectrophotometry
The concentration and purity of the extracted DNA were determined using ultraviolet spectrophotometry. Nucleic acids absorb ultraviolet light due to the presence of nitrogenous bases, with peak absorbance for double-stranded DNA occurring at 260 nm. The concentration of double-stranded DNA was calculated using the standard conversion factor, where an optical density (OD) of 1.0 at 260 nm corresponds to 50 µg/mL of pure DNA.
Purity was assessed by measuring the absorbance ratio at 260 nm and 280 nm (A260/A280), with acceptable values for pure DNA ranging from 1.6 to 1.8. Measurements falling outside this range suggested potential contamination by proteins or RNA. When DNA samples were diluted prior to spectrophotometric assessment, the dilution factor was incorporated into the calculation of the final concentration to estimate the stock DNA concentration accurately.
PCR-Primer Designing Tool
Allele-specific primer pairs for mutation detection were designed according to the methodology described by Wangkumhang et al. [15] The web-based WASP platform (http://bioinfo.biotec.or.th/WASP) was utilized for designing allele-specific primers. This tool incorporates a deliberate mismatch at the second-to-last nucleotide position of the allele-specific primer, thereby increasing specificity and reducing non-specific amplification.
All designed primers were subsequently validated using the Primer-BLAST tool provided by the National Centre for Biotechnology Information (https://www.ncbi.nlm.nih.gov/tools/primer-blast) to ensure sequence specificity and to rule out potential off-target binding. A comprehensive list of PCR primers, along with the corresponding cycling conditions and target mitochondrial DNA mutations and deletions, is presented in Table S2 of the supplementary file.
PCR
PCR amplification was performed using a thermal cycler (Applied Biosystems) and Taq DNA polymerase (Fermentas; 5 U/μL). Standard PCR protocols were employed for the amplification of targeted mitochondrial DNA regions associated with known pathogenic mutations. The composition of the reaction mixture, including primer concentrations, buffer conditions, and MgCl₂ levels, as well as the thermal cycling parameters, is detailed in Table S3 of the supplementary file.
Agarose Gel Electrophoresis of DNA
PCR-amplified DNA fragments were separated by agarose gel electrophoresis using 0.8–1.2% (w/v) Seakem LE agarose (Lonza, USA) prepared in TAE buffer. Agarose was dissolved by heating and cooled to approximately 50°C, after which ethidium bromide (1 μL of a 10 mg/mL stock per 50 mL of gel) was added to facilitate DNA visualization. The gel was cast and allowed to solidify before being placed in an electrophoresis tank containing TAE running buffer. DNA samples were prepared by mixing 10 μL of PCR product with two μL of 6X loading dye and then loading them into the wells. Following electrophoresis, DNA bands were visualized using an ultraviolet transilluminator (ChemiDoc MP Imaging system, Bio-Rad). The visualized bands were sometimes seen with an inverted image setup for better resolution and clarity, and placed as such.
DNA Sequencing
Targeted Sanger sequencing of the mitochondrial gene MT-TL1 was performed to identify point mutations in this gene along with heteroplasmy conditions. PCR amplification encompassed the MT-TL1 gene region (positions 3230–3304) along with flanking sequences. Sequencing was conducted using the BigDye Terminator v3.1 Cycle Sequencing Kit (Applied Biosystems), and protocol specifics are detailed in Table S4 of the supplementary file. PCR products were precipitated with 2.5 μL of 125 mM EDTA and 30 μL of absolute ethanol, followed by centrifugation at 13,000 rpm for 20 minutes at 4°C. The pellet was washed three times with 85% ethanol, with each wash followed by centrifugation at 13,000 rpm for 15 minutes at 4°C. It was then air-dried and dissolved in 12 μL of Hi-Di formamide. The samples were incubated in the dark for 30 minutes, denatured at 95°C for 5 minutes, and then snap-chilled before being subsequently loaded onto an automated DNA sequencing platform.
Nuclear Gene Analysis
Targeted sequencing of key nuclear genes associated with mitochondrial disorders—POLG1, POLG2, and SURF1—was performed to investigate their involvement in the disease spectrum observed in this cohort.
Band Intensity Measurement
In cases of suspected heteroplasmy, band intensity was quantified using ImageJ software, following the protocol available at [https://www.yorku.ca/yisheng/Internal/Protocols/ImageJ.pdf]. Bar graphs representing relative band intensities were generated using GraphPad Prism. Bands exhibiting intensities below 5–10% of the wild-type reference were excluded from graphical representation due to insufficient signal and variability. Images were edited and annotated using CanvasX and BioRender.
Sequence Data Processing
Raw sequence files were analyzed based on the chromatogram obtained from GeneDoc 2.0 software, along with a multiple sequence alignment for variant detection using CLUSTALW from the exported FASTA sequence.
Multiple Sequence Alignment and Pathogenicity Analysis
Conservation and pathogenicity analysis of mitochondrial variants were conducted using multiple bioinformatics platforms. MITOMASTER was used for multiple sequence alignment (MSA) and variant conservation profiling. Functional and pathogenic predictions were obtained using PolyPhen-2, MitoTIP, HmtVar, and APOGEE, offering multi-tool validation of the deleterious potential of identified mutations.
Statistical Analysis
All statistical analyses were performed using IBM SPSS Statistics for Windows, Version 26.0 (IBM Corp., Armonk, NY, USA). Graphs and visual representations were generated using GraphPad Prism version 5.0 (GraphPad Software, San Diego, CA, USA). A complete-case analysis approach was adopted to handle missing data.
Categorical variables were summarized as frequencies and percentages, while continuous variables were expressed as means ± standard deviations (SD). Statistical tests applied to compare groups or assess associations are detailed in the respective results subsections. A p-value of <0.05 was considered statistically significant.
Network Generation
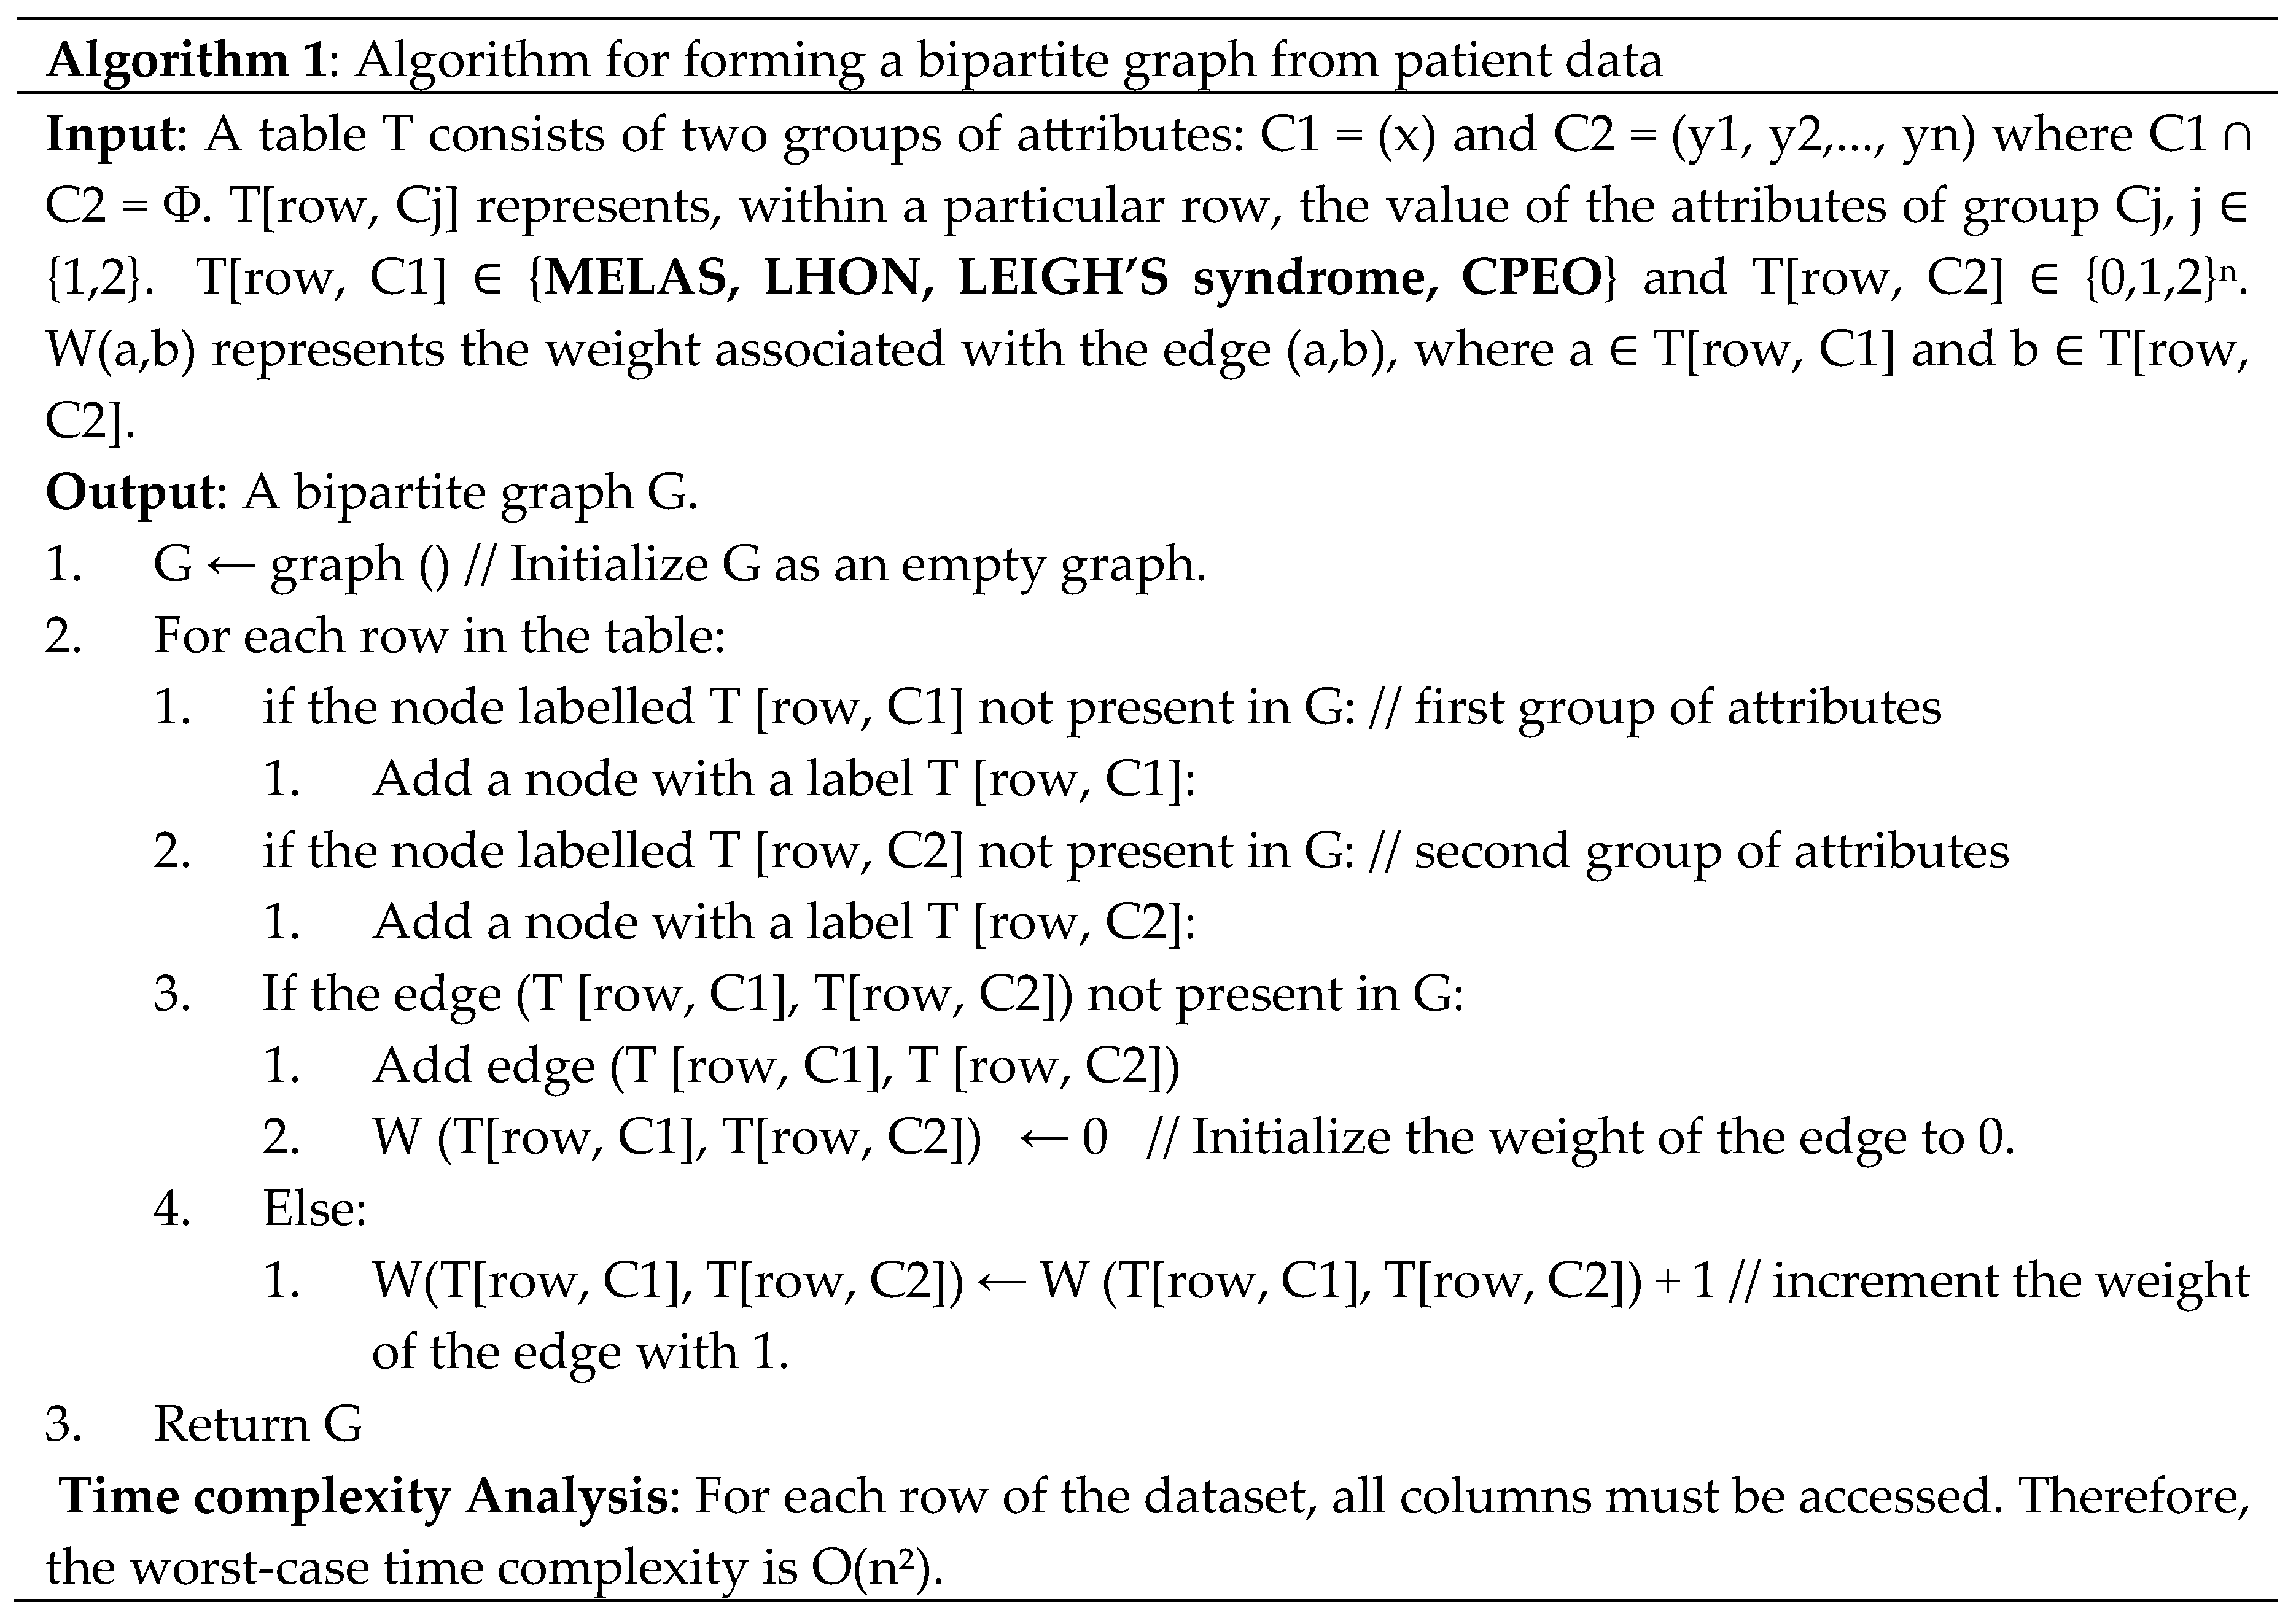
Algorithm 1 illustrates the construction of the bipartite network from the demographic, clinical, and neurological variables of patients clinically diagnosed with mitochondrial disorders. The columns are partitioned into two sections: C1 and C2. C1 possesses a singular feature, namely, the name of the mitochondrial illness. C2 possesses the remaining attributes. Each property of C2 may assume values from the set {0,1,2}. T[row, C1] denotes the value of the attribute associated with column C1 of a specific row in the database, which pertains to one of the following diseases: MELAS, LHON, Leigh’s syndrome. and CPEO, and T[row, C2] denote the concatenated values of the characteristics in that specific row of the table. For instance, if C2 = (y1, y2, y3) and for a specific row y1 = 0, y2 = 0, y3 = 2, then T[row, C2] = 002. Upon examining the data table, we generated two nodes in the network for each row. The initial node signifies the value of the attribute group associated with the first group, namely T[row, C1] (Line 2.a.i). In contrast, the subsequent node denotes the value of the attribute group linked to the second group, specifically T[row, C2] (Line 2.b.i). Subsequently, we introduce an edge with an initial weight of zero from T[row, C1] to T[row, C2], provided that the edge did not previously exist. Alternatively, we augment the edge weight by one.
Decision Tree Model Development
To classify patients based on clinical and molecular attributes, we implemented a Decision Tree classifier using the Scikit-learn library in Python. The model was based on the Classification and Regression Tree algorithm, which recursively partitions the feature space to maximize class purity at each node.
The dataset was randomly split into training (80%) and testing (20%) subsets. To optimize the model and reduce overfitting, key hyperparameters—such as maximum tree depth, minimum samples required to split an internal node, and minimum samples per leaf node—were tuned using grid search with k-fold cross-validation (k = 5). This ensured a balanced bias-variance trade-off, improving the model's generalizability. Final hyperparameter settings used for the test dataset evaluation are summarized in Table S5 of the supplementary file.
Feature Importance Analysis Using Random Forest
To identify the most predictive features contributing to classification, we employed a Random Forest algorithm, also implemented in Python using Scikit-learn. As an ensemble method comprising multiple decision trees, Random Forests inherently offer feature importance estimation by evaluating how each feature improves the quality of splits across all trees, quantified via metrics such as Gini impurity reduction or information gain.
The Random Forest model was trained on the full dataset. Hyperparameters, including the number of estimators (estimators), maximum tree depth, and minimum samples per split, were optimized to ensure stable importance scores and model robustness. Following training, the mean decrease in impurity (MDI) was calculated for each feature, ranking them according to their predictive contribution.
These ranked features were used to inform feature selection and interpretability of the decision tree model.
Results
Baseline Demographic Characteristics and Bipartite Network Analysis of Patients with Clinically Diagnosed Mitochondrial Disorders
A total of 48 patients from 42 unrelated families were clinically diagnosed with mitochondrial disorders based on comprehensive clinical, radiological, biochemical, and electrophysiological evaluations, as summarized in Table 1 and Table 2. MELAS was the most frequently identified syndrome, accounting for 17 patients (32.5%), followed by CPEO in 14 patients (29.2%), LHON in 10 patients (20.8%), and Leigh syndrome in 7 patients (14.6%).
The mean age at presentation across the cohort was 23.9 years, with a standard deviation of ±13.9 years, and the age range extended from 9 months to 60 years. The sex distribution was nearly balanced, with 25 males (52.1%) and 23 females (47.9%). Age at onset varied among the syndromes: patients with MELAS presented between 5 and 60 years of age, with a mean of 13.5 years (SD ±7.2); those with CPEO presented between 8 and 48 years, with a mean of 20.6 years (SD ±10.7); LHON cases ranged from 20 to 60 years, with a mean of 25.1 years (SD ±12.8); and Leigh syndrome was diagnosed in individuals aged from 8 months to 38 years, with a mean of 9.9 years (SD ± 11.3, standard error of the mean ±4.6) (Table 2).
The average disease duration prior to diagnosis was longest in patients with LHON, with a mean duration of 8.2 years, followed by CPEO at 7.4 years, MELAS at 6.9 years, and Leigh syndrome at 2.3 years. MELAS exhibited variable disease progression patterns: 8 patients (47.1%) showed a slowly progressive course, whereas nine patients (52.9%) displayed a relapsing-progressive trajectory. LHON was characterized by an acute-onset, non-progressive pattern in 6 patients (60%) and a slowly progressive course in the remaining four patients (40%). Leigh syndrome showed a slowly progressive course in three patients, an acute-onset progressive form in one patient, and a relapsing-progressive pattern in one individual. In contrast, all 14 patients diagnosed with CPEO exhibited a slowly progressive clinical course (Table 2).
Parental consanguinity was reported in 6 patients (12.5%), as determined by standardized familial questionnaires. These included three MELAS cases, two Leigh syndrome cases, and one case of CPEO. A positive family history suggestive of mitochondrial disease was reported in one patient with MELAS, eight patients with LHON, and four patients with CPEO. None of the patients with Leigh syndrome had a family history consistent with mitochondrial disease.
Bipartite network analysis was performed to evaluate the relationships between specific mitochondrial syndromes and key demographic and clinical variables. This analysis revealed that MELAS displayed the greatest connectivity, reflecting a high degree of phenotypic heterogeneity across variables such as age at onset, sex, family history, and clinical progression. Conversely, patients with Leigh syndrome were clustered within smaller, more distinct subgroups, often associated with regression of developmental milestones and early-onset symptoms, as represented by nodes A15 and A7 in the network model (Figure 2).
The three strongest weighted edges in the network connected node A1 to MELAS, node A20 to MELAS, and node A12 to LHON. The A1–MELAS edge reflected a cluster of female patients aged 16 to 25 years with no positive family history, whereas A20–MELAS indicated a grouping of female patients aged 26 to 36 years who presented with exercise intolerance but lacked other syndromic features, such as developmental delay or short stature. The A12–LHON edge represented older female patients with a documented positive family history of visual or neurologic impairment, highlighting the familial aggregation commonly seen in LHON (Figure 2). These findings underscore the potential of bipartite network analysis to elucidate demographic and clinical clustering within mitochondrial syndromes, offering a data-driven approach for refining diagnostic stratification.
Baseline Clinical Characteristics from General Survey and Systemic Examination
A detailed clinical survey of the 48 patients with confirmed mitochondrial disorders revealed a diverse spectrum of systemic and developmental abnormalities, as outlined in Table 2. Developmental delay was documented in five patients (10.4%), of whom four were diagnosed with Leigh syndrome and one with CPEO. Regression of developmental milestones was observed in two patients (4.1%), both of whom were classified as having MELAS. Short stature was noted in six individuals (12.5%), distributed across three patients with Leigh syndrome, two with CPEO, and one with MELAS.
Minor dysmorphic features were also reported. Hypertelorism was observed in one patient each with MELAS and Leigh syndrome, while a single patient diagnosed with LHON exhibited short metatarsals.
Systemic examination revealed involvement of multiple organs. Systemic hypertension was recorded in one MELAS patient. Cardiac conduction abnormalities—including left bundle branch block, bifascicular block, and sexual infantilism—were each identified in one patient with CPEO. Sensorineural hearing loss was present in four patients (8.3%), including two with CPEO and one each with Leigh syndrome and MELAS.
Features of metabolic dysfunction were also evident. One patient with MELAS and another with LHON were diagnosed with metabolic syndrome, including type 2 diabetes mellitus and cryptogenic hepatic cirrhosis. Pregnancy-induced hypertension with eclampsia was noted in one MELAS patient. Additionally, major depressive disorder was diagnosed in one patient with LHON and one with CPEO, highlighting the neuropsychiatric component associated with mitochondrial pathology.
Baseline Neurological Characteristics and Network Analysis of Patients with Mitochondrial Disorders
Comprehensive neurological assessments were conducted in all patients with a clinical diagnosis, revealing a broad spectrum of manifestations, some of which emerged during follow-up evaluations rather than at initial presentation. Among the 17 patients with MELAS, headache and hemiparesis were each observed in seven individuals (41.2%). Hemiparesis was also documented in one patient with Leigh syndrome (12.3%). Encephalopathy was noted in ten MELAS cases (58.8%) and three individuals with Leigh syndrome (42.8%). Dysarthria was present in 10 patients with MELAS (58.8%), 5 with CPEO (35.7%), and 2 with Leigh syndrome (14.3%). Dysphagia occurred in three MELAS patients (17.7%) and four with CPEO (28.6%) (Table 3).
External ophthalmoplegia, particularly ptosis with impaired ocular motility, was seen in 13 patients with CPEO (92.8%), and oculopharyngeal weakness was present in 12 of them (85.7%). Progressive cognitive decline was documented in seven MELAS patients (41.2%) and four with Leigh syndrome (57.1%). Visual disturbances, including dimness of vision and abnormal fundoscopic findings, were universal among patients with LHON (100%), and also observed in two cases of Leigh syndrome (28.6%) and one case of MELAS (5.9%). Stroke-like episodes were most commonly reported in MELAS (n = 10; 58.8%) (Table 3).
Seizure disorders were a prominent feature, particularly in MELAS, where 16 out of 17 patients (94.1%) experienced seizures. Among them, focal seizures with secondary generalization were most common (n = 12; 75%), followed by myoclonic seizures (n = 8; 50%) and generalized tonic-clonic seizures (GTCS) (n = 6; 37.5%). In contrast, GTCS was the predominant seizure type in Leigh syndrome, affecting three out of seven patients (42.8%) (Table 3).
Movement disorders were identified in 11 MELAS patients (64.7%), with dystonia (n = 7; 41.2%) being the most frequent, followed by tremor (n = 4; 36.4%). Similarly, five of seven patients with Leigh syndrome (71.4%) exhibited movement abnormalities, with dystonia again being the most common manifestation (n = 4; 80%) (Table 3).
The bipartite network analysis further underscored the neurological complexity and disease-specific clustering. Distinct neurological symptom profiles emerged across the four major mitochondrial syndromes. MELAS and Leigh syndrome were associated with a broader array of neurological combinations (e.g., A1, A4, A6, A9, A10, A31), reinforcing their heterogeneous clinical phenotypes. In contrast, LHON showed a highly weighted connection with node A12 (0000000100000000), corresponding to a strong and specific association with visual impairment (w = 9). CPEO was most strongly linked with node A11 (0100000001100000) (w = 6), which represents external ophthalmoplegia and acute encephalitis syndrome (Figure 3).
Regarding seizure disorders, MELAS displayed the widest distribution across multiple nodes, with notable connections to A4 (010002; w = 2), A11 (001113; w = 3), and A13 (110010; w = 2), reflecting its polymorphic seizure profile, including focal seizures with secondary generalization, myoclonic seizures, and GTCS. By contrast, the other three syndromes—CPEO, Leigh syndrome, and LHON—clustered around node A3 (00000), suggesting a generally lower association with seizure manifestations (w = 14, 10, and 3, respectively) (Figure 3).
In the context of movement disorders, MELAS again exhibited the strongest association, with a distinct connection to node A3 (0010000), particularly reflecting dystonia (w = 4). Conversely, LHON, CPEO, and Leigh syndrome primarily aligned with node A1 (0000000), indicating a relatively lower prevalence of movement disorder features in those subgroups (Figure 3).
Findings from Biochemical and Laboratory Investigations
All 48 patients diagnosed with mitochondrial disorders underwent a comprehensive biochemical evaluation. Routine laboratory tests—including complete blood count (except in one patient with Leigh syndrome), serum electrolytes, coagulation profiles, lipid panels, and assessments of liver and renal function—were generally within normal limits across the cohort.
Serum lactate levels were elevated in a substantial proportion of patients, indicating impaired oxidative metabolism. Specifically, increased serum lactate was found in 13 of the 17 patients with MELAS (76.4%), with a mean concentration of 24.4 ± 5.8 mg/dL. Similarly, elevated levels were detected in 8 of 14 patients with CPEO (57.1%; mean: 27.9 ± 19 mg/dL), 4 of 7 with Leigh syndrome (57.1%; mean: 22.1 ± 7 mg/dL), and 4 of 10 with LHON (40%; mean: 24 ± 16.6 mg/dL), as summarized in Table 4.
Cerebrospinal fluid (CSF) analysis revealed elevated lactate in 4 MELAS cases (23.5%) with a mean value of 17.9 ± 4.7 mg/dL (range: 10.3–29 mg/dL), 9 CPEO patients (64.3%; mean: 22.6 ± 8.1 mg/dL; range: 12.6–47 mg/dL), and 3 Leigh syndrome patients (42.9%; mean: 21.5 ± 6.5 mg/dL; range: 15–34 mg/dL). Among patients with LHON, elevated CSF lactate was observed in 2 cases (20%), with a mean of 17.4 ± 3.8 mg/dL (range: 13–25 mg/dL).
Regarding CSF glucose, elevated values were identified in 2 MELAS patients (11.8%), with a mean of 56.5 ± 14.1 mg/dL (range: 31–92 mg/dL), and in 3 LHON patients (33.3%), with a mean of 69.4 ± 17.9 mg/dL (range: 45–108 mg/dL). In contrast, CSF glucose concentrations remained within normal limits in all patients with CPEO (mean: 55.6 ± 11.3 mg/dL; range: 34–78 mg/dL) and Leigh syndrome (mean: 57.4 ± 8.8 mg/dL; range: 44–73 mg/dL).
Elevated CSF protein levels (>60 mg/dL) were detected in 3 LHON patients (33.3%) with a mean of 41.9 ± 12.8 mg/dL (range: 21.2–65 mg/dL), and in 5 CPEO patients (35.7%) with a mean of 49.8 ± 17.4 mg/dL (range: 23–86 mg/dL). An increased CSF cell count was documented in 3 patients with LHON (33.3%), 3 with Leigh syndrome (42.9%), and 4 with CPEO (28.6%).
Electroencephalogram (EEG) abnormalities were primarily observed in MELAS and Leigh syndrome. In the MELAS group, spike-and-wave discharges (SWDs) were present in 5 patients (29.4%), while generalized diffuse slowing was seen in 4 patients (23.5%). Six MELAS cases (35.3%) showed left-sided spike-wave discharges with secondary generalization. In the Leigh syndrome group, 3 patients (42.9%) exhibited SWDs, and one case (14.3%) demonstrated generalized slowing. No EEG abnormalities were identified in any of the LHON or CPEO patients included in this study (Table 4).
Findings of Muscle Biopsy
Muscle biopsy was performed in eight patients. In two of these cases—one diagnosed with MELAS (MT25) and the other with CPEO (MT27)—a high proportion of ragged red fibers (>40%) was identified, suggesting significant mitochondrial involvement. A myopathic pattern was observed in three patients (37.5%), including two with MELAS and one with CPEO. The remaining two cases demonstrated nonspecific histopathological changes, lacking distinct diagnostic features.
Findings from Neuroradiological Investigations (Table 5)
Comprehensive brain MRI and MR spectroscopy were conducted in all 48 clinically diagnosed patients with mitochondrial disorders. Among these, abnormal neuroradiological findings were detected in 25 cases. T2-weighted hyperintensities were the most common findings, particularly in patients with MELAS, where 15 of 17 patients (88.2%) demonstrated such alterations. These lesions were primarily located in the bilateral frontotemporal and frontoparietal regions (each observed in 5 patients, 33.3%), followed by bilateral caudate and putamen (n=4, 26.6%) and cerebellum (n=4, 26.7%). Gliotic changes were noted in the bilateral frontoparietal and occipital lobes in four MELAS cases. Diffusion restriction, suggestive of acute cytotoxic injury, was identified in the caudate and putamen in three patients and in the bilateral thalamus in two patients. Diffuse cortical atrophy was evident in four MELAS cases. MR spectroscopy revealed lipid-lactate peaks in three patients over the bilateral temporal, parietal, and occipital cortices, and abnormal NAA peaks in two patients within the frontal gray matter.

Table 5.
Neuroradiological Features Across Mitochondrial Disease Phenotypes.
| Neuroradiological Presentation | Disease Phenotype | |||
|---|---|---|---|---|
| MELAS (N=17) | LHON (N=10) | Leigh syndrome (N=7) | CPEO (N=14) | |
| Brain magnetic resonance imaging | ||||
| T2-Hyperintensity | 15 (88.2%) | 2 (20%) (bilateral optic nerves posterior segment) | 6 (85.71%) | NA |
| Bilateral-frontotemporal | 5 (33.3%) | NA | NA | NA |
| Frontoparietal areas | 5 (33.3%) | NA | NA | NA |
| Bilateral caudate | 4 (26.6%) | NA | NA | NA |
| Bilateral Putamen | 4 (26.6%) | NA | NA | NA |
| Bilateral caudate + bilateral Putamen | NA | NA | 4 | NA |
| Bilateral Thalamus | NA | NA | 3 (50%) | NA |
| Thalamic and periventricular hyperintensity | NA | NA | 2 | NA |
| Cerebellar Hyperintensity | 4 (26.6%) | NA | NA | NA |
| Bilateral fronto-parietal and occipital gliotic changes | 4(26.6%) | NA | NA | NA |
| Diffuse cortical atrophy | 4 (26.6%) | NA | NA | NA |
| Diffusion restriction | 5 (29.41%) | NA | NA | NA |
| Bilateral Thalamus | 2 (40%) | NA | NA | NA |
| Bilateral Caudate and putamen | 3 (60%) | NA | NA | NA |
| Magnetic resonance spectroscopy | 5 (29.41%) | NA | NA | NA |
| Lipid lactate peak (cortex of bilateral temporal, parietal, and occipital areas) | 3 (60%) | NA | NA | NA |
| N-acetylaspartate peak (frontal grey matter) | 2 (40%) | NA | NA | NA |
| N-acetylaspartate peak (over bilateral basal ganglia) | NA | NA | 1 | NA |
| Normal | 2 | 8 | 1 | 14 |
Abbreviations: MELAS, mitochondrial encephalopathy, lactic acidosis and stroke-like episodes; LHON, Leber hereditary optic neuropathy; CPEO, chronic progressive external ophthalmoplegia; NA, not available.
In Leigh syndrome, T2 hyperintensities were found in six of seven patients (85.7%), predominantly involving the bilateral caudate and putamen (n=4, 66.7%), bilateral thalamus (n=3, 50%), and periventricular regions (n=2, 33.3%). One Leigh syndrome patient exhibited an abnormal NAA peak over the basal ganglia. In LHON, only two of ten patients (20%) showed hyperintense signals along the posterior optic nerves, consistent with optic pathway involvement. No abnormal MRI findings were detected in any of the 14 patients with CPEO.
Machine Learning-Based Prediction of Mitochondrial Disorders
To facilitate predictive modeling, decision tree algorithms were trained using demographic, clinical, and neurological features. Visualization of the tree structures provided interpretable decision rules based on feature splits and thresholds (Supplementary file). Model performance, as evaluated through accuracy, precision, and recall metrics, revealed that decision trees performed robustly in classifying patients with CPEO and LHON, but showed reduced accuracy for MELAS and Leigh syndrome (Figure 4).
Further, a Random Forest model was applied to evaluate the relative contribution of each feature. Feature importance scores indicated that dimness of vision, oculopharyngeal weakness, ptosis, external ophthalmoplegia, family history, and focal seizures with secondary generalization were among the most influential predictors for distinguishing between mitochondrial syndromes. These findings were graphically represented in a ranked bar plot (Figure 5), improving model interpretability and supporting clinical decision-making.
Findings from Molecular Genetic Testing
As part of our ongoing clinical investigation protocol, comprehensive demographic and clinical evaluations were conducted on patients referred to our neurology outpatient department with suspected mitochondrial diseases, including LHON, Leigh syndrome, MELAS, and CPEO. Molecular confirmation of these clinical diagnoses was pursued through a targeted genetic approach that included both nuclear and mitochondrial DNA analyses. Allele-specific primer pairs were used as detailed in the methodology section, and analyses included PCR, restriction fragment length polymorphism, and whole-exome sequencing.
Genetic testing was performed in 21 patients, who were selected based on confirmed clinical diagnoses and provided informed consent. The remaining patients, although clinically evaluated, did not undergo genetic testing due to various reasons, including loss to follow-up and refusal to consent. Table 6 summarizes the clinical diagnoses and molecular findings of the 21 patients who completed genetic testing.
Nuclear DNA Sequencing
Whole-exome sequencing was conducted on 21 clinically diagnosed patients, with a focus on genes commonly associated with mitochondrial diseases, including POLG1, POLG2, and SURF1. The obtained nucleotide sequences were aligned with the corresponding wild-type reference sequences from the National Center for Biotechnology Information database (NCBI), using CLUSTAL-W and other sequence alignment tools to identify any potential pathogenic variants. Any detected variations were further annotated and cross-verified against established genomic databases, including ClinVar, dbSNP, and OMIM, to assess their clinical significance. Importantly, no known pathogenic variants or disease-associated mutations were found in any of the analyzed nuclear DNA samples.
Following the absence of mutations in nuclear genes, we proceeded with mitochondrial DNA analysis using allele-specific restriction fragment length polymorphism and random amplified polymorphic DNA techniques, as outlined in the Methods section.
LHON
Genetic testing for LHON was performed in five clinically diagnosed patients (MT-15, MT-16, MT-17, MT-18, and MT-21) using allele-specific primers targeting the well-characterized 11778G>A mutation in the MT-ND4 gene, as illustrated in Figure 6A. This mutation is among the most common mitochondrial DNA point mutations associated with LHON. Of the five patients tested, four (MT-15, MT-16, MT-17, and MT-18) demonstrated the presence of the pathogenic 11778G>A mutation, corresponding to a band size of 353 base pairs (Figure 6B,C). Patient MT-21 did not exhibit the mutation but remained classified as LHON based on the constellation of clinical features consistent with the disease phenotype (Figure 6D).
MELAS
Eight patients (MT-04, MT-06, MT-08, MT-12, MT-20, MT-22, MT-24, and MT-28) underwent targeted genetic testing for MELAS-associated variants in the MT-TL1 tRNA gene. The focus was on three well-established pathogenic mutations: 3243A>G (MELAS_1), 3271T>C (MELAS_2), and 3251A>G (MELAS_3), each producing PCR fragments of 400 base pairs (Figure 7A). Among these, patient MT-28 was the only individual confirmed by Sanger sequencing to carry the MELAS_1 (3243A>G) mutation in a heteroplasmic state (Figure 7B). The remaining seven patients (MT-04, MT-06, MT-08, MT-12, MT-20, MT-22, MT-24) harbored variants at MELAS_2 and MELAS_3, most of which exhibited heteroplasmy as determined by agarose gel electrophoresis (Figure 7C–H).
Quantitative estimation of heteroplasmy was inferred from the relative intensity of mutant versus wild-type bands. In MT-28 (MELAS_1), mutant and wild-type bands showed comparable intensity. In MT-08 (MELAS_2), the mutant band was slightly less intense than the wild-type (Figure 7D). MT-04 displayed approximately 40% mutant band intensity relative to wild-type. In MT-08 (MELAS_3), MT-06 (MELAS_3), and MT-12 (MELAS_2 and MELAS_3), heteroplasmy levels were estimated at 40–50%. MT-20 exhibited 50–60% mutant band intensity for both MELAS_2 and MELAS_3, whereas MT-22 (MELAS_3) and MT-24 (MELAS_2 and MELAS_3) showed mutant intensities of 30% and 30–40%, respectively (Figure 7H).
In some cases, such as MT-04 (MELAS_2), MT-06 (MELAS_2), and MT-22 (MELAS_2), the mutant bands were too faint to allow for reliable quantification, although electrophoretic images were still documented. Notably, only MT-28 was positive for MELAS_1 in a heteroplasmic state; the remaining patients tested negative for this mutation and retained wild-type alleles (Figure 7C,D).
Leigh syndrome
Two patients (MT-07 and MT-23) underwent genetic testing targeting the m.8993T>G mutation in the MT-ATP6 gene, which is associated with Leigh syndrome, using allele-specific primers (Figure 8A). Both patients tested positive for the mutation, as indicated by band expression at the expected 372 bp position. Band intensity analysis revealed heteroplasmy, with approximately equal intensities of mutant and wild-type bands, suggesting co-expression of both alleles (Figure 8B,C).
CPEO
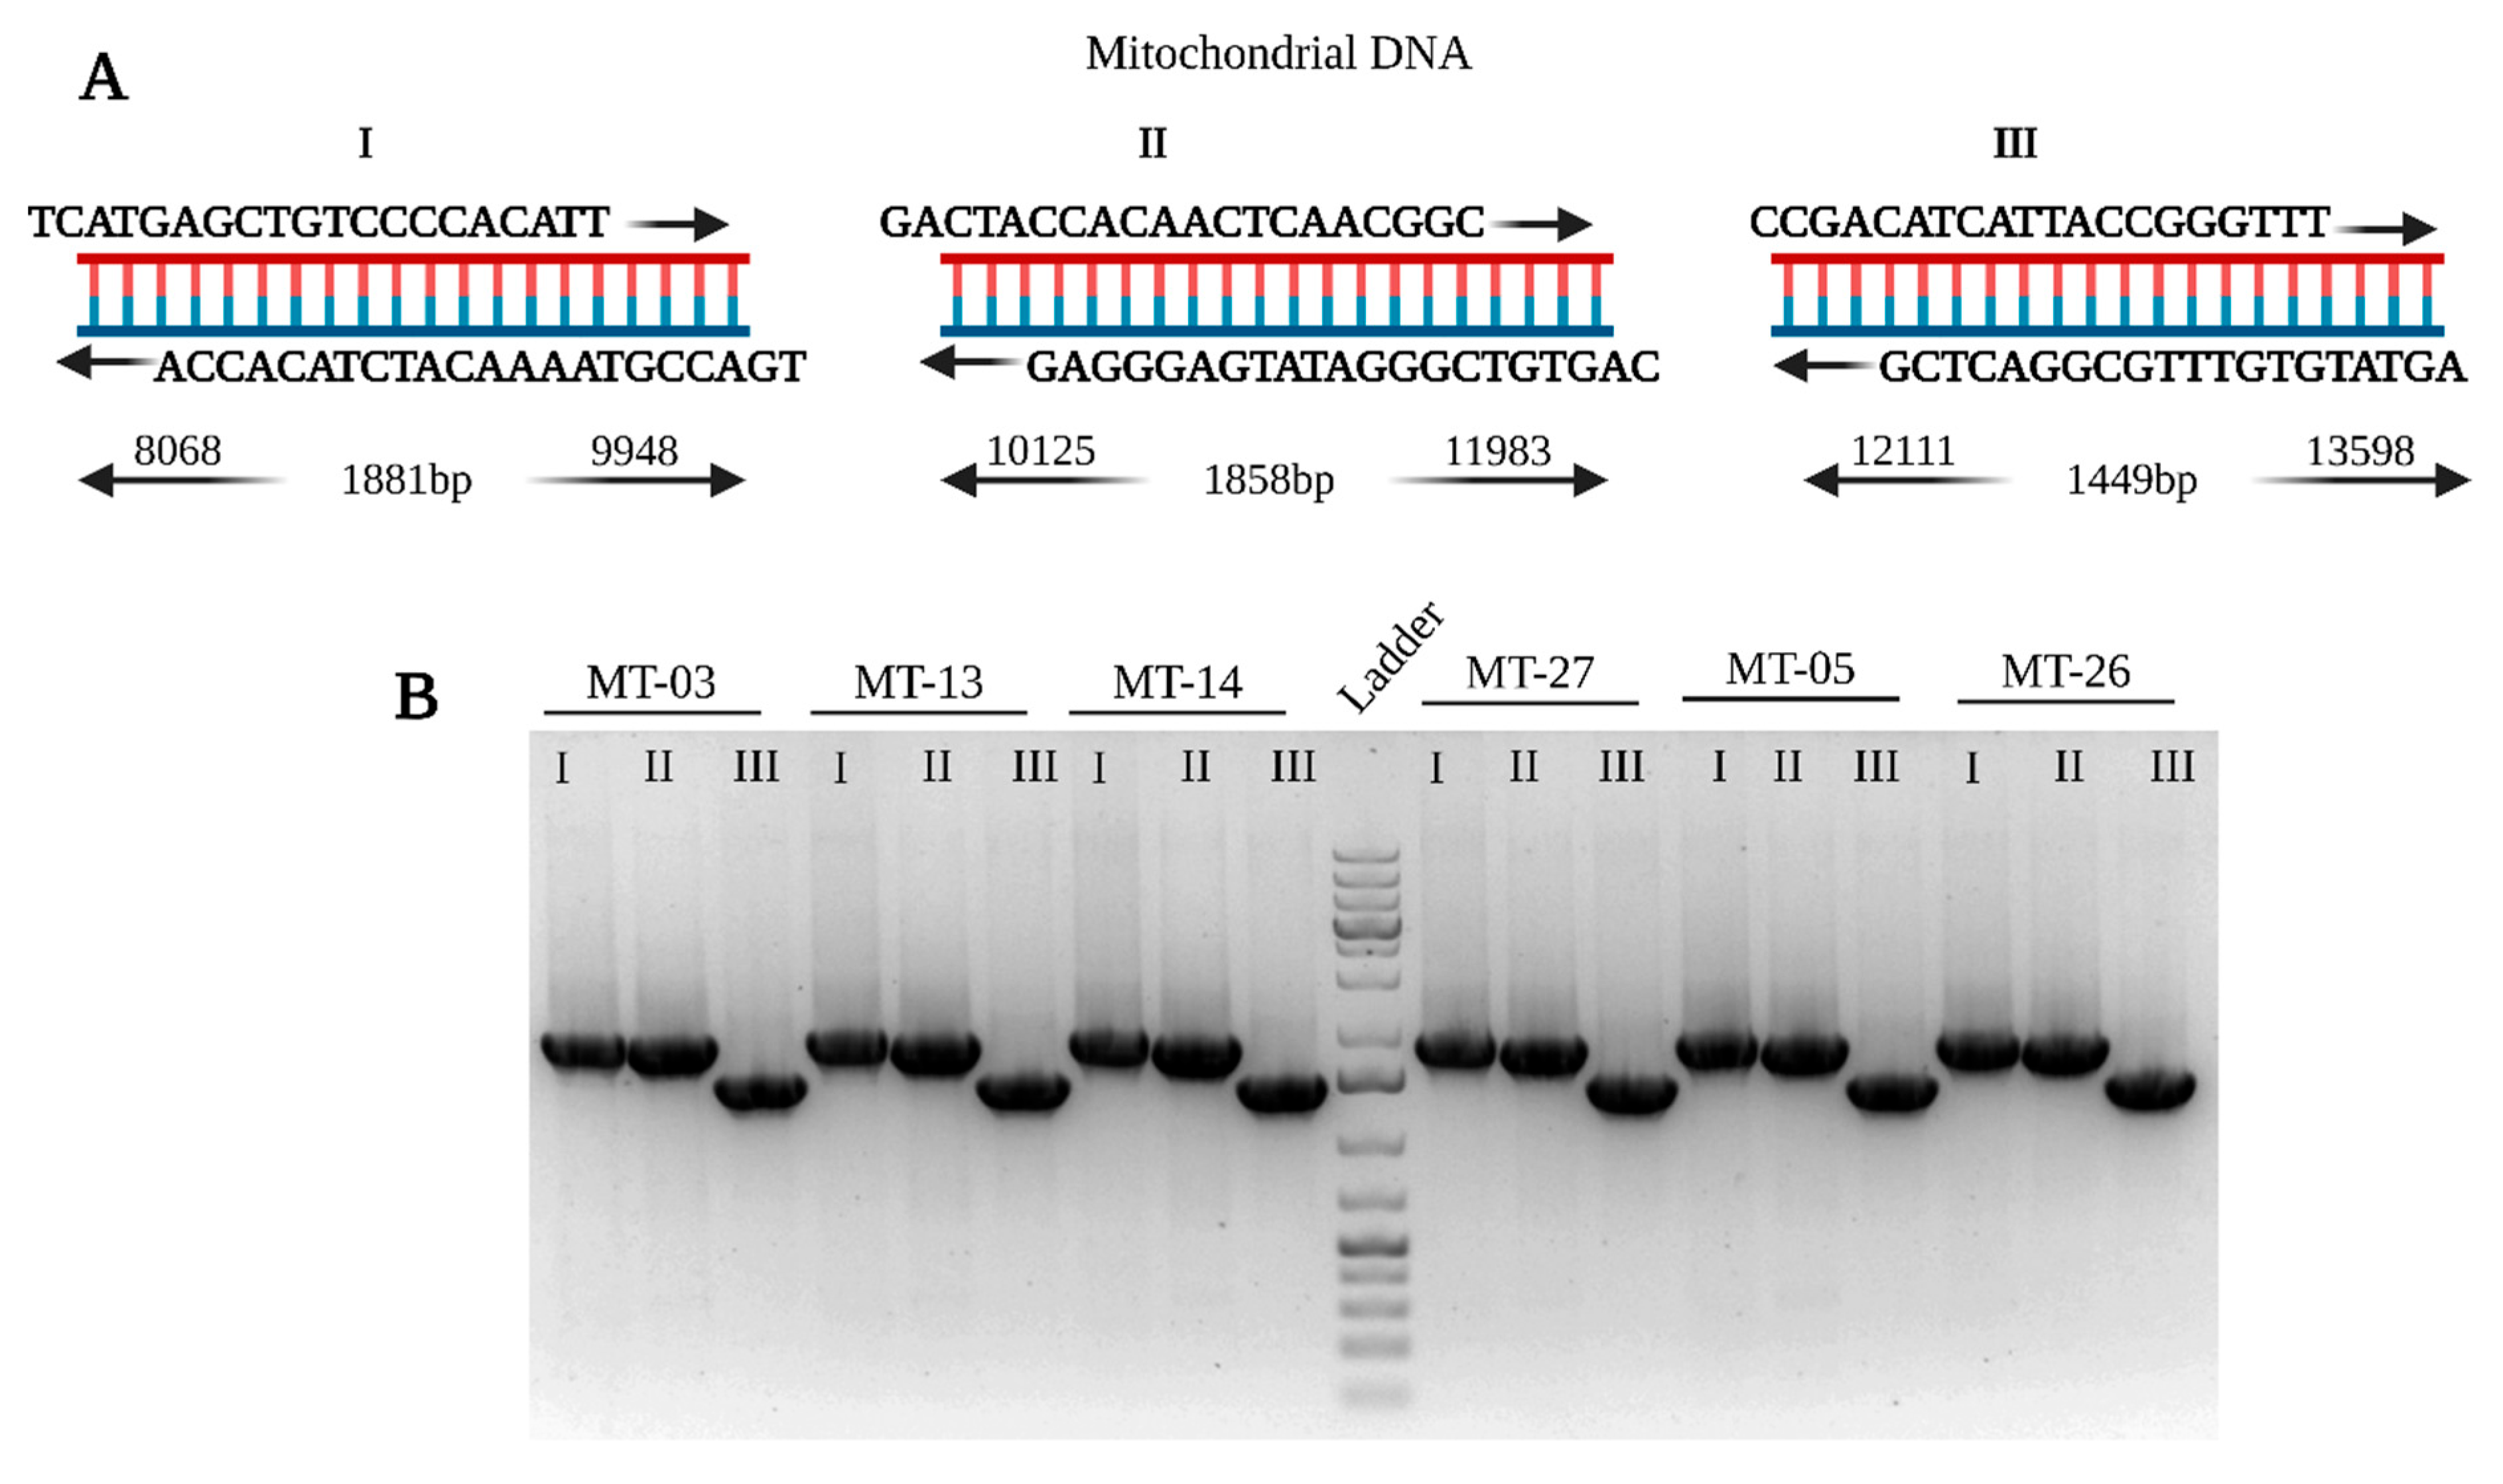
Six patients (MT-03, MT-05, MT-13, MT-14, MT-26, MT-27) underwent genetic testing for mitochondrial DNA deletions using primers specified in Table S2 of the supplementary file. None of the tested individuals showed deletions in the targeted regions. All PCR products matched the expected sizes of wild-type fragments, indicating the absence of detectable deletions in this cohort (Figure 9A,B).
Figure 9.
A. Primer design for the detection of mtDNA deletions in CPEO. B. PCR results for patients MT-03, MT-05, MT-13, MT-14, MT-26, and MT-27 showing wild-type fragment sizes. Abbreviations: PCR – Polymerase Chain Reaction; mtDNA – Mitochondrial DNA; CPEO – Chronic Progressive External Ophthalmoplegia.
Variant Pathogenicity Score Analysis
To assess the potential deleterious impact of the detected mutations, pathogenicity scores were computed for each variant using multiple bioinformatic prediction tools. Analyzed variants included m.8993T>G (MT-ATP6) for Leigh syndrome; m.3243A>G, m.3271T>C, and m.3251A>G (MT-TL1 tRNA) for MELAS; and m.11778G>A (MT-ND4) for LHON. CPEO was excluded from this analysis as no pathogenic variants or deletions were identified. A comparative summary of pathogenicity scores is presented in Figure 10.
Discussion
This study provides detailed clinical, genetic, and biochemical characterization of 48 patients with primary mitochondrial oxidative phosphorylation disorders, categorized into MELAS, LHON, Leigh syndrome, and CPEO. By integrating clinical phenotypes using molecular diagnostics, biochemical markers, and neuroimaging findings, the study contributes to the evolving landscape of personalized medicine in mitochondrial disease.
Our targeted sequencing of mtDNA and selected nuclear genes confirmed several known pathogenic mutations. The MELAS subgroup primarily carried pathogenic variants in MT-TL1, specifically the 3243A>G, 3251A>G, and 3271T>C mutations, which have long been associated with impaired mitochondrial protein synthesis and multisystemic manifestations, such as stroke-like episodes and seizures. [16,17] The heteroplasmic presentation of these mutations fits with the threshold model of mitochondrial genetics, where clinical severity correlates with the proportion of mutant mtDNA. [3]
In LHON, the 11778G>A mutation in the MT-ND4 gene was found in 9 of 10 cases, consistent with its global predominance among LHON mutations. [18,19] Notably, one patient with classical LHON phenotype lacked a detectable mutation at this site, highlighting the diagnostic limitation of targeted testing and the need for expanded sequencing approaches, including full mtDNA and nuclear exome panels, particularly for negative cases. [19]
Leigh syndrome patients showed homoplasmic or heteroplasmic 8993T>G mutations in the MT-ATP6 gene, which encodes a subunit of ATP synthase crucial for mitochondrial energy production. This variant is associated with early-onset neurodegeneration and symmetrical lesions in the basal ganglia. [12] In contrast, the absence of deletions in the CPEO cohort in our screened mtDNA segment (8–14 kb) suggests that these cases may carry mutations in nuclear genes responsible for mtDNA replication and maintenance (e.g., POLG, TWNK, SLC25A4). [1] This is a critical diagnostic consideration, as nuclear gene defects account for nearly 40–60% of CPEO cases in some cohorts. [20]
The elevated lactate levels in serum and CSF seen in MELAS, Leigh, and CPEO cases reflect impaired oxidative phosphorylation and resultant metabolic compensation via anaerobic glycolysis. [21] Leigh syndrome and CPEO patients also exhibited increased CSF protein, likely reflecting neuroinflammation or breakdown of the blood-brain barrier. [22]
Neuroimaging findings were highly syndrome-specific. MELAS patients showed bilateral stroke-like lesions involving the temporal, parietal, and occipital lobes with diffusion-weighted imaging restriction and lactate peaks on magnetic resonance spectroscopy—hallmarks of mitochondrial stroke. [23] Leigh syndrome presented with symmetric hyperintensities in the thalami, putamen, and brainstem—findings that correlate with disease progression and respiratory failure risk. [23] In LHON, optic nerve hyperintensities and no supratentorial abnormalities were observed, aligning with prior radiologic descriptions. [24] As expected, neuroimaging was unremarkable in most CPEO patients, consistent with its relatively localized clinical presentation. [2]
Electroencephalographic findings—such as spike-and-wave discharges and focal slowing—were frequent in MELAS and Leigh groups, reflecting the epileptogenic and encephalopathic potential of these disorders. These correlate with high seizure rates and stroke-like episodes, particularly in MELAS. [25]
In recent years, artificial intelligence and machine learning approaches have begun to transform the diagnosis of rare diseases, [26,27] including mitochondrial pathologies. [28,29] Several studies have demonstrated the feasibility of using machine learning algorithms to integrate clinical, imaging, and molecular data, thereby improving diagnostic yield and classification accuracy. [28,29] These approaches hold promise for addressing diagnostic delays and phenotypic variability—two major challenges in mitochondrial medicine. The integration of machine learning with multi-omics and natural language processing of electronic health records could further streamline diagnosis and improve the prediction of disease trajectory and therapeutic response. [30]
Despite these advances, real-world implementation remains limited by the need for large, curated datasets and the interpretability of artificial intelligence outputs. However, as seen in this study, phenotypic patterns—when systematically digitized—can serve as excellent input features for machine learning pipelines, emphasizing the need for structured data collection in mitochondrial disease cohorts.
In closing, this comprehensive clinical, biochemical, neuroimaging, and genetic characterization of patients with MELAS, LHON, Leigh syndrome, and CPEO underlines the remarkable phenotypic and genotypic heterogeneity within mitochondrial disorders. Our findings reaffirm the diagnostic relevance of classical mutations such as MT-TL1 3243A>G in MELAS, MT-ND4 11778G>A in LHON, and MT-ATP6 8993T>G in Leigh syndrome, while highlighting the challenges posed by mutation-negative cases and the underdiagnosis of nuclear gene-related CPEO.
The observed correlations between genotype, clinical phenotype, and MRI or CSF abnormalities support the utility of integrated diagnostic approaches. Notably, the study highlights the growing importance of machine learning and artificial intelligence in enhancing diagnostic accuracy, identifying disease subtypes, and potentially predicting prognosis in rare mitochondrial conditions.
Moving forward, larger multicenter cohorts and the integration of multi-omics and ML-based data are crucial for improving early detection, prognostication, and the development of personalized therapies in mitochondrial medicine. This work provides valuable reference data for clinicians and researchers, emphasizing the importance of standardized, multidisciplinary diagnostic pathways in managing mitochondrial disease.
Supplementary Materials
The following supporting information can be downloaded at the website of this paper posted on Preprints.org.
Acknowledgments
Julián Benito-León is supported by the National Institutes of Health (NINDS R01 NS39422 and R01 NS094607) and by Spain’s Ministry of Science and Innovation through the Recovery, Transformation, and Resilience Plan (grants TED2021-130174B-C33, NETremor, and PID2022-138585OB-C33, Resonate).
Authors’ Contributions
R.M. contributed to 1) the conception and organization of the study and 2) the writing of the first draft of the manuscript; S.D. contributed to 1) the conception and organization of the study and 2) the writing of the first draft of the manuscript; G.S. contributed to 1) the conception and organization of the study and 2) the writing of the first draft of the manuscript; P.S. contributed to 1) the conception, organization, and execution of the research project, and 2) the review and critique of the manuscript; S.C. contributed to 1) the conception, organization, and execution of the research project, and 2) the review and critique of the manuscript; C.S contributed to 1) the conception, organization, and execution of the research project, A.P 1) the conception, organization, and execution of the research project; Ga.S 1) the review and critique of the manuscript; N.B. 1) the review and critique of the manuscript; J.R. contributed to 1) the conception, organization, and execution of the research project and 2) the review and critique of the manuscript; S.B. contributed to 1) the conception, organization, and execution of the research project and 2) the review and critique of the manuscript; J.B.L. contributed to 1) the conception and organization of the study and 2) the writing of the first draft of the manuscript.
Competing Interests
The authors declare that they have no competing interests.
References
- Suomalainen A, Battersby BJ. Mitochondrial diseases: the contribution of organelle stress responses to pathology. Nat Rev Mol Cell Biol. 2018;19(2):77-92. [CrossRef]
- Parikh S, Goldstein A, Koenig MK, et al. Diagnosis and management of mitochondrial disease: a consensus statement from the Mitochondrial Medicine Society. Genet Med. 2015;17(9):689-701. [CrossRef]
- Gorman GS, Chinnery PF, DiMauro S, et al. Mitochondrial diseases. Nat Rev Dis Primer. 2016;2(1). [CrossRef]
- Finsterer J. Overview on visceral manifestations of mitochondrial disorders. Neth J Med. 2006;64(3):61-71.
- Saneto RP, Sedensky MM. Mitochondrial disease in childhood: mtDNA encoded. Neurother J Am Soc Exp Neurother. 2013;10(2):199-211. [CrossRef]
- Gorman GS, Schaefer AM, Ng Y, et al. Prevalence of nuclear and mitochondrial DNA mutations related to adult mitochondrial disease. Ann Neurol. 2015;77(5):753-759. [CrossRef]
- Skladal D. Minimum birth prevalence of mitochondrial respiratory chain disorders in children. Brain. 2003;126(8):1905-1912. [CrossRef]
- Ibayashi K, Fujino Y, Mimaki M, Fujimoto K, Matsuda S, Goto YI. Estimation of the Number of Patients With Mitochondrial Diseases: A Descriptive Study Using a Nationwide Database in Japan. J Epidemiol. 2023;33(2):68-75. [CrossRef]
- Schaefer AM, McFarland R, Blakely EL, et al. Prevalence of mitochondrial DNA disease in adults. Ann Neurol. 2008;63(1):35-39. [CrossRef]
- Hettiarachchi D, Lakmal K, Dissanayake VHW. Mitochondrial diseases in South Asia – A systematic review. Mitochondrion. 2022;62:24-30. [CrossRef]
- Wolf NI, Smeitink JAM. Mitochondrial disorders: A proposal for consensus diagnostic criteria in infants and children. Neurology. 2002;59(9):1402-1405. [CrossRef]
- Rahman S, Blok RB, Dahl H -H. M, et al. Leigh syndrome: Clinical features and biochemical and DNA abnormalities. Ann Neurol. 1996;39(3):343-351. [CrossRef]
- Hirano M, Ricci E, Richard Koenigsberger M, et al. MELAS: An original case and clinical criteria for diagnosis. Neuromuscul Disord. 1992;2(2):125-135. [CrossRef]
- Nakamura M, Mimura O, Wakakura M, Inatani M, Nakazawa T, Shiraga F. [Designation criteria for Leber’s hereditary optic neuropathy]. Nippon Ganka Gakkai Zasshi. 2015;119(5):339-346.
- Wangkumhang P, Chaichoompu K, Ngamphiw C, et al. WASP: a Web-based Allele-Specific PCR assay designing tool for detecting SNPs and mutations. BMC Genomics. 2007;8(1):275. [CrossRef]
- El-Hattab AW, Adesina AM, Jones J, Scaglia F. MELAS syndrome: Clinical manifestations, pathogenesis, and treatment options. Mol Genet Metab. 2015;116(1-2):4-12. [CrossRef]
- Goto Y ichi, Nonaka I, Horai S. A mutation in the tRNALeu(UUR) gene associated with the MELAS subgroup of mitochondrial encephalomyopathies. Nature. 1990;348(6302):651-653. [CrossRef]
- Yu-Wai-Man P, Griffiths PG, Chinnery PF. Mitochondrial optic neuropathies – Disease mechanisms and therapeutic strategies. Prog Retin Eye Res. 2011;30(2):81-114. [CrossRef]
- Mancuso M, Orsucci D, Angelini C, et al. “Mitochondrial neuropathies”: A survey from the large cohort of the Italian Network. Neuromuscul Disord NMD. 2016;26(4-5):272-276. [CrossRef]
- Tuppen HAL, Blakely EL, Turnbull DM, Taylor RW. Mitochondrial DNA mutations and human disease. Biochim Biophys Acta BBA - Bioenerg. 2010;1797(2):113-128. [CrossRef]
- Chinnery PF, Turnbull DM. Epidemiology and treatment of mitochondrial disorders. Am J Med Genet. 2001;106(1):94-101. [CrossRef]
- Finsterer J. Leigh and Leigh-Like Syndrome in Children and Adults. Pediatr Neurol. 2008;39(4):223-235. [CrossRef]
- Kim JH, Lim MK, Jeon TY, et al. Diffusion and Perfusion Characteristics of MELAS (Mitochondrial Myopathy, Encephalopathy, Lactic Acidosis, and Stroke-Like Episode) in Thirteen Patients. Korean J Radiol. 2011;12(1):15. [CrossRef]
- Newman NJ, Biousse V. Hereditary optic neuropathies. Eye Lond Engl. 2004;18(11):1144-1160. [CrossRef]
- Chin HL, Lai PS, Tay SKH. A clinical approach to diagnosis and management of mitochondrial myopathies. Neurother J Am Soc Exp Neurother. 2024;21(1):e00304. [CrossRef]
- Benito-León J, Louis ED, Mato-Abad V, et al. A data mining approach for classification of orthostatic and essential tremor based on MRI-derived brain volume and cortical thickness. Ann Clin Transl Neurol. 2019;6(12):2531-2543. [CrossRef]
- Mato-Abad V, Labiano-Fontcuberta A, Rodríguez-Yáñez S, et al. Classification of radiologically isolated syndrome and clinically isolated syndrome with machine-learning techniques. Eur J Neurol. 2019;26(7):1000-1005. [CrossRef]
- Kuo CW, Chen HA, Hsu RH, et al. Machine learning to predict mitochondrial diseases by phenotypes. Mitochondrion. 2025;84:102061. [CrossRef]
- Shen L, Falk MJ, Gai X. MSeqDR Quick-Mitome (QM): Combining Phenotype-Guided Variant Interpretation and Machine Learning Classifiers to Aid Primary Mitochondrial Disease Genetic Diagnosis. Curr Protoc. 2024;4(1):e955. [CrossRef]
- Seaby EG, Ennis S. Challenges in the diagnosis and discovery of rare genetic disorders using contemporary sequencing technologies. Brief Funct Genomics. 2020;19(4):243-258. [CrossRef]
Figure 1.
Flow chart of the study design and participant selection criteria. Abbreviations: WES – Whole Exome Sequencing; DNA – Deoxyribonucleic Acid; LHON – Leber Hereditary Optic Neuropathy; MELAS – Mitochondrial Encephalopathy, Lactic Acidosis, and Stroke-like Episodes; CPEO – Chronic Progressive External Ophthalmoplegia.
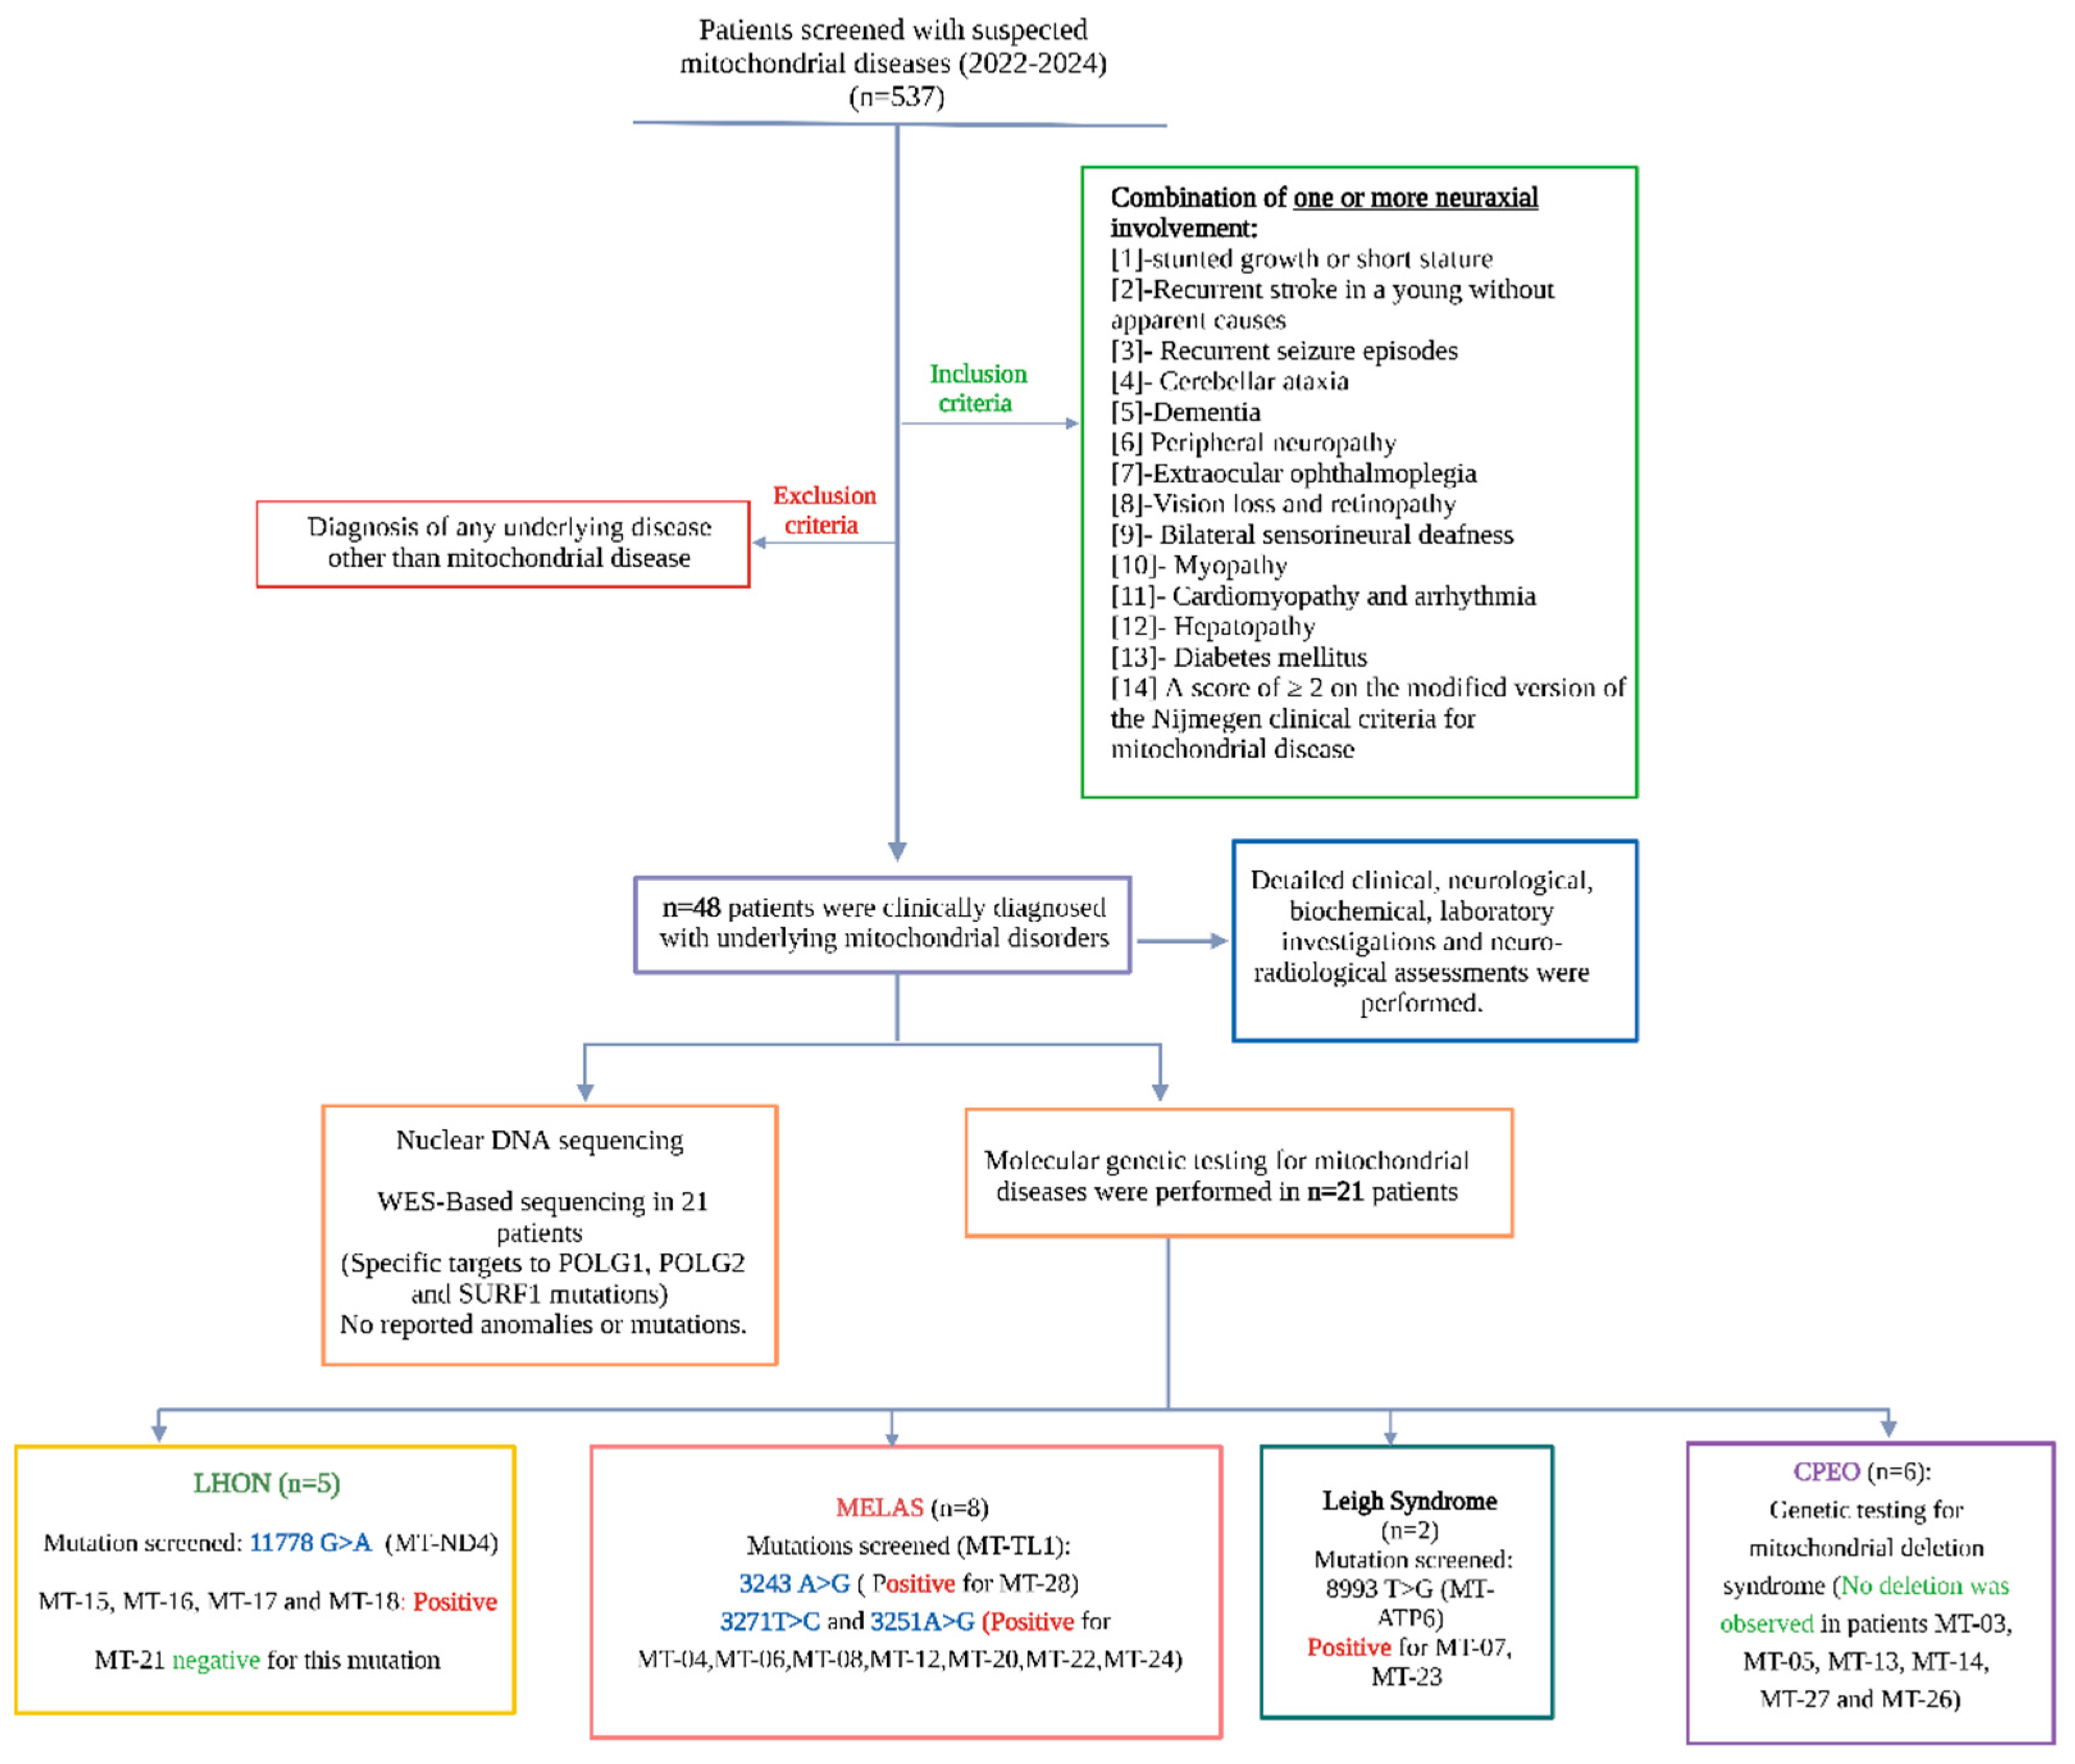
Figure 2.
Bipartite network of mitochondrial diseases and patient demographic variables. Green nodes (A₁–A₃₂) represent demographic variables; red nodes represent mitochondrial disease types. The top five highly weighted edges are highlighted in red.
Figure 2.
Bipartite network of mitochondrial diseases and patient demographic variables. Green nodes (A₁–A₃₂) represent demographic variables; red nodes represent mitochondrial disease types. The top five highly weighted edges are highlighted in red.
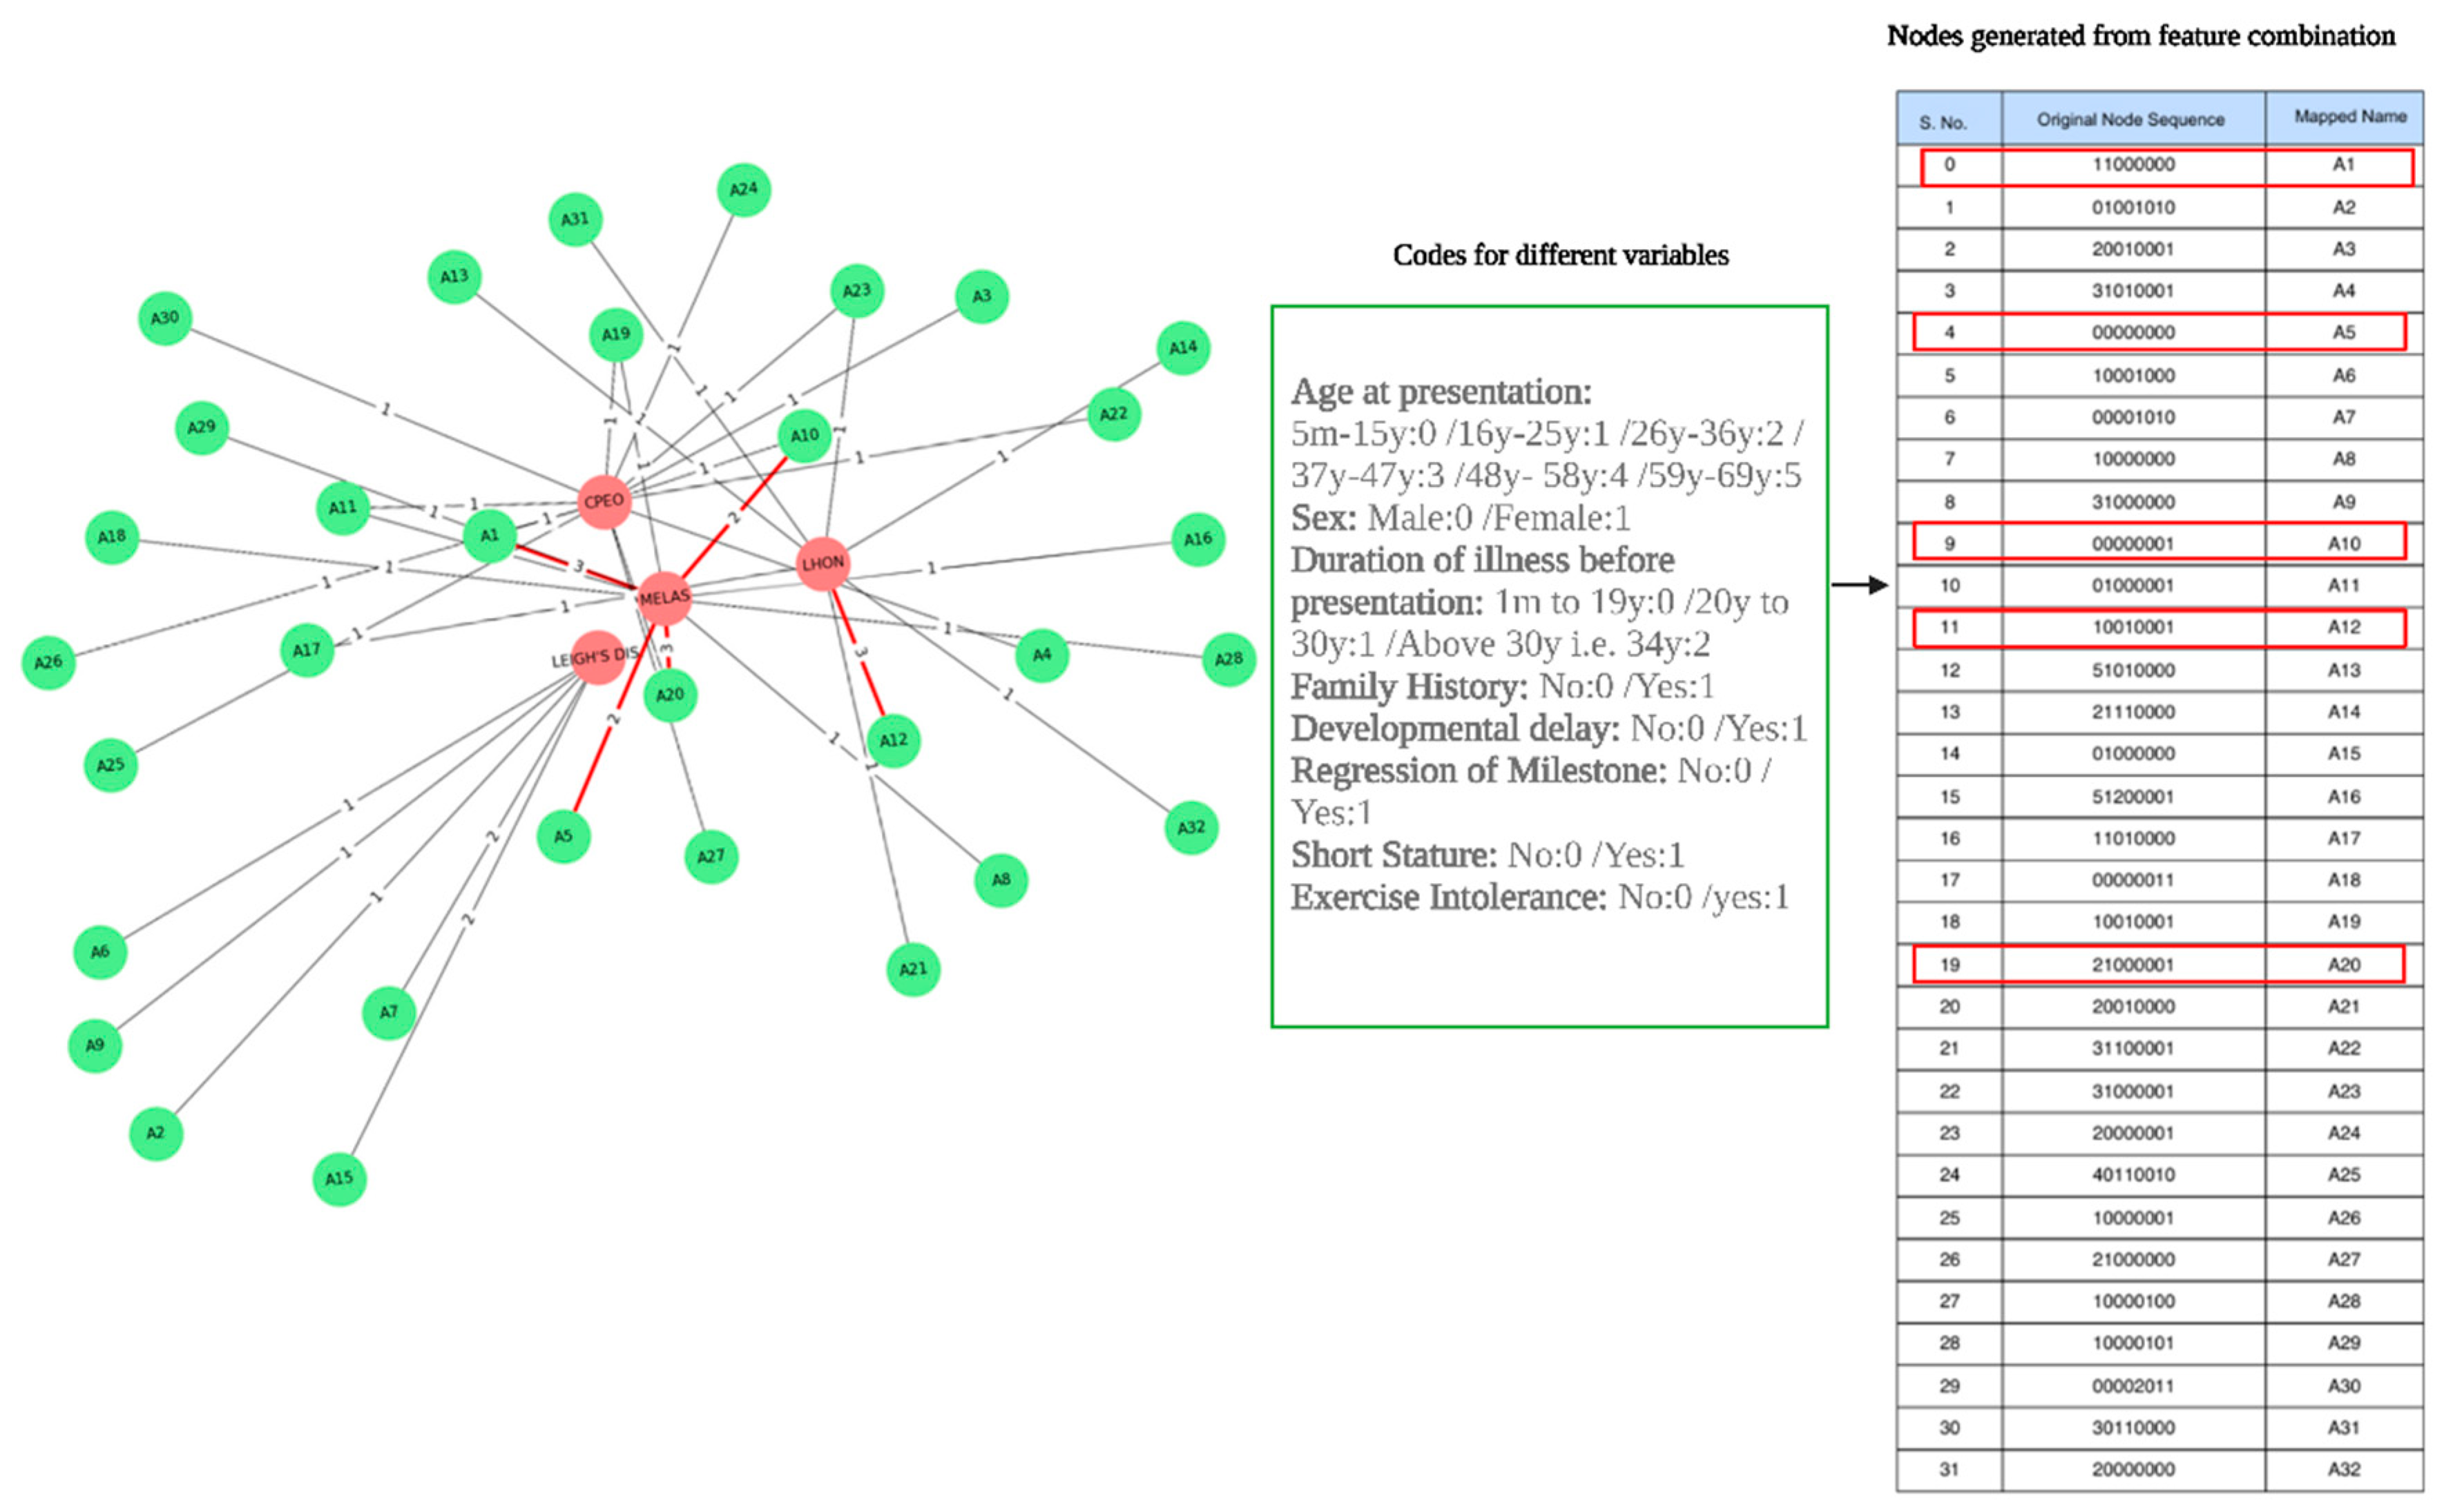
Figure 3.
A. Bipartite network of mitochondrial diseases and neurological features. Green nodes (A₁–A₃₃) represent neurological variables; red nodes represent mitochondrial disease types. The top four weighted edges are highlighted. B. Bipartite network linking mitochondrial diseases with seizure types. Green nodes (A₁–A₁₅) denote seizure categories; red nodes indicate diseases. The top four weighted edges are shown in red. C. Bipartite network of mitochondrial diseases and associated symptoms. Green nodes (A₁–A₉) represent symptom categories. The top five weighted edges are indicated in red.
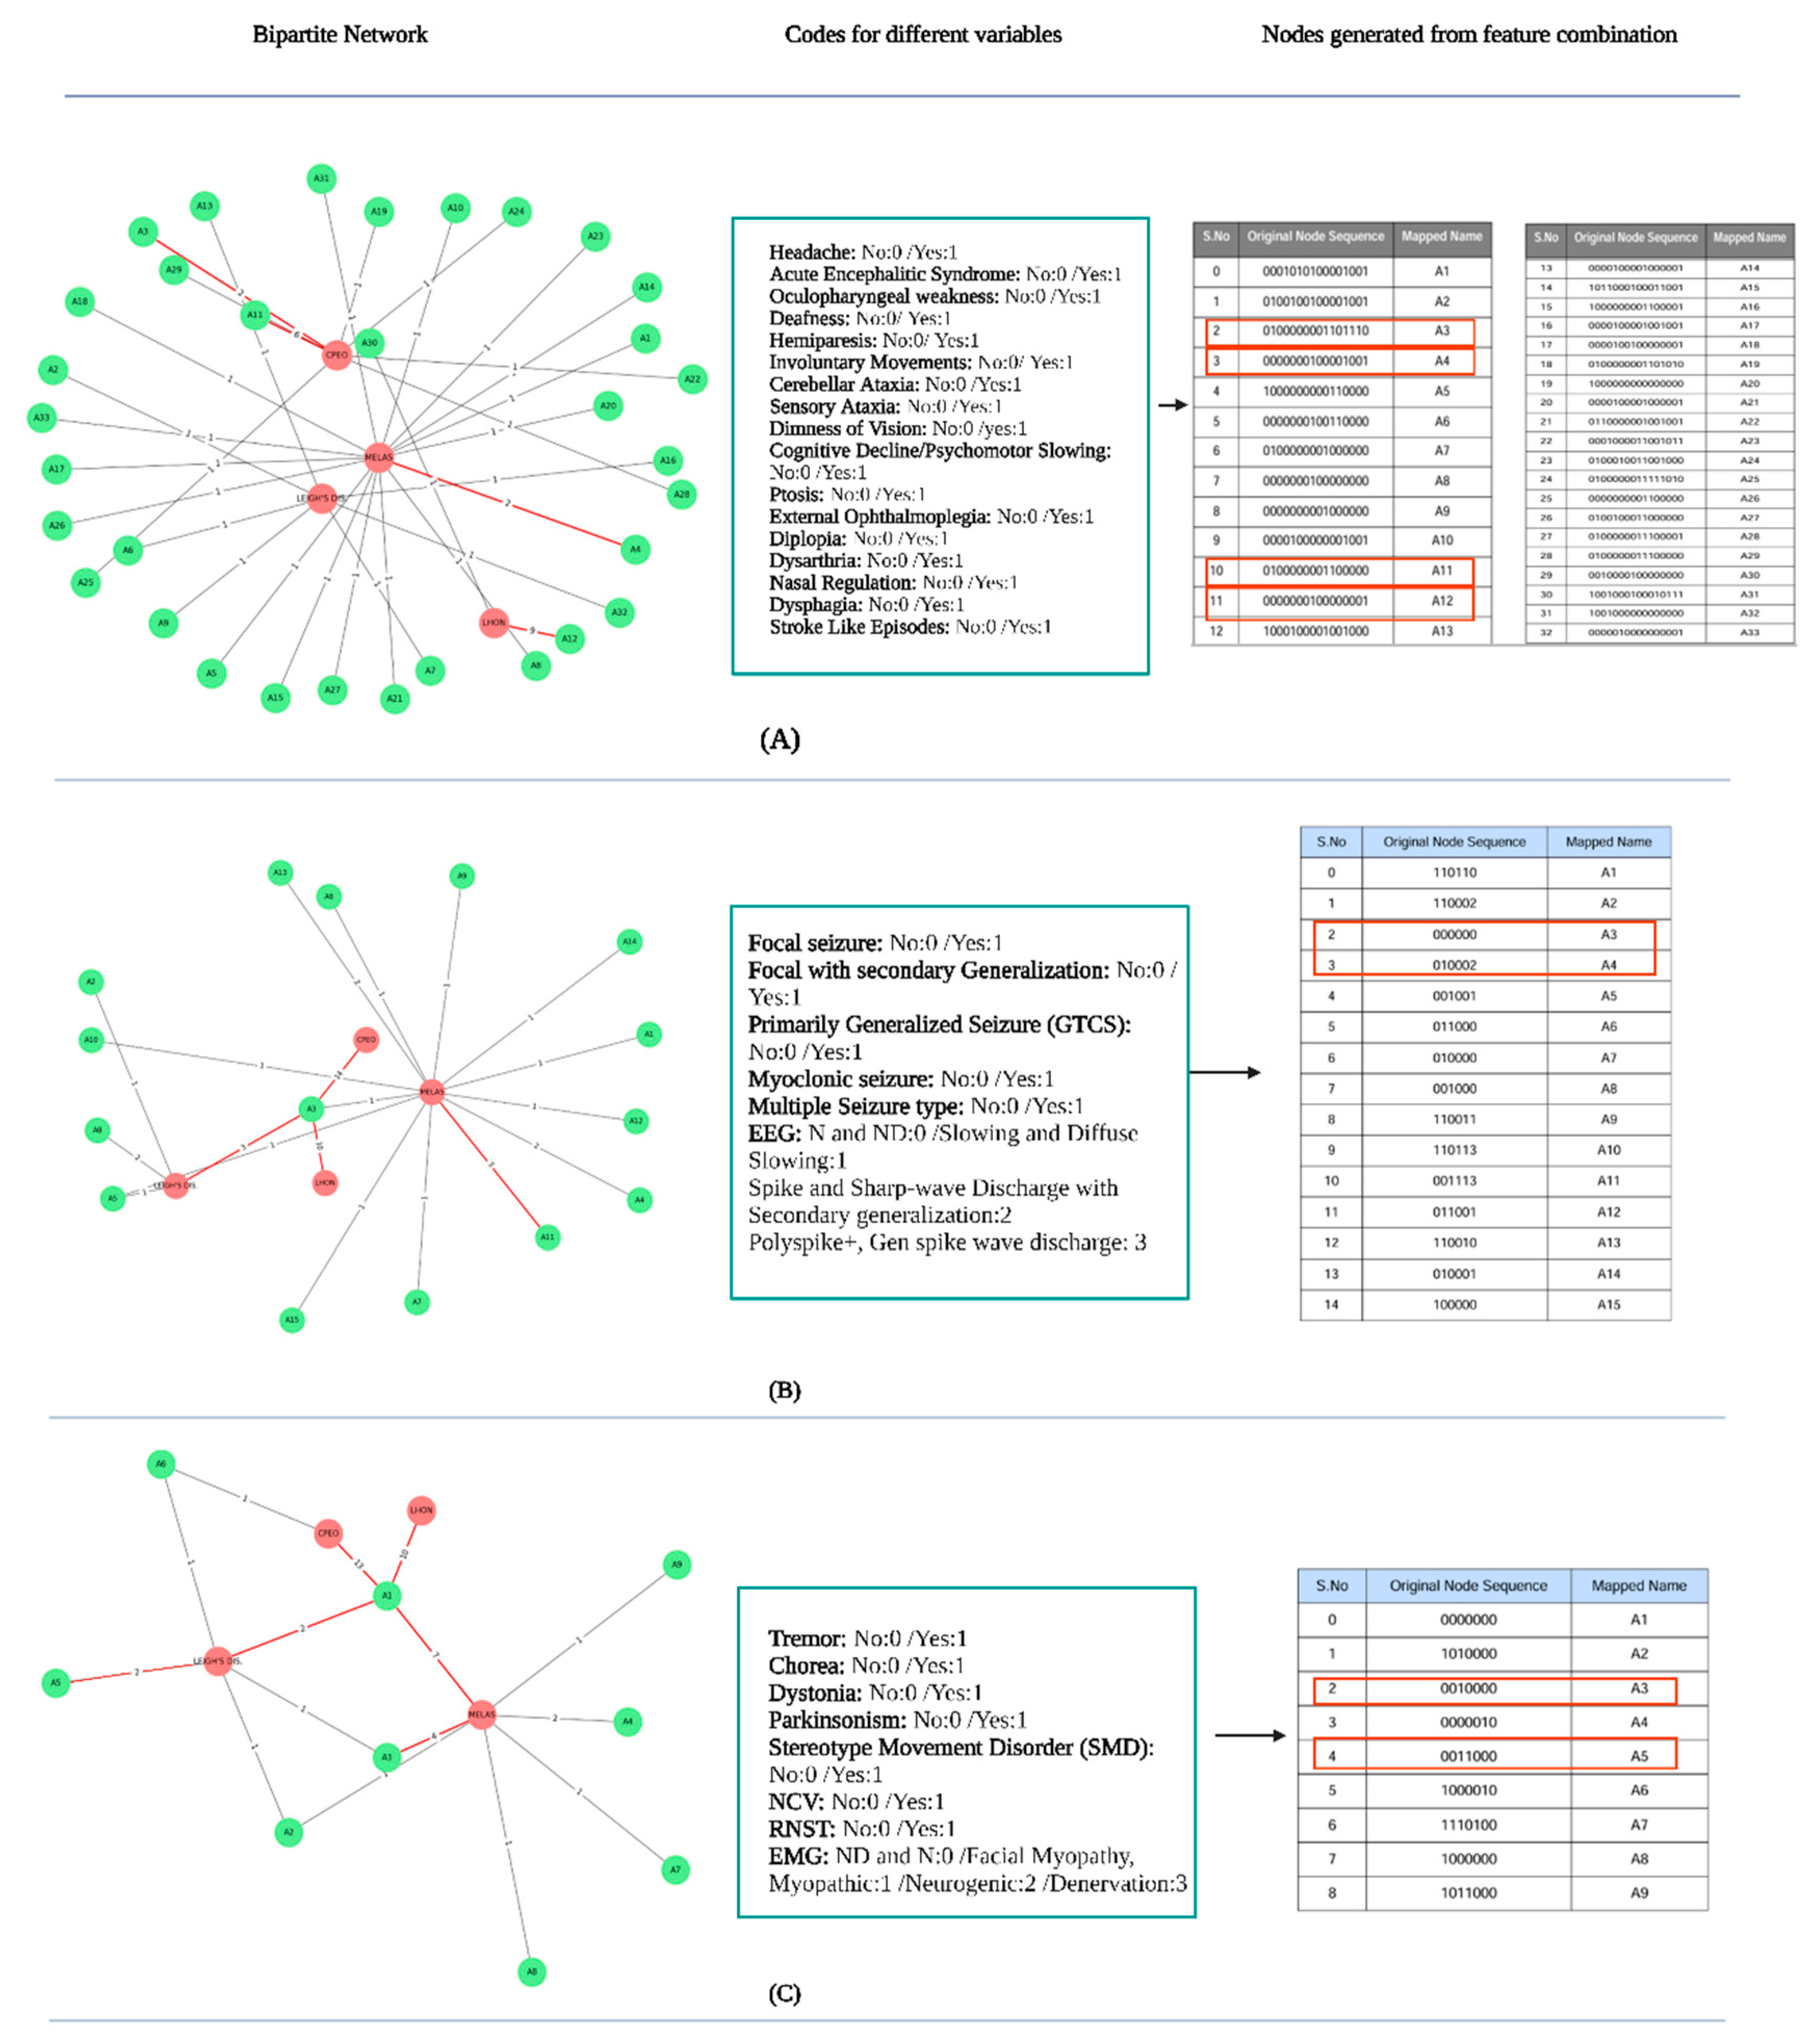
Figure 4.
[A] Represents three evaluation metrics (Mean Accuracy, Precision, and Recall) of a Decision Tree Classifier for the classification of mitochondrial diseases based on patients’ demographics. [B] Represents three evaluation metrics of a Decision Tree Classifier for the classification of mitochondrial diseases based on neurological representations. [C] Illustrates three evaluation metrics of a Decision Tree Classifier for the classification of mitochondrial diseases based on the type of seizures. [D] Illustrates three evaluation metrics of a Decision Tree Classifier for the classification of mitochondrial diseases based on different types of movement disorders.
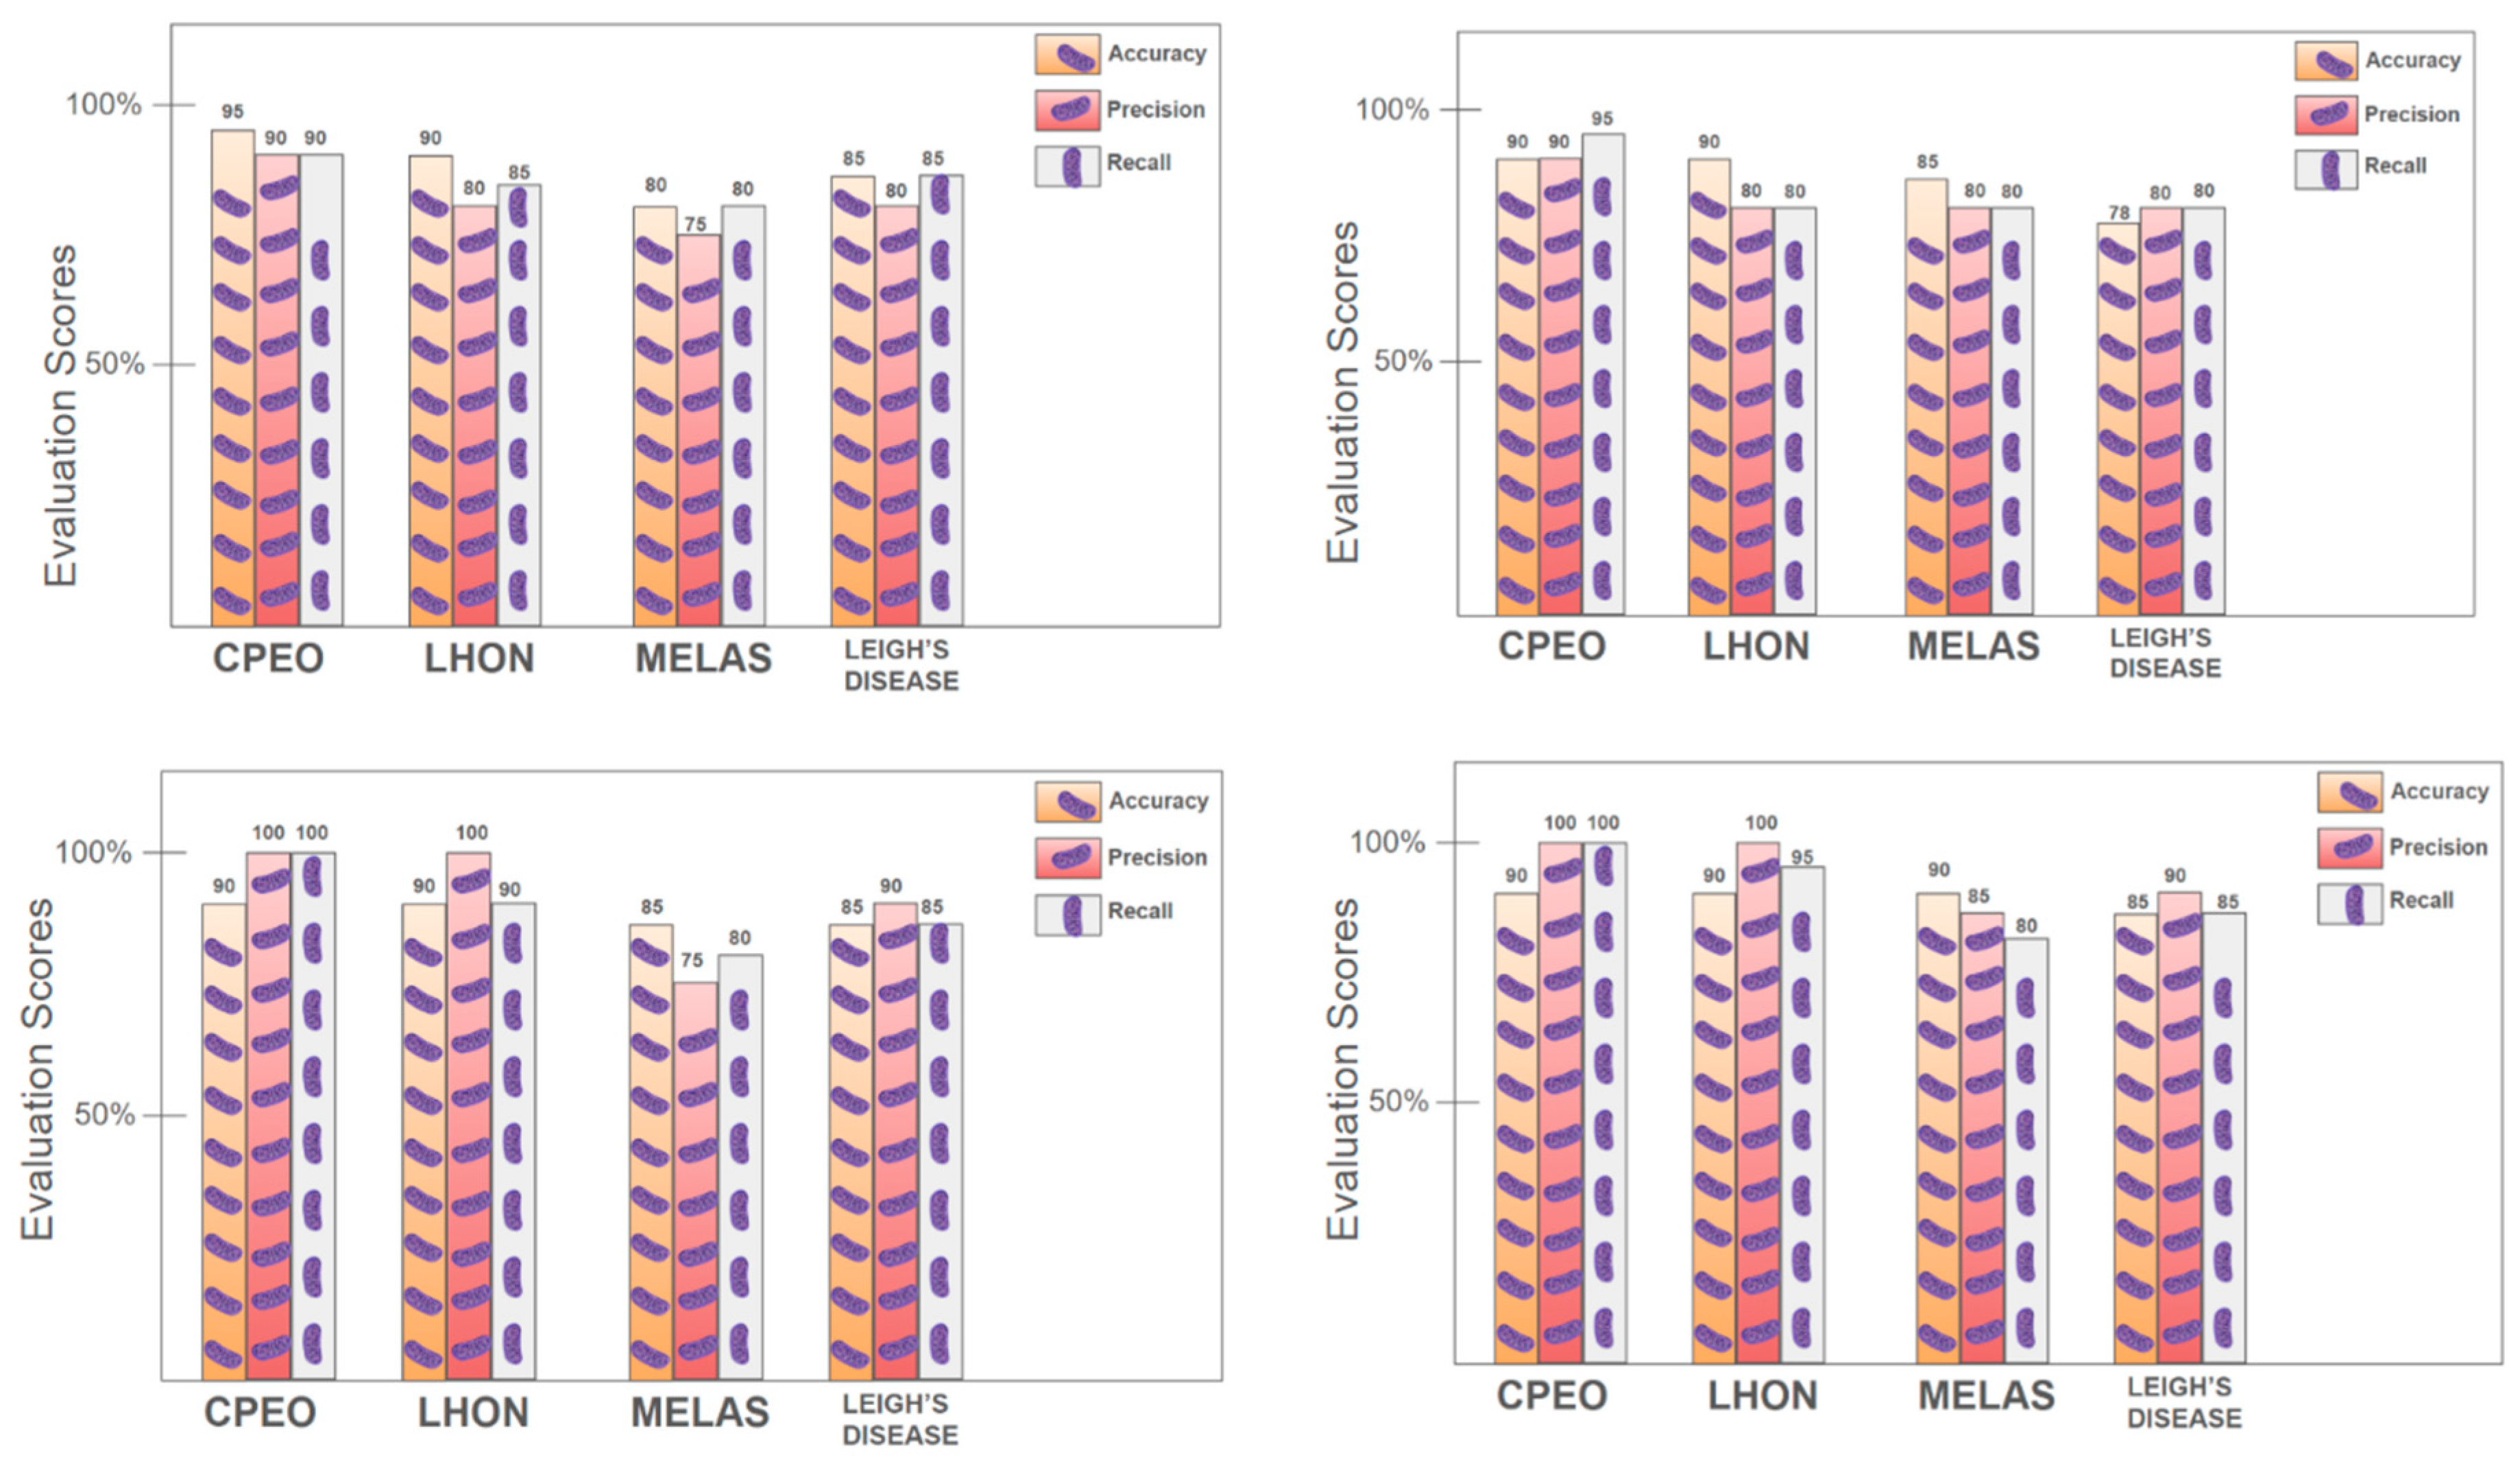
Figure 5.
Feature importance plot from the Random Forest model identifying the most predictive clinical and demographic variables for mitochondrial disease classification.
Figure 5.
Feature importance plot from the Random Forest model identifying the most predictive clinical and demographic variables for mitochondrial disease classification.
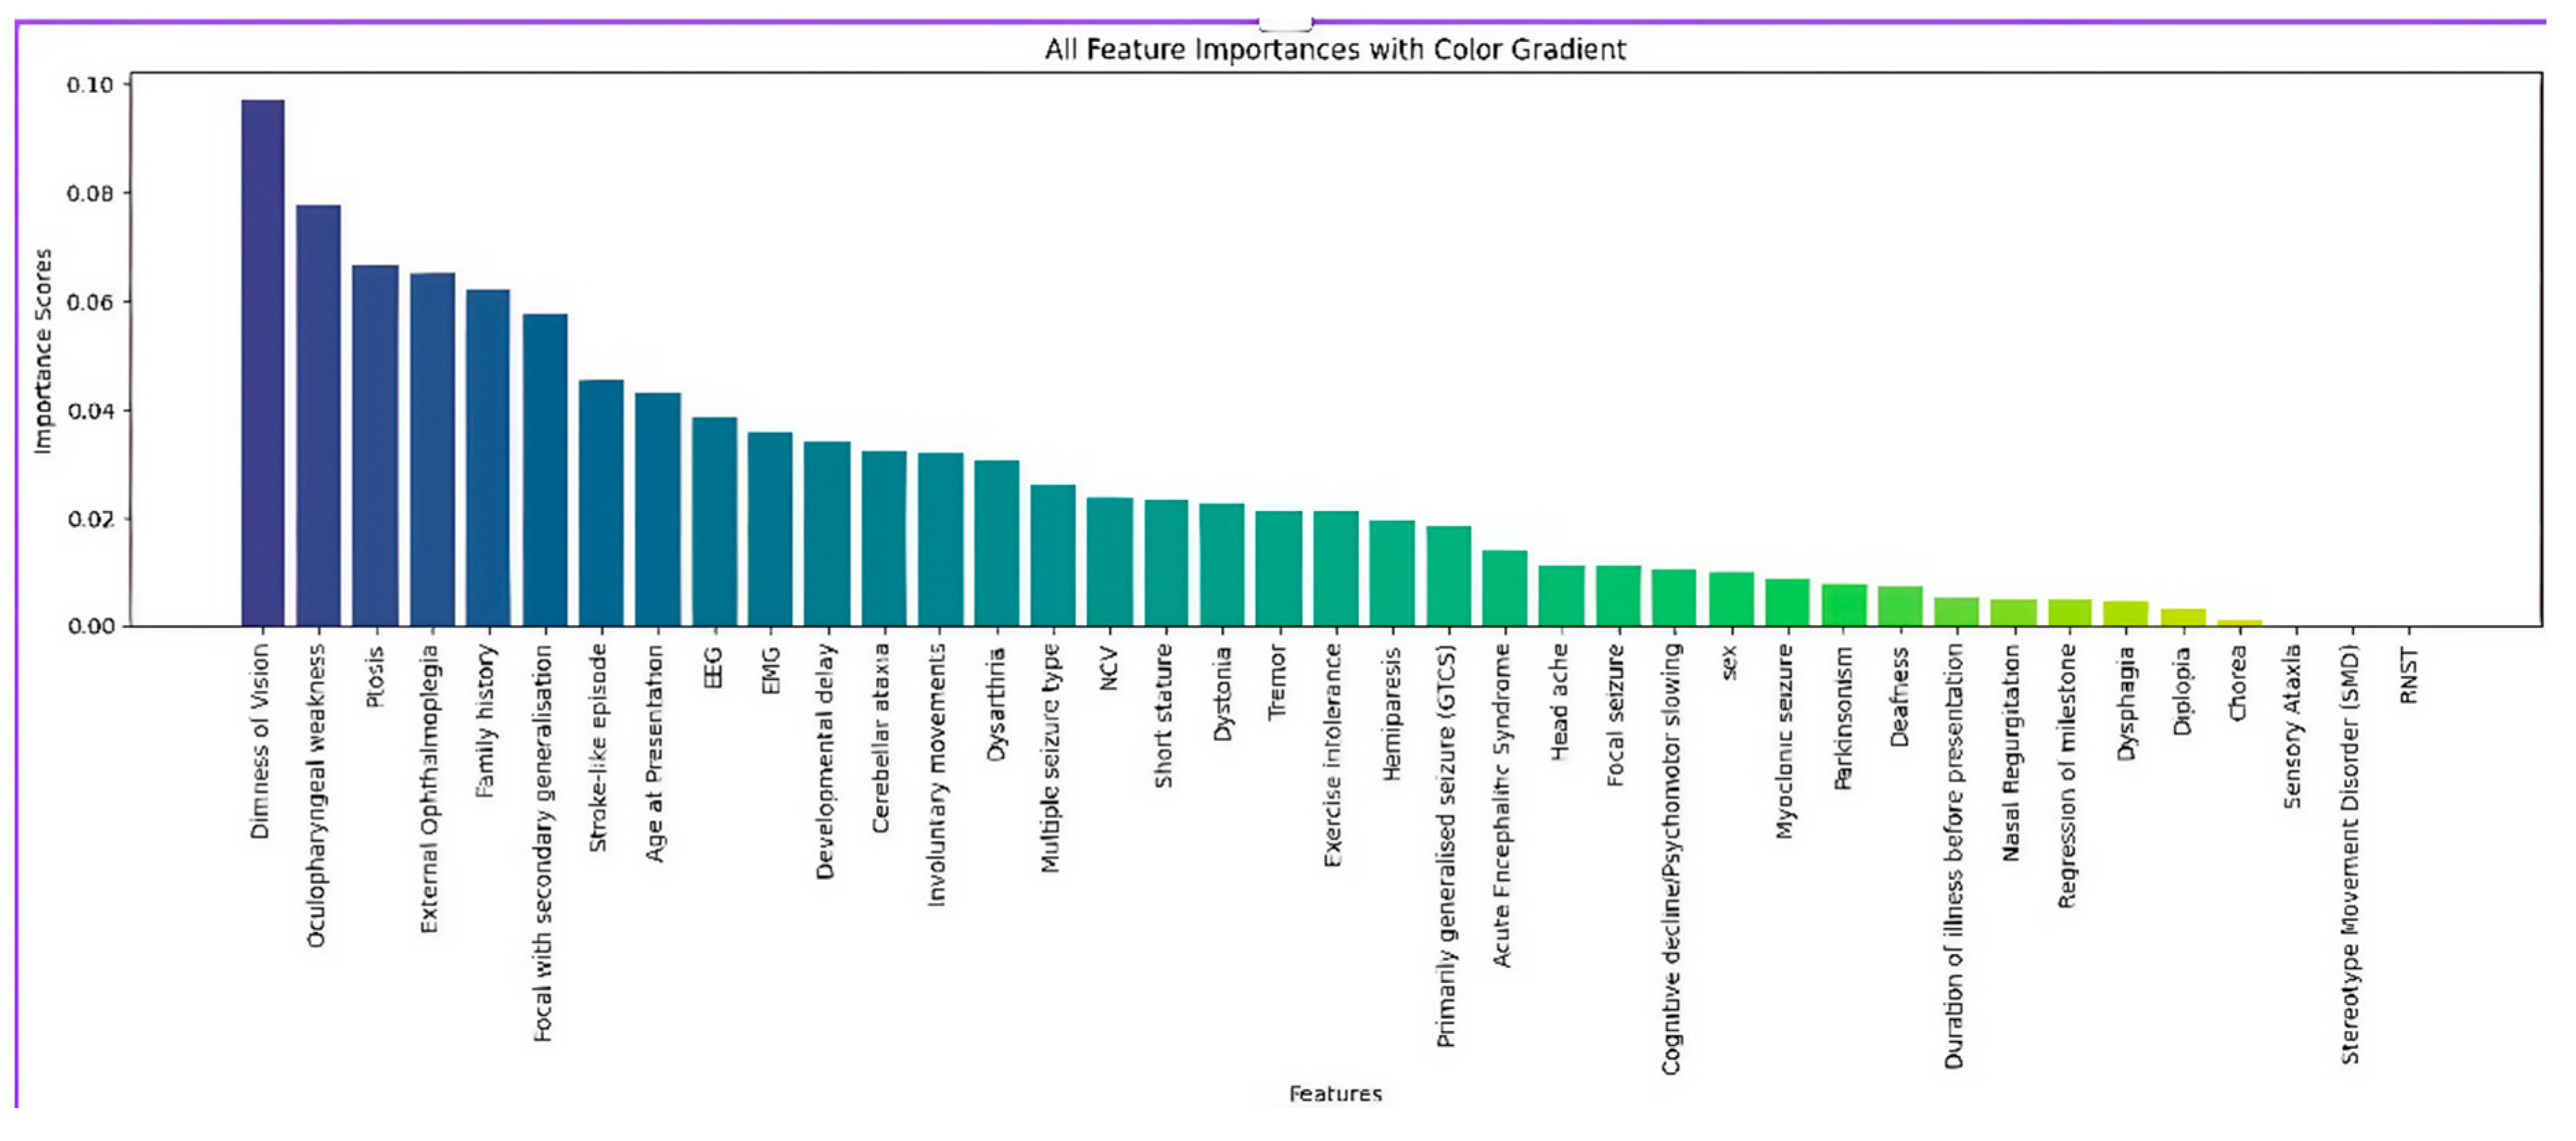
Figure 6.
A. Primer design and mutation site in wild-type vs mutant MT-ND4 gene (m.11778G>A) associated with LHON. B. PCR amplification of mtDNA from patients MT-15 and MT-16 using wild-type and mutant primers. C. PCR amplification of mtDNA from patients MT-17 and MT-18. D. PCR amplification of mtDNA from patient MT-21. Abbreviations: PCR – Polymerase Chain Reaction; mtDNA – Mitochondrial DNA.
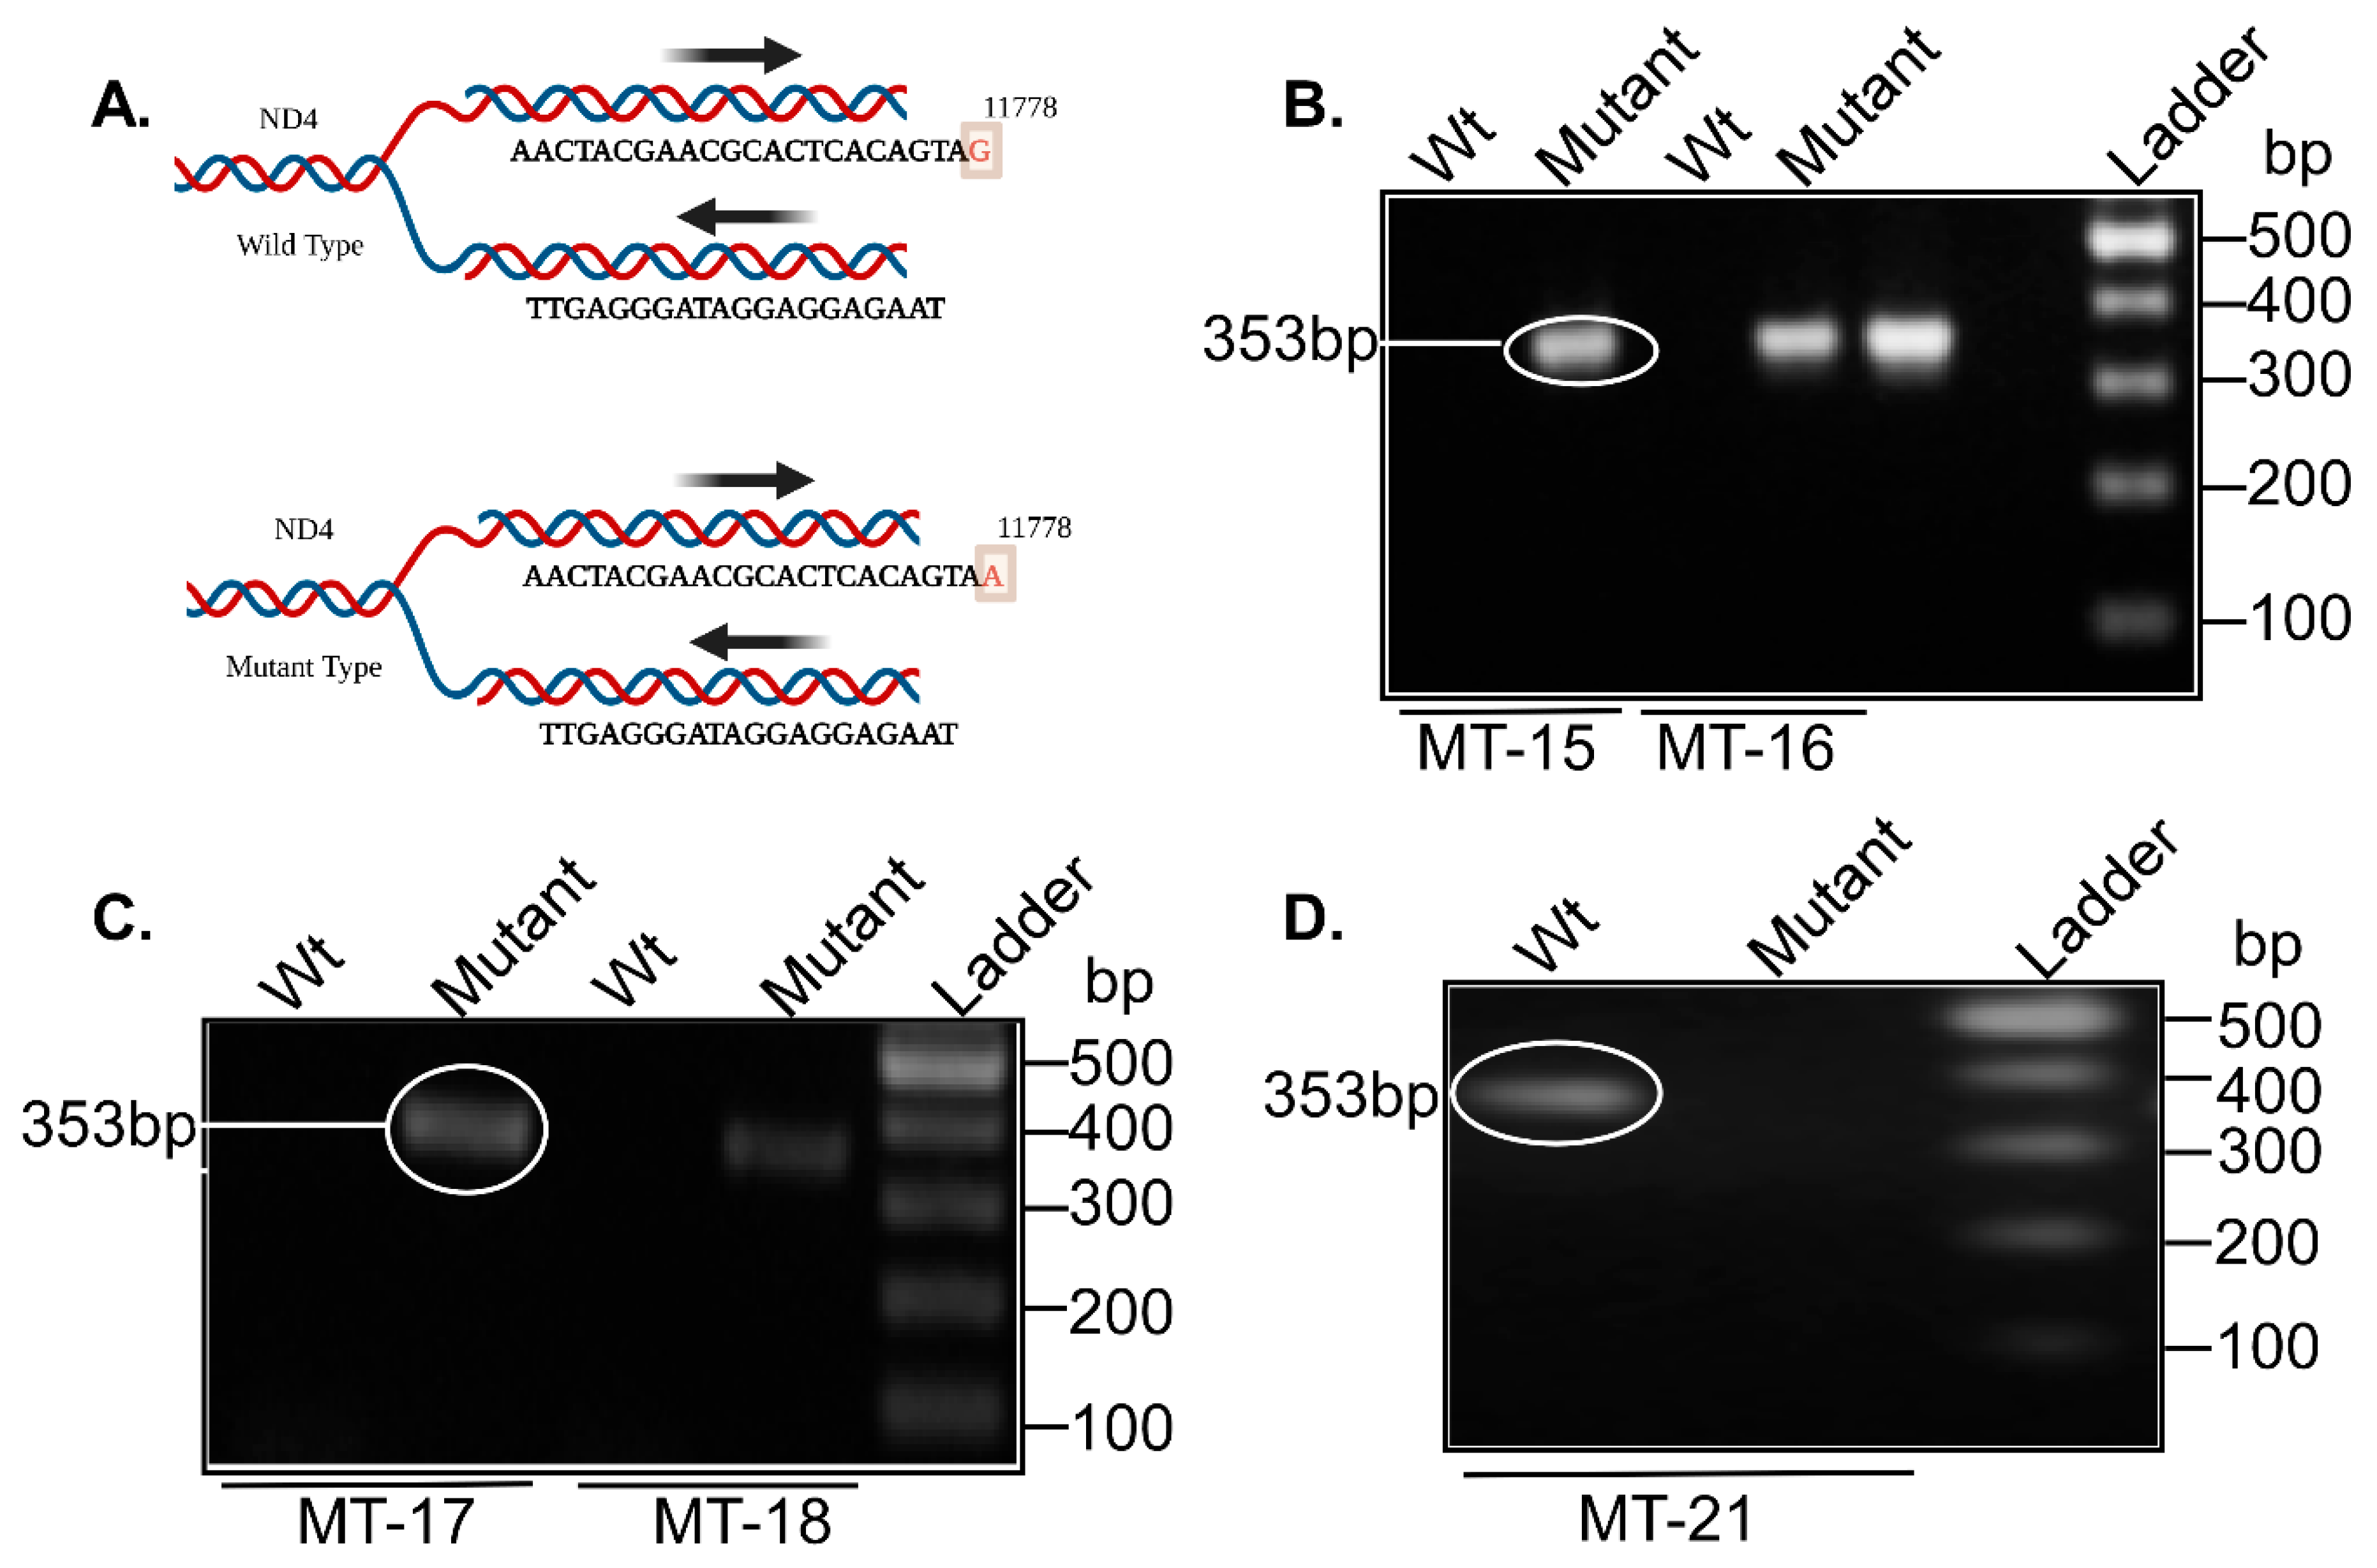
Figure 7.
A. Primer design and mutation sites in the MT-TL1 tRNA gene (m.3243A>G, m.3271T>C, m.3251A>G) associated with MELAS. B. Sanger sequencing chromatogram for patient MT-28 showing heteroplasmy at m.3243A>G. C. PCR amplification results for patients MT-28, MT-04, MT-08. D. Intensity plot for heteroplasmy in MT-28, MT-04, and MT-08. E. PCR results for MT-08, MT-06, MT-12, MT-20. F. Intensity plots for heteroplasmy in MT-08, MT-06, MT-12, MT-20. G. PCR results for MT-20, MT-22, MT-24. H. Intensity plots for heteroplasmy in MT-20, MT-22, MT-24. Note: MT-04 (MELAS_2), MT-06 (MELAS_2), and MT-22 (MELAS_2) are not plotted due to very low mutant band intensity, although gel images are provided. Abbreviations: PCR – Polymerase Chain Reaction; mtDNA – Mitochondrial DNA; MELAS – Mitochondrial Encephalopathy, Lactic Acidosis, and Stroke-like Episodes.
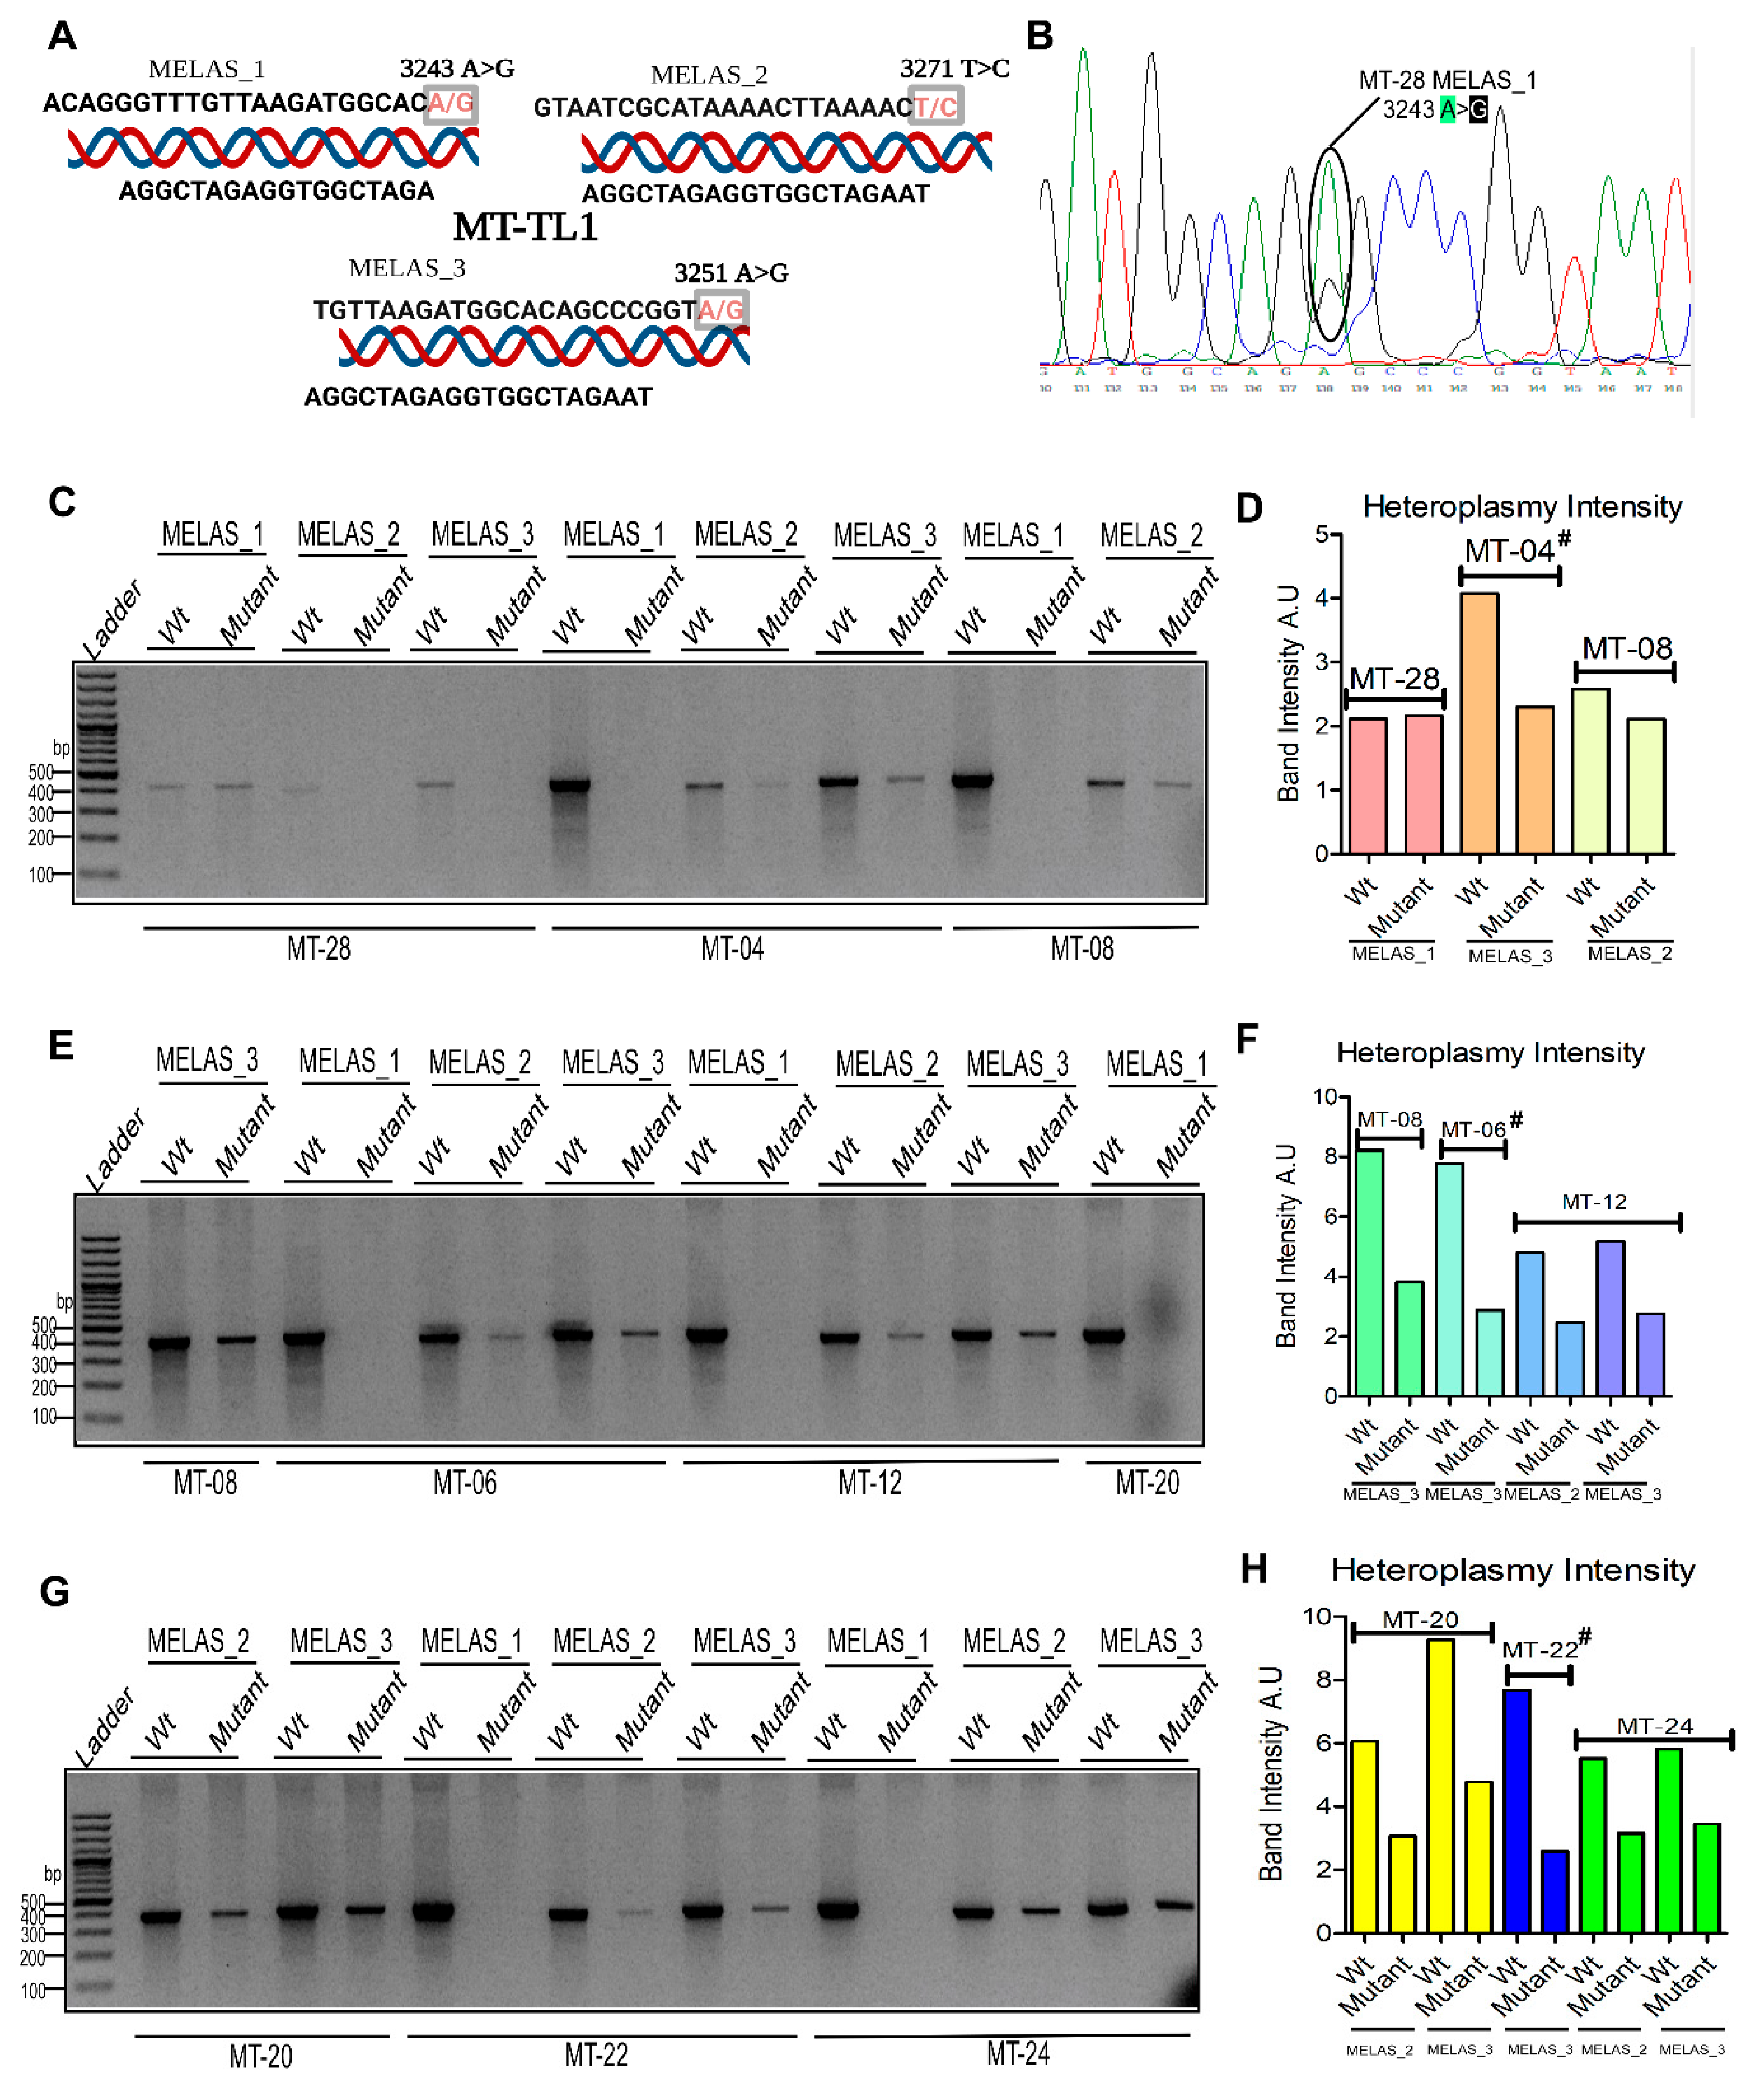
Figure 8.
A. Primer design for the detection of the m.8993T>G mutation in the MT-ATP6 gene (Leigh syndrome). B. PCR amplification products for patients MT-07 and MT-23. C. Intensity plot illustrating heteroplasmy in MT-07 and MT-23. Abbreviations: PCR – Polymerase Chain Reaction; mtDNA – Mitochondrial DNA.
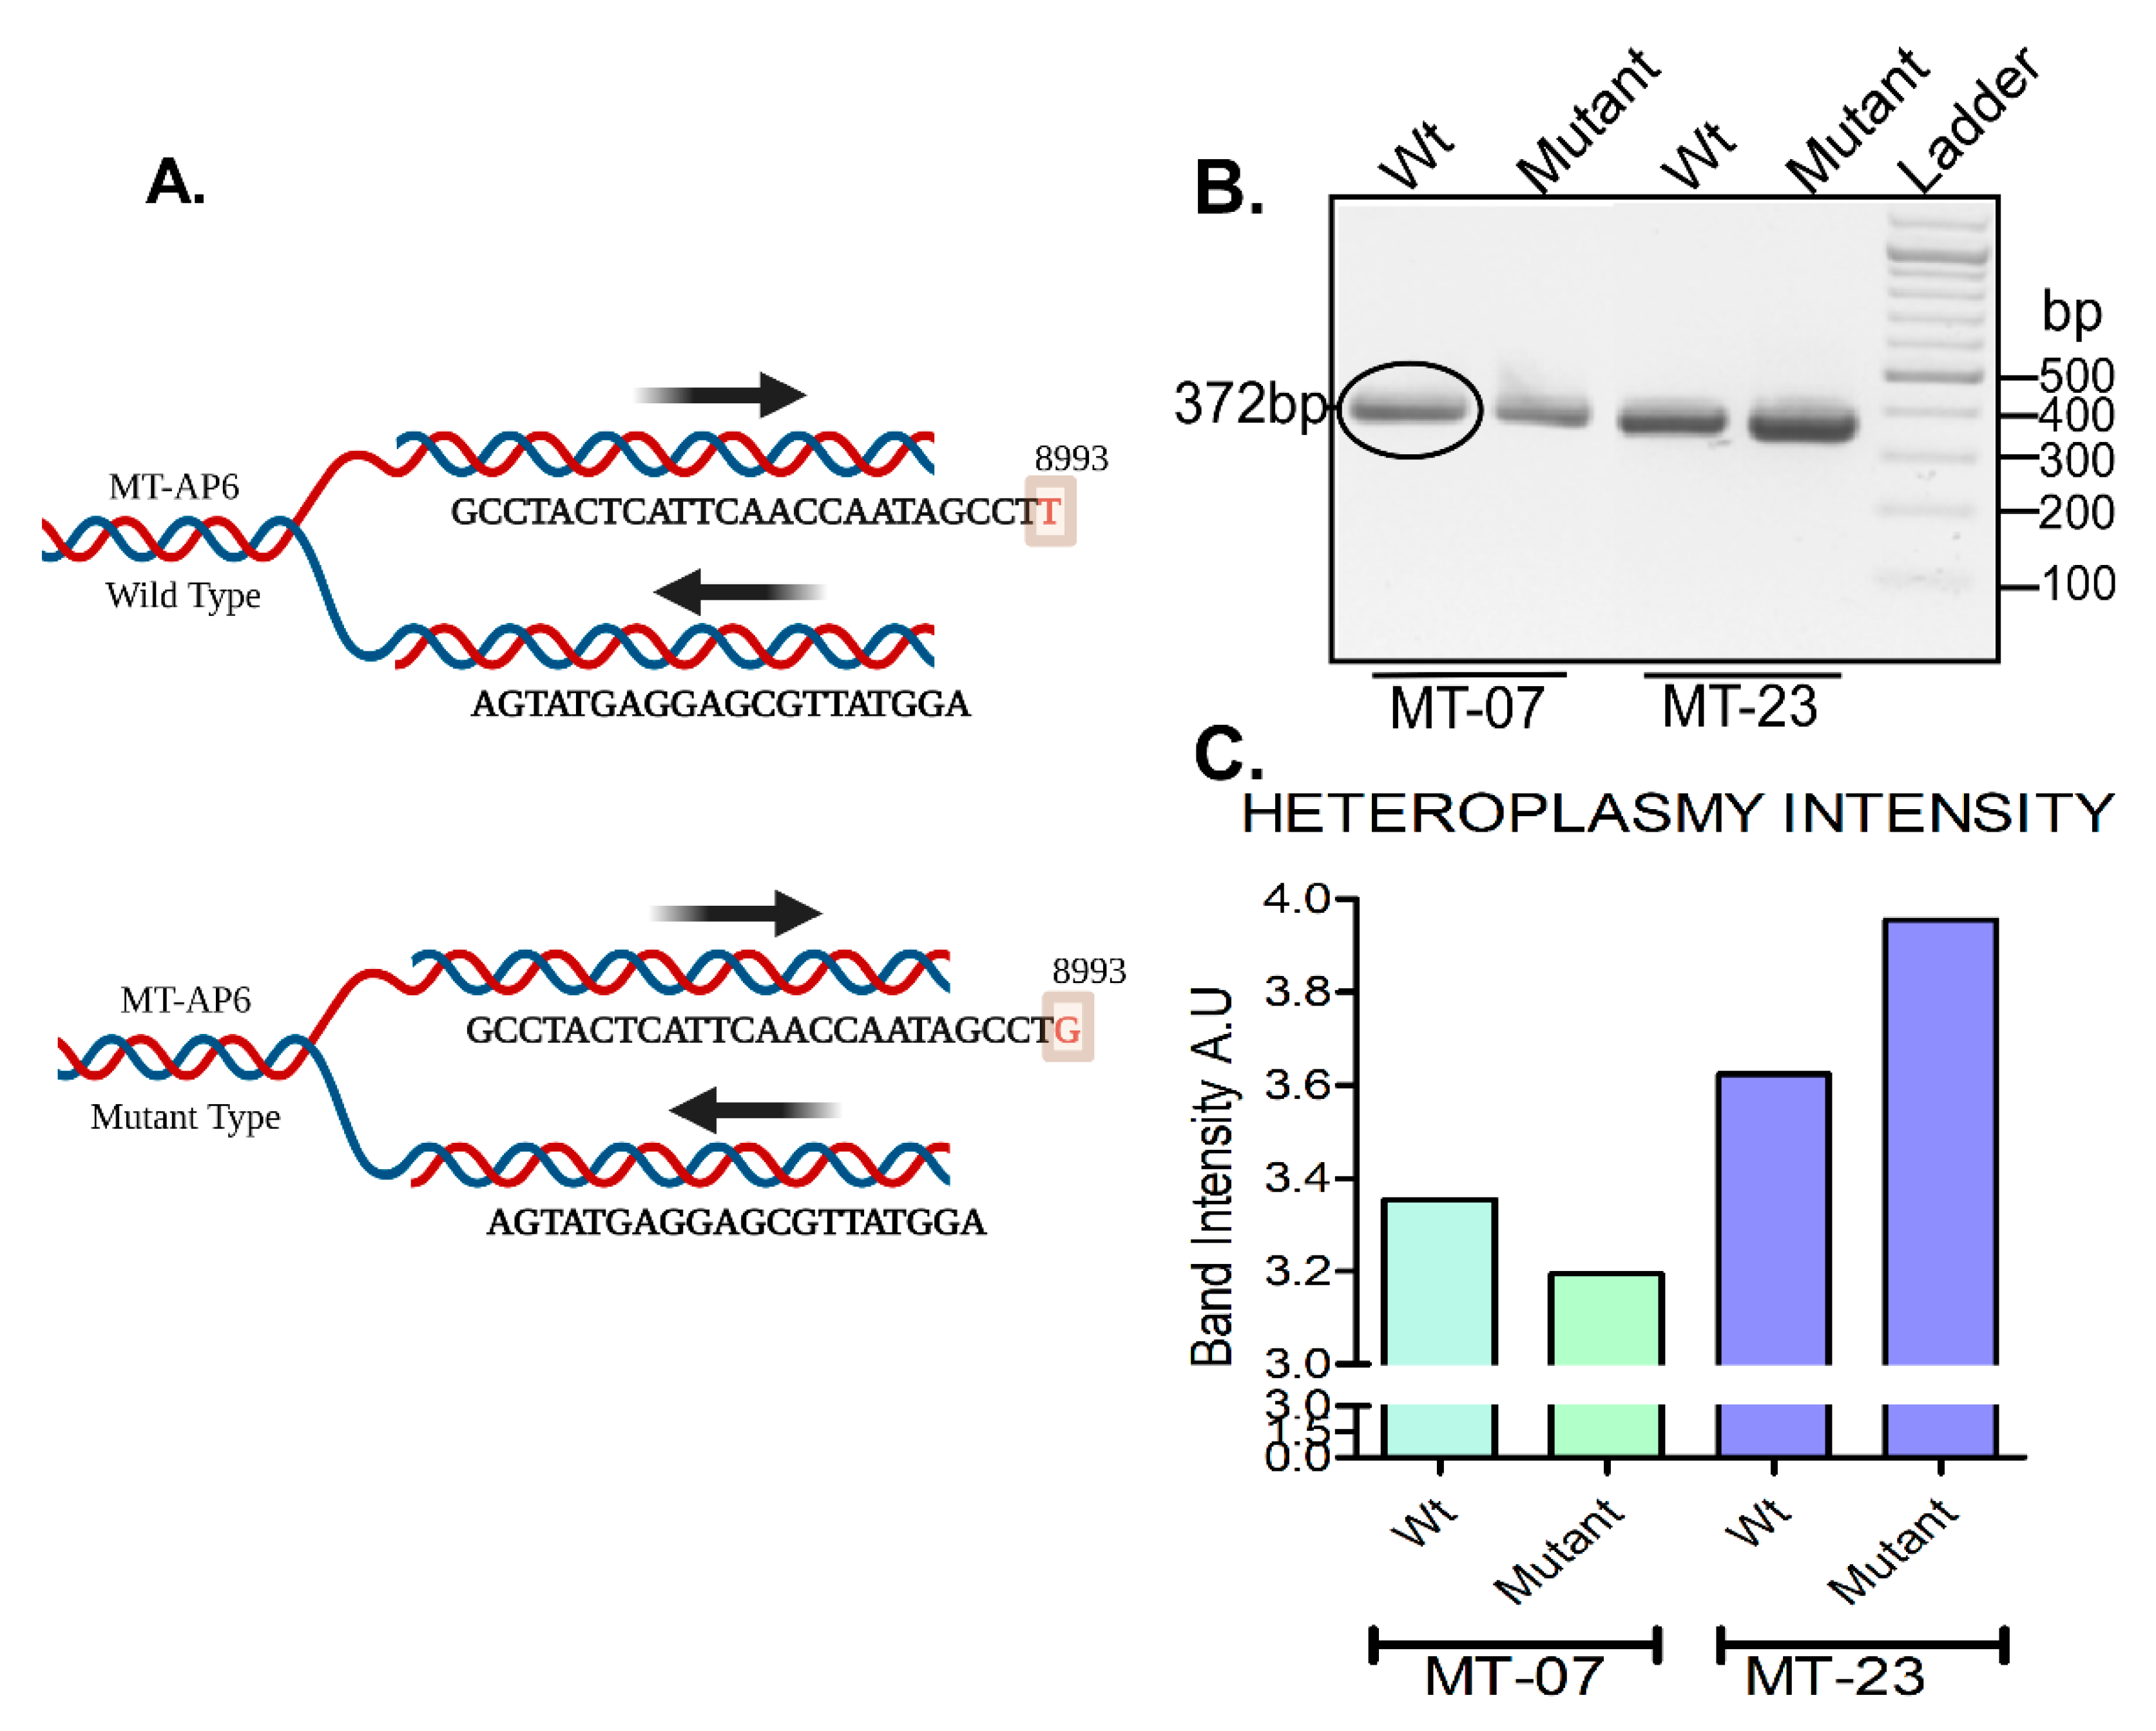
Figure 10.
Pathogenicity scores of mitochondrial single-nucleotide variants (SNVs) detected in this study. Scores were obtained using multiple bioinformatic tools to predict the deleterious impact of variants. Abbreviations: LHON – Leber Hereditary Optic Neuropathy; MELAS – Mitochondrial Encephalopathy, Lactic Acidosis, and Stroke-like Episodes; CPEO – Chronic Progressive External Ophthalmoplegia; HSP – Heat Shock Protein; NADH – Nicotinamide Adenine Dinucleotide; AA – Amino Acid; CADD – Combined Annotation-Dependent Depletion; PANTHER – Protein ANalysis THrough Evolutionary Relationships.
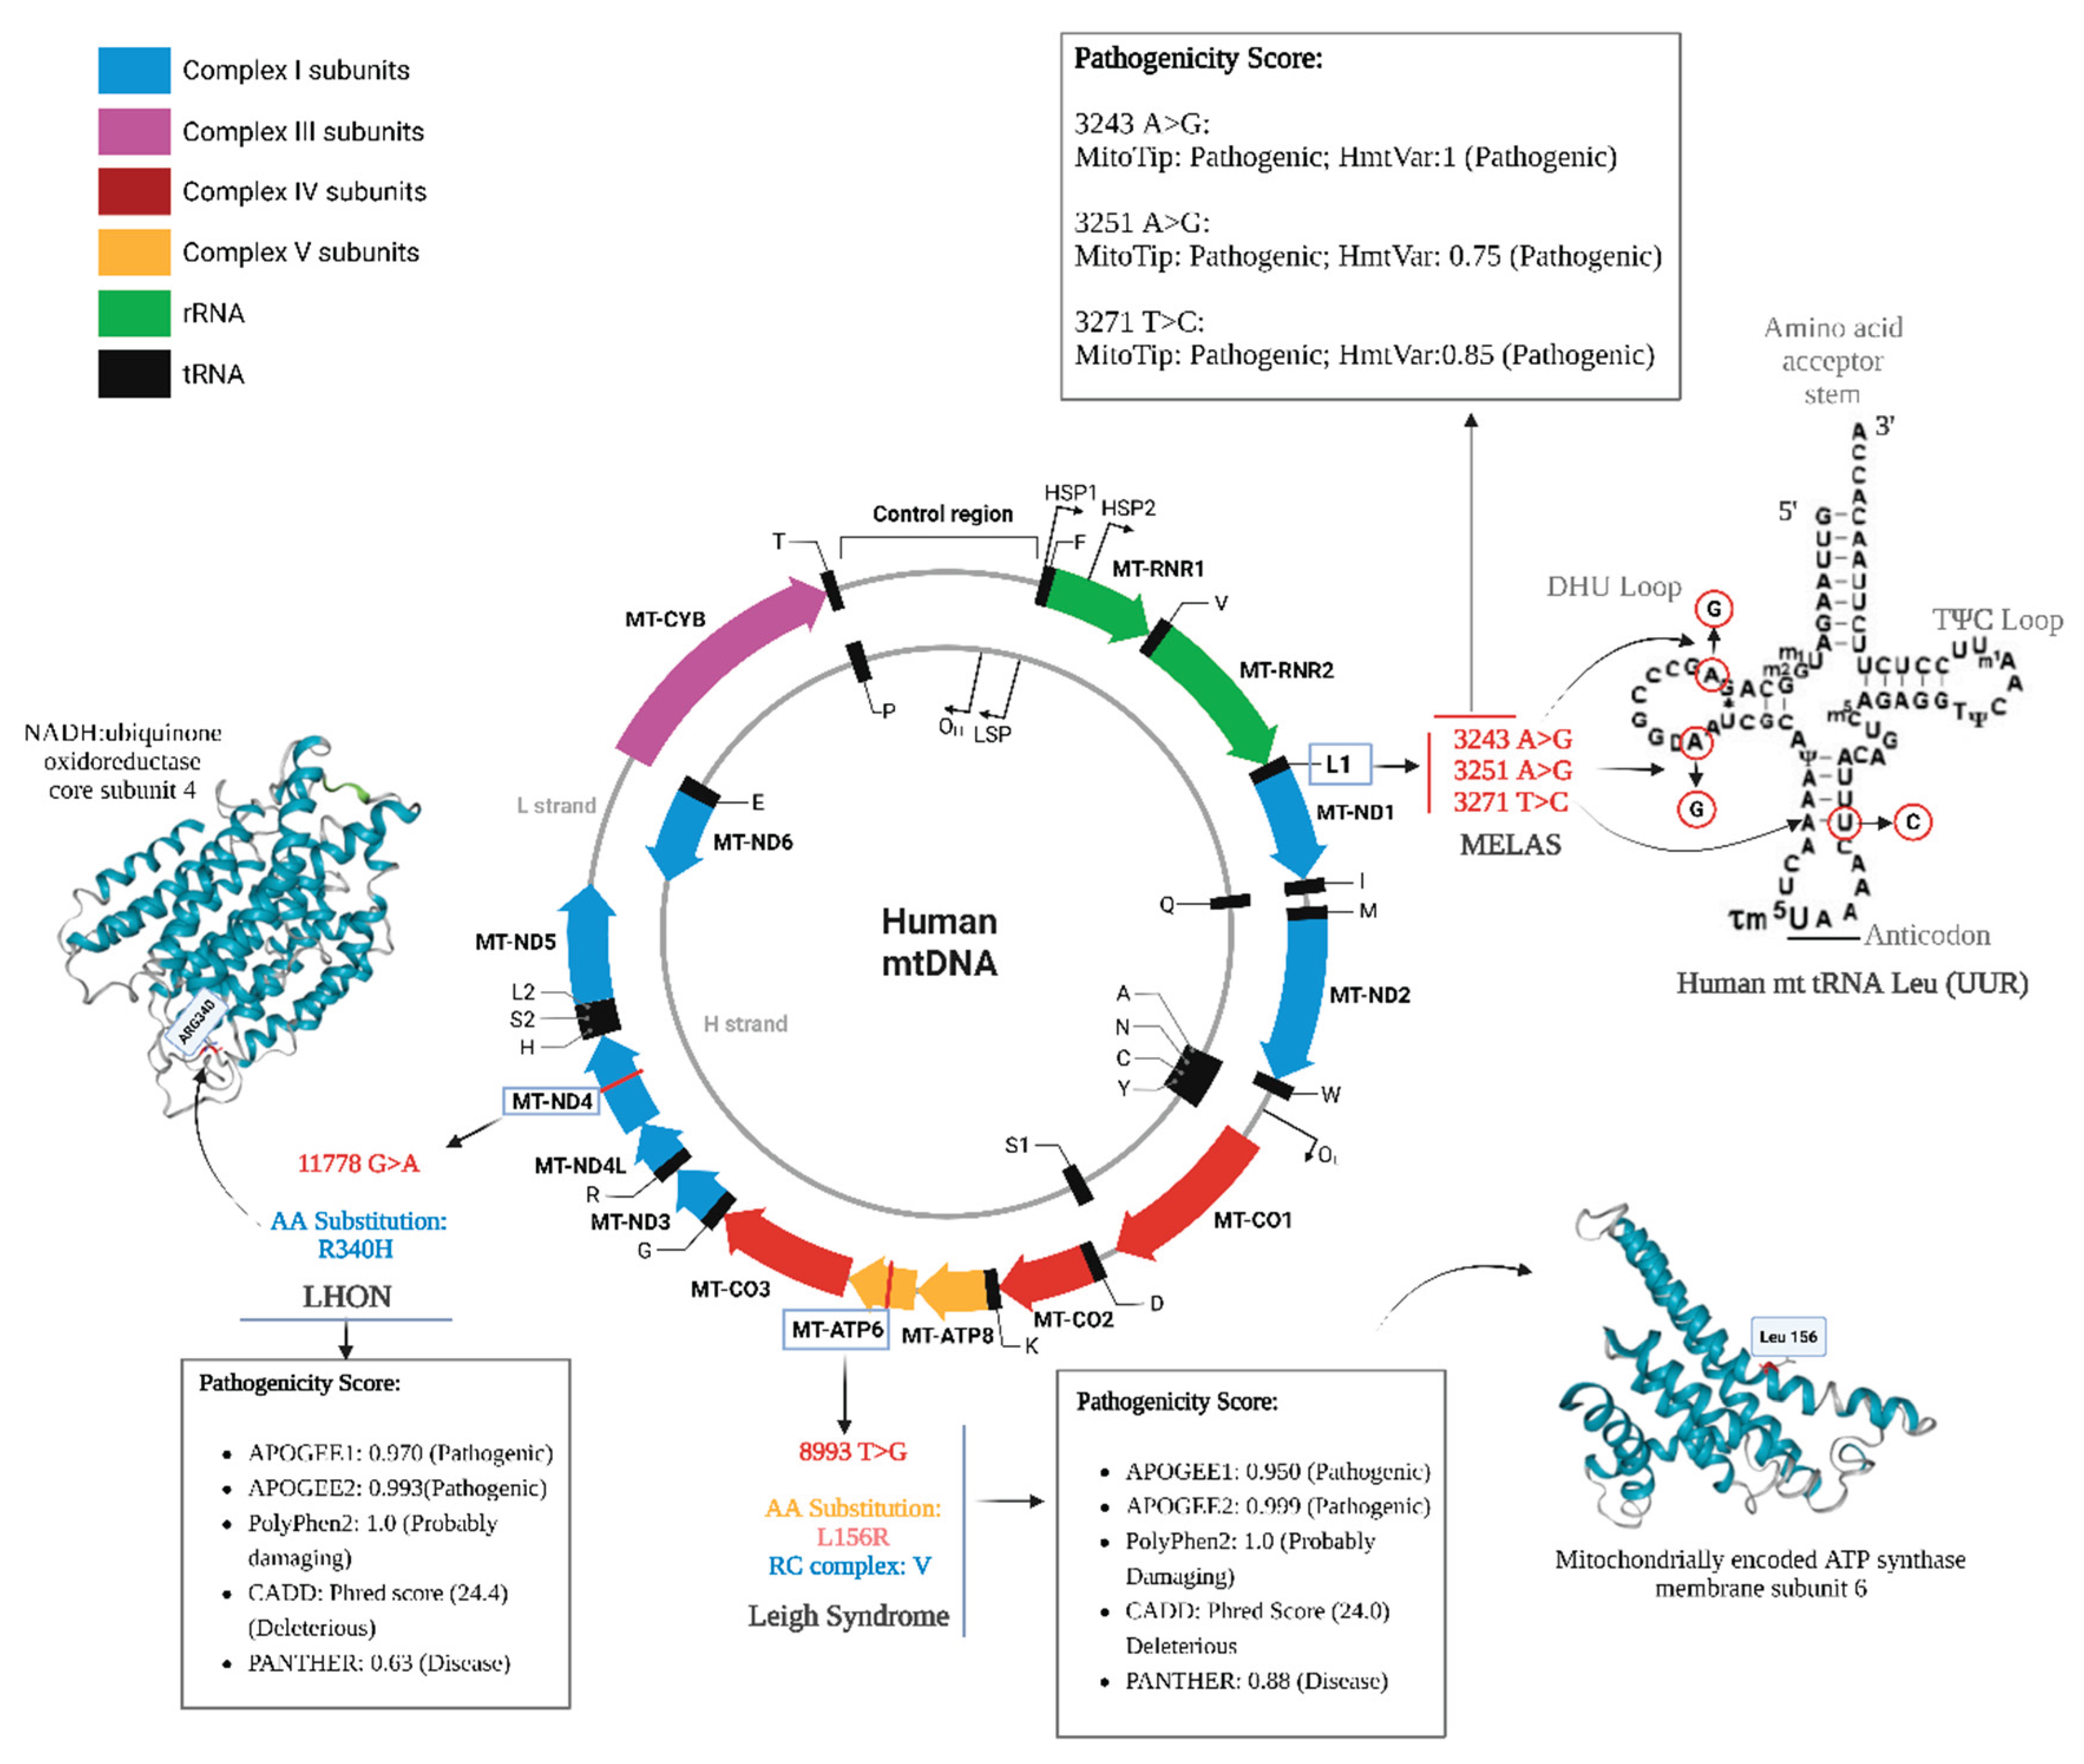
Table 1.
Distribution of Diagnoses Among Mitochondrial Disease Patients Included in the Study.
| Patient ID | Diagnosis | Patient ID | Diagnosis |
|---|---|---|---|
| MT-01 | MELAS | MT-25 | MELAS |
| MT-02 | LEIGH | MT-26 | CPEO |
| MT-03 * | CPEO | MT-27 | CPEO |
| MT-04 | MELAS | MT-28 | MELAS |
| MT-05 * | CPEO | MT-29 **** | LHON |
| MT-06 | MELAS | MT-30 **** | LHON |
| MT-07 | LEIGH | MT-31 | MELAS |
| MT-08 | MELAS | MT-32 | CPEO |
| MT-09 | LEIGH | MT-33 | LHON |
| MT-10 | MELAS | MT-34 | MELAS |
| MT-11 | LEIGH | MT-35 | CPEO |
| MT-12 | MELAS | MT-36 *** | CPEO |
| MT-13 | CPEO | MT-37 | CPEO |
| MT-14 | CPEO | MT-38 | CPEO |
| MT-15 ** | LHON | MT-39 | MELAS |
| MT-16 ** | LHON | MT-40 | MELAS |
| MT-17 ** | LHON | MT-41 | CPEO |
| MT-18 ** | LHON | MT-42 | CPEO |
| MT-19 | LEIGH | MT-43 | LHON |
| MT-20 | MELAS | MT-44 | MELAS |
| MT-21 *** | LHON | MT-45 | LEIGH |
| MT-22 | MELAS | MT-46 | CPEO |
| MT-23 | LEIGH | MT-47 | MELAS |
| MT-24 | MELAS | MT-48 | LHON |
LHON, Leber hereditary optic neuropathy; MELAS, mitochondrial encephalopathy, lactic acidosis, and stroke-like episodes; CPEO, chronic progressive external ophthalmoplegia; LEIGH, Leigh syndrome. * represents MT-03 and MT-05 belong from same family. ** represents MT-15, MT-16-MT-17 belong from same family. *** represents MT-21 and MT-36 belong from same family. **** represent MT-29, MT-30 represent from same family.
Table 2.
Baseline demographic characteristics of the study cohort.
| Variables | Disease Phenotype | |||
|---|---|---|---|---|
| MELAS (N=17) | LHON (N=10) | LEIGH Syndrome (N=7) | CPEO (N=14) | |
| Demographic Parameters | ||||
| Age (years) (mean±SD, range) | 20.4±12.3, 5–60 years | 32.3±12.1, 20–60 years | 12.2±11.9, 0.75-35 years | 28.1±12.4, 8–48 years |
| Age (years) at disease onset | 13.5±7.2 | 25.1±12.8 | 9.9±11.3; (SEM±4.6Y) | 20.6±10.7 |
| Duration of Illness (mean) | 6.9 years | 8.2 years | 2.3 years | 7.4 years |
| Positive Family History | 1 (5.9%) | 8 (80%) | 0 | 4 (28.6%) |
| Consanguinity | 3 (17.6%) | 0 | 2 (28.6%) | 1 (7.1%) |
| Sex | ||||
| Male | 9 (52.9%) | 6 (60%) | 3 (42.85%) | 7 (50%) |
| Female | 8 (47.05%) | 4 (40%) | 4 (57.14%) | 4 (50%) |
| Temporal Nature of Disease Progression | ||||
| Slowly Progressive | 8 (47.0%) | 4 (40%) | 3 (42.9%) | 14 (100%) |
| Relapsing /Progressive | 9 (52.9%) | 0 | 1 (14.2%) | 0 |
| Acute onset/Non progressive | 0 | 6 (60%) | 0 | 0 |
| Acute onset/Progressive | 0 | 0 | 3 (42.9%) | 0 |
| Baseline Findings from General Survey | ||||
| Developmental delay | NA | NA | 4 | 1 |
| Regression of Milestone | 2 | NA | NA | NA |
| Short stature | 1 | NA | 3 | 2 |
| Hypertelorism | 1 | NA | 1 | NA |
| Short metatarsal | NA | 1 | NA | NA |
| Exercise intolerance | 8 | 1 | NA | 11 |
| Arterial hypertension | 1 | NA | NA | NA |
| Type-2 diabetes mellitus | 1 | 1 | NA | NA |
| Left bundle branch block | NA | NA | NA | 1 |
| Bifascicular Block | NA | NA | NA | 1 |
| Sexual infantilism | NA | NA | NA | 1 |
| Pregnancy-induced arterial hypertension | 1 | NA | NA | NA |
| Cryptogenic hepatic cirrhosis | 1 | 1 | NA | NA |
| Major depressive disorder | NA | 1 | NA | 1 |
Abbreviations: MELAS, mitochondrial encephalopathy, lactic acidosis, and stroke-like episodes; LHON, Leber hereditary optic neuropathy; LEIGH, Leigh syndrome; CPEO, chronic progressive external ophthalmoplegia; NA, not applicable; Y, years; SEM, standard error of the mean.
Table 3.
Baseline neurological manifestations across mitochondrial disease subtypes.
| Variables | Disease Phenotype | |||
|---|---|---|---|---|
| MELAS (N=17) | LHON (N=10) | Leigh syndrome (N=7) | CPEO (N=14) | |
| Neurological presentations | ||||
| Headache | 7 (41.2%) | NA | NA | NA |
| Hemiparesis | 7 (41.2%) | NA | 1 (12.3%) | NA |
| Dysarthria | 10 (58.8%) | NA | 2 (28.6%) | 5 (35.7%) |
| Dysphagia | 3 (17.7%) | NA | NA | 4 (28.6%) |
| Diplopia | 1 (5.9%) | NA | NA | NA |
| Deafness | 1 (5.9%) | NA | 1 (12.3%) | 1 (7.1%) |
| Dimness of Vision | 1 (5.9%) | 10 (100%) | 2 (28.6%) | NA |
| Nasal Regurgitation | NA | NA | NA | 3 (21.4%) |
| External Ophthalmoplegia | 1 (5.9%) | NA | NA | 13 (92.6%) |
| Ptosis and impaired eye movement | 2 (11.8%) | NA | 1 (12.3%) | 13 (92.6%) |
| Oculopharyngeal weakness | NA | NA | 1 (12.3%) | 12 (85.7%) |
| Acute encephalitic syndrome | 4 (23.5%) | NA | 3 (42.9%) | NA |
| Stroke-like episode | 10 (58.8%) | NA | NA | NA |
| Cognitive decline/ Psychomotor slowing | 7 (41.2%) | NA | 4 (57.1%) | 2 (14.3%) |
| Encephalopathy | 10 (58.8%) | NA | 3 (42.9%) | NA |
| Sensorineural hearing loss | 1 (5.9%) | NA | 1 (12.3%) | 2 (14.3%) |
| Pattern of Movement Disorder | ||||
| Tremor | 4 (36.4%) | NA | 2 (40%) | 1 (7.14%) |
| Chorea | 1 (9.1%) | NA | NA | NA |
| Dystonia | 7 (41.2%) | NA | 4 (80%) | NA |
| Parkinsonism | 1 (5.9%) | NA | 1 (20%) | NA |
| Cerebellar Ataxia | 6 (35.3%) | NA | 1 (20%) | 1 (7.14%) |
| Involuntary Movement | 1 (5.9%) | NA | 4 (80%) | NA |
| Axonal Neuropathic Changes | 1 (5.9%) | NA | NA | NA |
| Seizure Types | ||||
| Focal Seizure with Secondary Generalisation | 12 (75%) | NA | ||
| Generalized tonic-clonic seizure | 6 (54.5%) | NA | 3 (42.8%) | NA |
| Myoclonic Seizure | 8 (72.7%) | NA | ||
Abbreviations: MELAS, mitochondrial encephalopathy, lactic acidosis, and stroke-like episodes; LHON, Leber hereditary optic neuropathy; CPEO, chronic progressive external ophthalmoplegia; NA, not applicable.
Table 4.
Biochemical and Electroencephalographic Findings Across Mitochondrial Disease Phenotypes.
| Variables | Disease Phenotype | |||
|---|---|---|---|---|
| MELAS (N=17) | LHON (N=10) | Leigh syndrome (N=7) | CPEO (N=14) | |
| Biochemical Parameters | ||||
| Cerebrospinal fluid | ||||
| Increased cell count | Normal | 3 (33.3%) | 3 (42.9%) | 4 (28.57%) |
| Elevated glucose (n, %) Mean±SD (mg/dL) Range (mg/dL) |
2 (11.76%) 56.5±14.1 31-92 |
3 (33.3%) 69.4±17.9 45-108 |
NA 57.4±8.8 44-73 |
NA 55.6±11.3 34-78 |
| Elevated protein (n, %) Mean±SD (mg/dL) Range (mg/dL) |
Normal | 3 (33.3%) 41.9±12.8 21.2-65 |
Normal | 5 (35.7%) 49.1±17.4 23-86 |
| Elevated lactate (n, %) Mean±SD (mg/dL) Range (mg/dL) |
4 (23.5%) 17.9±4.7 10.3-29 |
2 (20%) 17.4±3.8 13-25 |
3 (42.9%) 21.5±6.5 15-34 |
9 (64.3%) 22.6±8.1 12.6-47 |
| Serum | ||||
| Elevated lactate (n, %) Mean±SD (mg/dL) |
13 (76.4%) 24.4±5.8 |
4 (40%) 24±16.6 |
4 (57.1%) 22.1±7 |
8 (57.1%) 27.9±19 |
| Electroencephalographic findings | ||||
| Diffuse Slowing | 4 (23.5%) | NA | 1 (14.3%) | NA |
| Spike and wave discharge | 5 (29.41%) | 3 (42.9%) | ||
| Left-sided spike and sharp wave discharge with secondary generalization | 6 (35.3%) | 1 (14.3%) | ||
| Not Significant | 1 | 10 | 3 | 14 |
Abbreviations: MELAS, mitochondrial encephalopathy, lactic acidosis, and stroke-like episodes; LHON, Leber hereditary optic neuropathy; CPEO, chronic progressive external ophthalmoplegia; NA, not available; SD, standard deviation.
Table 6.
Summary of Targeted Mitochondrial Mutations, Genes Involved, and Conservation Scores Across Diagnosed Patients (N = 21).
Table 6.
Summary of Targeted Mitochondrial Mutations, Genes Involved, and Conservation Scores Across Diagnosed Patients (N = 21).
| Patient ID | Type of Disease | Gene | Nucleotide Position | Nucleotide change | Condition | Conservation Score |
|---|---|---|---|---|---|---|
| MT-04 | MELAS | MT-TL1 (tRNA) | 3271 3251 |
T>C A>G |
Heteroplasmy for both nucleotide positions | 82.2% 93.3% |
| MT-06 | MT-TL1 (tRNA) | 3271 3251 |
T>C A>G |
Heteroplasmy for both nucleotide positions | 82.2% 93.3% |
|
| MT-08 | MT-TL1 (tRNA) | 3271 3251 |
T>C A>G |
Heteroplasmy for both nucleotide positions | 82.2% 93.3% |
|
| MT-12 | MT-TL1 (tRNA) | 3271 3251 |
T>C A>G |
Heteroplasmy for both nucleotide positions | 82.2% 93.3% |
|
| MT-20 | MT-TL1 (tRNA) | 3271 3251 |
T>C A>G |
Heteroplasmy for both nucleotide positions | 82.2% 93.3% |
|
| MT-22 | MT-TL1 (tRNA) | 3271 3251 |
T>C A>G |
Heteroplasmy for both nucleotide positions | 82.2% 93.3% |
|
| MT-24 | MT-TL1 (tRNA) | 3271 3251 |
T>C A>G |
Heteroplasmy for both nucleotide positions | 82.2% 93.3% |
|
| MT-28 | MT-TL1 (tRNA) | 3243 | A>G | Heteroplasmy for both nucleotide positions | 97.8% | |
| MT-07 | LEIGH | MT-ATP6 | 8993 | T>G | Heteroplasmy for nucleotide position | 97.8% |
| MT-23 | MT-ATP6 | 8993 | T>G | Heteroplasmy for nucleotide position | 97.8% | |
| MT-15 | LHON | MT-ND4 | 11778 | G>A | A mutation was found in the MT-ND4 gene | 100% |
| MT-16 | MT-ND4 | 11778 | G>A | A mutation was found in the MT-ND4 gene | 100% | |
| MT-17 | MT-ND4 | 11778 | G>A | A mutation was found in the MT-ND4 gene | 100% | |
| MT-18 | MT-ND4 | 11778 | G>A | A mutation was found in the MT-ND4 gene | 100% | |
| MT-21 | MT-ND4 | 11778 | G>A | Clinically diagnosed, and genetic testing was performed, but no mutation was found in MT-ND4 gene | 100% | |
| MT-03 | CPEO | Not Applicable | Not Applicable | Not Applicable | No deletion was found between 8kb-14kb | Not Applicable |
| MT-05 | Not Applicable | Not Applicable | Not Applicable | No deletion was found between 8kb-14kb | Not Applicable | |
| MT-13 | Not Applicable | Not Applicable | Not Applicable | No deletion was found between 8kb-14kb | Not Applicable | |
| MT-14 | Not Applicable | Not Applicable | Not Applicable | No deletion was found between 8kb-14kb | Not Applicable | |
| MT-26 | Not Applicable | Not Applicable | Not Applicable | No deletion was found between 8kb-14kb | Not Applicable | |
| MT-27 | Not Applicable | Not Applicable | Not Applicable | No deletion was found between 8kb-14kb | Not Applicable |
Abbreviations: MELAS, mitochondrial encephalopathy with lactic acidosis and stroke-like episodes; LHON, Leber hereditary optic neuropathy; LEIGH, Leigh syndrome; CPEO, chronic progressive external ophthalmoplegia; MT-TL1, mitochondrial tRNA-Leu(UUR) gene; MT-ATP6, mitochondrial ATP synthase subunit 6 gene; MT-ND4, mitochondrial NADH dehydrogenase subunit 4 gene; T>C, thymine to cytosine substitution; A>G, adenine to guanine substitution; G>A, guanine to adenine substitution; T>G, thymine to guanine substitution; kb, kilobase; NA, not applicable.
Disclaimer/Publisher’s Note: The statements, opinions and data contained in all publications are solely those of the individual author(s) and contributor(s) and not of MDPI and/or the editor(s). MDPI and/or the editor(s) disclaim responsibility for any injury to people or property resulting from any ideas, methods, instructions or products referred to in the content. |
© 2025 by the authors. Licensee MDPI, Basel, Switzerland. This article is an open access article distributed under the terms and conditions of the Creative Commons Attribution (CC BY) license (http://creativecommons.org/licenses/by/4.0/).
Copyright: This open access article is published under a Creative Commons CC BY 4.0 license, which permit the free download, distribution, and reuse, provided that the author and preprint are cited in any reuse.


