
Submitted:
30 July 2025
Posted:
31 July 2025
You are already at the latest version
Abstract
In time defined by environmental transformation and anthropogenic pressure, understanding the natural geochemical evolution of coastal zones has never been more urgent. The Western Bohai Sea Coast (WBSC) offers a natural archive of significant land-sea evolution, comprising extensive subsurface deposits formed under marine influence during the progradation of the mid-to-late Holocene Yellow River delta. Over time, natural processes such as meteoric water infiltration and groundwater movement have altered the salinity and alkalinity of these sediments. This study explores the natural desalination pathways shaped by meteoric and groundwater infiltration, focusing on their impact on sediment alkalinity. Seven subsurface sediment cores (5 to 6 m in depth) were collected along a land-to-sea transect, targeting shallow layers situated above -1.5 m in elevation. Electrical conductivity (EC) and pH measurements, combined with foraminiferal records, revealed a seaward-narrowing desalination corridor, indicating the ongoing influence of natural desalination processes on coastal sediment chemistry. Inland marine-affected sediments exhibited very low EC values (0.2–0.4 mS·cm⁻¹), suggesting extensive desalination. In contrast, within ~15km landward of the coast, sediments showed higher and more variable EC values (0.67–3.66 mS·cm⁻¹), with a pronounced decline toward the middle layer within the 0–1 m elevation zone. High alkalinity (pH > 9) was associated with the extent of marine-affected sediments inland, while elevated pH values at coastal sites were restricted to areas of low EC. These findings highlight a critical environmental dynamic between desalination and pH increase, with implications for soil health, agricultural viability, and ecosystem functioning in coastal regions. Ultimately, this study not only enhances our understanding of sediment geochemistry in coastal areas but also provides an important foundation for future research aimed at mitigating the impacts of salinization in vulnerable coastal environments.
Keywords:
electric conductivity
; alkalinity
; desalination
; saline sediment
; Bohai Sea
1. Introduction
As climate variability accelerates and intensive land development continues, coastal zones face increasing pressure from both natural processes and anthropogenic interventions, making it essential to understanding the intrinsic geochemical evolution of subsurface sedimentary in these environments [1]. Among these processes, natural desalination plays a critical yet underexamined role in transforming the chemical environment of subsurface sediments in marine-affected lowlands. Along China’s northern coastline, particularly across the Subei coast and the Western Bohai Sea Coast (WBSC), this transformation unfolds across a vast deltaic plain shaped since the mid-to-late Holocene by the ancient Yellow River. The resulting landscape comprises extensive tidal and supratidal flats, where marine-influenced sediments several meters thick dominate, interspersed with a lesser contribution of fluvial materials [2,3].
These coastal sediment layers, particularly those in supratidal zones, are typified by low permeability and a disruption of hydraulic connectivity due to high evaporation rates. As a consequence, salinity gradients tend to increase with elevation, peaking near the spring high tide line and tapering landward [4,5]. This configuration contributes to poor soil productivity across marine-affected areas, prompting long-standing efforts in agricultural reclamation and soil improvement.
Numerous agronomic studies along the northern Chinese coast have reported that during artificial desalination of saline soils, pH levels rise markedly as salinity declines [6,7,8]. Leaching indoor desalination experiments using marine sediments from the Subei coast corroborate this behavior: as electrical conductivity (EC) falls, bicarbonate ions (HCO₃⁻) increase, driving pH upward from 8.71 to peaks of 9.29 and 9.16 during initial leaching cycles before eventually stabilizing around 8.70 in later stages [9]. These results indicate that the rise in pH is primarily governed by the depletion of calcium ions (Ca²⁺), which alters carbonate equilibria and facilitates an accumulation of HCO₃⁻ in the soil solution [9]. While such indoor-based and short-term observations have advanced our understanding of managed soil desalination, the long-term natural evolution of saline-alkaline characteristics in marine-influenced subsurface sediments—particularly over spatial scales extending tens of kilometers inland—remains insufficiently investigated. These sediments, shaped over millennia and exposed to varying regimes of meteoric water infiltration and groundwater interaction, hold untapped insights into natural geochemical transformation processes [3,10,11].
In this study, we address this gap by analysing seven sediment cores from the WBSC region, distributed along an inland transect of approximately 80 km from the maximum Holocene marine transgression limit to the present-day shoreline. Through detailed analysis of foraminiferal records, clayey water EC, and sediment pH, we reconstruct the patterns and extent of long-term natural desalination and its concurrent effect on alkalization. Our findings not only contribute to a more complete understanding of coastal sediment evolution under natural forcing but also highlight the transformative capacity of nature to reshape geochemical landscapes—gradually, but profoundly—over geological timescales.
2. Material and Methods
2.1. Study Sites and Sediment Core Collection
The Bohai Sea, the innermost marginal sea of Asia, extends furthest into the continent (Figure 1). This positioning gives the WBSC a semi-arid, continental monsoon climate with hot, rainy summers. Annual precipitation averages approximately 600 mm, with about 80% falling between July and September. Average annual evaporation is around 1200 mm [12]. The study area, located in the Tianjin-Changzhou area, North China (38.5°N–38.7°N, 116.6°E–117.5°E) gently slopes eastward with an elevation of 2–6 m. The inland region, at elevations of ~4–6 m, is primarily agricultural land used for corn and cash crops. Conversely, the coastal area, at elevations of ~2–4 m, features extensive wetlands, such as Beidagang and Nandagang, characterized by salt-tolerant vegetation [13].
Seven sediment cores (Dc01, 16-5, Qx02, Cz61, Cz66, 17-8, and Q7) were collected along a transect (Table 1, Figure 1) extending from the maximum Holocene transgression limit to the modern coastline. Sediment cores were collected using a rotary drilling method and precisely georeferenced with a GPS-RTK system linked to the CORS network. This study focuses on subsurface sediments down to -1.5 m below mean sea level (MSL), encompassing both fluvial and marine deposits. The sediment cores, sealed within PVC tubes for preservation, were transported to the laboratory for subsequent analysis.
2.2. Sedimentary Identification and Subsampling
In the laboratory, sediment cores were sectioned, photographed, and described in detail, documenting sedimentary characteristics such as grain size, Munsell color, physical sedimentary structures, organic content, and macrofossils. Subsamples were collected at 20 cm intervals for analysis of mud-water sediment electrical conductivity (EC) and pH, in order to assess sediment salinity and alkalinity. Foraminiferal analysis was performed to evaluate the extent of marine influence.
2.3. Measurement of Mud-Water EC and pH
Mud-water EC was measured following the method of [14]. Sediment samples were dried at 110°C for 48 hours and then ground into a fine powder. A 10.0 g portion of each sample was placed in a 120 ml triangular flask, mixed with 120 ml of distilled water, and stirred for three minutes. After settling for one hour, EC was measured using a Mettler Toledo FE30 conductivity meter [15]. The samples were then left undisturbed for five days, and a second EC measurement was taken to confirm stability. If the two measurements varied significantly, the process was repeated until consistent results were achieved.
Following EC measurement, pH was determined using a Mettler Toledo FE20 pH meter.
2.4. Foraminifera Analysis
Foraminiferal analysis was conducted on 20 g dry sediment samples. Organic matter was removed, and grains were dispersed by adding 15% hydrogen peroxide. The samples were then wet-sieved through a 240-mesh (0.063 mm) standard analysis sieve. The retained material was dried in an evaporation pan and examined under a binocular microscope to identify foraminiferal species and count individuals. Foraminifera were picked from the >63 µm fraction and quantified in terms of basic abundance (number of individuals per gram of dry sediment).
3. Results
3.1. Sediment Lithological Characteristics and Marine Influences
3.1.1. Anthropogenic Disturbance
The seven cores in this study were extracted from areas near residential or industrial zones, thus the topsoil exhibits varying degrees of anthropogenic disturbance. This disturbance has disrupted the original soil structure, resulting in heterogeneous sediment composition, including plant debris, gravelly soil, and agricultural or domestic residues. The disturbed layer, initially composed of clayey silt or silt, ranges in thickness from approximately 0.5 to 1 m. Consequently, determining the original depositional environment of this layer was challenging. However, the underlying strata remained unaffected by excavation.
3.1.2. Fluvial Sediments
Sediments from cores Dc01 and 16-5, located outside the Holocene maximum transgression boundary, and the upper sections of the cores Qx02 and Cz61, situated within the Holocene transgression range, consist of yellow to yellowish-brown clayey silt interbedded with clayey sand; foraminifera are absent (Figure 2). These sediments exhibit abundant reduction streaks and rust-colored stains, indicative of Fe oxide. We interpret them as floodplain deposits from a low-lying area between rivers.
3.1.3. Marine-Related Sediments
Within the Holocene transgression range, subsurface sediments from cores Qx02, Cz61, Cz66, 17-8, and Q7 consist of olive-brown or brown mud with intercalated clayey sand and peaty layers; foraminifera are generally present, indicating a marine influence (Figure 2). Small quantities of marine shells appear in localized layers. These sediments, excluding those from core Q7, exhibit abundant reduction streaks and rust stains from Fe oxides. We interpret these sediments as having formed in the upper intertidal and supratidal flats.
3.2. Sediment EC and pH Characteristics
3.2.1. Descriptive Statistics
EC and pH values for both the whole study area (WBSC) and individual cores are summarized in Table 2 and Table 3, respectively. Across the study area, subsurface sediment EC and pH values exhibit significant variability, ranging from 0.13 to 3.66 mS·cm⁻¹ and 8.07 to 9.51, with average values of 0.67 mS·cm⁻¹ and 8.84, respectively. The WBSC subsurface sediments range from non-saline to extremely saline, and in terms of pH, they are slightly or strongly alkaline.
The EC of individual cores showed a trend of increasing values seaward, with lower values inland and higher values near the coast (Table 2). Core 16-5 exhibited the lowest mean EC (0.28 mS·cm⁻¹) and a coefficient of variation (CV) of 19.66%, indicating minimal fluctuation. Conversely, cores 17-8 and Q7 have the highest mean EC values, at 1.20 mS·cm⁻¹ and 2.07 mS·cm⁻¹, respectively, with CVs of 41.88% and 37.94%, reflecting greater variability.
Subsurface pH values are relatively low in cores Dc01, 16-5, and Q7. The mean pH for Dc01, 16-5, and Q7 are 8.52, 8.59, and 8.60, with CVs of 1.44%, 1.08%, and 3.03%, respectively. In contrast, subsurface sediments from cores Qx01, Cz61, Cz66, and 17-8 exhibit higher pH values, with mean values of 8.98, 8.94, 9.18, and 9.13, respectively. The CVs for these cores are 1.78%, 2.07%, 1.07%, and 4.27%.
3.2.2. Spatial Variability
The spatial variability of EC and pH in the subsurface sediments is depicted in Figure 3 and Figure 4.
Generally, EC exhibits a seaward increasing trend (Figure 3, Table 2). In inland and central areas, such as locations Dc01, 16-5, Qx01, Cz61, and Cz66, subsurface EC ranges from 0.13 to 1.02 mS·cm⁻¹. EC values show a slight increase in the lower section of Dc01 and the upper section of Qx01, while values at the other locations primarily cluster between 0.2 and 0.4 mS·cm⁻¹. Conversely, coastal sites located within~15km landward of the coast, including cores 17-8 and Q7, demonstrate significantly higher EC values in sediments, ranging from 0.67 to 3.66 mS·cm⁻¹. A notable decreasing trend is observed toward the middle layer (0–1 m in elevation, MSL), with values increasing both upwards and downwards from this layer.
pH values are relatively low in sediments at inland sites farthest from the coast (Dc01 and 16-5), ranging from 8.22 to 8.77, and exhibit no clear vertical trend. In contrast, central sites (Qx01, Cz61, and Cz66) demonstrate higher pH values (8.67–9.40), with a notable increase in the lower layers of Qx01 and Cz61 compared to the upper layers. At coastal sites such as 17-8 and Q7, pH values vary widely (8.07–9.51) and show an inverse spatial pattern to EC, displaying a distinct increase toward the middle layer (0–1 m elevation, MSL) and decreasing both upwards and downwards from this layer.
4. Discussion
4.1. Natural Desalination of Marine-Affected Sediments
Lithological characteristics and foraminiferal analysis confirm the presence of marine-affected subsurface sediments at core sites Qx02, Cz61, Cz66, 17-8, and Q7 (Figure 2). Despite this marine influence, electrical conductivity (EC) displays a distinct pattern: lower values are observed in the central areas, while higher values near the coast. This distribution indicates that the EC levels are largely independent of marine sediment presence. Specifically, core sites Qx02, Cz61, and Cz66 in the central area exhibit very low EC values (0.2–0.4 mS·cm⁻¹) within the marine-affected subsurface sediments. These values are even lower than those of fluvial sediments at the more inland site Dc01. Given that water-soluble salts influence conductivity, and EC generally correlates positively with salinity [16], these low EC values suggest substantial desalination of the subsurface sediments. This desalination is likely due to the percolation of meteoric water and influx of fresh groundwater. Supporting this interpretation are abundant reduction streaks and prominent rust stains from Fe oxides (Figure 2), indicative of prolonged oxidation processes facilitated by relatively fresh pore water.
In contrast to the central sites, the coastal site of core 17-8 shows relatively higher EC values (0.67–1.99 mS·cm⁻¹) within the marine-affected sediments, suggesting a weakening of regional desalination towards the east. Fe oxide development is also less pronounced at this location. However, core 17-8 exhibits a distinct decreasing EC trend toward the middle layer, with the lowest EC values (0.6–0.8 mS·cm⁻¹) centered at an elevation of -0.3 to 0.8 m. At the coastline site Q7, the marine-affected sediments exhibit highest EC values (1.27–3.66 mS·cm⁻¹). This suggests that severe seawater intrusion has likely resulted in direct connectivity between pore water and marine-influenced water. Furthermore, the rarity of iron oxides in the subsurface sediments of Q7 (Figure 2) indicates limited oxidation, likely due to prolonged exposure to saline water. Similar to core 17-8, sediment EC in Q7 shows a decreasing trend toward the middle layer, but the lowest values (1.2–1.4 mS·cm⁻¹) occur approximately 0.8 m higher, at an elevation of 0.8–1.4 m. This elevation closely aligns with the local mean high water (MHW) level (~1.2 m above MSL [17]), suggesting that tidal fluctuations exert a primary influence on pore water salinity dynamics around the coastline, as also indicated by Shen et al. [18].
The coastal EC patterns observed in cores 17-8 and Q7 may be related to relatively weak groundwater coastal discharge in the region. Groundwater levels in the coastal area are around 1 m in elevation and gradually decrease inland, reaching 0 to -1 m at approximately 40 km from the shoreline [19,20]. These low coastal groundwater levels create favorable conditions for tidal seawater infiltration that suppresses the flushing effect and limits the leaching of soluble salts in coastal area. Consequently, along the WBSC, the pattern of natural desalination of marine-affected sediments shows drainage pathways narrowing seaward and ultimately limited to the upper intertidal zone.
4.2. pH Change During Marine-Affected Sediments Desalination
pH distributions in aquatic sediments are primarily shaped by sediment-water interactions [21]. In eastern China, the pH of modern coastal plain and marine sediments typically ranges from 7 to 7.8 [9,22,23]. However, the spatial variability of pH (Figure 4) reveals consistently high alkalinity (pH > 9) in cores Qx01, Cz61, Cz66, 17-8, and Q7 within marine-affected sediments. In the central area (cores Qx01, Cz61, and Cz66), high alkalinity (pH > 9) aligns closely with marine-affected sediments, whereas in the coastal area (cores 17-8 and Q7), it occurs in sediments with low EC (Figure 4), suggesting a strong link between desalination and pH elevation. The strong negative pH-EC correlation (R² = 0.69) in marine-affected sediments (cores Qx01, Cz61, Cz66, 17-8, and Q7) contrasts with the weaker correlation (R² = 0.20) in fluvial sediments (cores Dc01 and 16-5) (Figure 5), reflecting that sample pH-EC distributions are primarily governed by the depositional environment (i.e., initial sediment salinity), with desalination leading to increased alkalinity in marine-affected sediments.
In central areas, long-term interactions with meteoric water and groundwater infiltration flush out soluble salts, reducing EC values in marine-affected sediments to very low levels (0.2–0.4 mS·cm⁻¹) and leading to elevated pH. Chen et al. [8] suggested that the removal of marine-derived cations, particularly Ca²⁺, allows residual alkalinity to raise pH. However, considering the well-developed iron staining and reduction streaks in sediments (Figure 2), Fe²⁺ oxidation to Fe³⁺ may also contribute to this pH increase [24].
In the coastal area, the higher sediment EC suggests that lower surface elevations and proximity to the groundwater level enhance evaporation and facilitate significant seawater intrusion, suppressing the effectiveness of leaching and groundwater-driven desalination. However, along desalination drainage pathways (through low-EC horizons in the profile), sediments exhibit markedly elevated pH values (Figure 4). Notably, in coastal core 17-8, high-alkalinity samples deviate significantly from the overall pH-EC relationship (Figure 5), showing the highest pH values in the study area, despite their EC values (0.7–1.1 mS·cm⁻¹) not reaching the low levels as observed in central areas. Although this high alkalinity aligns with the peak pH observed during the weak desalination phase in leaching experiments [9], the mechanisms in natural coastal settings may differ. Unlike the deionized water used in experiments, coastal groundwater, characterized as Cl⁻-Na·Mg due to seawater intrusion [20], suggests that Ca²⁺ removal plays a lesser role in pH elevation during sediment desalination. Instead, under strong evaporation, excess Na⁺ and Mg²⁺ may react (including with HCO₃⁻) to elevate sediment pH. The mechanisms driving pH elevation in coastal areas require further investigation.
5. Conclusions
This study provides new insights into how natural desalination processes shape the geochemical environment of marine-affected sediments along the Western Bohai Sea Coast (WBSC). Through analysis of electrical conductivity (EC) and pH values from seven sediment cores, combined with foraminiferal data, we reconstructed the original salinity conditions and their spatial variability.
Inland marine-affected sediments exhibited very low EC values (0.2–0.4 mS·cm⁻¹), indicating extensive desalination. Conversely, coastal sediments showed higher and more variable EC values (0.67–3.66 mS·cm⁻¹), with a clear decreasing trend toward the 0–1 m elevation zone. This suggests that desalination drainage pathways narrow seaward to the upper intertidal zone.
High alkalinity (pH > 9) in the inland area is closely aligned with the overall extent of marine-affected sediments, while elevated pH values in the coastal sites are found limited in positions of low EC. Although desalination mechanisms may differ with distance from the coastline, the consistent strong link between desalination and pH increase highlights a critical environmental dynamic with implications for soil health, agricultural viability, and ecosystem functioning in coastal regions.
These findings not only deepen our understanding of sediment geochemistry in coastal contexts, but also serve as an essential foundation for future research and management strategies aimed at mitigating salinization impacts in vulnerable coastal regions.
Acknowledgments
The study was supported for design and research by the Major Program of the National Science Foundation of China (Grant No. 42293261) and CGS Project Nos. DD20230091 and DD20211301. The authors are grateful to Dr. Yongsheng Chen, who helped with fieldwork and lab sampling. We greatly appreciate Dr. Wanjun Jiang for his handling and thoughtful suggestions in the mechanisms driving pH elevation discussion part.
References
- Jennerjahn, T. C. Biogeochemical Response of Tropical Coastal Systems to Present and Past Environmental Change. Earth-Sci. Rev. 2012, 114, 19–41. [Google Scholar] [CrossRef]
- Xue, C. Historical Changes in the Yellow River Delta, China. Mar. Geol. 1993, 113, 321–329. [Google Scholar] [CrossRef]
- Wang, F.; et al. The Record of Mid-Holocene Maximum Landward Marine Transgression in the West Coast of Bohai Bay, China. Mar. Geol. 2015, 359, 89–95. [Google Scholar] [CrossRef]
- Wang, H.; Hsieh, Y.P.; Harwell, M.A.; Huang, W. Modeling Soil Salinity Distribution along Topographic Gradients in Tidal Salt Marshes in Atlantic and Gulf Coastal Regions. Ecol. Model. 2007, 201, 429–439. [Google Scholar] [CrossRef]
- Adam, P. (1990). Saltmarsh ecology. Cambridge, UK: Cambridge University Press.
- Sun, Y.; Zhang, X.; Xian, J.; Yang, J.; Chen, X.; Yao, R.; Luo, Y.; Wang, X.; Xie, W.; Cao, D. Saline–Alkaline Characteristics during Desalination Process and Nitrogen Input Regulation in Reclaimed Tidal Flat Soils. Sustainability 2023, 15, 4378. [Google Scholar] [CrossRef]
- Chu, L. , Kang, Y. , & Wan, S. (2014). Influence of microsprinkler irrigation amount on water, soil, and pH profiles in a coastal saline soil. The Scientific World Journal. 2014(1), 279895. [CrossRef] [PubMed]
- Sui, X., Gu, H. J., Jia, M. Q., Liu, C. B., Liu, M. Q., Gao, Z. W., & Zhang, G. G. (2020). Changes in Sediment Properties and the Bacterial Community in Marine Sediments after Entering the Terrestrial Ecosystem in Bohai Bay, Northern China. [CrossRef]
- Chen, W.; Chen, B.; Shen, Q. Studies on the Changes of pH Value and Alkalization of Heavily Saline Soil in Sea Beach during Its Desalting Process. Acta Pedol. Sin. 2000, 37, 521–528. [Google Scholar]
- Wang, F.; et al. Sea Level Change in Bohai Bay. North China Geol. 2024, 47, 1–20. [Google Scholar] [CrossRef]
- Tian, L.; Wang, D.; Pei, Y.; Wang, F.; Li, J.; Shang, Z.; Wang, H. Topographic and Geomorphic Evolution Process in Tianjin Binhai New Area after Middle Holocene. North China Geol. 2011, 1, 53–62. [Google Scholar] [CrossRef]
- Guo, L., Sun, M., Wang, X., Lan, H. (2019). Statistical Analysis of the Characteristics Difference of Rainfall over Bohai Bay and the Land. Climate Change Research Letters.
- An, P.; Li, W.; Li, X.J.; et al. Soil Vegetation Inventory of an Undisturbed Bohai Bay Ecosystem of China. J. Infrastruct. Policy Dev. 2024, 8, 6748. [Google Scholar] [CrossRef]
- Yokoyama, T. Mensuration of Electric Conductivity. In Japan Association for Quaternary Research; University of Tokyo Press: Tokyo, Japan, 1993; Volume 2, pp. 109–118. [Google Scholar]
- Li, W.; Wu, T.; Wang, W.; Guan, J.; Zhai, P. Integrating Non-Planar Metamaterials with Magnetic Absorbing Materials to Yield Ultra-Broadband Microwave Hybrid Absorbers. Appl. Phys. Lett. 2014, 104, 022903. [Google Scholar] [CrossRef]
- Hillel, D. Environmental Soil Physics, 2nd ed.; Academic Press: Cambridge, MA, USA, 1998. [Google Scholar]
- Wang, F.; et al. Holocene Sea-Level Change on the Central Coast of Bohai Bay, China. Earth Surf. Dynam. 2020, 8, 679–693. [Google Scholar] [CrossRef]
- Shen, C.; Zhang, C.; Xin, P.; Kong, J.; Li, L. Salt Dynamics in Coastal Marshes: Formation of Hypersaline Zones. Water Resour. Res. 2018, 54, 3259–3276. [Google Scholar] [CrossRef]
- Yang, J.; Pei, Y.; Tian, L.; Wang, F.; Xiao, G.; Hu, Y.; Xu, Q.; Yuan, H. The Influence of Land Reclamation in Tianjin Binhai New Area on the Environment of Shallow Groundwater in Coastal Lowland. Geol. Bull. China 2016, 35, 1653–1660. [Google Scholar]
- Xiao, G.; Pei, Y.; Yang, J.; Wang, F.; Tian, L.; et al. Environmental Geological Survey and Assessment Report of the Reclaimed Land Area in Binhai New Area, Tianjin; Geological Publishing House: Beijing, China, 2016. [Google Scholar]
- Jourabchi, P.; Van Cappellen, P.; Regnier, P. Quantitative Interpretation of pH Distributions in Aquatic Sediments: A Reaction-Transport Modeling Approach. Am. J. Sci. 2005, 305, 919–956. [Google Scholar] [CrossRef]
- Qi, H. The States of pH, Eh in Surface Sediments of the Yangtze River Estuary and Its Adjacent Areas and Their Controlling Factors. Acta Sedimentol. Sin. 2008, 26, 820–827. [Google Scholar]
- Liu, Y.; Hu, Y.; Gong, Y.; Zheng, Z.; Ding, L.; Li, Y.; Liu, J.; Wang, F. Distribution Patterns and Influencing Factors of Antibiotic Resistance Genes in Sediments from Representative Wetlands in Hebei Province. Chin. J. Eco-Agric. 2025, 33, 1–10. [Google Scholar] [CrossRef]
- Stumm, W.; Morgan, J.J. Aquatic Chemistry: Chemical Equilibria and Rates in Natural Waters, 3rd ed.; John Wiley & Sons: New York, NY, USA, 2012. [Google Scholar]
Figure 1.
Map of the Western Bohai Sea Coast with cores locations and the Holocene marine transgression limit.
Figure 1.
Map of the Western Bohai Sea Coast with cores locations and the Holocene marine transgression limit.
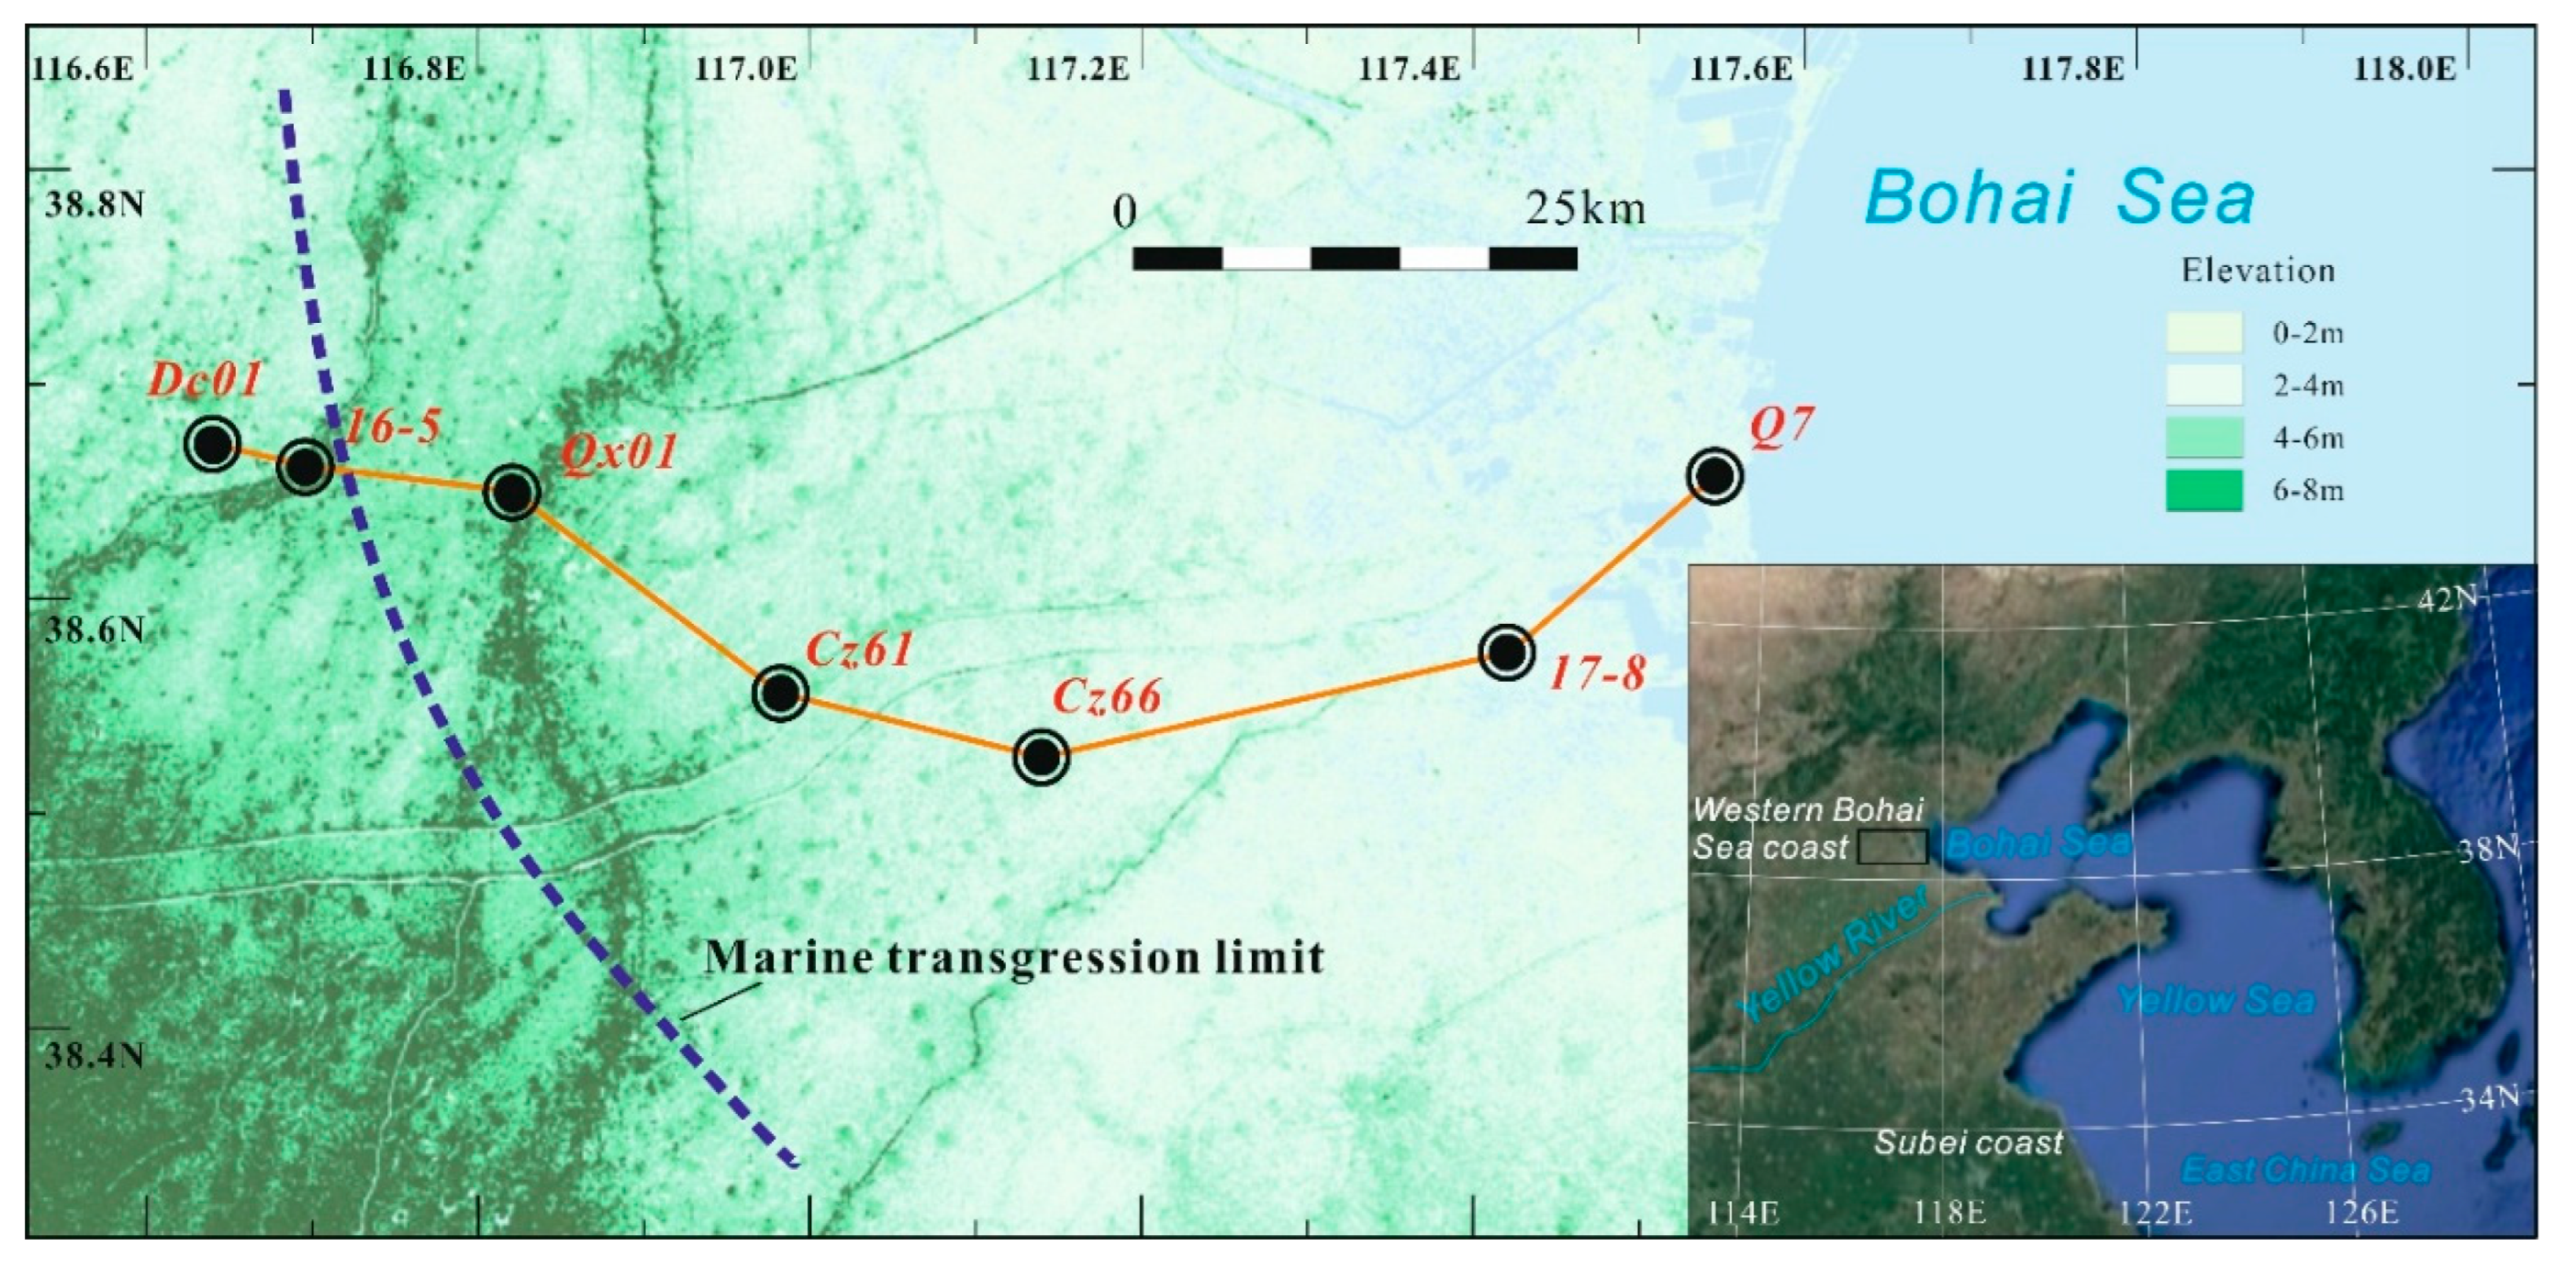
Figure 2.
Seven cores forming a sedimentological profile along the Western Bohai Sea Coast (WBSC), illustrating subsurface characteristics and environmental identification. Foraminiferal abundance is presented on a logarithmic scale for clarity.
Figure 2.
Seven cores forming a sedimentological profile along the Western Bohai Sea Coast (WBSC), illustrating subsurface characteristics and environmental identification. Foraminiferal abundance is presented on a logarithmic scale for clarity.
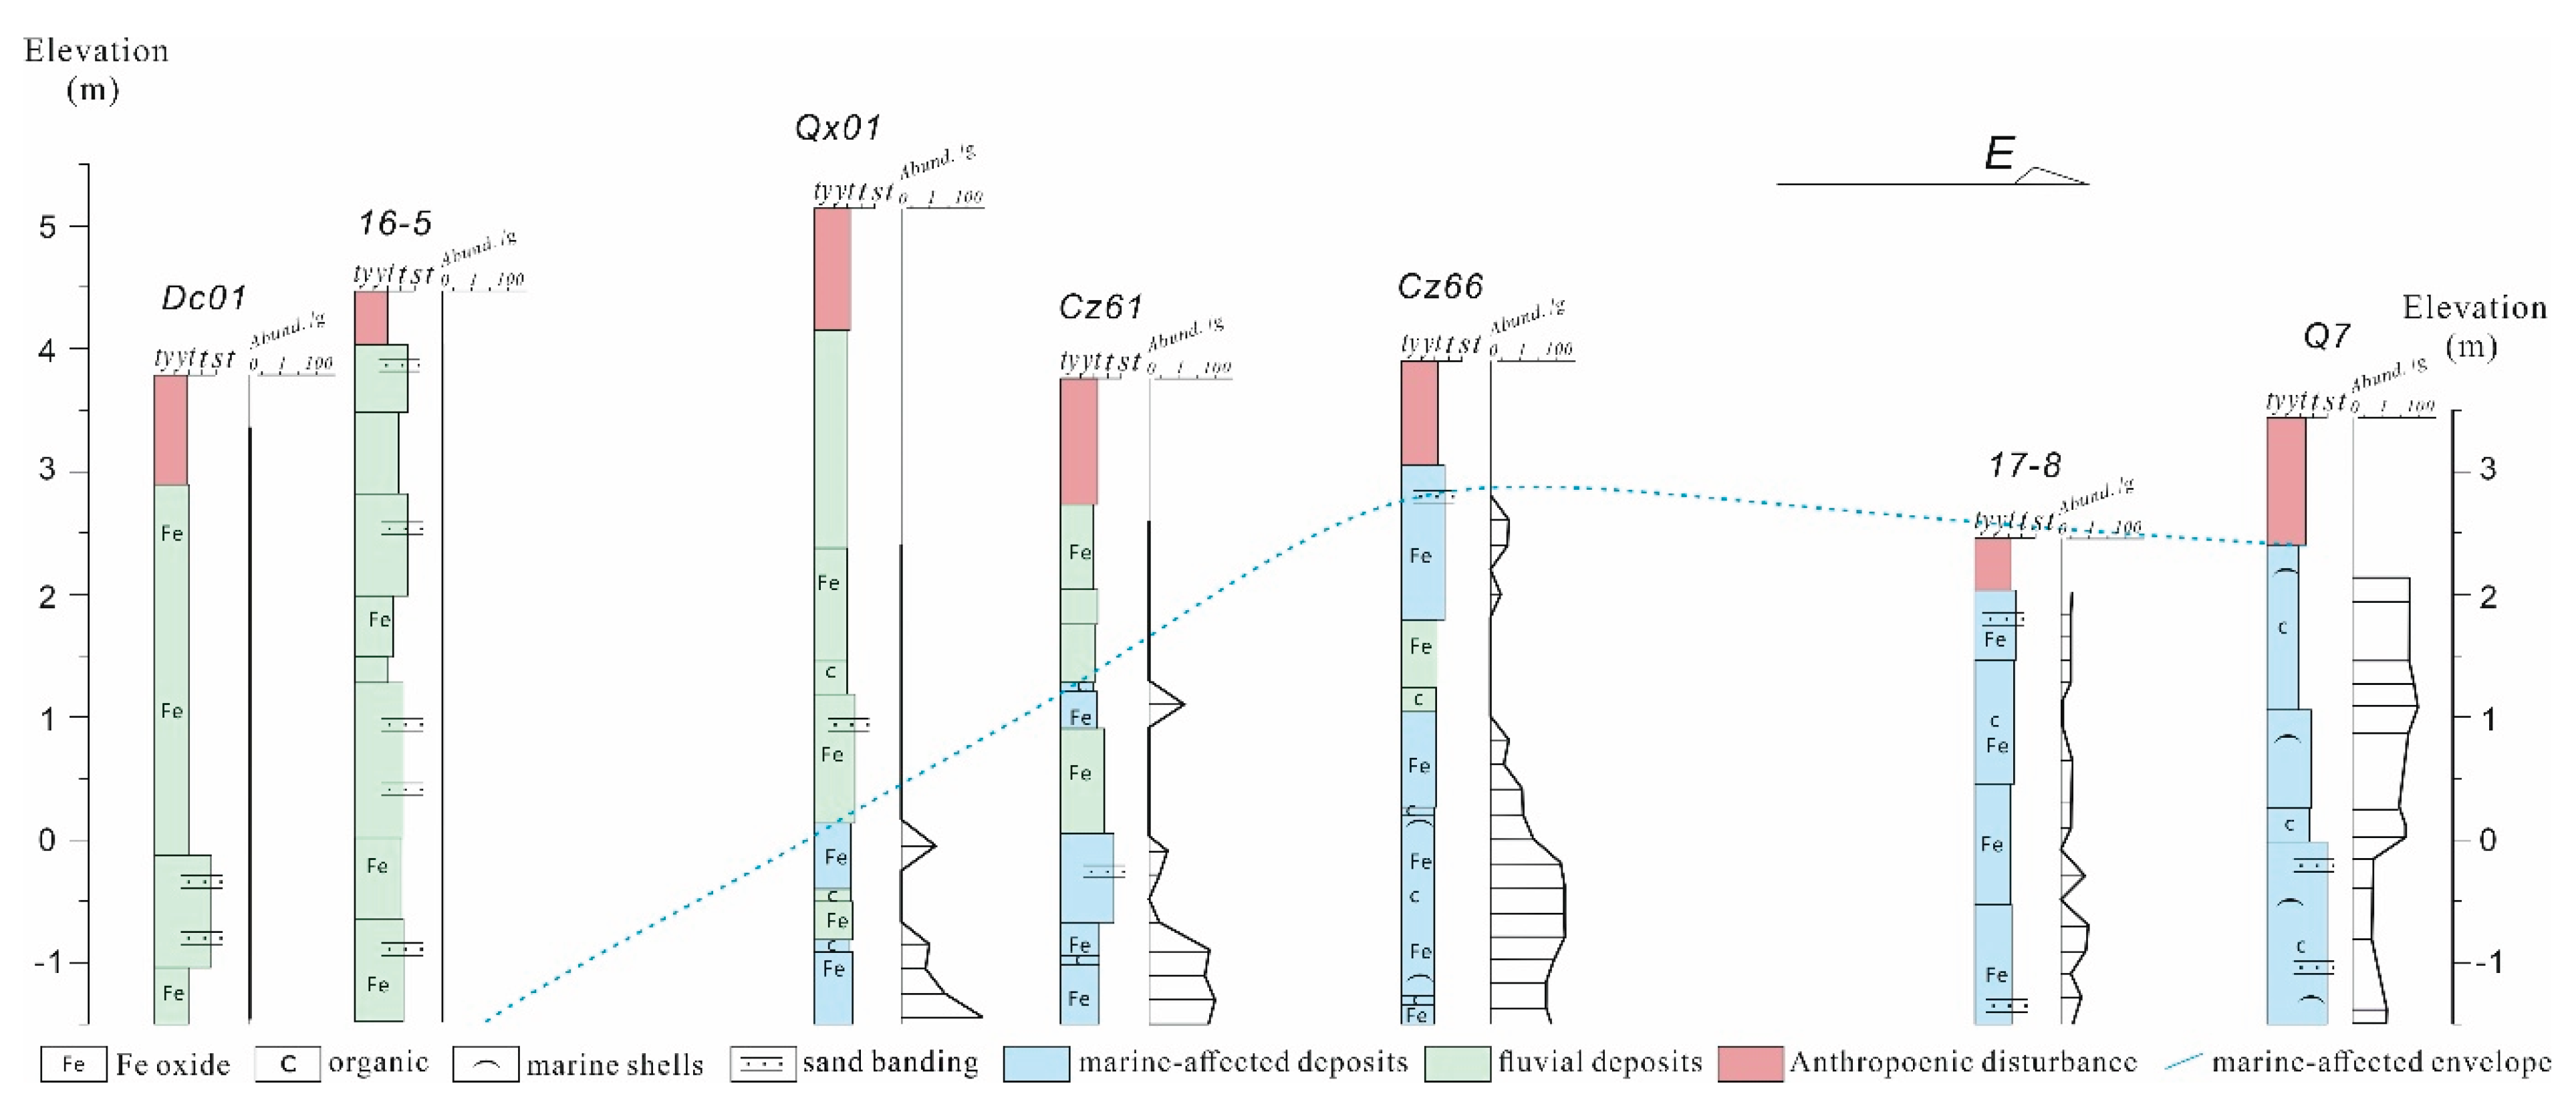
Figure 3.
Spatial variability of EC and its relationship with the sedimentological characteristics of the subsurface sequence.
Figure 3.
Spatial variability of EC and its relationship with the sedimentological characteristics of the subsurface sequence.
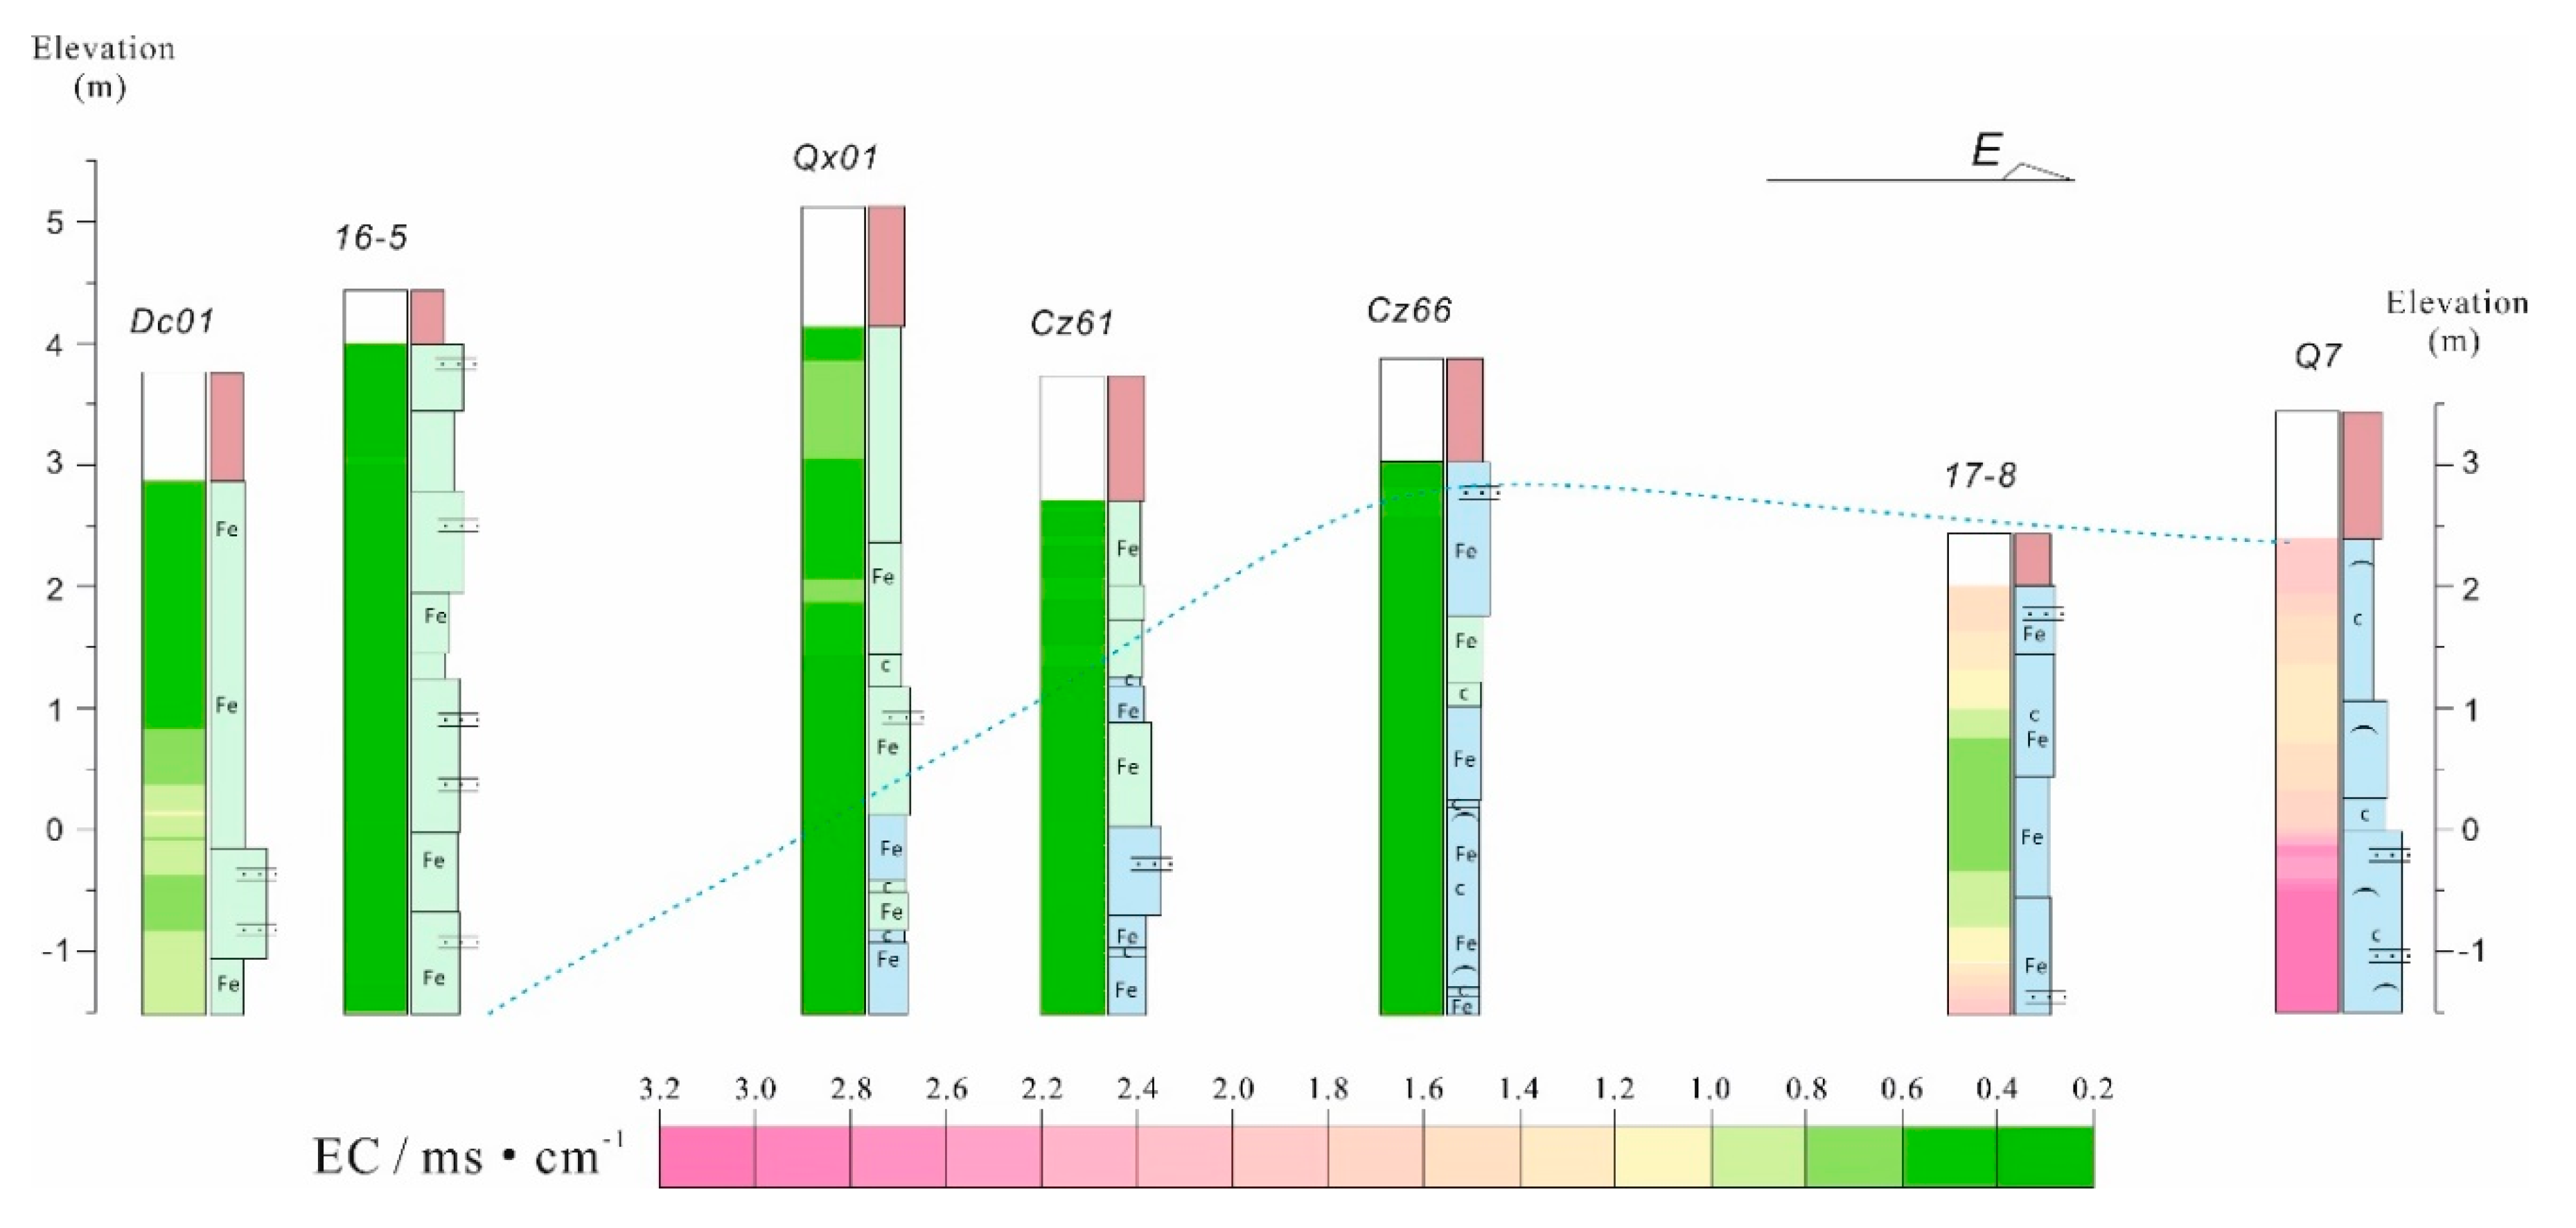
Figure 4.
Spatial variability of pH and its relationship with sedimentological characteristics of the subsurface sequence.
Figure 4.
Spatial variability of pH and its relationship with sedimentological characteristics of the subsurface sequence.
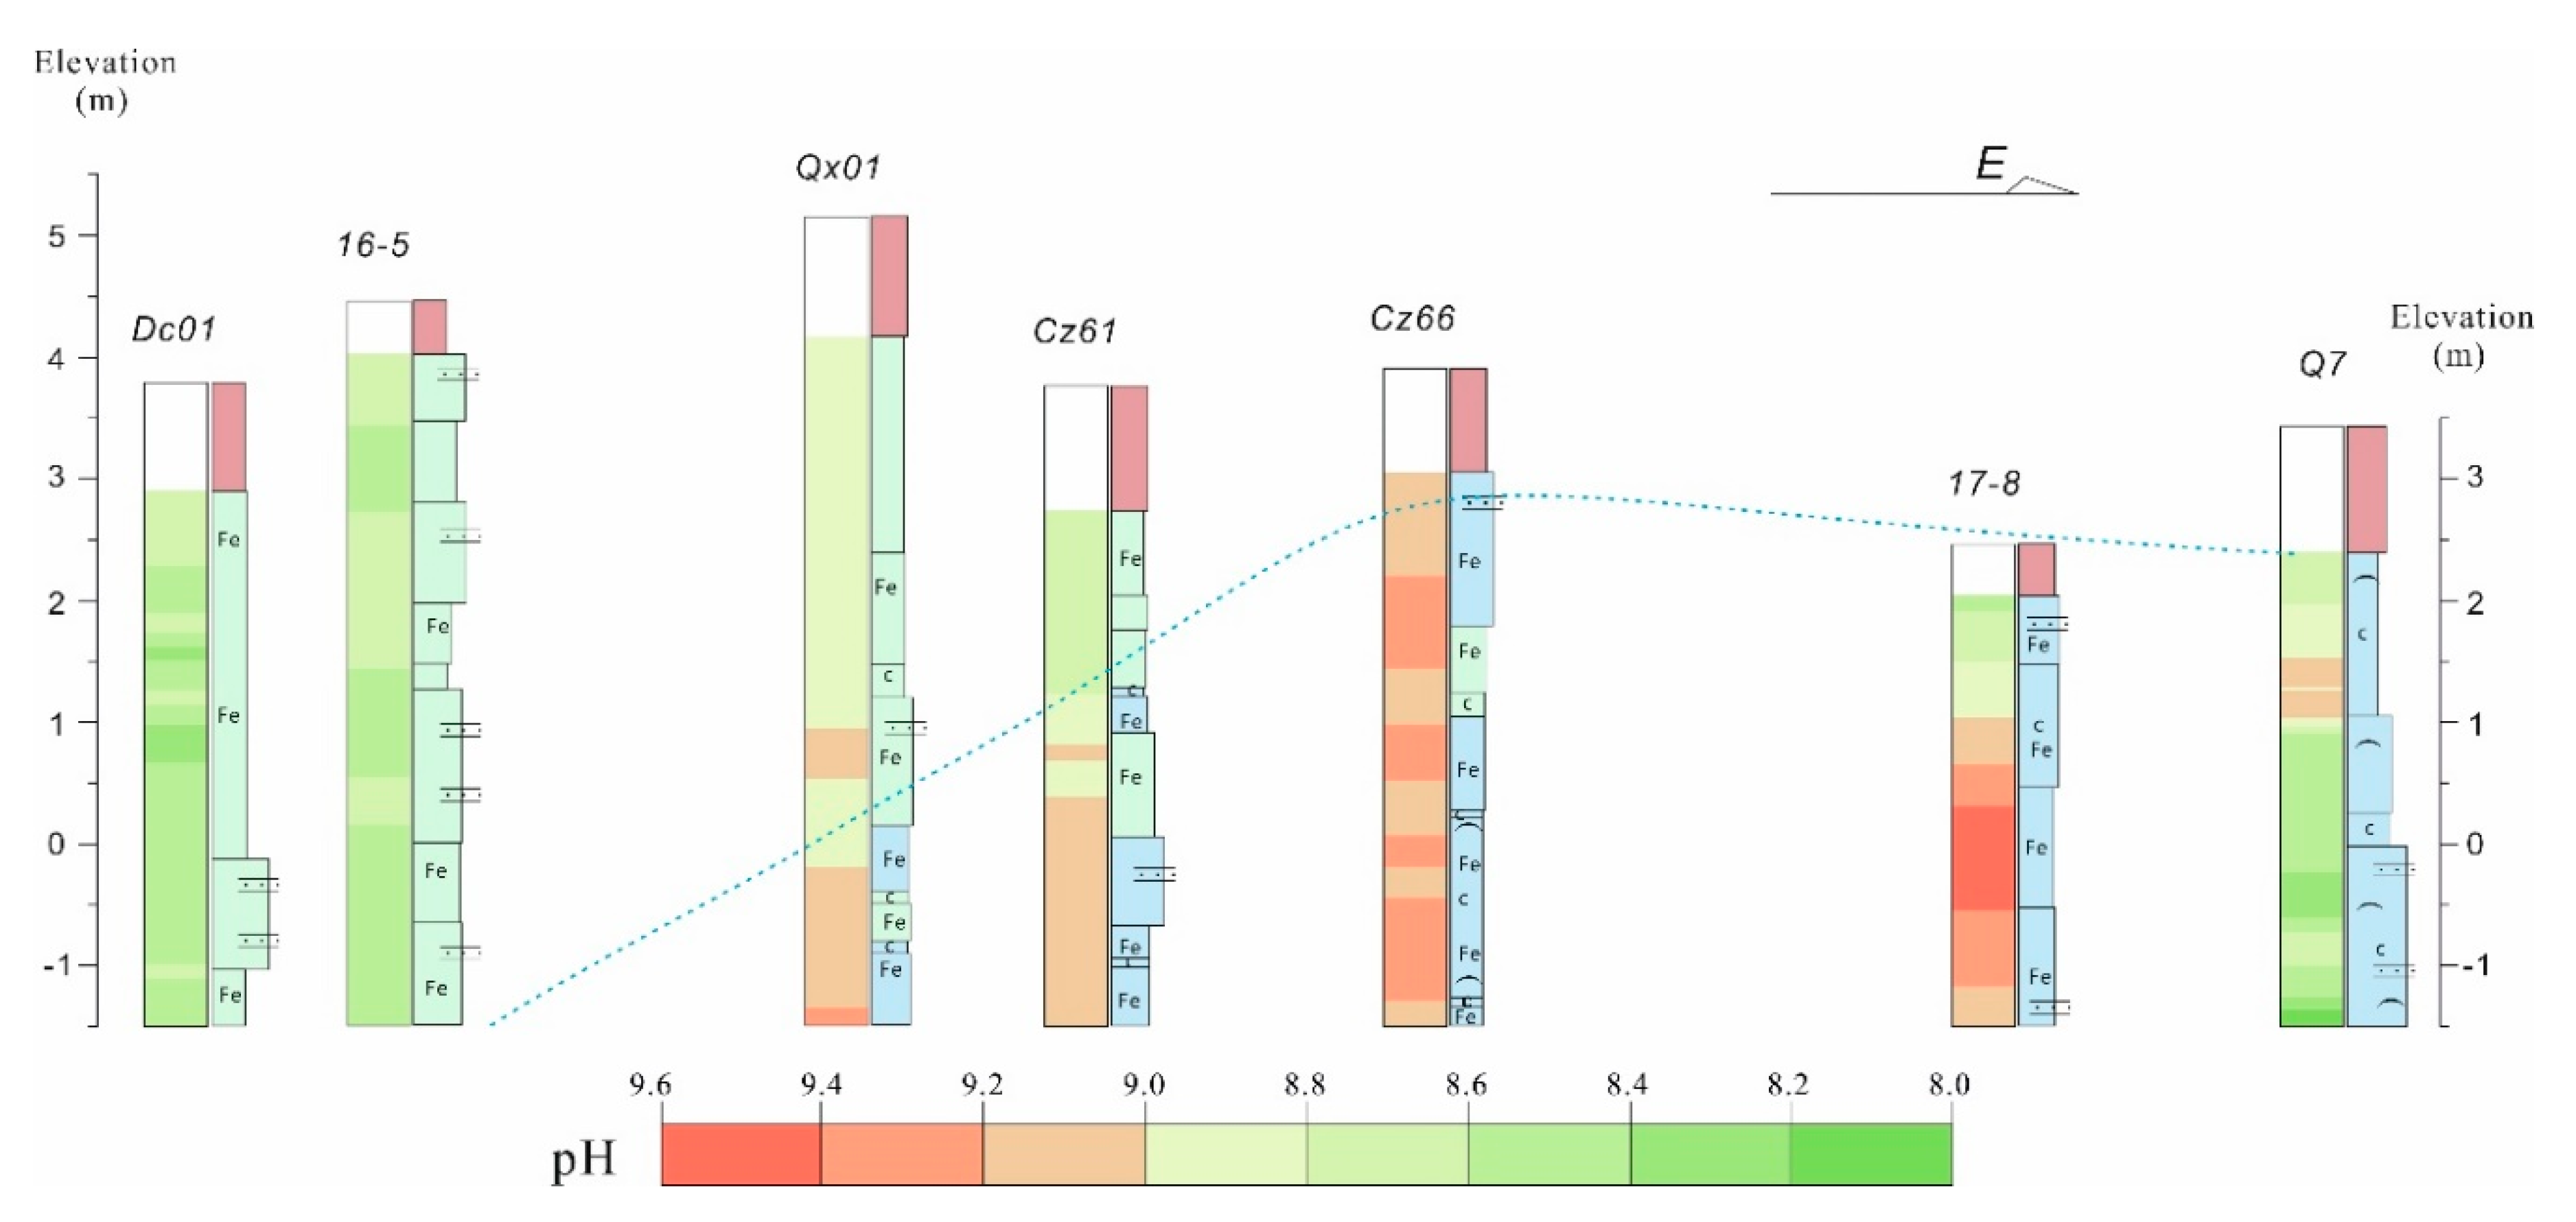
Figure 5.
pH-EC relationship in marine-affected for cores (red) and fluvial (blue) subsurface sediments, with high alkaline samples (pH > 9) highlighted from the central cores Qx01, Cz61, and Cz66, as well as the coastal core 17-8.
Figure 5.
pH-EC relationship in marine-affected for cores (red) and fluvial (blue) subsurface sediments, with high alkaline samples (pH > 9) highlighted from the central cores Qx01, Cz61, and Cz66, as well as the coastal core 17-8.
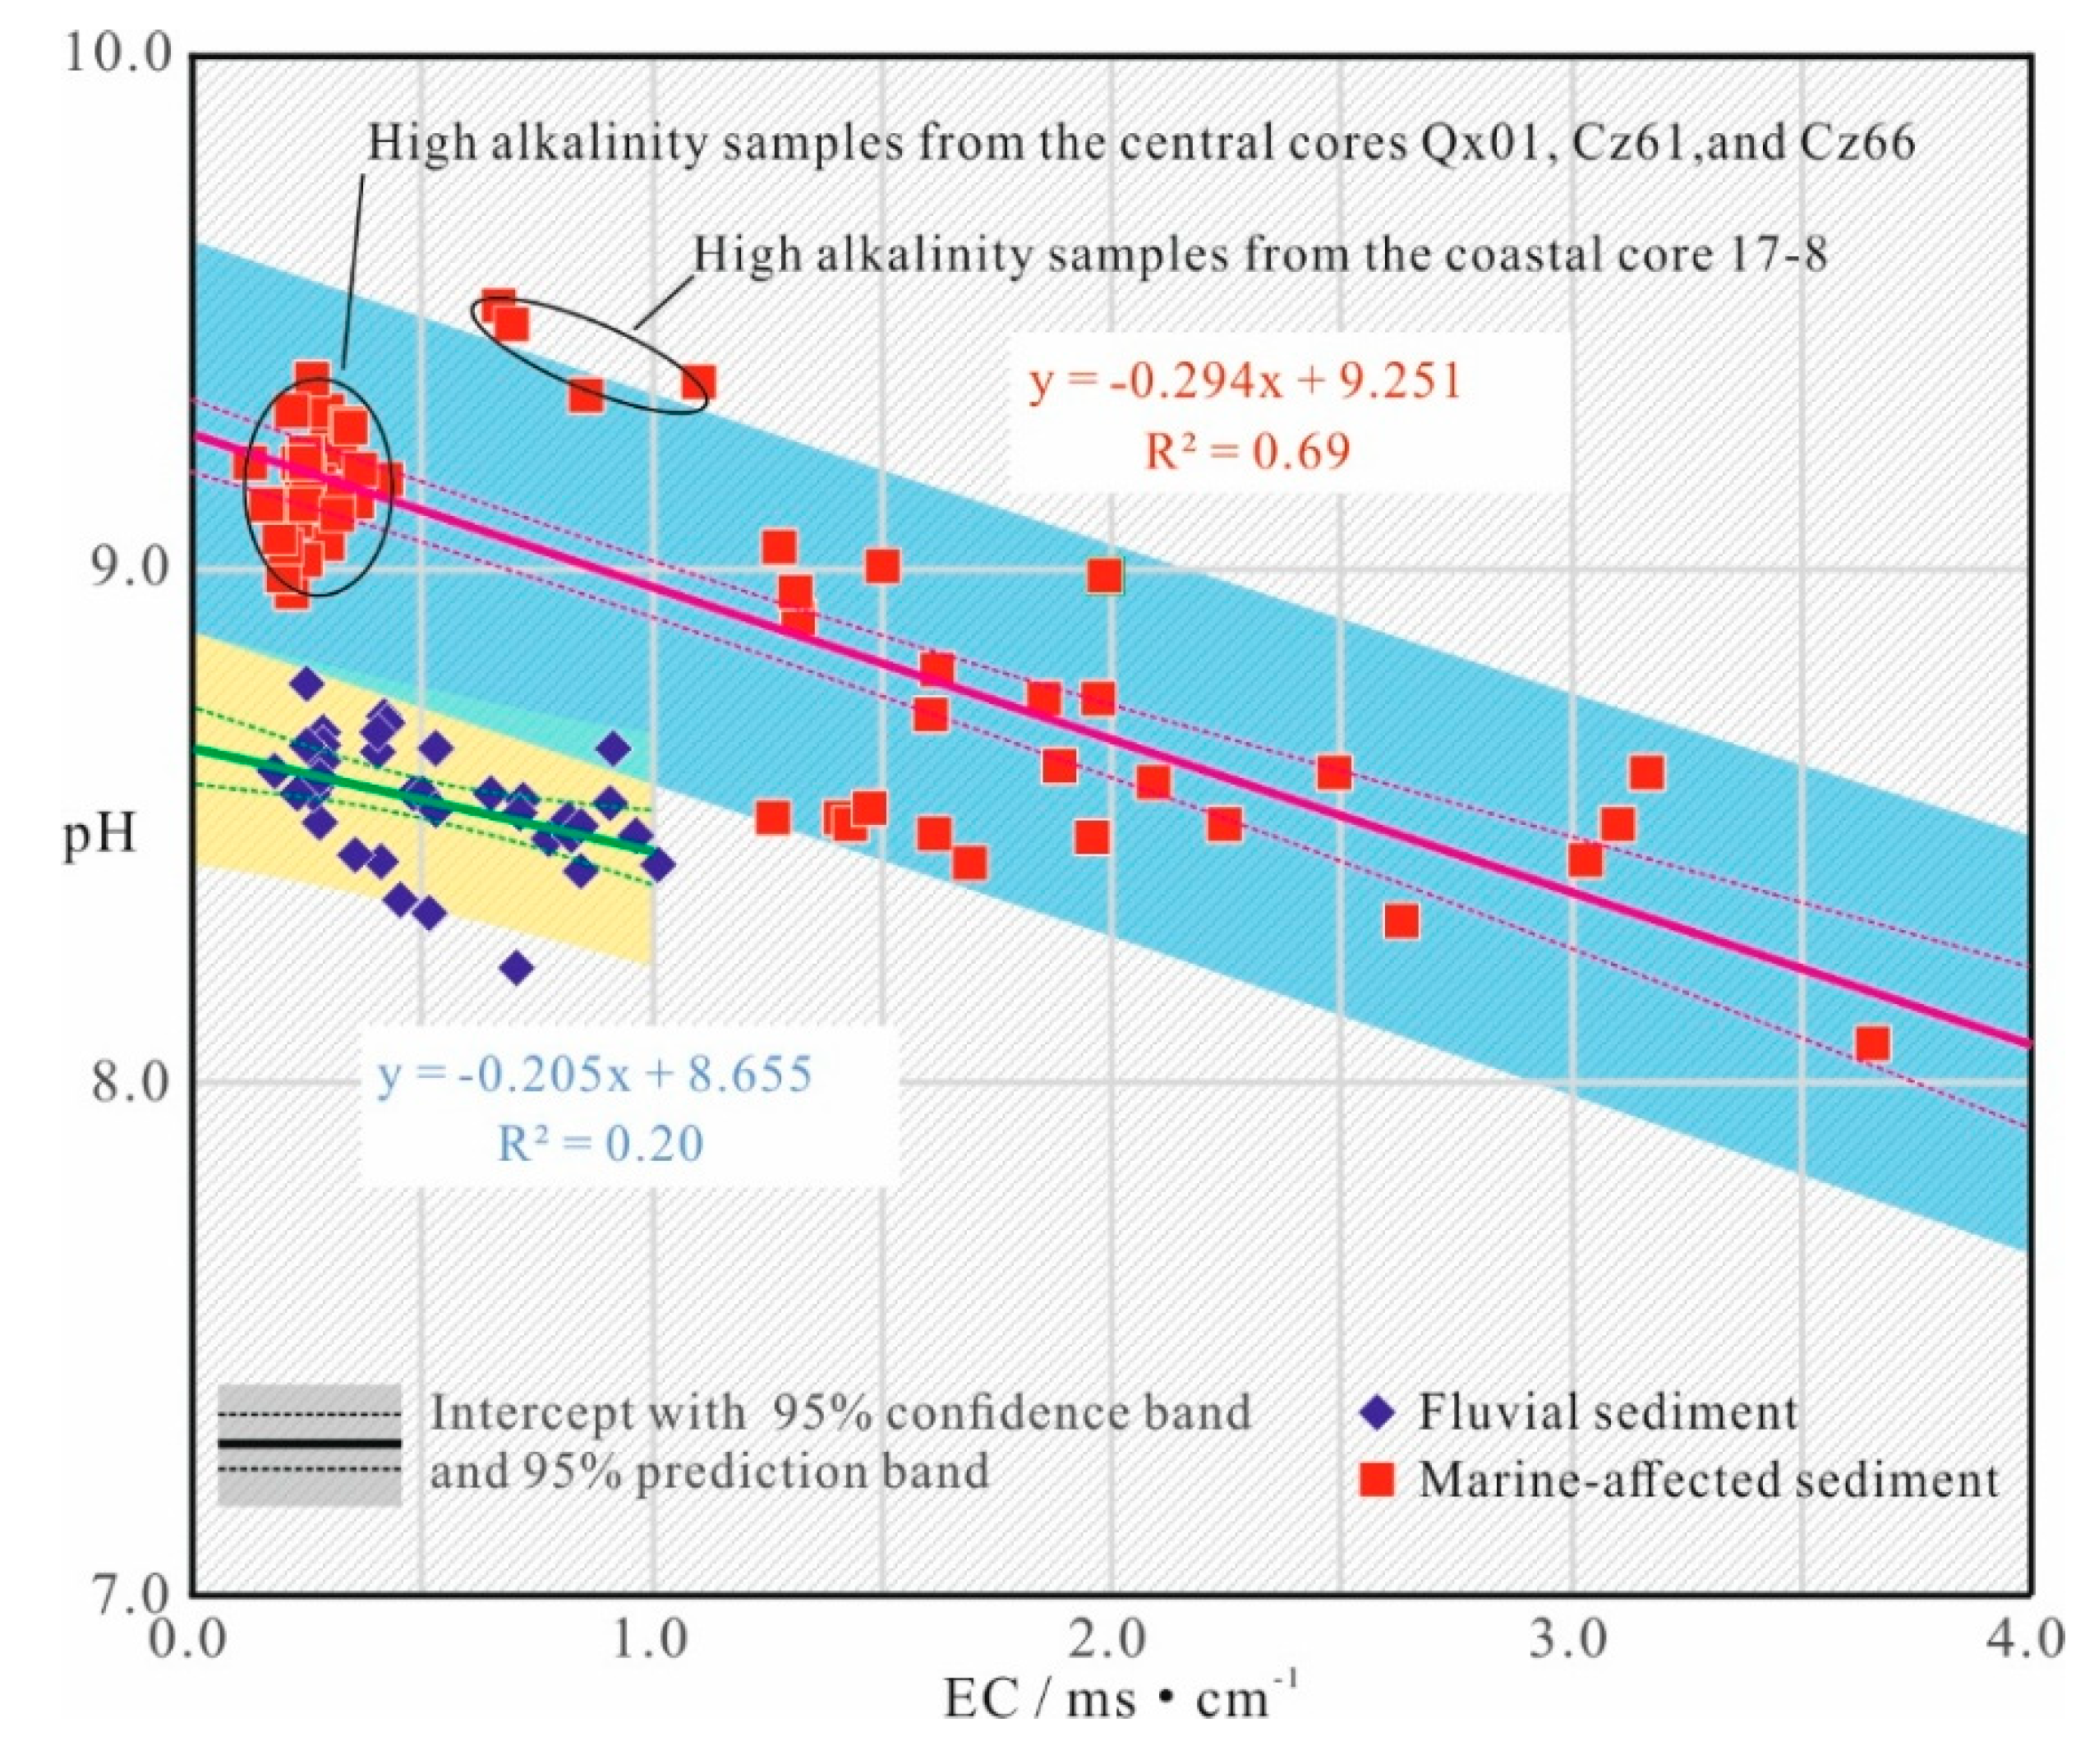

Table 1.
Cores information for this study.
| Core | Sampling site | Position | Elevation / m |
| Dc01 | Agricultural land | E 116.6586°, N 38.6698° | 3.74 |
| 16-5 | Agricultural land | E 116.7150°, N 38.6611° | 4.48 |
| Qx01 | Agricultural land | E 116.8219°, N 38.6485° | 5.16 |
| Cz61 | Factory land | E 116.9866°, N 38.5587° | 3.76 |
| Cz66 | Factory land | E 117.1396°, N 38.5256° | 3.87 |
| 17-8 | Agricultural land close to wetland | E 117.4139°, N 38.5750° | 2.46 |
| Q7 | Riverbank | E 117.5306°, N 38.6574° | 3.46 |
Table 2.
Descriptive statistics of EC for the study area (WBSC) and sediment cores.
| WBSC | Dc01 | 16-5 | Qx01 | Cz61 | Cz66 | 17-8 | Q7 | |
| Min. | 0.13 | 0.40 | 0.18 | 0.23 | 0.13 | 0.23 | 0.67 | 1.27 |
| Max. | 3.66 | 1.02 | 0.41 | 0.67 | 0.45 | 0.43 | 1.99 | 3.66 |
| Mean | 0.69 | 0.67 | 0.28 | 0.44 | 0.29 | 0.31 | 1.20 | 2.07 |
| Standard Error | 0.06 | 0.04 | 0.01 | 0.04 | 0.02 | 0.01 | 0.19 | 0.19 |
| Standard Deviation | 0.69 | 0.20 | 0.05 | 0.14 | 0.09 | 0.06 | 0.50 | 0.78 |
| Variance coefficient (CV) (%) | 99.58 | 30.00 | 19.66 | 32.53 | 32.10 | 20.53 | 41.88 | 37.94 |
Table 3.
Descriptive statistics of pH for the study area (WBSC) and sediment cores.
| WBSC | Dc01 | 16-5 | Qx01 | Cz61 | Cz66 | 17-8 | Q7 | |
| Min. | 8.07 | 8.22 | 8.43 | 8.71 | 8.67 | 8.97 | 8.53 | 8.07 |
| Max. | 9.51 | 8.71 | 8.77 | 9.40 | 9.20 | 9.37 | 9.51 | 9.04 |
| Mean | 8.84 | 8.52 | 8.59 | 8.98 | 8.94 | 9.18 | 9.13 | 8.60 |
| Standard Error | 0.03 | 0.03 | 0.02 | 0.04 | 0.04 | 0.02 | 0.15 | 0.06 |
| Standard Deviation | 0.30 | 0.12 | 0.09 | 0.16 | 0.19 | 0.10 | 0.39 | 0.26 |
| Variance coefficient (CV) (%) | 3.43 | 1.44 | 1.08 | 1.78 | 2.07 | 1.07 | 4.27 | 3.03 |
Disclaimer/Publisher’s Note: The statements, opinions and data contained in all publications are solely those of the individual author(s) and contributor(s) and not of MDPI and/or the editor(s). MDPI and/or the editor(s) disclaim responsibility for any injury to people or property resulting from any ideas, methods, instructions or products referred to in the content. |
© 2025 by the authors. Licensee MDPI, Basel, Switzerland. This article is an open access article distributed under the terms and conditions of the Creative Commons Attribution (CC BY) license (http://creativecommons.org/licenses/by/4.0/).
Copyright: This open access article is published under a Creative Commons CC BY 4.0 license, which permit the free download, distribution, and reuse, provided that the author and preprint are cited in any reuse.


