Submitted:
28 July 2025
Posted:
30 July 2025
You are already at the latest version
Abstract
Energy security benefits the development of biogas and is particularly evident in a context where the energy transition is advancing rapidly. Anaerobically susceptible substrates constitute the raw material to generate energy in a biogas way. To establish the raw mate-rial ratio in the feed is a key factor to make a viable process of Anaerobic Digestion (AD) achieving high biogas yields. This research performed different assays of AD separated in two stages increasing a profitable leguminous (Lupinus Albus) crop (L) and the Olive Mill Wastewater (OMW). The most elevated values of methane yield belonged to assays where the amount of L is higher in the fed mixture (532 L kg VS-1 and 522 L kg VS-1) and the Or-ganic Load Rate (OLR) evaluated is higher (510 L kg VS-1). Also, the presence of OMW in the fed mixture indicates the increase of Volatile Fatty Acids (VFA) concentration because significant differences were found in assays studied. Two kinetic models were fitted to Chemical Oxygen Demand (COD) removal data (Grau Second Order and Modified Stov-er-Kicannon).
Keywords:
two-stage anaerobic digestion
; legume crop
; kinetic model
; volatile fatty acids
; olive mill wastewater
1. Introduction
Currently, biogas and biomethane play a relatively small role in the global energy system. Around 40 billion cubic meters of natural gas equivalent are produced each year, primarily in Europe, the United States, and China. The majority are used to generate heat and electricity locally. Biomethane is growing rapidly, by about 20% annually, but is only equivalent to 0.2% of natural gas demand [1].
Globally, it is estimated that the amount of sustainable natural gas equivalent that could be produced from biogas represents a quarter of current natural gas demand [1]. Most of the biogas potential remains untapped to date: around 5% of the total potential for sustainable biogas and biomethane production is currently being used. The European Union utilizes the largest proportion of its potential, around 40%.
Biogas is produced through the Anaerobic Digestion (AD) biotechnological process in which microorganisms degrade complex organic matter into simpler components under anaerobic conditions. This process has many environmental benefits, such as green energy production, organic waste treatment, environmental protection, and greenhouse gas reduction. It is widely known that the two main species (acidogenic bacteria and methanogenic archaea) in the AD microbial community differ in many aspects, and the optimal conditions for their growth and development are different. For this reason, if anaerobic digestion is carried out in a digester (a single-stage process), the optimal conditions are selected considering the slow growth of methanogens at the expense of rapidly growing acidgens, affecting the efficiency of the entire process. This has led to the development of two-stage AD in recent years, where the processes are split between two digesters, leading to higher energy yields for the two-stage system, compared to the traditional one-stage process where the four steps of AD are carried out simultaneously (hydrolysis, acidogenesis, acetogenesis, methanogenesis) [2,3]. In terms of process technology, the separation of the different stages is achieved by a combination of two reactors. This process provides a more flexible loading operation due to its high biological stability, even when using complex substrates [4].
The competitiveness of biogases can be improved by highlighting the positive externalities of their use. Investing in biogas is more profitable when local economic development is a priority. Furthermore, biogas and biomethane production from some feedstocks can avoid methane emissions. Farm slurry and manure, slurry, stillage, biowaste in landfills, and wastewater are responsible for high levels of anthropogenic methane emissions each year. Capturing a portion of this methane and using it as biogas would avoid methane emissions from agriculture and waste management, as well as emissions from the use of fossil fuels. Concretely, the Extremadura region in Spain has a huge expanse of olive groves that generate 500 million tons of waste [5] through the Olive oil Mill Wastewater (OMW). The degradation of this waste is very difficult to achieve in a single AD process, so different alternatives are necessary to reach adequate treatment. In the first place, the two-stage AD process focuses on the OMW degradation brings great benefits for the difficult degradation of this waste. In the second place, the mixture of different substrates in the process that lead to determination of characteristics that help microorganisms to the degradation of the organic matter. A right balance of nutrients C and N in the mixture of substrates improves the AD process performance. The C/N ratio of OMW is around 40 [6] (values of C/N ratio close to 20-30 are appropriate to remain the AD process out of problems [7], which means that to achieve good stability in the process an adequate balance between C and N has to be found, and for this purpose another by-product must be introduced that acts as a co-substrate increasing the N content. As a substrate rich in N, lupin (L), a leguminous plant belonging to the genus Lupinus, which is part of the spontaneous flora of the Iberian Peninsula, can grow in acid and sandy soils, which are generally poor and of low fertility, although they need a certain depth to allow the development of its taproot, which confers a certain resistance to drought [8]. Due to its high N content as well as the intrinsic properties of the L crop to be able to develop in areas of low fertility, it becomes an excellent substrate to achieve an adequate balance between C and N nutrients. Previous work [7], employing the legume Crotalaria latifolia L. as nitrogen rich biomass to replace animal waste mixture with other substrates providing C reported the maximum methane yield of 494 L kg VS-1 at OLR 1.4 g VS L-1 d-1. This work aims to replace this legume which needs more water for its growth by L that requires few inputs for its development.
The purpose of the present study is to focus on the optimization of the performance of two-stage AD of OMW and L as main substrates offering the evaluation of different assays to introduce both substrates. By investigating these assays, the influence of L and OMW on the methane yield, the kinetic of the processes and the main parameters of the AD process, these research offers the key factors to improve and to be able to set up anaerobic digestion trials using OMW.
2. Materials and Methods
2.1. Substrates Evaluated
The OMW and L used for the assays developed were collected from a factory dedicated to the olive mill waste (Troil Vegas Altas S.C.) and the harvest carried out in the own research center (Center for Scientific and Technological Research of Extremadura), respectively. These wastes have been evaluated mixed with Prickly Pear (PP) collected in the same research center, Rapeseed Oil (RO) extracted from rapeseed harvested in the same place and other legumes (Crotalaria latifolia L.) (L2) from the harvest of the same center too. Vegetable raw materials L and L2 were crushed prior to the silage process for their storage, after the silage vegetable materials were dried at 105 ºC and milled. PP was grinded and stored at -4 ºC before using. OMW did not need any pretreatment and was stored in the same way as PP. The origin of the inoculum for these assays was the digested mixture from the developed studied previously and published by Parralejo et al. [7].
2.2. Experimental Design and Reactor Set-Up
Assays were developed in laboratory digesters of 5 L capacity maintaining a semi-continuous two-stage AD (hydrolytic and methanogenic stages), replacing vegetal biomasses (PP and L2) with a profitable legume (L) and OMW over time. The process was operated at mesophilic temperature (38 ºC) and recirculating a part of the digestate from the second stage to the first stage. The digesters fed was realized dairy and the Organic Load Rate (OLR) researched was 3.2 g VS L-1 d-1 for all assays, except assay 7 which was performed at 3.6 g VS L-1 d-1. The design and the physicochemical composition of the substrates studied were as follows (Table 1).
Similar values for both legume plants are obtained in their C content, however the N content for L is higher than the N content for L2. This difference of values in the N composition for two legumes entails a C/N ratio close to optimum values for two legumes. However, OMW has a C/N ratio raised so L manages to maintain the suitable values of C/N ratio for the mixture of feedstock.
2.3. Analytical Methods
During the performance of the evaluated processes according to APHA Methods [9] pH and redox potential were measured in the digestion medium [9], the Total and Volatile Solids (TS and VS) and the alkalinity. In addition, the concentration of Chemical Oxygen Demand (COD) and the ammonia nitrogen (N-NH4) were determined by EPA monitoring methods [10]. The Total Volatile Fatty Acids (VFA) was analyzed according to Buchauer’s volumetric method [10] and the initial C/N ratio in the substrates was determined using a True-Spec CHN Leco 4084 elementary analyzer (USA), according to the UNE-EN 16948 standard for biomass analysis C, N, H [12]. The volume and composition of the biogas generated was monitored daily according to the procedure reported in the research carried out by Parralejo et al. [13].
2.4. Kinetic Modelling of Substrate Removal
The COD removal on assays carried out at different Hydraulic Retention Time (HRT) and substrate initial composition has been modeled according to Grau second-order multicomponent and Modified Stover-Kicannon models. The initial conditions applied, and the original expressions of the COD removal referred to the two models are detailed in the research developed by Parralejo et al. [13].
Finally, one linear expression for each kinetic model has been employed to obtain the kinetic parameters of available data from anaerobic digestion assays. These expressions are shown below for the Grau Second-Order multicomponent (1) and the Modified Stover-Kicannon (2) models:
where ks is the reaction constant for Grau Second-Order model kB the reaction constant for Modified Stover-Kicannon model, X is the concentration of the microorganisms, which can be assumed as constant, Umax is the maximum substrate removal rate, Se is the substrate concentration at any time, Si is the initial substrate concentration. Experimental results have been fitted to expressions (1) and (2) and the reaction constants have been determined in a different way.
2.5. Data Energy Potential and Statistical Treatment of Results
The determination of the methane energy (E) was calculated as follows below: (expression (3))
E (kJ kg VS-1) = 0.716 g CH4 L-1 * 55.5 kJ gCH4-1 * Methane yield (L kg VS-1)
Tests for statistically significant differences among pH, ammonia nitrogen, alkalinity and VFA parameters of the AD process performance and analysis of variance (ANOVA) at p value of 0.05 were carried out employing the SPSS Statistics 20 software.
3. Results
3.1. Influence of Substrate Composition and OLR in Methane Production
The L proportion (assays 1, 2 and 3) and the OMW proportion (assays 4, 5 and 6) were increased in the feedstock to know the methane yield, as shown in Figure 1. The methane production represented in Figure 1 belongs to the two stages that the AD developed.
In the study of the L proportion influence in the methane yield an increase was reached but was not notable the difference achieved. However, when the OMW was included in the feedstock, Figure 1 shows the most elevated values in the assay 5 (467 L kg VS-1), with a feedstock composed of PP, L and OMW.
L increased in the composition of the feedstock assays developed because it is cheaper to produce than L2. As can be observed in Figure 1 and Table 2 higher methane yields are obtained when L is used in a higher proportion of the feedstock (assays 2 and 3). Also, OMW contributes to increasing the methane yield when the OLR rises.
A comparison between methane evolution from assays 6 and 7 (Figure 2) was carried out to evaluate the OLR employed in the feed, keeping a proportion 40:60% (on VS basis) L : OMW, respectively. Figure 1 and Figure 2 indicate that the methane yield obtained was higher when the OLR was raised. In the methane evolution different behavior was observed along the assays 6 and 7. It suggests that the increase in the amount fed seems to help microorganisms degrade the organic matter in a two-stage AD process. Ribeiro et al. [14] showed values of methane yield of 270 L kg COD-1 and 307 L kg VS-1 at 6 kg COD m-3 d-1 and 9 kg COD m-3 d-1. When the OLR values up, the methane yields obtained did not follow the same trend. However, De La Lama et al. [15] noticed that the maximum methane production rate was achieved when the OLR studied was 4.5 g VS L-1 d-1 of a OLR evaluated ranging from 2-7 g VS L-1 d-1.
A summary of performance in two-stages AD processes is detailed in Table 2. It can be observed that the highest methane yields belong to the assays 2, 3 and 7 where the L proportion (assays 2 and 3) and OLR (assay 7) were increased. However, the COD removal calculated was not according to the trend that happened with the methane yields. Higher values of COD removal for assays without OMW (assays 1, 2 and 3) seem to indicate that the organic matter degradation was more elevated than the degradation in assays with OMW (assays 4 to 7).
Methane concentration showed a sharp rise when the OMW was introduced in the fed mixture (assays 4 to 7) in stage 1 mainly. It suggests that the adaptation of the methanogenic microorganisms for the first stage was increasing as the AD process progressed and the OMW amount was higher. It can be due to the recirculation of substrate between the two phases.
Usmanbaha et al. [16] reported values ranged 65-70% for methane concentration in the second stage and HRT of 52 days for co-digestion of palm oil mill effluent and Ceratophyllum demersum, values close to several assays studied in this research. In addition, methane energy yield (or methane energy potential) determined located between 14 to 21 kJ g VS-1 (or 182-282 kJ d-1) was very similar to other authors. Devens et al. [17] studied a comparative analysis of the performance between two-stage and single-stage for cassava processing wastewater and glycerol and the values obtained in the energy potential methane ranged 111-152 kJ d-1 in the best assays developed for two-stage processes, lower than values obtained in this research. Other authors obtained values very similar to those values presented in this work, such as Ribeiro et al. [14] reported values ranging from 115-235 kJ d-1 in the two-stage AD of sugarcane waste varying the OLR.
3.2. Kinetic Evaluation of Substrate Removal
Different kinetic parameters have been obtained from experimental data fitted to the two models detailed above. All kinetic parameters shown in Table 3 indicate the speed at which COD is removed in this case researched. Two groups have been established to evaluate the influence of OMW on the feedstock for the process kinetics. Group I is composed of three assays without OMW (assays 1, 2 and 3) and group II is integrated by three assays with OMW (assays 4, 5 and 6). Results from all these assays studied were adjusted to Grau Second Order and Modified Stover-Kicannon models by plotting the expressions (1) and (2). Kinetic constants for Grau Second-Order Multicomponent (ks) and Modified Stover-Kicannon (kB) models have been determined by the interpretation of the straight line and the slope of the straight line, respectively.
The kinetic results for COD removal show (Table 3 and Figure 3) that the Grau Second-Order Multicomponent fits the data well with high R2 values of 0.983 and 0.955 for the two groups evaluated. Other authors have carried out kinetic adjustment in their experimental data, achieving regression coefficients of 0.94 or 0.96 employing different kinds of reactors treating pulp and paper mills [18]. However, the Modified Stover-Kicannon model is appropriate for predicting the Group of assays I but not the Group II obtaining regression values of 0.997 and 0.411, respectively.
According Grau Second-Order model the higher values of ks for Group I suggest that the biodegradability of the mixture of substrates without OMW is better than the mixture of substrates with OMW. Nevertheless, KB obtained for Group II according Grau Second-Order Multicomponent is higher than values obtained by De La Lama et al. [15] that reported values of 0.25 g COD L-1 d-1 employing “alperujo” in semi-continuous anaerobic digestion of thermally pretreated. Rizzioli et al. [19] developed the anaerobic digestion process to prickly pear and they reached values of 67.64 g VS L-1 d-1 according to the Modified Stover-Kicannon model. If the value of KB for Group I (feedstock composed majorly by prickly pear) is calculated in the same units, it represents a very low value, 1.09 g VS L-1 d-1. Probably, it can be due to the presence of other lignocellulosic substrates in the mixture such as legumes or rapeseed oil, substrates slower to degrade. Other work by Parralejo et al. [20] reports values ranged 4.33-4.98 g COD L-1 d-1 in the kinetic modelling (Modified Stover-Kicannon model) of experimental results from semicontinuous trials of pepper waste with pig manure, lower than values presented in this work. The difference between this last study and the present work can be due to a difference in the methane yields, 139-160 L kg VS-1 by Parralejo et al. versus 487-532 L kg VS-1.
3.3. Interactions of Parameters Measured in the Process
Figure 4 shows the interaction of pH, alkalinity, ammonia nitrogen and VFA for the different assays carried out. An increase is presented in the pH values as the L substrate is introduced in larger quantities in the mixture fed to the digestor. Likewise, the OMW causes the same effect on the pH parameter because it raises for assays 4, 5 and 6. A similar trend is observed for the alkalinity values, they were progressively rising as L and OMW substrates were introduced in the feedstock. It is a consequence of the pH increase because the alkalinity measures the buffer power of the digestion medium through the chemical equilibrium carbon dioxide-bicarbonate [21]. Regarding the ammonia nitrogen and VFA there were clear differences between assays carried out without OMW (lower values of ammonia nitrogen) and OMW (higher values of ammonia nitrogen). Low values of ammonia nitrogen (1913-4790 mg L-1) and VFA (1275-2747 mg L-1) concentrations were found in the research carried out by Parralejo et al. [13] when the presence of vegetable substrates in the employed feedstock was predominant. In any case, the values represented in Figure 3 were far from the threshold values that can inhibit the AD process (above 8000 mg L-1) for VFA concentrations [22] and 4000 mg L-1 in the ammonia nitrogen content according to Parralejo et al. [20].
The VFA parameter was significantly different for assays 1, 2, and 3 (p<0.05) from that assay 5 and the 4, 6 and 7 assays (Table 4). It seems to indicate that the presence of OMW in the feedstock increases the VFA concentration of the digestion medium, therefore a two-stage AD is a suitable process to treat this kind of OMW. pH, ammonia nitrogen and alkalinity did not present homogeneity of variances according to Leven statistics, so the ANOVA statistical analysis was not realized.
4. Conclusions
The research demonstrates a positive influence of the increase of L in the feedstock and the rise of the OLR on the methane yield achieving the most elevated values in the assays 2, 3 and 7 with values of 532 L kg VS-1, 522 L kg VS-1 and 510 L kg VS-1, respectively. These methane yields belong to methane energy potential ranging between 182-282 kJ d-1 close to values reported by other authors. The kinetic results of COD removal to Grau Second Order Multicomponent reported an excellent regression coefficient in all assays studied while the Modified Stover-Kicannon presented a right fit for the assays without OMW in their fed mixture. A significant difference was found in the VFA parameter in the performance of the process. Further work regarding two-stage AD optimization of the OMW is suggested for more elevate OLR and the evaluation in a pilot plant to enhance the methane energy potential.
Acknowledgments
The authors are grateful to the funding support by European Regional Development Fund (ERDF) Operational Programme for Extremadura 2020-2025, concretely as a part of projects from Counseling of Education, Science and Vocational Training from Junta of Extremadura, “Mejora de la competitividad y sostenibilidad agroganadera mediante estrategias circulares de valorización de subproductos y producciones de Calidad diferenciada” (SMARTCIRCLE).
References
- Outlook for Biogas and Biomethane. A global geospatial assessment. World Energy Outlook Special Report. 2025. International Energy Agency. www.iea.org.
- Simeonov I., Chorukva E., Kabainova L. (2025). Two-stage anaerobic digestion for green energy production: A review. Processes. [CrossRef]
- Nabaterega R., Kumar V., Khloei S. Eskicioglu C. (2021). A review on two-stage anaerobic digestion options for optimizing municipal wastewater sludge treatment process. Journal of Environmental Chemical Engineering. [CrossRef]
- Holl E., Steinbrenner J., Merkel W., Krümpel J., Lansing S., Baier U., Oeschner H., Lemmer A. (2022). Two-stage anaerobic digestion: State of technology and perspective roles in future energy systems. Bioresource Technology. [CrossRef]
- Sánchez-Mohino F. Innovación y sostenibilidad: análisis de los subproductos del aceite de oliva y su aprovechamiento. Innovación y sostenibilidad en el sector oleícola. español. Universidad Pontificia Comillas, Facultad de Ciencias Económicas y Empresariales. 2021; España.
- Parralejo A.I., Royano L., González J., González J.F. (2019). Small scale biogas production with animal excrement and agricultural residues. Industrial Crops & Products. [CrossRef]
- Parralejo A.I., Royano L., Cabanillas J., González J. (2022). Biogas from Nitrogen-Rich Biomass as an Alternative to Animal Manure Co-substrate in Anaerobic Co-Digestion Processes. Energies. [CrossRef]
- González F., Gil A., Llera F., González J.A., Maya V. Catálogo de variedades de semillas obtenidas en el Centro de Investigación La Orden-Valdesequera del Gobierno de Extremadura, Ed. Centro de Investigaciones La Orden-Valdesequera, 2012; Extremadura, Spain.
- APHA, American Public Health Association. Standard Methods for Examination of Water and Wastewater, twenty second ed. 2012; Washington DC.
- Environmental Protection Agency. Environmental Monitoring and Support Laboratory. Methods for Chemical Analysis of Water and Wastes. 1983; EPA-600/4-79-020. U.S.A.
- Buchauer K. Titrations verfahren in der Abwasserund Schlam-manalytik zur Bestimmung von flüchtigen organischen Säuren. Das Gas- und Wasserfach (gfw). Wasser Abwasser. 1997; 138 (6), 313-320.
- Norma UNE-EN 16948. (2015). Biocombustibles sólidos, Determinación de contenido total de C, H y N. Método instrumental.
- Parralejo A.I., González J., Royano L., González J.F. (2025). Optimizing Anaerobic Co-Digestion Formula of Agro-Industrial Wastes in Semi-Continuous Regime. Energies. [CrossRef]
- Ribeiro A.R., Devens K.U., Camargo F.P., Sakamoto I.K., Varesche M.B.A., Silva E.L. (2024). Synergizing sugarcane waste valorization: Optimization of two-stage anaerobic co-digestion for enhanced methane recovery and organic matter removal. Industrial Crops&Products. [CrossRef]
- De la Lama C., Borja R., Rincón B. (2017). Performance evaluation and substrate removal kinetics in the semi-continuous anaerobic digestion of thermally pretreated two phase olive pomace or “Alperujo”. Process safety and Environmental Protection. [CrossRef]
- Usmanbaha N., Sani K., Jariyaboon R., Raketh M., O-Thong S., Kongjan P. (2025). Co-digestion of palm oil mill effluent and Ceratophyllum demersum in a two-stage anaerobic bioreactor to recover gaseous biofuel. International Journal of Hydrogen Energy. [CrossRef]
- Devens K.U, Ribeiro A.R., Camargo F.P., Sakamoto I.K., Varesche M.B.A., Silva E.L. (2025). Two-stage versus single-stage anaerobic co-digestion on methane synthesis: Energy prospects and microbial community. Process Safety and Environmental Protection. [CrossRef]
- Vaghamshi N., Reddy M.N., Shah K., Duggirala S.M., Dudhagara P. (2025). Aerobic and anaerobic integrated treatment using microbial biofilm to improve the quality of the paper mills effluents: A reactor-based study. Journal of Hazardous Materials Advances. [CrossRef]
- Rizzioli F., Magonara C., Mengoli G., Bolzonella D., Battista F. (2024). Production, purification and recovery of caproica cid, Volatile fatty acids and methane from Opuntia ficus indica. Renewable and Sustainable Energy Reviews. [CrossRef]
- Parralejo A.I., Royano L., Cabanillas J., Gonzalez J. (2023). Pretreatment and Nanoparticles as Catalysts for Biogas Production Reactions in Pepper Waste and Pig Manure. Catalysts. [CrossRef]
- Somridhivej B., Boyd C.E. (2016). An assessment of factors affecting the reliability of total alkalinity measurements. Aquaculture. [CrossRef]
- Canaver D.F., Varella R., Maintinguer S.I. (2025). Maximizing biogas production from expired dairy products: A two-stage anaerobic digestion approach. International Journal of Hydrogen Energy. [CrossRef]
Figure 1.
Methane yield obtained in different assays developed.
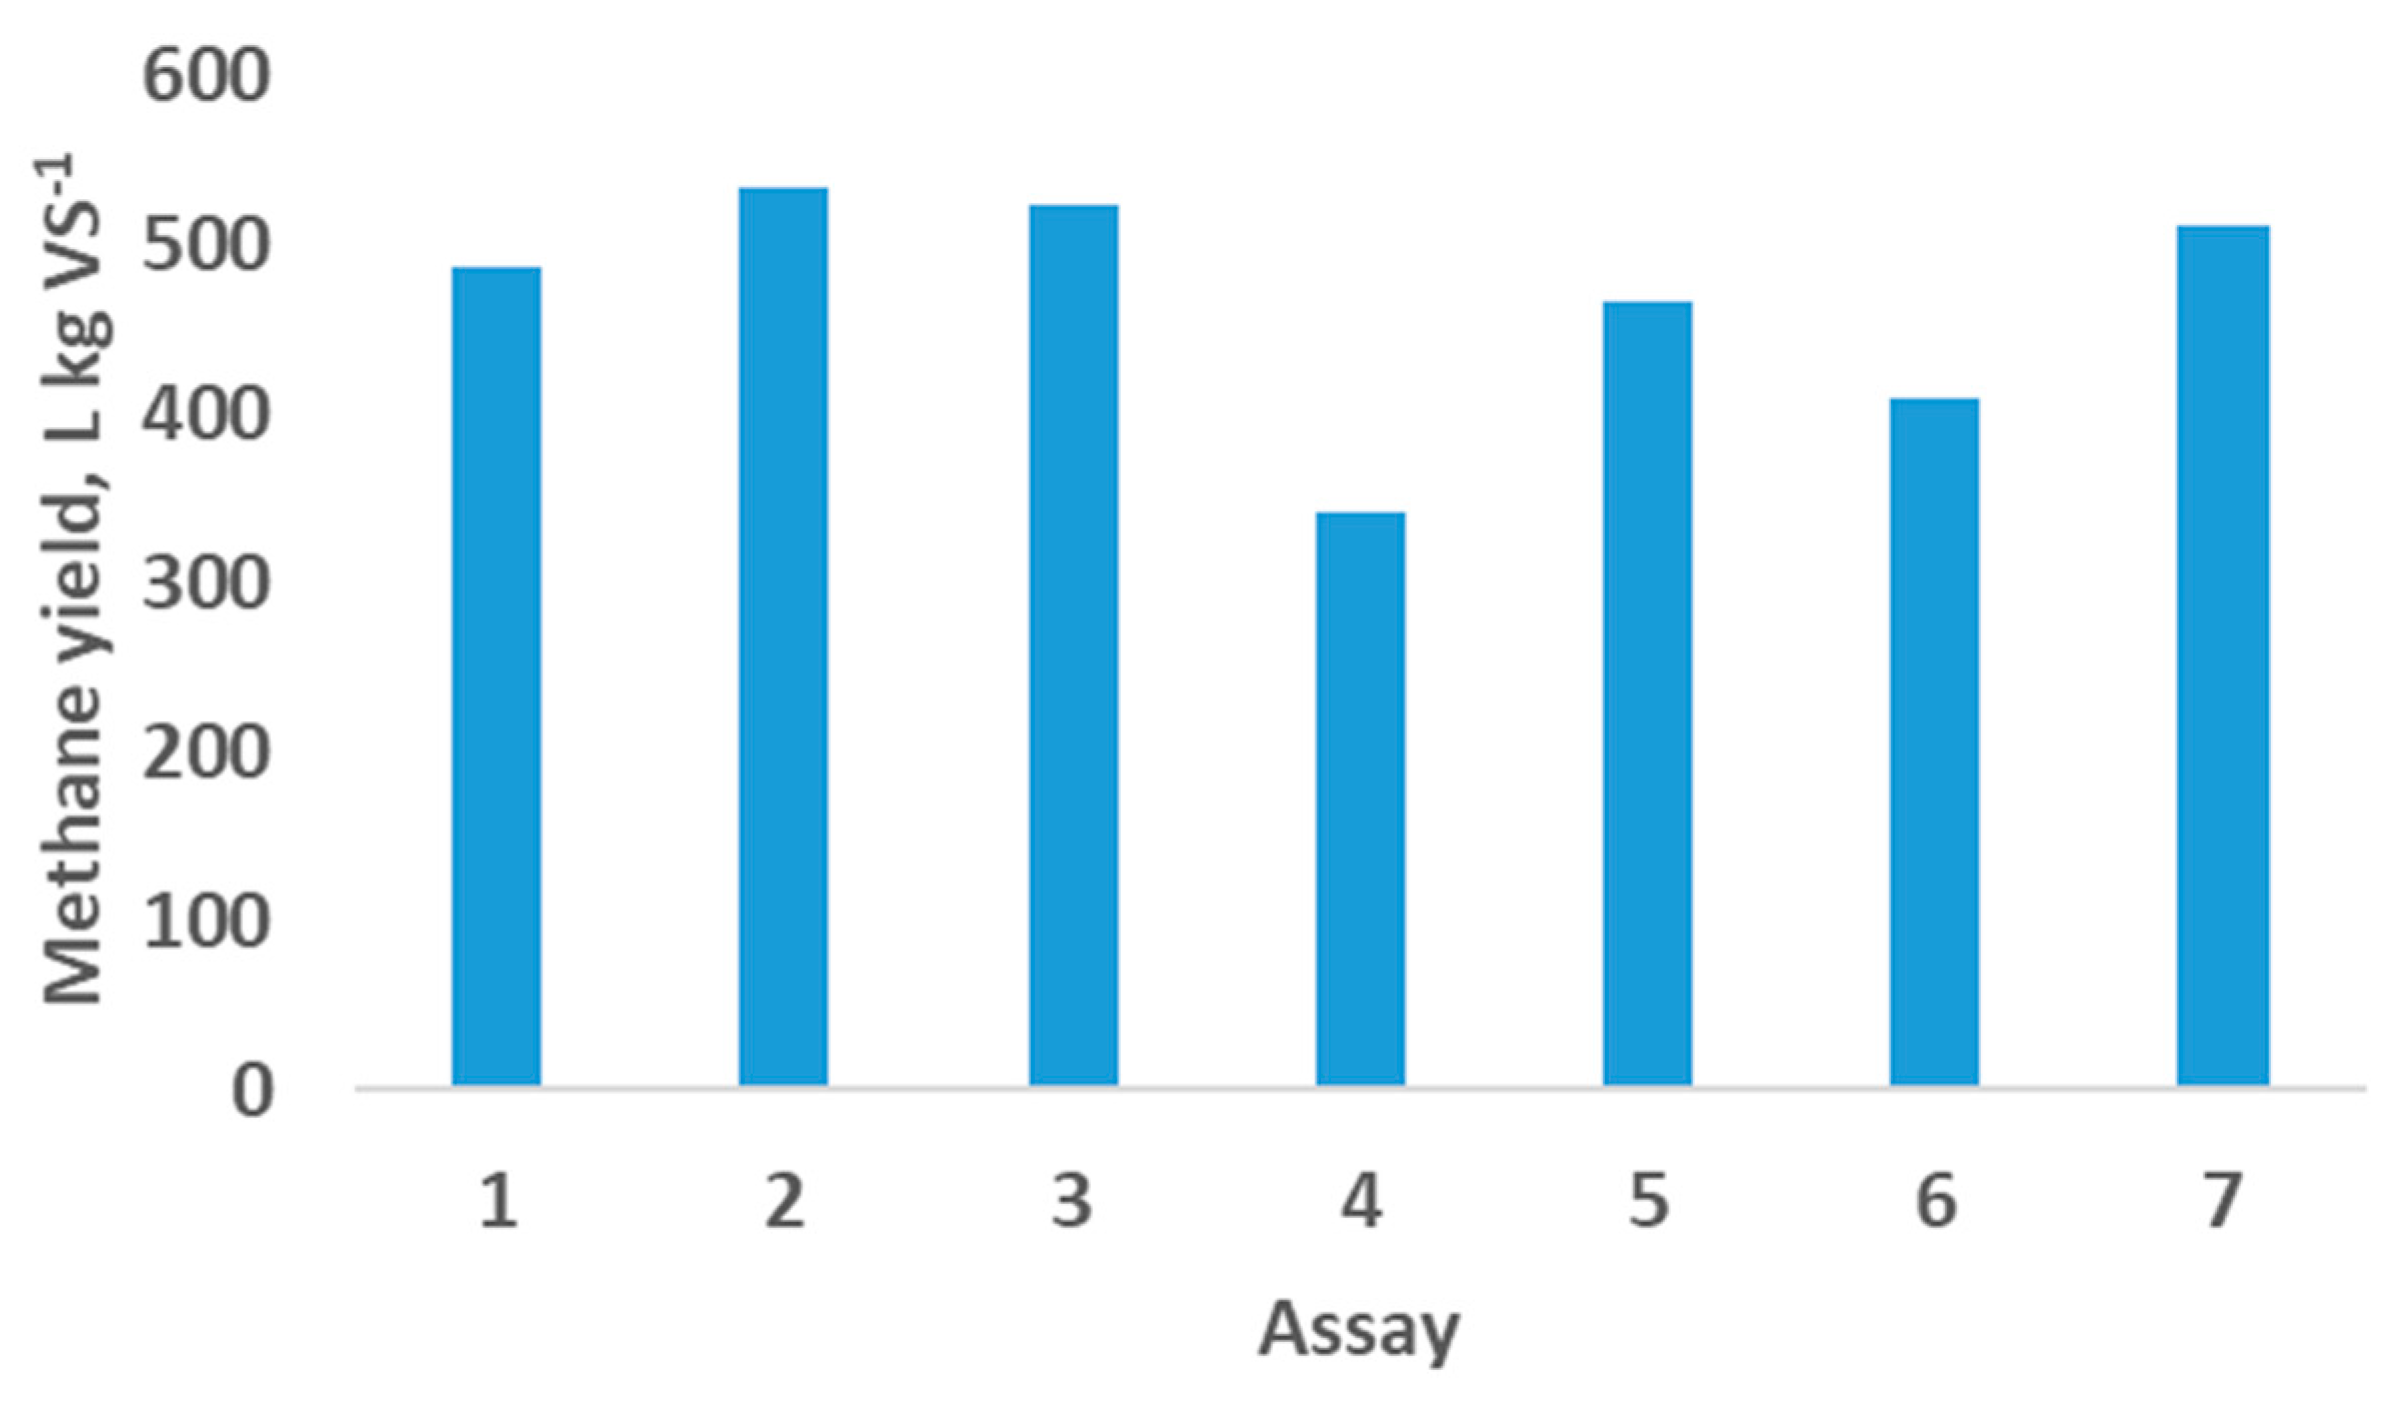
Figure 2.
Methane yield evolution in assays 6 and 7 at different OLR analyzed.
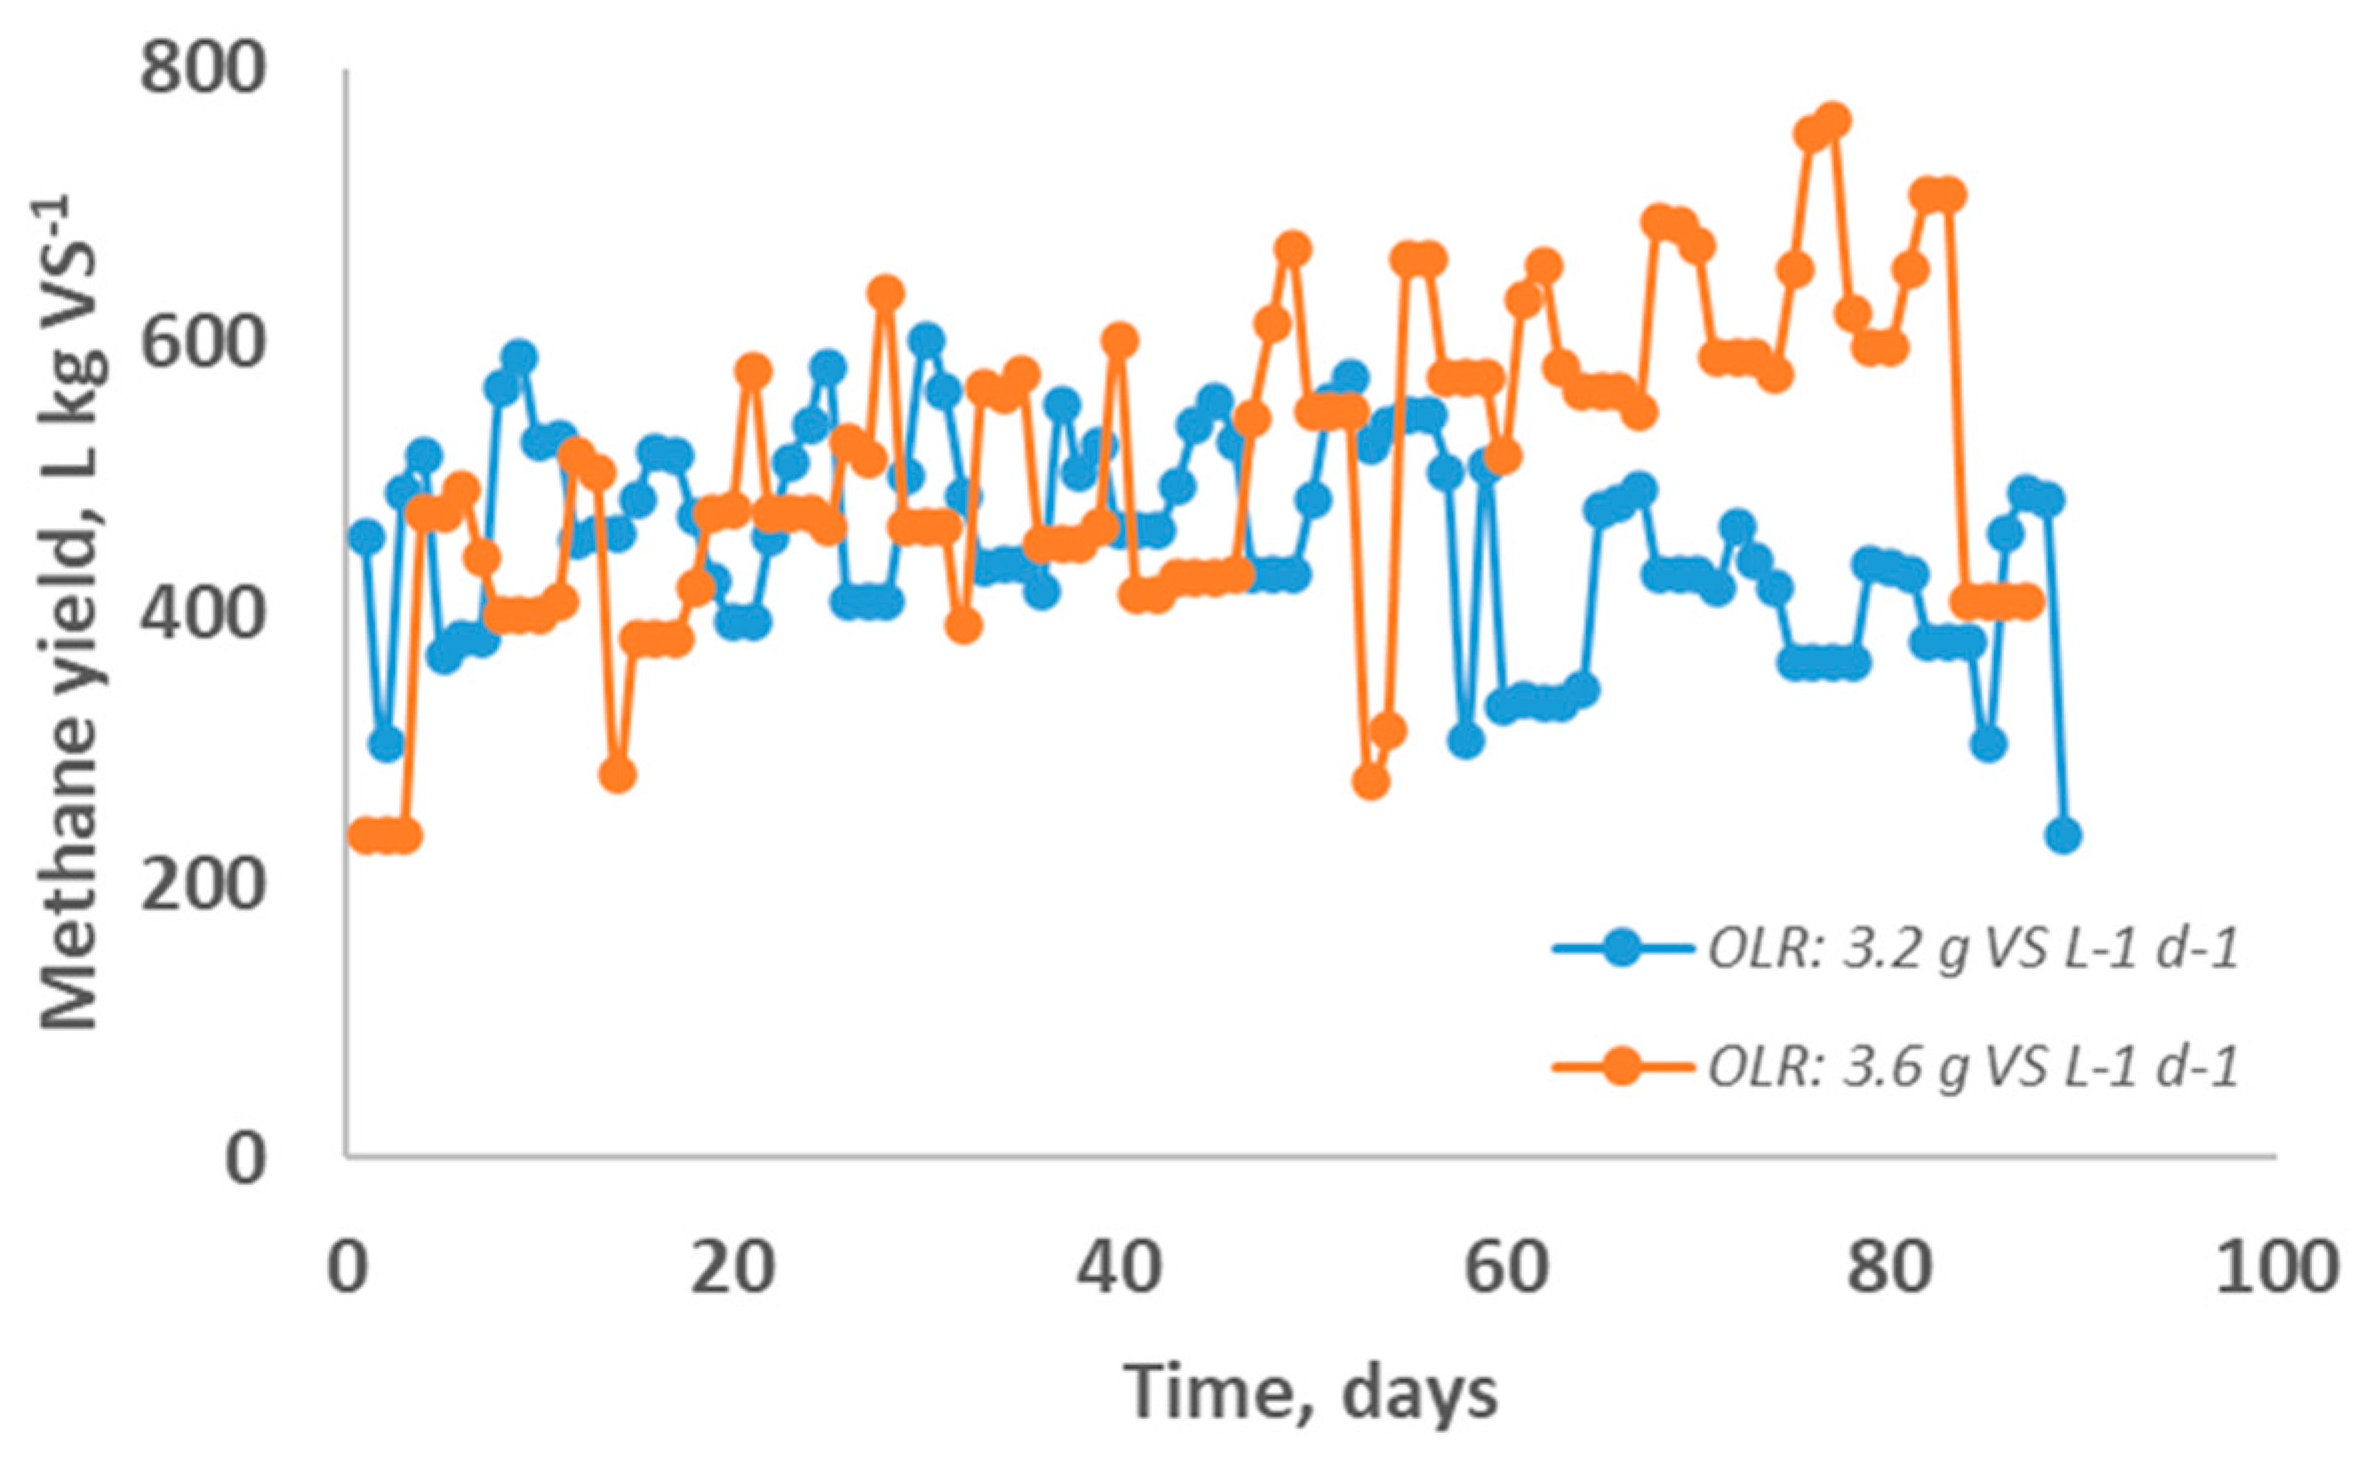
Figure 3.
Kinetic modelling plots for COD removal evaluating the Grau Second-Order and Modified Stover-Kicannon models for Groups I (without OMW) and II (with OMW).
Figure 3.
Kinetic modelling plots for COD removal evaluating the Grau Second-Order and Modified Stover-Kicannon models for Groups I (without OMW) and II (with OMW).
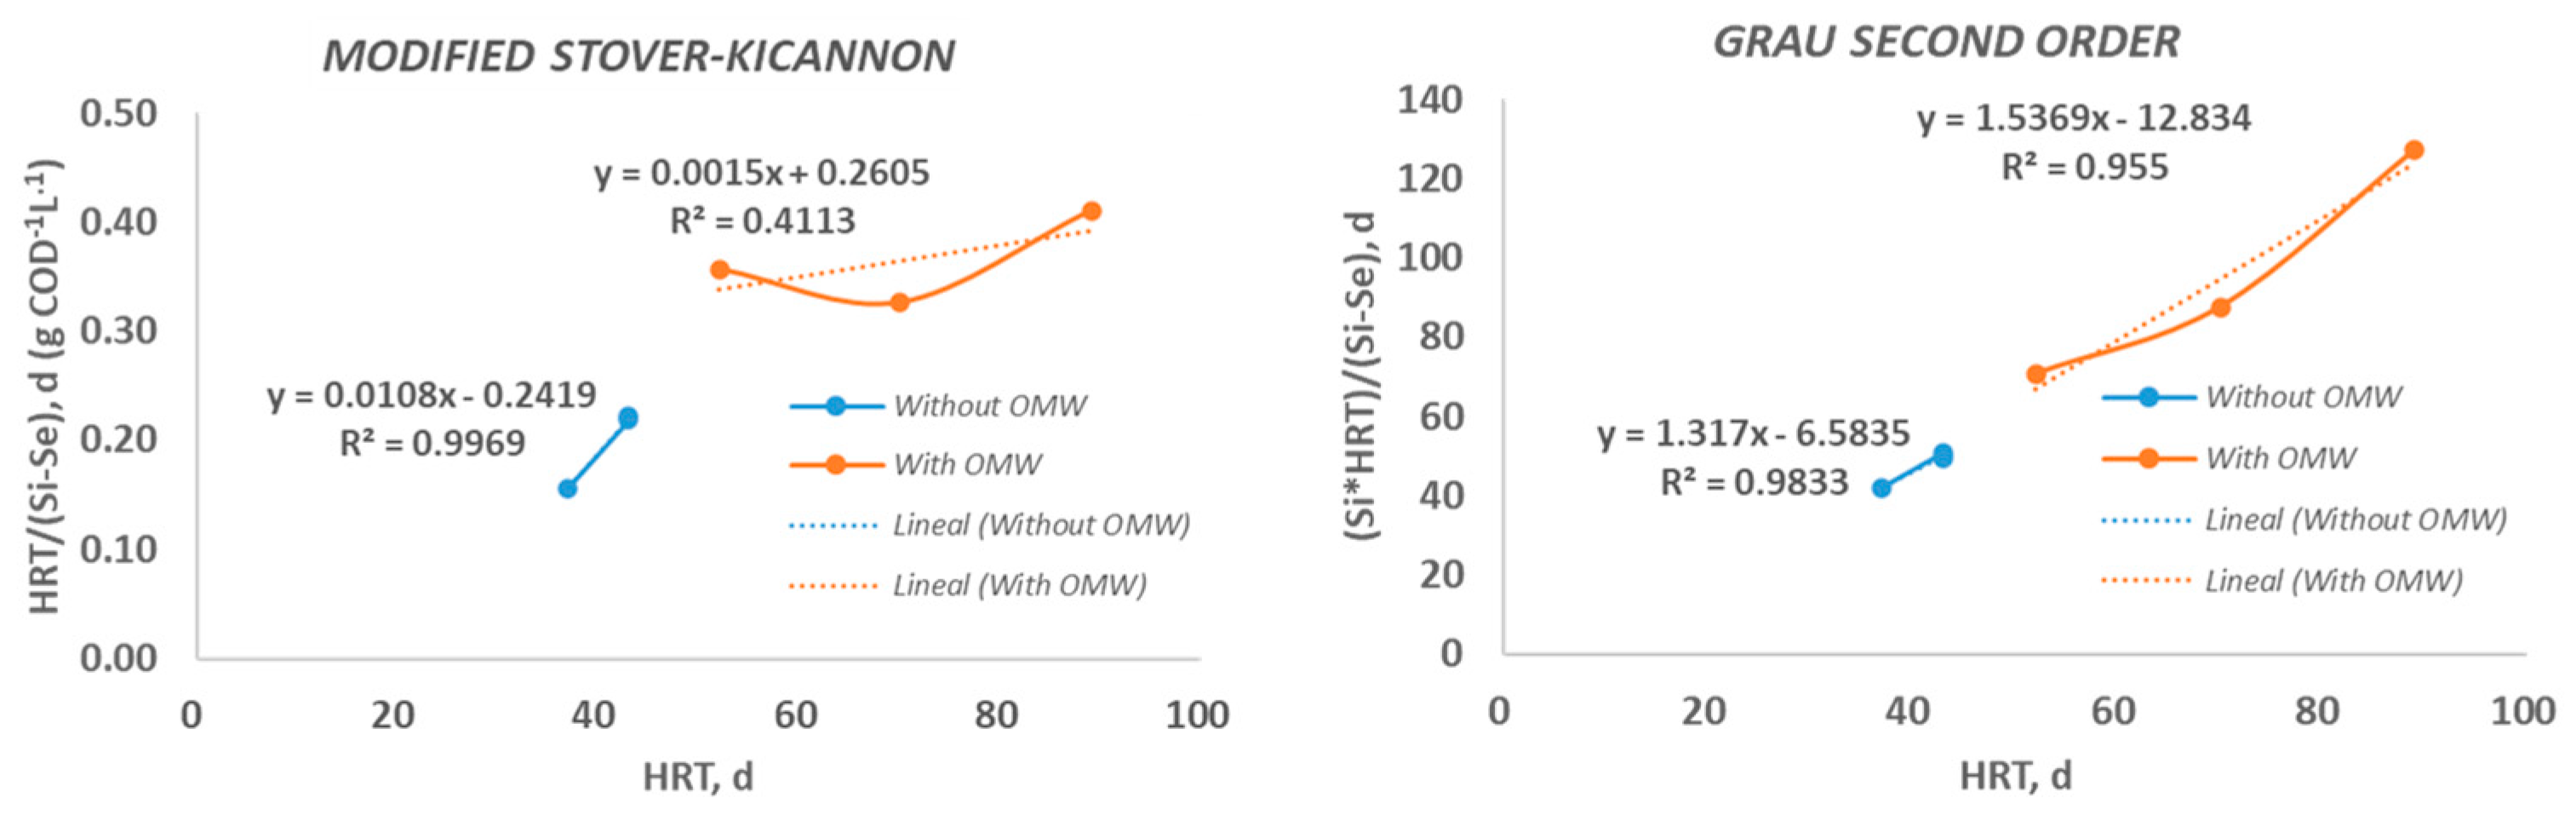
Figure 4.
Interaction of pH, ammonia nitrogen, alkalinity and VFA parameters with the mixture of substrates composition.
Figure 4.
Interaction of pH, ammonia nitrogen, alkalinity and VFA parameters with the mixture of substrates composition.
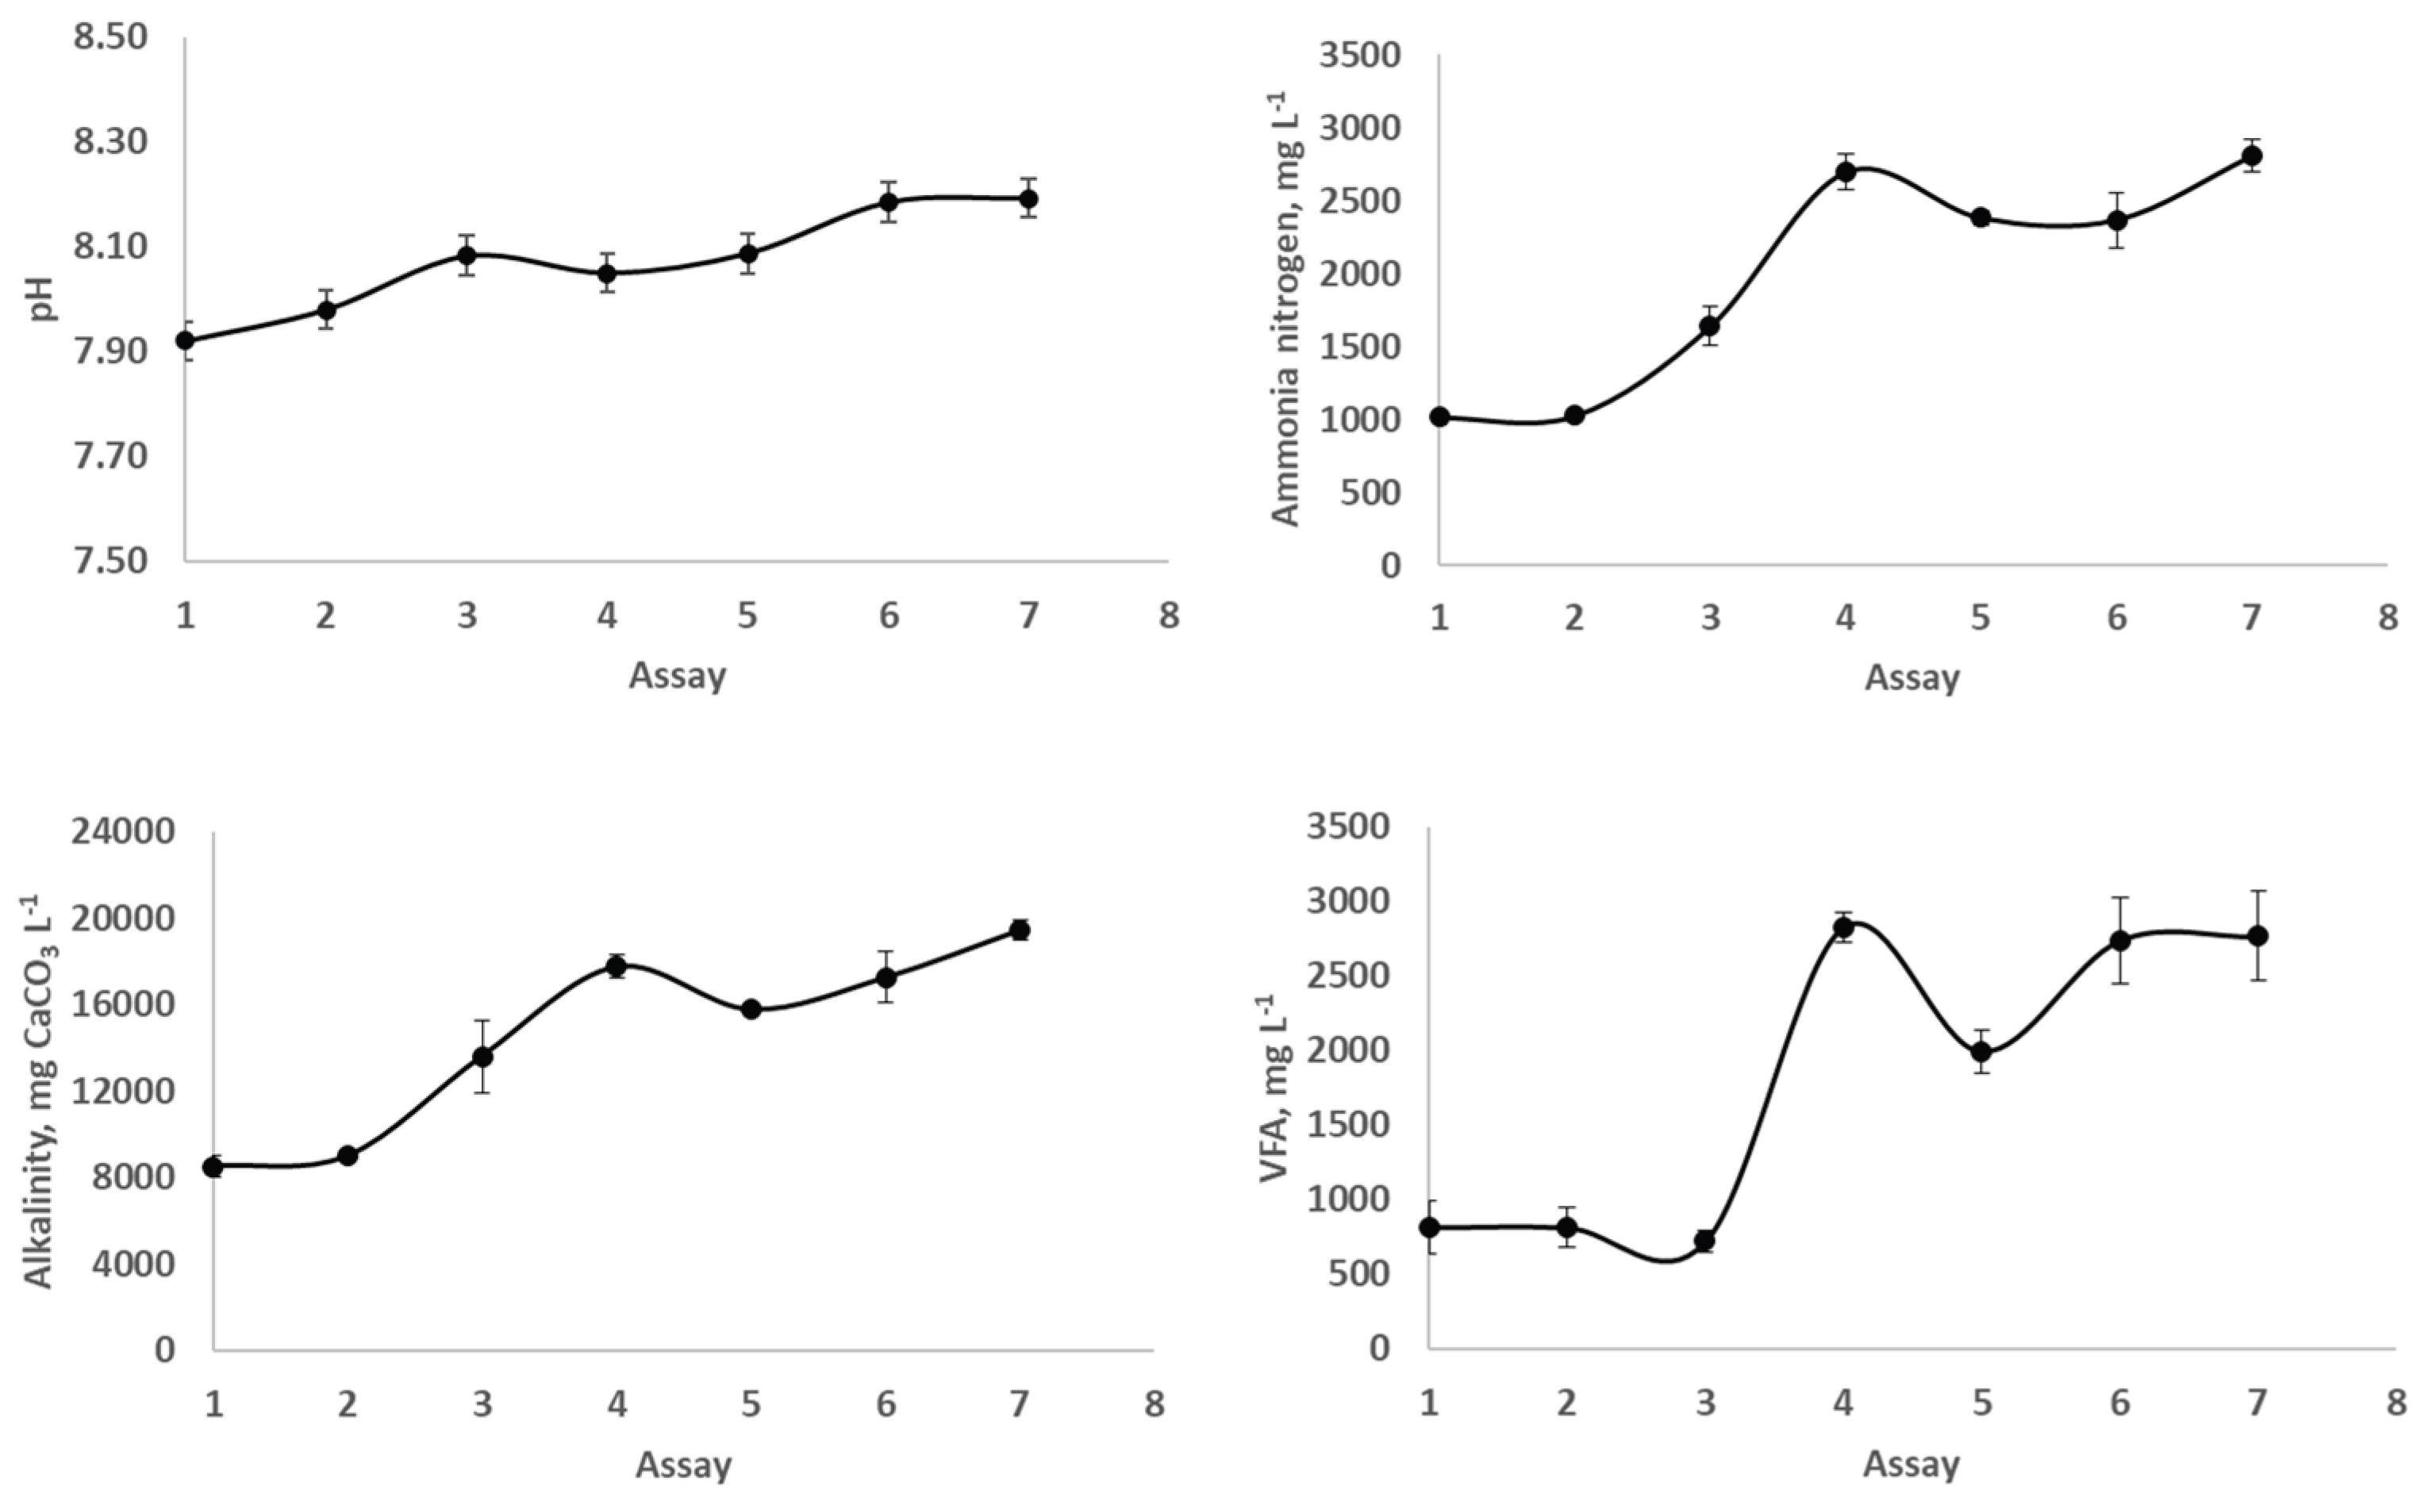

Table 1.
Assays design and composition of substrates evaluated.
| Parameter | PP | RO | L2 | L | OMW |
| C, % | 1.64 ± 0.10 | 74.00 ±0.50 | 44.80 ± 0.28 | 45.20 ± 0.57 | 11.8 ± 1.56 |
| N, % | 0.11 ± 0.01 | 0 | 1.97 ± 0.06 | 3.20 ± 0.03 | 0.33 ± 0.03 |
| C/N | 14.91 | - | 22.74 | 14.13 | 35.76 |
| VST, % | 6.65 ± 0.10 | - | 80.64 ± 0.12 | 93.79 ± 0.12 | 11.47 ± 0.42 |
| Assay | Composition in the feedstock, % over VS | ||||
| 1 | 50 | 17 | 22 | 11 | - |
| 2 | 53 | 18 | 12 | 17 | - |
| 3 | 50 | 18 | - | 32 | - |
| 4 | 24 | - | - | 40 | 36 |
| 5 | 8 | - | - | 40 | 52 |
| 6 | - | - | - | 40 | 60 |
| 7* | - | - | - | 40 | 60 |
*Assay 7: the OLR evaluated was 3.6 kg VS L-1 d-1.
Table 2.
Parameters and results of two-stages AD processes in assays 1 to 7.
| Parameter | Assay 1 | Assay 2 | Assay 3 | Assay 4 | Assay 5 | Assay 6 | Assay 7 |
|---|---|---|---|---|---|---|---|
| HRT, days | 43 | 43 | 37 | 52 | 70 | 89 | 63 |
| OLR, g VS L-1 d-1 | 3.2 | 3.2 | 3.2 | 3.2 | 3.2 | 3.2 | 3.6 |
| Methane yield, L kg VS-1 | 487 | 532 | 522 | 342 | 467 | 408 | 510 |
| COD removal, % | 87 | 85 | 88 | 74 | 80 | 70 | 58 |
| Methane energy yield, kJ kg VS-1 | 19 | 21 | 21 | 14 | 19 | 16 | 20 |
| Methane energy potential, kJ d-1 | 235 | 242 | 282 | 182 | 249 | 218 | 241 |
| Methane concentration stage 1, % | 42 | 40 | 42 | 48 | 55 | 62 | 59 |
| Methane concentration stage 2, % | 59 | 67 | 63 | 68 | 69 | 65 | 60 |
| Total methane concentration, % | 51 | 53 | 53 | 58 | 62 | 64 | 59 |
Table 3.
Influence of OMW in the process kinetics according Grau Second-Order and Modified Stover- Kicannon models.
Table 3.
Influence of OMW in the process kinetics according Grau Second-Order and Modified Stover- Kicannon models.
| Model | Group | HRT, d | ks, d-1 | R2 |
| Grau Second-Order Multicomponent | I | 37-43 | 12 | 0.983 |
| II | 52-89 | 5 | 0.955 | |
| Group | HRT, d | kB, g COD L-1 d-1 | ||
| Modified Stover-Kicannon | I | 37-43 | 10 | 0.997 |
| II | 52-89 | 1 | 0.411 |
Table 4.
ANOVA analysis of evaluated parameters (alkalinity, pH, VFA and ammonia nitrogen) in assays carried out with Legume 2 and OMW.
Table 4.
ANOVA analysis of evaluated parameters (alkalinity, pH, VFA and ammonia nitrogen) in assays carried out with Legume 2 and OMW.
| Assay | pH | VFA, mg L-1 | N-NH4, mg L-1 | Alkalinity, mg CaCO3 L-1 |
|---|---|---|---|---|
| 1 | 7.92±0.12 | 818±178 a |
1015±47 | 8533±464 |
| 2 | 7.98±0.18 | 816±129 a |
1028±10 | 9007±205 |
| 3 | 8.08±0.02 | 722±71 a |
1640±136 | 13630±1682 |
| 4 | 8.05±0.13 | 2828±99 c |
2695±118 | 17775±525 |
| 5 | 8.09±0.03 | 1996±142 b |
2380±52 | 15796±159 |
| 6 | 8.19±0.04 | 2740±291 c |
2368±188 | 17275±1183 |
| 7 | 8.19±0.03 | 2766±300 c |
2805±109 | 19472±447 |
Different letters indicated significant differences between values of the same parameter for the assays carried out. No significant differences were found in those parameters without any letter. For standard deviation, four samples were taken over the process.
Disclaimer/Publisher’s Note: The statements, opinions and data contained in all publications are solely those of the individual author(s) and contributor(s) and not of MDPI and/or the editor(s). MDPI and/or the editor(s) disclaim responsibility for any injury to people or property resulting from any ideas, methods, instructions or products referred to in the content. |
© 2025 by the authors. Licensee MDPI, Basel, Switzerland. This article is an open access article distributed under the terms and conditions of the Creative Commons Attribution (CC BY) license (http://creativecommons.org/licenses/by/4.0/).
Copyright: This open access article is published under a Creative Commons CC BY 4.0 license, which permit the free download, distribution, and reuse, provided that the author and preprint are cited in any reuse.


