
Submitted:
28 July 2025
Posted:
29 July 2025
You are already at the latest version
Abstract
Background: Metabolic dysfunction-associated steatotic liver disease (MASLD) is increasingly recognized as part of the broader spectrum of metabolic disorders, with links to obesity, insulin resistance, and systemic inflammation. Emerging evidence points to a role of the gut–liver axis, particularly intestinal permeability, in its pathogenesis. Zonulin—a regulator of tight junctions—has been proposed as a marker of impaired barrier function, but its relevance in MASLD remains unclear. Methods: We conducted a prospective observational study including 52 adult patients diagnosed with MASLD. Hepatic steatosis was evaluated using the SteatoTest (FibroMax panel), while fecal zonulin levels were measured by ELISA at baseline. Clinical, anthropometric, and metabolic parameters were assessed. We used ROC curve analysis to explore zonulin’s predictive value for moderate-to-severe steatosis (≥S2). Results: Fecal zonulin levels above 107 ng/mL were found in 26.9% of participants. This group showed a higher frequency of moderate-to-severe steatosis (78.6%) compared to those with lower zonulin levels (55.3%), although the correlation with SteatoTest was weak (r = 0.19, p > 0.05). No significant associations were found between zonulin and liver fibrosis, insulin resistance (HOMA-IR), or the BARD score. The AUC for detecting steatosis ≥ S2 was 0.68. Conclusions: Although limited as a standalone diagnostic tool, fecal zonulin may reflect underlying gut barrier dysfunction in MASLD and show moderate association with hepatic steatosis. Its role as a complementary biomarker in non-invasive stratification frameworks warrants further study, especially in larger cohorts with control groups.
Keywords:
MASLD
; zonulin
; fecal biomarkers
; intestinal permeability
; SteatoTest
; FibroMax
; gut–liver axis
; hepatic steatosis
1. Introduction
Over the past 15 years, metabolic dysfunction-associated steatotic liver disease (MASLD) has garnered increasing attention from researchers, primarily due to the rising global prevalence and its association with multiple comorbidities. The condition carries a significant risk of progression to steatohepatitis, fibrosis, cirrhosis, or even hepatocellular carcinoma in the absence of timely medical or nutritional intervention [1]. The recent change in nomenclature reflects a deeper understanding of this disease, highlighting its links with insulin resistance, type 2 diabetes mellitus, dyslipidemia, cardiovascular disease, hypertension, and obesity [2]. The growing prevalence of obesity [3], as well as the increasing incidence of type 2 diabetes, cardiovascular disease, and dyslipidemia, has intensified scientific interest in the metabolic and clinical implications of MASLD [4].
Recent evidence has emphasized the pivotal role of the gut-liver axis in the pathogenesis of MASLD. This bidirectional communication pathway involves interactions between the intestinal microbiota, intestinal barrier integrity, and systemic inflammatory responses.
Among the proposed mechanisms, altered intestinal permeability — often referred to as “leaky gut”—has gained considerable attention. This condition allows the translocation of endotoxins, bacteria, and other pro-inflammatory molecules into the portal circulation, which may contribute to systemic inflammation, hepatic injury, and disease progression [5,6].
Zonulin is a protein involved in the regulation of intestinal tight junctions, playing a key role in modulating barrier permeability. Increased fecal levels of zonulin have been observed in metabolic disorders such as obesity and type 2 diabetes, as well as in several inflammatory and liver-related conditions, suggesting a possible link with compromised gut integrity [7,8]. However, the evidence regarding its role in MASLD remains limited and inconclusive. Few studies to date have explored the potential of fecal zonulin as a non-invasive biomarker of altered intestinal permeability in MASLD patients [8,9].
Study Objective
This observational study aimed to evaluate fecal zonulin levels in patients with MASLD and to investigate its potential association with metabolic and hepatic parameters. We hypothesized that intestinal barrier dysfunction, reflected by elevated fecal zonulin, may be present in individuals with MASLD and could serve as a potential link between gut permeability and disease pathogenesis.
2. Materials and Methods
2.1. Study Design and Ethical Approval
This prospective, observational, single-center study was approved by the Ethics Committee of the Emergency Clinical County Hospital of Târgu Mureș (Approval No. Ad. 5004/16.02.2023). All participants provided written informed consent for inclusion in the study and granted permission for their data to be accessed exclusively for research purposes. All procedures were conducted in strict accordance with the ethical standards outlined in the Declaration of Helsinki.
The study was conducted between February and December 2023. A total of 52 patients were enrolled from the Gastroenterology Department of the same institution. All patients were evaluated via abdominal ultrasonography, which confirmed the presence of hepatic steatosis.
Note on terminology: In accordance with the 2023 international consensus, the nomenclature for fatty liver disease has shifted from “non-alcoholic fatty liver disease (NAFLD)” to “metabolic dysfunction-associated steatotic liver disease (MASLD),” and from “non-alcoholic steatohepatitis (NASH)” to “metabolic dysfunction-associated steatohepatitis (MASH).” In this study, we use the terms NAFLD and NASH where applicable, particularly in reference to established diagnostic tools such as FibroMax and BARD that were developed under the previous classification system.
2.2. Inclusion and Exclusion Criteria
Eligible participants were adults aged 18 years or older with a diagnosis of hepatic steatosis or steatohepatitis confirmed by abdominal ultrasonography and FibroMax testing. Patients were enrolled consecutively from the Gastroenterology Department of the Emergency Clinical County Hospital of Târgu Mureș between February and December 2023.
Exclusion criteria included daily alcohol intake exceeding standard recommended thresholds, the absence of written informed consent, and the presence of cirrhosis of toxic or alcohol-related etiology. Additional exclusion criteria were pregnancy or lactation, ongoing or planned bariatric surgery, psychiatric disorders, renal insufficiency, and advanced cardiovascular disease.
2.3. Anthropometric and Biochemical Assessment
At baseline, all participants underwent a structured medical interview, including a detailed assessment of dietary habits and lifestyle. Anthropometric measurements were obtained under standardized conditions and included height, weight, waist circumference, and hip circumference. Body mass index (BMI) was calculated using the standard formula (kg/m2). Measurements were performed by trained personnel blinded to the participants’ laboratory results.
Fasting venous blood samples were collected following a minimum 12-h fast. The biochemical parameters measured included fasting plasma glucose (glycemia a jeun), the HOMA-IR index (Homeostasis Model Assessment of Insulin Resistance), liver function enzymes, total cholesterol, HDL cholesterol, serum triglycerides, and other routine laboratory indicators.
To assess intestinal permeability, fecal samples were collected, and zonulin concentrations were determined using validated laboratory techniques in an accredited clinical laboratory.
2.4. Hepatic Evaluation: FibroMax and BARD Score
All patients underwent hepatic evaluation using the FibroMax test panel, a non-invasive diagnostic tool developed by BioPredictive (France) and validated in multiple clinical studies for the assessment of NAFLD and NASH. The FibroMax panel includes five distinct components, each designed to evaluate a specific aspect of liver pathology: FibroTest assesses the degree of fibrosis, ActiTest measures necroinflammatory activity, SteatoTest estimates the extent of steatosis, NashTest screens for non-alcoholic steatohepatitis, while AshTest helps differentiate alcohol-related hepatic injury.
Interpretation of the results was based on reference standards provided by the manufacturer. For FibroTest, scores ranged from F0 (no fibrosis) to F4 (severe fibrosis). SteatoTest scores were classified from S0 (no steatosis) to S3 (advanced steatosis). ActiTest scores ranged from A0 (no necroinflammatory activity) to A3 (severe activity). NashTest scores ranged from N0 (no inflammation) to N2 (confirmed inflammation), and AshTest scores ranged from H0 (no alcoholic inflammation) to H3 (severe alcoholic inflammation).
Each participant’s BARD score was also calculated to estimate the risk of advanced fibrosis and cirrhosis in the context of non-alcoholic fatty liver disease (NAFLD). The BARD score, which varies between 0 and 4, is calculated based on three clinical criteria: body mass index (BMI), abdominal obesity, and the presence of type 2 diabetes. It is commonly used to estimate the risk of advanced fibrosis in metabolic liver disease.. Based on BMI, participants were divided into three groups: Group 0 (normal BMI < 25 kg/m2), Group 1 (overweight, BMI 25.0–29.9 kg/m2), and Group 2 (obese, BMI ≥ 30 kg/m2).
2.5. Statistical Analysis
Statistical analyses were performed using IBM SPSS Statistics, version 21.0 (IBM Corp., Armonk, NY, USA). Graphs were generated using Microsoft Excel. Data distribution was evaluated using the Shapiro–Wilk test. Continuous variables are presented as mean ± standard deviation (SD), and categorical variables as counts and percentages.
For group comparisons, the independent-sample Student’s t-test was applied for normally distributed continuous variables, while the chi-square (χ2) test was used for categorical variables. Correlations between variables were assessed using Pearson’s correlation coefficient.
To evaluate the diagnostic performance of fecal zonulin in predicting moderate-to-severe steatosis (SteatoTest ≥ S2), receiver operating characteristic (ROC) curve analysis was conducted and the area under the curve (AUC) was calculated. A p-value of <0.05 was considered statistically significant.
3. Results
3.1. Baseline Characteristics Stratified by Fecal Zonulin Levels
Out of the 52 patients with MASLD included in the final analysis, 30 (57.7%) were female, with a mean age of 43.7 ± 13.2 years and a mean BMI of 28.6 ± 5.2 kg/m2. Elevated fecal zonulin levels (>107 ng/mL), indicative of increased intestinal permeability, were observed in 14 patients (26.9%).
When comparing individuals with elevated vs. normal zonulin levels, certain metabolic differences emerged, though statistical significance was not reached. Patients with higher zonulin values had, on average, a higher BMI (30.4 ± 5.6 vs. 27.9 ± 4.8 kg/m2; p = 0.12) and a greater proportion of insulin resistance as defined by HOMA-IR ≥ 2.5 (57.1% vs. 34.2%; p = 0.18). (Table 1)
Notably, moderate-to-severe hepatic steatosis (SteatoTest ≥ S2) was more frequent among patients with elevated zonulin (78.6%) compared to those with lower levels (55.3%), reflecting a potential trend (p = 0.10). No significant differences were observed regarding age, sex distribution, or fibrosis stage (FibroTest ≥ F1) between the two groups.
Although these differences did not meet the conventional threshold for statistical significance, they suggest a possible link between gut permeability and metabolic dysregulation in MASLD. These preliminary findings merit further investigation in larger, prospective cohorts.
3.2. Non-Invasive Hepatic Profiling Using the FibroMax Panel
A comprehensive non-invasive hepatic evaluation was performed for all participants using the FibroMax panel, which includes SteatoTest, FibroTest, ActiTest, and NashTest (Table 2).
Hepatic steatosis was highly prevalent, with 80.8% of patients presenting with at least mild steatosis (≥S1), and 34.5% exhibiting either moderate (S2) or severe (S3) steatosis. An additional 17.3% displayed intermediate stages (S1–S2 or S2–S3), which may reflect transitional metabolic profiles.
Regarding liver fibrosis, 36.5% of participants had any degree of fibrosis (≥F1), while 5.8% had advanced fibrosis (F3–F4). Necroinflammatory activity (ActiTest ≥ A1) was observed in 40.4% of patients, including 17.3% with moderate-to-severe activity. Additionally, 11.5% of patients were classified with definite NASH (N2), while 40.4% were borderline (N1), suggesting potential inflammatory liver injury in a substantial proportion of the cohort.
These findings support the metabolic burden and hepatic involvement associated with MASLD, even in a relatively young and ambulatory population.
3.3. Correlation Between Fecal Zonulin and Hepatic or Metabolic Parameters
Pearson’s correlation analysis revealed a modest, non-significant positive association between fecal zonulin concentrations and hepatic steatosis severity, as assessed by the SteatoTest (r = 0.19). No meaningful correlations were observed between fecal zonulin and FibroTest-derived fibrosis scores (r = 0.04) or insulin resistance as measured by HOMA-IR (r = 0.08). These findings suggest that, within this cohort, zonulin levels did not strongly reflect hepatic fibrotic burden or systemic metabolic dysfunction. A scatterplot of fecal zonulin versus HOMA-IR is provided in Figure 1.
3.4. Predictive Value of Fecal Zonulin for Hepatic Steatosis
To further explore the clinical relevance of fecal zonulin concentrations in MASLD, we assessed its discriminative capacity for detecting moderate-to-severe hepatic steatosis (defined as SteatoTest ≥ S2) using receiver operating characteristic (ROC) curve analysis. The area under the curve (AUC) was 0.68, indicating a modest, yet potentially meaningful, ability of fecal zonulin to differentiate between patients with and without significant steatosis (Figure 2).
Although the diagnostic performance did not reach thresholds typically associated with standalone biomarkers, the observed AUC suggests a potential contributory role for fecal zonulin when interpreted alongside other clinical and biochemical parameters. Given its non-invasive nature and biological plausibility as a marker of intestinal permeability, fecal zonulin may warrant further evaluation in larger, prospective cohorts and in multimarker predictive models.
3.5. BARD Score Analysis
To evaluate the clinical validity of the BARD score within this MASLD cohort, correlation analyses were performed with key hepatic and metabolic indicators. As expected, a strong positive correlation was identified between BARD score and body mass index (BMI) (r = 0.494, p < 0.001), reflecting the structural weighting of BMI within the score algorithm. Additionally, a significant correlation was observed between BARD score and hepatic steatosis severity, as assessed by the SteatoTest (r = 0.369, p = 0.007) (Table 3). These associations support the score’s utility in stratifying hepatic risk in metabolic liver disease, even within a relatively young, ambulatory population.No relevant correlations were noted between BARD score and fecal zonulin concentrations, suggesting that gut permeability, as assessed by zonulin, may capture a distinct biological dimension not fully reflected by traditional metabolic risk indices.
4. Discussion
4.1. Intestinal Barrier Dysfunction and Its Role in MASLD Pathogenesis
Disruption of the intestinal barrier has emerged as a key contributor to the pathogenesis of metabolic dysfunction-associated steatotic liver disease (MASLD). Zonulin, a physiological modulator of tight junctions, reflects gut permeability and has been increasingly studied as a non-invasive biomarker. Recent investigations have shown elevated zonulin levels in MASLD and non-alcoholic fatty liver disease (NAFLD), particularly in relation to steatosis rather than fibrosis [10,11]. In our prospective cohort, 26.9% of patients demonstrated elevated fecal zonulin (>107 ng/mL). While the correlation between zonulin levels and SteatoTest score was modest (r = 0.19), the noticeably higher prevalence of moderate-to-severe steatosis in this subgroup (78.6% vs. 55.3%) raises the possibility that microbial translocation through a disrupted gut barrier may contribute to systemic inflammatory responses and promote fat deposition within the liver [10,12,13].
4.2. Zonulin, Fibrosis, and Insulin Resistance
Importantly, fecal zonulin was not significantly associated with liver fibrosis severity (FibroTest, r = 0.04) or insulin resistance (HOMA-IR, r = 0.08). This finding supports the hypothesis that increased intestinal permeability may operate as an early and independent driver in MASLD pathogenesis, preceding both fibrotic remodeling and systemic metabolic dysfunction [14,15,16]. These results mirror recent data indicating that gut barrier dysfunction tends to be more pronounced in early-stage steatosis and may evolve independently from traditional metabolic markers such as insulin resistance.
4.3. Diagnostic Utility of Zonulin
The discriminative ability of fecal zonulin for identifying moderate-to-severe steatosis was modest (AUC = 0.68), in line with earlier reports that caution against using zonulin as a standalone diagnostic tool [17]. However, given its non-invasive nature and plausible biological role, zonulin may hold added value in multimodal assessment frameworks. Integrative diagnostic strategies that combine permeability markers (zonulin, LBP), microbial-derived metabolites, and established metabolic indices have shown promise in improving MASLD stratification [14,18]. In this context, fecal zonulin could contribute to refining risk profiles, particularly in patients with ambiguous clinical or imaging findings.
4.4. The BARD Score and Gut-Liver Axis Disconnection
The BARD score remains a practical fibrosis risk assessment tool, based on simple clinical parameters: BMI, presence of type 2 diabetes, and AST/ALT ratio. In our study, BARD score correlated moderately with both BMI (r = 0.494) and SteatoTest (r = 0.369), confirming its dependence on metabolic components. However, no correlation was found between BARD score and fecal zonulin. This dissociation highlights that gut barrier dysfunction may reflect a distinct axis of MASLD pathophysiology—one not captured by conventional metabolic risk scores [19,20]. Therefore, there is growing rationale to develop enhanced predictive models that incorporate gut-derived biomarkers alongside traditional tools such as the BARD, FIB-4, or FAST scores.
4.5. Pathophysiological Basis and Experimental Evidence
Preclinical studies offer biological plausibility for the observed link between intestinal permeability and hepatic injury. Experimental studies in animal models have shown that decreased expression of tight junction proteins like ZO-1 and occludin can lead to increased permeability, allowing microbial compounds such as LPS to reach the liver and trigger inflammatory processes and lipid buildup [21,22]. Dysbiosis-induced activation of the toll-like receptor 4 (TLR4) pathway has also been shown to exacerbate hepatic steatosis and fibrosis [23,24]. Our findings are consistent with this gut-liver axis framework and provide clinical evidence supporting its translational relevance in human MASLD.
4.6. Clinical Relevance and Future Perspectives
Despite the moderate strength of associations, fecal zonulin remains a biologically plausible and easily obtainable biomarker that may help capture a previously underrecognized component of MASLD: intestinal permeability. Its incorporation into non-invasive diagnostic algorithms—especially in combination with other stool-based or serum markers—could enrich risk stratification, particularly for patients in early or ambiguous stages of the disease.
Future research should pursue multicenter validation in larger cohorts, standardized fecal biomarker collection protocols, and head-to-head comparisons with alternative gut-derived markers (e.g., calprotectin, LBP). Longitudinal studies are also needed to evaluate whether changes in zonulin over time correlate with progression or regression of hepatic steatosis and fibrosis, particularly in response to lifestyle or pharmacologic interventions.
4.7. Study Strengthts and Limitations
This study’s prospective design, use of the validated FibroMax panel, and inclusion of zonulin as a non-invasive intestinal permeability biomarker are noteworthy strengths. Moreover, the use of SteatoTest enables nuanced stratification of steatosis stages, correlating with histologic findings in previous validation studies. Nonetheless, some limitations must be acknowledged. The relatively small sample size (n = 52), single-center recruitment, and absence of a healthy control group restrict generalizability. In addition, variability in stool consistency and pre-analytical handling can affect fecal zonulin reliability [25]. These challenges highlight the need for technical standardization and external validation in future studies.
Altogether, our findings support the role of intestinal permeability in the early stages of MASLD and underscore the importance of incorporating gut-liver axis biomarkers into non-invasive assessment strategies. While zonulin alone may not offer sufficient diagnostic accuracy, its inclusion in multimodal frameworks holds promise for enhancing early detection, risk stratification, and personalized care in MASLD.
5. Conclusions
In this prospective study, fecal zonulin levels were associated with moderate-to-severe hepatic steatosis in patients with MASLD, suggesting a potential link between gut barrier dysfunction and liver fat accumulation.
While the diagnostic accuracy of fecal zonulin in isolation was limited (AUC = 0.68), its ease of collection and plausible role in gut–liver interactions make it a candidate for inclusion in broader non-invasive assessment strategies.
No significant associations were found between zonulin and fibrosis stage, insulin levels, or the BARD score, indicating that intestinal permeability may capture a distinct pathophysiological aspect of MASLD.
Larger studies with control groups and additional non-invasive markers are needed to validate these findings and to determine the clinical utility of fecal zonulin in routine MASLD assessment.
Author Contributions
Conceptualization, N.-A.C. and S.B.; methodology, N.-A.C., S.B. and C.M.P.; validation, S.B. and C.M.P; formal analysis, N.-A.C.; investigation, N.-A.C., S.B.; data curation, N.-A.C., S.B., C.M.P. and P.G.; writing – original draft preparation, N.-A.C.; writing – review and editing, S.B., C.M.P., P.G.; visualization, N.-A.C. and S.B.; supervision, S.B. All authors have read and agreed to the published version of the manuscript.
Funding
This research received no external funding.
Institutional Review Board Statement
This study was conducted following the Declaration of Helsinki and approved by the Ethics Committee of County Clinical Emergency Hospital of Targu Mures (Approval No. Ad. 5004/16.02.2023).
Informed Consent Statement
Informed consent was obtained from all subjects involved in the study.
Data Availability Statement
Data are contained within the article.
Conflicts of Interest
The authors declare no conflicts of interest.
Abbreviations
| MASLD | Metabolic dysfunction-associated steatotic liver disease |
| NAFLD | Non-alcoholic fatty liver disease |
| NASH | Non-alcoholic steatohepatitis |
| MASH | Metabolic dysfunction-associated steatohepatitis |
| BMI | Body mass index |
| T2DM | Type 2 diabetes mellitus |
| HOMA-IR | Homeostasis Model Assessment of Insulin Resistance |
| AUC | Area under the curve |
| ROC | Receiver operating characteristic |
| LPS | Lipopolysaccharide |
| ZO-1 | Zonula occludens-1 |
| AST | Aspartate aminotransferase |
| ALT | Alanine aminotransferase |
| HDL | High-density lipoprotein |
| LDL | Low-density lipoprotein |
| LBP | Lipopolysaccharide-binding protein |
| ELISA | Enzyme-linked immunosorbent assay |
| SPSS | Statistical Package for the Social Sciences |
| SD | Standard Deviation |
References
- Lazarus, J.V.; Mark, H.E.; Anstee, Q.M.; Arab, J.P.; Batterham, R.L.; Castera, L.; Cortez-Pinto, H.; Crespo, J.; Cusi, K.; Dirac, M.A.; et al. Advancing the Global Public Health Agenda for NAFLD: A Consensus Statement. Nat. Rev. Gastroenterol. Hepatol. 2022, 19, 60–78. [Google Scholar] [CrossRef]
- Younossi, Z.M.; Kalligeros, M.; Henry, L. Epidemiology of Metabolic Dysfunction-Associated Steatotic Liver Disease. Clin. Mol. Hepatol. 2025, 31, S32–S50. [Google Scholar] [CrossRef]
- Le, M.H.; Yeo, Y.H.; Li, X.; Li, J.; Zou, B.; Wu, Y.; Ye, Q.; Huang, D.Q.; Zhao, C.; Zhang, J.; et al. 2019 Global NAFLD Prevalence: A Systematic Review and Meta-Analysis. Clin. Gastroenterol. Hepatol. Off. Clin. Pract. J. Am. Gastroenterol. Assoc. 2022, 20, 2809–2817.e28. [Google Scholar] [CrossRef] [PubMed]
- Huh, Y.; Cho, Y.J.; Nam, G.E. Recent Epidemiology and Risk Factors of Nonalcoholic Fatty Liver Disease. J. Obes. Metab. Syndr. 2022, 31, 17–27. [Google Scholar] [CrossRef] [PubMed]
- Albillos, A.; de Gottardi, A.; Rescigno, M. The Gut-Liver Axis in Liver Disease: Pathophysiological Basis for Therapy. J. Hepatol. 2020, 72, 558–577. [Google Scholar] [CrossRef] [PubMed]
- Tripathi, A.; Debelius, J.; Brenner, D.A.; Karin, M.; Loomba, R.; Schnabl, B.; Knight, R. The Gut-Liver Axis and the Intersection with the Microbiome. Nat. Rev. Gastroenterol. Hepatol. 2018, 15, 397–411. [Google Scholar] [CrossRef]
- Mörkl, S.; Lackner, S.; Meinitzer, A.; Mangge, H.; Lehofer, M.; Halwachs, B.; Gorkiewicz, G.; Kashofer, K.; Painold, A.; Holl, A.K.; et al. Gut Microbiota, Dietary Intakes and Intestinal Permeability Reflected by Serum Zonulin in Women. Eur. J. Nutr. 2018, 57, 2985–2997. [Google Scholar] [CrossRef]
- ElGhandour, A.M.; Bayoumy, E.M.; Sayed, M.M.; Eskandaros, M.S.; Emam, A.M.M.; Teama, N.M.; Mohamed, M.S.; El-Gaaly, S.A. Value of Zonulin as a Diagnostic and Prognostic Marker in Different Degrees of Nonalcoholic Fatty Liver Disease. Egypt. Liver J. 2024, 14, 43. [Google Scholar] [CrossRef]
- Koutoukidis, D.A.; Yen, S.; Gomez Castro, P.; Misheva, M.; Jebb, S.A.; Aveyard, P.; Tomlinson, J.W.; Mozes, F.E.; Cobbold, J.F.; Johnson, J.S.; et al. Changes in Intestinal Permeability and Gut Microbiota Following Diet-Induced Weight Loss in Patients with Metabolic Dysfunction-Associated Steatohepatitis and Liver Fibrosis. Gut Microbes 2024, 16, 2392864. [Google Scholar] [CrossRef]
- Martín-Mateos, R.; Albillos, A. The Role of the Gut-Liver Axis in Metabolic Dysfunction-Associated Fatty Liver Disease. Front. Immunol. 2021, 12, 660179. [Google Scholar] [CrossRef]
- Kessoku, T.; Kobayashi, T.; Imajo, K.; Tanaka, K.; Yamamoto, A.; Takahashi, K.; Kasai, Y.; Ozaki, A.; Iwaki, M.; Nogami, A.; et al. Endotoxins and Non-Alcoholic Fatty Liver Disease. Front. Endocrinol. 2021, 12, 770986. [Google Scholar] [CrossRef]
- An, L.; Wirth, U.; Koch, D.; Schirren, M.; Drefs, M.; Koliogiannis, D.; Nieß, H.; Andrassy, J.; Guba, M.; Bazhin, A.V.; et al. The Role of Gut-Derived Lipopolysaccharides and the Intestinal Barrier in Fatty Liver Diseases. J. Gastrointest. Surg. 2022, 26, 671–683. [Google Scholar] [CrossRef] [PubMed]
- Intestinal Barrier and Permeability in Health, Obesity and NAFLD. Available online: https://www.mdpi.com/2227-9059/10/1/83?utm_source=chatgpt.com (accessed on 10 July 2025).
- Yang, B.; Gong, M.; Zhu, X.; Luo, Y.; Li, R.; Meng, H.; Wang, Y. Correlation between Liver Fibrosis in Non-Alcoholic Fatty Liver Disease and Insulin Resistance Indicators: A Cross-Sectional Study from NHANES 2017–2020. Front. Endocrinol. 2025, 16, 1514093. [Google Scholar] [CrossRef] [PubMed]
- De Munck, T.J.I.; Xu, P.; Verwijs, H.J.A.; Masclee, A.A.M.; Jonkers, D.; Verbeek, J.; Koek, G.H. Intestinal Permeability in Human Nonalcoholic Fatty Liver Disease: A Systematic Review and Meta-Analysis. Liver Int. Off. J. Int. Assoc. Study Liver 2020, 40, 2906–2916. [Google Scholar] [CrossRef]
- Di Zeo-Sánchez, D.E.; Díaz-Alberola, I.; Pinazo-Bandera, J.M.; García-Cortés, M.; Sanabria-Cabrera, J.; Robles-Díaz, M.; Álvarez-Álvarez, I.; Lucena, M.I.; Andrade, R.J.; Villanueva-Paz, M.; et al. Intestinal Permeability and Immune-Inflammatory Markers in Patients with Idiosyncratic Drug-Induced Liver Injury, Drug-Induced Steatosis and Metabolic Dysfunction-Associated Steatotic Liver Disease (MASLD). Br. J. Pharmacol. 2025. [Google Scholar] [CrossRef] [PubMed]
- Benedé-Ubieto, R.; Cubero, F.J.; Nevzorova, Y.A. Breaking the Barriers: The Role of Gut Homeostasis in Metabolic-Associated Steatotic Liver Disease (MASLD). Gut Microbes 2024, 16, 2331460. [Google Scholar] [CrossRef]
- Wei, L.; Yue, F.; Xing, L.; Wu, S.; Shi, Y.; Li, J.; Xiang, X.; Lam, S.M.; Shui, G.; Russell, R.; et al. Constant Light Exposure Alters Gut Microbiota and Promotes the Progression of Steatohepatitis in High Fat Diet Rats. Front. Microbiol. 2020, 11, 1975. [Google Scholar] [CrossRef]
- Jiacheng, X.; Guochu, H.; Minhang, L.; Yinhang, C.; Yu, Z.; Xia, Z.; Jingyun, Y.; Meiwen, T.; Weisheng, L.; Xiaocong, M. The Interventional Role and Mechanism of Total Flavonoids in Lychee Seeds on Rats with Liver Fibrosis. Sci. Rep. 2025, 15, 24320. [Google Scholar] [CrossRef]
- Lau, H.C.-H.; Zhang, X.; Yu, J. Gut Microbiome in Metabolic Dysfunction-Associated Steatotic Liver Disease and Associated Hepatocellular Carcinoma. Nat. Rev. Gastroenterol. Hepatol. 2025, 1–20. [Google Scholar] [CrossRef]
- Coste, S.-C.; Orășan, O.H.; Cozma, A.; Negrean, V.; Sitar-Tăut, A.-V.; Filip, G.A.; Hangan, A.C.; Lucaciu, R.L.; Iancu, M.; Procopciuc, L.M. Metabolic Dysfunction-Associated Steatotic Liver Disease: The Associations between Inflammatory Markers, TLR4, and Cytokines IL-17A/F, and Their Connections to the Degree of Steatosis and the Risk of Fibrosis. Biomedicines 2024, 12, 2144. [Google Scholar] [CrossRef]
- Ghorbani, Z.; Shoaibinobarian, N.; Noormohammadi, M.; Taylor, K.; Kazemi, A.; Bonyad, A.; Khoshdooz, S.; Löber, U.; Forslund-Startceva, S.K. Reinforcing Gut Integrity: A Systematic Review and Meta-Analysis of Clinical Trials Assessing Probiotics, Synbiotics, and Prebiotics on Intestinal Permeability Markers. Pharmacol. Res. 2025, 216, 107780. [Google Scholar] [CrossRef] [PubMed]
Figure 1.
Scatterplot illustrating the relationship between fecal zonulin concentrations and insulin resistance (HOMA-IR). The red line represents the line of best fit with 95% confidence interval. No statistically significant correlation was observed (r = 0.08, p > 0.05).
Figure 1.
Scatterplot illustrating the relationship between fecal zonulin concentrations and insulin resistance (HOMA-IR). The red line represents the line of best fit with 95% confidence interval. No statistically significant correlation was observed (r = 0.08, p > 0.05).
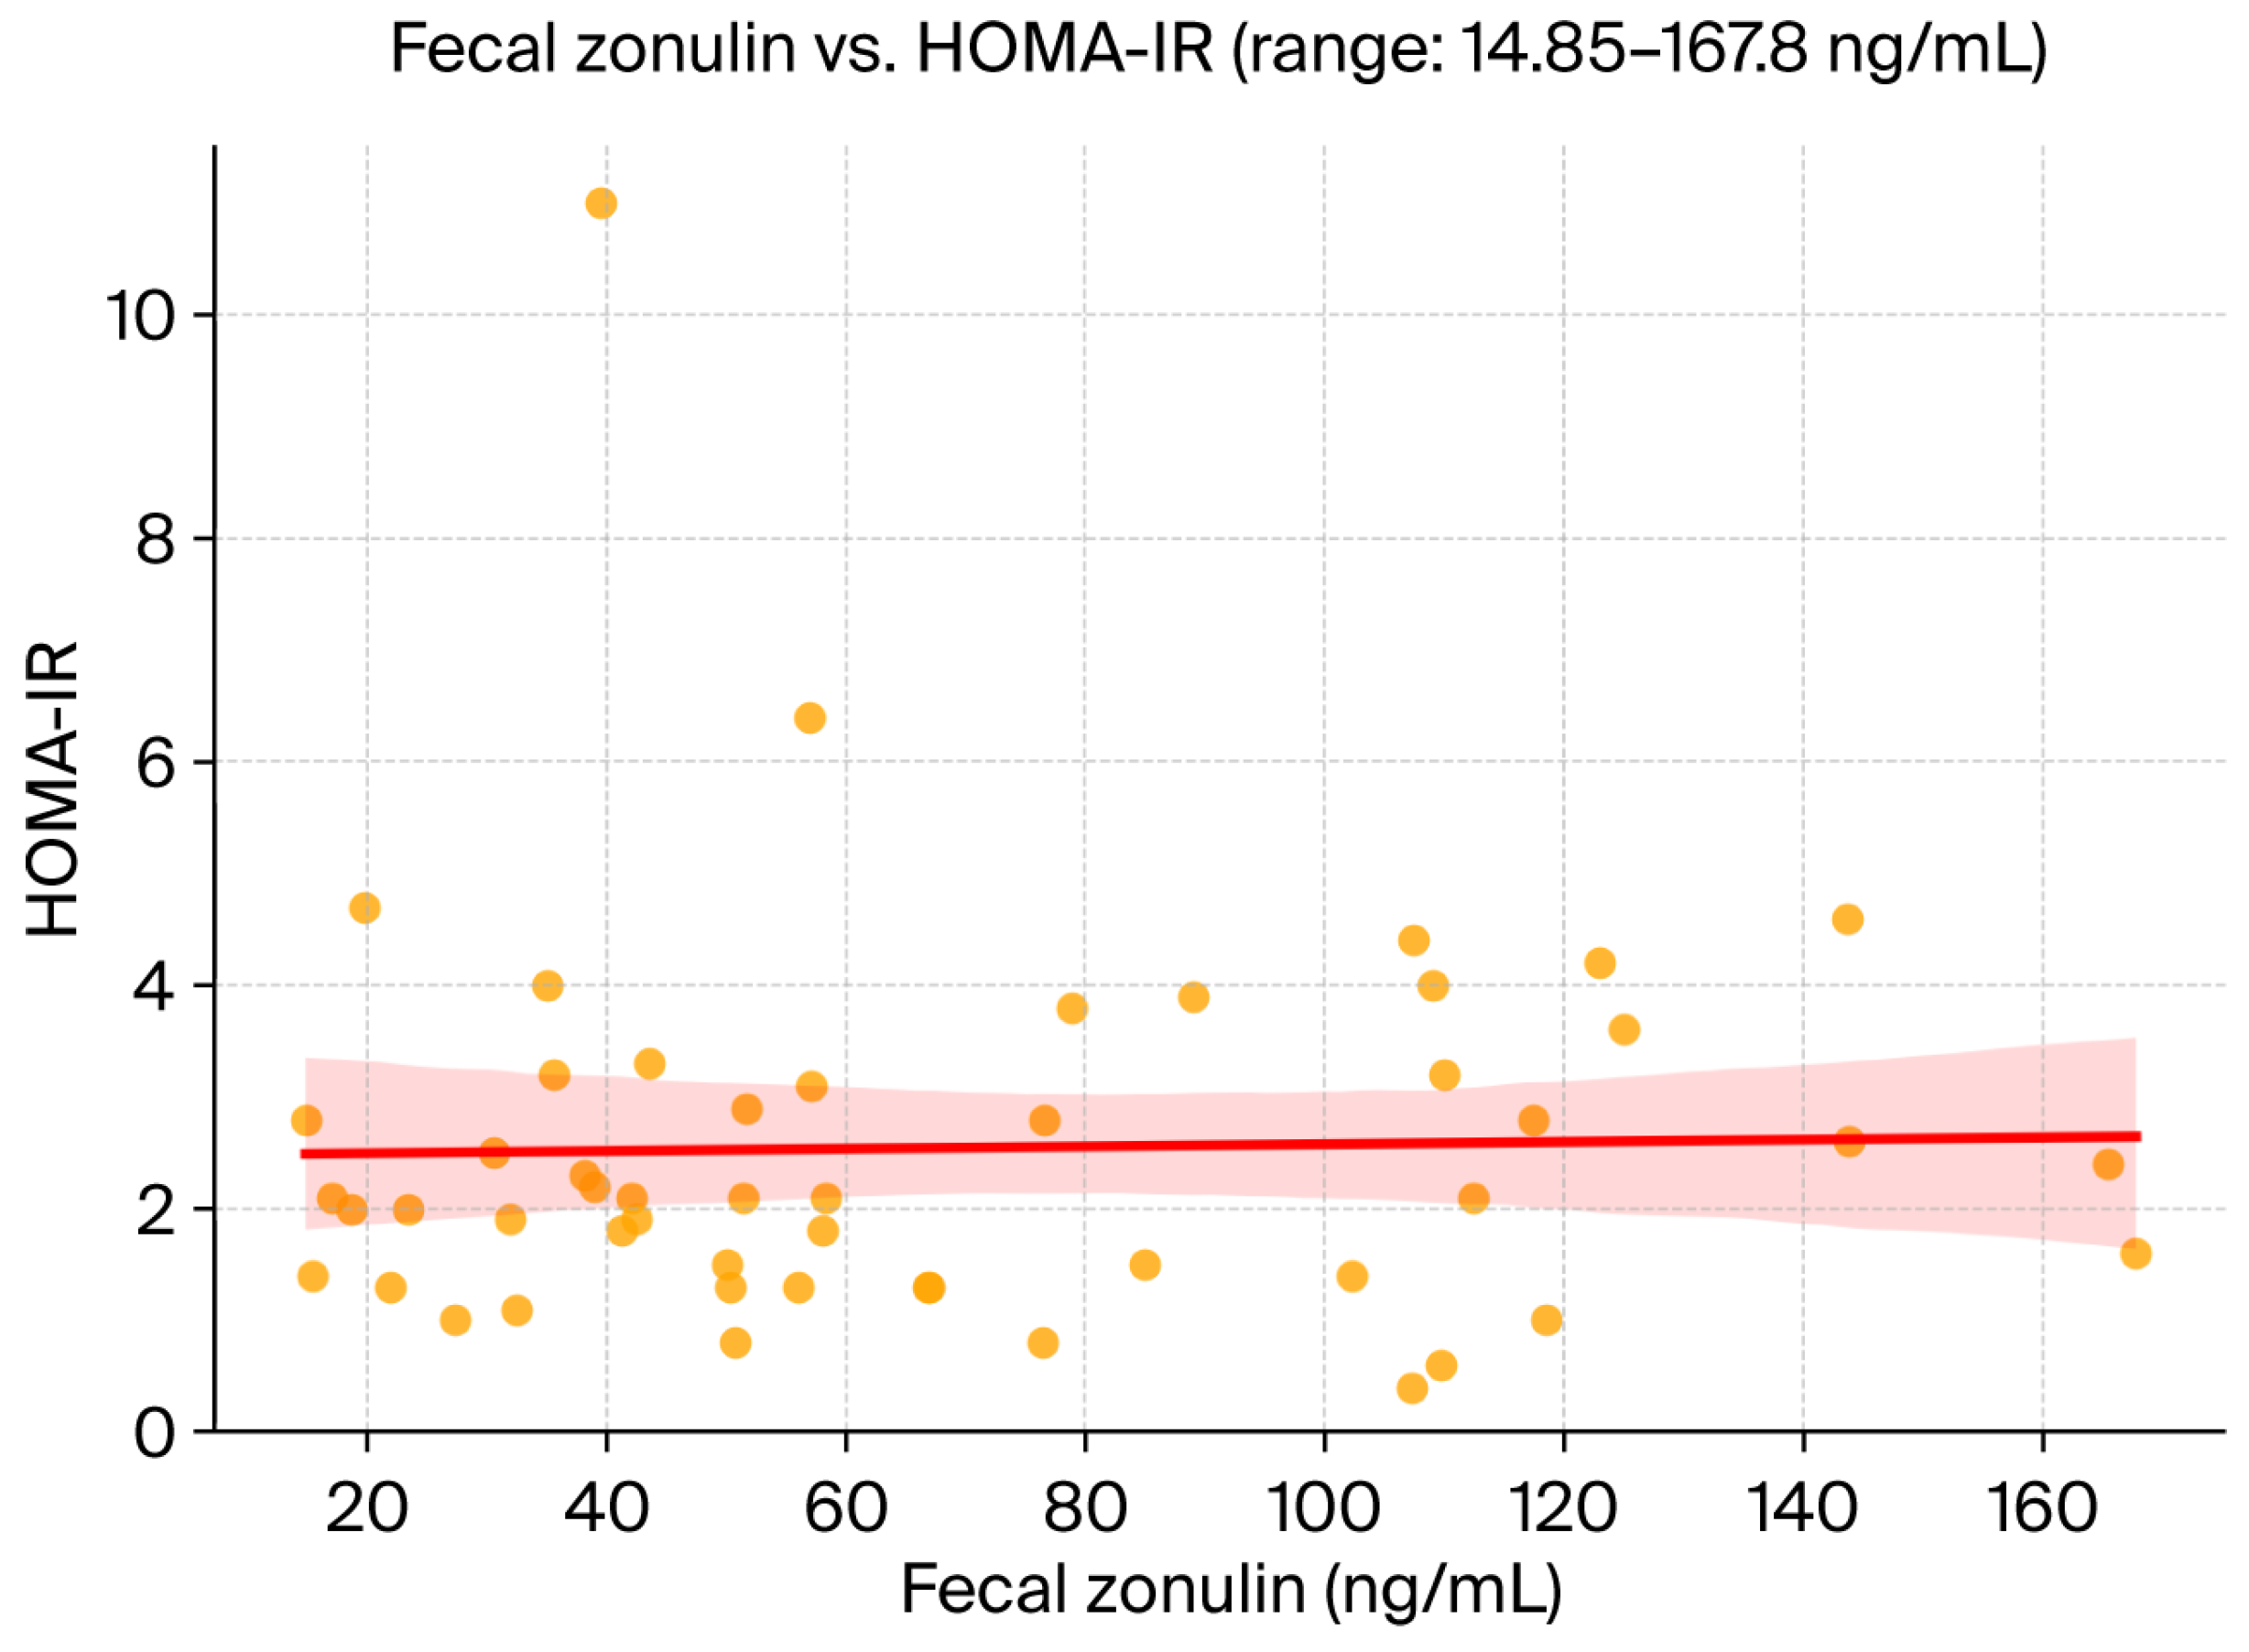
Figure 2.
ROC Curve for Fecal Zonulin Predicting Moderate-to-Severe Steatosis (Steato Test ≥ S2).
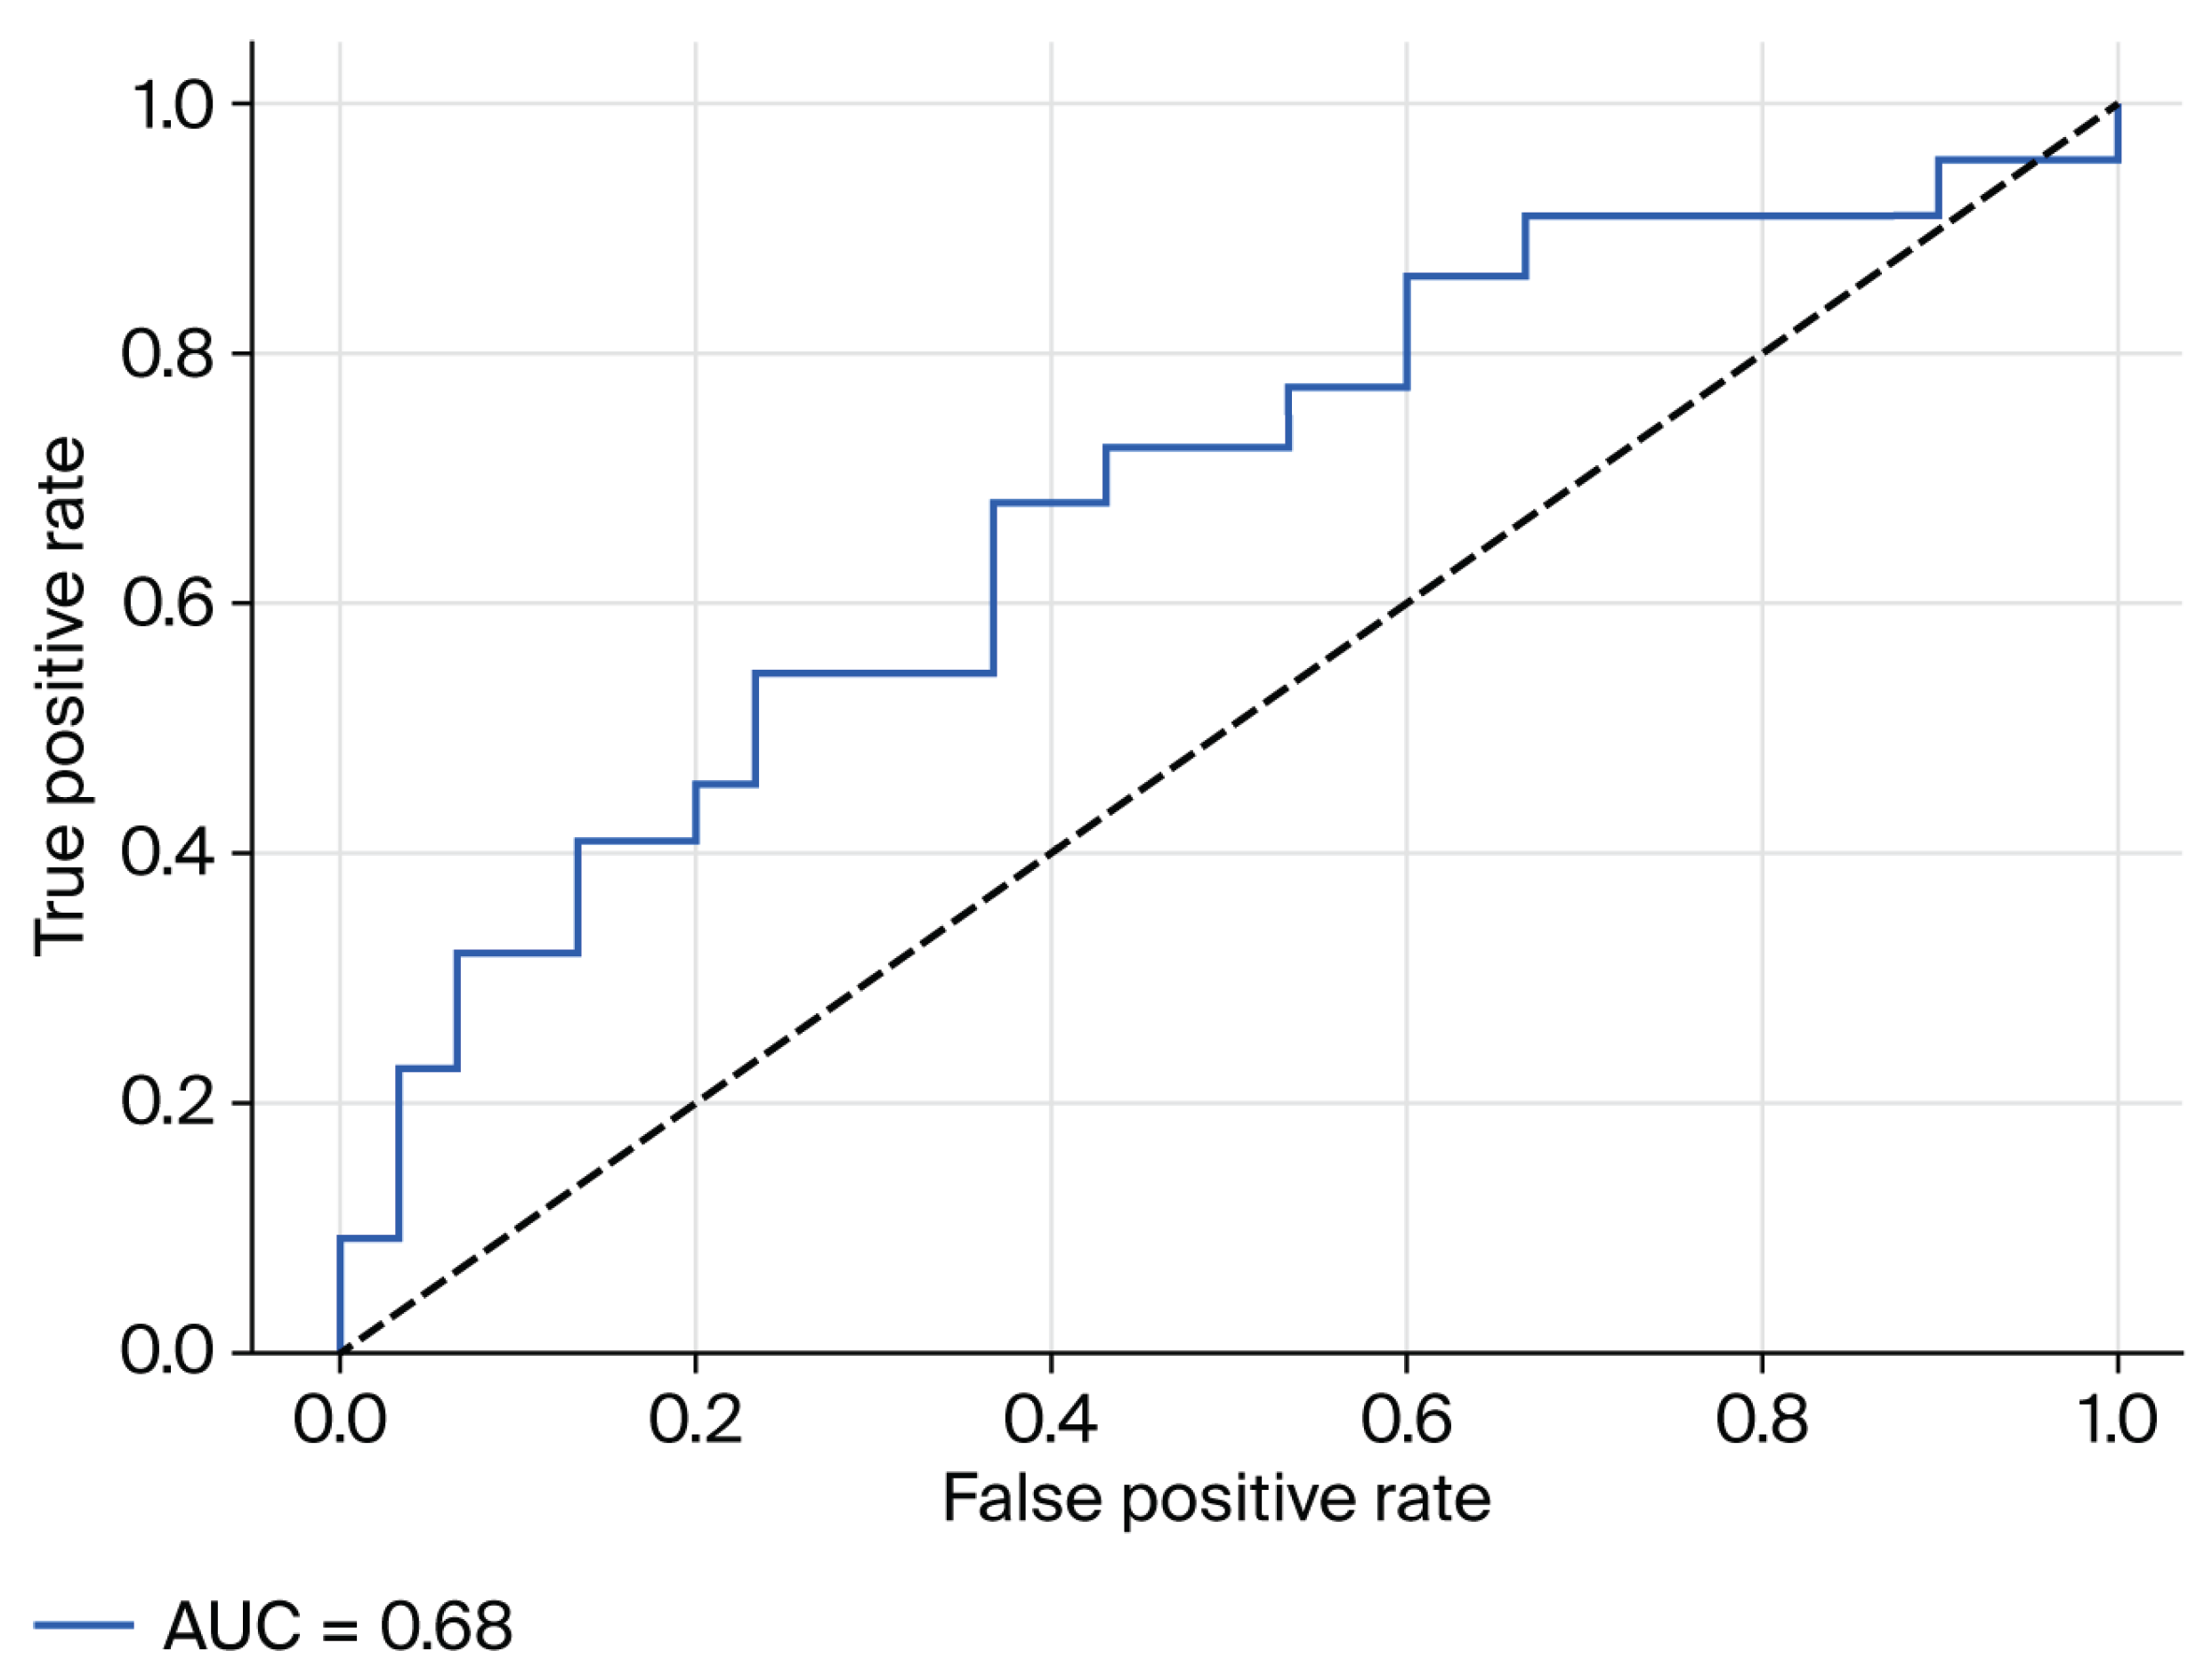

Table 1.
Baseline clinical and metabolic characteristics according to fecal zonulin levels in MASLD patients (n = 52).
Table 1.
Baseline clinical and metabolic characteristics according to fecal zonulin levels in MASLD patients (n = 52).
| Variable | All Patients (n = 52) |
Zonulin ≤ 107 ng/mL (n = 38) | Zonulin > 107 ng/mL (n = 14) | p-Value |
|---|---|---|---|---|
| Age (years) | 43.7 ± 13.2 | 42.1 ± 12.5 | 47.8 ± 14.2 | 0.15 |
| Female, n (%) | 30 (57.7%) | 22 (57.9%) | 8 (57.1%) | 0.95 |
| BMI (kg/m2) | 28.6 ± 5.2 | 27.9 ± 4.8 | 30.4 ± 5.6 | 0.12 |
| HOMA-IR ≥ 2.5, n (%) | 21 (40.4%) | 13 (34.2%) | 8 (57.1%) | 0.18 |
| SteatoTest ≥ S2, n (%) | 31 (59.6%) | 21 (55.3%) | 11 (78.6%) | 0.10 |
| FibroTest ≥ F1, n (%) | 16 (30.8%) | 10 (26.3%) | 5 (31.3%) | 0.73 |
Note: Values are expressed as mean ± SD or n (%). Comparisons were made using Student’s t-test for continuous variables and χ2 test for categorical variables. HOMA-IR ≥ 2.5 defines insulin resistance; SteatoTest ≥ S2 indicates moderate-to-severe steatosis; FibroTest ≥ F1 indicates presence of liver fibrosis.
Table 2.
Distribution of SteatoTest, FibroTest, ActiTest, ad NashTest Scores at Baseline in Patients with MASLD (n = 52).
Table 2.
Distribution of SteatoTest, FibroTest, ActiTest, ad NashTest Scores at Baseline in Patients with MASLD (n = 52).
| Score Type | Category | n (%) |
|---|---|---|
| SteatoTest | S0 (No steatosis) | 10 (19.2%) |
| S1 (Mild) | 15 (28.8%) | |
| S2 (Moderate) | 8 (15.4%) | |
| S3 (Severe) | 10 (19.2%) | |
| Intermediate (S1–S2, S2–S3) | 9 (17.3%) | |
| FibroTest | F0 (No fibrosis) | 33 (63.5%) |
| F1 (Mild) | 6 (11.5%) | |
| F2 (Moderate) | 5 (9.6%) | |
| F3–F4 (Advanced) | 3 (5.8%) | |
| F4 | 5 (9.6%) | |
| ActiTest | A0 (No necroinflammatory activity) | 31 (59.6%) |
| A1 (Mild activity) | 12 (23.1%) | |
| A2–A3 (Moderate–Severe activity) | 9 (17.3%) | |
| NashTest | N0 (No inflammation) | 25 (48.1%) |
| N1 (Possible NASH) | 21 (40.4%) | |
| N2 (Definite NASH) | 6 (11.5%) |
Note: Intermediate SteatoTest stages (e.g., S1–S2, S2–S3) were grouped to reflect clinical ambiguity in biomarker transitions.
Table 3.
Pearson Correlation Matrix Between BMI, SteatoTest, and BARD Score (n = 52).
| BMI | SteatoTest | BARD Score | |
|---|---|---|---|
| BMI | 1 | 0.645 ** | 0.494 ** |
| SteatoTest | 0.645 ** | 1 | 0.369 ** |
| BARD score | 0.494 ** | 0.369 ** | 1 |
Values represent Pearson correlation coefficients. All correlations marked ** are significant at the 0.01 level (2-tailed).
Disclaimer/Publisher’s Note: The statements, opinions and data contained in all publications are solely those of the individual author(s) and contributor(s) and not of MDPI and/or the editor(s). MDPI and/or the editor(s) disclaim responsibility for any injury to people or property resulting from any ideas, methods, instructions or products referred to in the content. |
© 2025 by the authors. Licensee MDPI, Basel, Switzerland. This article is an open access article distributed under the terms and conditions of the Creative Commons Attribution (CC BY) license (http://creativecommons.org/licenses/by/4.0/).
Copyright: This open access article is published under a Creative Commons CC BY 4.0 license, which permit the free download, distribution, and reuse, provided that the author and preprint are cited in any reuse.


