Submitted:
28 July 2025
Posted:
29 July 2025
You are already at the latest version
Abstract
Precision agriculture applies data-driven strategies to manage spatial and temporal variability within fields, aiming to increase productivity while minimizing pressure on natural resources. As interest in smart tillage systems expands, this study explores a central question: Can tillage tools be used to measure soil compaction during regular field operations? To investigate this, vibration data were collected from a cultivator shank using the AVDAQ system. The relationship between shank vibrations and soil compaction, as measured by a cone penetrometer, was evaluated using machine learning models. Both XGBoost and Random Forest demonstrated strong predictive performance, with Random Forest achieving a slightly higher correlation of 93.8% compared to 93.7% for XGBoost. Statistical analysis confirmed no significant difference between predicted and measured values, validating the accuracy and reliability of both models. These findings demonstrate the feasibility of using vibrations generated during tillage to estimate soil compaction under real-time field conditions. With further validation, this approach could be integrated into tractors to enable in-situ soil sensing, reduce tillage intensity, and support more sustainable and energy-efficient cultivation practices.
Keywords:
precision agriculture
; soil compaction
; tillage
; vibration
; sustainable agriculture
1. Introduction
Precision agriculture (PA) has emerged as a transformative approach to modern farming, designed to address the spatial and temporal variability within agricultural fields by leveraging advanced sensing, data analytics, and decision-support technologies [3,25,27]. With a projected global population of 9 to 10 billion by 2050 [6,27,39], food demand is expected to increase by at least 70% [3,9,15]. This rising demand places additional pressure on already constrained natural resources, highlighting the need for innovative, resource-efficient farming solutions. Precision agriculture offers a powerful response by enhancing input efficiency, increasing productivity, and reducing environmental impacts [25]. Among agricultural operations, tillage tools have remained less advanced compared to modern planters, sprayers, and harvesters. However, with the emergence of herbicide- resistant weeds, the need for residue management, field smoothing, and data-centric farming, tillage is increasingly recognized as a critical area for innovation to bring into precision agriculture systems.
Globally, soil compaction is a growing concern. Approximately 68 million hectares of land worldwide are already affected by compaction [29], and this number is expected to increase in the coming decades. The European Union has recognized compaction as a major form of soil degradation, with land use and heavy machinery identified as major contributors [22]. In particular, Central and Eastern Europe face widespread degradation due to excessive soil loading, making compaction the most pervasive type of degradation in those regions [36]. These concerns underscore the urgency of accurately assessing compaction levels in commercial agricultural lands and adopting practices that mitigate its effects.
This process involves the rearrangement of soil particles into a denser configuration, resulting in a decrease in void ratio and porosity, and an increase in bulk density [23,34]. The Soil Science Society of America defines compaction as “the process by which the soil grains are rearranged to decrease void space and bring them into closer contact with one another, thereby increasing the bulk density” [34]. This process involves the densification and distortion of the soil matrix, leading to reduced pore space both within and between soil structural units [10]. As a result, compaction impairs essential soil functions such as aeration, water infiltration, root penetration, and overall microbial activity [10,37].
Effective tillage improves soil conditions for seedbed preparation by physically loosening the soil, incorporating organic matter, forming a consistent surface suitable for planting, managing residue, incorporating herbicide, and create soil conditions that encourage root development. It also plays a central role in managing soil compaction, which can negatively affect crop productivity, water infiltration, nutrient uptake, and stunt downward root growth [28,32]. In integrated weed management systems, tillage and herbicide inputs often interact inversely, as reducing herbicide use typically requires increased mechanical intervention, while reduced tillage intensity tends to increase herbicide reliance to maintain effective weed control and minimize yield loss [24].
Compaction often arises from repeated passes of heavy machinery during agricultural activities such as seedbed preparation and harvesting. Deep compaction, particularly caused by high axle loads, can persist for several years and may not be easily alleviated by conventional tillage practices [18]. This compaction alters the spatial arrangement, size, and shape of soil clods, which in turn reduces pore space both within soil aggregates and in the spaces between them [10]. Soils affected by compaction exhibit increased bulk density and mechanical resistance (e.g., penetrometer resistance), which create physical barriers to root expansion and negatively affect root architecture and distribution [16,18,19,20,30]. Soil dry bulk density and soil strength, particularly mechanical resistance, are widely used indicators to assess soil compaction status. Among these, penetration resistance is the most adopted metric due to its direct measurement of soil resistance to root penetration and tillage. This mechanical impedance also reduces gas exchange and creates anaerobic conditions in the root zone, severely limiting plant growth and development [7,14,30,32]. Should we mention that cone penetrometers are used to measure compaction here?
From a mechanical perspective, understanding soil–tool interaction is essential in both geotechnical engineering and precision agriculture. In tillage and other soil-engaging operations, tools exert both vertical and horizontal forces on the soil. Vertical forces primarily control tool penetration, while horizontal forces govern soil cutting, displacement, and shear deformation—key processes influencing energy consumption and soil structural changes. Soil shear resistance is commonly characterized by the Mohr–Coulomb failure criterion [26]. According to this theory, the shear strength (τ) of soil is defined as:
where c is cohesion, σ is the normal stress, and ϕ is the internal friction angle. This criterion forms the basis for understanding soil mechanical behavior under lateral stresses induced by tillage tools. Traditional methods for assessing soil mechanical resistance, such as soil cone penetrometers, are often static, invasive, time-consuming, and difficult to scale [4,7,12]. While accurate, these methods provide only localized and discrete estimates, failing to capture the dynamic interactions between tools and soil during field operations. To address the limitations of static measurements, Hart (1958) [20] proposed a non-dimensional modeling approach to generalize soil–tool interaction across varying tool types and soil conditions. This framework was further refined by Anat (1965) [5] to incorporate dynamic soil behaviors, including compaction and penetration resistance. During tillage, soil properties such as density, moisture content, and compaction influence the dynamic resistance encountered by tools. As a tillage tool moves through the soil, its vibrational response changes according to the resistance it encounters [41]. Horizontal soil resistance, dominated by shear forces, generates characteristic vibrations that can be measured on the tool. Vibration-based sensing offers a dynamic, non-invasive alternative for estimating horizontal soil resistance, particularly shear strength. Denser, more cohesive soils generate higher resistance, altering both the frequency and amplitude of the tool’s vibrations [19].
τ=c+σ⋅tan(ϕ)
The central question of this work is: Can tillage tools be used to measure soil compaction during regular field operations? We hypothesize that vibration signals generated during tillage operations carry meaningful information about the mechanical properties of the soil, particularly compaction and structural conditions, and can be utilized for real-time monitoring of soil condition during field operations. This information could be used in year-over-year decision-making in precision agriculture management systems. This approach is supported by prior studies across engineering and agricultural domains. For instance, El-Wardany et al. [13] used vibration data to monitor tool wear, while Gebraeel et al. [17] applied neural networks to predict bearing failure from similar signals. Zhang and Chen [41] developed microcontroller-based systems for real-time vibration data acquisition. In the agricultural context, Xiangqian et al. [38] showed that vibration data from subsoilers could support parameter optimization, highlighting the potential of accelerometry and signal analysis in enabling adaptive, sensor-guided machinery operation.
When a field cultivator shank penetrates compacted soil layers, the increased mechanical resistance from the dense soil induces vibrations in the tool. This resistance causes deflection and oscillatory motion of the shank, converting mechanical energy into measurable vibration signals [14]. Experimental studies by Esehaghbeygi et al. [14] further demonstrated that the vibration frequency of the cultivator shank strongly correlates with soil compaction, having a greater influence on draft force and soil fragmentation than factors such as soil moisture or working depth.
To evaluate the relationship between field cultivator shank vibration and soil compaction levels and document soil conditions existing in a field prior to tillage, we developed and compared machine learning models. These models, trained on vibration data, soil moisture, and cone penetrometer measurements, intend to prove a correlation between collected vibration data and collected soil penetrometer and moisture data. Using two models, XGBoost and Random Forest, we intend to demonstrate that vibration data, when properly processed and interpreted, can serve as a reliable predictor of soil compaction before tillage. Furthermore, this work advances the possibility of developing smart tillage tools capable of sensing subsurface soil conditions in real time and dynamically adjusting their operation. Such technology paves the way for more efficient, sustainable, and intelligent soil management practices in modern precision agriculture, enabling the development of automated cultivators that can make on-the-go tillage decisions.
2. Materials and Methods
2.1. Data Collection
Data for this study were collected from an agricultural field located on Knox Lane in Manhattan, Kansas, USA (39.202999° N, 96.543221° W). Field tests were conducted over two growing seasons, from summer 2023 through November 2024. The soil at the site consists of Reading silt loam (moderately wet, rarely flooded) and Eudora–Bismarck Grove silt loams (occasionally flooded), which are representative of typical soil conditions in the region. In the 2023 growing season, the field was planted with maize (Zea mays L.), harvested for silage. The first round of data collection took place on August 17, 2023. The second round was conducted in November 2024, following the harvest of soybeans (Glycine max) in late October 2024. This second collection was carried out in select field locations prior to full-width fall tillage.
2.1.1. Vibration Data Collection
Ridder et al. [33] developed the avDAQ system, which is designed to collect vibration data during agricultural processes, with capabilities including high sampling rates, spatial data logging via GPS, and compatibility with auxiliary sensors. The system features a central platform based on a National Instruments compactRIO device (Model 9053), paired with NI modules for vibration analog and digital data acquisition. It can support multiple accelerometers and is powered by various DC sources, including tractor power and batteries. The avDAQ system was initially tested in a laboratory using a single field cultivator shank taken from a Sunflower 5035 field cultivator. Vibration data was collected and analyzed in both time and frequency domains in this testing. The results showed that the cultivator shank had a natural frequency of around 21.5 Hz, which was consistent with modal analysis from CAD simulations. Following lab validation, the system was field-tested by instrumenting select field cultivator shanks on the Sunflower 5035 field cultivator with accelerometers. The system successfully collected vibration and spatial data during tillage operations, confirming its reliability in mobile agricultural environments. The software, developed with LabVIEW, offers flexibility for data collection and analysis, including real-time monitoring through a graphical user interface (GUI). However, the system can also function independently without the GUI once data collection is verified.
The initial field testing to collect data for vibration analysis involved equipping the Sunflower 5035 field cultivator with the avDAQ system and three single-axis accelerometers. These sensors, labeled ACC1, ACC2, and ACC3, were mounted on three adjacent shanks located on the front rank of shovels on the left side of the cultivator (Figure 1). ACC1 was positioned on the front, leftmost shank, while ACC3 was mounted furthest inboard of the three. The shanks on the Sunflower 5035 are spaced 22.86 cm apart. Each accelerometer was installed approximately parallel to the ground surface to measure horizontal vibrations in the direction of implement movement. The sensors were placed at the curved section of the shovel shank, aligned with the shank centerline (Figure 2), to capture vibrations generated in the direction of travel of the cultivator. For these tests, the cultivator was operated at a forward speed of 9.7 km/h and a working depth of 10 cm, which represents a typical operating depth for this tool [1].
Vibration data were collected on August 17, 2023, following silage harvest and prior to any fall tillage operations. Data were sampled at a rate of 102,000 Hz, synchronized with GPS coordinates, and visualized as heatmaps using the Seaborn library in Python. Figure 3, Figure 4, and Figure 5 present the frequency distribution of vibration (m/s²) recorded by the three accelerometers. ACC1, mounted on the leftmost field cultivator shank, exhibited limited frequency variation, due to it being mostly operated in previously tilled soil. This is shown in Figure 3, where minimal color transitions across most of the field indicate a narrow frequency range. Only the entrance section, shown in darker red tones, displayed relatively higher vibration levels.
As explained by Horn [21], shading of imagery maps, also known as shaded relief or hill shading, is a technique where brightness or tone reflects the surface slope. In Figure 4 and Figure 5, background gradients resemble this shading effect and correspond to elevation variations across the field, as detected by the avDAQ system and known soil compaction areas.
The upper left region of the heatmaps corresponds to the field entrance, where the field is heavily trafficked as equipment enters and exits. This area was subject to repeated loading by loaded silage trucks carrying material away from the field. The central region of the field, where dark shading reflects a bottoming out elevation variability, exhibited high vibration levels recorded by the shank. This zone likely experiences increased mechanical stress due to soil heterogeneity. Notably, a visible channel has formed in the middle of the field as a result of historical river overflows and erosion from seasonal rainfall. This feature likely contributed to reduced soil compaction in that area, as indicated by the lighter tones observed in the heatmaps.
While the initial test with the full-size field cultivator provided an indication that shank vibration could provide some soil compaction information, more fidelity in compaction information was desired. Experimental studies by Esehaghbeygi et al. [14] demonstrated that the vibration frequency of a cultivator shank strongly correlates with soil compaction, which has a greater impact on draft force and soil fragmentation than factors such as soil moisture or working depth. Given the strong influence of soil moisture on soil mechanical behavior and the tool’s vibrational response, soil moisture was concurrently measured with compaction to more accurately interpret the vibration signals [23]. Moisture content directly affects soil strength and shear resistance: wetter soils reduce penetration resistance and increase vibration damping, resulting in lower-amplitude signals, while drier soils produce higher-amplitude vibrations due to increased rigidity [23]. Therefore, including soil moisture measurements was essential to enhance the accuracy and reliability of compaction assessment using vibration data [8]. To investigate this relationship more deeply, a field test was devised for crop year 2024 where compaction, soil moisture, and vibration data would be collected in controlled locations. The test would have soil moisture and soil compaction information collected at geolocated points of interest within the Knox Lane field. A single field cultivator shank fitted with an accelerometer would pass through points where soil compaction and moisture content data had been collected. GPS data would be collected with vibration data to provide a direct comparison of field compaction, soil moisture content, and shank vibration.
A single field cultivator shank and shovel assembly taken from the Sunflower 5035 was mounted on the Cultivation Assessment Test Apparatus, known as the “CAT App.” Developed by Zeller [40], the CAT App is a mobile testing platform designed to evaluate various tillage and planting tools under field conditions across a wide range of operating speeds. The shank was fitted with an accelerometer as in the previous test and the AV-DAQ was used to record vibration and GPS data. Field testing was conducted at locations where notable variation in soil resistance was observed in the previous tests.
The field cultivator shank was mounted on the CAT App frame, as shown in Figure 6, to till the ground between the tracks of the towing tractor tires. The single accelerometer was shown in Figure 2. The selected test locations exhibited distinct variations in vibration response across the field, enabling a more detailed and controlled evaluation of vibration behavior in relation to soil conditions (Figure 7).
The synchronized vibration data collected from the accelerometers, together with soil moisture measurements taken at specific geolocated points, formed the basis for developing machine learning models aimed at predicting soil compaction. By pairing these continuous sensor inputs with ground-truth compaction values obtained from the cone penetrometer, a labeled dataset was created. This dataset was used to develop and train predictive models to compare the relative contributions of vibration and moisture signals in estimating soil compaction.
2.1.2. Soil Compactness Using Penetrometer
The Cone Index, expressed as force per unit basal area (typically in kPa or psi/in²), is a standard measure of soil penetration resistance obtained using a soil cone penetrometer equipped with a 30° circular cone, as specified in ASABE Standard S313.3 [4]. For this study, the Rimik CP40II Cone Penetrometer was used to measure soil compaction at select field locations. This device records cone index values along with time, date, and GPS coordinates, enabling spatially referenced analysis across soil depth profiles.
Although compaction data were collected to the full depth capability of the Rimik CP40II at each location, the analysis in this study focuses specifically on penetrometer readings at 10 cm depth, corresponding to the planned tillage depth. Cone index values at this depth ranged from 20 to 5087 kPa. These values are visualized in Figure 8 using a graduated color scale, where each point represents soil resistance at its respective location.
All measurements followed standardized data acquisition and analysis protocols commonly adopted in soil compaction studies [4]. As noted by Ramsey [31], penetrometer readings may be unreliable in highly compacted soils due to resistance to penetration and difficulty characterizing deeper layers. At geographic locations with extremely compacted soil where the penetrometer could not be inserted, the maximum cone index value recorded in the same field on the same day was assigned to represent extreme compaction, ensuring dataset continuity.
2.1.3. Soil Moisture Data Collection
Soil compaction is significantly influenced by moisture content, as higher moisture levels reduce soil strength and shear resistance, making soils more susceptible to deformation under mechanical stress [23]. In wetter conditions, reduced penetration resistance and increased vibration damping allow the cultivator shank to move more freely through the soil, resulting in lower-amplitude vibration signals. Conversely, drier soils exhibit greater rigidity, leading to amplified vibrational responses. Given this relationship, soil moisture is a critical parameter for interpreting the vibration signals collected from tillage tools [8].
During the experimental period, the field conditions were generally very dry, reflecting below-average soil moisture levels. Soil moisture was measured using a Hydrosense II soil-water sensor (HSII), which recorded volumetric water content (VWC) at a depth of 10 cm. Sensor readings were stored internally and later retrieved for analysis. Measurements were taken concurrently with cone penetrometer tests and vibration data collection. VWC values across the field ranged from 0.16% to 12.69%, indicating notable spatial variability. Incorporating soil moisture data into the analysis enhances the accuracy of vibration-based compaction assessments by contextualizing variations in vibrational behavior under different moisture regimes.
2.2. Data Preprocessing
Data cleaning was performed to address missing values caused by occasional GPS disconnections in the penetrometer and avDAQ systems. Subsequently, soil moisture and cone index data collected at the same depth (10 cm) and geographic coordinates were merged. To spatially integrate vibration data with these measurements, the buffer tool in ArcGIS Pro was employed. Within each buffer zone, vibration data points were assigned the same soil moisture and compaction values, assuming relative uniformity over short distances. The final dataset was stored in a CSV file, containing columns for geographic coordinates (latitude and longitude) along with corresponding vibration data, soil moisture measurements, and soil cone penetrometer readings. Soil moisture and compaction data were obtained at discrete sampling points, whereas vibration signals were recorded continuously as the tillage tool traversed the field. To ensure accurate spatial alignment between datasets, the tool was operated directly over the designated sampling locations.
As noted by Duiker [12], higher cone index values obtained from a penetrometer generally reflect greater levels of soil compaction. In addition, soil moisture significantly influences compaction susceptibility; elevated moisture content reduces soil shear strength, making it more prone to compaction under mechanical stress [35].
Figure 9 and Figure 10 illustrate sensor outputs from selected sampling locations representing contrasting soil conditions. Each figure includes normalized values for geographic coordinates, cone penetrometer measurements (Cone Index, CI), soil moisture content, and corresponding vibration intensity. To visually compare all parameters on the same scale, each dataset was normalized to a range from 0 to 1 using Min-Max scaling. In this scale, a value of 1 represents the maximum observed value within each dataset (e.g., a soil moisture value of 1 corresponds to the actual maximum of 12.69%).
Vibration data were recorded as acceleration signals expressed in units of g, where 1 g corresponds to the acceleration due to Earth's gravity (9.81 m/s²). Raw acceleration values ranged approximately from -0.43 to 0.40 g and were normalized between 0 and 1 to enable direct comparison across variables. For example, a normalized vibration value of 0.75 corresponds to an actual acceleration level of approximately 0.19 g (≈1.86 m/s²), indicating relatively high vibration intensity.
CI values ranged from 20.49 to 5087.0 kPa, so a normalized value of 1 corresponds to a CI of 5087, representing the highest measured soil resistance. Figure 9 represents a location with high normalized vibration intensity and CI values, coupled with low normalized soil moisture, suggesting a compacted soil profile. Conversely, Figure 10 shows lower normalized vibration and CI values along with higher normalized soil moisture content, indicating reduced soil compaction under wetter conditions.
2.3. Prediction of Compaction
Given the high volume, velocity, and complexity of continuous vibration data collected during the second round of field testing in November 2024, machine learning techniques were selected for their ability to efficiently process large datasets and model complex nonlinear relationships. Machine learning’s capacity to extract valuable insights from heterogeneous data sources, such as soil moisture and vibration signals, makes it well suited to predict soil compaction levels based on these values. In this study, vibration and moisture data served as input features to train models aimed at estimating soil compaction, with cone penetrometer measurements as the ground truth (Figure 11). The predicted compaction values were then compared to actual cone index measurements to evaluate model accuracy and the strength of the relationship.
Tree-based machine learning models are particularly effective at capturing complex nonlinear patterns in structured agricultural datasets [36]. Initially, a stacking ensemble model combining Random Forest and Gradient Boosting regressors with a linear regression meta-learner was evaluated. However, this approach yielded limited predictive performance on our dataset, achieving a correlation coefficient of only 0.3704. This outcome likely reflects the complexity of the stacking strategy combined with the large volume and high variability of the data.
To improve prediction accuracy, two individual models known for their robustness in handling nonlinear relationships were selected: Random Forest and XGBoost. Random Forest reduces variance by averaging predictions from multiple decision trees trained on random data subsets (bagging). In contrast, XGBoost builds trees sequentially, correcting residual errors via gradient boosting to enhance overall model performance.
Soil moisture and vibration signals were selected because they reflect key physical and mechanical properties of soil. Moisture affects the soil’s susceptibility to compaction, while vibrations measured during tillage capture real-time resistance experienced by the cultivator shank. In practice, the models learn to associate patterns in these two features with corresponding cone index values. This enables the prediction of soil compaction intensity at locations where only discrete data points are available, offering the potential for continuous, on-the-go compaction monitoring.
Both models were trained using soil moisture content and cultivator shank vibration signals as input features. The target variable was soil compaction measured through cone index values collected in the field.
Hyperparameter tuning was performed using randomized search with cross-validation, optimizing parameters such as number of trees, maximum tree depth, learning rate (specific to XGBoost), and subsampling ratios. The dataset was split into 60% training and 40% testing subsets to enable a rigorous model evaluation.
Model performance was assessed by comparing predicted compaction values with actual (CI) measurements using root mean squared error (RMSE), coefficient of determination (R²), and Pearson correlation, with all metrics calculated based on CI values. This modeling approach effectively captured the relationships between soil moisture, vibration, and soil compaction, supporting the feasibility of real-time soil compaction prediction during tillage operations.
3. Results
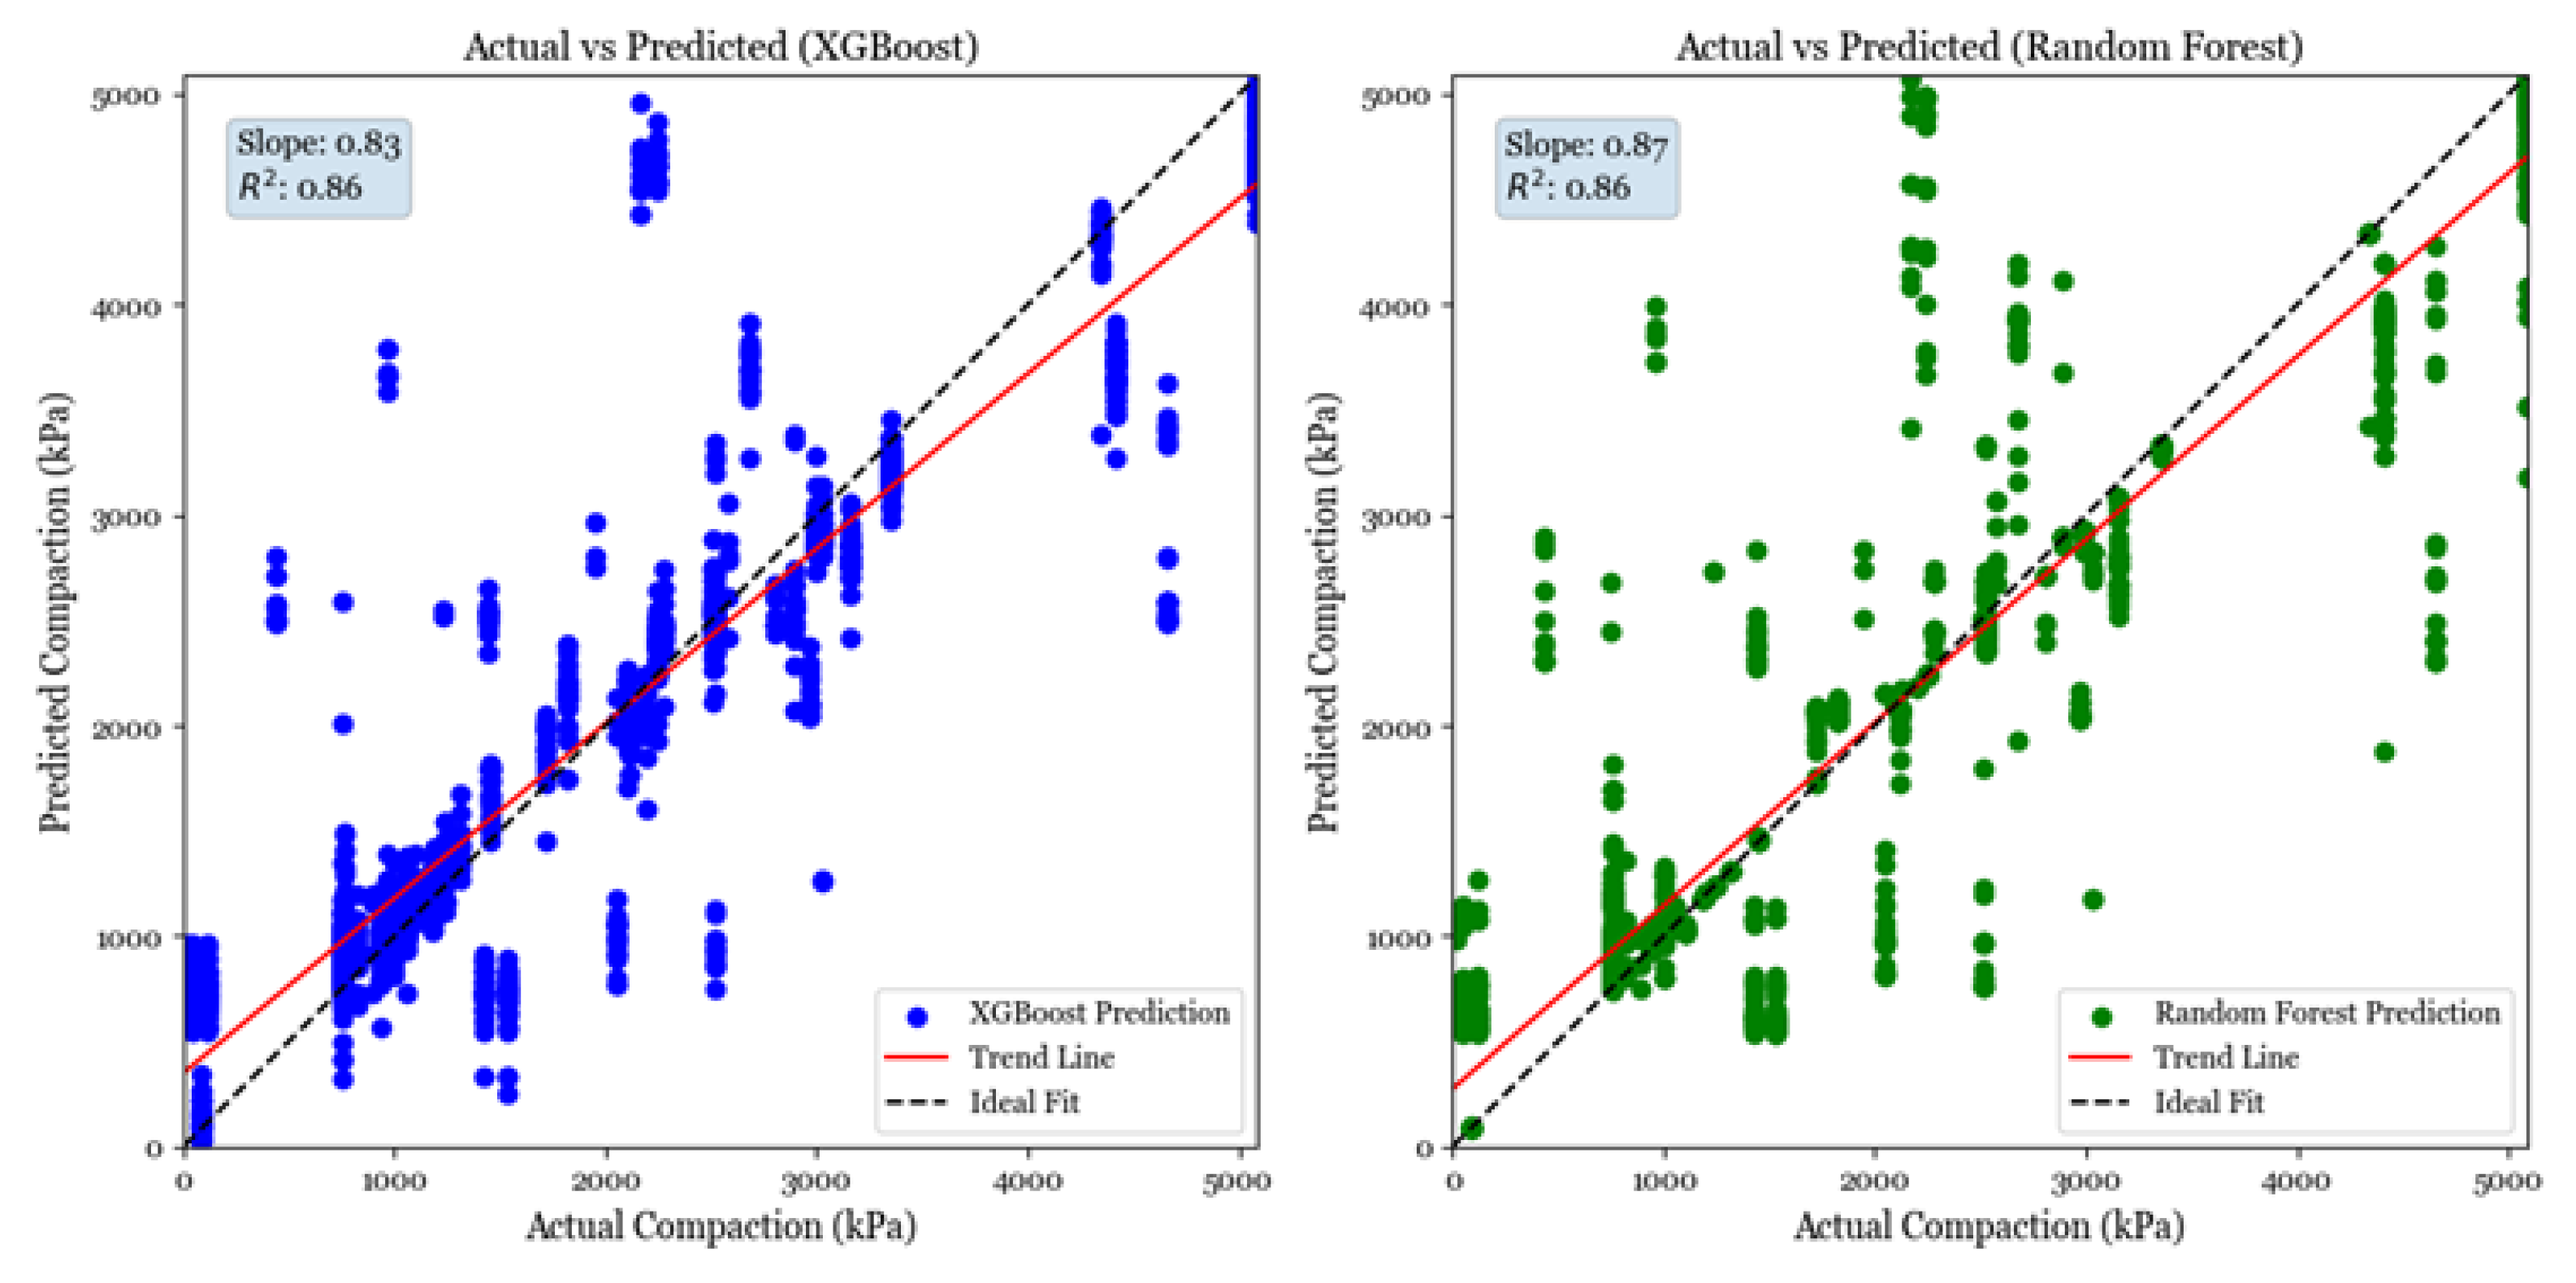
Figure 12 shows scatter plots of actual versus predicted soil compaction values (kPa) for the XGBoost and Random Forest models, based on 40% of data reserved for testing. These models were developed using the vibration and soil moisture data collected during the second round of field testing on August 23, 2024. Each plot includes a red trend line, a dashed black ideal fit line, and annotations indicating the slope and coefficient of determination (R²). Notably, several predicted values are vertically aligned at specific actual compaction levels, including approximately 800, 900, 1200, 1500, 2000, 2500, and 3000 kPa. This clustering results from multiple observations in the dataset sharing the same actual compaction value while yielding different predicted values, due to variations in other input features such as soil moisture content and vibration response. Such patterns are common in field datasets where measurements are discretized or recorded at standard operational levels.
Both models exhibited strong predictive capabilities, with predicted values closely approximating the observed soil compaction measurements. This alignment indicates that the models effectively captured the relationship between the input features, including vibration signals and soil moisture content, and the response variable, soil compaction as measured by the cone index. The XGBoost model achieved a test R² of 0.876, a training R² of 0.870, and a Pearson correlation coefficient of 0.937, demonstrating substantial concordance between predicted and actual values. Similarly, the Random Forest model yielded a test R² of 0.881, a training R² of 0.907, and a correlation coefficient of 0.938.
Root mean squared error (RMSE) values were 536.96 kPa for XGBoost and 527.82 kPa for Random Forest, corresponding to approximately 10.7% and 10.6% error, respectively, based on a compaction range of 0 to 5000 kPa. These values indicate relatively low prediction errors across the full compaction spectrum.
While both models performed consistently across most compaction levels, the Random Forest model exhibited slightly greater dispersion at higher compaction values (above 3500 kPa). This suggests some degree of overestimation or underestimation under extreme conditions. In contrast, XGBoost maintained tighter clustering in this range, indicating more stable performance for highly compacted soils. This characteristic is critical for real-time monitoring in field applications.
These results demonstrate the effectiveness of both models in predicting soil compaction from vibration and moisture data. They support the potential integration of these models into smart tillage and precision soil management systems.
To statistically validate the similarity between predicted and actual values, a one-way ANOVA was conducted. For the XGBoost model, the F-statistic was 0.38 with a p-value of 0.54, while for the Random Forest model, the F-statistic was 0.11 with a p-value of 0.74. In both cases, the p-values exceed the conventional significance threshold of 0.05, indicating no statistically significant difference between the predicted and observed means. This finding reinforces that both models not only capture overall trends but also closely approximate the true distribution of soil compaction within the dataset.
The combination of high coefficients of determination (R²), low root mean squared error (RMSE), and strong Pearson correlation coefficients demonstrates the effectiveness of both XGBoost and Random Forest models in predicting soil compaction using vibration and moisture data. Furthermore, the ANOVA results confirm that the differences between predicted and actual soil compaction values are not statistically significant (p > 0.05), supporting the consistency between model predictions and observed measurements.
4. Discussion
A central objective of this study was to demonstrate high-resolution subsurface mapping of soil conditions at tillage depth using a scalable, field-operable sensing system. Traditional methods such as cone penetrometers provide only point-based data, rendering field-scale mapping labor-intensive and spatially limited. In contrast, integration of sensors into a tillage implement enables continuous data acquisition along the tillage path, facilitating high-resolution compaction maps to support precision agriculture. Although this approach captures soil conditions only prior to the tillage pass and to the implement’s working depth, it provides valuable insights into spatial variability from the previous growing season, informing site-specific soil management strategies.
Incorporation of vibration-based sensing into a tillage implement enabled effective detection of subsurface features such as hard spots and spatial heterogeneity in soil strength. These outputs provide detailed spatial information for precision tillage, facilitating targeted soil management practices that improve soil health and operational efficiency.
A field cultivator was selected due to its structural compatibility with sensor mounting and its applicability for shallow tillage operations. Its consistent working depth facilitated installation of accelerometers on the shanks to effectively capture soil–tool interaction forces. With further refinement of signal processing and interpretation, this methodology may be extended to other soil-engaging tools such as coulters, subsoiler shanks, and planter row units, broadening its applicability across a range of field operations. Although cone penetrometers remain the most widely used instrument for soil compaction assessment, their limitations in field-scale applications are well documented. Accurate measurement in heterogeneous or dry soils is challenging due to the probe’s sensitivity to local variations in soil texture, moisture content, and root density, which often introduce high variability and complicate data interpretation [24,37]. Furthermore, cone penetrometer use is labor-intensive, time-consuming, and susceptible to operator-induced variability related to insertion technique, speed, and soil moisture conditions, particularly under dry circumstances [12]. These factors constrain the feasibility of cone penetrometers for high-resolution, large-scale compaction mapping.
Dynamic penetration devices have been used in other sectors such as pavement engineering but generally lack the spatial resolution, adaptability, and operational integration required for precision agriculture applications [7]. This highlights the need for implement-mounted systems capable of providing continuous, real-time data on soil mechanical properties during routine field operations.
To address these challenges, the AVDAQ system was developed as an embedded vibration-based platform for real-time soil compaction monitoring. By collecting vibration signals via accelerometers affixed to tillage shanks, AVDAQ enables continuous, non-invasive compaction mapping without disrupting field activities. Machine learning models, including XGBoost and Random Forest, demonstrated strong predictive performance in estimating soil compaction from vibration data, with Random Forest achieving the highest correlation of 93.8%. These findings confirm the system’s potential as an effective alternative to traditional penetrometer measurements for high-resolution, field-scale compaction assessment.
AVDAQ overcomes several limitations of conventional approaches by providing automated, operator-independent, and spatially explicit data in real time. Its seamless integration with tillage equipment facilitates informed, site-specific soil management decisions and advances precision tillage practices, thereby contributing to sustainable agriculture.
Future research will focus on improving signal quality by mitigating mechanical noise generated by the towing tractor and machine field motion. The development of advanced filtering and signal processing algorithms to isolate soil–shank interaction frequencies is expected to enhance measurement accuracy and the robustness of associated machine learning models.
Moreover, AVDAQ’s sensitivity to vibration signals may enable detection of machine load dynamics, such as individual wheel or track passes and their localized effects on soil compaction, providing finer spatial resolution. Further investigation of these capabilities may expand the system’s utility in operational monitoring and tillage optimization.
It should be emphasized that the AVDAQ system currently captures soil conditions prior to tillage. While this is valuable for retrospective analysis and operational planning, future research should consider extending its use to post-tillage assessments, providing a more accurate representation of seedbed quality at planting. Furthermore, it should be noted that the resulting compaction maps represent relative compaction levels within the field rather than absolute cone index (CI) values.
5. Conclusions
This study set out to answer the central research question: Can tillage tools be used to measure soil compaction during regular field operations? The results demonstrate that when equipped with vibration sensors and paired with soil moisture data, tillage tools can provide reliable, real-time estimates of soil compaction. From this collected data, field maps showing relative compaction levels within a field can be generated.
Soil compaction poses a significant challenge to sustainable agriculture by reducing pore space, increasing bulk density and penetration resistance, and ultimately degrading soil structure. Repeated use of heavy machinery for tillage, planting, spraying, and harvesting intensifies this problem, leading to long-term declines in soil health, crop growth, and yield.
Vibration data were collected using the AVDAQ system during two field tests: one using a Sunflower 5035 cultivator with multiple shanks, and another with a single-shank cultivator. Among these, the front-left shank provided the most informative vibration signal. This location consistently operated in undisturbed soil and was not influenced by tractor-induced compaction. An improved data collection configuration would include shanks fitted with accelerometers across the width of the implement, placed in similar undisturbed positions. Furthermore, because soil moisture significantly affects compaction, future designs should also incorporate sensors for simultaneous soil moisture data collection.
One of the initial goals of this project was to generate a field-scale map of soil compaction within a production field. Traditional methods, such as cone penetrometers, are labor-intensive and restricted to discrete sampling points, resulting in incomplete spatial resolution. In contrast, the use of shank-mounted vibration sensors during tillage offers a more continuous and efficient mapping solution. Although this method only captures pre-tillage compaction and is limited to the tillage depth, it provides valuable insight into previous field conditions and can inform future management strategies in precision agriculture.
To validate the relationship between vibration and compaction, cone penetrometer measurements were collected from the same field coordinates. Because soil moisture plays a key role in influencing compaction resistance, it was included alongside vibration data as an input variable. Two machine learning models, XGBoost and Random Forest, were trained using these features, with cone index values serving as ground truth.
Both models demonstrated strong predictive performance. The XGBoost model achieved a Pearson correlation coefficient of 0.937, while the Random Forest model achieved 0.938, indicating high agreement between predicted and observed compaction values. A one-way ANOVA test confirmed no statistically significant differences between predicted and actual means, with p-values of 0.54 for XGBoost and 0.74 for Random Forest. These results support the models’ ability to not only capture overall trends but also closely approximate actual compaction levels throughout the field.
This study highlights the viability of using shank vibration and soil moisture data for continuous, in-field monitoring of soil compaction. Unlike cone penetrometers, which offer discrete point-based measurements, the AVDAQ system enables spatially continuous sensing during regular tillage operations. Future work should focus on advanced signal processing techniques to filter out engine noise and isolate vibration frequencies specifically related to soil–tool interactions. Continued development of this method may enable real-time soil monitoring, reduce unnecessary tillage, and promote more sustainable and energy-efficient agricultural practices.
Author Contributions
Conceptualization, E.B.; methodology, S.J.; software, D.F. and E.R.; validation, S.J.; formal analysis, S.J.; investigation, S.J.; resources, S.J.; data curation, S.J.; writing—original draft preparation, S.J.; writing—review and editing, S.J. and E.B.; visualization, S.J.; supervision, S.J.; project administration, E.B.; funding acquisition, E.B. All authors have read and agreed to the published version of the manuscript.
Funding
This research was funded by AGCO Corporation under a cooperative research agreement.
Institutional Review Board Statement
Not applicable.
Data Availability Statement
The data presented in this study are not available due to privacy and confidentiality restrictions.
Conflicts of Interest
The authors declare no conflicts of interest. The funders had no role in the design of the study; in the collection, analyses, or interpretation of data; in the writing of the manuscript; or in the decision to publish the results.
Abbreviations
| CI | Cone Index |
| VWC | Volumetric Water Content |
| HSII | Hydrosense II Soil-Water Sensor |
| GUI | Graphical User Interface |
References
- Abbaspour-Gilandeh, Y., Fazeli, M., Roshanianfard, A., Hernández-Hernández, J. L., Fuentes Penna, A., & Herrera-Miranda, I. (2020). Effect of different working and tool parameters on performance of several types of cultivators. Agriculture, 10(5), 145. [CrossRef]
- Aitkenhead, M., & Coull, M. (2020). Mapping soil profile depth, bulk density and carbon stock in Scotland using remote sensing and spatial covariates. European Journal of Soil Science, 71(4), 553-567. [CrossRef]
- Alfred, R., Obit, J.H., Chin, C.P.Y., Haviluddin, H., Lim, Y. (2021). Towards Paddy Rice.
- American Society of Agricultural and Biological Engineers. (2018). Soil Cone Penetrometer (ASABE S313.3). St. Joseph, MI: Author.
- Anat, A., Duke, H. R., & Corey, A. T. (1965). Steady upward flow from water tables.
- Bhat, S.A.; Huang, N.-F. Big Data and AI Revolution in Precision Agriculture: Survey and Challenges. IEEE Access 2021, 9, 110209–110222. [CrossRef]
- Birl, L., & Morrison Jr, J. E. (2002). 2.8 Soil penetrometers and penetrability. Methods of Soil Analysis: Part 4 Physical Methods, 5, 363-388.
- Cardei, P., Sfiru, R., Muraru, S., & Condruz, P. (2020). Soil moisture influence in the soil tillage operations. In E3S Web of Conferences (Vol. 180, p. 03002). EDP Sciences.
- Cravero, A.; Sepúlveda, S. Use and Adaptations of Machine Learning in Big Data— Applications in Real Cases in Agriculture. Electronics 2021, 10, 552. [CrossRef]
- Défossez, P., & Richard, G. (2002). Models of soil compaction due to traffic and their evaluation. Soil and Tillage Research, 67(1), 41-64. [CrossRef]
- Défossez, P., & Richard, G. (2002). Models of soil compaction due to traffic and their evaluation. Soil and Tillage Research, 67(1), 41-64. [CrossRef]
- Duiker, S. W. (2002). Diagnosing soil compaction using a penetrometer (soil compaction tester). Agronomy facts, 63(4).
- El-Wardany, T. I., Gao, D., & Elbestawi, M. A. (1996). Tool condition monitoring in drilling using vibration signature analysis. International Journal of Machine Tools and Manufacture, 36(6), 687-711. [CrossRef]
- Esehaghbeygi, A., Abedi, M., Razavi, J., & Hemmat, A. (2020). Field evaluation of a vibrating dual bent-share cultivator. Research in Agricultural Engineering, 66(4). [CrossRef]
- Filipe, J.; Śmiałek, M.; Brodsky, A.; Hammoudi, S. (Eds.) Enterprise Information Systems: 21st International Conference, ICEIS 2019, Heraklion, Crete, Greece, 3–5 May 2019, Revised Selected Papers. In Lecture Notes in Business Information Processing; Springer International Publishing: Cham, Switzerland, 2020; Volume 378.
- Gan-Mor, S., & Clark, R. L. (2001). DGPS-Based Automatic Guidance–Implementation and Economical Analysis. ASAE Annual Inter. Meeting, ASAE Paper.
- Gebraeel, N., Lawley, M., Liu, R., & Parmeshwaran, V. (2004). Residual life predictions from vibration-based degradation signals: a neural network approach. IEEE Transactions on industrial electronics, 51(3), 694-700. [CrossRef]
- Hamza, M. A., & Anderson, W. K. (2005). Soil compaction in cropping systems: A review of the nature, causes and possible solutions. Soil and tillage research, 82(2), 121-145.
- Han, K., Wang, J., Xiao, T., Li, S., Zhang, D., & Dong, H. (2024). Effects of train vibration load on the structure and hydraulic properties of soils. Scientific Reports, 14(1), 7393. [CrossRef]
- Hart, E. G., Kondner, R. L., & Boyer, W. C. (1958). Analysis for partially penetrating sand drains. Journal of the Soil Mechanics and Foundations Division, 84(4), 1812-1.
- Horn, B. K. (1981). Hill shading and the reflectance map. Proceedings of the IEEE, 69(1), 14-47. IEEE Access, 9, 50358- 50380.
- Jones, R. A. L. (2004). Soft machines: nanotechnology and life. Oxford University Press.
- Keller, T. (2004). Soil compaction and soil tillage-studies in agricultural soil mechanics (No. 489).
- Mason-Jones, K., Vrehen, P., Koper, K., Wang, J., van Der Putten, W. H., & Veen, G. C. (2020). Short-term temperature history affects mineralization of fresh litter and extant soil organic matter, irrespective of agricultural management. Soil Biology and Biochemistry, 150, 107985. [CrossRef]
- McFadden, J.; Njuki, E.; Griffin, T. Precision Agriculture in the Digital Era: Recent Adoption on U.S. Farms. US Department of Agriculture, Economic Research Service 248. 2023. Available online: https://www.ers.usda.gov (accessed on 2 March 2023).
- Mohr, E. (1900). Amine der Pyridinreihe... J. Hörning.
- Monteiro, A.; Santos, S.; Gonçalves, P. Precision Agriculture for Crop and Livestock Farming—Brief Review. Animals 2021, 11, 2345. [CrossRef]
- Nawaz, M. F., Bourrie, G., & Trolard, F. (2013). Soil compaction impact and modelling. A review. Agronomy for sustainable development, 33, 291-309. [CrossRef]
- Oldeman, R. A. (1992). Architectural models, fractals and agroforestry design. Agriculture, ecosystems & environment, 41(2), 179-188. [CrossRef]
- Radford, I. J., Dickinson, K. J., & Lord, J. M. (2007). Functional and performance comparisons of invasive Hieracium lepidulum and co-occurring species in New Zealand. Austral Ecology, 32(3), 338-354. [CrossRef]
- Ramsey, N. (2010, May). Some issues related to applications of the CPT. In 2nd International Symposium on Cone Penetration Testing, CPT (Vol. 10).
- Raper, R. L. (2005). Agricultural traffic impacts on soil. Journal of Terramechanics, 42(3-4), 259-280. [CrossRef]
- Ridder, E., Brokesh, E., JanbaziAlamdari, S., & Vail, B. (2023). Development of the Agricultural Vibration Data Acquisition Platform (avDAQ). In 2023 ASABE Annual International Meeting (p. 1). American Society of Agricultural and Biological Engineers. Smart Farming: A Review on Big Data, Machine Learning, and Rice Production Tasks.
- Soil Science Society of America. (2008). Glossary of Soil Science Terms (88 p). Soil Science Society of America, Madison, WI.
- Tavankar, F., Picchio, R., Nikooy, M., Jourgholami, M., Latterini, F., & Venanzi, R. (2021). Effect of soil moisture on soil compaction during skidding operations in poplar plantation. International Journal of Forest Engineering, 32(2), 128-139. [CrossRef]
- Van den Akker, J. J. (2004). SOCOMO: a soil compaction model to calculate soil stresses and the subsoil carrying capacity. Soil and Tillage Research, 79(1), 113-127. [CrossRef]
- Willoughby, C. M., Topp, C. F., Hallett, P. D., Stockdale, E. A., Walker, R. L., Hilton, A. J., & Watson, C. A. (2023). Soil health metrics reflect yields in long-term cropping system experiments. Agronomy for Sustainable Development, 43(5), 65. [CrossRef]
- Xiangqian, D. O. N. G., ZHENG, H., Chen, S. U., Yonglei, L. I., Jiannong, S. O. N. G., & Jicheng, W. A. N. G. (2022). TEST AND ANALYSIS OF VIBRATION CHARACTERISTICS OF VIBRATION SUBSOILER. INMATEH-Agricultural Engineering, 68(3).
- Yazdinejad, A., Zolfaghari, B., Azmoodeh, A., Dehghantanha, A., Karimipour, H., Fraser, E., ... & Duncan, E. (2021). A review on security of smart farming and precision agriculture: Security aspects, attacks, threats and countermeasures. Applied Sciences, 11(16), 7518. [CrossRef]
- Zeller, J. (2018). Mobile soil bin development and testing (Doctoral dissertation).
- Zhang, J. (1997). Vibratory analysis of tillage operation (Doctoral dissertation, University of Saskatchewan).
Figure 1.
Position of Three single axis accelerometers.
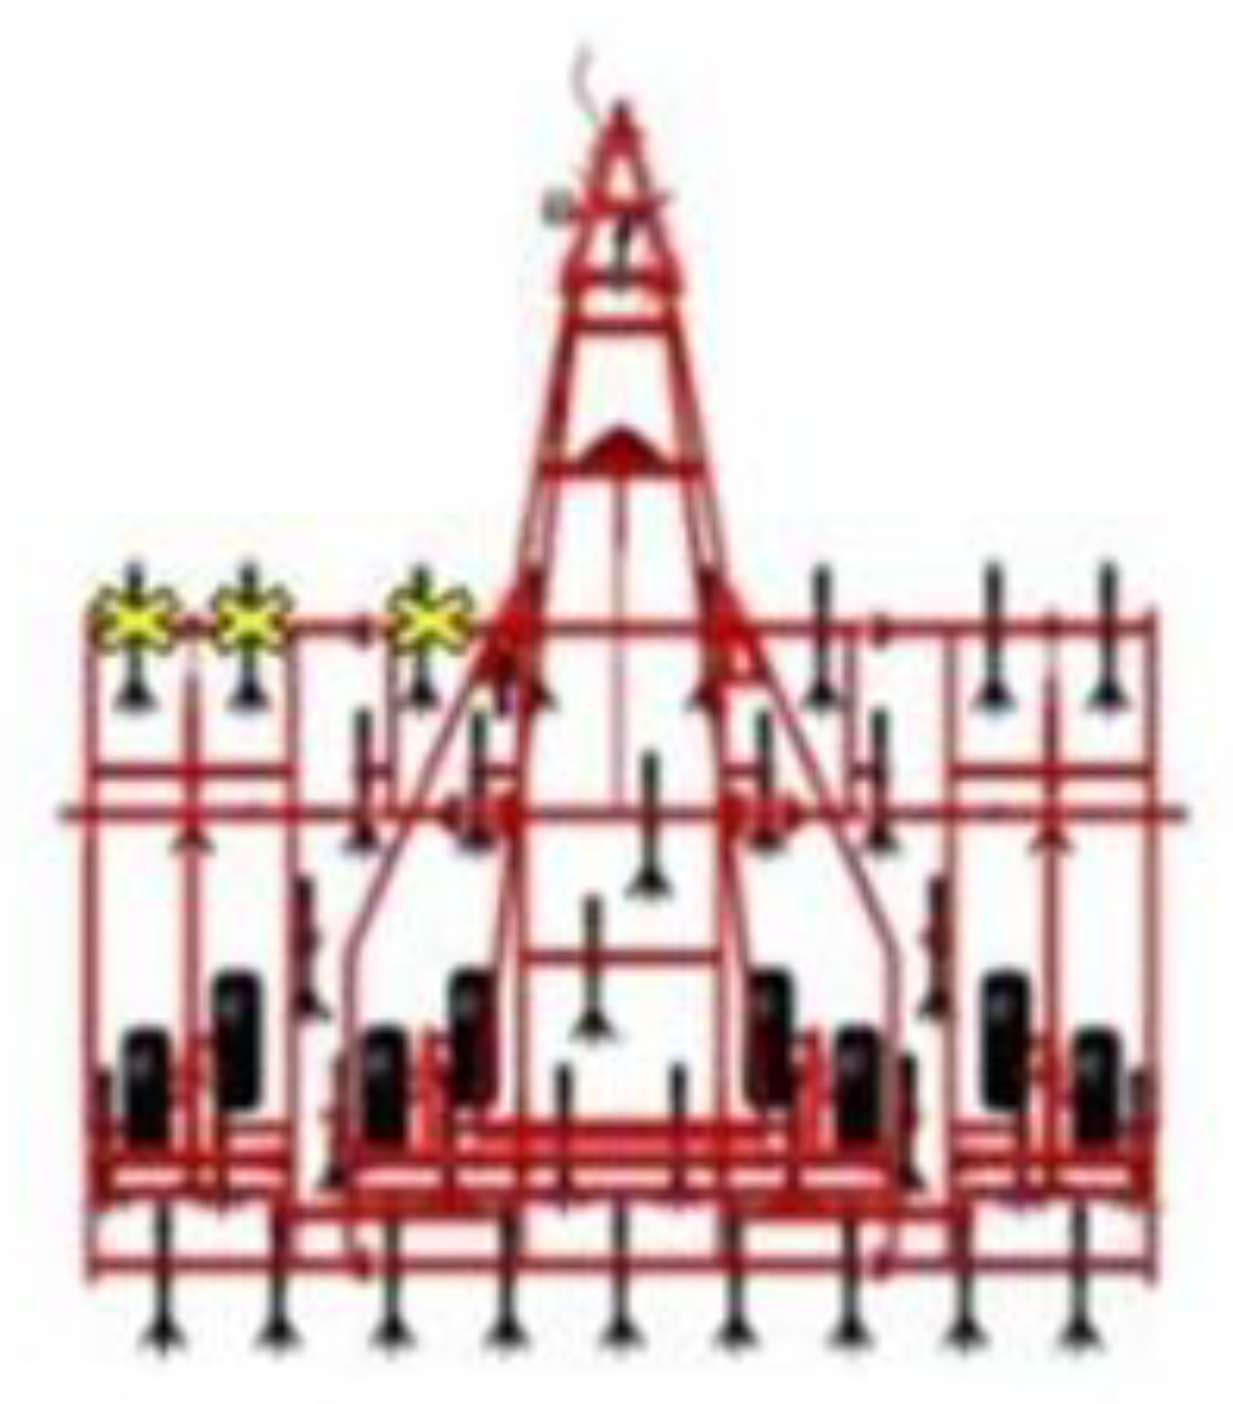
Figure 2.
Position of accelerometers.
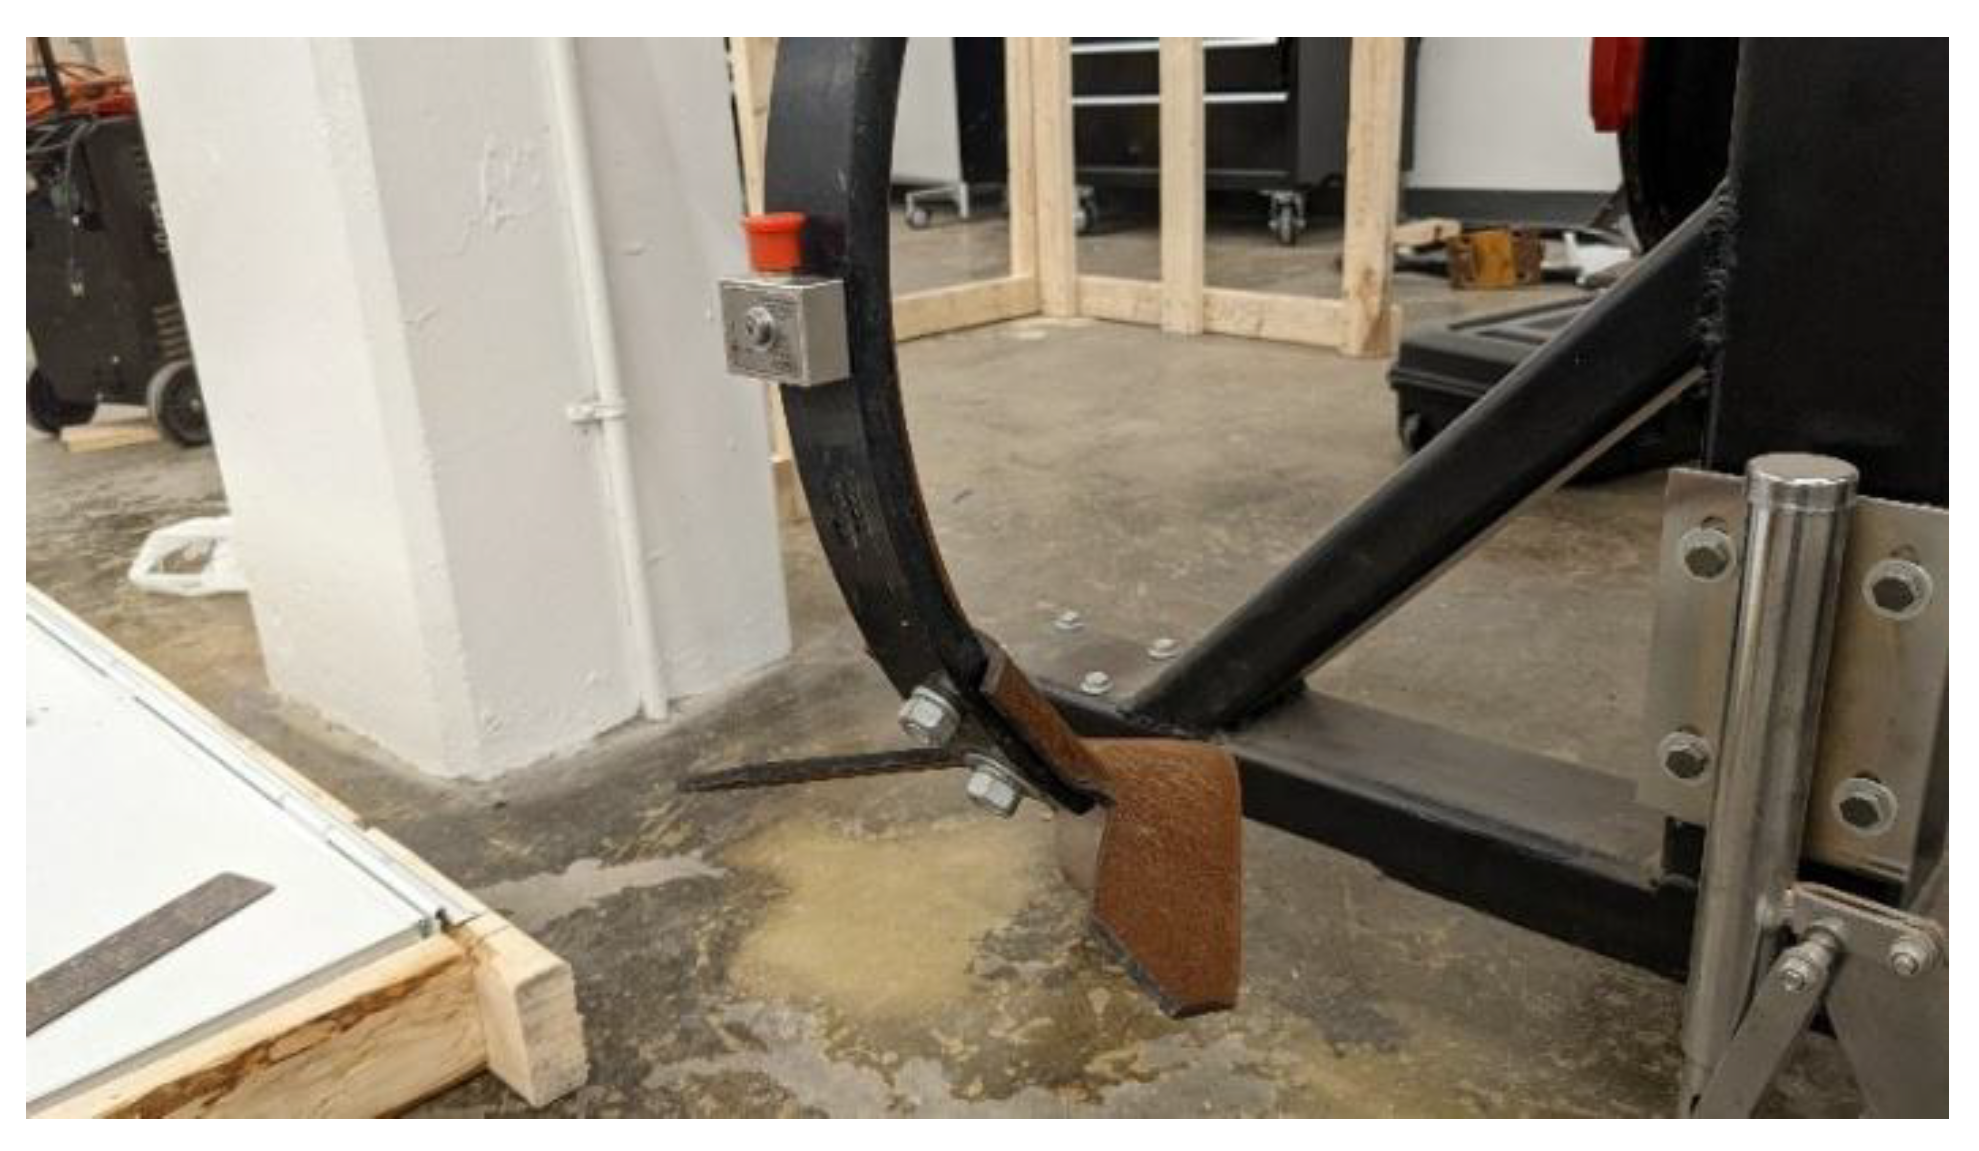
Figure 3.
Spatial Visualization of Vibration Data of Accelerometer1.
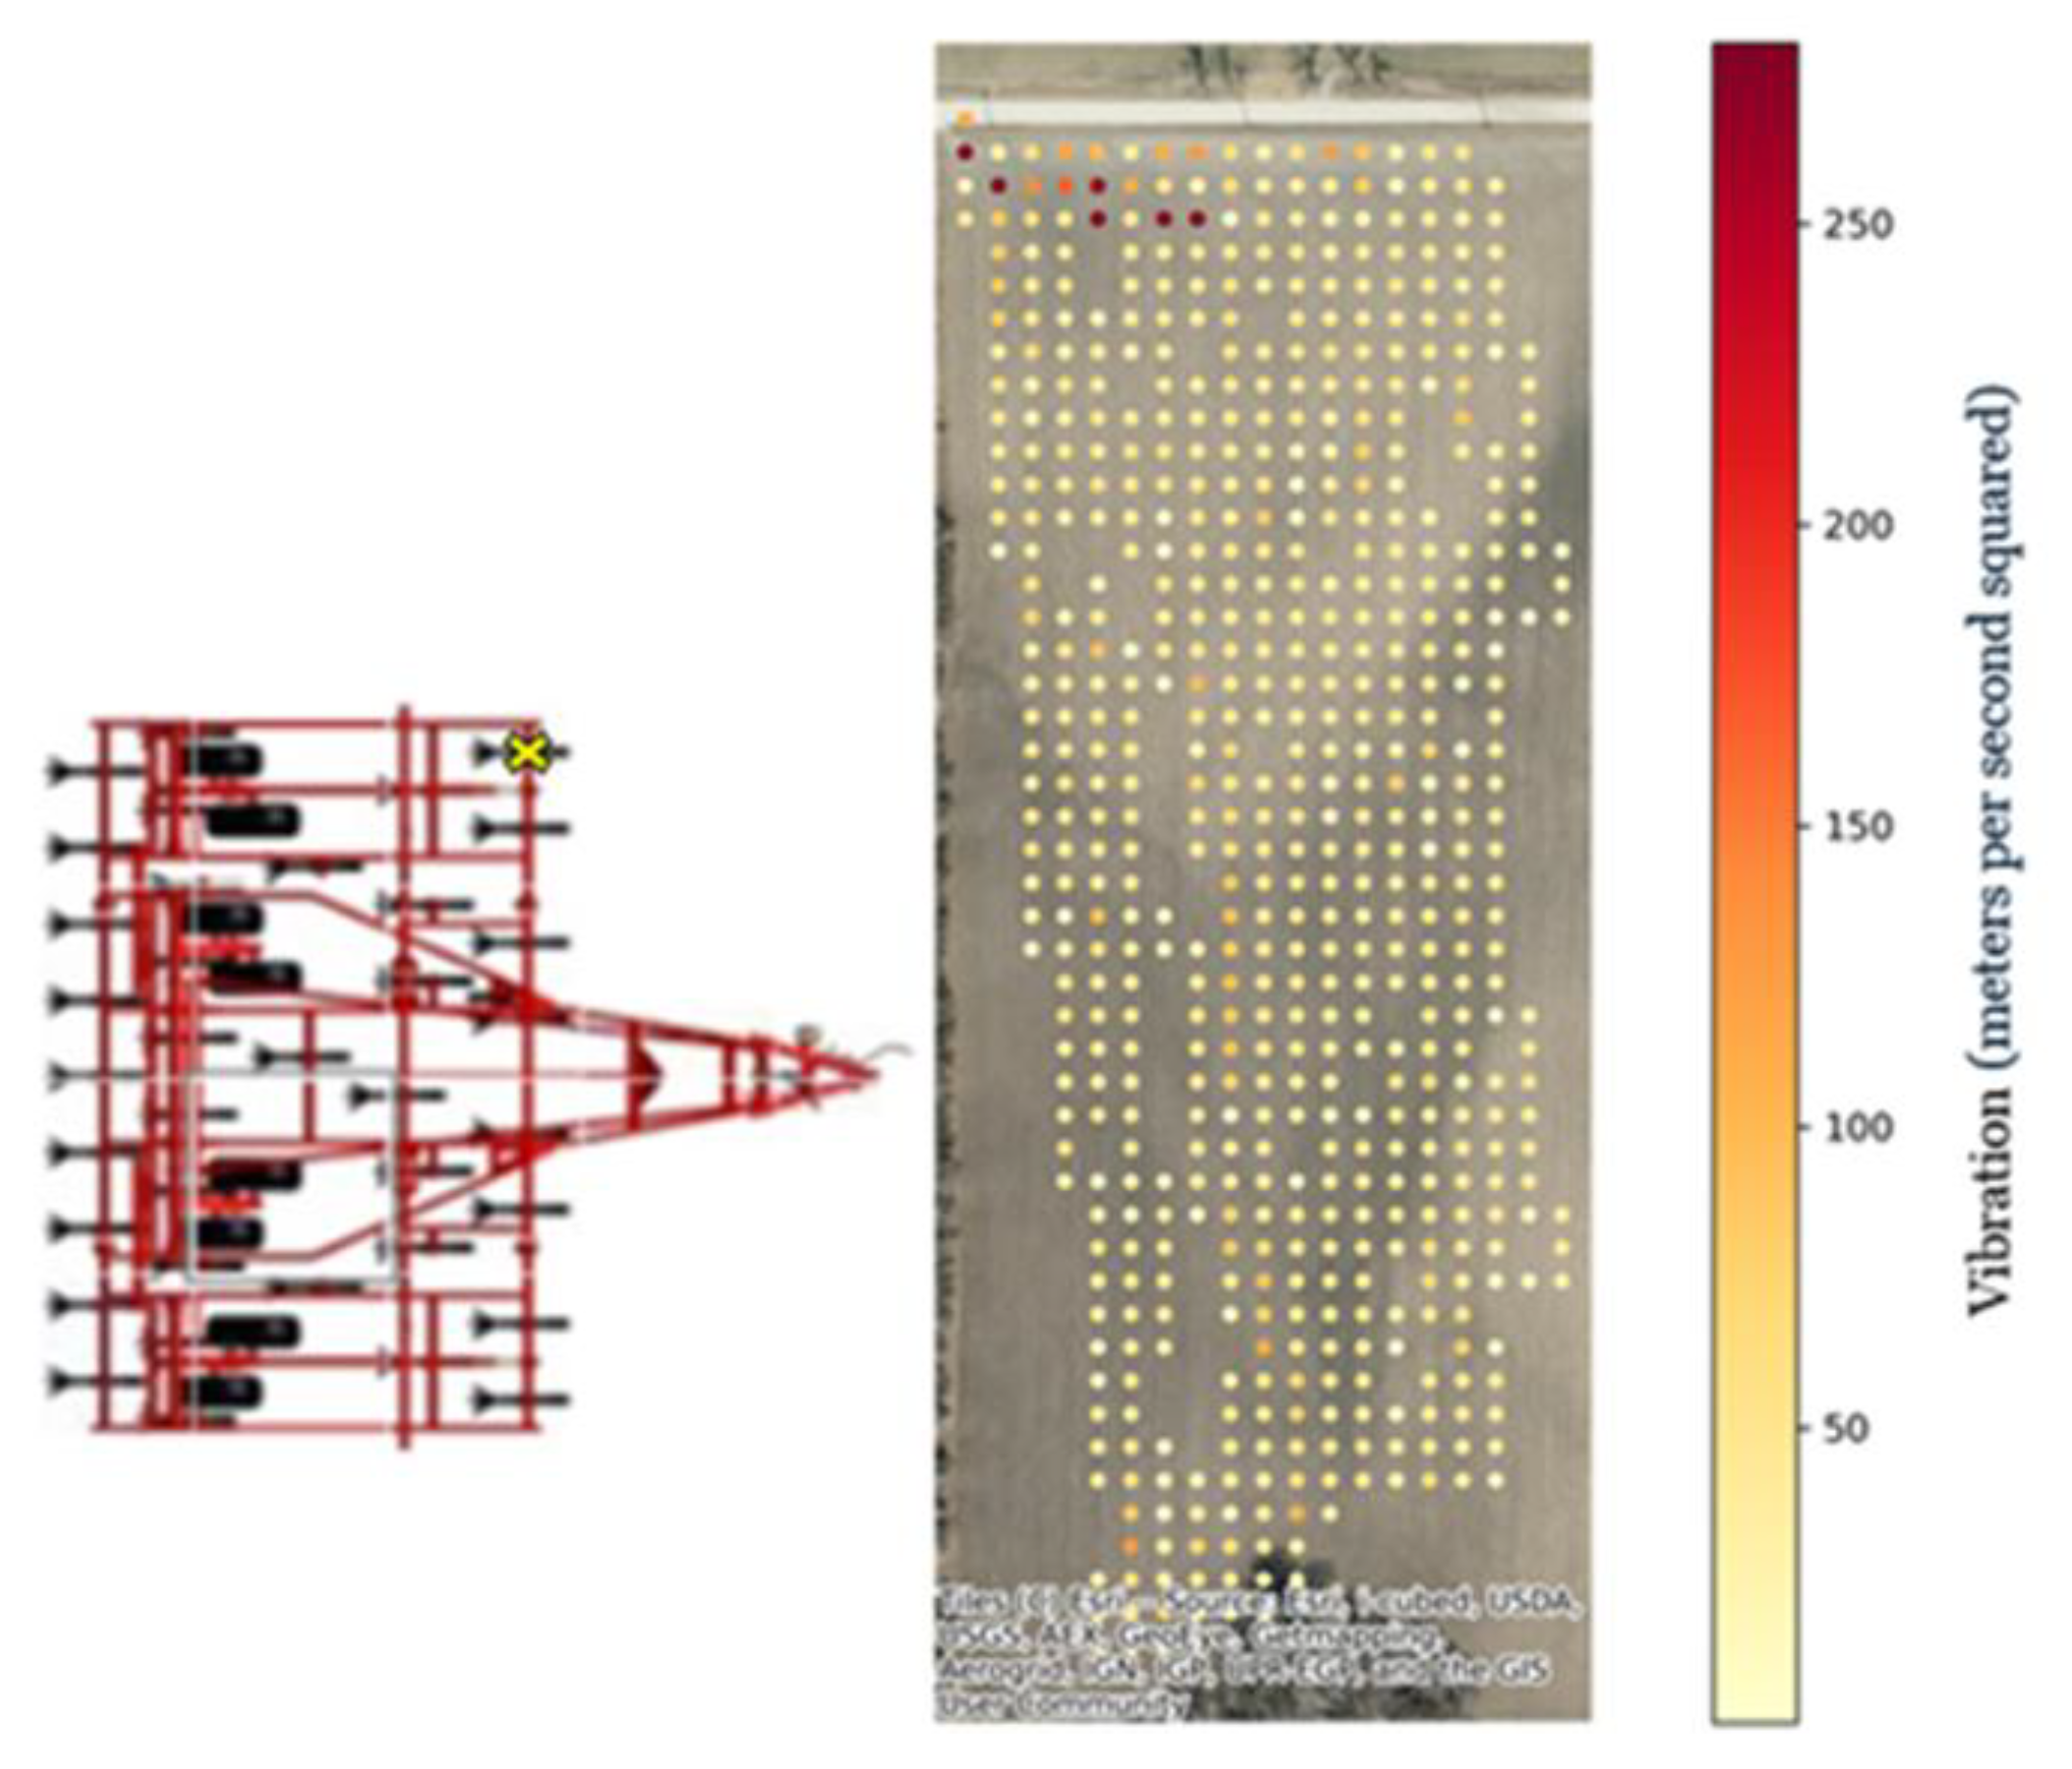
Figure 4.
Spatial Visualization of Vibration Data of Accelerometer2.
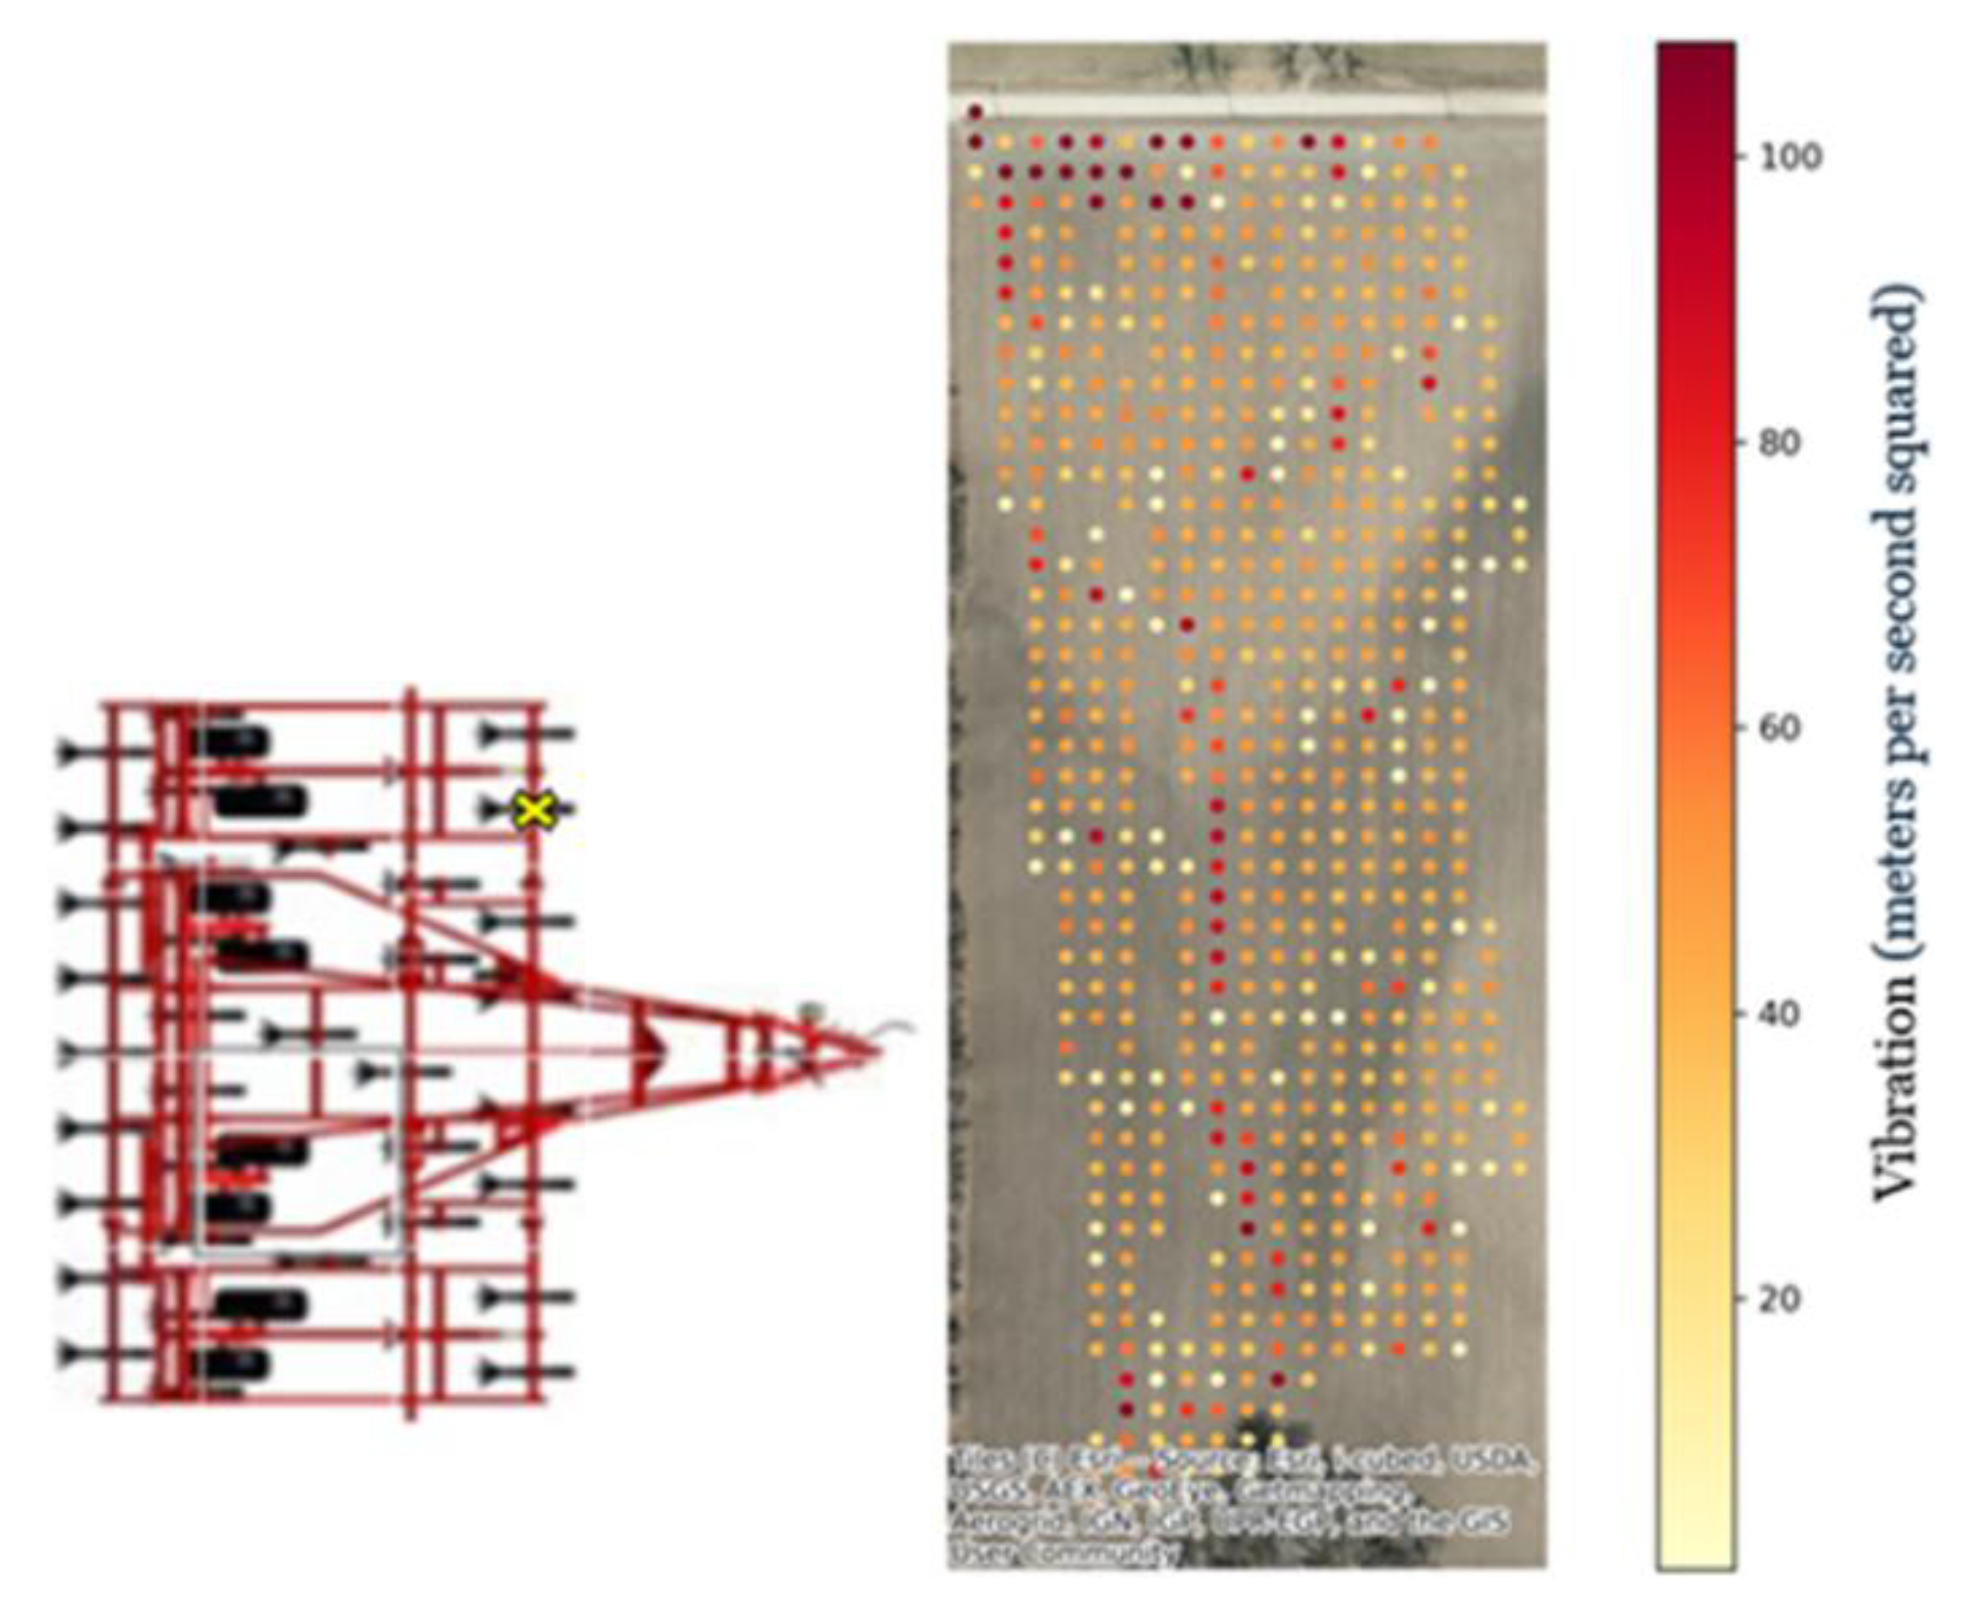
Figure 5.
Spatial Visualization of Vibration Data of Accelerometer3.
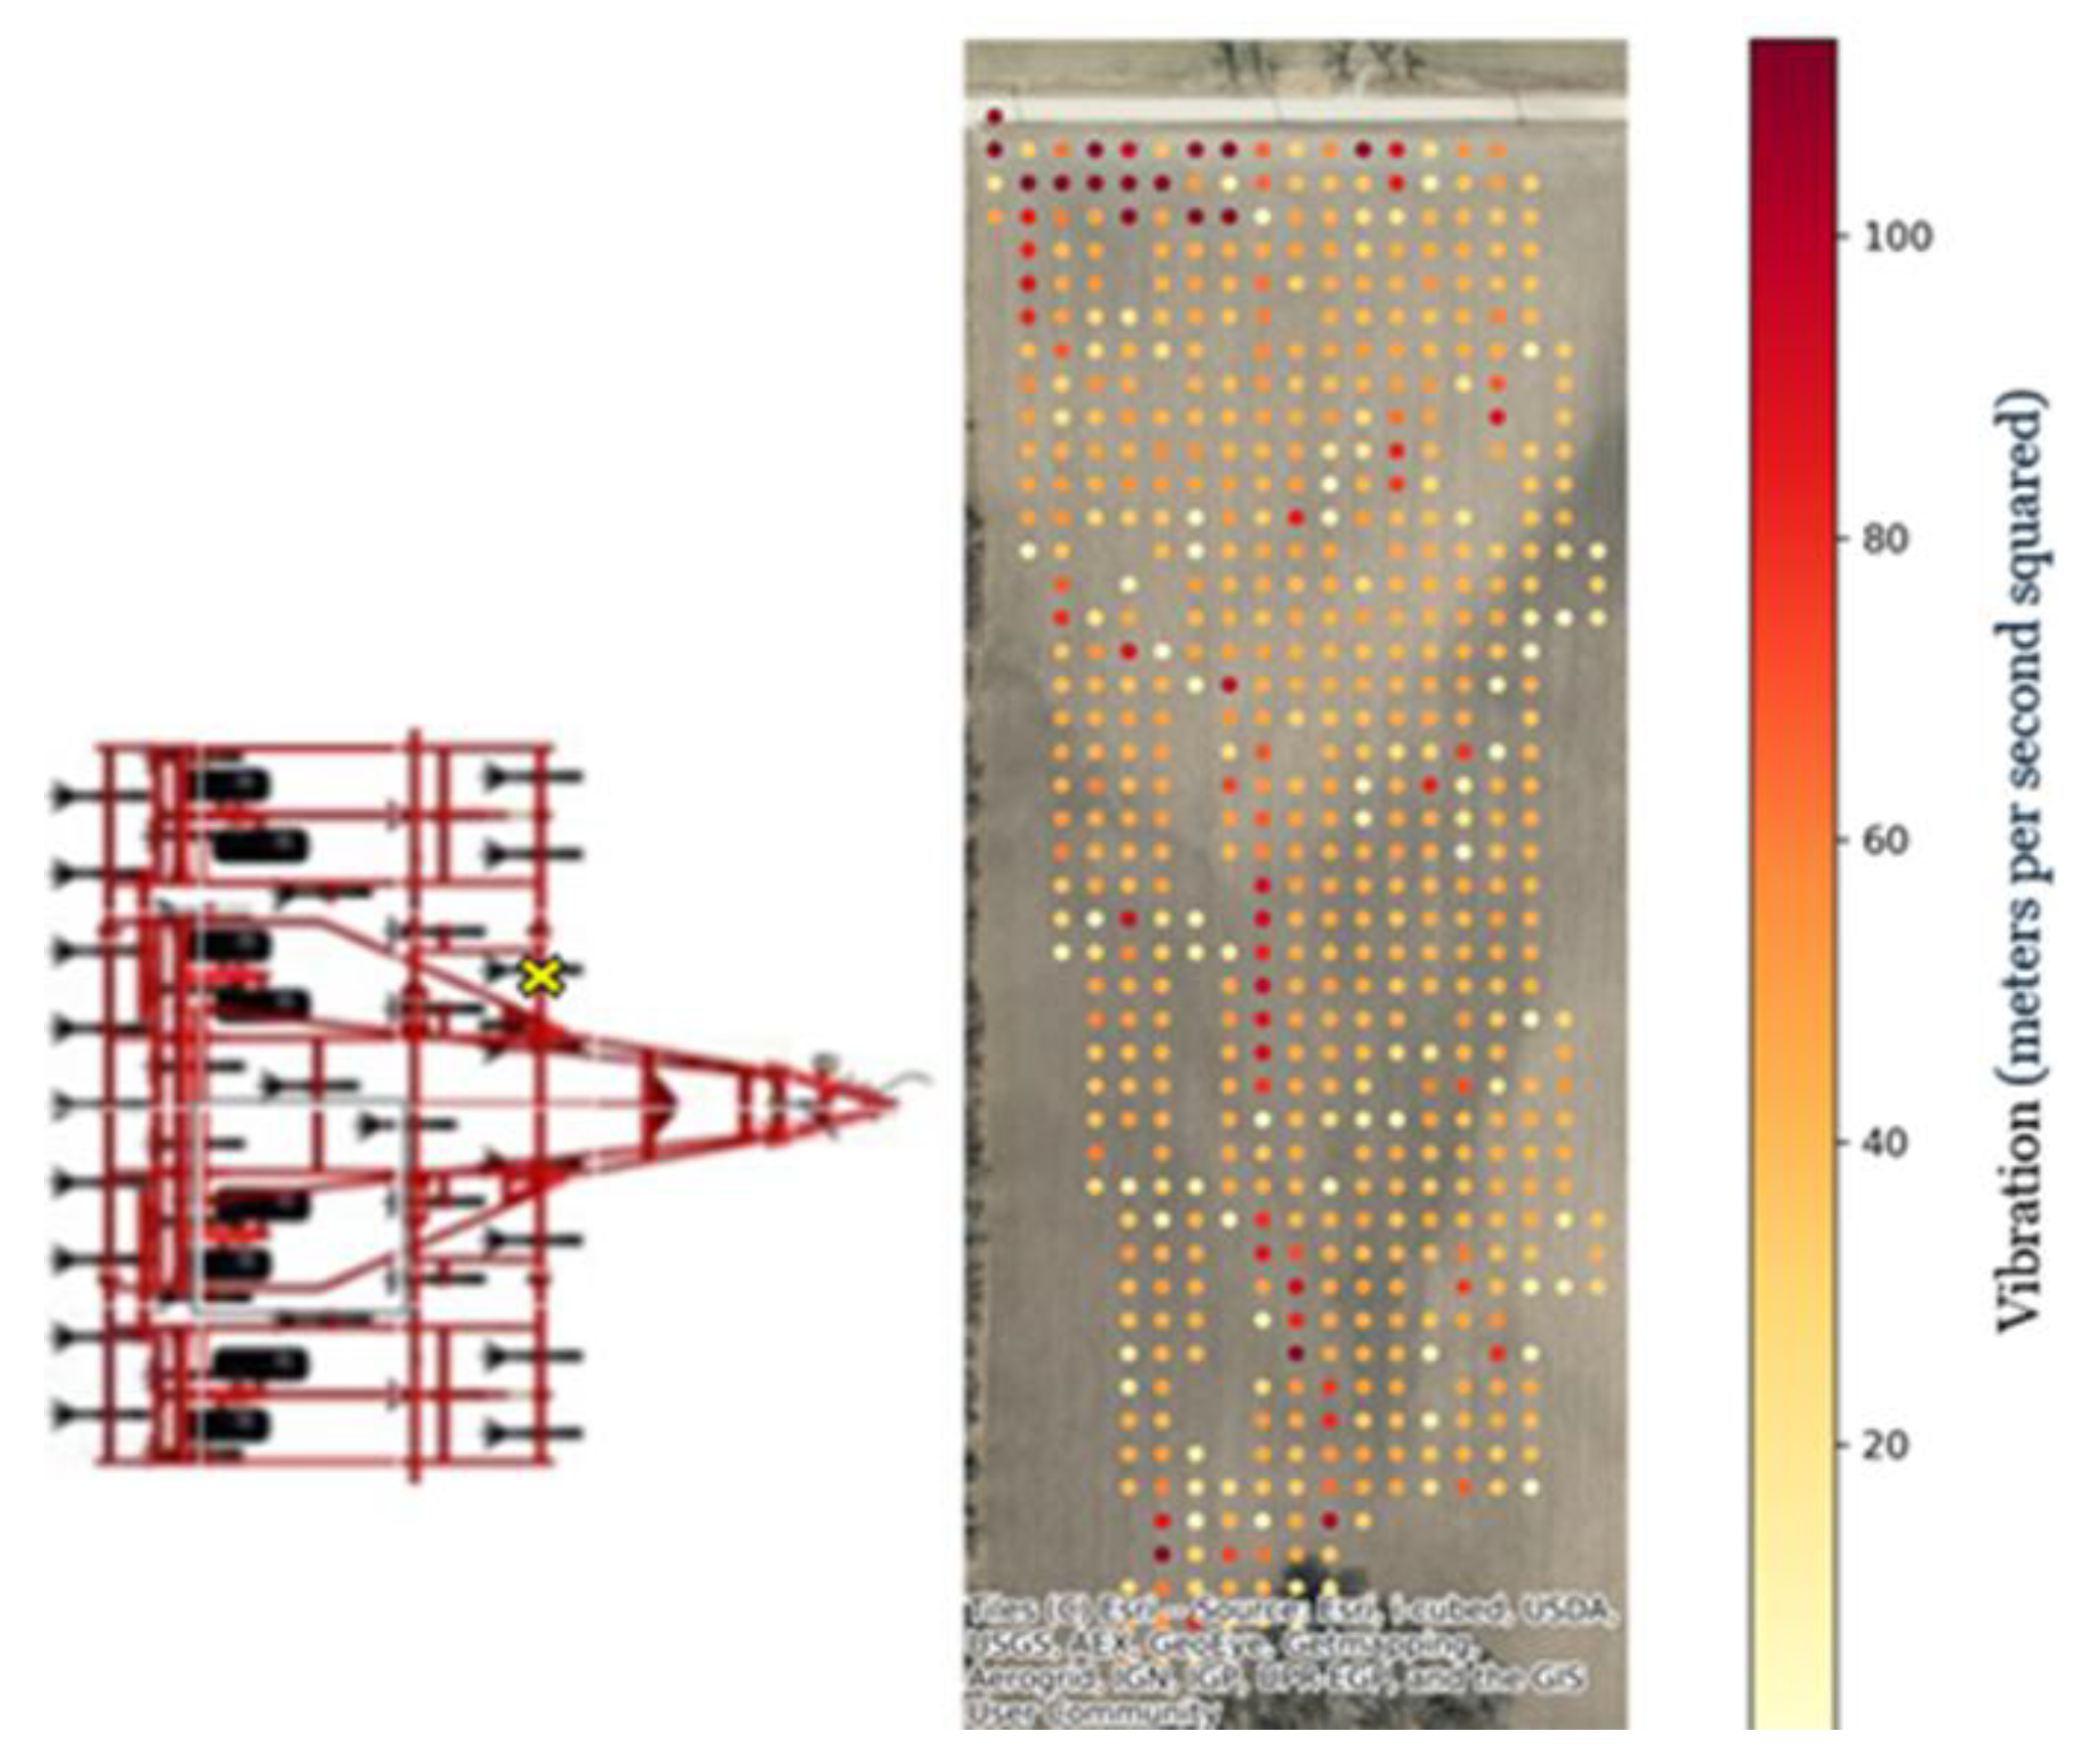
Figure 6.
Single Shank Cultivator.
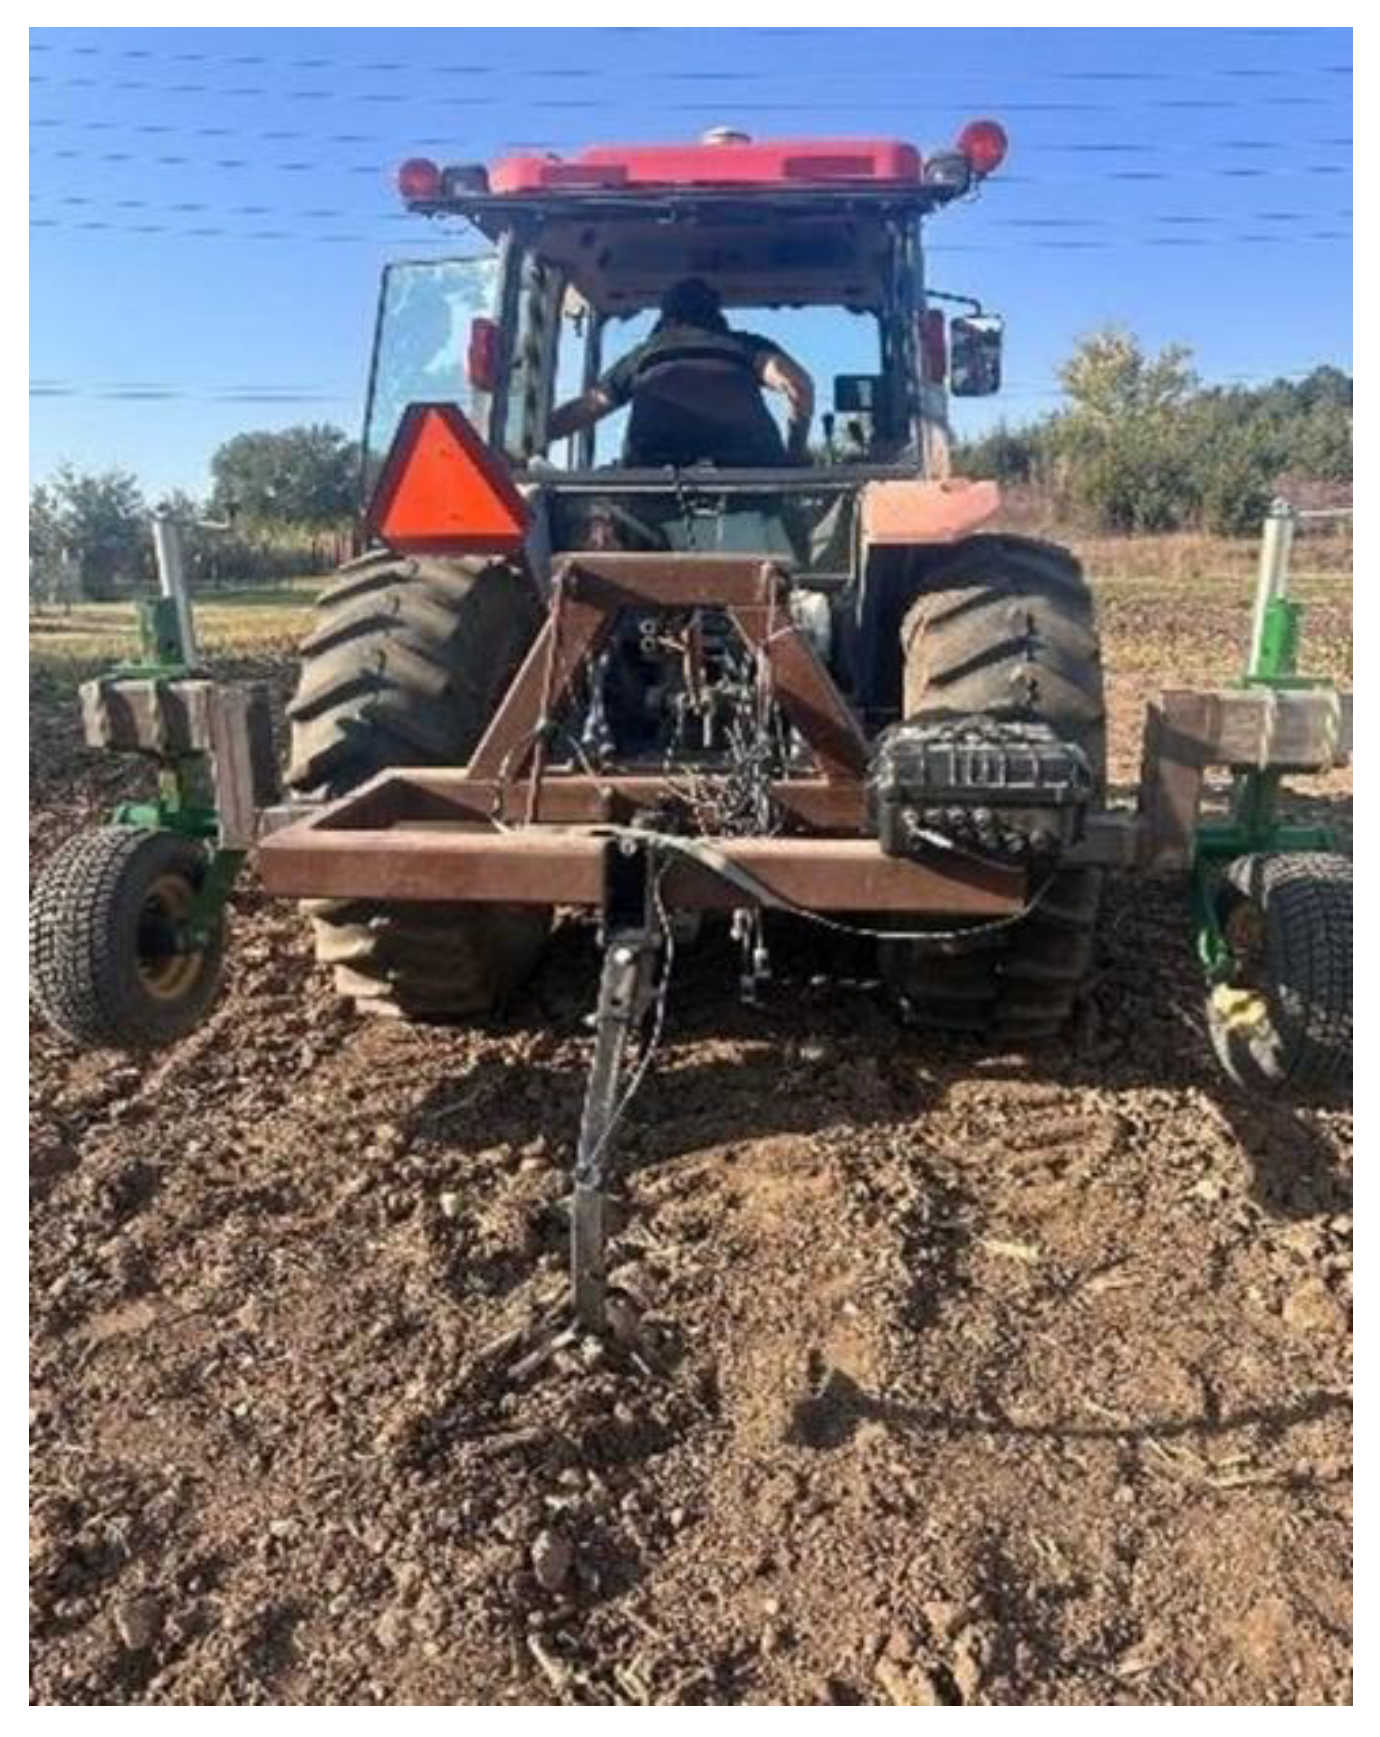
Figure 7.
Locations of spots where soil compaction changes were identified during the study.
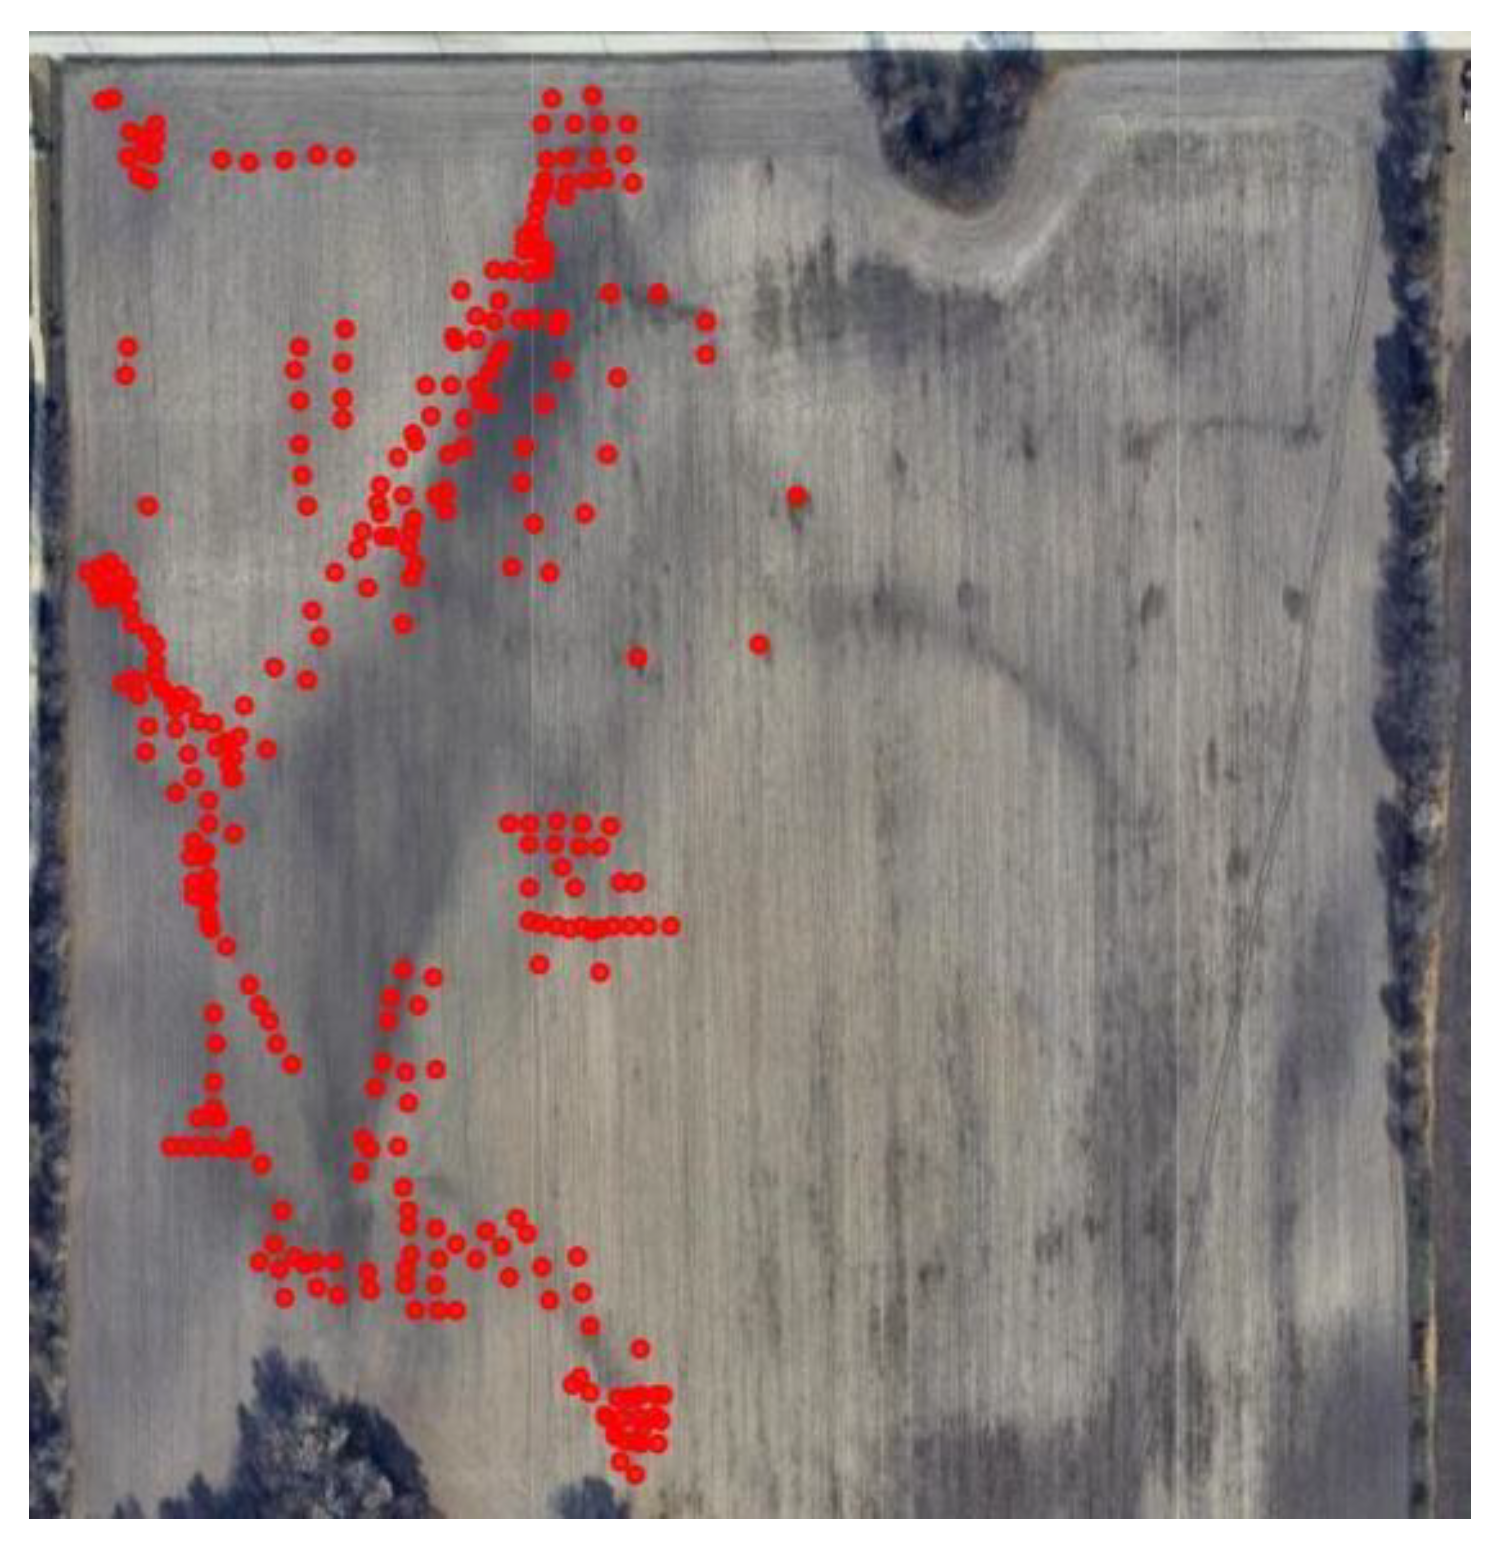
Figure 8.
Penetrometer Data Visualization.
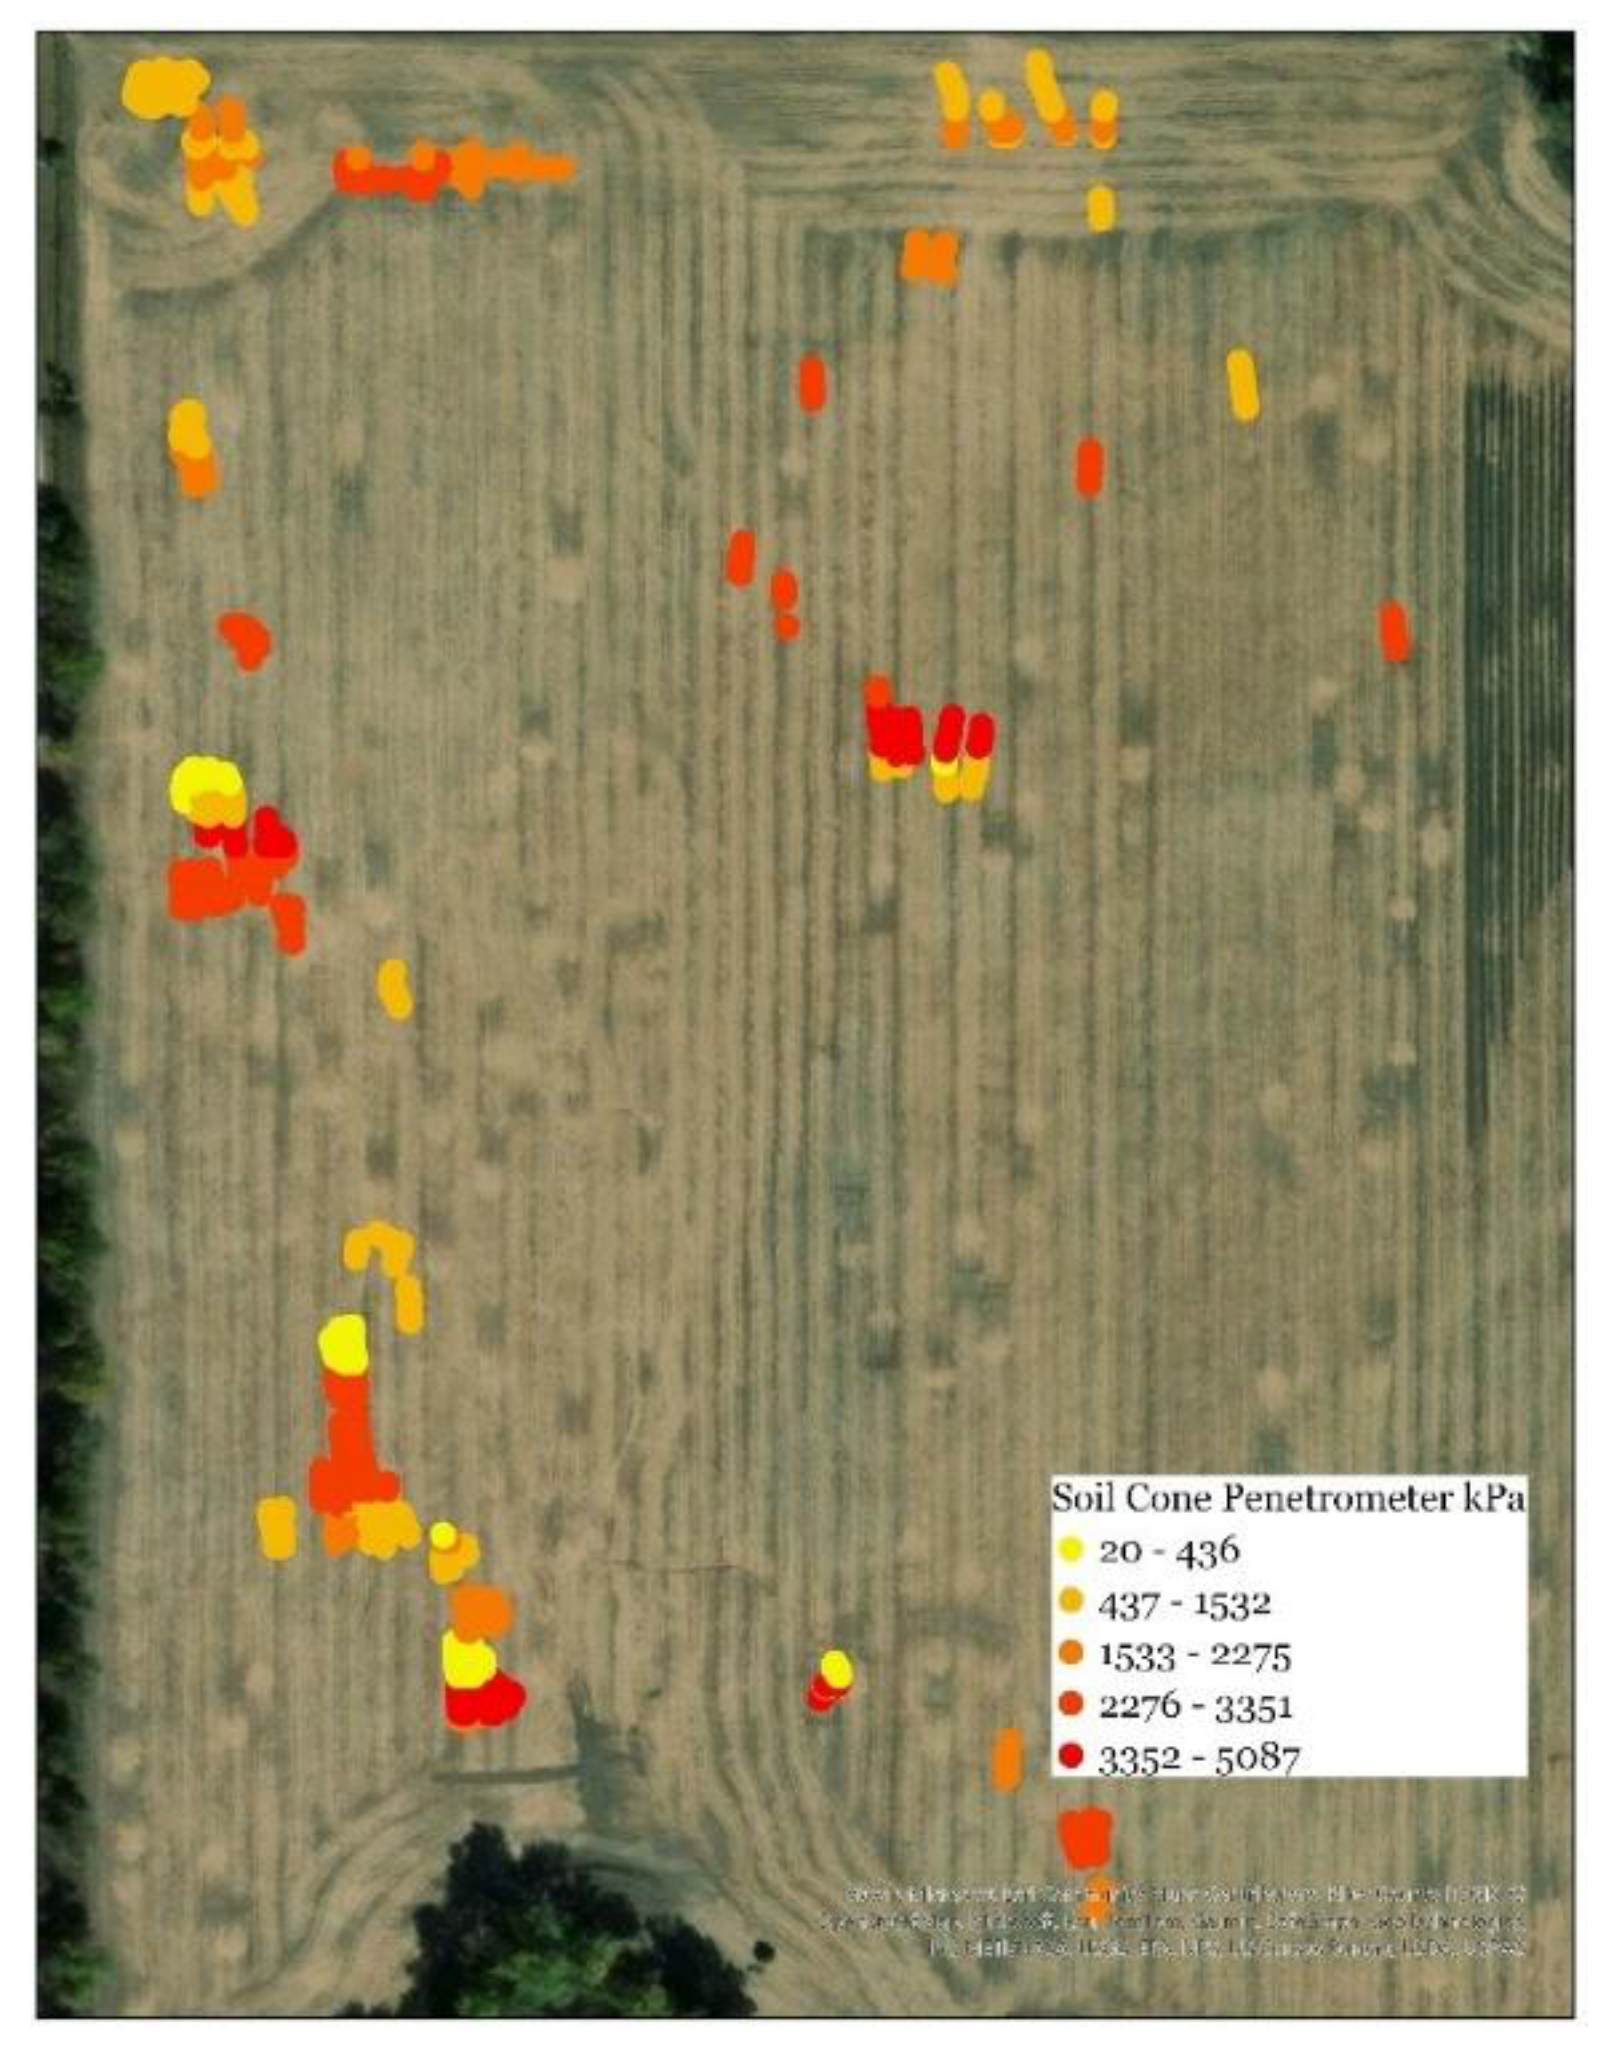
Figure 9.
High vibration, cone index, and low moisture values.
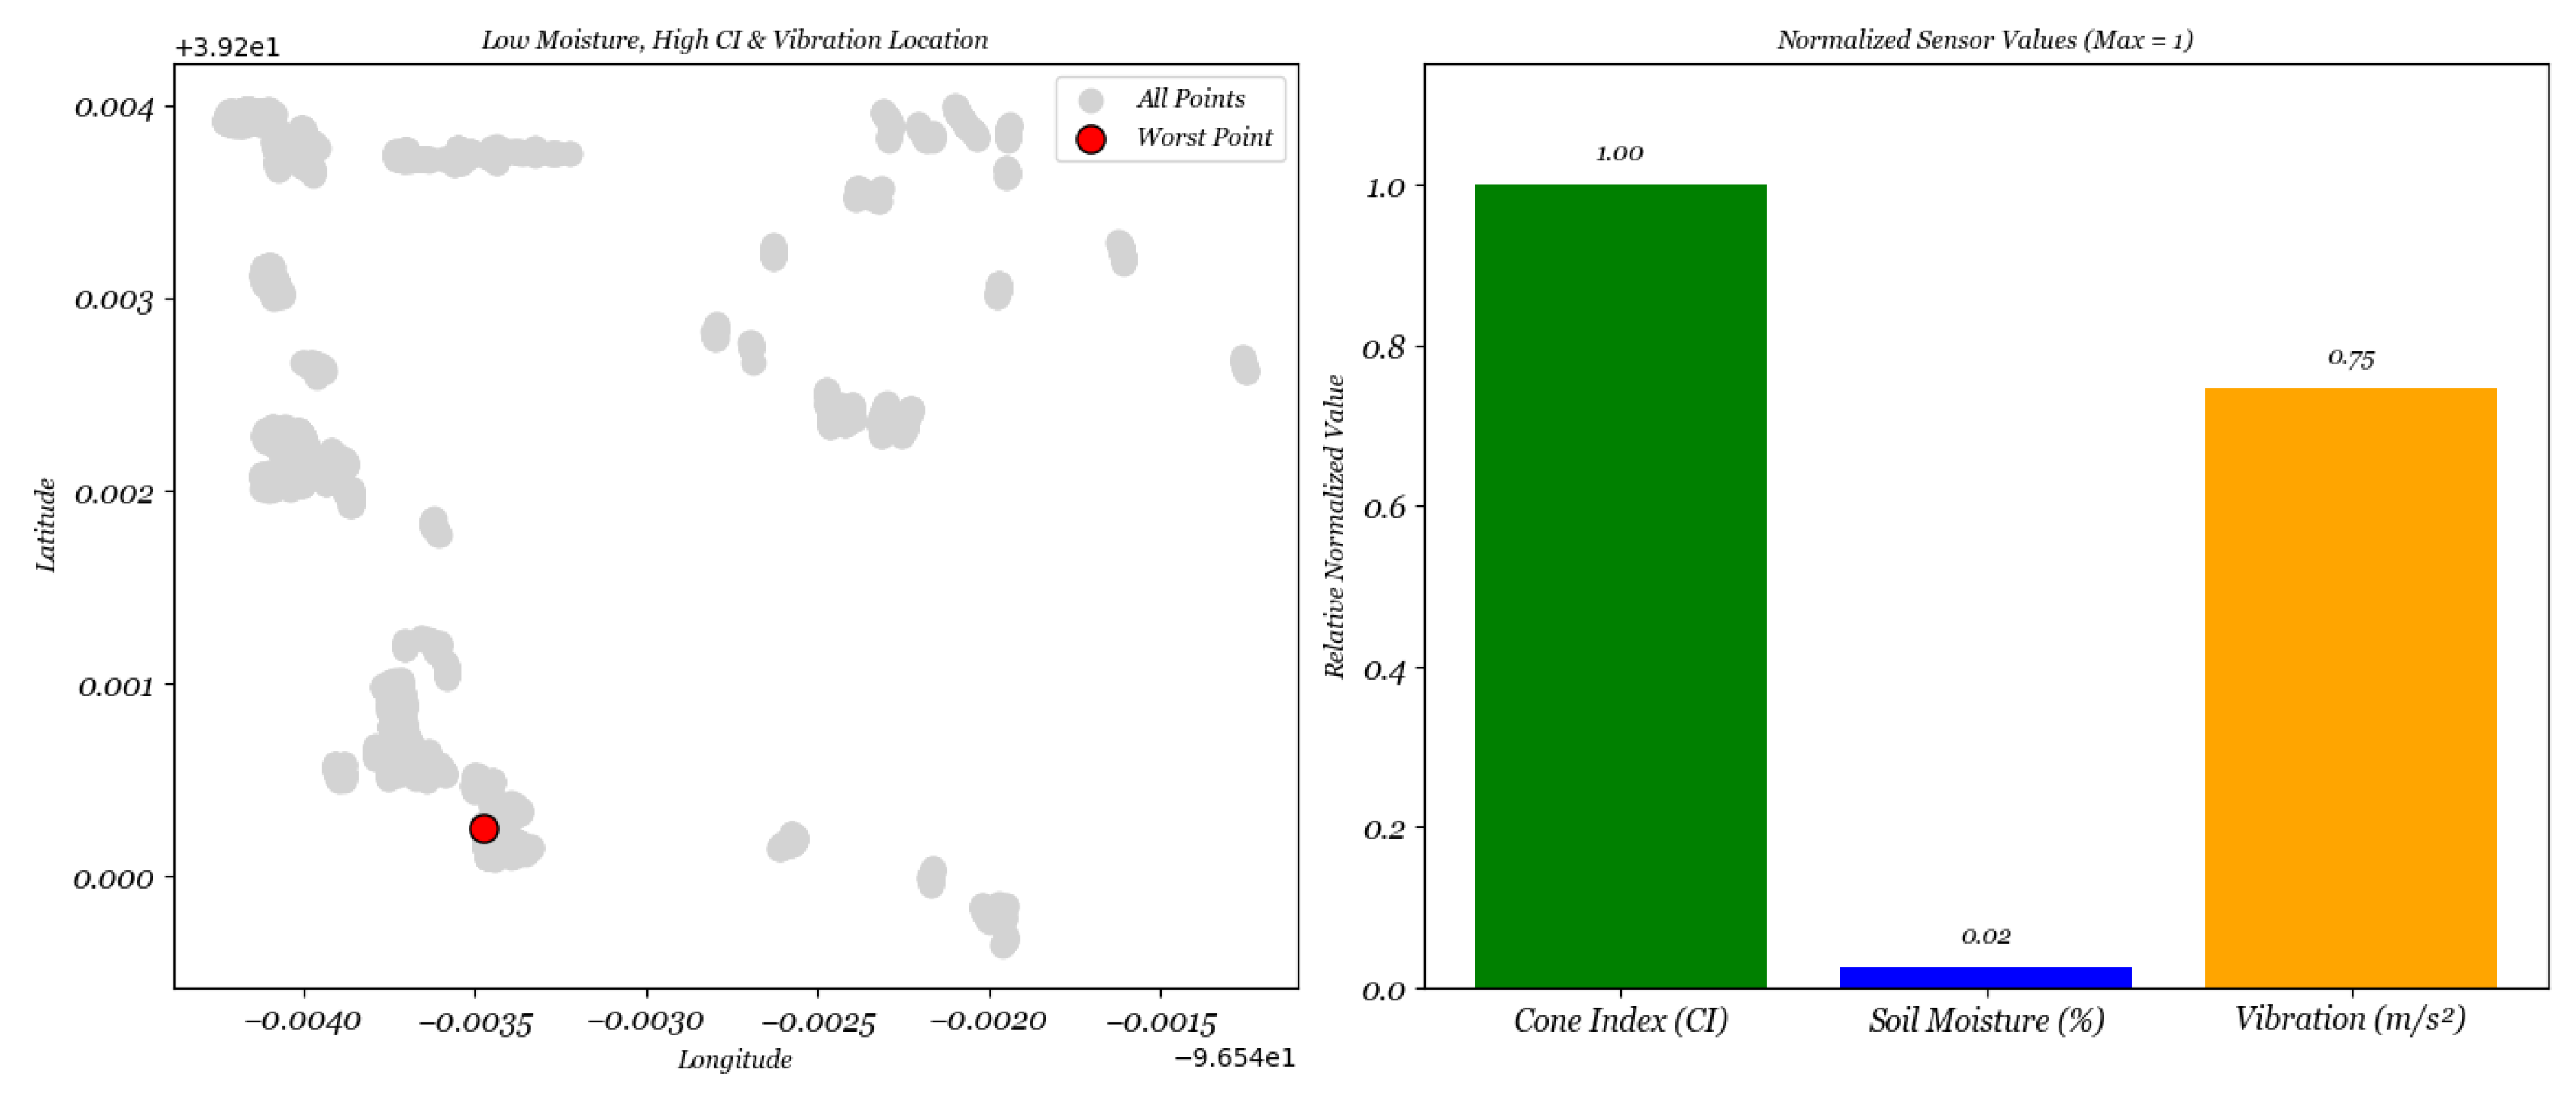
Figure 10.
Soil point with low cone index and vibration and high moisture.
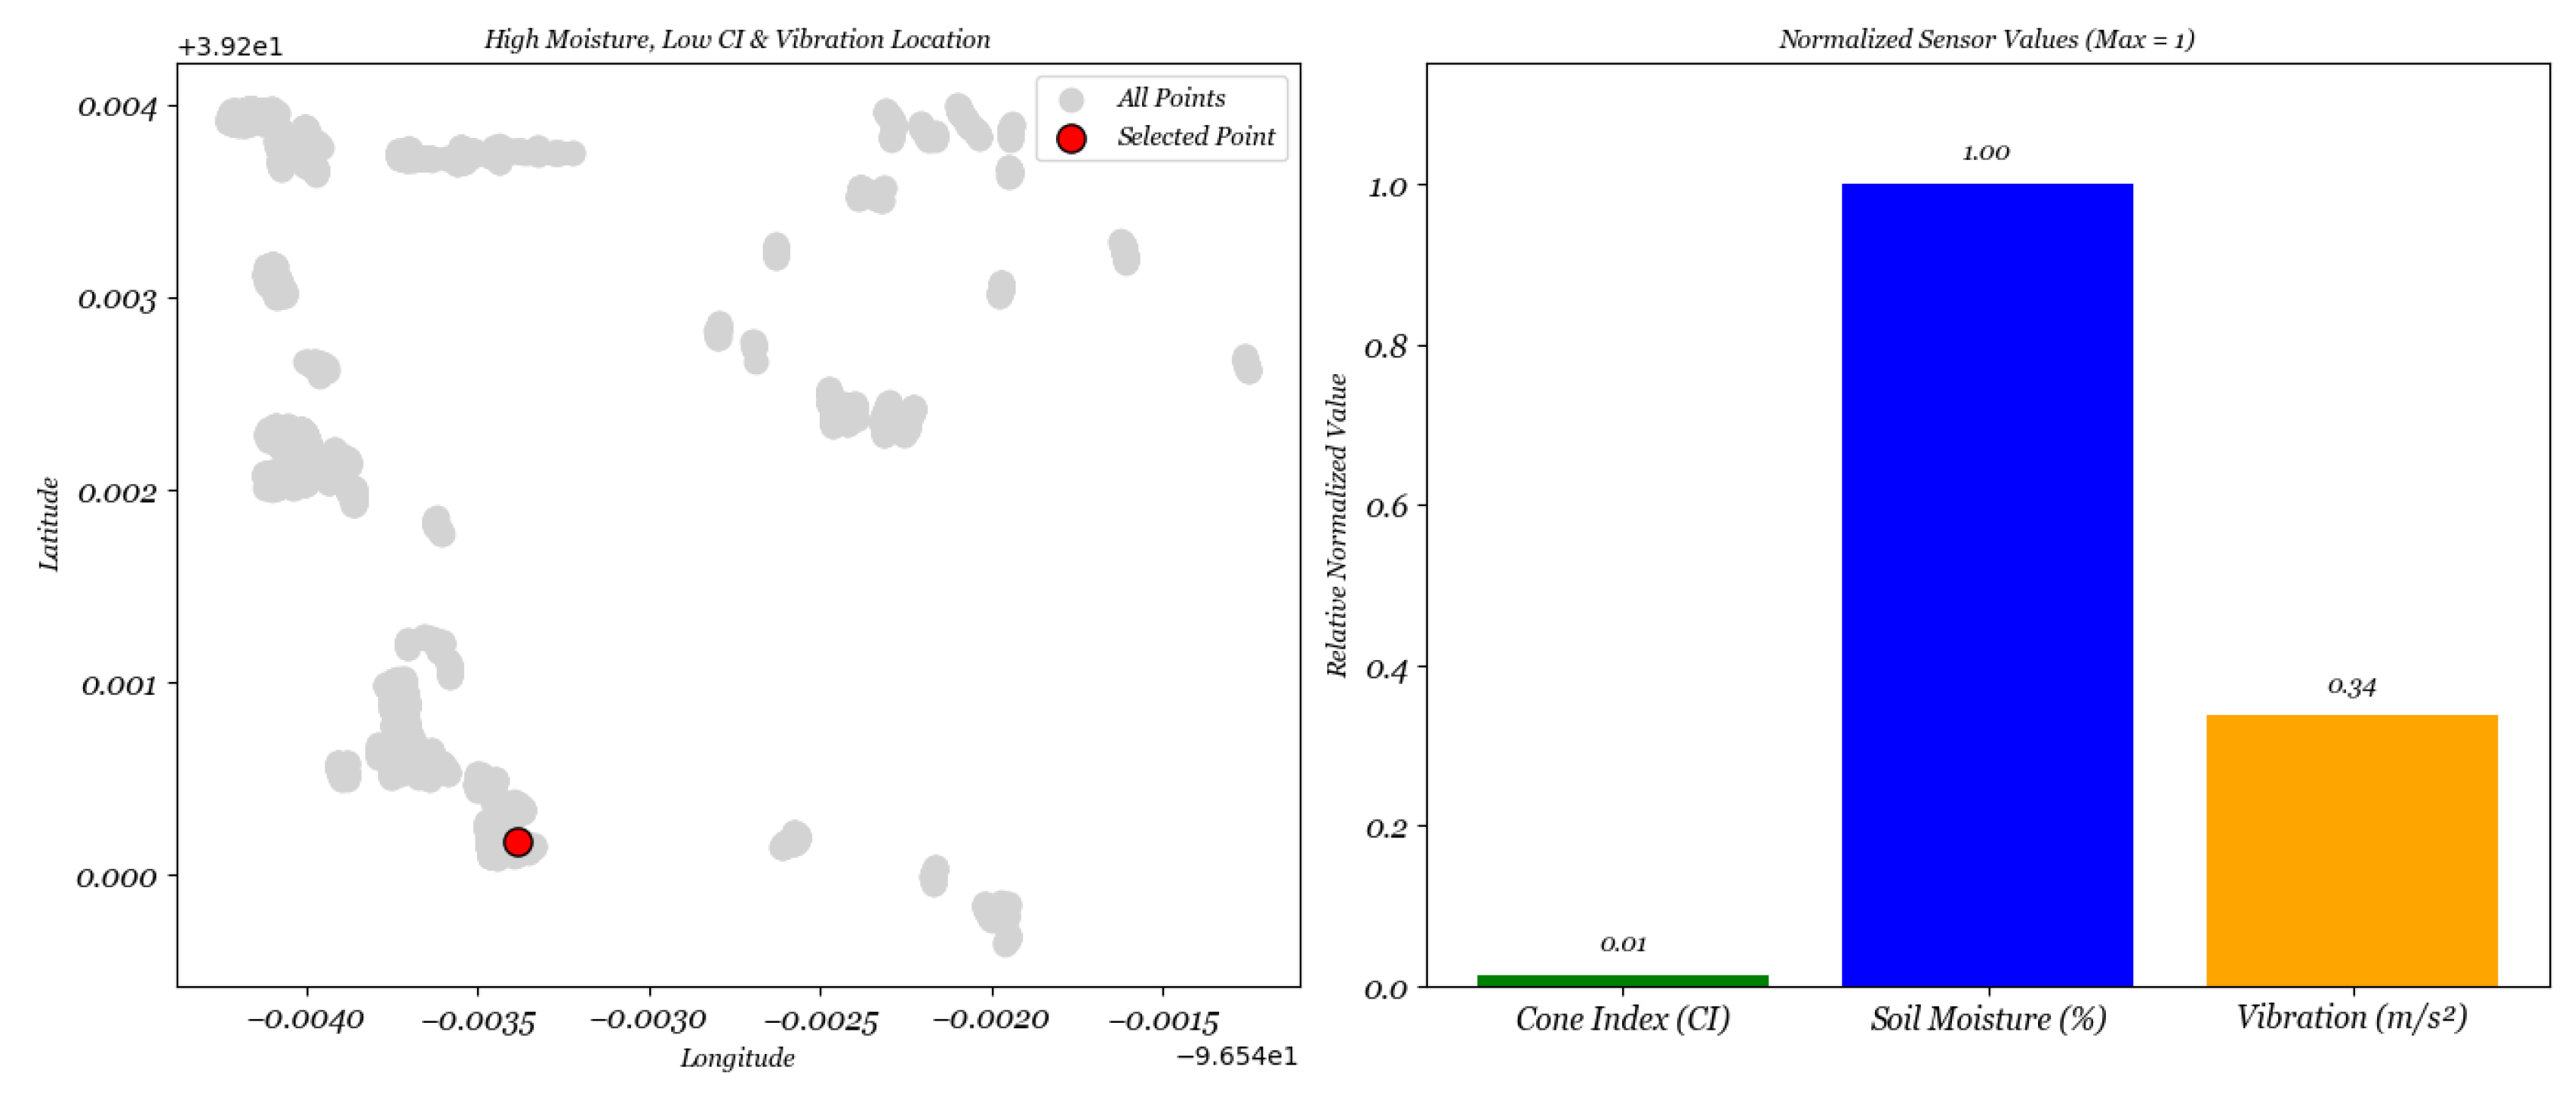
Figure 11.
Input features (soil moisture and vibration data) and output (predicted soil compaction) using Random Forest and XGBoost models.
Figure 11.
Input features (soil moisture and vibration data) and output (predicted soil compaction) using Random Forest and XGBoost models.
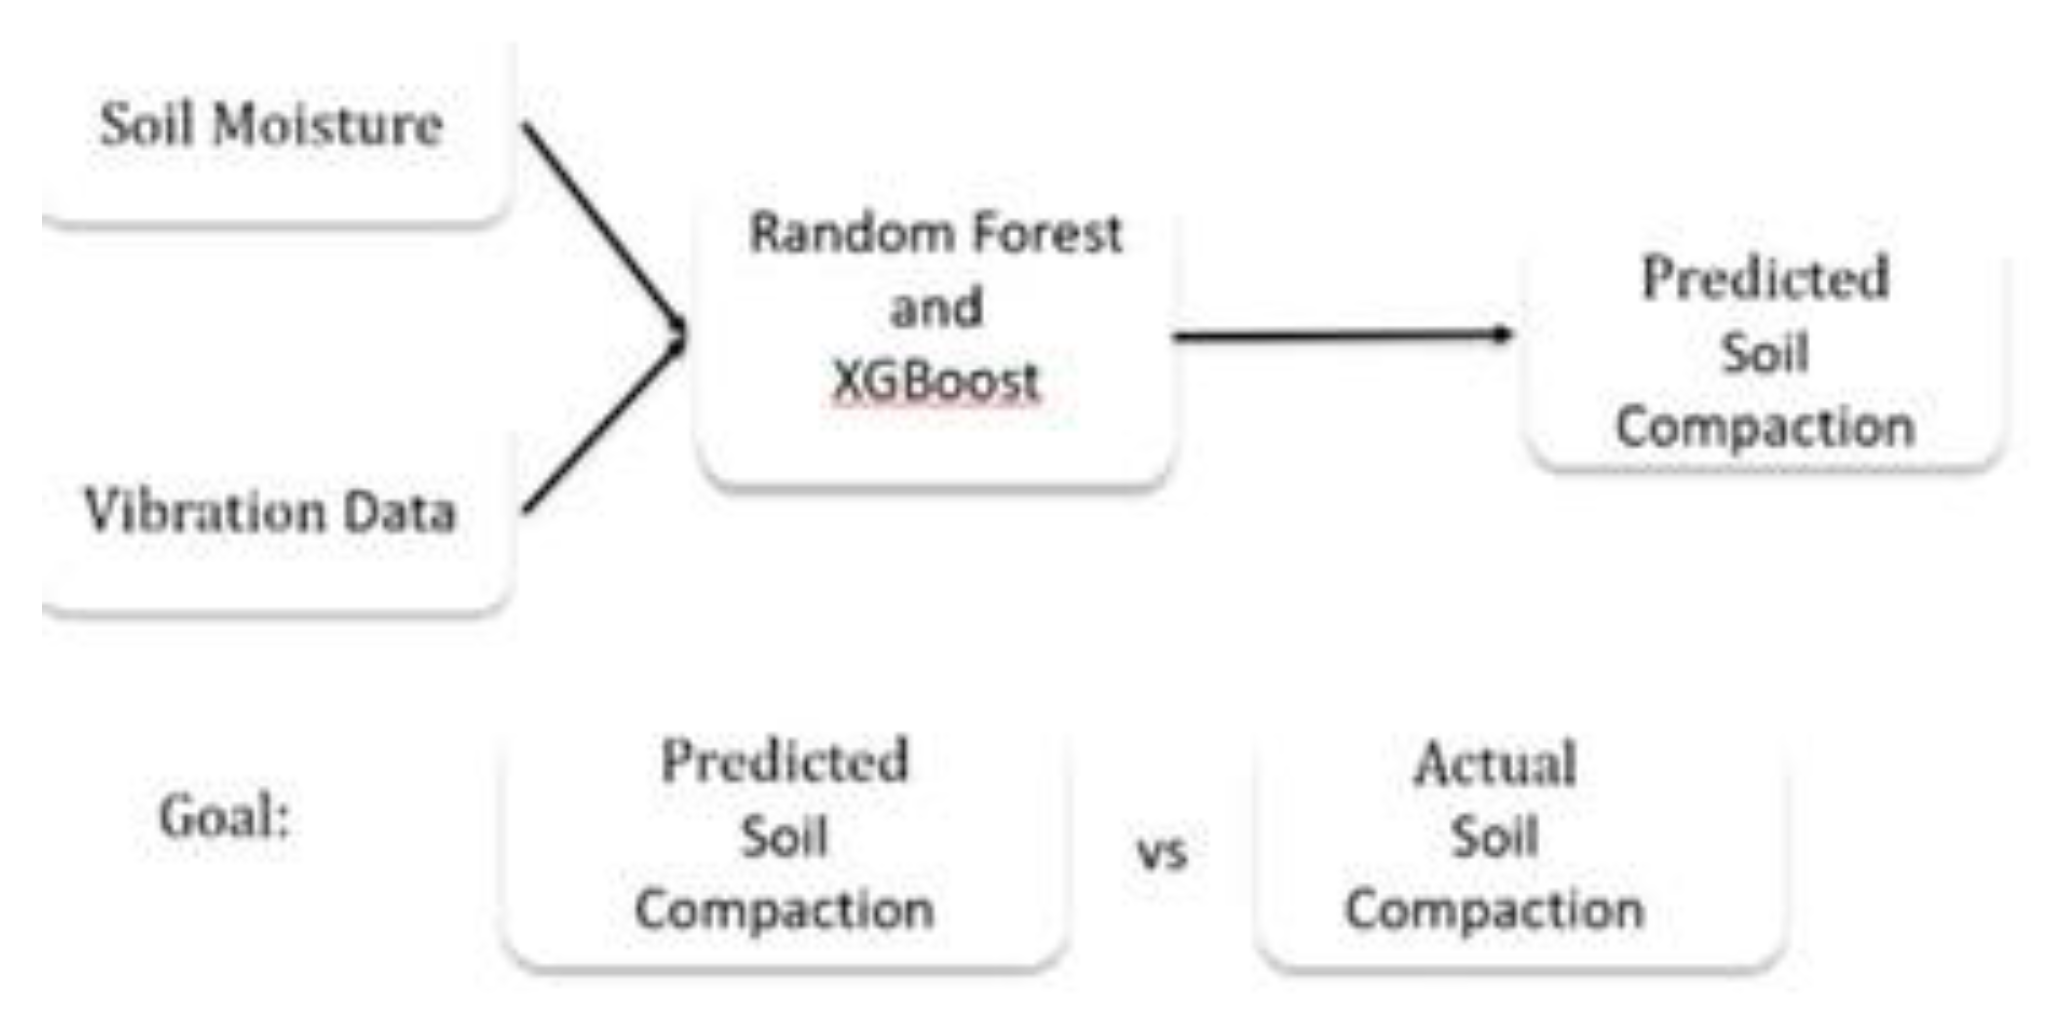
Figure 12.
Scatter plots of actual vs. predicted soil compaction (kPa) using XGBoost (left) and Random Forest (right).
Figure 12.
Scatter plots of actual vs. predicted soil compaction (kPa) using XGBoost (left) and Random Forest (right).
Disclaimer/Publisher’s Note: The statements, opinions and data contained in all publications are solely those of the individual author(s) and contributor(s) and not of MDPI and/or the editor(s). MDPI and/or the editor(s) disclaim responsibility for any injury to people or property resulting from any ideas, methods, instructions or products referred to in the content. |
© 2025 by the authors. Licensee MDPI, Basel, Switzerland. This article is an open access article distributed under the terms and conditions of the Creative Commons Attribution (CC BY) license (http://creativecommons.org/licenses/by/4.0/).
Copyright: This open access article is published under a Creative Commons CC BY 4.0 license, which permit the free download, distribution, and reuse, provided that the author and preprint are cited in any reuse.


