Submitted:
25 July 2025
Posted:
28 July 2025
You are already at the latest version
Abstract
Introduction: Non-invasive diagnostic tools for the assessment of pulmonary arterial hypertension (PAH) have been under intensive investigation. Positron emission tomography (PET)/computed tomography (CT) with [13N]-ammonia and [18F]-fluorodeoxyglucose ([18F]-FDG) are the golden standard of myocardial metabolism and perfusion assessment. The relationships between RV myocardial metabolism and perfusion and cardiopulmonary exercise testing (CPET) have not been studied. The study aimed to evaluate the correlations between the CPET parameters and RV perfusion and metabolism using positron emission tomography PET/CT with [13N]-ammonia and 18F]-FDG in IPAH patients. Methods: 34 IPAH patients (34.2±8.9 years, 4 males, 6 prevalent) comprised into the study. The relationships between CPET parameters and SUVmax RV/LV metabolism and perfusion were assessed. Cardiac MRI and hemodynamics were evaluated as well. Results: Significant negative correlations were registered between SUVmax RV/LV metabolism, SUVmax RV/LV perfusion and oxygen consumption, oxygen pulse and positive correlation with the ratio of minute ventilation to carbon dioxide production. The majority of CPET indices and SUVmax RV/LV metabolism and SUVmax RV/LV perfusion differed significantly between the low-risk IPAH patients and intermediate- high-risk groups. No reliable differences in CPET indices and SUVmax RV/LV metabolism and SUVmax RV/LV perfusion registered between intermediate and high-risk patients. Tight interconnections between CPET and invasive hemodynamics, RV remodeling were confirmed. Conclusion: Significant correlations between CPET parameters and RV myocardial metabolism and perfusion parameters, MRI, and hemodynamics indicate that CPET is a reliable noninvasive diagnostic tool for distinguishing low-risk IPAH patients from intermediate-high risk population.
Keywords:
cardiac PET/CT
; [18F]-FDG PET/CT
; [13N]-ammonia PET/CT
; cardiopulmonary testing
; idiopathic pulmonary arterial hypertension
; right ventricle
1. Introduction
Right ventricular heart failure is the leading cause of death in patients with pulmonary arterial hypertension (PAH) [1]. The mechanisms of the RV maladaptation closely related to the cardiomyocyte metabolism changes [2]. Adenosine triphosphate deficiency with inefficient oxidative phosphorylation [3] leads to the shift from fatty acid oxidation to an anaerobic pathway of glycolysis in myocardium [4]. Reactive oxygen species and lactate alter normal functioning of cellular structures, primarily mitochondria [5]. Thus, a vicious circle of discrepancy between the RV energy expenditure and the possibility of its provision evolves. Elevated cellular glucose consumption is a marker of increased metabolic demand. PET/CT with [18F]-FDG and [13N]-ammonia are the reference methods for myocardial metabolism and perfusion assessment. [18F]-FDG uptake in the RV myocardium has been tightly associated with the severity of PAH [4,6,7]. The high cost and radiation exposure determine infrequent use of radionuclide methods for maladaptive remodeling assessment in patients with IPAH
CPET is of great interest as it evaluates the adequacy of oxygen delivery and utilization by tissues [8], identifies the “suffering” system (cardiovascular, respiratory or muscular) and the mechanisms of compensation [9]. CPET indices closely correlate with hemodynamics and the right heart remodeling in patients with IPAH [10,11]. No data regarding CPET and the RV metabolic and perfusion indices currently exist in IPAH patients.
We hypothesize that there is a close correlation between the RV myocardial metabolism and perfusion and CPET parameters depending on the current concept of PAH severity assessment.
The study aimed to evaluate the correlation between the CPET parameters and RV myocardial perfusion and metabolism using PET/CT with [13N]-ammonia and [18F]-fluorodeoxyglucose ([18F]-FDG) in IPAH patients. The relationships between the CPET parameters and the cardiac MRI, invasive hemodynamics were assessed for the integrity perception of the study hypothesis.
2. Methods
2.1. Data Collection
The hemodynamic criteria for PAH were defined as mean PAP ≥25 mmHg, PCWP < 15 mmHg and PVR ≥3 Wood units according to the national guidelines 2020 for the management of pulmonary hypertension [12]. Pulmonary arterial compliance (PAC) was calculated with parameters derived from the right heart catheterization (RHC): stroke volume/(systolic pulmonary artery pressure-diastolic pulmonary artery pressure) [13]. The exclusion criteria were defined as PAH other etiologies than IPAH, moderate to severe lung disease (forced vital capacity (FVC) < 70%; forced expiratory volume in one second (FEV1) < 80%; DLCO, diffusion capacity of the lungs for carbon monoxide (DLCO)<40%); left heart disease; established malignancies; diabetes mellitus; thyroid disease; severe kidney or liver dysfunction, inflammatory diseases and mental disorders.
Demographics, symptoms, 6-minute walk test (6MWT) distance, cardiac MRI and PET/CT with two radiopharmaceuticals [13N]-ammonia and [18F]-fluordeoxiglucose ([18F]-FDG), laboratory values (hemoglobin, creatinine with estimated glomerular filtration rate [eGFR], N-terminal pro-brain-type natriuretic peptide [NT-proBNP]) were collected at a baseline through 1 month when RHC was performed. Estimated GFR was calculated according to the CKD-EPI equation. Cardiac MRI was done using MAGNETOM Trio A Tim Sistem 3 Tesla (Siemens, Germany).
Cardiopulmonary exercise test (CPET) was performed in all patients on a cycle ergometer (Ebike, GI, USA) with an incremental workload 10 W/min (RAMP-protocol) up to the patient symptoms-limited maximum tolerance. Gas exchange was measured breath-by-breath method using calibrated Oxycon Pro equipment (Cardinal Health, Germany).
All patients underwent RHC, echocardiography, MRI, CRT, PET/CT, NT-proBNP and 6MWT at the time of study conduction. ESC/ERS 2022 baseline 3-strata risk stratification was performed [https://www.pahinitiative.com/hcp/risk-assessment/calculators] (URL accessed on January 14, 2025) in all patients at the time of study conduction.
2.2. PET/CT Protocol
Cardiac PET/CT («Discovery 710», GE Healthcare, USA) with [18F]-FDG and [N3]-ammonia was performed in all patients in two separate days. Myocardial glucose metabolism was assessed by [18F]-FDG PET/CT. Patients fasted at least 6 hours before the procedure [18F]-FDG PET/CT. A standard dose of 5 MBq/kg (<550 MBq) [18F]-FDG was administered intravenously 1 hour after the start of the insulin-euglycemic clamp, when stable glycemia was established (optimal glycemia was 5 mmol/L). Glucose level in blood was checked every 5 minutes. Cardiac PET/CT scans were acquired in 40 minutes after [18F]-FDG intravenous administration in a static mode. Low dose CT scan was performed immediately prior to PET for attenuation correction. PET perfusion scanning was performed at rest, 5 minutes after intravenous administration of 10 MBq/kg [13N]-ammonia in a static mode immediately after low dose CT transmission.
The regions of interest (ROI) of the left ventricle (LV) and RV myocardial uptake were identified visually. The regions of interest (ROI) were drawn on the RV free wall, and LV lateral wall on the static transaxial images to measure the LV and RV myocardial uptake of both [18F]-FDG and [13N]-ammonia [7]. The maximal standardized uptake value (SUVmax) was obtained in each ROIs using software AWS 4.6 (GE Healthcare, USA). The ratio of SUVmax RV free wall and SUVmax LV lateral wall was calculated for both [18F]-FDG and [13N]-ammonia PET images for assessment of glucose metabolism (SUVmax RV/LV metabolism) and perfusion (SUVmax RV/LV perfusion) of the right ventricular myocardium. The SUVmax RV/LV metabolism/SUVmax RV/LV perfusion ratio was calculated for evaluation the relationship between perfusion and metabolism in the right heart myocardium.
The study was conducted in accordance with the Declaration of Helsinki and approved by the Ethics Committee of the Center, (protocol N 04-23, approved on 17 April 2023). Informed consent was obtained from all subjects participating in the study. Written informed consent was obtained from the patient(s) for publication of this paper.
2.3. Study Population
The study population comprised 34 (18-52 years old) Caucasian IPAH patients prospectively recruited in a single-PH referral center between February 2020 and October 2024. The entire cohort was divided into three groups based on ESC/ERS 2022 risk status: low-risk (n=11), intermediate risk (n=17) and high risk (n=6) (Table 1). Twenty-eight incident patients underwent initial PAH diagnostics and were treatment naïve. Six patients were prevalent. They enrolled into the study within 6 to 12 months from the initial diagnosis of IPAH in the center. All study procedures (RHC, MRI, CPET, NT-proBNP, 6MWT and clinical assessment) were performed in all patients at the time of study conduction and the risk stratification was calculated using 3-strata ESC/ERS 2022 risk score based on the obtained parameters. Among prevalent patients, three IPAH patients with positive vasoreactive testing (VRT) received CCB therapy. Two III-IV FC (WHO) patients received triple combination therapy including riociquate, sildenafil, macitentan, ambrisentan, iloprost and selexipag. One III FC patient received sildenafil and ambrisentan. Prevalent patients received CCB or PAH-specific therapy for at least three months since the diagnosis of IPAH was established. All procedures including RHC were done on a background PAH therapy in prevalent patients. Vasoreactive testing was performed as a part of first follow-up assessment of CCB therapy efficacy in VRT positive prevalent patients according to the guideline [13]. Survival data were not provided as no deaths have been reported to date.
2.4. Statistical Analysis
Demography, clinical data including PAH functional class (FC) (WHO), smoking, hemodynamic data, laboratory, CPET, MRI and PET/CT parameters were compared in three risk groups. Numerical parameters with a normal distribution were presented as mean ± standard deviation (M ± SD), and numerical parameters with an abnormal distribution presented as median and interquartile range (IQR; M ± 25%, 75%). Categorical variables presented as absolute numbers and percentages and compared using Fisher exact or Pearson M-L Chi-square tests, as appropriate. Mean values compared using the unpaired t-Student test and ANOVA, as appropriate. Correlations were evaluated using the Pearson’s correlation analysis. A statistically significant difference determined as a two-tailed p < 0.05. The statistical analyses of the data carried out using Statistica for Windows, version 10.0 (StatSoft: Tulsa, Okla, USA).
3. Results
3.1. Patients’ Characteristics Depending on ESC/ERS Risk Status
Patients of the three ESC/ERS 2022 risk groups did not differ in age, body mass index, smoking, eGFR, hemoglobin level, and forced vital capacity (FVC). Forced expiratory volume in one second (FEV1) was within the normal range in all groups, unless lower in intermediate-high risk patients in comparison with low-risk group. Low-risk patients differed significantly from the intermediate-high risk population in terms of exercise tolerance, hemodynamics and right heart remodeling, NT-proBNP level and the RV myocardial metabolism and perfusion. No significant difference was revealed between intermediate and high-risk patients in functional class of PAH (FC), 6 MWT distance and CPET parameters, cardiac MRI and hemodynamics (mean PAP, right atrial pressure, PCWP, PVR), arterial oxygen saturation and RV myocardial metabolism and perfusion (Table 1).
3.2. CPET Parameters According to the ESC/ERS 2022 Risk Status
Low-risk patients differed significantly in the predicted workload, peak oxygen consumption in absolute (VO2 peak) and predicted values (%VO2 peak Predicted), the ratio between oxygen consumption and workload (ΔVO2/ΔWR), heart rate slope (HR/Vkg) in comparison with the intermediate- high-risk patients, while no significant difference was observed between the intermediate- and high-risk groups (Table 1). There was a tendency to a higher predicted oxygen pulse (V'O2/HR Predicted, %) in low-risk patients in comparison with the intermediate-risk group (р=0.05). No significant difference was registered in ventilatory equivalents, exercise desaturation and predicted breathing reserve (% BR predicted) between three risk groups. Low-risk patients had significantly lower ventilatory equivalent for carbon dioxide on anaerobic threshold (VE/VCO2 AT) compared to the intermediate- and high-risk patients.
3.3. Correlations Between CPET and Hemodynamics
Significant inverse correlations identified between the mPAP and the workload, peak O2 consumption, O2/HR, PetCO2, and a direct correlation with VE/VCO2 (Table 2, Suppl.). No significant correlations were registered between mean RAP and CPET parameters. A negative tendency was revealed between mean RAP and VO2 peak AT (p=0.05). Significant positive correlations have been recorded between cardiac index and the workload, VO2 peak, oxygen pulse, and an inverse correlation with the heart rate slope (HR/Vkg), VE/VCO2 and anaerobic work efficiency (ΔVO/ΔWR). A positive correlation registered between the cardiac index and the PetCO2. A direct correlation was recorded between PAC and the predicted load, VO2 peak and VO2AT, oxygen pulse and PetCO2.
3.4. Correlations Between CPET and Cardiac MRI Parameters
We assessed the relationship between CPET parameters with established MRI determinants of prognosis in PAH patients: right ventricular end-systolic volume index (RV ESV index), left ventricular stroke volume index (LV SV index), and right ventricular ejection fraction (RV EF); as well as, the ratio of the RV ESV index/LV ESV index (Table 3).
A significant inverse correlation was registered between RV ESV index and the predicted workload, VO2 peak, VO2 AT and Predicted VO2 AT (%VO2 AT predicted), PetCO2 at rest and on peak of exertion.
A significant positive correlation was found between the LV stroke volume index and predicted load, VO2 peak, % VO2 peak Predicted, VO2 peak AT, % VO2 AT Predicted, VO2/HR, %VO2/HR Predicted, PetCO2 peak, dO2/dW and an inverse correlation with VE/VCO2, VE/VCO2 AT.
No reliable correlations were found between the RV ejection fraction and the CPET indices.
The largest number of correlations between the CPET parameters identified with the ratio of the RVESVindex/LVESVindex. Significant negative correlations were found between the ratio of the RVESVindex/LVESVindex and predicted workload, VO2 peak, VO2peak Predicted, VO2 AT, % VO2 AT Predicted, VO2/HR, VO2/HR Predicted, PetCO2 at rest and on peak, PetCO2 AT, dO2/dW. A direct correlation was recorded between the RVESVindex/LVESVindex and VE/VCO2, VE/VCO2 AT.
3.5. Correlations Between CPET Parameters and [18F]-FDG and [13N]-Ammonia RV Myocardial Uptake
Significant inverse correlation were registered between the SUVmax RV/LV metabolism and VO2 peak, VO2 AT, %VO2AT Predicted, PetCО2 at rest, on exertion and upon reaching aerobic threshold. Direct significant correlations were recorded between the RV/LV metabolism and VE/VCO2 peak and VE/VCO2 AT.
Significant inverse correlations were recorded between the values of the SUVmax RV/LV perfusion and workload, VO2 peak, % VO2 AT Predicted, PetCO2 at rest and on exercise. Direct correlations were recorded between the value of the SUVmax RV/LV perfusion and the magnitude of dead space ventilation increase during exercise, HR/Vkg, VE/СО2 peak and VE/СО2 AT. The inverse correlation was observed between PetCO2 AT and the SUVmax RV/LV perfusion value.
A direct significant correlation was found between the ratio of metabolism to perfusion of the RV/LV myocardium and HR/kg, and negative correlations with the workload, VO2 peak, VO2 AT, % VO2 AT Predicted. Reduced oxygen delivery to the workload was associated with a tendency to an increase of the ratio of metabolism/perfusion RV/LV (p = 0.057) (Table 4). No reliable correlation relationships were noted between breathing reserve, PetCO2 and the ratio of metabolism to perfusion of the RV/LV myocardium.
3.6. Changes in [18F]-FDG and [13N]-Ammonia Uptake by the RV Myocardium Depending on Risk Categories of the Main CPET Determinants of Prognosis
The values of [18F]-FDG SUVmax RV/LV lateral wall and [13N]-NH3-ammonia SUVmax RV/LV lateral wall have not been validated depending on the mortality risk scores in patients with PAH. Therefore, we divided patients into 3 risk groups for VO2 peak, % VO2 peak Predicted, VE/VCO2 according to the according to the established ESC/ERS 2022 risk categories [13]. Given the small number of patients in the intermediate risk category for VO2 peak and VE/VCO2 (n=4), intermediate and high-risk patients were pooled and compared with low risk patients (shown in Figure 1) (Table 5).
3.7. Peak Oxygen Consumption Category
Significant differences in [18F]-FDG and [13N]-ammonia uptake by the RV myocardium were observed between patients in the low and intermediate-high risk VO2 peak category. No significant differences in perfusion and the ratio of metabolism to perfusion of the RV/LV myocardium were registered between intermediate-risk and high-risk VO2 peak category.
3.8. The Percent of Predicted Peak Oxygen Consumption Category
Significant differences in the SUVmax RV/LV metabolism was recorded between patients in the low- and high-risk VO2 peak % Predicted category, as well as between intermediate and high risk, while the SUV max RV/LV metabolism did not differ significantly between patients in the low- and intermediate-risk VO2 peak % Predicted category.
The SUV max RV/LV perfusion differed significantly across all risk groups in the VO2 peak % Predicted category.
No significant differences in the ratio of metabolism to perfusion of the RV/LV myocardium was found depending on the risk category of the peak VO2% Predicted (Table 5).
3.9. The Ratio of Minute Ventilation to Carbon Dioxide Production Category
3.10. Summary of Correlations Between CPET Parameters and Changes in [18F]-FDG and [13N]-Ammonia Uptake by the RV Myocardium
The mean value of SUVmax RV/LV for [18F]-FDG PET/CT was 0.581±0.39 in low risk group and ranged from 0.59 to 0.6 depending on prognostic parameters of CPET (peak VO2, peakVO2%Predicted, VE/VCO2). The mean value of SUVmax RV/LV for [18F]-FDG PET/CT ranged from 0.996±0.27 in intermediate-high ESC/ERS 2022 risk cohort and was within the same limits while using intermediate-high risk categories for peak VO2, peakVO2%Predicted, VE/VCO2.
The mean value of SUVmax RV/LV for [13N]-ammonia PET/CT was 0.758±0.153 and 0.815-0.862 in low-risk ESC/ERS 2022 group and in low-risk category of CPET indicators, respectively. The mean value of SUVmax RV/LV for [13N]-ammonia PET/CT ranged from 0.852±0.151 in intermediate-high ESC/ERS 2022 risk cohort and was within the same limits while using intermediate-high risk categories of peak VO2, peakVO2%Predicted, VE/VCO2.
The ratio of metabolism to perfusion of the RV/LV myocardium was 0.786±0.321 in low-risk patients according to the ESC/ERS 2022 scale and varied depending on the CPET parameters from 1.08 to 1.2. The mean value of the ratio of metabolism to perfusion of the RV/LV myocardium was in the range of 1.797±0.751 in patients with intermediate-high risk of the ESC/ERS 2022 scale and for CPET indicators - 1.6-2.0.
Thus, the mean values of SUVmax RV/LV for [18F]-FDG and [13N]-ammonia were within the same limits when using ESC/ERS 2022 risk scale or CPET indicators alone. (Figure 2).
4. Discussion
For the first time, data on the relationship between cardiorespiratory testing parameters and parameters of metabolism and perfusion of the right ventricle myocardium was presented in patients with IPAH without comorbidities.
Cardiac output increase in response to metabolic demand is one of the main determinants of exercise capacity. Pulmonary microvasculature recruitment and PVR decrease provide adequate cardiac output and oxygen delivery to tissues during physical exertion under physiological conditions [14]. Pulmonary arterial pressure and PVR elevation accompanied by the RV hypertrophy with subsequent RV dilation and decreased myocardial contractility leads to the RV-PA uncoupling. [15]. LV underfilling and low stroke volume invariably result in low tissue perfusion, compensatory high tissue oxygen extraction and a metabolic shift towards anaerobic oxidation [8]. Hyperventilation with PETCO2 decrease, elevation of VE/VCO2 and the dead space ventilation are the typical features of respiratory compensation in patients with IPAH [16].
The present study confirmed the close correlations between hemodynamics, RV myocardial remodeling and CPET parameters, which was consistent with previously published studies [8,16,17]. We did not find any significant correlations between CPET parameters and RV ejection fraction, which might be due to the small patient population and a wide range of intermediate-risk limits for the RV ejection fraction [13,18,19]. The largest number of correlations between the CPET parameters identified with the ratio of the RVESV index/LVESV index. The RV/LV volumes ratio was not included into the risk scale stratification [13]; while this parameter reliably reflects the severity of RV remodeling and the LV compression in patients with PAH.
High glucose consumption and an early transition to the anaerobic pathway of glycolysis were determined in myocardium in pressure overload state [20,21]. A close correlation between PET/CT myocardial metabolism and perfusion parameters of the RV and mean PAP, PVR, cardiac output, and RV remodeling has been demonstrated in patients with IPAH [7,22]. Changes in RV myocardial metabolism observed even in a slight mPAP and PVR elevation in patients with IPAH. Increased metabolic demand compensated by perfusion augmentation of the RV myocardium in low-risk IPAH patients with mild PVR elevation and slight RV myocardial remodeling [7]. However, the RV metabolism-to-perfusion ratio dramatically increased in intermediate- and high-risk IPAH patients with severe hemodynamic changes and RV remodeling. In the present study, the rise of [18F]-FDG and [13N]-ammonia uptake by the RV myocardium was accompanied with a decrease in workload, VO2 peak, oxygen delivery and an increase of VE/VCO2 AT depending on the risk status.
The identification of low-risk IPAH patient is the most important task according to the current concept of PAH management. Obtaining a true low-risk picture of IPAH patient using RV molecular imaging is of paramount importance. Data regarding changes of [13N]-ammonia and [18F]-FDG uptake by RV myocardium depending on the risk status and the severity of PAH are scares [7,23]. While the prognostic values of the main CPET indicators are well defined within the ESC/ERS 2022 risk scale [13]. Thus, we assessed the mean values of [18F]-FDG and [13N]-ammonia uptake by RV myocardium in terms of ESC/ERS risk categories and separately in terms of established CPET indices (peak VO2, peak VO2% Predicted, VE/VCO2). The values of metabolism and perfusion changes of the RV myocardium differed significantly between low- and intermediate-high risk IPAH patients in terms of different CPET parameters. Whereas, the intermediate and high-risk groups did not exhibit significant differences in CPET and PET/CT data, which might be due to a small sample of high-risk patients (n=6). The RV metabolism-to-perfusion ratio was numerically lower in patients with low-risk CPET indicators in comparison with intermediate-high risk. Similar values of [18F]-FDG and [13N]-ammonia uptake by the RV myocardium were observed in between the risk categories derived from the ESC/ERS 2022 scale and the risk categories of the main CPET indicators.
The important topic of the study was the evaluation of the mean values of [18F]-FDG and [13N]-ammonia myocardial uptake depending on PAH severity. The higher SUVmax RV/LV metabolism value was recorded in low-risk patients in the present study compared to our previously published data (0.581±0.39 vs. 0.38±0.09) in patients with IPAH [7]. The SUVmax RV/LV perfusion was only slightly higher in low-risk patients in the present study compared to the previously published one (0.74±0.15 vs 0.65±0.06), and did not differ in intermediate-risk (0.86±0.14 vs 0.85±0.15) and high-risk patients (0.79±0.2 vs 0.79±0.18) between studies. Higher ratio of metabolism to perfusion of the RV/LV myocardium was recorded in the present study compared to the previous one, especially in the low-risk group (0.78±0.32 vs 0.69±0.27). The differences in mean values of SUVmax RV/LV metabolism and perfusion in low-risk patients between the two studies were likely due to a larger number of low-risk patients (n=11 vs n=6), more severe hemodynamic signs of pulmonary vascular disease (PVR 5.5 [3.9; 7.2] vs 3.9 [3.1; 5.4] WU; mPAP 40.8±3.9 vs 30.8±8.3 mm Hg) and more pronounced RV myocardial remodeling (RV ESVi 43.9±12.3 vs 36.0±8.0 ml/m2). The obtained results demonstrated high heterogeneity of the SUVmax RV/LV metabolism in patients within the low-risk group. This observation needs further data accumulation and analysis in terms of hemodynamic, cardiac remodeling and outcome. RV metabolism molecular imaging using PET/CT might be essential for the new treatment goals formation.
Current practical aspect of our study was the confirmation the previous studies [10,24,25] of the high relevance of CPET for noninvasive risk stratification in IPAH patients without left heart or lung disease comorbidities. We clearly demonstrated significant correlations between CPET parameters and hemodynamics, cardiac MRI and changes of metabolism and perfusion of the RV myocardium.
5. Conclusions
For the first time, a direct relationship was established between the RV molecular imaging (PET/CT metabolism/perfusion) and CPET parameters.
CPET might be a reliable risk stratification tool in IPAH without comorbidities.
PET/CT myocardial RV uptake with [18F]-FDG and [13N]-ammonia reveals early metabolic and perfusion abnormalities in IPAH patients and strongly associated with the risk status.
Limitations
The sample size was small (n=34), with the only 6 patients in the high-risk group, potentially affecting statistical power (e.g., the lack of significant differences between intermediate- and high-risk groups).
The prognostic value of CPET, as well as the features of RV myocardial metabolism and perfusion obtained using PET/CT, could not be assessed due to an insufficient observation period.
Author Contributions
Conceptualization, N.G. and O.M; Data curation, N.G., A.B., D.R., I. Z., A. R., A. M. and E. K.-A.; Formal analysis, N. G. and I. Z.; Funding acquisition, O.M.; Investigation, A. B., D. R., I. Z., K. L., A. R., A. M. and E. K.-A.; Methodology, N. G. A. B., D. R. and O. M.; Project administration, O. M.; Resources, O.M.; Software, D. R., A. M. and E. K.-A.; Supervision, O. M.; Validation, A. B., D. R., K. L., A. R. and O. M.; Visualization, D.R., A. R. and A. M.; Writing – original draft, N. G. and O. M.; Writing – review & editing, A. B., D. R. and O. M. All authors contributed to manuscript revision, read, and approved the submitted version.
Funding
The study was supported by the Russian Science Foundation, agreement number [23-15-00318]. The funder had no role in the design, data collection, data analysis, and reporting of this study.
Institutional Review Board Statement
The study was conducted in accordance with the Declaration of Helsinki. This study protocol was reviewed and approved by the Ethics Committee of the Almazov National Medical Research Centre, Ministry of Health of Russia, [protocol N 04-23, approved on April, 17 2023].
Informed Consent Statement
Informed consent was obtained from all subjects participating in the study. Written informed consent was obtained from all patients for publication of this paper.
Data Availability Statement
The data sup non-model plant speciesporting the conclusions of this study are available from the corresponding author upon reasonable request.
Acknowledgments
The authors thank Molokova Evgenia, MD and Orlova Galina, MD for the valuable participation in the PET/CT study conduction.
Conflicts of Interest Statement
The authors have no conflicts of interest to declare.
References
- J.L. Sanders, M. Koestenberger, S. Rosenkranz, B.A. Maron, Right ventricular dysfunction and long-term risk of death, Cardiovasc Diagn Ther. 10 (2020) 1646–1658. [CrossRef]
- T. Tuomainen, P. Tavi, The role of cardiac energy metabolism in cardiac hypertrophy and failure, Exp Cell Res. 360 (2017) 12–18. [CrossRef]
- C. Real, C.N. Pérez-García, C. Galán-Arriola, I. García-Lunar, A. García-Álvarez, Right ventricular dysfunction: pathophysiology, experimental models, evaluation, and treatment, Rev Esp Cardiol (Engl Ed). 77 (2024) 957–970. [CrossRef]
- V. Agrawal, T. Lahm, G. Hansmann, A.R. Hemnes, Molecular mechanisms of right ventricular dysfunction in pulmonary arterial hypertension: focus on the coronary vasculature, sex hormones, and glucose/lipid metabolism, Cardiovasc Diagn Ther. 10 (2020) 1522–1540. [CrossRef]
- Jorge, J. Sáiz, N. Solanes, A.P. Dantas, J.J. Rodríguez-Arias et al., Metabolic changes contribute to maladaptive right ventricular hypertrophy in pulmonary hypertension beyond pressure overload: an integrative imaging and omics investigation, Basic Res Cardiol. 119 (2024) 419–433. [CrossRef]
- C. Sumer, G. Okumus, E.G. Isik, C. Turkmen, A.K. Bilge, M. Inanc, (18)F-fluorodeoxyglucose uptake by positron emission tomography in patients with IPAH and CTEPH, Pulm Circ. 14 (2024) e12363. [CrossRef]
- N. Goncharova, D. Ryzhkova, K. Lapshin, A. Ryzhkov, A. Malanova, E. Andreeva, O. Moiseeva, PET/CT Imaging of the Right Heart Perfusion and Glucose Metabolism Depending on a Risk Status in Patients With Idiopathic Pulmonary Arterial Hypertension, Pulm Circ. (2025) e70042. [CrossRef]
- D. Dumitrescu, O. Sitbon, J. Weatherald, L.S. Howard, Exertional dyspnoea in pulmonary arterial hypertension, Eur Respir Rev. 26 (2017) 170039. [CrossRef]
- B. Pezzuto, P. Agostoni, The Current Role of Cardiopulmonary Exercise Test in the Diagnosis and Management of Pulmonary Hypertension, J Clin Med. 12 (2023) 5465. [CrossRef]
- I. Singh, R.K.F. Oliveira, P. Heerdt, M.B. Brown, M. Faria-Urbina, A.B. Waxman, D.M. Systrom, Dynamic right ventricular function response to incremental exercise in pulmonary hypertension, Pulm Circ. 10 (2020) 2045894020950187. [CrossRef]
- R. Badagliacca, F. Rischard, S. Papa, S. Kubba, R. Vanderpool, J.X. Yuan et al., Clinical implications of idiopathic pulmonary arterial hypertension phenotypes defined by cluster analysis, J Heart Lung Transplant. 39 (2020) 310–320. [CrossRef]
- S.N. Avdeev, O.L. Barbarash, A.E. Bautin et al., 2020 Clinical practice guidelines for Pulmonary hypertension, including chronic thromboembolic pulmonary hypertension, Russ J Cardiol. 26 (2021) 4683. [CrossRef]
- M. Humbert, G. Kovacs, M.M. Hoeper et al., 2022 ESC/ERS Guidelines for the diagnosis and treatment of pulmonary hypertension, Eur Heart J. 43 (2022) 3618–3731. [CrossRef]
- D. Langleben, S.E. Orfanos, B.D. Fox, N. Messas, M. Giovinazzo, J.D. Catravas, The Paradox of Pulmonary Vascular Resistance: Restoration of Pulmonary Capillary Recruitment as a Sine Qua Non for True Therapeutic Success in Pulmonary Arterial Hypertension, J Clin Med. 11 (2022) 4568. [CrossRef]
- A. Vonk Noordegraaf, B.E. Westerhof, N. Westerhof, The Relationship Between the Right Ventricle and its Load in Pulmonary Hypertension, J Am Coll Cardiol. 69 (2017) 236–243. [CrossRef]
- B. Pezzuto, R. Badagliacca, F. Muratori, S. Farina, M. Bussotti, M. Correale et al., Role of cardiopulmonary exercise test in the prediction of hemodynamic impairment in patients with pulmonary arterial hypertension, Pulm Circ. 12 (2022) e12044.
- A.E. Sherman, R. Saggar, Cardiopulmonary Exercise Testing in Pulmonary Arterial Hypertension, Heart Fail Clin. 19 (2023) 35–43. [CrossRef]
- N.S. Goncharova, A.V. Ryzhkov, K.B. Lapshin, A.F. Kotova, O.M. Moiseeva, Cardiac magnetic resonance imaging in mortality risk stratification of patients with pulmonary hypertension, Russ J Cardiol. 28 (2023) 5540. [CrossRef]
- P.M. Heerd, I. Singh, A. Elassal et al., Pressure-based estimation of right ventricular ejection fraction, ESC Heart Fail. (2022)9(2):1436-1443. /: https. [CrossRef]
- H. Ohira, R. deKemp, E. Pena, R.A. Davies, D.J. Stewart, G. Chandy et al., Shifts in myocardial fatty acid and glucose metabolism in pulmonary arterial hypertension: a potential mechanism for a maladaptive right ventricular response, Eur Heart J Cardiovasc Imaging. 17 (2016) 1424–1431. [CrossRef]
- S. Chen, Y. Zou, C. Song, K. Cao, K. Cai, Y. Wu et al., The role of glycolytic metabolic pathways in cardiovascular disease and potential therapeutic approaches, Basic Res Cardiol. 118 (2023) 48. [CrossRef]
- J. Osorio Trujillo, O. Tura-Ceide, J. Pavia et al., 18-FDG uptake on PET-CT and metabolism in pulmonary arterial hypertension, Pulm Hypertens. (2021) PA588. [CrossRef]
- R. Kazimierczyk, P. Szumowski, S.G. Nekolla et al., The impact of specific pulmonary arterial hypertension therapy on cardiac fluorodeoxyglucose distribution in PET/MRI hybrid imaging-follow-up study, EJNMMI Res. 13 (2023) 20. [CrossRef]
- Y. Song, H. Jia, Q. Ma, L. Zhang, X. Lai, Y. Wang, The causes of pulmonary hypertension and the benefits of aerobic exercise for pulmonary hypertension from an integrated perspective, Front Physiol. 15 (2024) 1461519. [CrossRef]
- E.V.M. Ferreira, J.S. Lucena, R.K.F. Oliveira, The role of the exercise physiology laboratory in disease management: pulmonary arterial hypertension, J Bras Pneumol. 50 (2024) e20240240. [CrossRef]
Figure 1.
The ratio of metabolism to perfusion of the RV/LV myocardium depending on the risk categories of the main cardiorespiratory test parameters: A. peak oxygen consumption; B. peak oxygen consumption % of predicted; C. the ratio of minute ventilation to carbon dioxide production.
Figure 1.
The ratio of metabolism to perfusion of the RV/LV myocardium depending on the risk categories of the main cardiorespiratory test parameters: A. peak oxygen consumption; B. peak oxygen consumption % of predicted; C. the ratio of minute ventilation to carbon dioxide production.
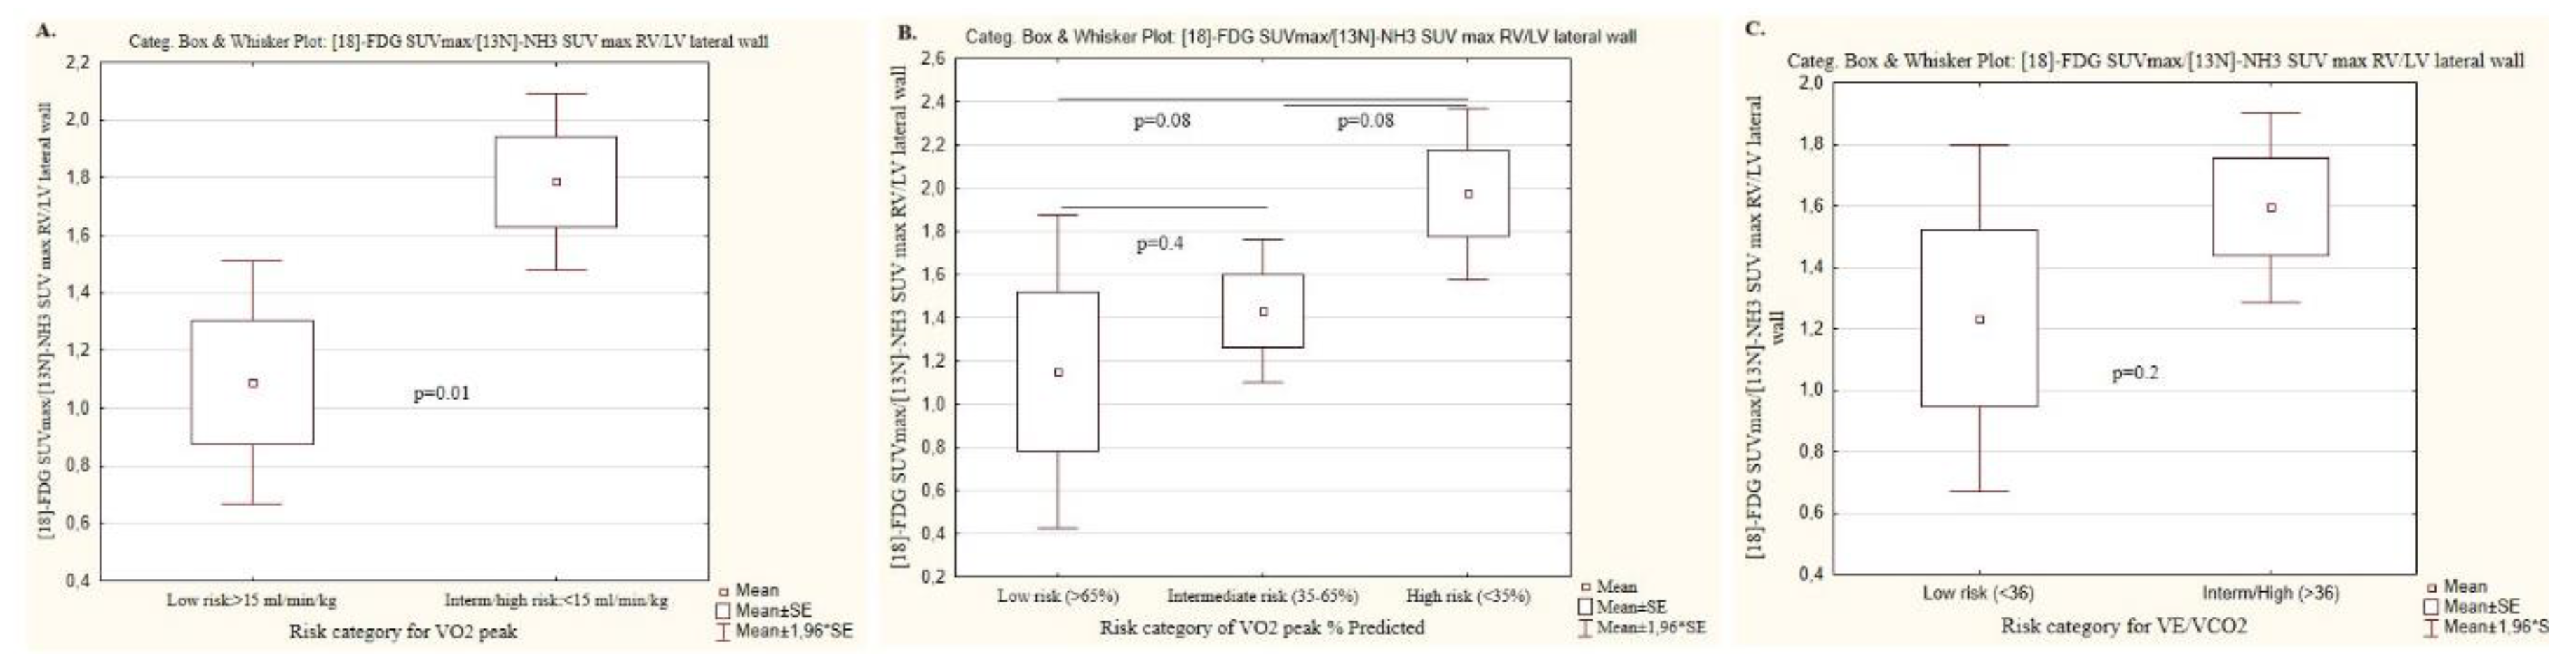
Figure 2.
The examples of low-risk, intermediate and high-risk IPAH patients were presented in terms of PET/CT SUVmax RV/LV for [18F]-FDG, CPET data and hemodynamics.
Figure 2.
The examples of low-risk, intermediate and high-risk IPAH patients were presented in terms of PET/CT SUVmax RV/LV for [18F]-FDG, CPET data and hemodynamics.
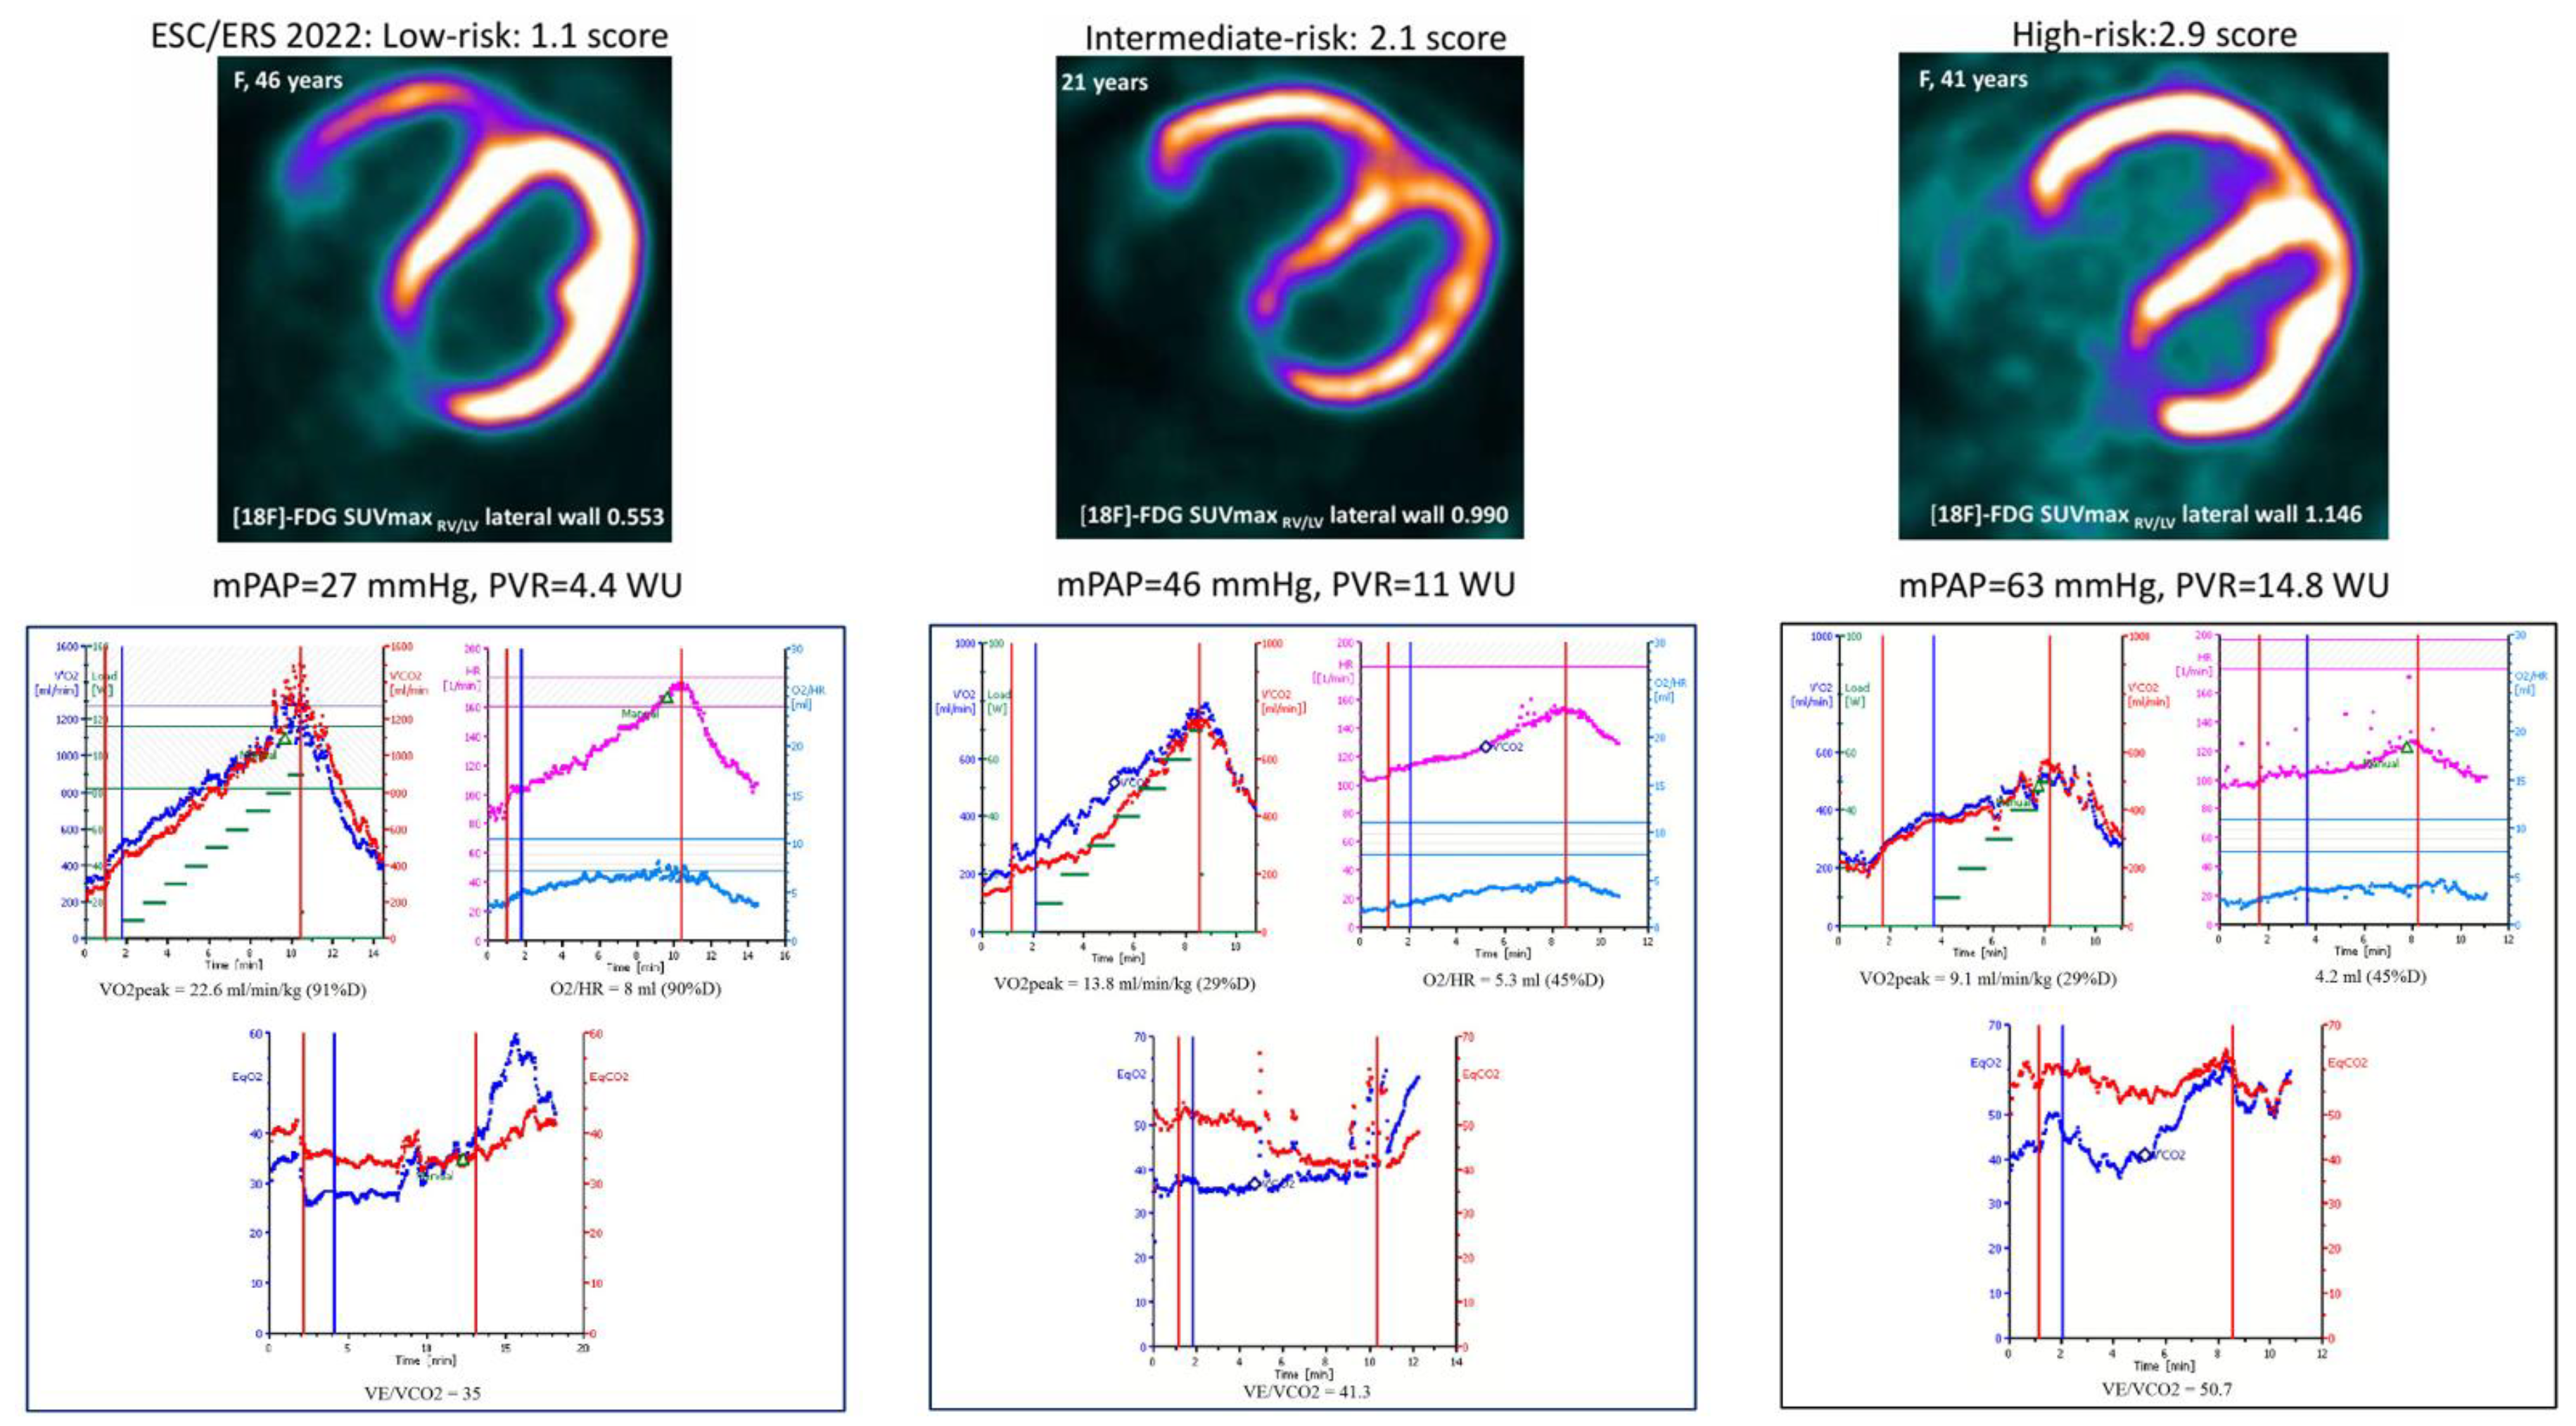

Table 1.
Characteristics of IPAH patients according to ESC/ERS 2022 risk status.
|
Parameters, n (%); M±SD; Me [IQR 25;75]. |
Entire cohort, n=34 |
Low risk, N=11 |
Intermediate risk, N=17 |
High risk, N=6 |
P value (*, **, ***) |
| Age (years) | 33.9 ± 8.7 | 33.1 ± 7.8 | 34.4 ±10.2 | 34.5±7.2 | 0.9 (0.7; 0.9; 0.7) |
| Male, n (%) | 3 (8.8) | 2 (18.1) | 1 (5.8) | 0 (0) | n/a |
| BMI (kg/m2) | 25.3 ± 6.5 | 24.2 ± 4.0 | 26.2 ± 7.8 | 26.3 ± 7.3 | 0.7 (0.4; 0.9; 0.4) |
| Smoking, n (%) | 6 (17.6) | 3 (27) | 2 (11.7) | 1 (16.7) | n/a |
| Prevalent, n (%) | 6 (17.6) | 3 (27.2) | 1 (5.8) | 2 (33.3) | n/a |
| FC III-IV, n (%) | 20 (58.8) | 0 | 14 (82) | 6 (100) | 0.0002 |
| 6MWT, m | 394.1 ±121.2 | 469.1 ± 71.6 | 365.7 ± 101.9 | 319.7 ± 178.2 | 0.01 (0.006; 0.4; 0.02) |
| Laboratory parameters | |||||
| NT-proBNP, pg/ml | 767 [144; 2835] | 114.0 [55.5; 210.0] | 1016.0 [532.9; 2796.0] | 4443.0 [3450.0; 5576.0] | 0.00005 (0.006; 0.006;0.000001) |
| CRP, mg/l | 2.2 ± 1.9 | 1.2 ±0.6 | 2.2 ±1.6 | 4.2 ±3.1 | 0.006 (0.04; 0.06; 0.005) |
| eGFR, ml/min/1.73m2 | 97.0 ± 28.3 | 100.7 ± 25.9 | 99.7 ± 25.5 | 82.7 ± 39.4 | 0.4 (0.9; 0.2; 0.2) |
| Hemoglobin, g/l | 144.1 ± 17.0 | 136.4 ±19.4 | 148.2 ± 14.4 | 148.7 ± 15.7 | 0.1 (0.07; 0.9; 0.2) |
| Lung function test | |||||
| FVC, % | 93.3 ± 15.1 | 97.8 ± 12.7 | 90.3 ± 18.6 | 92.5 ± 6.0 | 0.4 (0.2; 0.8; 0.3 ) |
| FEV1, % | 88.9 ± 9.9 | 94. 9 ± 7.4 | 86.2 ± 9.4 | 83.8 ± 10.9 | 0.02 (0.007; 0.9; 0.05) |
| DLCO, % | 75.1 ± 17.3 | 81.9 ±15.6 | 67.6 ±16.4 | 78.9 ± 18.1 | 0.08 (0.03; 0.2; 0.7) |
| Right heart catheterization | |||||
| mBP, mm Hg | 86.2 ± 11.7 | 92.6 ± 13.4 | 81.8 ± 9.3 | 85.0 ± 9.3 | 0.047 (0.02; 0.4; 0.2) |
| mPAP, mm Hg | 55.7 ± 19.8 | 40.8 ± 13.9 | 63.1 ± 18.5 | 65.8 ± 17.5 | 0.002 (0.002; 0.7; 0.004) |
| RAP, mm Hg | 7.1 ± 5.4 | 3.8 ± 2.8 | 6.7 ± 4.4 | 14.8 ± 4.6 | 0.00005 (0.058; 0.001; 0.000009) |
| PCWP, mm Hg | 8.4 ± 3.6 | 7.7 ± 4.5 | 8.2 ±3.3 | 10.2 ± 1.7 | 0.3 (0.7; 0.2; 0.2) |
| CI, l/min/m2 | 2.5 ± 0.8 | 3.3 ± 0.5 | 2.2 ± 0.4 | 1.8 ± 0.3 | <0.000001 (0.000001; 0.05; 0.000004) |
| PVR, WU | 11.3 [6.5; 15.5] | 5.5 [3.9; 7.2] | 12.5 [11.0; 16.7] | 22.0 [14.8; 34.7] | 0.0002 (0.001; 0.1; 0.00004) |
| PAC, ml/mm Hg | 1.5 ± 1.0 | 2.3 ±0.8 | 1.3 ± 0.9 | 0.7 ±0.3 | 0.0004 (0.004; 0.1; 0.0002) |
| Sat O2, % | 95.3 ± 2.8 | 96.3 ± 2.9 | 95.0 ± 2.7 | 94.2 ± 2.6 | 0.3 (0.2; 0.5; 0.1) |
| SvO2, % | 62,4 ± 12,3 | 72.2 ± 5.8 | 59.9 ± 10.4 | 49.2 ± 12.0 | 0.00007 (0.001; 0.05; 0.00004) |
| Cardiopulmonary exercise testing | |||||
| Load, W | 73.6 [50.0; 90.0] | 90.0 [87.0; 102.5] | 60.0 [50.0; 75.0] | 50.0 [50.0; 70.0] | 0.001 (0.001; 0.7; 0.03) |
| VO2 peak, ml/min/kg | 13.4 [11.1; 18] | 18.1 [16.9; 22.8] | 11.7 [10.8; 14.2] | 11.7 [10.8; 13.8] | 0.0003 (0.0002; 0.9; 0.01) |
| VO2 peak Predicted, % | 54.4 ± 19.5 | 67.8 ± 19.2 | 47.3 ± 15.1 | 46.7 ± 18.6 | 0.008 (0.004; 0.9; 0.04) |
| %VO2/kg AT Predicted, ml/kg/min | 50.3 ± 17.8 | 61.8 ± 16.2 | 45.4 ± 13.3 | 39.8 ± 21.7 | 0.02 (0.01; 0.5; 0.04) |
| ΔVO2/ΔWR, ml/min/W | 9.0 ± 2.4 | 10.2 ± 2.1 | 8.5 ± 2.4 | 7.8 ± 2.2 | 0.07 (0.06; 0.5; 0.04) |
| V'O2/HR Predicted, % | 62.7 ± 19.0 | 72.7 ± 20.1 | 58.1 ± 17.9 | 55.3 ± 13.2 | 0.07 (0.05; 0.7; 0.07) |
| HR/Vkg, l/ml/kg | 11.0 ± 2.8 | 9.1 ± 2.2 | 12.0 ± 2.7 | 12.2 ± 2.2 | 0.009 (0.006; 0.9; 0.01) |
| VE max Predicted,% | 60.2 ± 17.5 | 66.3 ± 20.1 | 59.4 ± 16.2 | 50.3 ± 12.1 | 0.1 (0.3; 0.2; 0.09) |
| Desaturation, % | 2 [1; 4] | 1.5 [1.0; 4.0] | 2.0 [1.0; 4.0] | 3.0 [2.0; 5.0] | 0.7 (0.7; 0.6; 0.5) |
| ΔVD/VT, % | 2.8 ± 6.8 | 6.3 ± 7.7 | 1.2 ± 6.3 | 1.2 ± 4.8 | 0.1 (0.07; 0.9; 0.1) |
| BR Predicted, %, l | 171.4 ± 48.4 | 146.4 ± 57.9 | 177.0 ± 39.9 | 201.0 ± 37.5 | 0.2 (0.2; 0.3; 0.1) |
| VE/VCO2 | 48.9 ± 13.1 | 42.6 ± 13.6 | 53.5 ± 12.4 | 49.0 ± 10.2 | 0.09 (0.04; 0.4; 0.3) |
| VE/VCO2 AT | 45.2 ± 12.5 | 37.7 ± 8.4 | 50.9 ± 13.9 | 45.2 ± 8.0 | 0.03 (0.01; 0.4; 0.1) |
| PetCO2 rest | 3.38±0.7 | 3.73±0.74 | 3.22±0.73 | 3.16±0.45 | 0.1 (0.09; 0.8; 0.1) |
| PetCO2 peak | 3.06±0.92 | 3.47±0.92 | 2.8±0.92 | 2.9±0.7 | 0.2 (0.07; 0.6; 0.3) |
| ∆ PetCO2 | 0.32±0.49 | 0.25±0.55 | 0.42±0.41 | 0.17±0.59 | 0.5 (0.4; 0.3; 0.7) |
| PetCO2 AT | 3.29±1.07 | 3.72±1.29 | 2.97±0.9 | 3.29±0.7 | 0.3 (0.1; 0.5; 0.5) |
| Cardiac MRI | |||||
| RA short dimension, mm | 49.6 ± 9.8 | 44.0 ± 4.9 | 52.4 ± 9.4 | 54.3 ± 13.7 | 0.03 (0.01; 0.7; 0.03) |
| RV EDV index, ml/m2 | 86.2 ± 22.6 | 79.7 ± 16.6 | 80.8 ± 18.7 | 112.1 ± 25.7 | 0.004 (0.8; 0.006; 0.005) |
| RV ESV index, ml/m2 | 57.1 ± 18.8 | 43.9 ± 12.3 | 56.4 ±10.5 | 85.2 ± 13.9 | 0.00001 (0.01; 0.00007; 0.000008) |
| RV wall thickness, mm | 6.0 ± 1.8 | 5.0 ± 1.3 | 6.4 ±1.9 | 7.4 ± 1.6 | 0.02 (0.049; 0.2; 0.003 ) |
| RV EF, % | 36.5 ± 11.3 | 45.0 ±7.5 | 34.9 ± 8.8 | 23.2 ± 8.9 | 0.00005 (0.004; 0.01; 0.00005) |
| LA short dimension, mm | 29.6 ± 5.4 | 33.1 ± 5.0 | 28.0 ± 4.3 | 26.2 ± 4.8 | 0.007 (0.01; 0.4; 0.01) |
| LV EDV index, ml/m2 | 58.9 ± 15.9 | 72.7 ± 9.2 | 55.3 ± 12.4 | 39.8 ± 7.6 | 0.000002 (0.0005; 0.01; 0.000001) |
| LV ESV index, ml/m2 | 23.3 ± 7.5 | 29.4 ± 6.2 | 20.8 ±5.4 | 17.0 ± 5.7 | 0.0002 (0.001; 0.2; 0.0009) |
| LV SV index, ml/m2 | 37.2 ± 14.6 | 48.1 ± 15.6 | 34.2 ± 8.9 | 22.6 ± 4.2 | 0.0003 (0.009; 0.007; 0.001) |
| LV EF, % | 60.4 ± 6.3 | 60.8 ± 4.7 | 61.6 ± 6.4 | 57.0 ± 8.4 | 0.3 (0.7; 0.2; 0.2) |
| RV EDVi/LV EDVi | 1.4 [1.03; 1.87] | 1.0 [0.9; 1.2] | 1.5 [1.2; 1.7] | 2.7 [2.3; 4.1] | 0.000001 (0.01; 0.0003; 0.000009) |
| RV ESVi/LV ESVi | 2.37 [1.59; 3.56] | 1.4 [1.3; 1.6] | 2.7 [2.2; 3.3] | 4.6 [4.4; 7.6] | 0.000001 (0.00004; 0.001; 0.00004) |
| PET-CT metabolism of the RV/LV | |||||
| [18F]-FDG SUVmax RV/LV lateral wall | 0.866±0.365 | 0.581±0.393 | 0.941±0.247 | 1.186±0.293 | 0.002 (0.007; 0.07; 0.01) |
| PET-CT perfusion of the RV/LV | |||||
| [13N]-NH3 SUVmax RV/LV lateral wall | 0.817±0.157 | 0.744±0.153 | 0.867±0.142 | 0.796±0.184 | 0.1 (0.04; 0.3; 0.5) |
| The ration of metabolism to perfusion of the RV/LV | |||||
| SUVmax 18F-FDG/SUVmax [13N]-NH3 RV/LV lateral wall | 1.481±0.799 | 0.786±0.321 | 1.646±0.646 | 2.311±0.931 | 0.0002 (0.0006; 0.08; 0.0004) |
| PAH therapy | |||||
| Naïve patients, n (%) | 28 (82.3) | 3 (27.3) | 1 (5.8) | 2 (33.3) | n/a |
Footnote: * difference between low and intermediate risk groups; ** difference between intermediate and high risk group; *** difference between low and high risk groups; AT, anaerobic threshold; BR, breathing reserve; BMI, body mass index; CI, cardiac index; CCB, calcium channel blockers; CPET, cardiopulmonary exercise test;; DLCO, diffusion capacity of the lungs for carbon monoxide; EDVi, end-diastolic volume index; ESVi, end-systolic volume index; eGFR, estimated glomerular filtration rate; EF, ejection fraction; ESC, European Society of Cardiology; ERS, European Respiratory Society; ERA, endothelin receptor antagonist; FC, functional class; FEV1, forced expiratory volume in one second; FVC, forced vital capacity; HR/Vkg, heart rate slope; IQR, interquartile range; LA, left atrial; LV, left ventricle; max, maximal; mBP, mean blood pressure; mPAP, mean pulmonary artery pressure; MRI - magnetic resonance imaging; n/a, not applicable; NT-proBNP, N-terminal pro-brain-type natriuretic peptide; PAC, pulmonary artery compliance; PCWP, pulmonary capillary wedge pressure; PET, positron emission tomography; Pet CO2, partial pressure of end-tidal carbon dioxide; PVR, pulmonary vascular resistance; RA, right atrial; RAP, right atrial pressure; RHC, right heart catheterization; RV, right ventricle; Sat O2, arterial oxygen saturation; SV, stroke volume: SUV, standardized uptake value; SvO2, mixed venous oxygen saturation; 6MWT, 6 minute walk test; [18F]-FDG, 18F-Fluorodeoxyglucose; [13N]-NH3, ammonia; VE, ventilator equivalent; VE/VCO2, the ratio of minute ventilation to carbon dioxide production; VO2/HR, oxygen pulse; VO2 peak, peak oxygen consumption; VO2/kgAT, peak oxygen consumption at anaerobic threshold; VE/VCO2, minute ventilation per unit carbon dioxide production; ΔVO2/ΔWR, the ratio between oxygen consumption and workload; ΔVD/VT, delta peak to rest of the ratio of the dead space volume to the tidal volume; VO2/HR, oxygen pulse.
Table 2.
Correlations between CPET parameters and hemodynamics (Supplements).
| Parameters | Mean PAP | Mean RAP | CI | PAC | ||||||||
| r | t | p | r | t | p | r | t | p | r | t | p | |
| %Load predicted | -0.57 | -3.9 | 0.0004 | -0.003 | -0.02 | 0.9 | 0.44 | 2.8 | 0.009 | 0.48 | 3.2 | 0.003 |
| VO2 peak | -0.45 | -2.9 | 0.007 | -0.17 | -0.9 | 0.3 | 0.48 | 3.1 | 0.004 | 0.35 | 2.1 | 0.04 |
| %VO2 peak predicted | -0.45 | -2.9 | 0.007 | -0.05 | -0.3 | 0.7 | 0.52 | 3.4 | 0.002 | 0.49 | 3.2 | 0.003 |
| VO2/HR | -0.37 | -2.3 | 0.03 | -0.07 | -0.4 | 0.7 | 0.44 | 2.7 | 0.01 | 0.52 | 3.5 | 0.002 |
| % VO2/HR predicted | -0.49 | -3.2 | 0.003 | -0.06 | -0.3 | 0.7 | 0.38 | 2.3 | 0.02 | 0.47 | 3.1 | 0.004 |
| ∆VD/VT | 0.14 | 0.8 | 0.4 | 0.04 | 0.2 | 0.8 | 0.12 | 0.6 | 0.5 | 0.10 | 0.5 | 0.5 |
| %BR | 0.14 | 0.6 | 0.5 | 0.16 | 0.7 | 0.5 | -0.39 | -1.8 | 0.08 | -0.43 | -2.1 | 0.05 |
| PetCO2 rest | -0.38 | -2.3 | 0.03 | -0.01 | -0.08 | 0.9 | 0.42 | 2.5 | 0.02 | 0.36 | 2.2 | 0.04 |
| PetCO2 peak | -0.45 | -2.8 | 0.008 | 0.003 | 0.01 | 0.9 | 0.34 | 2.0 | 0.05 | 0.38 | 2.3 | 0.03 |
| ∆Pet CO2 | 0.23 | 1.3 | 0.2 | -0.04 | -0.2 | 0.8 | -0.007 | -0.04 | 0.9 | -0.15 | -0.8 | 0.4 |
| PetCO2 AT | -0.35 | 1.9 | 0.06 | -0.004 | -0.002 | 0.9 | 0.31 | 1.7 | 0.1 | 0.24 | 1.3 | 0.2 |
| ΔVO2/ΔWR | -0.16 | -0.8 | 0.4 | -0.12 | -0.7 | 0.5 | 0.45 | 2.7 | 0.01 | 0.27 | 1.5 | 0.1 |
| HR/Vkg | 0.52 | 3.3 | 0.002 | 0.14 | 0.8 | 0.4 | -0.41 | -2.5 | 0.02 | -0.41 | -2.5 | 0.02 |
| VO2 AT | -0.41 | -2.4 | 0.02 | -0.36 | -2.0 | 0.05 | 0.54 | 3.3 | 0.003 | 0.43 | 2.5 | 0.02 |
| %VO2 AT predicted | -0.45 | -2.6 | 0.01 | -0.13 | -0.7 | 0.5 | 0.56 | 3.5 | 0.002 | 0.53 | 3.2 | 0.004 |
| VE/VCO2 | 0.37 | 2.3 | 0.03 | 0.11 | 0.6 | 0.5 | -0.37 | -2.3 | 0.03 | -0.28 | -1.7 | 0.1 |
| VE/VCO2 AT | 0.43 | 2.4 | 0.02 | 0.03 | 0.1 | 0.9 | -0.44 | -2.5 | 0.02 | -0.31 | -1.7 | 0.1 |
Footnotes: * difference between low and intermediate risk groups; ** difference between intermediate and high risk group; *** difference between low and high risk groups; AT, anaerobic threshold; BR, breathing reserve; CI, cardiac index; dO2/dW, HR/Vkg, heart rate slope; PAC, pulmonary artery compliance; PAP, pulmonary artery pressure; Pet CO2, partial pressure of end-tidal carbon dioxide; RAP, right atrial pressure; PVR, pulmonary vascular resistance; VE/VCO2, the ratio of minute ventilation to carbon dioxide production; V'O2/HR, oxygen pulse; VO2 peak, peak oxygen consumption; VO2/kgAT, peak oxygen consumption at anaerobic threshold; VE/VCO2, minute ventilation per unit carbon dioxide production;ΔVO2/ΔWR, relationship between oxygen consumption and workload;ΔVD/VT, delta peak to rest of the ratio of the dead space volume to the tidal volume; VO2/HR, oxygen pulse.
Table 3.
Correlations between CPET parameters and cardiac MRI (Supplements).
| Parameters | RV ESV index | LV SV index | RV EF | RV ESV index/LV ESV index | ||||||||
| r | t | p | r | t | p | r | t | p | r | t | p | |
| %Load predicted | -0.38 | -2.25 | 0.03 | 0.44 | 2.6 | 0.01 | 0.3 | 1.8 | 0.08 | -0.58 | -3.9 | 0.0005 |
| VO2 peak | -0.29 | -1.67 | 0.1 | 0.54 | 3.5 | 0.001 | 0.3 | 1.7 | 0.1 | -0.66 | -4.8 | 0.00004 |
| %VO2 peak predicted | -0.37 | -2.19 | 0.036 | 0.49 | 3.1 | 0.004 | 0.3 | 1.5 | 0.1 | -0.60 | -4.1 | 0.0003 |
| VO2/HR | -0.26 | -1.46 | 0.1 | 0.43 | 2.6 | 0.01 | 0.17 | 0.9 | 0.3 | -0.42 | -2.5 | 0.02 |
| % VO2/HR predicted | -0.27 | -1.5 | 0.1 | 0.46 | 2.8 | 0.008 | 0.29 | 1.7 | 0.1 | -0.46 | -2.8 | 0.008 |
| ∆VD/VT | 0.1 | 0.6 | 0.5 | 0.1 | 0.5 | 0.6 | 0.06 | 0.3 | 0.7 | -0.02 | -0.1 | 0.9 |
| %BR | 0.2 | 1.0 | 0.3 | -0.02 | -0.1 | 0.9 | 0.03 | 0.1 | 0.8 | 0.3 | 1.3 | 0.2 |
| PetCO2 rest | -0.39 | -2.3 | 0.03 | 0.3 | 1.8 | 0.07 | 0.2 | 1.1 | 0.2 | -0.53 | -3.3 | 0.002 |
| PetCO2 peak | -0.35 | -2.02 | 0.05 | 0.42 | 2.5 | 0.02 | 0.2 | 1.3 | 0.2 | -0.52 | -3.3 | 0.002 |
| ∆Pet CO2 | 0.09 | 0.5 | 0.6 | -0.26 | -1.4 | 0.1 | -0.09 | -0.5 | 0.6 | 0.22 | 1.2 | 0.2 |
| PetCO2 AT | -0.36 | -1.8 | 0.07 | 0.30 | 1.5 | 0.1 | 0.18 | 0.9 | 0.4 | -0.43 | -2.4 | 0.02 |
| ΔVO2/ΔWR | -0.21 | -1.1 | 0.3 | 0.44 | 2.6 | 0.01 | 0.2 | 1.1 | 0.3 | -0.44 | -2.6 | 0.01 |
| HR/Vkg | 0.22 | 1.2 | 0.2 | -0.55 | -3.5 | 0.002 | -0.27 | -1.5 | 0.1 | 0.54 | 3.4 | 0.002 |
| VO2 AT | -0.44 | -2.5 | 0.02 | 0.56 | 3.4 | 0.002 | 0.2 | 1.2 | 0.2 | -0.69 | -4.8 | 0.00005 |
| %VO2 AT predicted | -0.47 | -2.6 | 0.01 | 0.49 | 2.8 | 0.01 | 0.2 | 1.3 | 0.2 | -0.63 | -3.9 | 0.0005 |
| VE/VCO2 | 0.30 | 1.7 | 0.09 | -0.42 | -2.5 | 0.016 | -0.19 | -1.1 | 0.3 | 0.51 | 3.3 | 0.002 |
| VE/VCO2 AT | 0.47 | 2.6 | 0.01 | -0.39 | -2.1 | 0.048 | -0.33 | -1.7 | 0.09 | 0.57 | 3.4 | 0.002 |
Footnotes: * difference between low and intermediate risk groups; ** difference between intermediate and high risk group; *** difference between low and high risk groups; AT, anaerobic threshold; BR, breathing reserve; ESV, end systolic volume; EF, ejection fraction; HR/Vkg, heart rate slope; LV – leftventricle; Pet CO2,partial pressure of end-tidal carbon dioxide;RV, right ventricle;SV, stroke volume; VE/VCO2, the ratio of minute ventilation to carbon dioxide production; V'O2/HR, oxygen pulse; VO2 peak, peak oxygen consumption; VO2/kgAT, peak oxygen consumption at anaerobic threshold; VE/VCO2, minute ventilation per unit carbon dioxide production;ΔVO2/ΔWR, relationship between oxygen consumption and workload;ΔVD/VT, delta peak to rest of the ratio of the dead space volume to the tidal volume; VO2/HR, oxygen pulse.
Table 4.
Correlations between [18F]-FDG and [13N]- NH3 uptake of the RV/LV lateral wall and CPET parameters.
Table 4.
Correlations between [18F]-FDG and [13N]- NH3 uptake of the RV/LV lateral wall and CPET parameters.
| Parameters | [18F]-FDGSUVmax RV/LV lateral wall | [13N]-NH3 SUVmax RV/LV lateral wall | [18F]-FDGSUVmax/[13N]-NH3 SUVmaxRV/LVlateral wall | ||||||
| r | t | p | r | t | p | r | t | p | |
| %Load predicted | -0.54 | -3.5 | 0.002 | -0.58 | -4.1 | 0.0003 | -0.45 | -2.7 | 0.009 |
| VO2 peak | -0.59 | -4.1 | 0.0003 | -0.46 | -2.9 | 0.006 | -0.54 | -3.5 | 0.01 |
| %VO2 peak predicted | -0.46 | -2.9 | 0.007 | -0.51 | -3.3 | 0.002 | -0.46 | -2.8 | 0.008 |
| VO2/HR | -0.22 | 1.2 | 0.2 | -0.39 | -2.4 | 0.02 | -0.35 | -2.04 | 0.05 |
| % VO2/HR predicted | -0.29 | -1.7 | 0.09 | -0.49 | -3.1 | 0.003 | -0.25 | -1.5 | 0.1 |
| ∆VD/VT | 0.16 | 0.89 | 0.4 | 0.37 | 2.2 | 0.03 | -0.28 | -1.6 | 0.1 |
| %BR | 0.03 | 0.1 | 0.9 | 0.08 | 0.4 | 0.7 | 0.06 | 0.2 | 0.8 |
| PetCO2 rest | -0.46 | -2.8 | 0.009 | -0.60 | -4.2 | 0.0002 | -0.26 | -1.4 | 0.2 |
| PetCO2 peak | -0.38 | -2.2 | 0.03 | -0.44 | -2.7 | 0.009 | -0.26 | -1.5 | 0.2 |
| ∆Pet CO2 | 0.08 | 0.4 | 0.6 | 0.04 | 0.2 | 0.8 | 0.1 | 0.7 | 0.5 |
| PetCO2 AT | -0.44 | -2.4 | 0.02 | -0.59 | -3.7 | 0.0009 | -0.25 | -1.3 | 0.2 |
| ΔVO2/ΔWR | -0.28 | -0.6 | 0.1 | -0.27 | -1.5 | 0.1 | -0.35 | -1.9 | 0.057 |
| HR/Vkg | 0.45 | 2.7 | 0.01 | 0.53 | 3.4 | 0.002 | 0.42 | 2.5 | 0.02 |
| VO2 AT | -0.56 | -3.4 | 0.002 | -0.46 | -2.7 | 0.01 | -0.47 | -2.7 | 0.01 |
| %VO2 AT predicted | -0.52 | -3.1 | 0.005 | -0.54 | -3.3 | 0.003 | -0.44 | -2.4 | 0.02 |
| VE/VCO2 | 0.37 | 2.2 | 0.03 | 0.36 | 2.2 | 0.04 | 0.2 | 1.1 | 0.3 |
| VE/VCO2 AT | 0.44 | 2.5 | 0.02 | 0.62 | 4.02 | 0.0004 | 0.3 | 1.7 | 0.1 |
Footnotes: AT, anaerobic threshold; BR, breathing reserve; ESV, end systolic volume; EF, ejection fraction; HR/Vkg, heart rate slope; LV, left ventricle; PET, positron emission tomography; Pet CO2, partial pressure of end-tidal carbon dioxide; RV, right ventricle; SV, stroke volume; SUV, standardized uptake value; VE/VCO2, the ratio of minute ventilation to carbon dioxide production; V'O2/HR, oxygen pulse; VO2 peak, peak oxygen consumption; VO2/kgAT, peak oxygen consumption at anaerobic threshold; VE/VCO2, minute ventilation per unit carbon dioxide production;ΔVO2/ΔWR, relationship between oxygen consumption and workload;ΔVD/VT, delta peak to rest of the ratio of the dead space volume to the tidal volume; VO2/HR, oxygen pulse; [18F]-FDG, 18F-Fluorodeoxyglucose;[13N]-NH3, ammonia.
Table 5.
[18F]-FDG and [13N]-ammonia uptake by RV myocardium depending on the risk categories of the main cardiopulmonary test determinants.
Table 5.
[18F]-FDG and [13N]-ammonia uptake by RV myocardium depending on the risk categories of the main cardiopulmonary test determinants.
| Peak oxygen consumption, ml/min/kg | ||||
| Parameters, n (%); m±SD | Low risk (n=14) | Intermediate/high risk (n=20) | P value | |
| Risk category | >15 | <15 | ||
| [18F]-FDG SUVmax RV/LV lateral wall | 0.59 ±0.28 | 1.08 ±0.26 | 0.00002 | |
| [13N]-NH3 SUVmax RV/LV lateral wall | 0.72 ± 0.10 | 0.89 ± 0.15 | 0.0005 | |
| SUVmax 18F-FDG/SUVmax [13N]-NH3 RV/LV lateral wall | 1.08 ±0.8 | 1.78±0.6 | 0.01 | |
| Peak oxygen consumption, %, Predicted | ||||
| Risk category | Low risk (n=8) | Intermediate (n=17) | High risk (n=9) |
P value, all groups (*;**;***) |
| >65 | 35-65 | <35 | ||
| [18F]-FDG SUVmax RV/LV lateral wall | 0.6 ±0.3 | 0.9 ±0.3 | 1.2 ±0.3 | 0.01 (0.1; 0.04; 0.005) |
| [13N]-NH3 SUVmax RV/LV lateral wall | 0.7 ± 0.07 | 0.8 ± 0.1 | 1.0 ±0.2 | 0.003 (0.04; 0.04; 0.001) |
| SUVmax 18F-FDG/SUVmax [13N]-NH3 RV/LV lateral wall | 1.2 ±1.0 | 1.4 ± 0.7 | 2.0 ± 0.5 | 0.1 (0.4; 0.08; 0.08) |
| VE/VCO2, the ratio of minute ventilation to carbon dioxide production | ||||
| Risk category | Low risk (n=10) | Intermediate/high risk (n=24) | P value | |
| <36 | >36 | |||
| [18F]-FDG SUVmax RV/LV lateral wall | 0.6 ± 0.3 | 0.9 ± 0.3 | 0.007 | |
| [13N]-NH3 SUVmax RV/LV lateral wall | 0.7 ± 0.09 | 0.8 ± 0.16 | 0.03 | |
| SUVmax 18F-FDG/SUVmax [13N]-NH3 RV/LV lateral wall | 1.2 ± 0.9 | 1.6 ± 0.7 | 0.2 | |
Footnotes: * difference between low and intermediate risk groups; ** difference between intermediate and high risk group; *** difference between low and high risk groups; [18F]-FDG, 18F-Fluorodeoxyglucose; [13N]-NH3, ammonia; VO2/HR, oxygen pulse; VE, ventilator equivalent; VE/VCO2, the ratio of minute ventilation to carbon dioxide production; VO2/HR, oxygen pulse; VO2 peak, peak oxygen consumption; VO2/kgAT, peak oxygen consumption at anaerobic threshold; VE/VCO2, minute ventilation per unit carbon dioxide production; LV – left ventricle; max, maximal; RV, right ventricle; SUV, standartized uptake value.
Disclaimer/Publisher’s Note: The statements, opinions and data contained in all publications are solely those of the individual author(s) and contributor(s) and not of MDPI and/or the editor(s). MDPI and/or the editor(s) disclaim responsibility for any injury to people or property resulting from any ideas, methods, instructions or products referred to in the content. |
© 2025 by the authors. Licensee MDPI, Basel, Switzerland. This article is an open access article distributed under the terms and conditions of the Creative Commons Attribution (CC BY) license (http://creativecommons.org/licenses/by/4.0/).
Copyright: This open access article is published under a Creative Commons CC BY 4.0 license, which permit the free download, distribution, and reuse, provided that the author and preprint are cited in any reuse.


