Submitted:
24 July 2025
Posted:
25 July 2025
You are already at the latest version
Abstract
Droughts are complex and recurring natural hazards that occur throughout the ecosystems and impact many sectors of society. Droughts have complex spatiotemporal behaviors, therefore monitoring them is a challenging task. Drought monitoring has mostly depended on climate-based indices and indicators, thus deemed useful in many scenarios. The purpose of this review is to explore classical and holistic drought indicators/indices for unravelling their usefulness and associated limitations. Given that they offer a broadened spatial perspective of drought conditions and fluctuations over large areas, climate-based drought index maps may be of limited use. Precise evaluations of drought are necessary for efficient monitoring and assessment of the condition. Here, this review examined more than 50 indices/indicators for their sensitivity to input data requirements, spatiotemporal scales, strengths, and weaknesses. Also, an analysis was carried out based on the previous studies to identify hotspots and show the dissimilarity in the results yielded by different indices/indicators. Typically, none of these indices is inclusive enough to provide a broad-gauge assessment and determine appropriate actions. New and enhanced geospatial intelligence-based drought indices and earth observations are needed to identify, classify, and communicate real-time drought-related phenomena, as well as offer an in-depth breakdown of the constraints and requirements of novel indicators and data difficulties.
Keywords:
droughts
; climatic water deficit
; aridity index
; precipitation
; evapotranspiration
; yield loss
1. Introduction
A global increase in temperature and severe changes in precipitation have been observed due to anthropogenic greenhouse gas emissions (Solomon et al., 2009; Tan et al., 2023). The United Nations Office for Disaster Risk Reduction (UNDRR) identified drought as one of the largest global risks that could impact the world over the next decades (Erian et al., 2021). In some regions of the planet, there will be severe drought and heatwaves (Tripathy and Mishra, 2023). Droughts are among the most complex environmental effects, devastating natural hazards, and affect many different socio-ecological systems (e.g., air, forests, aquatic systems, soils, and humans) (Vicente-Serrano et al., 2020). Droughts can affect the quality, structure, diversity, and functioning of agroecosystems (Kundel et al., 2020). Due to changing climate, shifting ocean and atmospheric dynamic patterns, expanding human water usage, and human influence on the environment, novel forms of drought are emerging locally, regionally, and globally. Prolonged droughts are increasing the likelihood of ecological transitions that have expensive externalities and significant repercussions for anthropoid communities (Crausbay et al., 2020). The natural pattern of droughts has been exacerbated by climate change, becoming more prevalent, prolonged, and catastrophic. This situation can get worse, increasing water stress in already affected regions.
The World Economic Forum (WEF) reported that, the frequency and duration of droughts have risen by 29% since 2000 and more than 75% of the world could face drought by 2025 (WEF, 2022). Over the past four decades, weather, climate, and water hazards represented 50% of disasters and 45% of disaster-related fatalities, especially in developing economies. Droughts contributed to 15% of natural catastrophes but took the highest humanitarian toll, with roughly 650,000 deaths. From 1998 to 2017, droughts triggered global economic losses of approximately USD 124 Bn (Crossman, 2018). In 2022, more than 2.3 Bn people face water stress; almost 160 million children are exposed to severe and prolonged droughts. Besides, by 2050, droughts may affect over three-quarters of the world’s population, and an estimated 4.8-5.7 Bn people will remain in areas that are water-scarce for at least one month per year, up from 3.6 Bn now (Funk et al., 2019). De facto, up to 216 million people could be forced to migrate by 2050, largely due to drought in combination with other factors including water scarcity, declining crop productivity, sea-level rise, and overpopulation (King-Okumu et al., 2020).
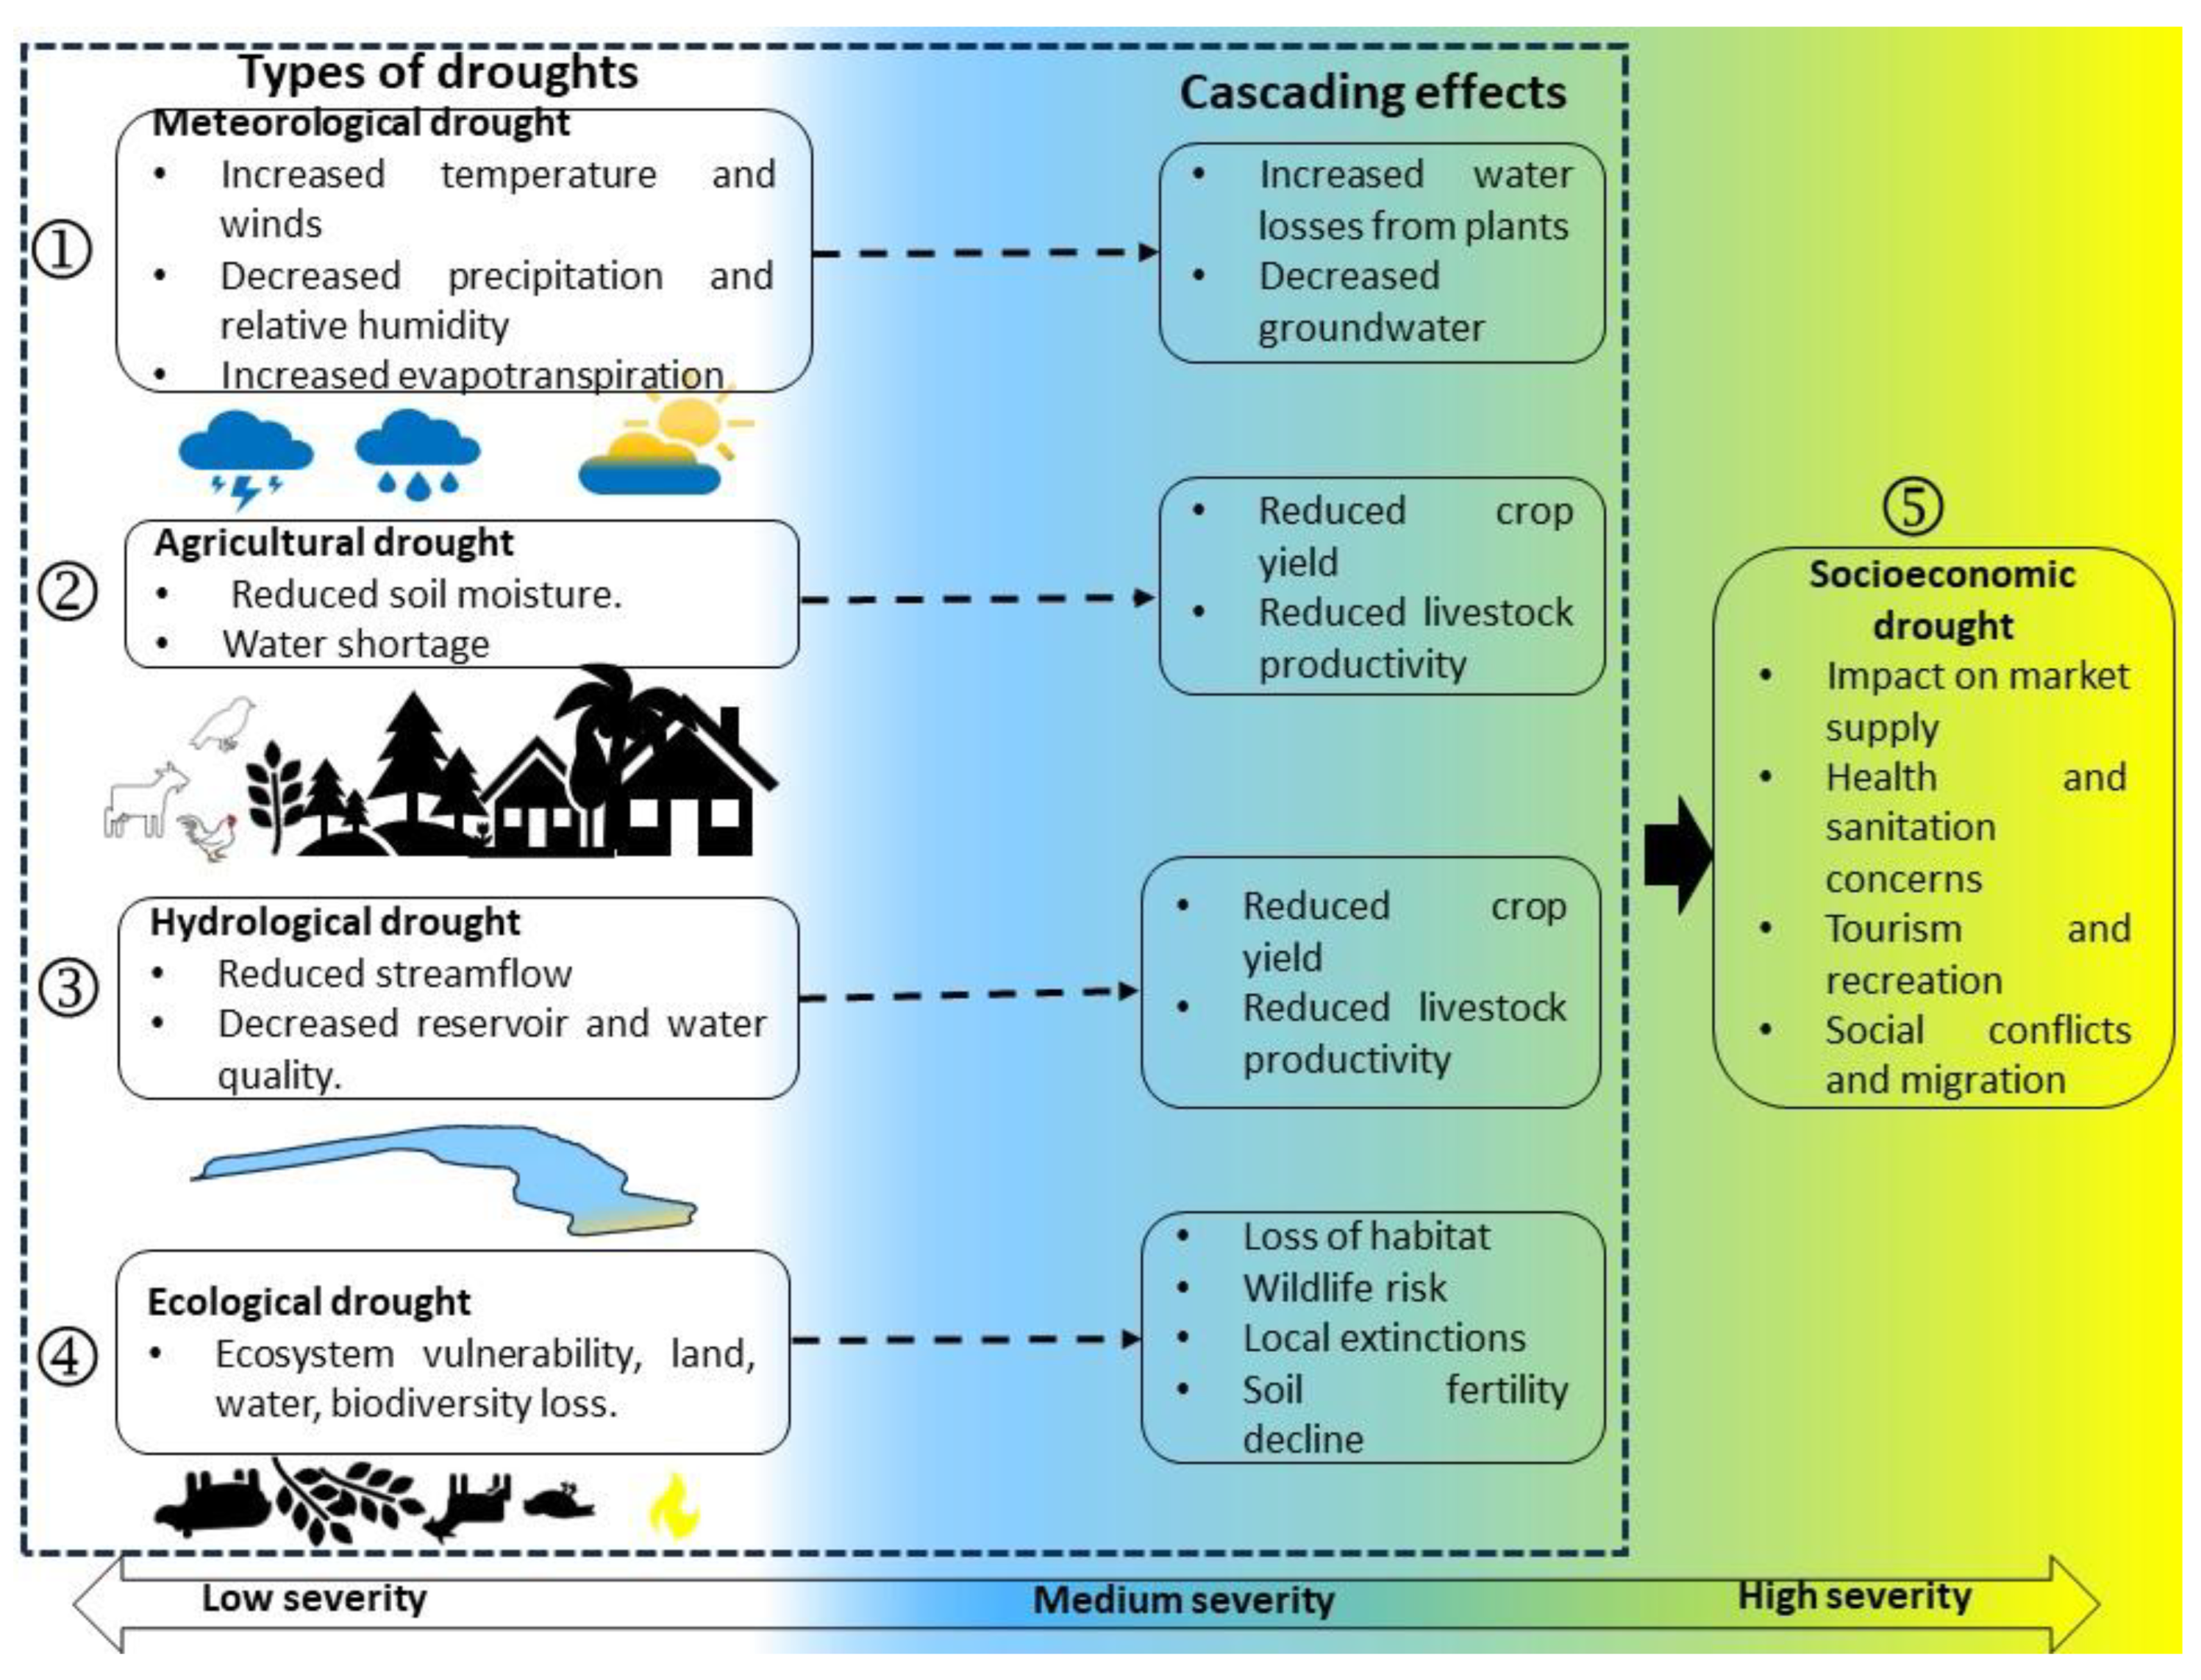
In the current nature dynamics of multiple shocks, accurate measurement of drought events has become a central task and problematic in terms of the measurement system and effective way to forecast long-term drought. According to Wilhite and Glantz (1985), there are a whole range of types of droughts (often distinguished) (Figure 1), but new categories are being defined (Crausbay et al., 2020), including the following:
➀ agricultural drought (farming) refers to the adverse impacts on farmland by factors such as rainfall shortages, soil water deficits, reduced groundwater, or dwindled reservoir levels required for irrigation (Jiang and Zhou, 2023; Orimoloye, 2022; Zhang et al., 2023)
➁ hydrological drought (surface water) is based on the impact of rainfall deficits on the water supply such as stream flow, reservoir and lake levels, and groundwater table decline (Brunner et al., 2023; Satoh et al., 2022; Van Loon, 2015),
➂ socio-economic drought (ones which affect humans) occurs when the demand for economic good exceeds supply as a result of a weather-related shortfall in water (Lee et al., 2022; Liu et al., 2020; Mehran et al., 2015),
➃ meteorological drought (weather) is typically defined on the basis of the extent of dryness (in comparison to some “normal” or average amount and the span of the dry period (Monjo et al., 2020; Torelló-Sentelles and Franzke, 2022),
➄ ecological drought defined as "a prolonged and widespread deficit in naturally available water supplies — including changes in natural and managed hydrology — that create multiple stresses across natural-human systems" (Crausbay et al., 2017; McEvoy et al., 2018; Park et al., 2020).
Drought indices are a crucial way to assess the extent of the problem. A thorough understanding of drought events helps to formulate strategic policies aimed at the effective management of water, land, and atmospheric systems. Using drought indices, drought types, intensity, duration, location, timing, and frequency of droughts can be evaluated quantitatively and used to plan for probable risk assessments (Nagarajan, 2010).
Owing to the challenges associated with the current descriptions of drought, their evolution depends on the metrics or indicators that help define this occurrence. Consequently, to study drought, basic information about the climate and weather around a particular area is necessary to ascertain whether a drought event has occurred or is likely to occur in the future (Wilhite, 2016). A consistent regional climatological pattern could indicate that a drought is about to start in another part of the region. Appropriate planning may be a prospect for mitigating the impacts of credible drought in this case if it is presumed that a exceptional dry pattern occurs in the region (Svoboda and Fuchs, 2016). Monitoring drought conditions may be conducted by early warning systems that might be supportive of adequate preparation for any drought event (Faiz et al., 2021; Heim and Brewer, 2012). Until now, there has been no widely agreed drought index among scholars, practitioners, and policymakers. There is a necessity of developing integrated composite drought indices and indicators. Hence, they will serve as a bridge between research and policy and enable policymakers to make informed judgments.
Up to now, investigations that focused on the 50+ drought indicators and indices based on various approaches (i.e., meteorology, soil moisture, hydrology, remote sensing, and modeled or composite), revealed that none encompasses all aspects of drought events. The Integrated Drought Management Programme (IDMP) declared that any, all, or none of the indicators/indices may be suitable for a particular application, based on user knowledge, needs, data availability, and computer resources available to implement them (Svoboda and Fuchs, 2016). On one hand, most of the indices solely depend on meteorological conditions while ignoring the social, economic, and environmental factors. Drought indices may not fully account for these non-meteorological causes. On the other hand, many drought indices focus on surface-level indicators but do not incorporate interfaces of several data (e.g., surface water dynamics, topography, soil properties, soil moisture, etc.) which is crucial for agriculture, water resources, and socio-ecological systems (Dehghani et al., 2022). It should be noted that drought indices are retrospective and often developed based on historical data or past drought conditions, a climate patterns shift, the effectiveness of these indices in predicting future droughts may decline, as well as challenging to plan for long-term drought resilience. Some of the indices may yield different results for the same area or time. This lack of consistency can make it challenging to compare and combine findings from different indices (Savenije, 2000). The above issues can stem to contradictory results, confusion, and inconsistency in monitoring efforts and, at the same time, mislead public opinion and decision-making process by creating a false sense of security or insecurity.
Developing a better understanding of the changing expression and influences of drought across diverse ecosystems is one of contemporary foremost challenges. Coupling novel methodologies (i.e., machine learning, deep learning, artificial intelligence, etc.) with high-resolution datasets of drought metrics is essential for monitoring and quantifying the duration, frequency, severity, and spatial extent of droughts at global, regional, and particularly local scales. Drought indices are practical techniques to convert enormous volumes of data into quantitative facts that can be used in applications such as drought forecasts and declaration, contingency planning, and impact assessment. Therefore, urgent actions are essential to better comprehend and more effectively achieve drought risk to reduce the devastating toll on human livelihoods and ecosystems.
In this work previous studies published from 1985 to 2025 were analyzed using VOS Viewer, a software tool for constructing and visualizing bibliometric networks (Perianes-Rodriguez et al., 2016). From the resulting 2691 published articles, 121 were clustered and reviewed. Based on the analysis, literature regarding drought indices and indicators can be divided into 7 categories: ➀ objectives of drought indices; ➁ spatiotemporal coverage; ➂ data availability and interpretability ➃ sectoral focus; ➄ complementarity and scientific validity; ➅ applicability for early warning; and ➆ adaptation to climate change. Here, we compared 50 drought indices/indicators against 21 input parameters of comparison, revealing how these indicators/indices miss certain areas and how they can be used collectively to supplement their strengths and weaknesses. Out of 12 indicators, 6 are widely used, and 6 are promising as holistic indicators. A few drought hotspots have also been located to demonstrate how various circumstances can have distinct effects.
Figure 1.
Timeline of drought incidence and effects for the most widely recognized kinds of drought. Almost all droughts are accompanied by a lack of precipitation or meteorological drought, but other types of droughts result from this lack. Meteorological drought consists of normal precipitation below 25%. Hydrological drought is characterized by prolonged meteorological drought and drying of reservoirs, lakes, streams and rivers, cessation of spring flows and fall in groundwater levels. While the agricultural drought is characterized by depletion of soil moisture during the growing season. A dry situation with 20% probability and rainfall deficiency of more than 25% in drought-prone areas. Source: Author.
2. Drought Indices and Indicators
2.1. Classical Drought Indices and Indicators
Classical drought indices have been developed to assess and monitor drought conditions based on meteorological and hydrological data that is summarized using mathematical expressions. These indices have been in use for several decades. The most commonly used indices were first defined by Wayne Palmer in 1960s (Palmer, 1965), McKee and his team in the late 1990s (McKee et al., 1993), and Thornthwaite in the mid-20th century (Thornthwaite, 1948). Most of these indices have addressed one or more aspects of drought events and quantifiable ways to assess drought conditions and their impacts while providing valuable information for understanding drought severity. Classical drought indices vary in their complexity, data requirements, and temporal scales. The choice of index depends on the specific application and the data availability for a particular region. While they provide valuable insights into drought conditions, it is crucial to consider their limitations and supplement their findings with other information, especially for complex multifaceted drought assessments.
2.1.1 Palmer Drought Severity Index (PDSI)
The PDSI is one of the most influential, widely used, and recognized indices within scientific and meteorological communities (Lehner et al., 2017). In a hydrological accounting system, moisture demand (PE) and supply (P) are integrated over time (Mika et al., 2005), to assess and monitor long-term regional drought conditions (typically 6-24 months). Its strengths are due to its long historical use, incorporation of multiple climate factors, standardization, long-term perspective (especially over low and middle latitudes), historical data utilization, integration of climatology, impact on water resources and agriculture, and scientific credibility (Dai, 2013). By using surface air temperature and a physical water balance model, PDSI considers the basic effect of global warming through potential evapotranspiration. Nonetheless, it also has some limitations including sensitivity to parameter settings and the assumption of stationarity in climate data, which may be challenged in the face of changing climate patterns.
Recently, the PDSI was questioned for its inadequacy to predict droughts on temporal scales less than 12 months when monthly PDSI values were applied. It is, therefore, not to associate it with specific water resources such as runoff, snowpack, reservoir storage, and more using multi-timescale indices like the Standardized Precipitation Index (SPI) (Alley, 1984; Dai, 2011). A novel standardized Palmer drought index (SPDI) was established (Ma et al., 2014). Despite its limitations, the PDSI is known to be useful as a means of monitoring drought in terms of soil moisture and deciding the timing of agricultural drought contingency planning and measures (Zargar et al., 2011). A PDSI < – 4 represents an extreme drought, while a PDSI value >4 represents very wet conditions.
2.1.2. Standardized Precipitation Indices (SPIs)
SPIs such as the Standardized Precipitation Index (SPI) or Standardized Precipitation and Evapotranspiration Index (SPEI) are frequently used around the world to evaluate drought severity across a continent or a larger region covering different meteorological regimes (Laimighofer and Laaha, 2022; Vicente-Serrano et al., 2010). The SPI measures the deviation of observed P from the long-term average and quantifies it in terms of standard deviations. The SPI provides information about the probability of a certain level of precipitation deficit over different time scales. It is available at various time scales, from short-term (e.g., 1 to 6 months) to long-term (e.g., 24 months or more) (McKee et al., 1993). Several studies have demonstrated the SPI’s value in identifying droughts, and its basic and straightforward procedure has made it well-liked across a range of sectors. The SPI is calculated by first summing up monthly precipitation data over i-monthly accumulation periods, with i typically taking values of 1 to 12. However, in order to estimate the probability of no precipitation, the probabilities of the Weibull plotting position are calculated as follows:
with F being the gamma distribution with as the shape parameter and as the scale parameter. is the probability of zero precipitation by and is the number of zero precipitation events in the observation period. The drought categories vary from mild drought (0-0.99) to extreme drought ≤ –2 (Figure 2).
The SPI values are not exact as they depend on several choices made by the user. Drought indices are subject to five different uncertainties including sample size, choice of distribution, observation period, parameter estimation, and Goodness-of-fit (GOF).
2.1.3. Thornthwaite Moisture Index (TMI)
The TMI was developed by C.W. Thornthwaite (Thornthwaite, 1948), to categorize the climate conditions of different regions. This index estimates potential evapotranspiration and compares it to actual evapotranspiration, which can indicate moisture deficits. The TMI model is widely used because it is easy to use and only needs monthly average temperature and latitude (Karunarathne et al., 2016; Li and Sun, 2015). However, this model ignores the effects of air humidity, wind speed, and other factors, thus the value of ET is frequently underestimated (Zhao et al., 2019). It is a dimensional index spanning from +100 to –100 depicting weather conditions from humid to arid (Figure 3). TMI is calculated by combining two indices: aridity index and humidity index. Based on a water balance calculation, these indices are determined by run-off or surplus and water deficit. The calculation method of TMI is given by Equation 2:
where TMI is the Thornthwaite moisture index, P is precipitation (mm), and PET is potential evapotranspiration (mm). The TMI is multiplied by 100 to create whole numbers (Grundstein, 2009).
2.1.4. Aridity Index (AI)
The AI - characterizes the metric measure of the degree of dryness of the climate at a specific location. It is calculated by the ratio between precipitation (P) and potential evapotranspiration (PET) (Prăvălie and Bandoc, 2015; Qu et al., 2019; Standler., 2005). Aridity is commonly defined as the result of the interaction of evaporation, rainfall, and temperature (Thornthwaite, 1948). PET is an estimation of the atmosphere’s "drying power" to evaporate water from land surfaces (e.g., from the soil and plant canopy) and via plant transpiration. Obviously, the anomaly water deficits may also occur over shorter periods, e.g., seasonally or monthly, which are called droughts depending on their intensity and duration. Therefore, the AI provides the key material to assess the trends of aridity or humidity and characterize the drought. When AI becomes larger than normal in an area, the climate tends to suffer from drought and water resource shortages which negatively affects the food security and the livelihoods of the community (Hirwa et al., 2022; Li et al., 2017).
The ET0 indicates the maximum amount of water that can be evaporated from the soil and transpired from the vegetation of a specific surface, as a function of wind speed, solar radiation, vapor pressure, and temperature (Zhang et al., 2007). The atmospheric evaporative demand, expressed as ET0, is especially relevant in drought evaluations as an important factor in AI computation (Vicente-Serrano et al., 2015). The results of analyzing the aridity trends differ in the magnitude of the AI and their spatial patterns as consequences of the difference in the forcing precipitation datasets employed and the model used to estimate ET0 and meteorological datasets used to calculate ET0. However, the strong differences in the magnitude of ET0 changes may be obtained using different methods to estimate ET0 (Donohue et al., 2010; Vicente-Serrano et al., 2014). Further, to hasten the uncertainties in aridity estimates and in the analysis of the AI versus the hydro-ecological factors, the regions where the mainstream of models concur in sign should be considered. However, note that the ensemble of climate models is not weighted, even though several models are from the same modeling institutions (Greve et al., 2019).
The AI map (Figure 4) is based on data computed using the 30-year average of P/PET, where denotes the ith year.
2.1.5. Rainfall Anomaly Index (RAI)
The RAI was proposed by Van Rooy (1965). It incorporates and evaluates a ranking mechanism to assign dimensions to two anomalies for precipitation (i.e., positive and negative anomalies) (Raziei, 2021). First, the precipitation information is presented in descending order. The ten greatest numbers are averaged to generate a positive anomaly limit, while the ten lowest values are averaged to form a negative anomaly limit. Therefore, RAI is a simpler index that measures the deviation of monthly or seasonal rainfall from the long-term average. RAI is relatively easy to compute, with one input (i.e., precipitation) that can be examined on monthly, seasonal, and annual intervals. One of its flaws is that it requires a sequentially complete dataset with missing value estimates. Changes throughout the year must be minor in comparison to temporal variations. Moreover, the RAI classification is similar to that used by Gibbs (1967) to partition precipitation values between ten deciles and is equally applicable to various lengths of drought, including flash droughts, meteorological droughts, deep soil moisture droughts, and hydrological droughts defined with RAI computed at different time scales.
The study of Olukayode Oladipo (1985) revealed that the differences between RAI and the more complicated indices of Palmer and Bhakme-Mooley were negligible. It is useful for monitoring short-term drought conditions. The standardization follows the unity-based feature scaling (Khansalari et al., 2018) to asymmetrically distribute the original anomalies between the predefined limits (−3 and + 3). For positive anomalies (i.e., greater than 0), the prefix is positive (i.e., 3) and is the mean of the 10 highest precipitation values on track; for negative anomalies (i.e., ), the prefix is negative (i.e., −3) and the mean of 10 lowest measurements can be utilized (Keyantash and Dracup, 2002). In contrast, a plethora studies revealed that the RAI (Equation 4) can perform well in humid to moderate climates of the world where monthly precipitation distributed relatively regularly throughout the year, and the associated distribution is less skewed (Hänsel et al., 2016; Loukas et al., 2003).
However, determining from the ten largest (smallest) precipitation values appear arbitrary. The thresholds are computed using Equation 4, as described by Salehnia et al. (2017).
where is the sequence of measured precipitation at the time , is the long-term average precipitation (mm), is average of ten highest (extrema) values of for the positive anomaly and the mean of the 10 lowest values of for the negative anomaly. The prefix is used to limit the deviations’ lower and upper boundaries. The RAI ranging from extremely dry (RAI ≤ −3) to extremely wet (RAI ≥ 3).
2.1.6. Crop Moisture Index (CMI)
CMI is designed expressly for assessing the impact of drought on crop conditions. It takes into account both precipitation and temperature data to evaluate soil moisture levels (Isard et al., 1995). The CMI, which varies quickly from week to week, might provide the short-term or current condition of primarily agricultural drought or moisture surplus. The CMI was developed based on PDSI (Juhasz and Kornfield, 1978). It is calculated by subtracting the difference between potential evaporation and moisture, to determine any deficit. Input parameters (i.e., weekly mean temperature, weekly mean precipitation, and the previous week’s CMI value. The CMI values vary from excessively wet (+3 and above) to severely dry (-3 or less) (Zarafshani et al., 2016). Nonetheless, the CMI is limited to use only in the growing season; it cannot determine the long-term period of drought.
2.2. Holistic Indices and Indicators
Holistic drought indices are more comprehensive tools that attempt to provide a more complete picture of drought conditions by considering multiple factors and impacts beyond just meteorological and hydrological data. These indices take into account the broader socioeconomic and environmental consequences of drought. Due to their complexity, they may require a variety of data inputs. Besides, comprehensive indicators offer a more integrated view of the overall drought situation. The holistic drought indicators are particularly valuable for decision-makers, actors, and stakeholders who need a more complete understanding of the impacts of drought on society, the environment, and the economy. They can help guide policy decisions, resource allocation, and drought management strategies by providing a more comprehensive view of the complex nature of drought events. However, they often require extensive data and resources for their implementation and may be more challenging to use in regions with limited data availability or monitoring infrastructure.
2.2.1. U.S. Drought Monitor (USDM)
The USDM was conceived in 1999, and is produced through a joint effort of the National Drought Mitigation Center, U.S. Department of Agriculture (USDA), National Oceanic and Atmospheric Administration (NOAA), and local experts. It combines data from various sources across the hydrological cycle (i.e., meteorological, hydrological, and agricultural information), to provide a holistic view of drought conditions in the United States (Svoboda et al., 2002). The USDM also considers water supply, ecosystems, and society (Leeper et al., 2022). The USDM categories are classified based on drought indicator percentiles from “no drought or abnormal dryness” to “exceptional drought” corresponding to 31-100 and 0-2, respectively. For instance, abnormally dry corresponds to 20-30% chance for a drought to occur in ranges from 20 to 30 while for exceptional drought it is less than 2% (Pendergrass et al., 2020). Most of the maps drawn using USDM refer to NOAA/NCEI (2023).
Additionally, USDM’s uniqueness includes: (i) being the first nationwide unifying drought monitoring of multiple entities; (ii) receiving local bystanders’ observation, for instance, more than 425 local observers such as state climatologists, and National Weather Staff, (iii) simple and effective, the classification system for droughts is easy to understand for public; (iv) timely, it is a weekly product which illustrates drought conditions and impacts promptly (Hatami Bahman Beiglou et al., 2021). The precipitation-deficit-driven (PDD) and heat-wave-driven (HWD definitions have no positive correlation with the USDM definition (Osman et al., 2021). While the USDM offers real-time maps of drought spatial extent, unlike several other drought indices, it lacks a straightforward method for analyzing drought over time. Since 2000, as the USDM has only been in circulation, its value is constrained when a lengthy historical backdrop is required.
2.2.2. Drought Severity and Coverage Index (DSCI)
An index known as the DSCI was created to improve the quantitative capabilities of the USDM in order to better assess spatial coverage and intensity combined and enable better comparisons between drought occurrences for places or between locations. In order to transform categorical USDM drought levels into single continuous aggregated number for a particular area, the DSCI was created as an experimental technique. The five USDM drought classes are added simultaneously to generate the DSCI (Akyuz, 2017; Smith et al., 2020). Month-to-month changes in the DSCI are used to inform the rate at which drought can improve or worsen in different months of the year. To calculate, there are two ways: 1) use cumulative drought monitor data, and 2) add the percentages for D0 through D4 for a given week. To compute the DSCI using a weighted average, a weight between 1 and 5 is assigned to each USDM category (D0–D4), and this weight is subsequently multiplied by the categorical percent area for the drought category, and these totals are summed together (Equation 5). Possible cumulative values of the DSCI are from 0 (i.e., none of the areas is abnormally dry or in drought) to 500 (i.e., area in exceptional drought). This results in a DSCI value that has a continuous scale of 0–500.
where the continuous DSCI (USDM) values are 0–99 (None), 100–199 (D0), 200–299 (D1): Moderate Drought, 300–399 (D2): Severe Drought, 400–499 (D3), and 500 (D4).
Two advantages can result from converting the percent of an area in each USDM drought category into the DSCI: (1) it provides a single numerical value describing current drought extent and intensity and (2) it allows for drought to be quantified over time. DSCI is a new tool that increases the capacity of the USDM for further drought monitoring and analysis (Johnson et al., 2020).
2.2.3. Agricultural Drought Risk Index (ADRI)
ADRI is designed to assess the risk and vulnerability of agriculture to drought by combining meteorological information on soil moisture, crop types, and irrigation. It uses indicators such as Hazard, Exposure, Sensitivity, and Adaptive capacity (Equation 6). Vulnerability indicates the function of exposure, sensitivity, and adaptive capacity (Equation 7). In this case, high drought vulnerability when the exposure to drought risks is high, the sensitivity of the environment is high and adaptive capacity is low. All the three parameters are highly interconnected (Carrão et al., 2016). The ADRI was developed using a conceptual framework that was applied to Kazakhstan and South Korea (Kim et al., 2021).
where is the disaster risk, is the hazard, is exposure, is vulnerability, is sensitivity, and is adaptive capacity. After all, the indicators are then normalized in terms of a common baseline using the min-max normalization method. The indicators then can be combined in each risk category by assessing equal weights (Moss et al., 2000). The final index can be computed with the equally weighted hazard, exposure, and vulnerability components. This enables the evaluation of each category independently, increasing understanding of the strengths and weaknesses of each component of the risk index in each region (Iglesias et al., 2009).
Figure 5.
Distribution of global drylands Global ADRI map. Source: Meza et al. (2020).
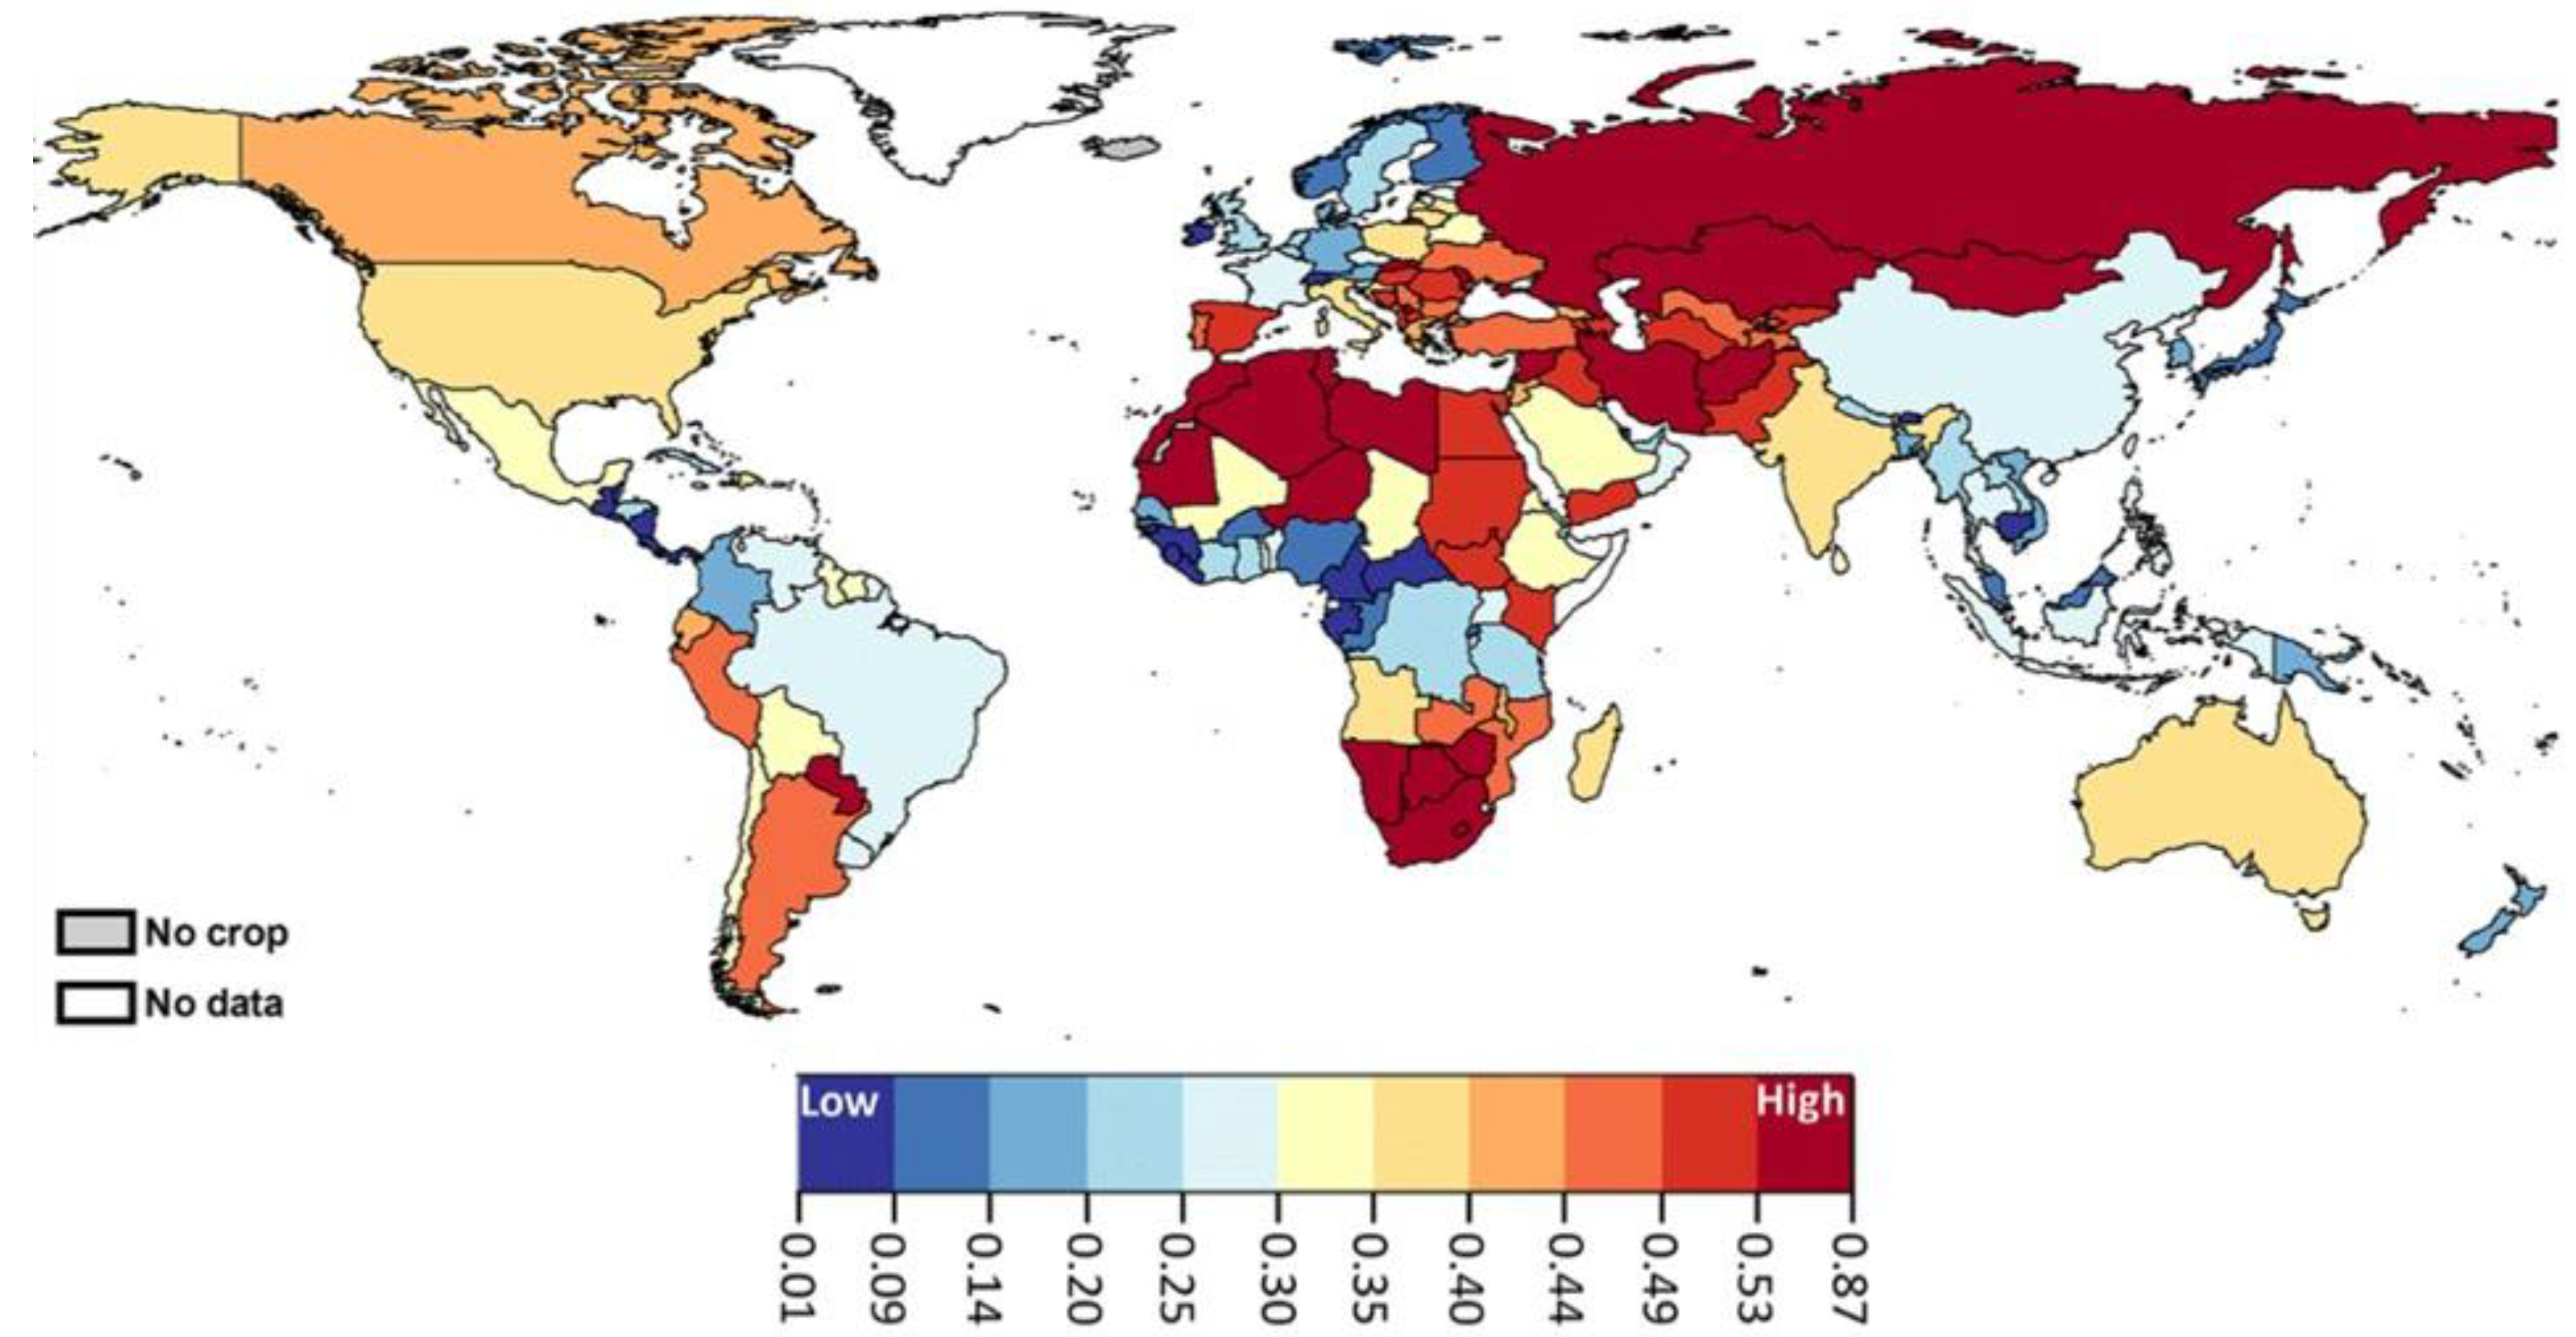
Practically, there are limitations related to the frequency of updates and the unavailability of data at the required resolution (data quality). Even if the datasets are available, the accuracy thereof does not always meet the requirements (Aubrecht et al., 2013). The quality of available input data in terms of spatial resolution and reliability is an important factor in disaster risk assessments. While most environmental indicators rely on quantitative measures and spatial statistics, socio-economic indicators introduce a certain amount of uncertainty and subjectivity (Ozceylan and Coskun, 2012). The ADRI can contribute to addressing risk, and prioritizing risk areas at reasonable scale leading to effective decisions and policymaking for risk reduction related to drought events.
2.2.4. Hydrological Drought Index (HDI)
HDI evaluates drought conditions from a hydrological perspective, incorporating streamflow, soil moisture, and groundwater data to assess the impact on water resources and ecosystems (Tokarczyk, 2013). This index is often used in broader assessments of drought conditions, especially in areas where water resources are critical for purposes, such as agriculture, industry, and ecosystem health (Tareke and Awoke, 2022). The HDI relies on accurate and up-to-date hydrological data, which can be a limitation in areas with sparse monitoring networks or data gaps. Its calculations can be complex, involving various hydrological components and statistical methods, which may require expertise to use effectively. Like many drought indices, HDI may not provide significant lead time for drought prediction, making it challenging for proactive drought management.
Therefore, calculations for this index involve a combination of different hydrological parameters, and the methodology can be more complex. It often involves the use of drought indices like SPI or PDSI. For instance, the HDI is grounded on discharge data (HDI1), and simulation (HDI2) (Hadiani et al., 2022). The drought index is a comparison of the deficit to the watershed area as indicated in the following Equation 8.
HDI is the hydrological drought index, the deficit is the difference between X0 and Xt (ith daily), X0 I the dry threshold, and Xt is the ith daily periods of discharge. Drought severity involves the analysis of the duration and deficit in dry conditions.
2.2.5. Socioeconomic Drought Index (SEDI)
The SEDI is defined as a measure of the drought conditions-related impacts on the supply and demand of economic goods. SEDI combines meteorological and economic data to gauge the economic impacts of drought. It considers factors like agricultural losses, employment, and food prices. Four categories are distinguished: water deficit, water security and support, economic damage and impact, and environmental and sanitation effects (Lee et al., 2022). SEDI also has four values, that is, 1, 2, 3, and 4, corresponding to the four levels of socioeconomic drought, that is, SEDI = 1 for low level, SEDI = 2 for moderate level, SEDI = 3 for severe level, and SEDI = 4 for extreme level (Liu et al., 2020). As for the SEDI, it ignores the influence of reservoir water storage on future socioeconomic drought (Guo et al., 2019). It can provide early warnings about the potential economic and social consequences of drought, enabling proactive measures to mitigate the impact.
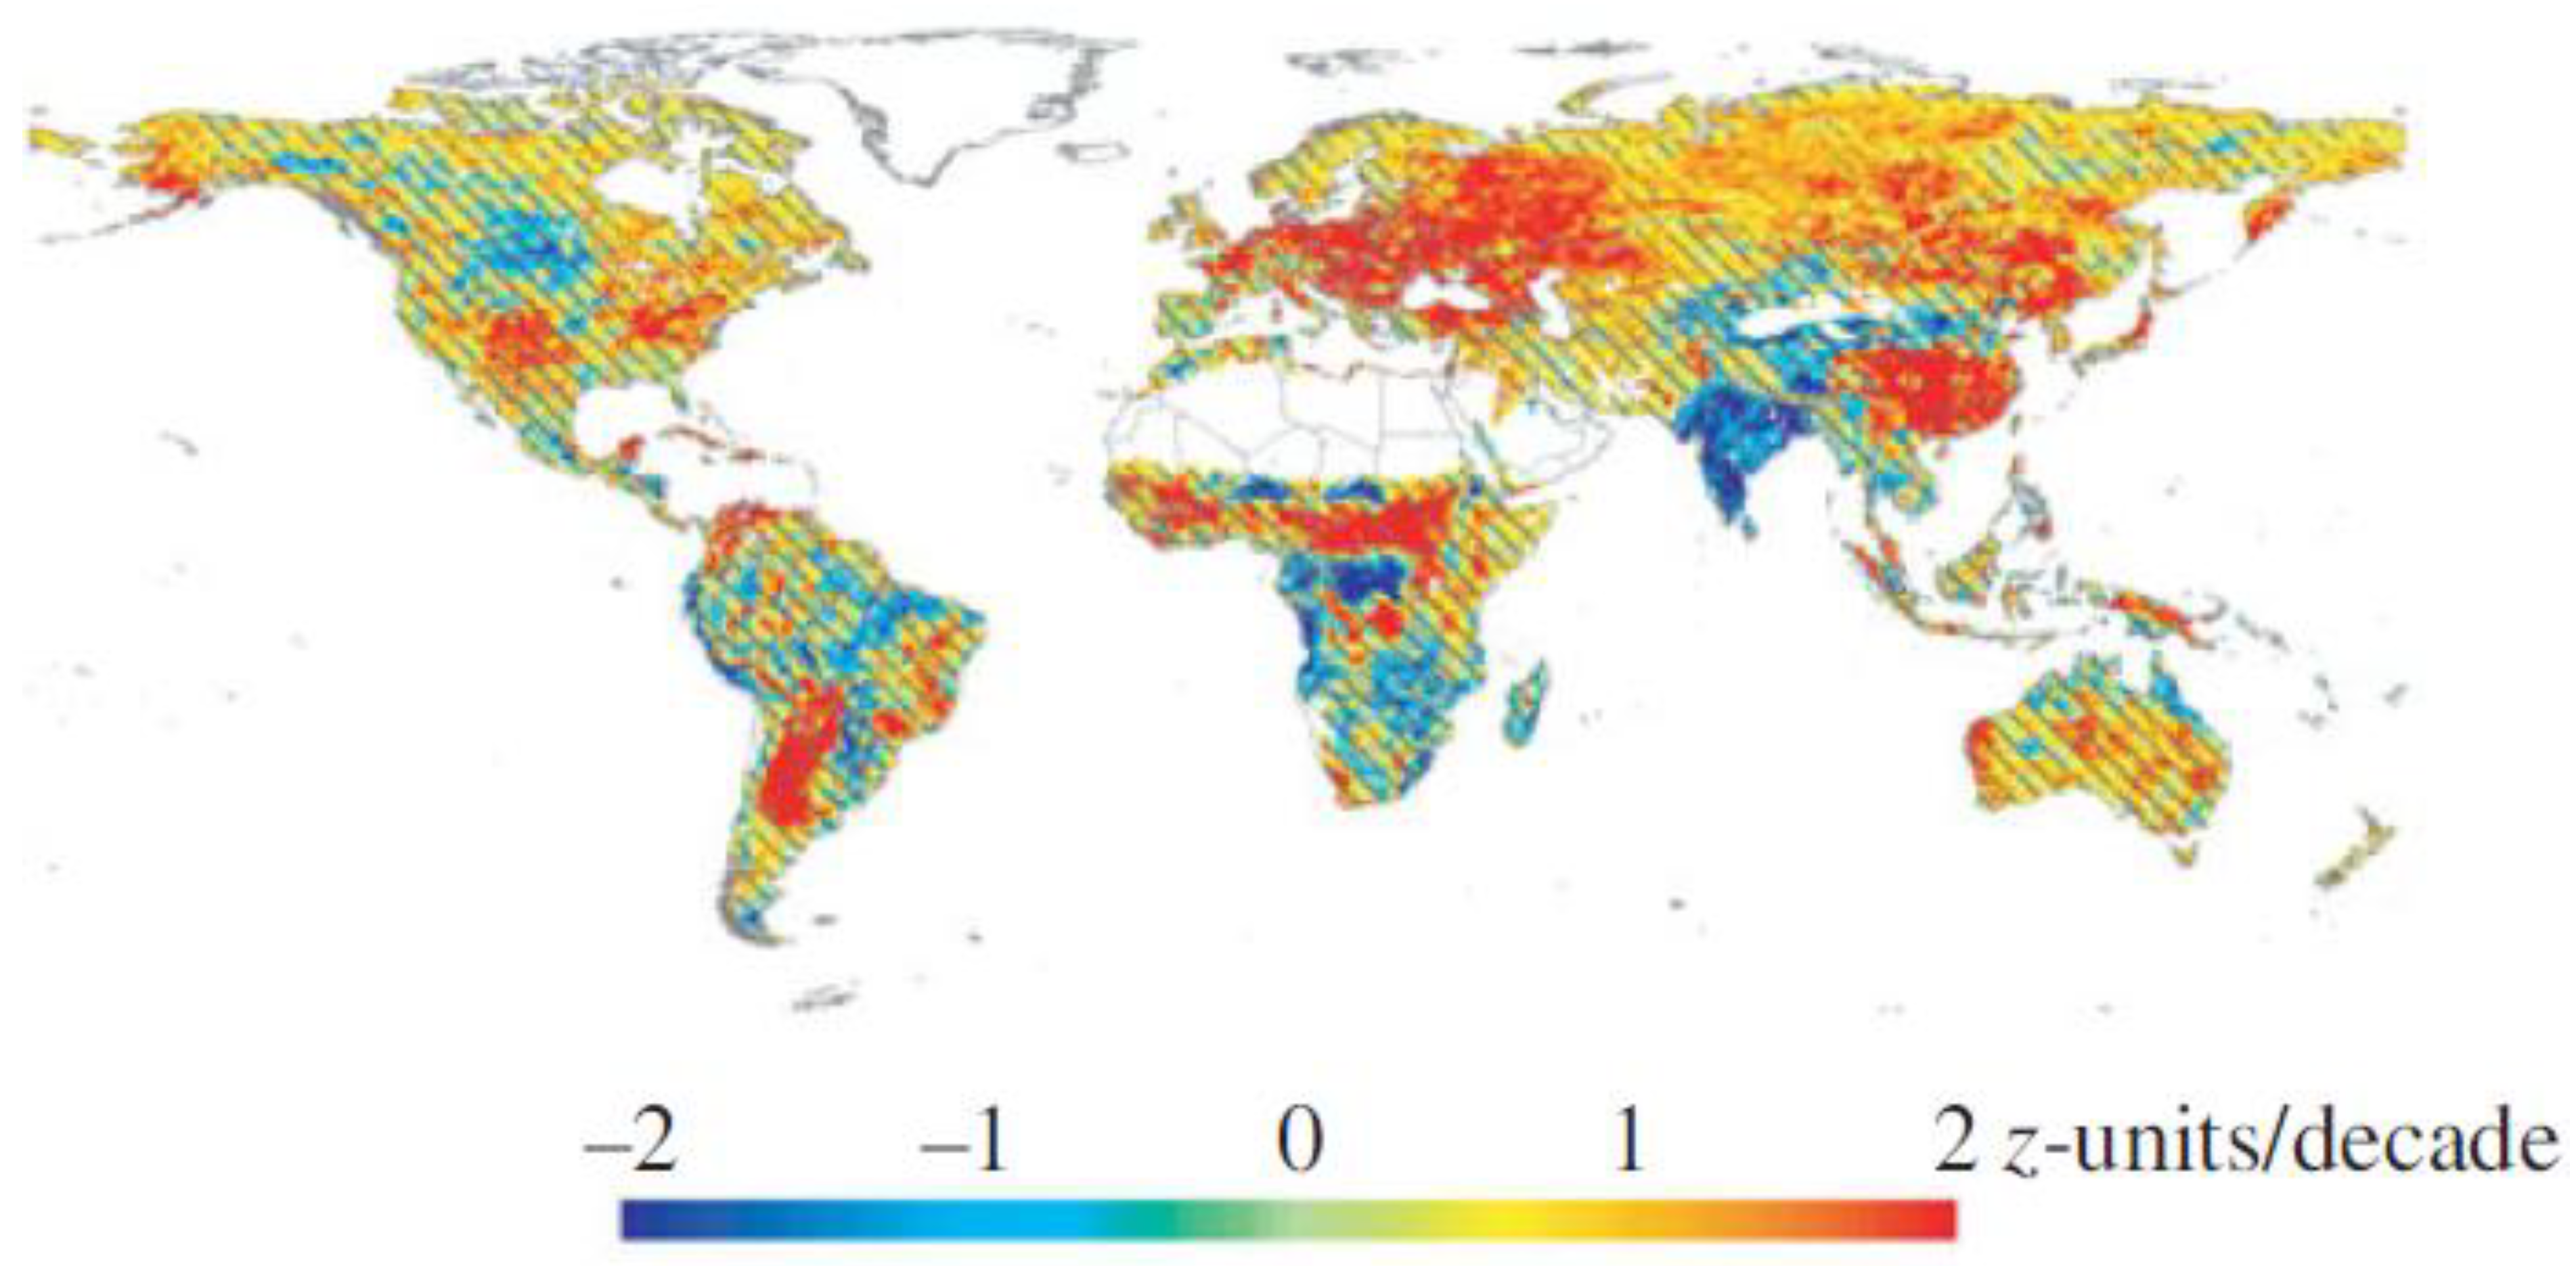
Figure 6.
Trends in drought event magnitude between 1980 and 2020, based on SEDI. Source: Vicente-Serrano et al. (2022).
Figure 6.
Trends in drought event magnitude between 1980 and 2020, based on SEDI. Source: Vicente-Serrano et al. (2022).
2.2.6. Composite Drought Index (CDI)
The CDI is a comprehensive drought monitoring tool that combines multiple drought indicators or indices to provide a more holistic view of drought conditions (Beccari, 2016). The CDI is designed to capture various aspects of drought, such as agricultural, hydrological, meteorological, and socioeconomic components on a seasonal time scale, and thus blend them into a single, integrated index in a more robust picture. When developing the CDI, water balance conditions are considered along with actual evapotranspiration and meteorological data (Sepulcre-Canto et al., 2012). It generally uses remote sensing and modeled data inputs to reflect anomalies in precipitation, vegetation greenness, soil moisture, and evapotranspiration (Faiz et al., 2022). Using CDI, agricultural drought-prone areas are detected by the CDI, as well as areas where drought-affected vegetation already exists; and regions that are returning to normal following a drought spell. The CDI is conceptualized by a cause-effect theory - taking drought as cascading process, where a precipitation shortage (i.e., watch stage) turns into a soil water deficit (i.e., warning stage), then causes stress on vegetation growth and production (i.e., alert stage) (Cammalleri et al., 2021).
A new CDI was established using the integration of potential and actual evapotranspiration, climatic water balance, and precipitation. The CDI provides a concise overview of agricultural drought evolution that can be used to communicate with both specialized actors and policymakers (Vogt et al., 2018). This index is presented as below (Equation 9), but may have multiple forms depending on the types of input parameters considered:
where are coefficients for mod rainfall anomaly index (), water balance anomaly index (WBAI), actual evapotranspiration (AET), and moisture index (. The CDI classification index varies from no drought (CDI < −0.60) to extreme drought (extreme drought).
The selection of indices and the weighting assigned to each component in the CDI calculation can be subjective, potentially leading to different results based on the choices made. Likewise, when it comes to identifying mild to extreme drought conditions, the CDI outperforms the PDSI in terms of false alarm ratio. In practice, CDI calculation requires a significant amount of computing power, especially when analyzing large volumes of data and long-time series from multiple sources (Ali et al., 2022). Also, it may have limitations in predicting future drought events.
3. Drought Indices and Indicators Comparisons
3.1. Comparison Criteria
50+ indices/indicators were reviewed during this study based. The criteria for evaluating drought indices and indicators can vary depending on the specific application and context such as accuracy, relevance, sensitivity, consistency, lead time, spatiotemporal resolution, data requirements, data quality, user-friendliness, transparency, validation, flexibility, intersectoral applicability, and stakeholder engagement. Despite the fact that no leading index or indicator is always better than the others, some indices are more appropriate than others for specific uses.

Table 1.
Comparison of different drought indicators.
| Index/indicator | P | T | PE | AWC | CD | SF | GW | SM | Multiple | Spatial scale | Temporal scale | Data requirement |
|---|---|---|---|---|---|---|---|---|---|---|---|---|
| Classical | ||||||||||||
| PDSI | ✓ | ✓ | ✓ | Global | Monthly | High | ||||||
| SPI/SPEI | ✓ | ✓ | Global | Daily, weekly, monthly | High | |||||||
| TMI | ✓ | Global | Monthly | Low | ||||||||
| AI | ✓ | ✓ | Global | Monthly | Low | |||||||
| RAI | ✓ | Regional | Monthly | Medium | ||||||||
| CMI | ✓ | ✓ | Regional | Weekly | Medium | |||||||
| Holistic | ||||||||||||
| USDM | ✓ | Country | Weekly | Medium | ||||||||
| DSCI | ✓ | Global | Monthly, annually | High | ||||||||
| ADRI | ✓ | Regional | Monthly, annually | High | ||||||||
| HDI | ✓ | Regional | Annually | High | ||||||||
| SEDI | ✓ | Global | Annually | High | ||||||||
| CDI | ✓ | Global | Annually | High |
Source: Author.
3.2. Drought Event Hotspots
Drought indices and indicators are used worldwide to monitor, assess, and manage drought conditions. Hotspots, in this context, refer to regions or countries where drought indices and indicators are commonly used due to the prevalence or severity of drought conditions. These hotspots may vary based on the type of drought and regional characteristics. The maps used in this study were used to identify 12 drought event hotspots, i.e., United States, Australia, China, India, Africa, Brazil, Europe, Mediterranean regions, Southern Africa (South Africa, Zimbabwe, Namibia, and Mozambique), Latin America, and the Middle East. For this purpose, the thresholds of PDSI, SPI, TMI, AI, RAI, CMI, USDM, DSCI, ADRI, HDI, SEDI, and CDI were reduced to three categories (low, medium, and high severity).
4. Drought Indices and Indicators Discussion
Drought can have significant implications for achieving the Sustainable Development Goals (SDGs) of 2030 Agenda (Tabari and Willems, 2023). Mainly, it strikes at the heart of SDG1 (No Poverty) by leading to crop failures and reduced productivity causing income loss and pushing people deeper into poverty; SDG2 (Zero Hunger) by posing a major threat to food security (i.e., crop failures, reduced livestock productivity, and water scarcity resulting in food shortages and malnutrition; SDG6 (Clean Water and Sanitation) by reducing water availability for personal, agricultural, and industrial use; SDG15 (Life on Land) by exacerbating land degradation, deforestation, desertification, impacting ecosystems and biodiversity (Lindoso et al., 2018; Zhang et al., 2019). As drought affects various aspects of society and the environment, addressing the interconnected challenges of drought and SDGs requires a comprehensive and multisectoral approach.
Ever since the soil and water management challenges surfaced during the Mid to late 20th century, scholars have attempted the development of drought indices/indicators for disaggregating the complex and simple indications of drought conditions. Classical and holistic indicators provided the foundations for drought measurement. Researchers developed indicators sensitive to agricultural, socioeconomic, and environmental aspects of droughts, since these indicators cover only limited aspects of drought episode. For example, the SEDI, HDI, CMI, ADRI, and PSIs are founded on broader sets of drought aspects. Further research studies pointed out more missing areas including the new authenticities like climate change and adaptation strategies.
4.1. Limitations of the Indices and Indicators
Understanding the limitations of drought indices and indicators is crucial for using the holistic and classical indices effectively and making informed decisions.
- Sensitivity to data inputs: The accuracy of indices is highly dependent on the quality and availability of data inputs (i.e., meteorological data, socioecological data, agricultural data, etc.). The quality and quantity of input data are important for accurate drought assessment. For example, precipitation data is used to derive the SPI-based drought index. By comparing the spatiotemporal differences and drought area capture capabilities over 23 sub-datasets spanning 30 years, the study of Liu et al. (2016) concluded that SPDI is less sensitive to data selection than sc-PDSI. Moreover, the SPDI series derived from different datasets are highly correlated and consistent in drought area characterization. SPDI is most sensitive to changes in the scale parameter, followed by location and shape parameters. It was looked into how sensitive each of the seven precipitation-based drought indices was to varying record lengths at monthly, seasonal, and annual time scales. The findings showed that better time steadiness was observed in Z-score Index (ZSI) and Effective Drought Index (EDI) compared to other indices such as the Deciles Index (DI), Standardized Precipitation Index (SPI), Percent of Normal Precipitation Index (PNPI), China Z Index (CZI), and the Modified China Z Index (MCZI) (Mahmoudi et al., 2019). Due to sensitivity to a relatively wider range of factors, holistic indices/indicators have the advantage over classical indices/indicators.
- Lack of consistency: Different drought indices may yield different results for the same area or time period. There is no universal drought indicator and previous studies identified significant discrepancies between the state drought indices (Feng et al., 2017). The most exact and accurate techniques to track agricultural conditions are drought indices estimated from ground observations of soil moisture, precipitation, and temperature. The accuracy of drought indices also depends on accurate estimates of soil parameters based on in-situ measurements; calculation methods and missing data (Pan et al., 2023). Coupled climatic and socioeconomic aspects are interlinked to drought conditions in one region and distinct in another location. Many of these features are meticulously interrelated with each other and any decision-making ability regarding their inclusion has certain consequences in terms of accuracy and effective outcomes. The problem of inconsistency is prominent in the case of both holistic and classical indicators that consider multiple parameters.
- Artificial Intelligence-based drought assessment: Droughts can be modeled, observed, and predicted using high-resolution spatiotemporal resolution data. Drought-causing factors and mechanisms operate on a wide range of spatial scales, from the movement of soil water to global atmospheric circulation. There is huge lack of multiscale drought monitoring and early warning systems (Mardian, 2022). Further, the Centre for Environmental Data Analysis (CEDA) developed new high-resolution datasets providing more detailed local information that can be used to evaluate drought severity for specific periods and regions and determine global, regional, and local trends, thereby supporting the development of site-specific adaptation measures (Gebrechorkos et al., 2023). There is an emerging need to develop novel datasets that can serve fundamental data support for future studies. The integration of machine learning (ML) models – usually superior to traditional techniques – has a promising answer since they are good at addressing non-stationarities and non-linearities in drought assessment. For instance, DroughtCast ML was utilized to forecast a very extreme drought event up to 12 weeks before its onsets. It offers promising findings for decision-makers, land managers, and public institutions in preparing for and mitigating the impacts of drought.
- Complex interpretation: Some drought indices are based on complex mathematical algorithms, making them difficult for non-experts (i.e., smallholder farmers) to interpret and need more attention. This can limit their utility for decision-making. The work of reported that Fluixá-Sanmartín et al. (2018) due to the general complexity of droughts, the comparison of the index-identified events with droughts at different levels of the complete system, including soil humidity or river discharges, relies typically on model simulations of the latter, entailing potentially significant uncertainties and decidedly biased outcomes. The short-term anomalies are overlooked – regarding the interactions of soil moisture and evapotranspiration – hiding the influence of long-term anomalies of rainfall, soil moisture, and evapotranspiration that cause recurrent droughts and heatwaves (Gaona et al., 2022). To solve these challenges, there is a need for collaborative efforts (e.g., expert consultation, access documentation, multi-indices understanding, access to historical data and stakeholder engagement, etc.) and requiring interdisciplinary expertise from various fields (e.g., agriculturalists, climatologists, socio-economists, and ecologists, etc.).
- Data Infrastructure and Maintenance: Remote sensing infrastructural development and their maintenance outlays can be costly, thus hindering accessibility to accurate and precise data in developing countries.
4.2. Necessity for Multidisciplinary Indices and Indicators
Drought impacts are not limited to a single sector or dimension. Sectors affected by drought are interconnected. For example, drought conditions can lead to reduced agricultural productivity, which in turn can impact food security. By incorporating various indicators, these systems can provide timely alerts for different sectors, which is essential for effective planning, response, and resilience-building in the face of a changing climate. Literature reveals that all indicators have certain limitations, either conceptual, operational, or both (Hayes et al., 2007; Hayes et al., 1999; Heim Jr, 2002; Keetch and Byram, 1968; Palmer, 1965; Vicente-Serrano et al., 2010). None of the indices cover simultaneously all the necessary areas, duration, intensity, frequency, impacts, etc. However, the major shortcoming occurs when some vital parameters are not included in the account (Yang et al., 2015). For example, while many parameters are essential for a robust assessment, some may be considered “leftover” when designing or using a particular index, including solar radiation, relative humidity, wind speed, cloud cover, barometric pressure, snowpack data, turbidity (Dikici, 2020). In any region experiencing drought events, any evaluation or monitoring practice without considering coupled climatic features will yield defective outcomes and wrong decisions. This is not limited to weather parameters only. Each region has a unique scenario of drought experience, spatial and temporal distribution, socioeconomic development, water scarcity concerns, and adaptive capacity. Some countries (e.g., the United States of America, Australia, and European Union countries) have developed their specific indicators/indices for monitoring drought (Heim et al., 2020). However, many indices, particularly classical, are unable to reflect the cause-effect relationship of drought. Thus, in planning, it would be wise not to use a single indicator because it will not lead to consistent results or delusion of security. Artificial Intelligence methods (e.g., machine learning, deep learning and among other) have a high potential for prediction of extremes due to the ability of machine learning methods to learn from past data, to handle large numbers of input variables, to integrate physical understanding into the models and to discover additional knowledge from the data.
4.3. Data, Methodological and Technological Challenges
One of the major issues influencing the adoption of indices, causing shortcomings and restricting research and development, is data challenge, leading to complications in the development and use of indices. Many holistic indices have not been extensively employed because the requisite data is not readily available. Assessment of drought conditions requires a reasonably long time series at the desired time phase. Different indices/indicators consider different parameters. Hence, the data required for holistic indices is huge and diverse. Many regions, especially in developing countries, lack sufficient data collection and monitoring infrastructure (e.g., Long-term Ecological Research) (Vanderbilt and Gaiser, 2017), leading to data gaps and inaccuracies. Data collected at a regional or national scale may not provide the necessary detail for local-level drought assessments.
Moreover, remote sensing technologies, while valuable for monitoring drought conditions, have limitations, including cloud cover, instrument errors, and sensor calibration issues, lack of integration tools and standardized data formats for main parameters such as satellite-based precipitation, soil moisture, groundwater levels, and among others (Hao et al., 2014). While climate models offer projections of future climate conditions, uncertainties in these projections can limit their utility for long-term drought planning and adaptation. Conspicuously, integrating socio-economic data, such as agricultural statistics, demographic data, greenhouse gas emission, and land use/land cover information is crucial for a holistic understanding of drought impacts, but to such data may be restricted or limited in many regions. In some regions, access to advanced technology and computing resources can be limited, leading to the inability to develop and implement sophisticated drought monitoring and assessment tools. Data privacy, security, and sovereignty concerns can hinder data sharing and collaborative drought assessment across transboundary regions. There is an urgent need to invest in data infrastructure, develop standardized data-sharing protocols, and enhance technological capabilities. Lastly, international cooperation is crucial for sharing data, methodological, and technological advancement.
5. Conclusions
Drought is a creeping natural phenomenon with highly destructive power, which unfolds their impacts on different temporal and spatial scales. After reviewing 50+ drought indices/indicators, this study presented descriptions of 12 indices/indicators in terms of drought characterization, spatiotemporal scale suitability, calculation methods, data requirements, level of complexity, strengths, and weaknesses. Therefore, based on previous literature on drought assessment and monitoring using different indices/indicators, we compiled a global comparison. Based on this review, the following conclusions can be drawn:
- i)
- There is no single drought indicator, whether classical or holistic, for all drought types in all specific regions and climates, because all available drought indicators have their limitation during development and application. Therefore, drought indicator selection requires a thorough investigation related to the type of drought and the respective drought indicator based on the availability of data, ease of communication, result implication, strength and limitations of the indices, and the objective of the investigation. Drought indices/indicators assimilate thousands of bits of data on meteorological, agricultural, socioeconomic, and ecological data into a comprehensive big picture. Due to a lack of large-scale application, experts must make their own judgments regarding holistic indicators’ pros and cons.
- ii)
- Holistic indices require huge amounts of data. The lack of sufficient infrastructure for collecting and monitoring data in many regions, particularly in developing countries, produces gaps and inaccuracies in data. A regional or national drought assessment may not be able to provide the necessary detail based on data collected at the local level. There is a need for affordable geospatial infrastructures and technologies. The development of new composite methods should be used as building blocks and integrating remote sensing to support multinational and disciplinary approaches with local participation to attain sustainable drought monitoring.
- iii)
- Various indices/indicators produce contradictory findings regarding drought hotspots. For instance, the PDSI also tends to underestimate runoff conditions whereas CMI is limited to use only in the growing season; it cannot determine the long-term period of drought. The meteorological drought indices may not solely be appropriate and adequate to assess agricultural drought due to the lag between agricultural and meteorological drought. The main reason for these controversial results can be the choice of drought indices/indicators and the accuracy of satellite products used to derive drought indices/indicators. Ultimately, the evaluation criteria should align with the objectives of the drought monitoring and management efforts, and the chosen index should meet the specific needs of the stakeholders and decision-makers.
- iv)
- Future research studies should focus on novel geospatial intelligence (Geo-AI) based drought indices that could facilitate in assessing, categorizing, and disclosing deep drought conditions; utilization of earth observations that include satellite, climate, oceanic, and biophysical data for efficient drought analysis and improved seasonal prediction; combine or integrate drought indices based on improved modelling techniques; apply the data mining and GIS applications to build Drought Early Warning Systems (DEWSs); and explore the impact of drought on sustainable food systems.
In summary, both holistic and classical drought indices/indicators play roles in monitoring and assessing drought conditions. In practice, both types of indices/indicators are often used in combination to provide a more comprehensive and well-rounded understanding of drought events. Combining these tools with advancements in technology, early warning systems, and international cooperation is crucial for addressing the complex challenges posed by drought.
Conflicts of Interest
The authors declare that they have no known competing financial interests or personal relationships that could have appeared to influence the work reported in this paper.
Acknowledgments
The author gratefully acknowledges the support of the Department of Agronomy, Food, Natural Resources, Animals, and Environmenta at the University of Padova for its contribution to this research.
Data availability statement
Not applicable.
References
- Akyuz, F. Drought severity and coverage index. united states drought monitor. https://droughtmonitor.unl.edu/About/AbouttheData/DSCI.aspx 2017.
- Ali, M.; Ghaith, M.; Wagdy, A.; Helmi, A.M. Development of a New Multivariate Composite Drought Index for the Blue Nile River Basin. Water 2022, 14, 886. [Google Scholar] [CrossRef]
- Alley, W.M. The Palmer Drought Severity Index: Limitations and Assumptions. Journal of Applied Meteorology and Climatology 1984, 23, 1100–1109. [Google Scholar] [CrossRef]
- Aubrecht, C.; Özceylan, D.; Steinnocher, K.; Freire, S. Multi-level geospatial modeling of human exposure patterns and vulnerability indicators. Natural Hazards 2013, 68, 147–163. [Google Scholar] [CrossRef]
- Beccari, B. A comparative analysis of disaster risk, vulnerability and resilience composite indicators. PLoS Currents 2016, 8. [Google Scholar] [CrossRef]
- Brunner, M.I.; Götte, J.; Schlemper, C.; Van Loon, A.F. Hydrological Drought Generation Processes and Severity Are Changing in the Alps. Geophysical Research Letters 2023, 50, e2022GL101776. [Google Scholar] [CrossRef]
- Cammalleri, C.; Arias-Muñoz, C.; Barbosa, P.; de Jager, A.; Magni, D.; Masante, D.; Mazzeschi, M.; McCormick, N.; Naumann, G.; Spinoni, J.; et al. A revision of the Combined Drought Indicator (CDI) used in the European Drought Observatory (EDO). Nat. Hazards Earth Syst. Sci. 2021, 21, 481–495. [Google Scholar] [CrossRef]
- Carrão, H.; Naumann, G.; Barbosa, P. Mapping global patterns of drought risk: An empirical framework based on sub-national estimates of hazard, exposure and vulnerability. Global Environmental Change 2016, 39, 108–124. [Google Scholar] [CrossRef]
- Crausbay, S.D.; Betancourt, J.; Bradford, J.; Cartwright, J.; Dennison, W.C.; Dunham, J.; Enquist, C.A.; Frazier, A.G.; Hall, K.R.; Littell, J.S. Unfamiliar territory: Emerging themes for ecological drought research and management. One Earth 2020, 3, 337–353. [Google Scholar] [CrossRef]
- Crausbay, S.D.; Ramirez, A.R.; Carter, S.L.; Cross, M.S.; Hall, K.R.; Bathke, D.J.; Betancourt, J.L.; Colt, S.; Cravens, A.E.; Dalton, M.S.; et al. Defining Ecological Drought for the Twenty-First Century. Bulletin of the American Meteorological Society 2017, 98, 2543–2550. [Google Scholar] [CrossRef]
- Crossman, N.D. Drought resilience, adaptation and management policy (DRAMP) framework. Bonn: UNCCD 2018, 20. [Google Scholar]
- Dai, A. Drought under global warming: a review. WIREs Climate Change 2011, 2, 45–65. [Google Scholar] [CrossRef]
- Dai, A. Increasing drought under global warming in observations and models. Nature Climate Change 2013, 3, 52–58. [Google Scholar] [CrossRef]
- Dehghani, S.; Massah Bavani, A.R.; Roozbahani, A.; Gohari, A.; Berndtsson, R. Towards an integrated system modeling of water scarcity with projected changes in climate and socioeconomic conditions. Sustainable Production and Consumption 2022, 33, 543–556. [Google Scholar] [CrossRef]
- Dikici, M. Drought analysis with different indices for the Asi Basin (Turkey). Sci Rep 2020, 10, 20739. [Google Scholar] [CrossRef] [PubMed]
- Donohue, R.J.; McVicar, T.R.; Roderick, M.L. Assessing the ability of potential evaporation formulations to capture the dynamics in evaporative demand within a changing climate. Journal of Hydrology 2010, 386, 186–197. [Google Scholar] [CrossRef]
- Erian, W.; Pulwarty, R.; Vogt, J.; AbuZeid, K.; Bert, F.; Bruntrup, M.; El-Askary, H.; de Estrada, M.; Gaupp, F.; Grundy, M. GAR special report on drought 2021; United Nations Office for Disaster Risk Reduction (UNDRR): 2021.
- Faiz, M.A.; Zhang, Y.; Ma, N.; Baig, F.; Naz, F.; Niaz, Y. Drought indices: aggregation is necessary or is it only the researcher’s choice? Water Supply 2021, 21, 3987–4002. [Google Scholar] [CrossRef]
- Faiz, M.A.; Zhang, Y.; Zhang, X.; Ma, N.; Aryal, S.K.; Ha, T.T.V.; Baig, F.; Naz, F. A composite drought index developed for detecting large-scale drought characteristics. Journal of Hydrology 2022, 605, 127308. [Google Scholar] [CrossRef]
- Feddema, J.J. A Revised Thornthwaite-Type Global Climate Classification. Physical Geography 2005, 26, 442–466. [Google Scholar] [CrossRef]
- Feng, S.; Trnka, M.; Hayes, M.; Zhang, Y. Why do different drought indices show distinct future drought risk outcomes in the US Great Plains? Journal of Climate 2017, 30, 265–278. [Google Scholar] [CrossRef]
- Fluixá-Sanmartín, J.; Pan, D.; Fischer, L.; Orlowsky, B.; García-Hernández, J.; Jordan, F.; Haemmig, C.; Zhang, F.; Xu, J. Searching for the optimal drought index and timescale combination to detect drought: a case study from the lower Jinsha River basin, China. Hydrology and Earth System Sciences 2018, 22, 889–910. [Google Scholar] [CrossRef]
- Funk, C.; Shukla, S.; Thiaw, W.M.; Rowland, J.; Hoell, A.; McNally, A.; Husak, G.; Novella, N.; Budde, M.; Peters-Lidard, C. Recognizing the famine early warning systems network: over 30 years of drought early warning science advances and partnerships promoting global food security. Bulletin of the American Meteorological Society 2019, 100, 1011–1027. [Google Scholar] [CrossRef]
- Gaona, J.; Quintana-Seguí, P.; Escorihuela, M.J.; Boone, A.; Llasat, M.C. Interactions between precipitation, evapotranspiration and soil-moisture-based indices to characterize drought with high-resolution remote sensing and land-surface model data. Natural Hazards and Earth System Sciences 2022, 22, 3461–3485. [Google Scholar] [CrossRef]
- Gebrechorkos, S.H.; Peng, J.; Dyer, E.; Miralles, D.G.; Vicente-Serrano, S.M.; Funk, C.; Beck, H.E.; Asfaw, D.T.; Singer, M.B.; Dadson, S.J. Global High-Resolution Drought Indices for 1981-2022. Earth Syst. Sci. Data Discuss. 2023, 2023, 1–28. [Google Scholar] [CrossRef]
- Gibbs, W.J.J.V.M. Rainfall deciles as drought indicators. Bureau of Meteorology 1967, 48, 84. [Google Scholar]
- Greve, P.; Roderick, M.L.; Ukkola, A.M.; Wada, Y. The aridity Index under global warming. Environmental Research Letters 2019, 14, 124006. [Google Scholar] [CrossRef]
- Grundstein, A. Evaluation of climate change over the continental United States using a moisture index. Climatic Change 2009, 93, 103–115. [Google Scholar] [CrossRef]
- Guo, Y.; Huang, S.; Huang, Q.; Wang, H.; Fang, W.; Yang, Y.; Wang, L. Assessing socioeconomic drought based on an improved Multivariate Standardized Reliability and Resilience Index. Journal of Hydrology 2019, 568, 904–918. [Google Scholar] [CrossRef]
- Hadiani, R.R.; Suharto, B.; Suharyanto, A. Hydrological Drought Index Based on Discharge. In Drought-Impacts and Management; 2022.
- Hänsel, S.; Schucknecht, A.; Matschullat, J. The Modified Rainfall Anomaly Index (mRAI)—is this an alternative to the Standardised Precipitation Index (SPI) in evaluating future extreme precipitation characteristics? Theoretical and applied climatology 2016, 123, 827–844. [Google Scholar] [CrossRef]
- Hao, Z.; AghaKouchak, A.; Nakhjiri, N.; Farahmand, A. Global integrated drought monitoring and prediction system. Scientific Data 2014, 1, 140001. [Google Scholar] [CrossRef]
- Hatami Bahman Beiglou, P.; Luo, L.; Tan, P.-N.; Pei, L. Automated Analysis of the US Drought Monitor Maps With Machine Learning and Multiple Drought Indicators. Frontiers in Big Data 2021, 4. [Google Scholar] [CrossRef] [PubMed]
- Hayes, M.J.; Alvord, C.; Lowrey, J. Drought indices. Intermountain west climate summary 2007, 3, 2–6. [Google Scholar] [CrossRef]
- Hayes, M.J.; Svoboda, M.D.; Wiihite, D.A.; Vanyarkho, O.V. Monitoring the 1996 drought using the standardized precipitation index. Bulletin of the American meteorological society 1999, 80, 429–438. [Google Scholar] [CrossRef]
- Heim Jr, R.R. A review of twentieth-century drought indices used in the United States. Bulletin of the American Meteorological Society 2002, 83, 1149–1166. [Google Scholar] [CrossRef]
- Heim, R.R.; Brewer, M.J. The Global Drought Monitor Portal: The Foundation for a Global Drought Information System. Earth Interactions 2012, 16, 1–28. [Google Scholar] [CrossRef]
- Heim, R.R.; Guard, C.; Lander, M.A.; Bukunt, B. USAPI USDM: Operational Drought Monitoring in the U.S.-Affiliated Pacific Islands. Atmosphere 2020, 11, 495. [Google Scholar] [CrossRef]
- Hirwa, H.; Li, F.; Qiao, Y.; Measho, S.; Muhirwa, F.; Tian, C.; Leng, P.; Ingabire, R.; Itangishaka, C.A. Climate Change-Drylands-Food Security Nexus in Africa: From the Perspective of Technical Advances, Challenges, and Opportunities. Frontiers in Environmental Science 2022, 1535. [Google Scholar] [CrossRef]
- Iglesias, A.; Moneo, M.; Quiroga, S. Methods for evaluating social vulnerability to drought. In Coping with Drought Risk in Agriculture and Water Supply Systems: Drought Management and Policy Development in the Mediterranean; Springer: 2009; pp. 153-159.
- Isard, S.A.; Welford, M.R.; Hollinger, S.E. A SIMPLE SOIL MOISTURE INDEX TO FORECAST CROP YIELDS. Physical Geography 1995, 16, 524–538. [Google Scholar] [CrossRef]
- Jiang, J.; Zhou, T. Agricultural drought over water-scarce Central Asia aggravated by internal climate variability. Nature Geoscience 2023, 16, 154–161. [Google Scholar] [CrossRef]
- Johnson, L.E.; Geli, H.M.E.; Hayes, M.J.; Smith, K.H. Building an Improved Drought Climatology Using Updated Drought Tools: A New Mexico Food-Energy-Water (FEW) Systems Focus. Frontiers in Climate 2020, 2. [Google Scholar] [CrossRef]
- Juhasz, T.; Kornfield, J. The Crop Moisture Index: Unnatural Response to Changes in Temperature. Journal of Applied Meteorology and Climatology 1978, 17, 1864–1866. [Google Scholar] [CrossRef]
- Karunarathne, A.; Gad, E.; Disfani, M.; Sivanerupan, S.; Wilson, J. Review of calculation procedures of Thornthwaite Moisture Index and its impact on footing design. Aust. Geomech. J 2016, 51, 85–95. [Google Scholar]
- Keetch, J.J.; Byram, G.M. A drought index for forest fire control; US Department of Agriculture, Forest Service, Southeastern Forest Experiment …: 1968; Volume 38.
- Keyantash, J.; Dracup, J.A. The quantification of drought: an evaluation of drought indices. Bulletin of the American Meteorological Society 2002, 83, 1167–1180. [Google Scholar] [CrossRef]
- Khansalari, S.; Raziei, T.; Mohebalhojeh, A.R.; Ahmadi-Givi, F. Moderate to heavy cold-weather precipitation occurrences in Tehran and the associated circulation types. Theoretical and applied climatology 2018, 131, 985–1003. [Google Scholar] [CrossRef]
- Kim, S.J.; Park, S.; Lee, S.J.; Shaimerdenova, A.; Kim, J.; Park, E.; Lee, W.; Kim, G.S.; Kim, N.; Kim, T.H.; et al. Developing spatial agricultural drought risk index with controllable geo-spatial indicators: A case study for South Korea and Kazakhstan. International Journal of Disaster Risk Reduction 2021, 54, 102056. [Google Scholar] [CrossRef]
- King-Okumu, C.; Tsegai, D.; Pandey, R.P.; Rees, G. Less to lose? Drought impact and vulnerability assessment in disadvantaged regions. Water 2020, 12, 1136. [Google Scholar] [CrossRef]
- Kundel, D.; Bodenhausen, N.; Jørgensen, H.B.; Truu, J.; Birkhofer, K.; Hedlund, K.; Mäder, P.; Fliessbach, A. Effects of simulated drought on biological soil quality, microbial diversity and yields under long-term conventional and organic agriculture. FEMS Microbiology Ecology 2020, 96. [Google Scholar] [CrossRef] [PubMed]
- Laimighofer, J.; Laaha, G. How standard are standardized drought indices? Uncertainty components for the SPI & SPEI case. Journal of Hydrology 2022, 613, 128385. [Google Scholar] [CrossRef]
- Lee, J.-W.; Hong, E.-M.; Jang, W.-J.; Kim, S.-J. Assessment of socio-economic drought information using drought-related Internet news data (Part A: Socio-economic drought data construct and evaluation socio-economic drought information). International Journal of Disaster Risk Reduction 2022, 75, 102961. [Google Scholar] [CrossRef]
- Leeper, R.D.; Bilotta, R.; Petersen, B.; Stiles, C.J.; Heim, R.; Fuchs, B.; Prat, O.P.; Palecki, M.; Ansari, S. Characterizing U.S. drought over the past 20 years using the U.S. drought monitor. International Journal of Climatology 2022, 42, 6616–6630. [Google Scholar] [CrossRef]
- Lehner, F.; Coats, S.; Stocker, T.F.; Pendergrass, A.G.; Sanderson, B.M.; Raible, C.C.; Smerdon, J.E. Projected drought risk in 1.5°C and 2°C warmer climates. Geophysical Research Letters 2017, 44, 7419–7428. [Google Scholar] [CrossRef]
- Li, J.; Sun, X. Evaluation of changes of the Thornthwaite moisture index in Victoria. Australian Geomechanics Journal 2015, 50, 39–49. [Google Scholar]
- Li, Y.; Feng, A.; Liu, W.; Ma, X.; Dong, G. Variation of aridity index and the role of climate variables in the Southwest China. Water 2017, 9, 743. [Google Scholar] [CrossRef]
- Lindoso, D.P.; Eiró, F.; Bursztyn, M.; Rodrigues-Filho, S.; Nasuti, S. Harvesting Water for Living with Drought: Insights from the Brazilian Human Coexistence with Semi-Aridity Approach towards Achieving the Sustainable Development Goals. Sustainability 2018, 10, 622. [Google Scholar] [CrossRef]
- Liu, S.; Shi, H.; Sivakumar, B. Socioeconomic Drought Under Growing Population and Changing Climate: A New Index Considering the Resilience of a Regional Water Resources System. Journal of Geophysical Research: Atmospheres 2020, 125, e2020JD033005. [Google Scholar] [CrossRef]
- Liu, Y.; Ren, L.; Hong, Y.; Zhu, Y.; Yang, X.; Yuan, F.; Jiang, S. Sensitivity analysis of standardization procedures in drought indices to varied input data selections. Journal of Hydrology 2016, 538, 817–830. [Google Scholar] [CrossRef]
- Loukas, A.; Vasiliades, L.; Dalezios, N. Intercomparison of meteorological drought indices for drought assessment and monitoring in Greece. In Proceedings of the Proceedings of the International Conference on Environmental Science and Technology, 2003.
- Ma, M.; Ren, L.; Yuan, F.; Jiang, S.; Liu, Y.; Kong, H.; Gong, L. A new standardized Palmer drought index for hydro-meteorological use. Hydrological Processes 2014, 28, 5645–5661. [Google Scholar] [CrossRef]
- Mahmoudi, P.; Rigi, A.; Miri Kamak, M. Evaluating the sensitivity of precipitation-based drought indices to different lengths of record. Journal of Hydrology 2019, 579, 124181. [Google Scholar] [CrossRef]
- Mardian, J. The role of spatial scale in drought monitoring and early warning systems: a review. Environmental Reviews 2022, 30, 438–459. [Google Scholar] [CrossRef]
- McEvoy, J.; Bathke, D.J.; Burkardt, N.; Cravens, A.E.; Haigh, T.; Hall, K.R.; Hayes, M.J.; Jedd, T.; Poděbradská, M.; Wickham, E. Ecological Drought: Accounting for the Non-Human Impacts of Water Shortage in the Upper Missouri Headwaters Basin, Montana, USA. Resources 2018, 7, 14. [Google Scholar] [CrossRef]
- McKee, T.B.; Doesken, N.J.; Kleist, J. The relationship of drought frequency and duration to time scales. In Proceedings of the Proceedings of the 8th Conference on Applied Climatology, 1993.
- Mehran, A.; Mazdiyasni, O.; AghaKouchak, A. A hybrid framework for assessing socioeconomic drought: Linking climate variability, local resilience, and demand. Journal of Geophysical Research: Atmospheres 2015, 120, 7520–7533. [Google Scholar] [CrossRef]
- Meza, I.; Siebert, S.; Döll, P.; Kusche, J.; Herbert, C.; Eyshi Rezaei, E.; Nouri, H.; Gerdener, H.; Popat, E.; Frischen, J.; et al. Global-scale drought risk assessment for agricultural systems. Nat. Hazards Earth Syst. Sci. 2020, 20, 695–712. [Google Scholar] [CrossRef]
- Mika, J.; Horváth, S.; Makra, L.; Dunkel, Z. The Palmer Drought Severity Index (PDSI) as an indicator of soil moisture. Physics and Chemistry of the Earth, Parts A/B/C 2005, 30, 223–230. [Google Scholar] [CrossRef]
- Monjo, R.; Royé, D.; Martin-Vide, J. Meteorological drought lacunarity around the world and its classification. Earth Syst. Sci. Data 2020, 12, 741–752. [Google Scholar] [CrossRef]
- Moss, R.; Brenkert, A.; Malone, E.L. Measuring vulnerability: a trial indicator set. Pacific Northwest Laboratories 2000. [Google Scholar]
- Nagarajan, R. Drought Indices. In Drought Assessment; Springer Netherlands: Dordrecht, 2010; pp. 160–204. [Google Scholar]
- NOAA/NCEI. U.S. Drought Monitor. 2023.
- Olukayode Oladipo, E., 1985. A comparative performance analysis of three meteorological drought indices. Journal of Climatology 5(6), 655-664.
- Orimoloye, I.R. Agricultural Drought and Its Potential Impacts: Enabling Decision-Support for Food Security in Vulnerable Regions. Frontiers in Sustainable Food Systems 2022, 6. [Google Scholar] [CrossRef]
- Osman, M.; Zaitchik, B.F.; Badr, H.S.; Christian, J.I.; Tadesse, T.; Otkin, J.A.; Anderson, M.C. Flash drought onset over the contiguous United States: sensitivity of inventories and trends to quantitative definitions. Hydrol. Earth Syst. Sci. 2021, 25, 565–581. [Google Scholar] [CrossRef]
- Ozceylan, D.; Coskun, E. The relationship between Turkey’s Provinces’ development levels and social and economic vulnerability to disasters. Journal of Homeland Security and Emergency Management 2012, 9. [Google Scholar] [CrossRef]
- Palmer, W.C. Meteorological drought; US Department of Commerce, Weather Bureau: 1965; Volume 30.
- Pan, Y.; Zhu, Y.; Lü, H.; Yagci, A.L.; Fu, X.; Liu, E.; Xu, H.; Ding, Z.; Liu, R. Accuracy of agricultural drought indices and analysis of agricultural drought characteristics in China between 2000 and 2019. Agricultural Water Management 2023, 283, 108305. [Google Scholar] [CrossRef]
- Park, S.-Y.; Sur, C.; Lee, J.-H.; Kim, J.-S. Ecological drought monitoring through fish habitat-based flow assessment in the Gam river basin of Korea. Ecological Indicators 2020, 109, 105830. [Google Scholar] [CrossRef]
- Pendergrass, A.G.; Meehl, G.A.; Pulwarty, R.; Hobbins, M.; Hoell, A.; AghaKouchak, A.; Bonfils, C.J.; Gallant, A.J.; Hoerling, M.; Hoffmann, D. Flash droughts present a new challenge for subseasonal-to-seasonal prediction. Nature Climate Change 2020, 10, 191–199. [Google Scholar] [CrossRef]
- Perianes-Rodriguez, A.; Waltman, L.; van Eck, N.J. Constructing bibliometric networks: A comparison between full and fractional counting. Journal of Informetrics 2016, 10, 1178–1195. [Google Scholar] [CrossRef]
- Prăvălie, R.; Bandoc, G. Aridity variability in the last five decades in the Dobrogea region, Romania. Arid Land Research and Management 2015, 29, 265–287. [Google Scholar] [CrossRef]
- Qu, C.; Hao, X.; Qu, J.J. Monitoring Extreme Agricultural Drought over the Horn of Africa (HOA) Using Remote Sensing Measurements. Remote Sensing 2019, 11, 902. [Google Scholar] [CrossRef]
- Raziei, T. Revisiting the Rainfall Anomaly Index to serve as a Simplified Standardized Precipitation Index. Journal of Hydrology 2021, 602, 126761. [Google Scholar] [CrossRef]
- Salehnia, N.; Alizadeh, A.; Sanaeinejad, H.; Bannayan, M.; Zarrin, A.; Hoogenboom, G. Estimation of meteorological drought indices based on AgMERRA precipitation data and station-observed precipitation data. Journal of Arid Land 2017, 9, 797–809. [Google Scholar] [CrossRef]
- Satoh, Y.; Yoshimura, K.; Pokhrel, Y.; Kim, H.; Shiogama, H.; Yokohata, T.; Hanasaki, N.; Wada, Y.; Burek, P.; Byers, E.; et al. The timing of unprecedented hydrological drought under climate change. Nature Communications 2022, 13, 3287. [Google Scholar] [CrossRef]
- Savenije, H.H.G. Water scarcity indicators; the deception of the numbers. Physics and Chemistry of the Earth, Part B: Hydrology, Oceans and Atmosphere 2000, 25, 199–204. [Google Scholar] [CrossRef]
- Sepulcre-Canto, G.; Horion, S.; Singleton, A.; Carrao, H.; Vogt, J. Development of a Combined Drought Indicator to detect agricultural drought in Europe. Nat. Hazards Earth Syst. Sci. 2012, 12, 3519–3531. [Google Scholar] [CrossRef]
- Smith, K.H.; Tyre, A.J.; Tang, Z.; Hayes, M.J.; Akyuz, F.A. Calibrating human attention as indicator monitoring# drought in the Twittersphere. Bulletin of the American Meteorological Society 2020, 101, E1801–E1819. [Google Scholar] [CrossRef]
- Solomon, S.; Plattner, G.-K.; Knutti, R.; Friedlingstein, P. Irreversible climate change due to carbon dioxide emissions. Proceedings of the National Academy of Sciences 2009, 106, 1704–1709. [Google Scholar] [CrossRef]
- Standler., J., Stephen.,. Aridity Indexes. In Encyclopedia of World Climatology, Oliver, J.E., Ed.; Springer Netherlands: Dordrecht, 2005; pp. 89-94.
- Svoboda, M.; Fuchs, B. Handbook of drought indicators and indices. Drought and water crises: Integrating science, management, and policy 2016, 155-208.
- Svoboda, M.; LeComte, D.; Hayes, M.; Heim, R.; Gleason, K.; Angel, J.; Rippey, B.; Tinker, R.; Palecki, M.; Stooksbury, D. The drought monitor. Bulletin of the American Meteorological Society 2002, 83, 1181–1190. [Google Scholar] [CrossRef]
- Tabari, H.; Willems, P. Sustainable development substantially reduces the risk of future drought impacts. Communications Earth & Environment 2023, 4, 180. [Google Scholar] [CrossRef]
- Tan, X.; Wu, X.; Huang, Z.; Fu, J.; Tan, X.; Deng, S.; Liu, Y.; Gan, T.Y.; Liu, B. Increasing global precipitation whiplash due to anthropogenic greenhouse gas emissions. Nature Communications 2023, 14, 2796. [Google Scholar] [CrossRef] [PubMed]
- Tareke, K.A.; Awoke, A.G. Hydrological Drought Analysis using Streamflow Drought Index (SDI) in Ethiopia. Advances in Meteorology 2022, 2022, 7067951. [Google Scholar] [CrossRef]
- Thornthwaite, C.W. An approach toward a rational classification of climate. Geographical review 1948, 38, 55–94. [Google Scholar] [CrossRef]
- Tokarczyk, T. Classification of low flow and hydrological drought for a river basin. Acta Geophysica 2013, 61, 404–421. [Google Scholar] [CrossRef]
- Torelló-Sentelles, H.; Franzke, C.L.E. Drought impact links to meteorological drought indicators and predictability in Spain. Hydrol. Earth Syst. Sci. 2022, 26, 1821–1844. [Google Scholar] [CrossRef]
- Trabucco, A.; Zomer, R.J. Global aridity index and potential evapotranspiration (ET0) climate database v2. CGIAR Consort Spat Inf 2018. [Google Scholar] [CrossRef]
- Tripathy, K.P.; Mishra, A.K. How Unusual Is the 2022 European Compound Drought and Heatwave Event? Geophysical Research Letters 2023, 50, e2023GL105453. [Google Scholar] [CrossRef]
- UNEP. World atlas of desertification. Edward Arnold, London 1992, 15-45. [CrossRef]
- Van Loon, A.F. Hydrological drought explained. WIREs Water 2015, 2, 359–392. [Google Scholar] [CrossRef]
- Van Rooy, M. A rainfall anomally index independent of time and space, notos. 1965.
- Vanderbilt, K.; Gaiser, E. The international long term ecological research network: a platform for collaboration. Ecosphere 2017, 8, e01697. [Google Scholar] [CrossRef]
- Vicente-Serrano, S.M.; Azorin-Molina, C.; Sanchez-Lorenzo, A.; Revuelto, J.; López-Moreno, J.I.; González-Hidalgo, J.C.; Moran-Tejeda, E.; Espejo, F. Reference evapotranspiration variability and trends in Spain, 1961–2011. Global and Planetary Change 2014, 121, 26–40. [Google Scholar] [CrossRef]
- Vicente-Serrano, S.M.; Beguería, S.; López-Moreno, J.I. A multiscalar drought index sensitive to global warming: the standardized precipitation evapotranspiration index. Journal of climate 2010, 23, 1696–1718. [Google Scholar] [CrossRef]
- Vicente-Serrano, S.M.; Peña-Angulo, D.; Beguería, S.; Domínguez-Castro, F.; Tomás-Burguera, M.; Noguera, I.; Gimeno-Sotelo, L.; El Kenawy, A. Global drought trends and future projections. Philosophical Transactions of the Royal Society A: Mathematical, Physical and Engineering Sciences 2022, 380, 20210285. [Google Scholar] [CrossRef]
- Vicente-Serrano, S.M.; Quiring, S.M.; Peña-Gallardo, M.; Yuan, S.; Domínguez-Castro, F. A review of environmental droughts: Increased risk under global warming? Earth-Science Reviews 2020, 201, 102953. [Google Scholar] [CrossRef]
- Vicente-Serrano, S.M.; Van der Schrier, G.; Beguería, S.; Azorin-Molina, C.; Lopez-Moreno, J.-I. Contribution of precipitation and reference evapotranspiration to drought indices under different climates. Journal of Hydrology 2015, 526, 42–54. [Google Scholar] [CrossRef]
- Vogt, J.V.; Naumann, G.; Masante, D.; Spinoni, J.; Cammalleri, C.; Erian, W.; Pischke, F.; Pulwarty, R.; Barbosa, P. (Publication Office of the European Union). Drought risk assessment and management: A conceptual framework; 1831-9424; Publication Office of the European Union: Luxembourg, 2018 2018; p. 68. [Google Scholar]
- WEF. More than 75% of the world could face drought by 2050, UN report warns. Available online: https://www.weforum.org/stories/2022/05/drought-2050-un-report-climate-change/#:~:text=The%20report%20found%20that%20drought,the%20top%20of%20the%20list. (accessed on 07/23 2025).
- Wilhite, D.A. Managing drought risk in a changing climate. Climate Research 2016, 70, 99–102. [Google Scholar] [CrossRef]
- Wilhite, D.A.; Glantz, M.H. Understanding: the drought phenomenon: the role of definitions. Water international 1985, 10, 111–120. [Google Scholar] [CrossRef]
- Yang, T.; Zhou, X.; Yu, Z.; Krysanova, V.; Wang, B. Drought projection based on a hybrid drought index using Artificial Neural Networks. Hydrological Processes 2015, 29, 2635–2648. [Google Scholar] [CrossRef]
- Zarafshani, K.; Sharafi, L.; Azadi, H.; Van Passel, S. Vulnerability assessment models to drought: toward a conceptual framework. Sustainability 2016, 8, 588. [Google Scholar] [CrossRef]
- Zargar, A.; Sadiq, R.; Naser, B.; Khan, F.I. A review of drought indices. Environmental Reviews 2011, 19, 333–349. [Google Scholar] [CrossRef]
- Zhang, X.; Chen, N.; Sheng, H.; Ip, C.; Yang, L.; Chen, Y.; Sang, Z.; Tadesse, T.; Lim, T.P.Y.; Rajabifard, A.; et al. Urban drought challenge to 2030 sustainable development goals. Science of The Total Environment 2019, 693, 133536. [Google Scholar] [CrossRef] [PubMed]
- Zhang, Y.; Liu, C.; Tang, Y.; Yang, Y. Trends in pan evaporation and reference and actual evapotranspiration across the Tibetan Plateau. Journal of Geophysical Research: Atmospheres 2007, 112. [Google Scholar] [CrossRef]
- Zhang, Y.; Wu, Z.; Singh, V.P.; Lin, Q.; Ning, S.; Zhou, Y.; Jin, J.; Zhou, R.; Ma, Q. Agricultural drought characteristics in a typical plain region considering irrigation, crop growth, and water demand impacts. Agricultural Water Management 2023, 282, 108266. [Google Scholar] [CrossRef]
- Zhao, Q.; Ma, X.; Yao, W.; Liu, Y.; Du, Z.; Yang, P.; Yao, Y. Improved Drought Monitoring Index Using GNSS-Derived Precipitable Water Vapor over the Loess Plateau Area. Sensors 2019, 19, 5566. [Google Scholar] [CrossRef] [PubMed]
Figure 2.
9-month SPI global drought map. The Global Precipitation Centre (GPCC) monthly precipitation dataset from 1901-present was calculated from global station data. Source: GPCC.
Figure 2.
9-month SPI global drought map. The Global Precipitation Centre (GPCC) monthly precipitation dataset from 1901-present was calculated from global station data. Source: GPCC.
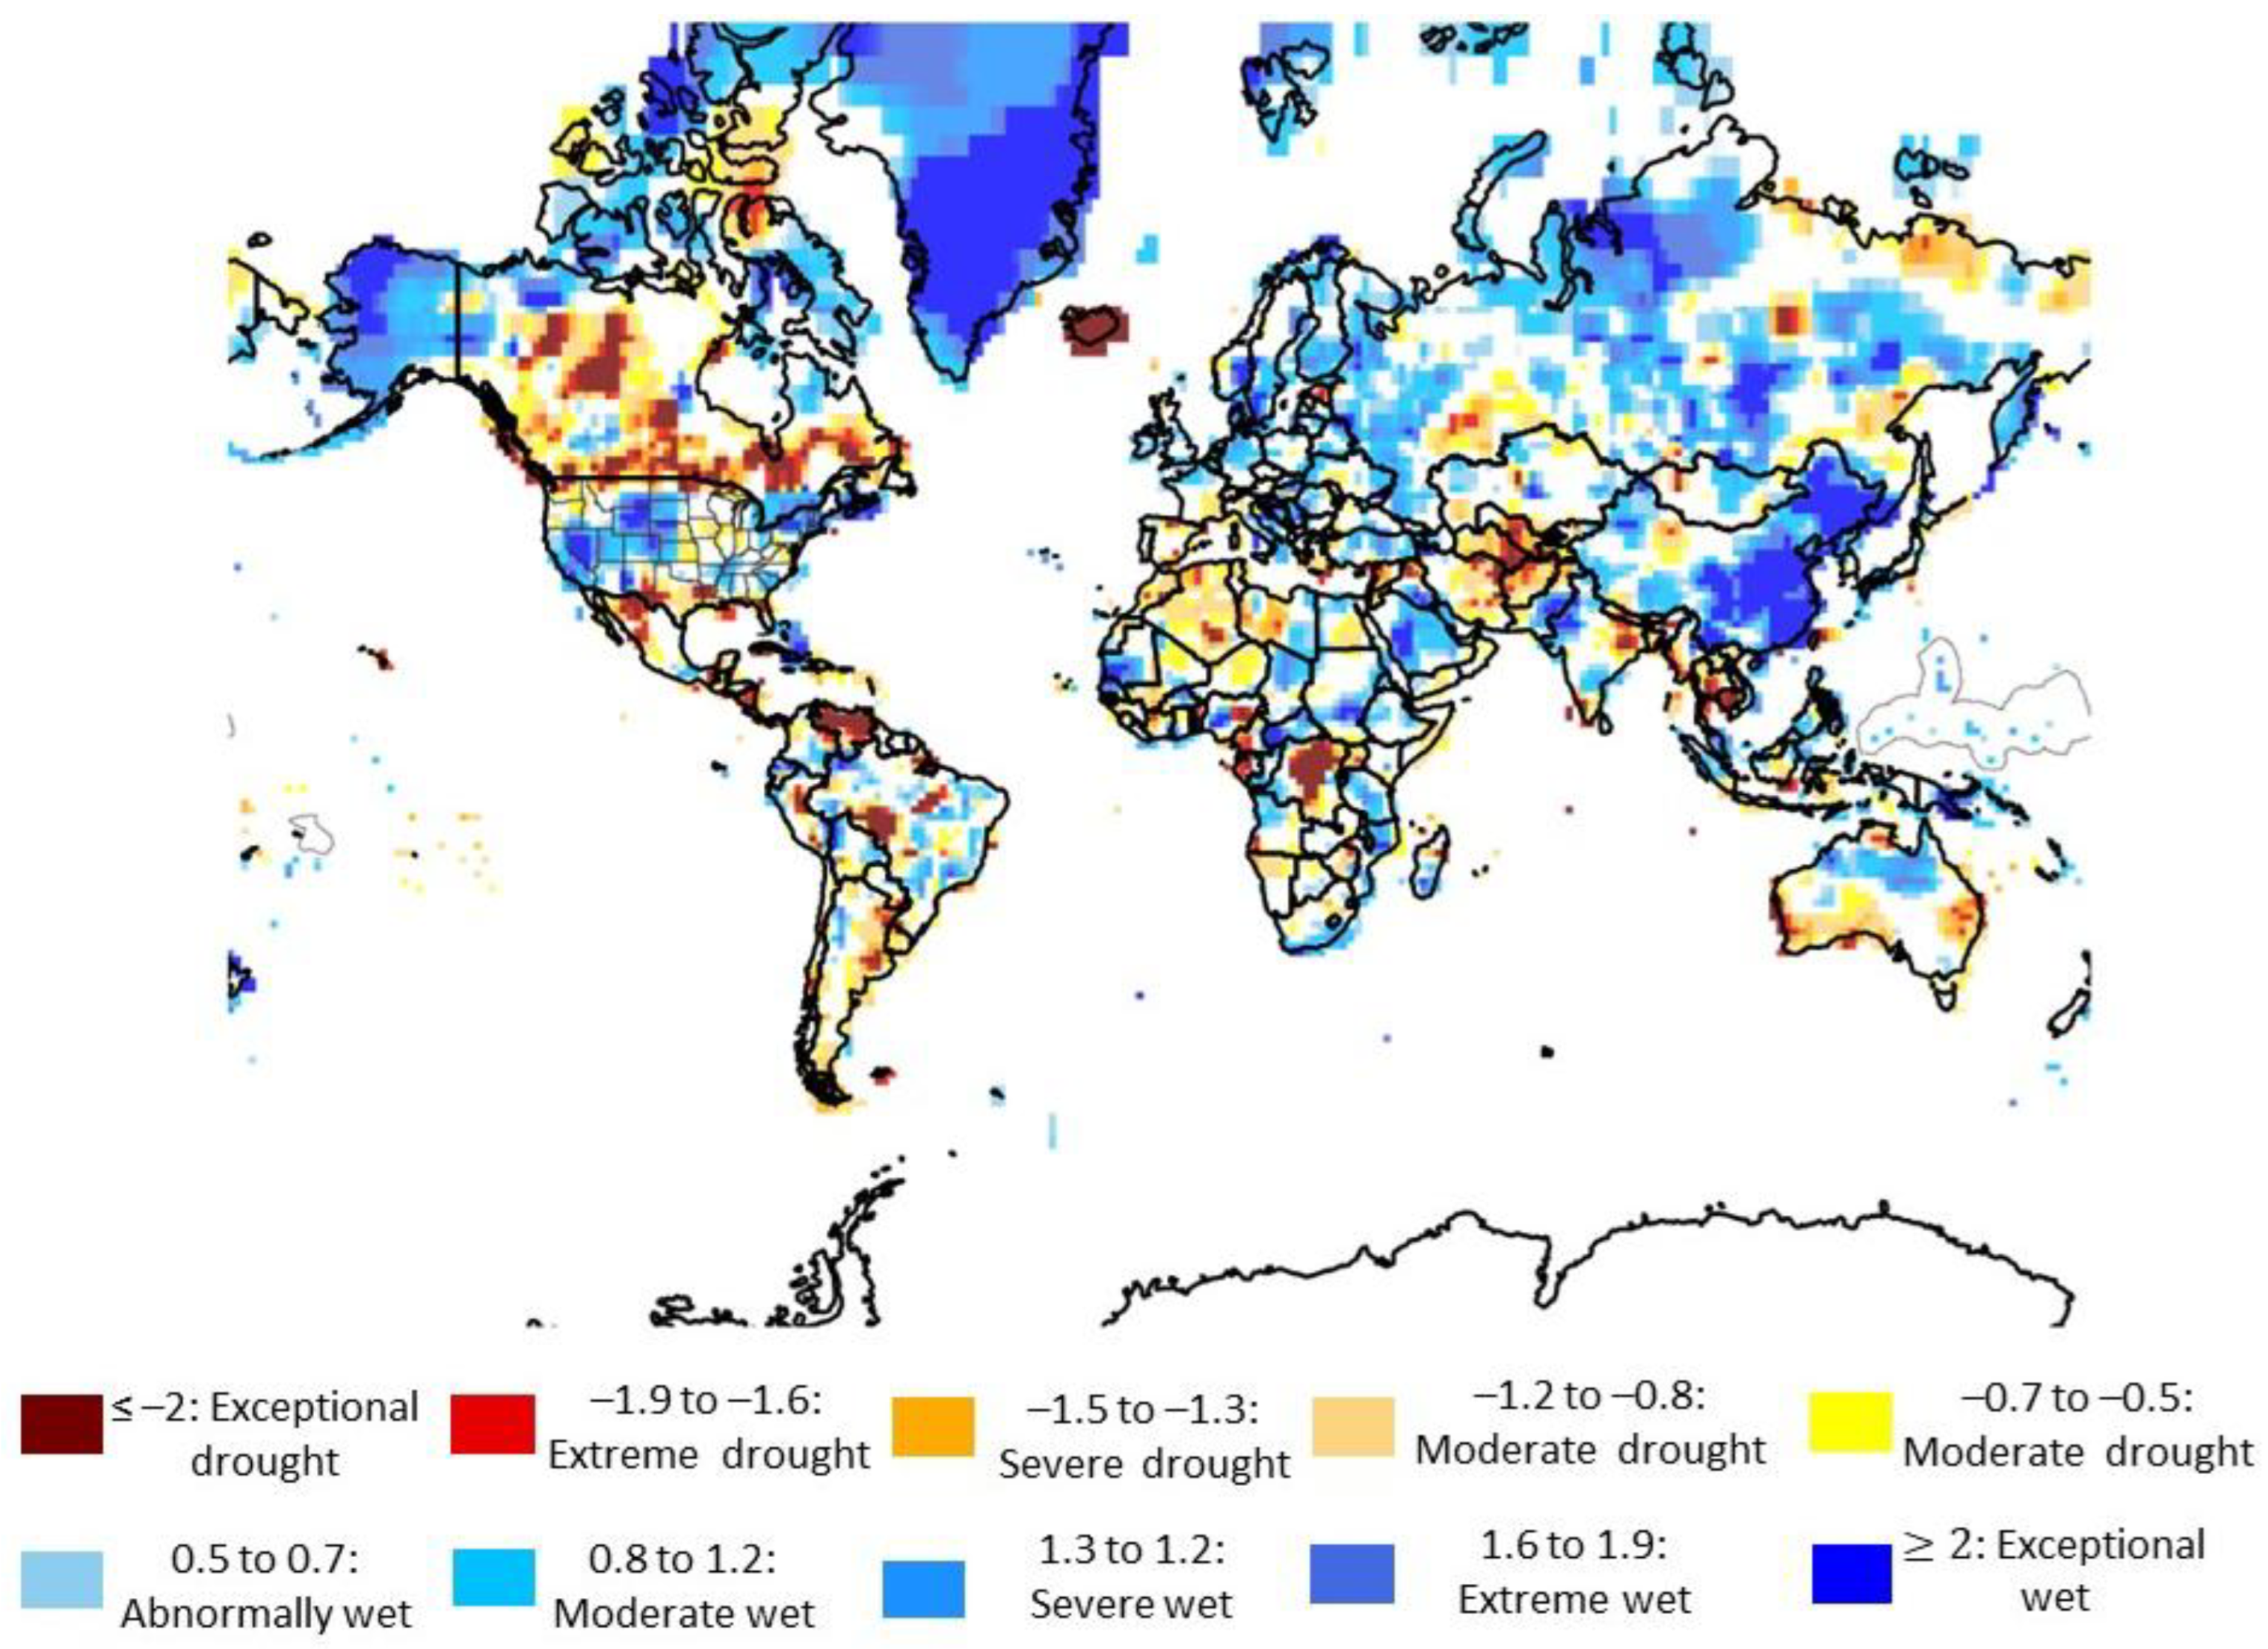
Figure 3.
The global Thornthwaite moisture regions. Source: Feddema (2005).
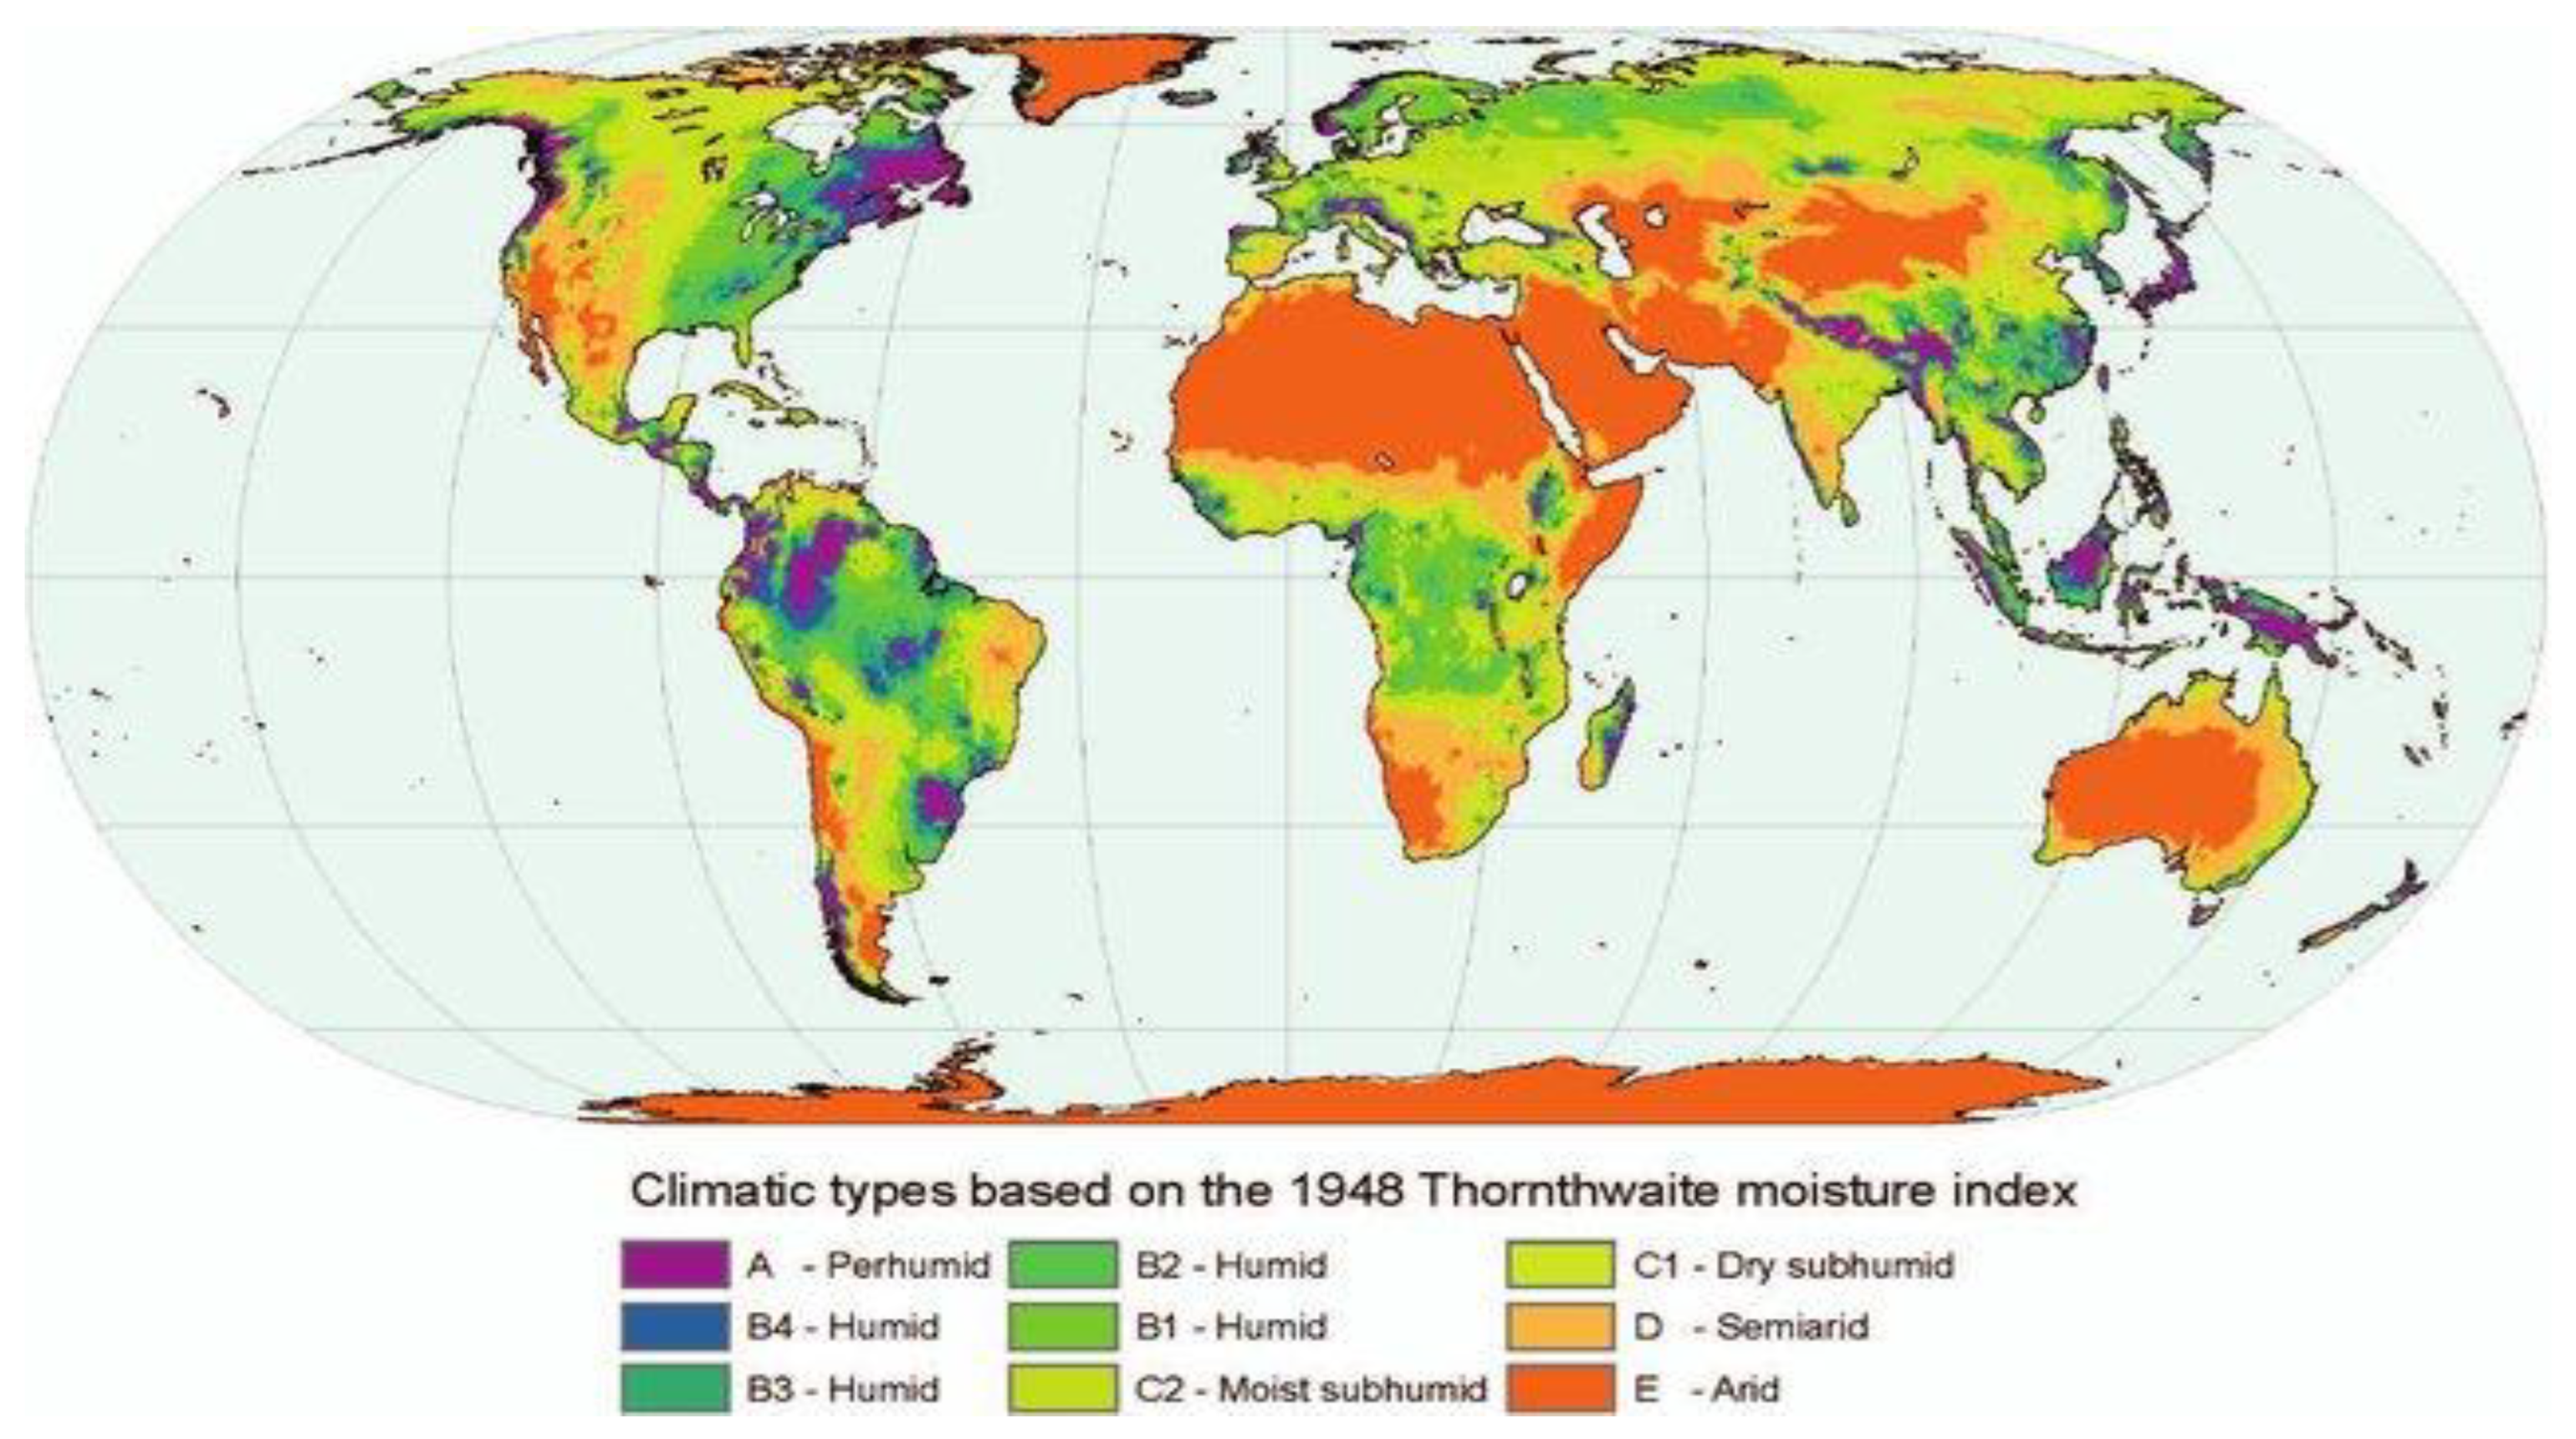
Figure 4.
Distribution of global drylands. Drylands are delineated based on the AI, humid (AI > 0.65), dry sub-humid (0.50 < AI ≤ 0.65), semi-arid (0.20 < AI ≤ 0.50), arid (0.05 < AI ≤ 0.20), hyper-arid (AI < 0.05). AI values and corresponding climate classes developed by UNEP (1992). Mean global-Aridity_ET0 and global_ET0 datasets (Trabucco and Zomer, 2018).
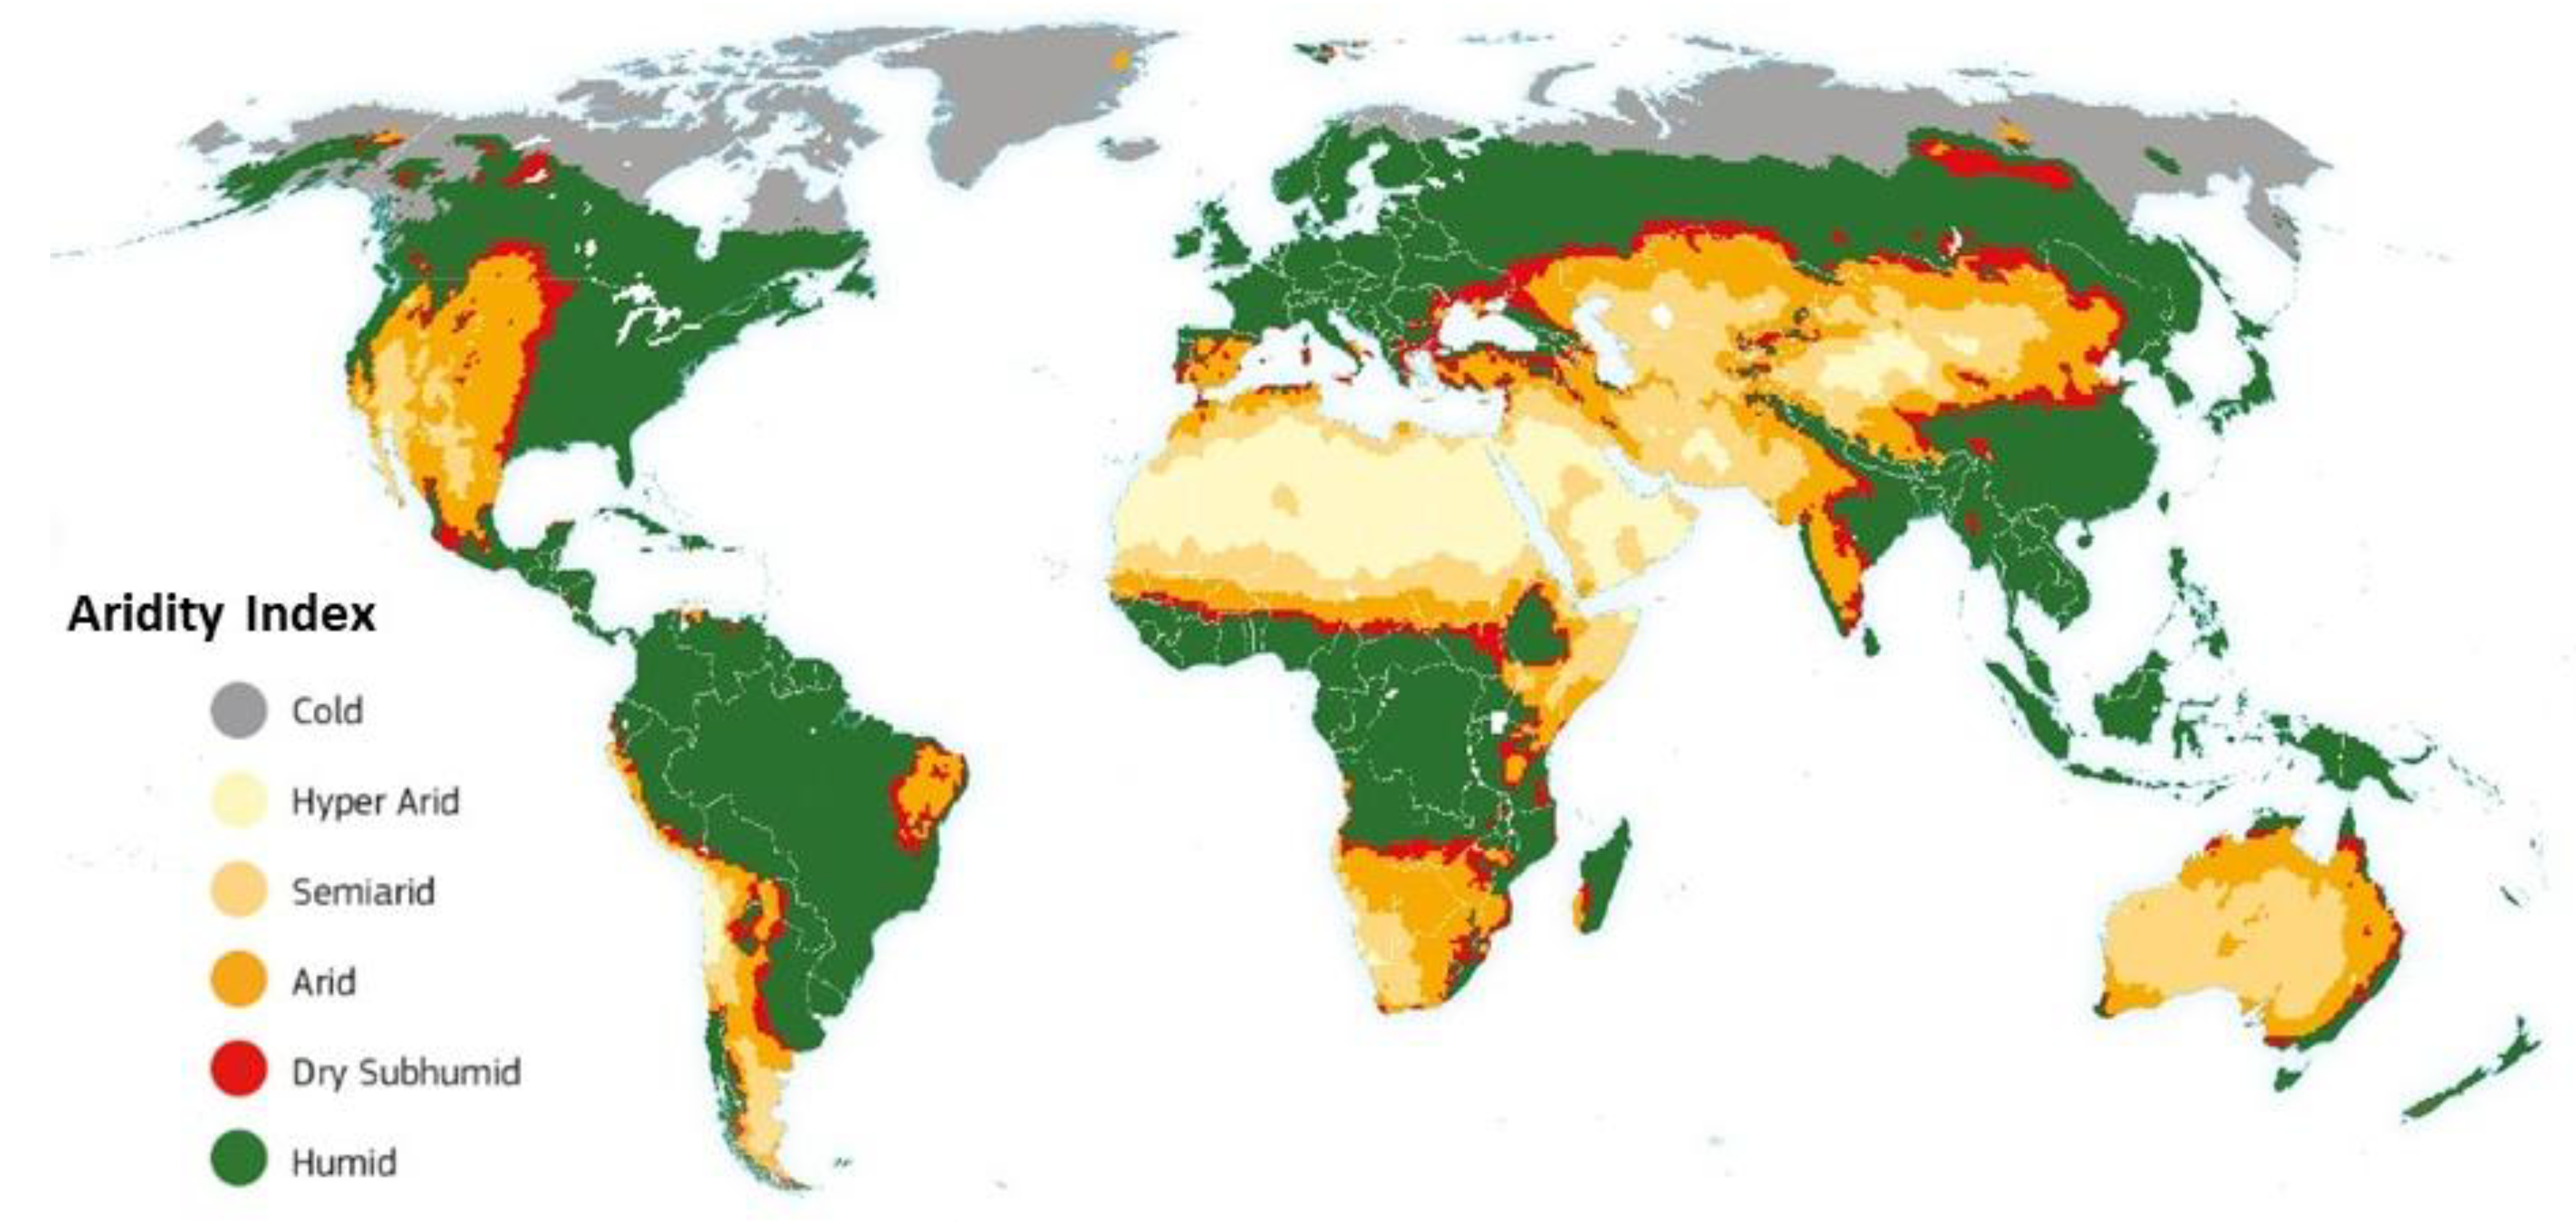
Disclaimer/Publisher’s Note: The statements, opinions and data contained in all publications are solely those of the individual author(s) and contributor(s) and not of MDPI and/or the editor(s). MDPI and/or the editor(s) disclaim responsibility for any injury to people or property resulting from any ideas, methods, instructions or products referred to in the content. |
© 2025 by the authors. Licensee MDPI, Basel, Switzerland. This article is an open access article distributed under the terms and conditions of the Creative Commons Attribution (CC BY) license (http://creativecommons.org/licenses/by/4.0/).
Copyright: This open access article is published under a Creative Commons CC BY 4.0 license, which permit the free download, distribution, and reuse, provided that the author and preprint are cited in any reuse.


