Submitted:
23 July 2025
Posted:
24 July 2025
You are already at the latest version
Abstract
Japanese Kanji characters present significant challenges in the context of character recognition due to the complexity of their visual forms and the large number of classes. This study aims to compare the performance of four classical machine learning algorithms—Decision Tree, Random Forest, K-Nearest Neighbor (KNN), and Support Vector Machine (SVM)—in the task of Kanji character classification using the Histogram of Oriented Gradients (HOG) method as a consistent feature extraction technique. Experiments were conducted on a curated subset of the ETL9G dataset consisting of 30 randomly selected Kanji characters, with a total of 5,700 grayscale images. Each model was trained and evaluated using the K-Fold Cross-Validation method, and assessed based on accuracy, precision, recall, F1-score, and regression error metrics (R², MSE, MAE, RMSE). The results showed that the SVM algorithm with a linear kernel performed the best, with an accuracy of 97.43%, high inter-fold stability, and the lowest prediction error rate. Although KNN had the fastest training time, SVM showed better reliability and consistency of predictions. These findings confirm that, despite the increasing popularity of deep learning approaches, classical algorithms such as SVM remain highly competitive when combined with effective feature representations such as HOG. Future research could explore hybrid approaches that combine classical models with deep learning-based feature extractors to improve scalability and generalization on more complex datasets.
Keywords:
Kanji character classification
; machine learning
; support vector machine
; HOG
; image recognition
; ETL9G dataset
; KNN
; random forest
; decision tree
; cross validation
1. Introduction
Japanese language ability is a primary requirement for Indonesian migrant workers who wish to work in Japan, particularly under the Specified Skilled Worker (SSW) program [1]. Based on data from the Ministry of Manpower in 2023, Japan is one of the most popular destination countries, with the number of Indonesian migrant workers reaching more than 25,000 by mid-year [2]. However, the difficulty of learning Japanese, especially its writing system, remains one of the main obstacles for prospective migrant workers.
Japanese uses three writing systems: Hiragana, Katakana, and Kanji. Kanji is the most complex, consisting of thousands of characters that vary in shape, number of strokes, and meaning [3]. The challenge of recognizing and understanding Kanji characters is a common obstacle, especially for speakers of non-logographic languages such as Indonesian [4]. Therefore, a technology-based approach is needed to support the recognition and classification of Kanji characters.
Machine learning is increasingly used in character image processing, including for Japanese characters. Some commonly used methods include Support Vector Machine (SVM), K-Nearest Neighbor (KNN), Decision Tree, and Random Forest. Support Vector Machine is known for its effectiveness in handling high-dimensional data and achieving optimal classification margins [5]. K-Nearest Neighbor is a simple yet effective instance-based method for classification tasks with small to medium-sized datasets [6]. Decision Trees have an easy-to-understand tree structure and are widely used because of their ability to produce clear classification rules [7]. Meanwhile, Random Forest, as an ensemble method of Decision Tree, can improve accuracy and reduce overfitting by combining the results of multiple Decision Trees [7]. However, limited research specifically compares the performance of the four methods in Kanji character classification using uniform feature extraction techniques.
One of the effective feature extraction techniques for detecting shape and texture patterns in images is the Histogram of Oriented Gradients (HOG). HOG is widely used in character recognition because of its ability to capture gradient orientation in detail[8].In the context of highly complex Kanji characters, the use of HOG can help the algorithm to recognize the basic structure of the characters more accurately. The main contribution of this study is to provide a systematic comparative analysis of four classical machine learning algorithms: Decision Tree, Random Forest, K-Nearest Neighbor (KNN), and Support Vector Machine (SVM) for Kanji character classification using Histogram of Oriented Gradients (HOG) feature extraction. Each model is trained and evaluated using accuracy, precision, and recall metrics derived from the confusion matrix. The experiments are conducted on the ETL9G dataset obtained from Kaggle (https://www.kaggle.com/datasets/votrancong/etl9g-images-processed-96x96), which contains more than 500,000 Kanji images in .png and .txt formats, representing 3,036 classes with several handwriting variations. Unlike previous studies that mainly focused on CNN-based deep learning approaches[9], this research introduces a lightweight yet effective solution that can serve as a practical baseline, especially for systems with limited computing resources.
This study presents a practical and focused comparative analysis of classical machine learning algorithms, Decision Tree, Random Forest, K-Nearest Neighbors, and Support Vector Machine for Kanji character classification using Histogram of Oriented Gradients (HOG) as a consistent feature extraction technique. Although deep learning approaches have been extensively explored in the recent literature, few studies have systematically evaluated lightweight and interpretable models under the same feature representation for highly complex logographic scripts such as Kanji.
The main contributions of this research can be detailed as follows:
- −
- Consistent benchmarking against four classical machine learning algorithms: Decision Tree, Random Forest, K-Nearest Neighbor, and Support Vector Machine in Kanji character classification, with a unified feature extraction approach using Histogram of Oriented Gradients (HOG) on a subset of the ETL9G dataset consisting of 30 randomly selected characters.
- −
- The lightweight and resource-efficient classification framework provides a practical alternative to deep learning models, making it suitable for applications in constrained environments such as educational aids or mobile devices.
- −
- The analysis bridges the literature gap by directly comparing the performance of classical machine learning algorithms under uniform feature configurations—an approach that is still rare in previous studies that tend to combine different techniques or datasets.
- −
- Empirical evidence that the combination of HOG and linear SVM algorithms can produce up to 97% accuracy in Kanji character recognition shows the potential of an efficient and replicable baseline solution for further research.
To the best of our knowledge, this work is one of the few studies that systematically evaluates classical machine learning algorithms in the context of Kanji character recognition, using standardized and reproducible configurations. This work is expected to lay the foundation for the development of lightweight yet effective non-deep learning approaches for complex logographic script recognition.
The rest of this paper is organized as follows: Section 2 presents a literature review discussing related studies in Japanese character classification and the machine learning approaches used. Section 3 describes the research methodology, including a description of the ETL9G dataset, the HOG feature selection and extraction process, and the algorithms used. Section 4 presents the experimental results and model performance evaluation based on accuracy, precision, recall, F1-score, as well as error and time efficiency metrics. Section 5 discusses an in-depth analysis of the results, including comparisons between algorithms and statistical significance tests. Finally, Section 6 summarizes the main findings of this study and provides directions for further studies.
2. Related Work
Several previous studies have developed Hiragana character classification models using various machine learning algorithms such as Naïve Bayes, SVM, Decision Tree, Random Forest, and K-Nearest Neighbor (KNN), with a dataset consisting of 120 Hiragana vowel images. The classification results show that SVM obtained the highest accuracy of 96.97%, followed by KNN with an accuracy of 89.39% [10]. However, this study is limited to Hiragana characters and does not cover more complex Kanji characters, and has not utilized feature extraction techniques such as Histogram of Oriented Gradients (HOG).
Another study applied a combination of CNN and SVM approaches to transliterate handwritten Hiragana and Katakana characters. The dataset was obtained from individual handwriting and processed through preprocessing steps such as resizing, grayscale, binarization, dilation, and erosion. The classification accuracy reached 87.82% using CNN and increased to 88.21% with the combination of CNN-SVM [11]. Despite showing increased accuracy, this study only compared two methods and did not conduct a more extensive evaluation of other classical models, nor did it use an explicit feature extraction method such as HOG.
The next study focuses on optimizing the Capsule Network (CapsNet) model by applying pruning techniques such as Parasite, Magnitude, and Similarity-Based Pruning, using the KMNIST dataset and a custom Kanji dataset. The results show that the combination of pruning techniques is able to maintain accuracy close to the performance of the intact CapsNet model [12]. Although interesting, the focus of this research is on the efficiency of deep learning-based models, not on a comparative evaluation between different classification methods.
Another study developed a real-time approach for Kanji character classification using a 10-layer CNN architecture. The dataset used included Kanji characters from level N5 to N1 with preprocessing such as normalization and resizing. The model achieved training accuracy of 69.44%, validation accuracy of 62.50%, and testing accuracy of 72% [13]. The accuracy obtained is relatively lower compared to other methods, and this study also only evaluates one CNN architecture without comparison to other models.
Finally, the Y-Autoencoder (Y-AE) approach is used as a Japanese handwritten character generator to increase the amount of training data. The datasets used include ETL7, ETL8G, and ETL9G. The CNN-based recognition model shows an increase in F1 score from 0.8664 to 0.9192 with synthetic images, and reaches 0.9281 when combined with real data [14]. Although it shows very good results in improving performance, the main focus of this research is on data augmentation, not on comparing the performance of various classification algorithms.
Based on Table 1, this study aims to compare the performance of four Machine Learning methods: Decision Tree, Random Forest, KNN, and SVM in classifying Kanji characters based on the ETL9G dataset. This study integrates the HOG feature extraction technique to produce a more informative gradient direction-based representation, thereby improving the model's ability to recognize complex patterns of Kanji characters.
The following section also presents theories related to the concepts underlying this research approach, including comparative studies, basic principles of machine learning and its algorithms (Decision Tree, Random Forest, KNN, and SVM), and the Histogram of Oriented Gradients (HOG) feature extraction technique used in the Kanji character classification process. These theories include definitions and working mechanisms, which serve as a basis for objectively analyzing and evaluating the models.
2.1. Comparative Study
Comparative research is a research method used to compare two or more variables, objects, processes, or phenomena to find similarities, differences, and advantages and disadvantages of each [15]. In comparative studies involving machine learning, evaluation is done using certain measurable parameters or metrics, such as accuracy, precision, recall, and F1 score [16].
2.2. Machine Learning
Machine learning (ML) is a field in artificial intelligence that focuses on developing algorithms that can learn from data and automatically improve their performance through experience. ML algorithms enable systems to identify patterns from given data and make predictions or decisions without direct human intervention. ML has been widely used in a variety of applications, including facial recognition, text classification, anomaly detection, financial analysis, and image processing [17]. Machine learning is classified into several main categories: supervised learning, unsupervised learning, and reinforcement learning. Supervised learning is an ML approach where the model is trained using a labeled dataset, meaning each data point has a known input-output pair. Several classification algorithms used in this study fall under supervised learning, including Support Vector Machine (SVM), K-Nearest Neighbors (KNN), Decision Tree, and Random Forest [18].
2.3. Decision Tree
Decision Tree is a machine learning algorithm used for classification and regression tasks. It recursively divides a data set based on certain features that provide the best information to separate the classes of data. Each branch in the tree represents a decision based on a feature, and each leaf represents the final classification result [19]. This supervised learning method divides the data into subsets based on features to make predictions. It consists of nodes (decisions), branches (outcomes), and leaves (predictions), using criteria such as MSE or Gini Index to determine the division [20].
2.4. Random Forest
Random Forest is an ensemble algorithm that combines multiple decision trees to improve prediction accuracy [19]. An ensemble method that trains multiple decision trees and combines their outputs. This method reduces overfitting by using bagging (training on random data samples) and selecting a random subset of features. Predictions are made through majority voting or averaging [20].
2.5. K-Nearest Neighbors (KNN)
K-Nearest Neighbors (KNN) is an instance-based classification algorithm that searches for the number of nearest neighbors of the test data based on a certain distance. This algorithm classifies new data based on the majority of labels from the K nearest neighbors [21]. A classification method that classifies data points based on the majority class of their k nearest neighbors using a distance metric such as Euclidean. This method has low training cost but high inference cost, with performance affected by the choice of k value [20].
2.6. Support Vector Machine (SVM
Support Vector Machine (SVM) is a machine learning algorithm for classification and regression. SVM works by finding the optimal hyperplane that separates two classes with the largest margin. For data that is not linearly separable, SVM uses a kernel to map the data to a higher-dimensional space [22]. SVM can be used for binary classification problems and multiclass classification problems [23]. A technique that identifies the optimal hyperplane to separate classes by maximizing the margin between them, using support vectors. Kernel functions transform linearly inseparable data to a higher dimension for separation [20].
2.7. Feature Extraction
Feature extraction is the process of transforming raw data into simpler yet still informative representations for use in Machine Learning (ML) and Deep Learning (DL) [24]. The goal is to reduce data complexity and retain important information. According to [24] This technique is used in pattern recognition, image processing, speech, and natural language processing.
2.8. Histogram of Oriented Gradients (HOG)
Histogram of Oriented Gradients (HOG) is a feature extraction technique used to analyze image texture and shape patterns. HOG computes intensity gradients and groups them into a histogram based on the orientation of their edges [8]. The Histogram of Oriented Gradients (HOG) feature, on the other hand, is superior in capturing edge information in images. HOG can accurately identify areas associated with internal defects [25].
2.9. Classification
Classification is the process of categorizing or grouping pixels in a digital image into certain classes or categories based on their visual characteristics [26]. Image classification is widely used in various fields such as digital image processing, computer vision, and artificial intelligence, especially in applications such as pattern recognition, medical analysis, geospatial mapping, and optical character recognition (OCR).
2.10. Classification
Japanese has three main writing systems, namely Kanji, Hiragana, and Katakana [27]. Kanji are characters that originate from China and have double meanings and pronunciations [28]. Hiragana is used as a simple phonetic system to write native words in Japanese [29]. Meanwhile, Katakana is used to write loan words, onomatopoeia, and to emphasize certain words [29].
2.11. Machine Learning Lifecycle (MLLC)
MLLC Machine Learning Lifecycle is a systematic flow in developing machine learning models consisting of several important stages, starting from data collection to model deployment into production systems. This process is iterative and aims to continuously improve model accuracy and performance [30]. In general, the stages in this cycle include: data collection from various sources such as transactions and user activities; data pre-processing, including cleaning, feature engineering, and data sharing; model training and evaluation using metrics such as accuracy, precision, and recall to test prediction performance.
The main challenge at this stage is to ensure that the model remains stable and reliable in a more varied production environment than during training. Therefore, regular monitoring is needed to ensure that the model's scalability and performance remain optimal in the long term [30].
2.12. Evaluation
Model evaluation is an important component in the machine learning process to assess how effective and efficient an algorithm is in solving classification tasks. Evaluation is carried out using various performance metrics that reflect aspects of classification accuracy, balance between classes, and prediction errors. In addition, computational efficiency is measured through training time and the size of the model used. The following are the evaluation metrics applied in this study along with their explanations and mathematical formulas.
- −
- Accuracy, Precision, Recall
Accuracy measures the proportion of correct predictions to all predictions made. This metric provides a general idea of model performance, but can be biased when the data is imbalanced [25]. Whereas Precision measures the proportion of correct positive predictions to all positive predictions. This metric is important in contexts where false positives [25]. have a significant impact, such as on diagnostic or safety systems. And Recall, or sensitivity, measures the model's ability to detect all true positive cases [20,25].
Information :
- −
- TP: True Positive
- −
- TN: True Negative
- −
- FP: False Positive
- −
- FN: False Negative
- F1-Score
F1-Score is the harmonic mean of precision and recall, making it a balanced indicator in assessing model performance on imbalanced data [20].
- R² Score
The R² Score, or coefficient of determination, measures how well a model explains the variance of the actual data. While more common in regression, in the context of multiclass classification, this value can help assess the correlation of predictions with actual labels [20].
- Mean Squared Error (MSE)
MSE calculates the average of the squared differences between the actual values and the predicted values. The smaller the MSE value, the more accurate the model's predictions [31].
- Mean Absolute Error (MAE)
MAE is the average of the absolute differences between the actual and predicted values. MAE provides a representation of the error in the same units as the original data and is more resistant to outliers than MSE [31].
- Root Mean Squared Error (RMSE)
RMSE is the square root of MSE, and provides a measure of the prediction error in the original units of the target variable. RMSE is more sensitive to outliers than MAE [31].
- Training Time
Training time indicates the duration of time required by the model to complete the training process. This metric is important in real-world applications, especially in real-time based systems and with limited computing resources [32].
- Model Size
Model size refers to the number of parameters or the size of the model file formed after the training process. Model size impacts memory usage and efficiency in the deployment process [32].
2.13. Statistical Test t-Test
To complete the model evaluation process, a paired sample t-test was also conducted to test whether the differences in performance between metrics or between algorithms were statistically significant or not [33]. This test is particularly useful in the context of performance comparisons of machine learning algorithms evaluated using k-fold cross-validation, as it considers the distribution of results across folds as a related population.
- Paired t-test Accuracy vs F1-Score
This test is performed for each algorithm individually to test the consistency between the accuracy and F1-score metrics. This is especially important in the case of imbalanced datasets, where high accuracy does not necessarily mean that the model is able to classify all classes well. A p-value smaller than 0.05 indicates a statistically significant difference between the two metrics.
Information:
- : average difference between 1st and 2nd metrics (e.g. accuracy and F1)
- : standard deviation of the difference between pairs of values
- : number of data pairs (number of folds)
- If the p-value < 0.05, then the null hypothesis (that there is no significant difference) is rejected.
- Paired t-test Between Algorithms
In addition, the t-test is also used to compare the accuracy performance between algorithms, for example, SVM vs Random Forest, or Decision Tree vs KNN. This is done to find out whether the difference in average accuracy between two algorithms tested on the same fold is statistically significant or only occurs due to random variation.
This test provides quantitative justification that the performance of one model is indeed significantly superior to the other model. For example, if SVM shows a p-value < 0.05 when compared to Random Forest, then it can be concluded that SVM provides significantly better results in Kanji character classification based on the tested data.
3. Materials and Methods
This study applies the Machine Learning Life Cycle (MLLC) approach to compare the performance of four classical machine learning algorithms, namely Decision Tree, Random Forest, K-Nearest Neighbor (KNN), and Support Vector Machine (SVM), in the task of Kanji character classification. The research process includes a number of systematic stages, starting from data collection, pre-processing, feature extraction, model training, to evaluation of classification performance. MLLC is an iterative framework for developing machine learning models, consisting of critical stages, starting from data acquisition to model implementation into real or production systems [34]. This cycle is designed to ensure continuous improvement of model accuracy and performance. In general, the stages in MLLC include data collection from various sources, pre-processing processes such as cleaning and feature engineering, and model training and evaluation using metrics such as accuracy, precision, and recall to objectively assess the quality of predictions.
The research workflow used in this study follows the Machine Learning Life Cycle (MLLC) framework, which is presented in Figure 1.
Figure 1 shows the research workflow that follows the Machine Learning Life Cycle (MLLC) framework, starting from the data acquisition stage to the evaluation of model performance. The first stage is Data Acquisition, which is the process of collecting Kanji character images from the ETL9G dataset obtained through the Kaggle platform. This study specifically uses 30 randomly selected Kanji characters with a total of 9,500 images. This subset selection takes into account the diversity of character shapes while maintaining the efficiency of processing and model training.
Next, in the data pre-processing stage, image conversion to grayscale, pixel value normalization to the range 0–1, and image size alignment are performed. After that, feature extraction is performed using the Histogram of Oriented Gradients (HOG) method. The HOG parameters used include orientation = 9, cell size = (8,8), and normalization block = (2,2). This technique allows Kanji character images to be converted into feature vectors based on local gradient direction patterns, which are very useful in recognizing Kanji line structures and stroke shapes in detail.
The next stage is model training, which is carried out using four classic machine learning algorithms, namely Decision Tree, Random Forest, K-Nearest Neighbor (KNN), and Support Vector Machine (SVM). The Decision Tree model is built using DecisionTreeClassifier, Random Forest using RandomForestClassifier, KNN is evaluated with various values of the parameter k, while SVM is implemented using SVC with four types of kernels, namely linear, polynomial, radial basis function (RBF), and sigmoid. The evaluation is carried out to determine which kernel provides the best performance in Kanji character classification. To ensure accurate evaluation results and free from partition bias, each model is tested using the K-Fold Cross-Validation technique with four variations of k values, namely k = 3, 5, 7, and 10. This approach is used to analyze the effect of the number of folds on the stability and accuracy of model performance. The best configuration of each algorithm is determined based on the results of the performance metric evaluation obtained from each variation.
In the final stage, the model is evaluated using several metrics derived from the Confusion Matrix, including accuracy, precision, and recall. In addition, additional metrics such as F1-score, mean squared error (MSE), mean absolute error (MAE), root mean squared error (RMSE), and coefficient of determination (R²) are used to evaluate the quality of predictions more comprehensively. To ensure the statistical significance of the performance differences between models, a paired t-test was also conducted on the evaluation results of each algorithm. The results of this evaluation are used to determine the model with the best performance after consistent application of the HOG feature.
Table 2 summarizes all configurations used in the experimental process, starting from dataset selection, HOG feature extraction technique, parameters of each machine learning model, to the evaluation metrics applied. The compilation of this configuration aims to ensure that the training and evaluation processes are carried out systematically and fairly. With a combination of cross-validation techniques and quantitative evaluation, this study aims to identify models and parameters that provide the best classification performance for Kanji characters under standardized and replicable conditions.
4. Results
This section presents the evaluation results of Kanji character classification experiments using four classical machine learning algorithms, namely Decision Tree, Random Forest, K-Nearest Neighbor (KNN), and Support Vector Machine (SVM), with features extracted using the Histogram of Oriented Gradients (HOG) method. Each model is evaluated based on a number of performance metrics, including accuracy, precision, recall, and F1-score, as well as error metrics such as Mean Absolute Error (MAE), Mean Squared Error (MSE), Root Mean Squared Error (RMSE), and coefficient of determination (R²). To test the statistical significance of the performance differences between algorithms, a paired t-test is also performed. These results are used to determine the algorithm configuration and parameters that provide the best performance in Kanji character classification.
4.1. Data Acquisition
The initial stage of this experiment begins with the data acquisition process. The dataset used is ETL9G, a handwritten Kanji character dataset obtained from the Kaggle platform, through the ETL9G_images_processed_96x96 repository (https://www.kaggle.com/datasets/votrancong/etl9g-images-processed-96x96). This dataset has gone through a pre-processing process by the provider, where each character image has been converted into black and white format and adjusted to a fixed size of 96×96 pixels.
Overall, ETL9G contains more than 578,000 images from 3,036 Kanji character classes. However, only 30 randomly selected Kanji character classes were used in this study. Random selection was carried out to avoid bias in character selection and to ensure that the samples used represent various stroke shapes and character complexity levels in a balanced manner. In addition, this subset selection aims to maintain the efficiency of processing and model training, given the limited computing resources. Each character class consists of 190 images, resulting in a total of 5,700 images used in the classification experiment. Table 3 below presents a list of 30 Kanji characters along with their label codes used in this study.
4.2. Data Preprocessing
After the data collection process, the next stage is data pre-processing to ensure that all data is ready for the feature extraction and model training process. This stage consists of three main processes: data selection based on labels, label name conversion, and image normalization.
A total of 30 Kanji character labels were randomly selected from the ETL9G dataset. The selection process was carried out in a controlled manner so that the characters used had a variety of shapes and visual complexity, but remained efficient to process. Only images that matched the 30 labels were retained and processed further. To facilitate the validation and visual evaluation process, all Kanji character labels were then converted into Romaji (phonetic transliteration), as shown in Table 4.
Next, all images were read in grayscale format using the OpenCV library, and normalized to a range of 0–1 values by dividing the pixel intensity by 255. The processed images were then saved into a new directory named “cleaned”, with subfolders grouped according to each character’s Romanji label. Before final storage, the images were converted back to 8-bit grayscale format to maintain compatibility with standard digital image formats.
The final result of the preprocessing process produced a total of 5,700 images ready to be used in the feature extraction stage. A visualization of some of the preprocessing results is shown in Figure 2, which displays 15 Kanji characters randomly in a 3×5 grid format. Each image is labeled with its Romanji to ensure accurate correspondence between the image and the label.
After the data is cleaned, the next stage is feature extraction using the Histogram of Oriented Gradients (HOG) method. This method was chosen because of its ability to capture important visual patterns such as contours, gradient directions, and edge structures, which are very relevant in Kanji character shape recognition [8]. Extraction was performed using the skimage.feature.hog library with the following parameters: orientations = 9, pixels_per_cell = (8, 8), cells_per_block = (2, 2), block_norm = 'L2', transform_sqrt = True. This configuration was chosen to achieve a balance between feature granularity and computational efficiency. With 9 gradient orientations, the features can capture contour directions without excessive noise, while the cell size (8×8) and block size (2×2) provide a sufficiently detailed spatial representation but are not too computationally expensive. This configuration has also been shown to be effective in character recognition tasks, as shown in a study [35].
The result of the feature extraction process is a HOG vector for each image, resulting in a total of 5,700 feature vectors. The visualization of the extraction results is shown in Figure 3, which compares the original image and the HOG extraction results.
The visualization in Figure 3 shows that the HOG feature effectively highlights the edge structure and line direction of Kanji characters. This representation is then used as input in the training process of the classification model with the Decision Tree, Random Forest, KNN, and SVM algorithms. This process is an important foundation in the classification pipeline because the quality of the features will greatly affect the effectiveness of machine learning.
4.3. Training Model and Evaluation
At this stage, the training and evaluation process is carried out on four classic machine learning algorithms: Decision Tree, Random Forest, K-Nearest Neighbor (KNN), and Support Vector Machine (SVM). Unlike conventional approaches that use data division with a fixed ratio (for example 80:20 or 90:10), the evaluation in this study uses the K-Fold Cross Validation method with variations in the value of k = 3, 5, 7, and 10. This approach was chosen because it is able to provide a more stable estimate of model performance, reduce bias due to certain data partitions, and utilize the entire dataset as a whole.
In each iteration of cross-validation, the dataset is divided into k subsets (folds). One subset is used as test data, while the rest are used as training data. This process is repeated k times until each subset has been used as test data. The evaluation results from each fold are then averaged to obtain a more representative final performance metric.
Each model in this study was built using the scikit-learn library according to the configuration in Table 2. The Decision Tree model was implemented using the DecisionTreeClassifier from sklearn.tree with the random_state=42 parameter to ensure consistent replication of the results. Random Forest was implemented through the RandomForestClassifier from sklearn.ensemble, with n_estimators=100 and random_state=42. The K-Nearest Neighbor (KNN) algorithm was tested using the KNeighborsClassifier with various k values, to determine the best k parameter based on cross-validation performance. Meanwhile, the Support Vector Machine (SVM) was implemented using SVC from sklearn.svm with four different kernel types: linear, polynomial, radial basis function (RBF), and sigmoid, to evaluate the effect of kernel type on the effectiveness of Kanji character classification. Performance evaluation is conducted comprehensively using classification metrics such as Accuracy, Precision, Recall, and F1-Score, as well as regression error metrics such as Mean Squared Error (MSE), Mean Absolute Error (MAE), Root Mean Squared Error (RMSE), and Coefficient of Determination (R²). To test the statistical significance of the performance differences between models, a paired t-test is used on the cross-fold accuracy results of each algorithm.
Details of the training and evaluation results of each model will be presented in detail in the following subsections, including a comparison of performance between models and an analysis of the influence of variations in the k value and SVM kernel on prediction accuracy and stability.
4.3.1. Decision Tree
The first model tested in this study is the Decision Tree algorithm, which aims to classify Kanji characters based on visual features that have been extracted using the Histogram of Oriented Gradients (HOG) method. The model implementation is carried out using the DecisionTreeClassifier function from the sklearn.tree library, with the random_state=42 parameter to ensure consistent replication of the results.
To obtain more accurate performance estimates and avoid bias from single data partitions, the K-Fold Cross-Validation technique is used with variations in k values of 3, 5, 7, and 10. Each k value divides the dataset into k subsets (folds), where one subset is used as test data and the rest as training data alternately. Evaluation is performed at each iteration and averaged to obtain a representative metric value. Table 5 presents the average accuracy results of the Decision Tree model for each tested k value.
The highest accuracy value was achieved in the 10-fold configuration, which was 68.23%. Validation with a larger number of folds, such as 10-Fold Cross-Validation, provides more stable and accurate results because more data is used for training in each iteration. With a larger proportion of training data, the Decision Tree model is able to build a more representative classification structure. Therefore, the use of 10-fold is recommended to improve model performance in Kanji character classification, especially on limited datasets with relatively balanced class distributions.
Next, the Decision Tree model is evaluated based on four main metrics, namely accuracy, precision, recall, and F1-score. The results of this evaluation are visualized in Figure 4, which displays the boxplot of the Decision Tree model performance based on the 10-Fold Cross-Validation technique.
Based on the visualization in Figure 4, the average evaluation metrics obtained are as follows: accuracy of 68.23%, precision of 68.48%, recall of 68.38%, and F1-score of 67.68%. These values indicate that the Decision Tree model provides relatively stable and balanced performance in terms of accuracy and completeness.
4.3.2. Random Forest
The second model tested in this study is the Random Forest algorithm, which is a development of the Decision Tree method by building a number of decision trees in parallel and combining the prediction results of each tree to produce a final decision through a majority voting mechanism. This algorithm is implemented using the RandomForestClassifier function from the sklearn.ensemble library, with default parameter settings and random_state=42 to maintain consistency of results.
To evaluate the overall model performance and avoid dependence on one data partition, the K-Fold Cross-Validation technique is used with k values = 3, 5, 7, and 10. In each configuration, the data is divided into k parts, where one part is used for testing and the rest for training in turn. The accuracy values from each iteration are averaged to obtain a representative picture of the model's performance. Table 6 below presents the average results of Random Forest accuracy for each variation of k values.
The best configuration was achieved in 10-Fold Cross-Validation, with the highest accuracy value of 95.01%. Validation with a larger number of folds provides advantages in terms of evaluation stability because the model has a larger proportion of training data in each iteration. This allows the Random Forest model to build a more robust combination of trees and is able to generalize the data well. Therefore, the use of 10-fold validation is recommended to produce optimal performance, especially on the Kanji character classification dataset.
The evaluation of the Random Forest model performance is continued by calculating four main metrics, namely accuracy, precision, recall, and F1-score. The distribution of evaluation results on each fold is visualized in Figure 5, which shows the stability and consistency of model performance in the form of a boxplot based on the 10-Fold Cross-Validation technique.
Based on the visualization results in Figure 5, the average metric values are as follows: accuracy of 95.01%, precision of 95.06%, recall of 95.09%, and F1-score of 94.92%. These results indicate that Random Forest has excellent and consistent performance, and is able to maintain a balance between precision and completeness (recall) in classifying Kanji characters. Its superior performance compared to other models makes this algorithm a strong candidate for use in practical and reliable Kanji character image-based classification applications.
4.3.3. K-Nearest Neighbor (KNN)
Model The third model tested in this study is the K-Nearest Neighbor (KNN) algorithm, an instance-based classification method that determines the class of a test data based on the majority class of its k nearest neighbors in the feature space. The implementation of the algorithm is done using the KNeighborsClassifier function from the sklearn.neighbors library, with the selection of the best k value (number of neighbors) based on the validation results for each data fold configuration.
Performance evaluation is performed using the K-Fold Cross-Validation technique with k values = 3, 5, 7, and 10, in order to obtain accurate estimates and avoid overfitting to certain data subsets. For each k value, the best k is selected based on the highest performance achieved in each validation scenario. Table 7 below presents the average KNN accuracy results and the best k values used in each validation scenario.
The 10-Fold Cross-Validation configuration produces the highest performance with an accuracy value of 92.33% using a value of k = 5. The greater the number of folds in cross-validation, the greater the proportion of training data available in each iteration, so that the model can recognize more accurate neighboring patterns in the feature space. This improves the generalization ability of KNN in handling various variations of Kanji character data. Therefore, 10-fold validation with best k = 5 is recommended for the KNN model in this study.
In addition to accuracy, evaluations were also carried out using three additional metrics, namely precision, recall, and F1-score. Visualization of the model performance distribution on each fold is shown in Figure 6 in the form of a boxplot, illustrating the stability and consistency of the KNN algorithm performance on the 10-fold validation technique.
Based on the visualization in Figure 6, the average values of the metrics are as follows: accuracy 92.33%, precision 92.88%, recall 92.47%, and F1-score 92.26%. These values indicate that the KNN algorithm is able to produce very good and relatively consistent performance in Kanji character classification. The model's ability to recognize feature similarities between characters makes it an effective method, especially when the data has a uniform distribution.
4.3.4. Support Vector Machine (SVM)
The final model evaluated in this study is the Support Vector Machine (SVM) algorithm, a classification method that works by finding the optimal hyperplane that separates data classes in a high-dimensional space. To increase the flexibility of non-linear data separation, various types of kernels are used, namely Sigmoid, Radial Basis Function (RBF), Polynomial (Poly), and Linear. The implementation is carried out using SVC from the sklearn.svm library, with kernel parameter settings according to the variations tested and random_state = 42.
Model evaluation was performed using the K-Fold Cross-Validation technique, using variations of k values = 3, 5, 7, and 10. Each configuration was tested on all four types of kernels, and the average accuracy value was recorded for each combination. The test results are summarized in Table 8 below.
From the results in Table 8, it is known that the best performance is achieved by SVM with a linear kernel in the 10-Fold Cross-Validation configuration, with an accuracy of 97.43%. The linear kernel gives the highest results, indicating that the Kanji character data in the HOG feature space can be optimally separated using a linear boundary. Cross-validation with a larger number of folds contributes to improving model stability and maximizing the amount of training data available in each iteration.
Further evaluation was performed using precision, recall, and F1-score metrics based on the best configuration (linear kernel SVM, 10-fold). The visualization of the distribution of evaluation metrics at each fold is shown in Figure 7 in the form of a boxplot, which illustrates the consistency of the Kanji character classification performance by the SVM model.
Figure 6.
Distribution of Evaluation Metrics SVM.
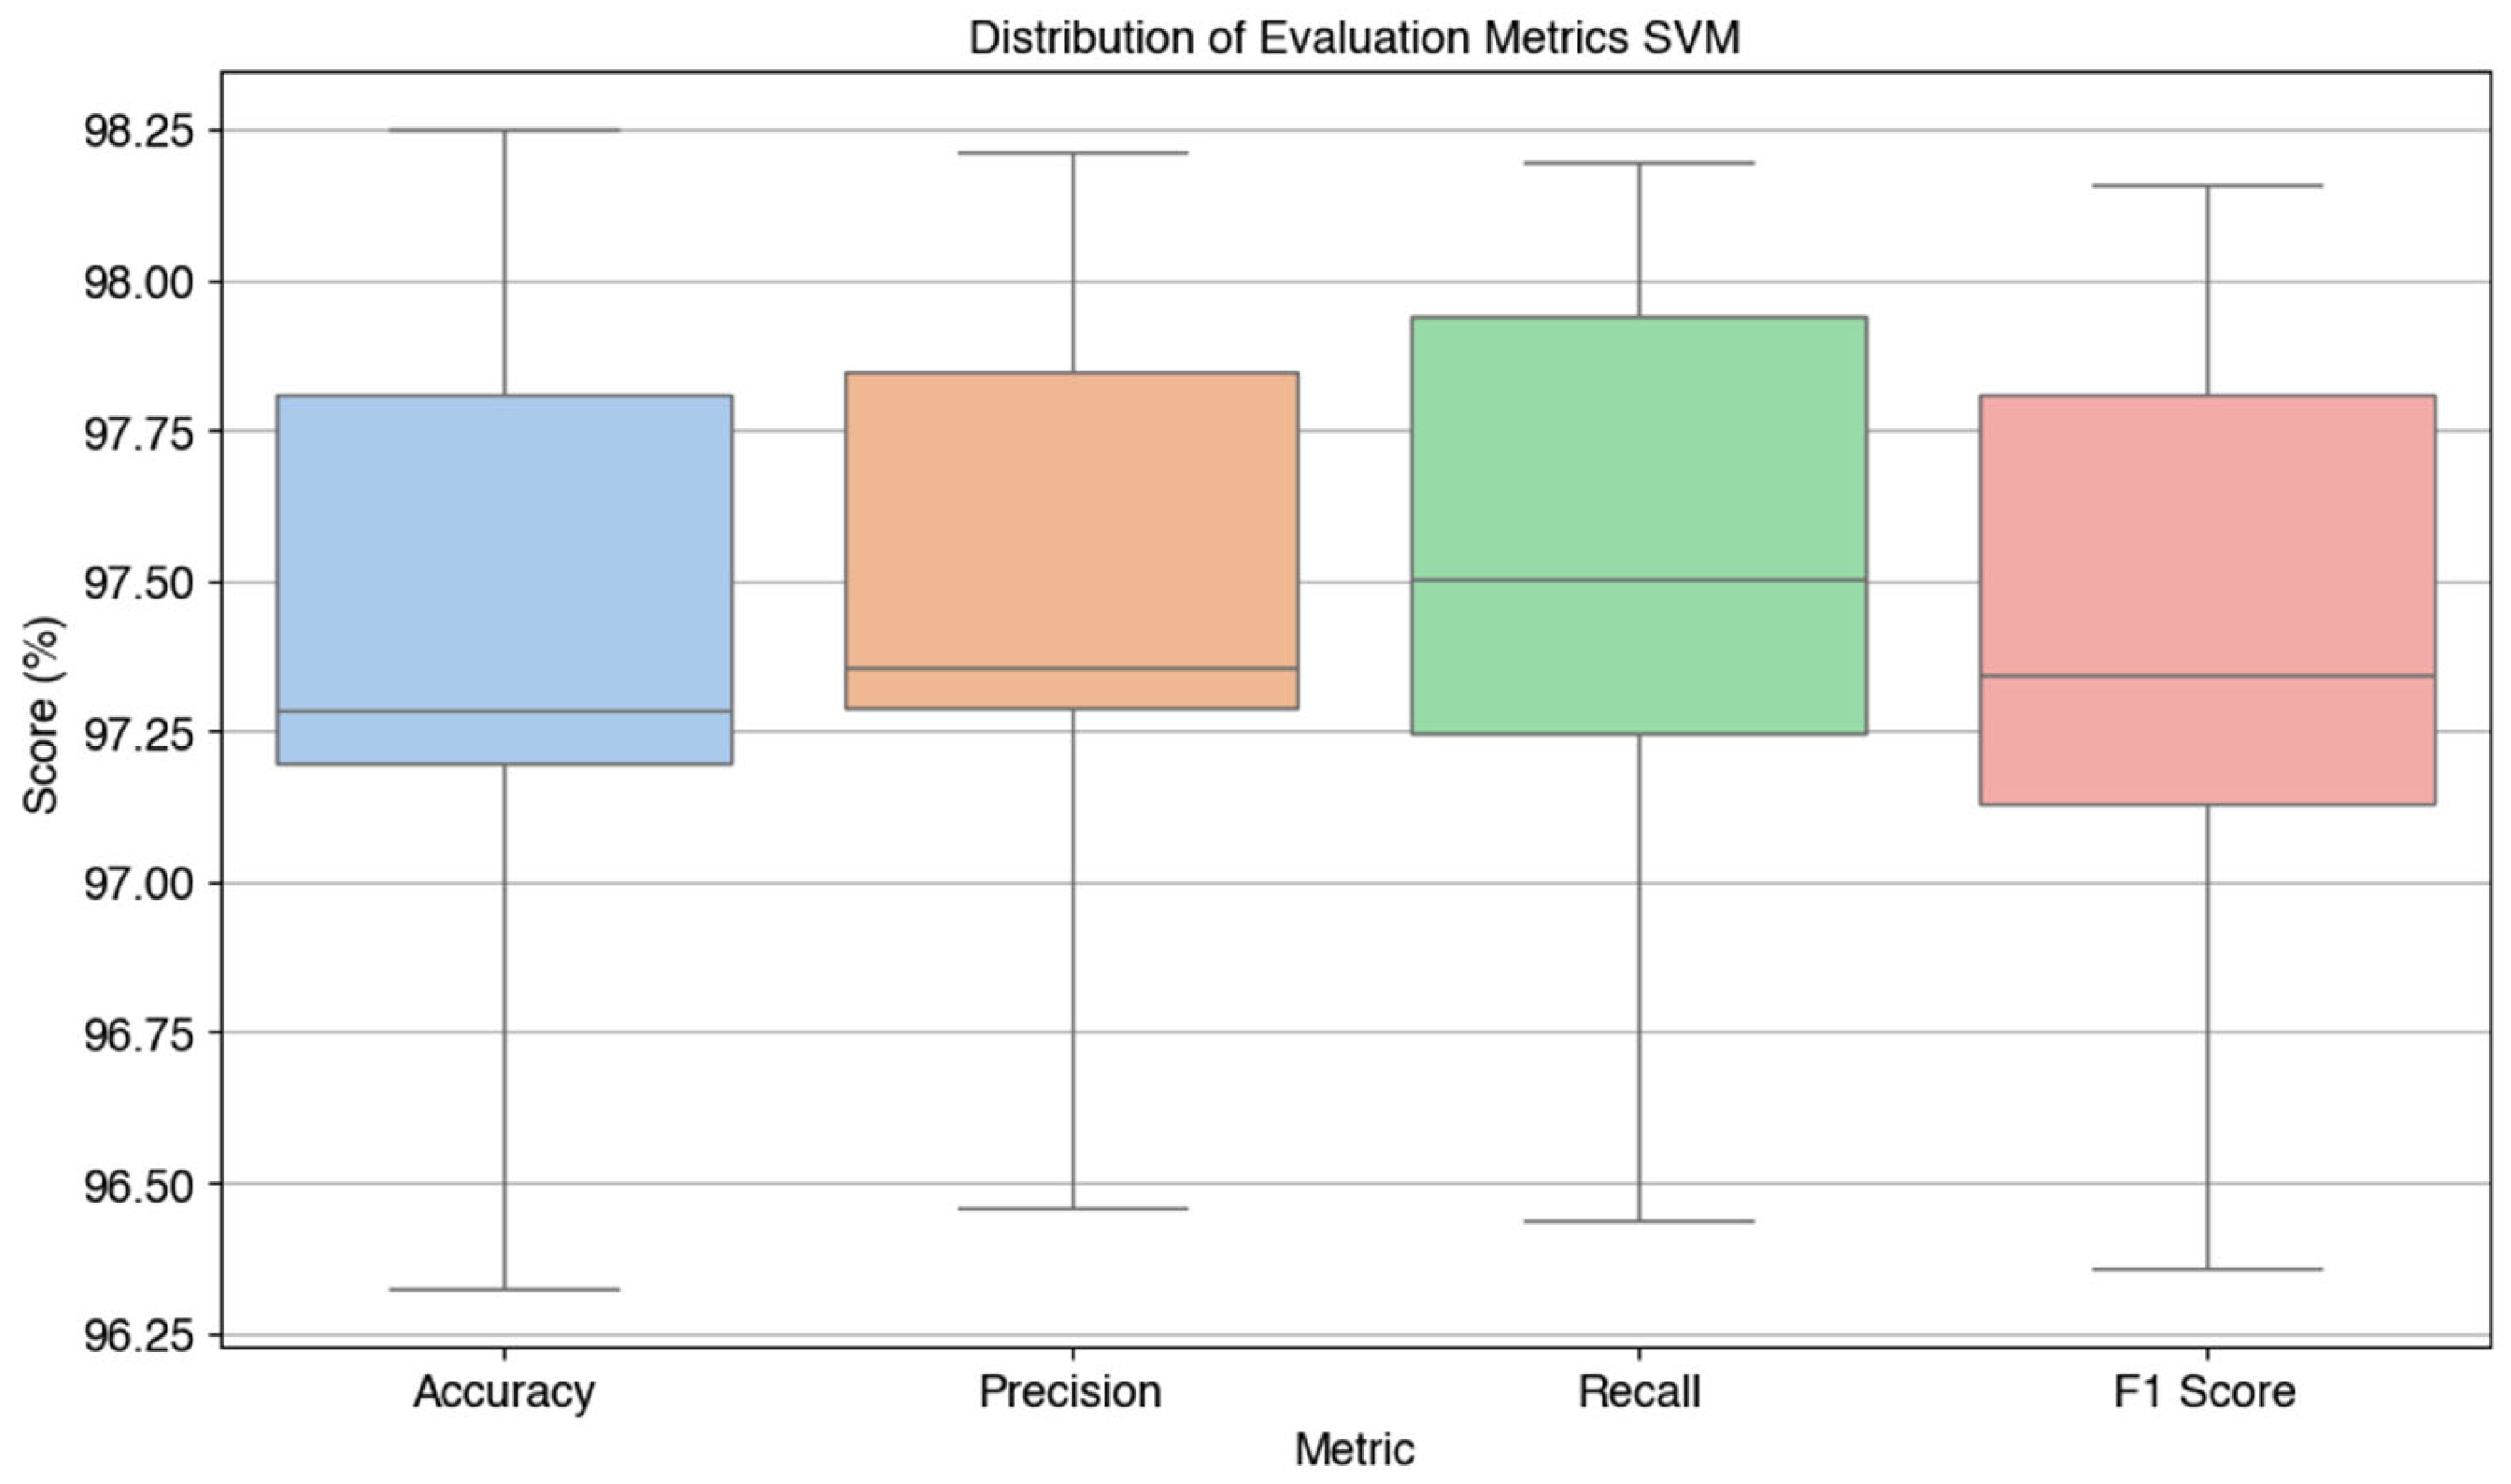
Based on the visualization results in Figure 6, the following average values were obtained: accuracy 97.43%, precision 97.46%, recall 97.50%, and F1-score 97.40%. These values indicate that SVM with linear kernel has the best performance among all tested models, with high stability in all metrics. This proves the effectiveness of the model in handling Kanji character image classification with very high accuracy and precision, making it the main choice in machine learning-based character recognition systems.
4.3.5. Comparison of All Algorithms
This section presents the results of the performance comparison of the four classification algorithms, namely Decision Tree, Random Forest, K-Nearest Neighbor (KNN), and Support Vector Machine (SVM), based on the metrics of accuracy, precision, recall, F1-score, R², MSE, MAE, and RMSE, as well as computational efficiency in the form of training time and model size (Table 9). From the results of the 10-fold cross-validation presented in Table 11, SVM showed the highest accuracy in each fold, followed by Random Forest, KNN, and Decision Tree. In addition, the paired t-test analysis between accuracy and F1-score (Table 10) showed that only in Decision Tree there was a statistically significant difference, while the other three algorithms did not.
Furthermore, a paired t-test to compare the accuracy between algorithms (Table 12) confirmed that all performance differences between models were statistically significant (p < 0.05). Figure 7 presents the confusion matrix of the four models, showing the distribution of correct and incorrect predictions per class. These results will be further analyzed in Section 5 (Discussion) to identify the advantages and disadvantages of each algorithm.

Table 9.
Summary of Evaluation Metrics and Computational Efficiency for Each Algorithm.
| Algorithm | Decision Tree | Random Forest | KNN | SVM |
|---|---|---|---|---|
| Accuracy (%) | 68.23 | 95.01 | 92.33 | 97.43 |
| Precision (%) | 68.48 | 95.06 | 92.88 | 97.46 |
| Recall (%) | 68.38 | 95.09 | 92.47 | 97.50 |
| F1 Score (%) | 67.68 | 94.92 | 92.26 | 97.40 |
| R² Score* (%) | 39.64 | 90.88 | 84.87 | 94.80 |
| MSE* | 45.0657 | 6.8739 | 11.4131 | 3.9011 |
| MAE* | 3.1137 | 0.4855 | 0.7746 | 0.2664 |
| RMSE* | 6.6928 | 2.5994 | 3.3418 | 1.9229 |
| Training Time | 9.4754 s | 18.4549 s | 0.1298 s | 29.7774 s |
| Model Size | 525.37 KB | 62407.43 KB | 174927.65 KB | 110332.96 KB |
* R-squared Score (Coefficient of Determination), MSE (Mean Squared Error), MAE (Mean Absolute Error), RMSE (Root Mean Squared Error).
Table 10.
Paired t-test Results between Accuracy and F1-Score for Each Algorithm.
| Algorithm | T-Statistic | P-Value | Conclusion |
|---|---|---|---|
| Decision Tree | 3.4203 | 0.0076 | Statistically significant difference (p < 0.05) |
| Random Forest | 1.7019 | 0.1230 | No statistically significant difference (p ≥ 0.05) |
| KNN | 0.7763 | 0.4575 | No statistically significant difference (p ≥ 0.05) |
| SVM | 0.7348 | 0.4812 | No statistically significant difference (p ≥ 0.05) |
Table 11.
Accuracy per Fold for Each Algorithm.
| Fold | Decision Tree | Random Forest | KNN | SVM |
|---|---|---|---|---|
| 1 | 0.6848 | 0.9475 | 0.9282 | 0.9807 |
| 2 | 0.6602 | 0.9492 | 0.9212 | 0.9755 |
| 3 | 0.6900 | 0.9650 | 0.9545 | 0.9790 |
| 4 | 0.6655 | 0.9580 | 0.9370 | 0.9720 |
| 5 | 0.6865 | 0.9352 | 0.8897 | 0.9720 |
| 6 | 0.7145 | 0.9615 | 0.9299 | 0.9825 |
| 7 | 0.6480 | 0.9457 | 0.9387 | 0.9737 |
| 8 | 0.6865 | 0.9335 | 0.9159 | 0.9632 |
| 9 | 0.6602 | 0.9475 | 0.8984 | 0.9720 |
| 10 | 0.7268 | 0.9580 | 0.9194 | 0.9720 |
Table 12.
Paired t-test Results for Accuracy Comparison Between Algorithms.
| Algorithm | T-Statistic | P-Value | Conclusion |
|---|---|---|---|
| Decision Tree vs Random Forest | -35.9979 | 0.0000 | Statistically significant difference (p < 0.05) |
| Decision Tree vs KNN | -24.1966 | 0.0000 | Statistically significant difference (p < 0.05) |
| Decision Tree vs SVM | -37.8759 | 0.0000 | Statistically significant difference (p < 0.05) |
| Random Forest vs KNN | 5.9268 | 0.0002 | Statistically significant difference (p < 0.05) |
| Random Forest vs SVM | -9.2665 | 0.0000 | Statistically significant difference (p < 0.05) |
| KNN vs SVM | -9.2433 | 0.0000 | Statistically significant difference (p < 0.05) |
5. Discussion
Considering the aspects of predictive effectiveness and computational efficiency, this study conducts a comparative analysis of four machine learning algorithms: Decision Tree, Random Forest, K-Nearest Neighbor (KNN), and Support Vector Machine (SVM) in the task of Kanji character classification. The evaluation is conducted based on key performance metrics such as accuracy, precision, recall, F1-score, and regression metrics (R², MSE, MAE, RMSE), which are summarized in Table 9. The comparison reveals significant performance variations among the algorithms, which are influenced by model complexity, generalization capacity, and the intrinsic characteristics of the Kanji data used.
The evaluation was conducted using various performance metrics and aspects of computational efficiency. Based on Table 9, the evaluation results show that the SVM algorithm provides the best overall performance with an accuracy value of 97.43%, precision of 97.46%, recall of 97.50%, and F1-score of 97.40%. This model also has the highest R² value of 94.80%, accompanied by the lowest MSE, MAE, and RMSE, indicating that the predictions produced are very close to the actual values in the test data.
However, the superiority of SVM in terms of accuracy and precision must be paid for with relatively large training time and model size (29.78 seconds and 110,332 KB). In contrast, KNN shows the fastest training time (0.13 seconds), but its model size is very large (174,928 KB), because this algorithm stores all training data for nearest neighbor-based prediction. Random Forest appears balanced between high accuracy (95.01%) and more moderate model size compared to KNN and SVM. Meanwhile, Decision Tree shows the lowest performance among the four algorithms, both in terms of accuracy (68.23%) and F1-score (67.68%), despite having a small model size and quite efficient training time.
Furthermore, the evaluation results per fold presented in Table 11 strengthen the superiority of SVM. This model consistently shows high performance on all folds, with an accuracy range of 96.32% to 98.25%. This indicates excellent model stability against variations in data partitions. In contrast, Decision Tree shows quite large performance fluctuations between folds, with the lowest accuracy on the 7th fold (64.80%) and the highest on the 10th fold (72.68%), indicating that this model is more susceptible to varying training data distributions.
The paired t-test statistical test presented in Table 10 shows that only the Decision Tree algorithm has a statistically significant difference between the accuracy and F1-score values (p = 0.0076). This indicates that in this model, there is an imbalance between the number of correct predictions and the quality of classification in the minority class, which can affect the consistency of performance. In contrast, in the Random Forest, KNN, and SVM algorithms, no significant difference was found between the accuracy and F1-score, indicating that these metrics are consistent with each other and the model is able to maintain the balance of classification between classes.
In addition, the results of the t-test between algorithms (Table 12) show that all comparisons provide statistically significant differences (p < 0.05). In particular, the comparison between Decision Tree and other algorithms produces a negative t-statistic value with a very small p value, confirming that Decision Tree significantly outperforms. Comparisons between other algorithms such as Random Forest vs SVM or KNN vs SVM also show that although all show high performance, there are significant differences that cannot be ignored.
The combined confusion matrix visualization presented in Figure 7 visually illustrates the performance of each algorithm on 30 Kanji character classes. SVM shows the most even distribution of predictions and minimal errors between classes, while Decision Tree shows more misclassifications (false positives and false negatives) in certain classes.
Figure 7 shows the Confusion Matrix of the Kanji (漢字) character classification results using four tested algorithms, namely (a) Decision Tree, (b) Random Forest, (c) K-Nearest Neighbor (KNN), and (d) Support Vector Machine (SVM). Based on the visualization and quantitative evaluation results, the SVM model shows the most superior and stable performance in recognizing Kanji characters, with precision and recall approaching 1.00 for most classes such as sa (佐), tei (亭), shita (下), jō (上), jō_2 (場), and ichi (一), reflecting almost perfect classification capabilities. The KNN model also shows high performance on classes such as jō_2 (場), kyū (九), kushi (串), maru (丸), and tan (丹), with f1-scores predominantly above 0.95, but experiences a decline in classes such as san (三), shu (主), and nai (内) due to higher misclassification rates. On the other hand, Random Forest consistently performs very well, especially on characters such as ichi (一), hei_2 (兵), kyū (九), tei (亭), and shita (下), and only experiences a decline in classes man (万) and shichi (七). Meanwhile, the Decision Tree algorithm shows greater variability between classes, with optimal performance on characters such as ichi (一), san (三), tei (亭), and ryō (良), but has difficulty classifying characters such as chū (中), ko (子), maru (丸), man (万), and oka (岡), as indicated by lower f1-score values in the range of 0.50–0.60. This indicates that the Decision Tree model tends to be less reliable in distinguishing Kanji characters that have similar shapes or uneven distributions. Overall, the Confusion Matrix analysis in Figure 7 confirms the finding that SVM is the most accurate algorithm for multiclass classification of Kanji characters (漢字), followed by Random Forest and KNN, while Decision Tree shows the lowest and inconsistent performance between classes.
Overall, the results of this study support that SVM is the best algorithm choice for Kanji character classification in the context of the dataset used, considering its consistency, high accuracy, and stability between folds. However, consideration of computational resources remains important, especially in real implementation scenarios, so the choice of algorithm must be adjusted to the needs of the system.
As a form of external validation of the research results, a comparison was made with a number of previous studies that also focused on the classification of Kanji characters and Japanese characters in general. Table 13 summarizes the evaluation results of several previous studies, including the methods used and the reported evaluation values such as accuracy, precision, recall, and F1-score. The main purpose of this comparison is to place the performance of the SVM model used in this study in a broader context, as well as to identify its strengths and limitations compared to other approaches that have been applied to similar problems.
When compared to various methods in previous literature, the results of this study place SVM as a superior approach in terms of accuracy, precision, recall, and overall F1-score. The model used shows the best performance compared to other models, such as CNN-SVM [11], CNN ensemble [12], as well as various combinations of classical algorithms such as KNN and Random Forest, which are used in research [10]. Meanwhile, synthetic data-based methods such as Y-AE [14] shows potential in improving F1-score, even without clear accuracy information.
These findings strengthen the hypothesis that SVM, with proper parameterization and features (in this case HOG features), is very effective for Kanji character classification, especially when the available data is representative enough. Although deep learning methods such as CNN have great potential, the advantages of SVM lie in its stable performance and computational efficiency, which makes it very relevant in resource-constrained systems.
These results indicate that the SVM method in this study is a practical and superior approach for Kanji character classification based on image features. This study provides a comparative analysis of supervised machine learning algorithms, including Decision Tree, Random Forest, K-Nearest Neighbors, and Support Vector Machine, using Histogram of Oriented Gradients (HOG) features to classify 30 randomly selected Kanji characters from the ETL9G dataset. Unlike previous studies that mainly use deep learning approaches, this study explores a lightweight and interpretable model that is suitable for environments with limited computing resources. Experimental results show that SVM with a linear kernel provides the highest accuracy, and the HOG feature effectively represents the complex visual structure of characters. This study offers a useful empirical benchmark as a basis for future research in logographic character recognition.
For further research, hybrid approaches such as integrating SVM with deep learning-based feature extraction methods, or applying data augmentation based on generative models such as Y-AE, could be interesting directions to explore further. In addition, applying to more complex and larger datasets will be a challenge as well as an opportunity to assess the generalization of the SVM model in the context of broad Kanji character recognition.
6. Conclusions
This study has conducted a comparative study of four machine learning algorithms, namely Decision Tree, Random Forest, K-Nearest Neighbor (KNN), and Support Vector Machine (SVM), in the classification of Kanji characters based on the Histogram of Oriented Gradients (HOG) feature. The results of a comprehensive evaluation show that the SVM algorithm provides the best performance with an accuracy of 97.43%, a precision of 97.46%, a recall of 97.50%, and an F1-score of 97.40%. This model also recorded the highest R² value and the lowest error among all algorithms, indicating excellent predictive ability and high performance stability in each test fold.
The superiority of SVM in Kanji character classification is also strengthened by the confusion matrix analysis, which shows an even distribution of predictions and minimal classification errors between classes. Although it requires a larger training time and model size than other algorithms, high consistency and accuracy make SVM a reliable algorithm choice, especially in character classification applications with high complexity.
In contrast, the Decision Tree algorithm shows the lowest and most unstable performance, especially on Kanji characters with similar or imbalanced shape distributions. KNN stands out in terms of training time efficiency, but has the largest model size. Meanwhile, Random Forest performs well with high accuracy and more moderate computational complexity.
Comparison with several previous studies shows that the SVM approach used in this study is superior in terms of predictive effectiveness compared to other models such as CNN-SVM, Ensemble CNN, and other classical method combinations. This shows that with the right combination of features and optimal parameterization, conventional algorithms such as SVM can still compete even with deep learning approaches in character classification tasks.
As a practical implication, SVM model with HOG features can be an efficient and accurate solution in Kanji character recognition, especially in systems with limited computing resources. For further research directions, it is recommended to explore a hybrid approach between SVM and deep learning-based feature extraction methods, as well as the application of data augmentation techniques such as generative models (e.g. Y-AE), to improve the generalization of the model on larger and more diverse datasets.
For future research, several directions are recommended to address these limitations. First, applying transfer learning techniques using pre-trained deep learning models can improve feature representation and classification performance, especially on larger and more diverse datasets. Second, hybrid models combining classical feature extraction (such as HOG) with deep learning architectures can leverage the strengths of both approaches. Third, expanding the dataset to include multilingual logographic characters and evaluating the robustness of the model on noisy real-world data will provide valuable insights for practical applications. Finally, combining detailed error analysis and interpretability methods can help identify and address specific challenges in Kanji character recognition, further improving the reliability and usability of the model.
Author Contributions
Conceptualization, Dede Kurniadi and Asri Mulyani; methodology, Dede Kurniadi; software, Nurcinta Asih; validation, Dede Kurniadi, Asri Mulyani and Nurcinta Asih; formal analysis, Asri Mulyani; investigation, Dede Kurniadi and Nurcinta Asih; resources, Asri Mulyani and Nurcinta Asih; data curation, Nurcinta Asih; writing—original draft preparation, Dede Kurniadi, Asri Mulyani and Nurcinta Asih; writing—review and editing, Dede Kurniadi; visualization, Dede Kurniadi and Nurcinta Asih; supervision, Dede Kurniadi; project administration, Asri Mulyani; funding acquisition, Dede Kurniadi and Asri Mulyani All authors have read and agreed to the published version of the manuscript.
Funding
This research received no external funding.
Institutional Review Board Statement
Not applicable.
Informed Consent Statement
Not applicable.
Data Availability Statement
The dataset used in this study is publicly available on Kaggle at the following link: https://www.kaggle.com/datasets/votrancong/etl9g-images-processed-96x96. The authors selected a subset of 30 Kanji characters from this dataset and applied preprocessing for feature extraction using the HOG method. The processed dataset is available from the corresponding author upon reasonable request.
Conflicts of Interest
The authors declare no conflicts of interest.
Abbreviations
| HOG | Histogram of Oriented Gradients |
| DT | Decision Tree |
| RF | Random Forest |
| SVM | Support Vector Machine |
| KNN | K-Nearest Neighbor |
| ELT9G | Japanese Kanji Dataset (ETL Character Database) |
| MSE | Mean Squared Error |
| MAE | Mean Absolute Error |
| RMSE | Root Mean Squared Error |
| R² Score | Coefficient of Determination |
References
- M. M. Sarinanto, Analisis kebutuhan pelatihan kerja luar negeri tahun 2023. 2023.
- A. D. Sembada, D. Prasetyo, and Y. Yarmanto, “Motivasi Calon Pekerja Migran Indonesia Bekerja ke Luar Negeri dan Kontribusinya Bagi Negara Indonesia,” Metta J. Ilmu Multidisiplin, vol. 4, no. 2, pp. 45–54, 2024. [CrossRef]
- F. O. Feranda and D. Yani, “Analisis Penyebab Kesulitan Belajar Kanji Mahasiswa Prodi Pendidikan Bahasa Jepang Universitas Negeri Padang,” Omi. J. Bhs. dan Pembelajaran Bhs. Jepang, vol. 5, no. 1, pp. 109–119, 2022. [CrossRef]
- I. Fitriani and P. Y. Ginanjar, “Strategi dalam Meminimalisir Kesulitan Pembelajaran Kanji,” Izumi, vol. 11, no. 2, pp. 236–247, 2022. [CrossRef]
- A. T. Imam, A. Alhroob, and W. J. Alzyadat, “SVM Machine Learning Classifier to Automate the Extraction of SRS Elements,” Int. J. Adv. Comput. Sci. Appl., vol. 12, no. 3, pp. 174–185, 2021. [CrossRef]
- A. Wani, U. Pawar, Y. Gatagat, and M. Thalor, “Handwritten Character Recognition Using CNN, KNN and SVM,” Int. J. Technol. Eng. Arts Math. Sci., vol. 1, no. 2, pp. 2583–1224, 2021.
- T. N. Ngo, Q. Van Nong, and M. D. Ngo, “Recognition of Handwritten Numbers Using Machine Learning and Deep Learning,” vol. 7, no. 01, pp. 315–319, 2025. [CrossRef]
- R. K. Wati and H. Irsyad, “Pengenalan Aksara Arab Menggunakan Metode JST Dengan Fitur HOG Dan LBP,” J. Algoritm., vol. 2, no. 1, pp. 39–54, 2021.
- A. I. Solis, J. Zarkovacki, J. Ly, and A. Atyabi, “Recognition of Handwritten Japanese Characters Using Ensemble of Convolutional Neural Networks,” 2023, [Online]. Available: http://arxiv.org/abs/2306.03954.
- M. A. Amrustian, V. F. Muliati, and E. E. Awal, “Studi Komparasi Metode Machine Learning untuk Klasifikasi Citra Huruf Vokal Hiragana,” J. Media Inform. Budidarma, vol. 5, no. 3, p. 905, 2021. [CrossRef]
- W. Nugroho and A. Harjoko, “Transliteration of Hiragana and Katakana Handwritten Characters Using CNN-SVM,” IJCCS (Indonesian J. Comput. Cybern. Syst., vol. 15, no. 3, p. 221, 2021. [CrossRef]
- S. Pandkar, K. Sabane, S. Rathod, P. Bansode, and S. Deore, “Handwritten Japanese Kanji Character Recognition using different Pruning Algorithm,” 15th Int. Conf. Adv. Comput. Control. Telecommun. Technol. ACT 2024, vol. 2, pp. 1040–1046, 2024.
- P. Annisa, Z. A. Gultom, and Y. Sary, “Analysis and Implementation of CNN in Real- time Classification and Translation of Kanji Characters,” Sinkron, vol. 9, no. 1, pp. 296–305, 2024. [CrossRef]
- T. Kitagawa, C. S. Leow, and H. Nishizaki, “Handwritten Character Generation using Y-Autoencoder for Character Recognition Model Training,” 2022 Lang. Resour. Eval. Conf. Lr. 2022, no. June, pp. 7344–7351, 2022.
- A. Aprilia, E. S. Putri Fatikah, and T. Muhtarom, “Studi Komparasi Pendidikan Karakter di Negara Indonesia Dan Negara Jepang,” vol. 4, no. 2, pp. 64–71, 2024.
- A. R. Azis, “Analisis Komparasi Algoritma Machine Learning dalam Prediksi Performa Akademik Mahasiswa : Literature Review,” vol. 4, no. 2, pp. 143–150, 2024.
- Hartono, Modul Digital Machine Learning Panduan Praktis dan Sistematis Belajar Machine Learning, no. 1. 2021.
- I. C. Sutrisno, A. A. S. U. Hasanah, and Y. I. Febiola, Ai, Machine Learning & Deep Learning ( Teori & Implementasi ). 2021.
- Z. Jin, J. Shang, Q. Zhu, C. Ling, W. Xie, and B. Qiang, “RFRSF: Employee Turnover Prediction Based on Random Forests and Survival Analysis,” Lect. Notes Comput. Sci. (including Subser. Lect. Notes Artif. Intell. Lect. Notes Bioinformatics), vol. 12343 LNCS, pp. 503–515, 2020. [CrossRef]
- O. B. Ayoade, S. Shahrestani, and C. Ruan, “Machine Learning and Deep Learning Approaches for Predicting Diabetes Progression : A Comparative Analysis,” no. Dm, pp. 1–38, 2025.
- N. F. Munazhif, G. J. Yanris, and M. N. S. Hasibuan, “Implementation of the K-Nearest Neighbor (kNN) Method to Determine Outstanding Student Classes,” SinkrOn, vol. 8, no. 2, pp. 719–732, 2023. [CrossRef]
- F. Riandari, T. Sihotang, T. Tarigan, and M. Rafli, “Classification of Book Types Using the Support Vector Machine (SVM) Method,” J. Mantik, vol. 6, no. 1, pp. 43–49, 2022.
- M. A. M. Hasan, J. Shin, and M. Maniruzzaman, “Online Kanji Characters Based Writer Identification Using Sequential Forward Floating Selection and Support Vector Machine,” Appl. Sci., vol. 12, no. 20, 2022. [CrossRef]
- A. G. Sooai, U. Katolik, and W. Mandira, “Exkstaksi Fitur Book Teaser-compressed,” no. January, 2024.
- Z. Yang, J. Zhang, Z. Li, N. Hu, and Z. Qi, “Pears Internal Quality Inspection Based on X-Ray Imaging and Multi-Criteria Decision Fusion Model,” pp. 1–25, 2025.
- A. Misra, M. A. A. Abdelgawad, P. Jing, and R. C. C. Cheung, Randomized tensor decomposition using parallel reconfigurable systems. Springer US, 2025. [CrossRef]
- G. H. Limantoro and Y. D. Atma, “Multidisciplinary Sciences and Arts History of Japanese Writing System ; From Kanji Into Hiragana International Journal of,” vol. 3, no. 4, pp. 96–102, 2024.
- T. Kalay, “The Connotations of Japanese Words Written in Kanji Alphabet : A ‘ Color ’ Ful Representation,” no. August 2021, 2024.
- S. Bias, “TRACE : Tennessee Research and Creative Exchange Learning Japanese in Comparison to Romantic and Germanic Languages Learning,” 2021.
- I. D. Id, “Machine Learning : Teori , Studi Kasus dan Implementasi Menggunakan Python,” no. July, 2021. [CrossRef]
- J. Kim and D. Lee, “Comparative Study on Hyperparameter Tuning for Predicting Concrete Compressive Strength,” pp. 1–16, 2025.
- V. Rusyn, A. Boichuk, and L. Mochurad, “Cross-Language Transfer-Learning Approach via a Pretrained Preact ResNet-18 Architecture for Improving Kanji Recognition Accuracy and Enhancing a Number of Recognizable Kanji,” Appl. Sci., vol. 15, no. 9, 2025. [CrossRef]
- W. E. Rose et al., “Genetic Correlates of Synergy Mechanisms of Daptomycin Plus Fosfomycin in Daptomycin-Susceptible and -Resistant Methicillin-Resistant Staphylococcus aureus ( MRSA ),” pp. 1–12, 2025.
- I. Daqiqil, “Machine Learning : Teori , Studi Kasus dan Implementasi Menggunakan Python,” no. July, 2021. [CrossRef]
- S. R. Bhowmik and M. M. Rahman, “Bangla Handwritten Word Recognition using HOG And CNN,” 2021.
Figure 1.
Research Flow.

Figure 2.
Sample Kanji dataset.
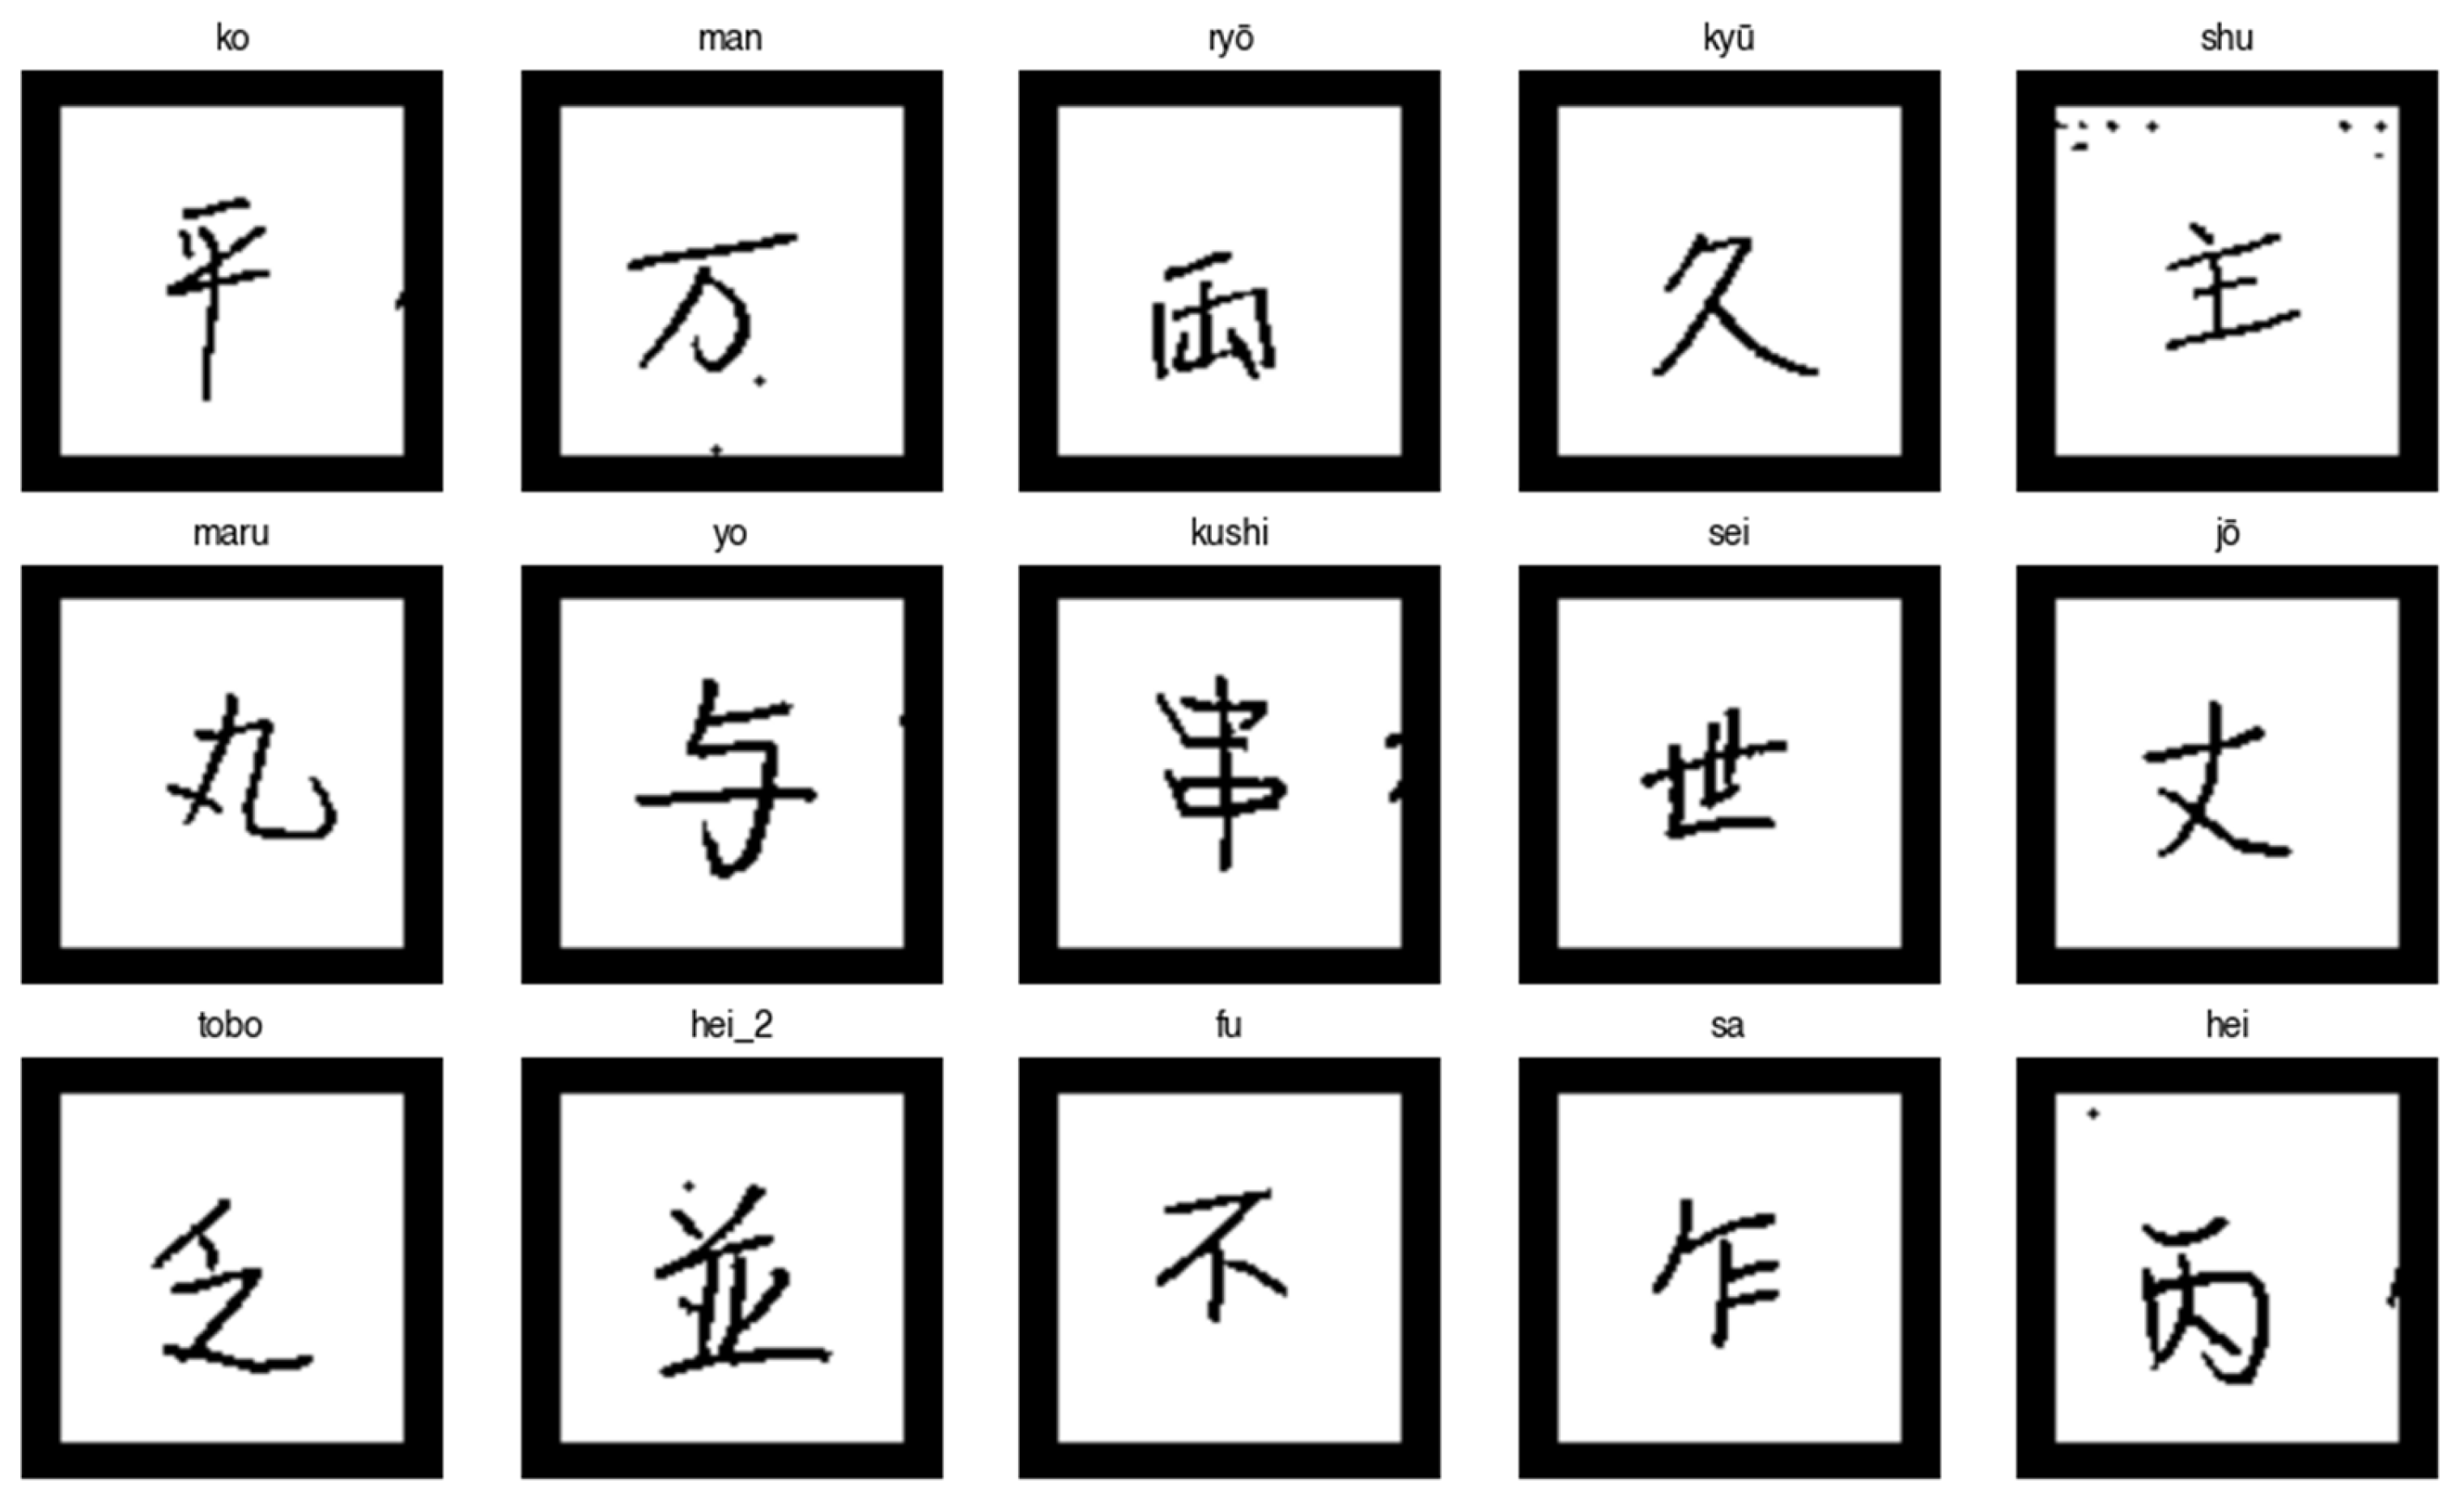
Figure 3.
(a) Original image (b) After HOG Feature extraction.

Figure 4.
Distribution of Evaluation Metrics Decision Tree.
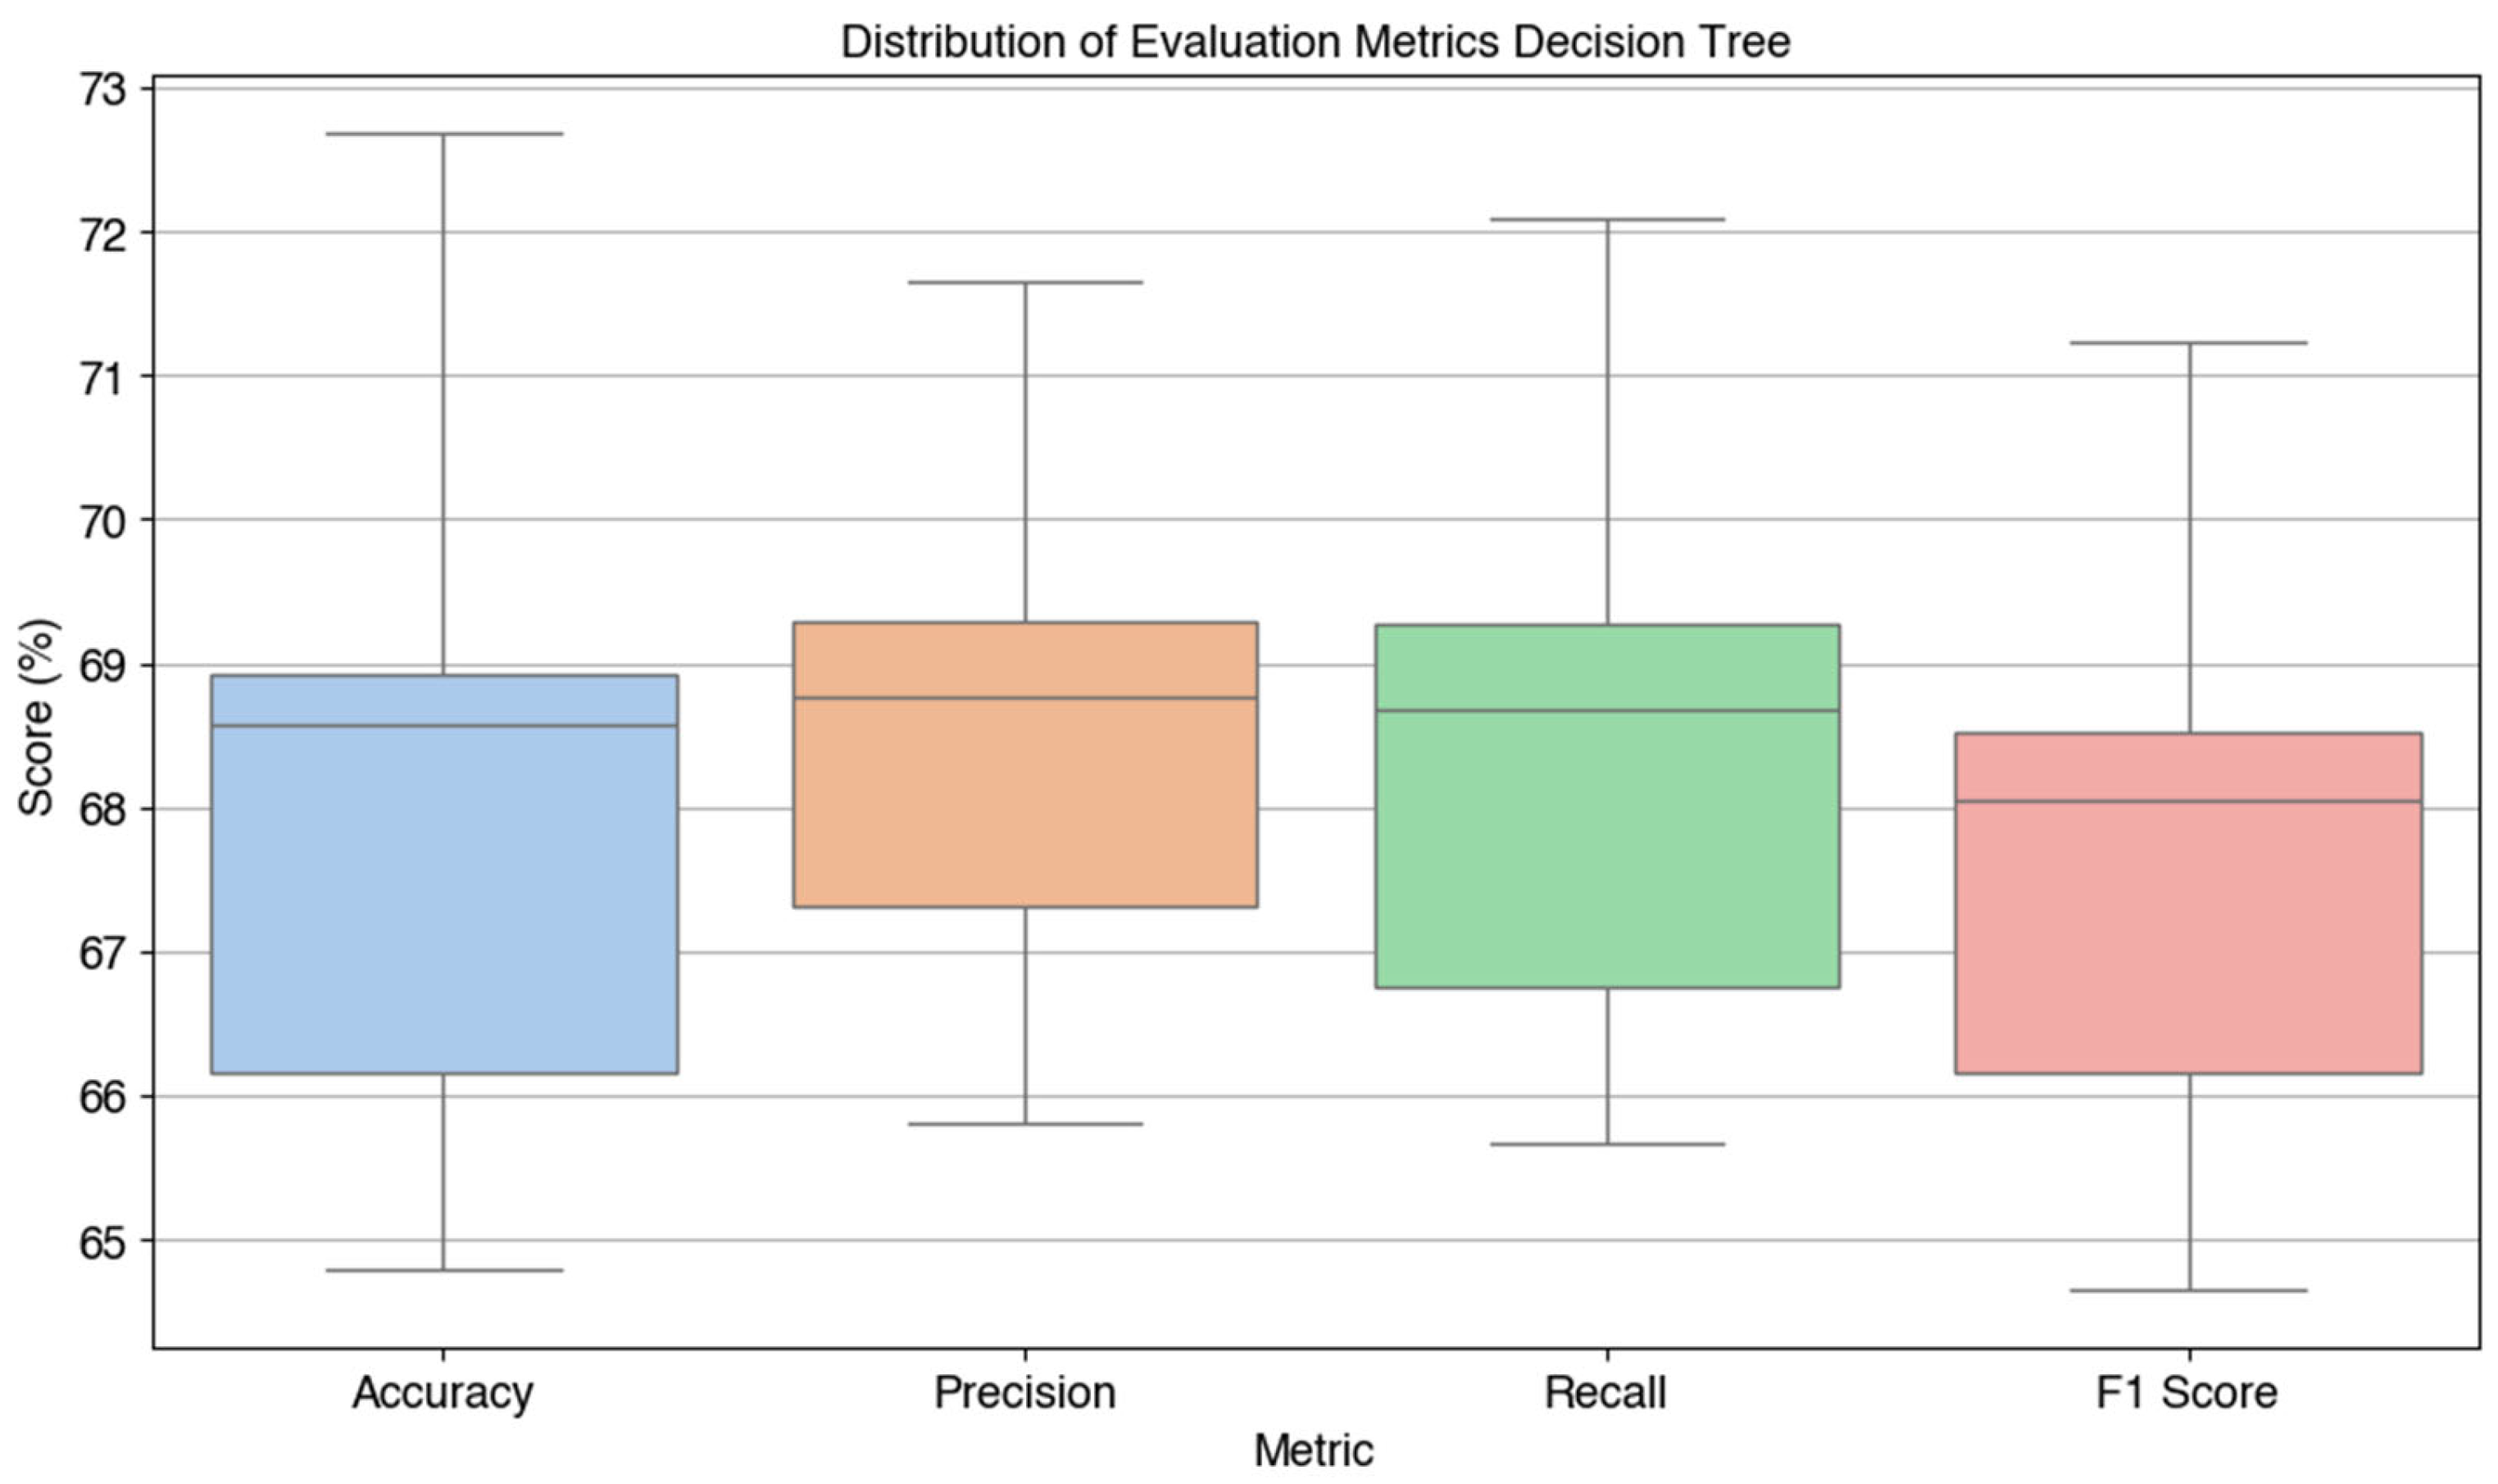
Figure 5.
Distribution of Evaluation Metrics Random Forest.
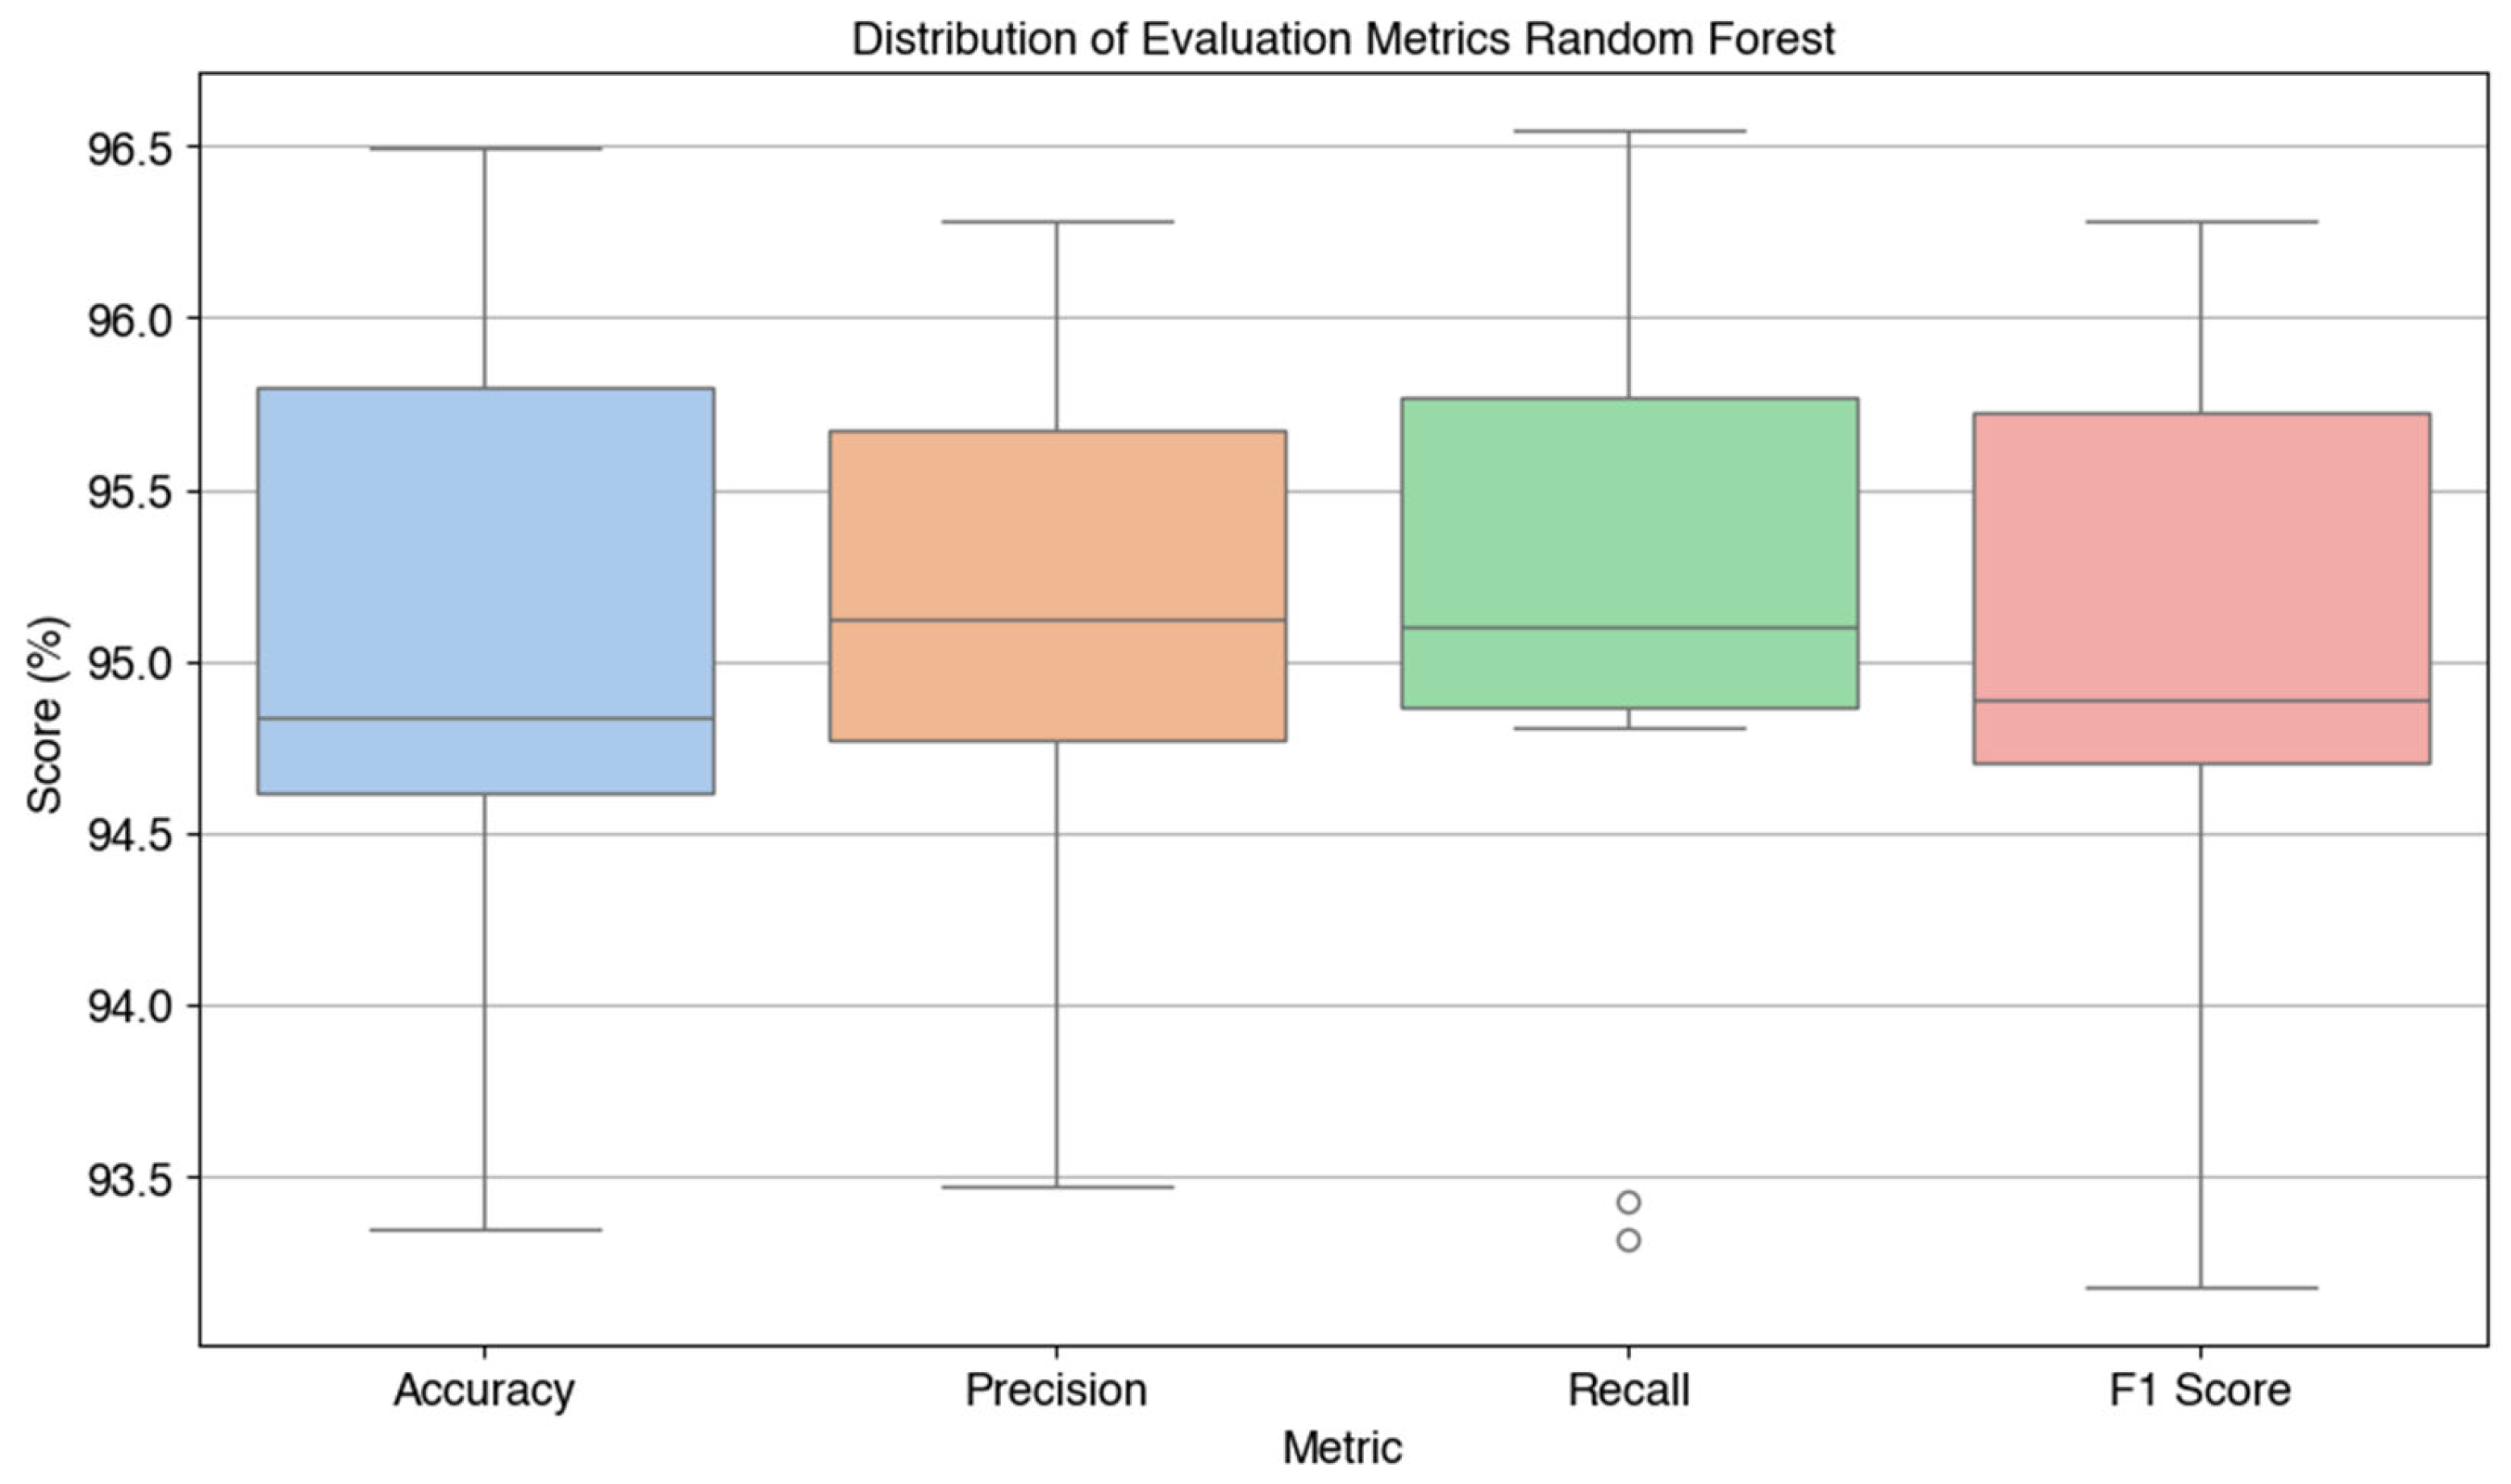
Figure 6.
Distribution of Evaluation Metrics KNN.
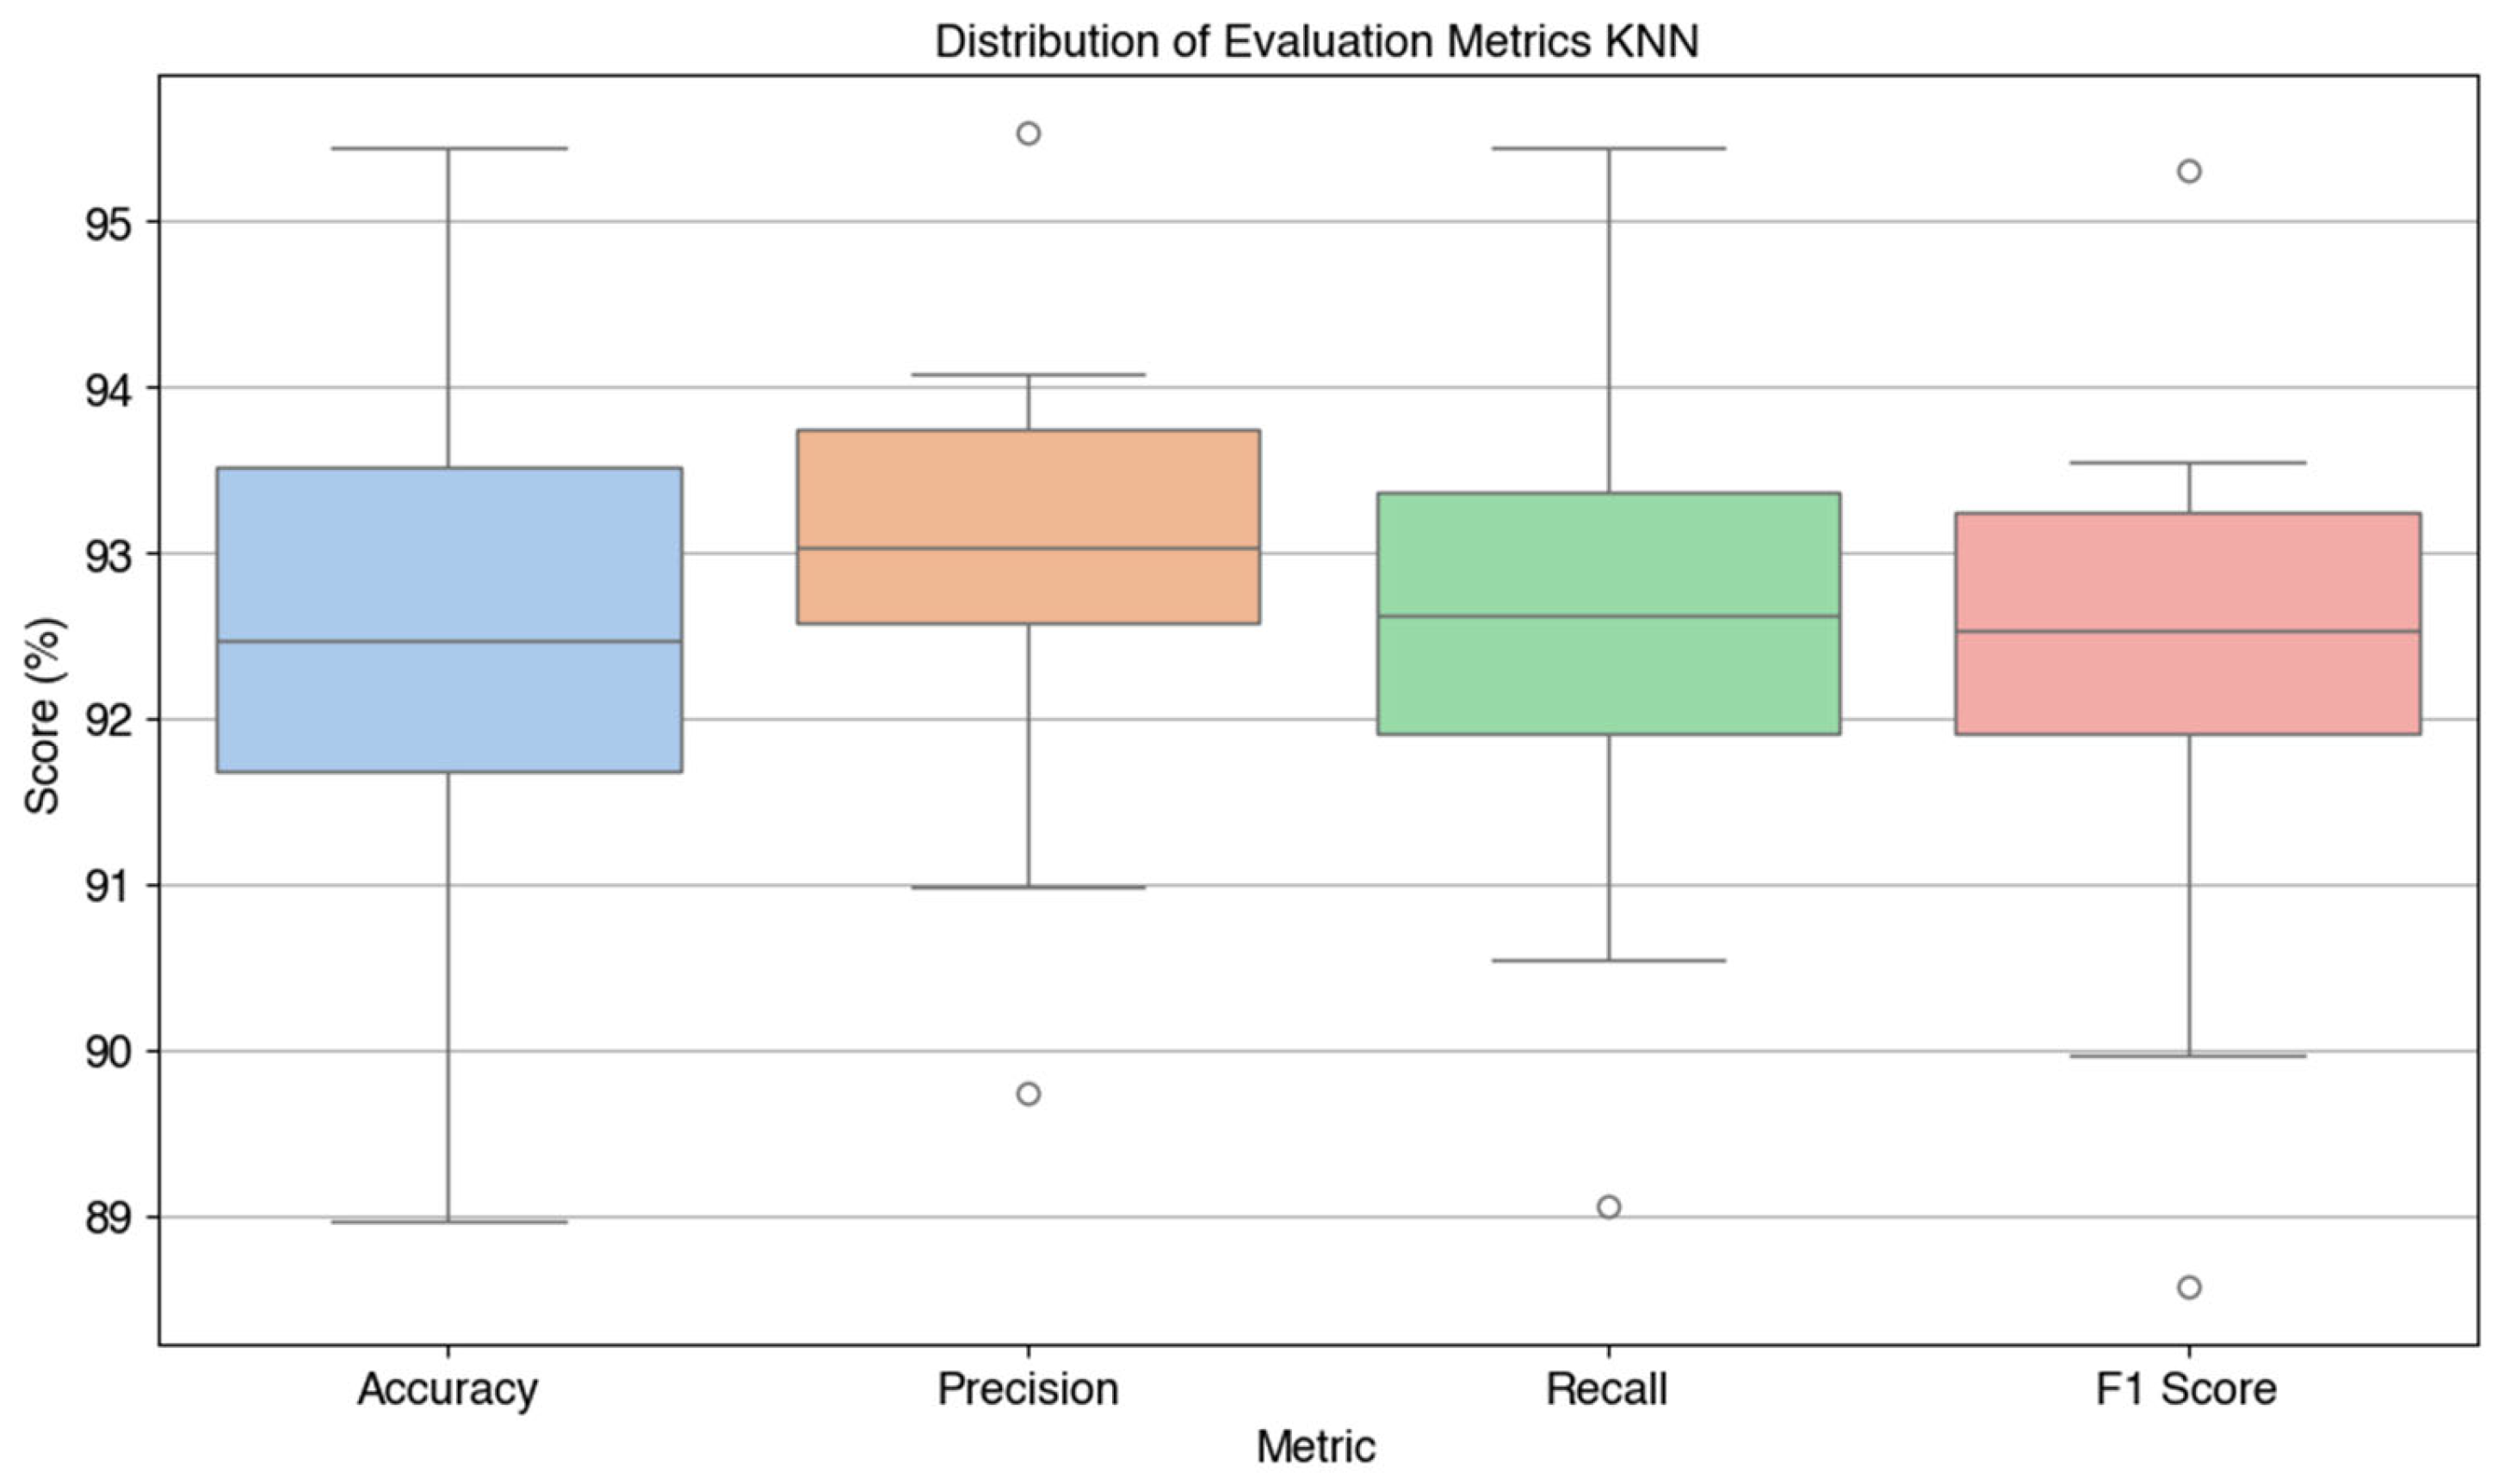
Figure 7.
Confusion Matrix (a) Decision Tree, (b) Random Forest, (c) KNN, (d) SVM.
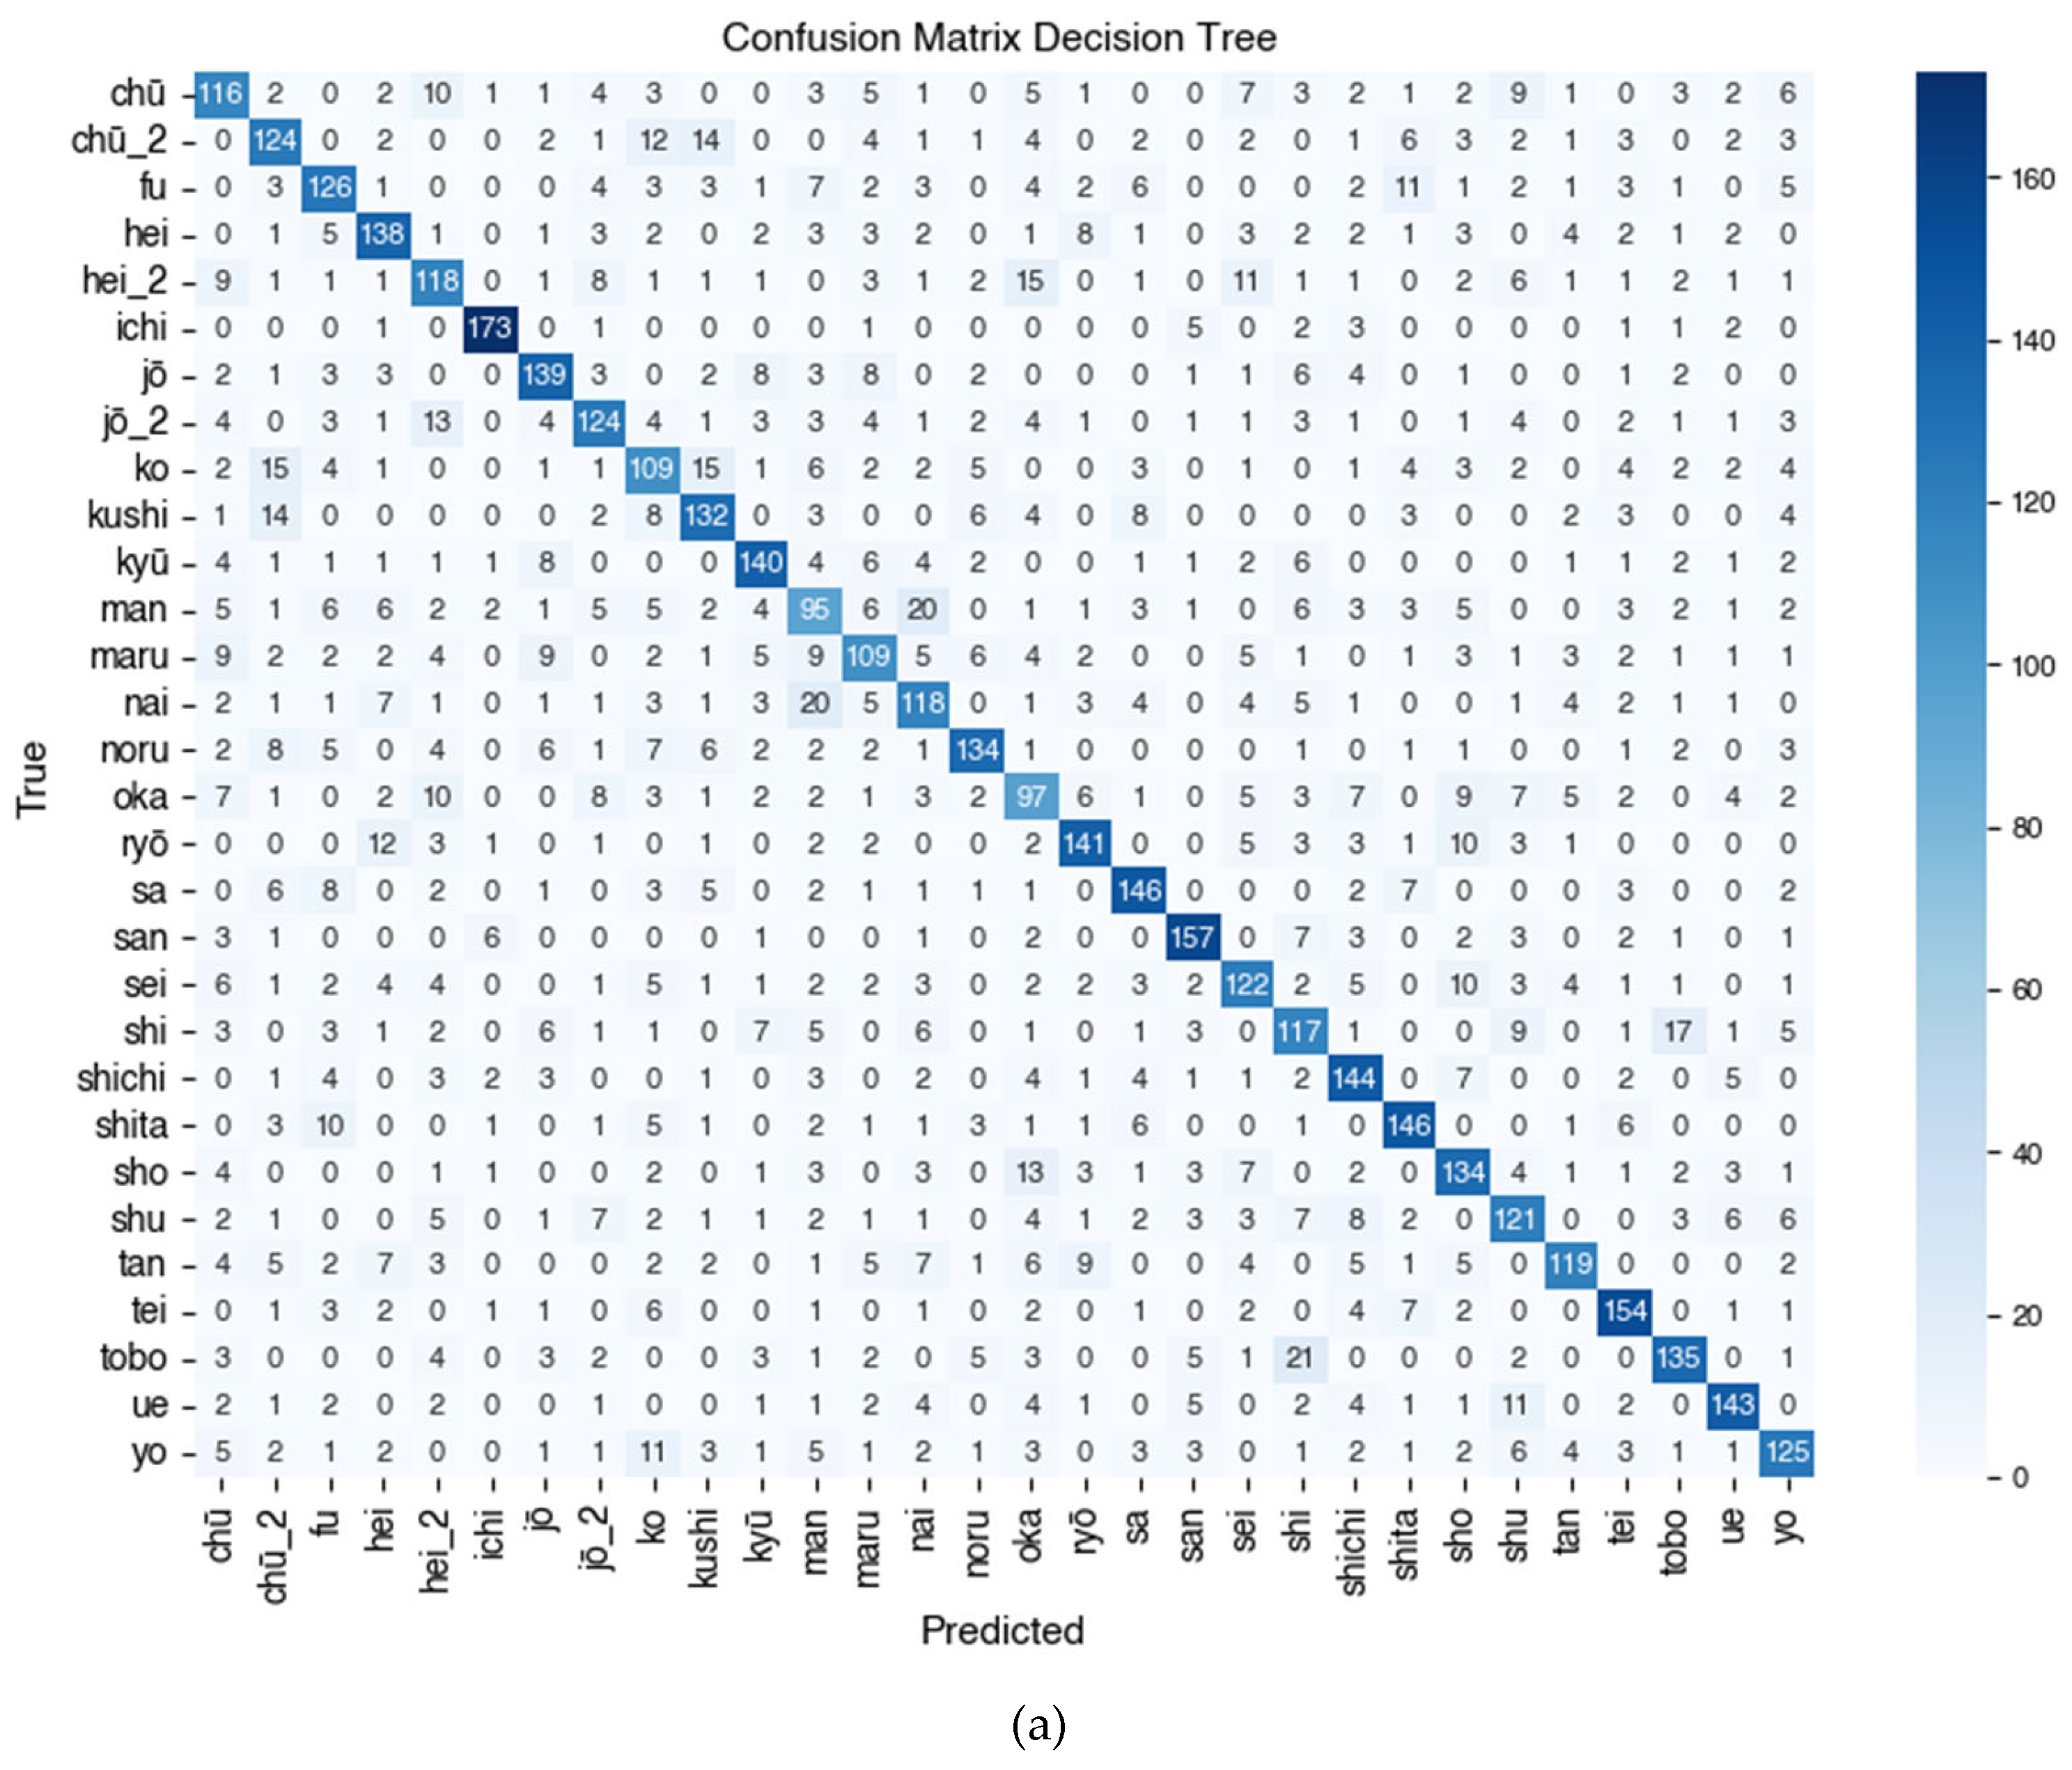
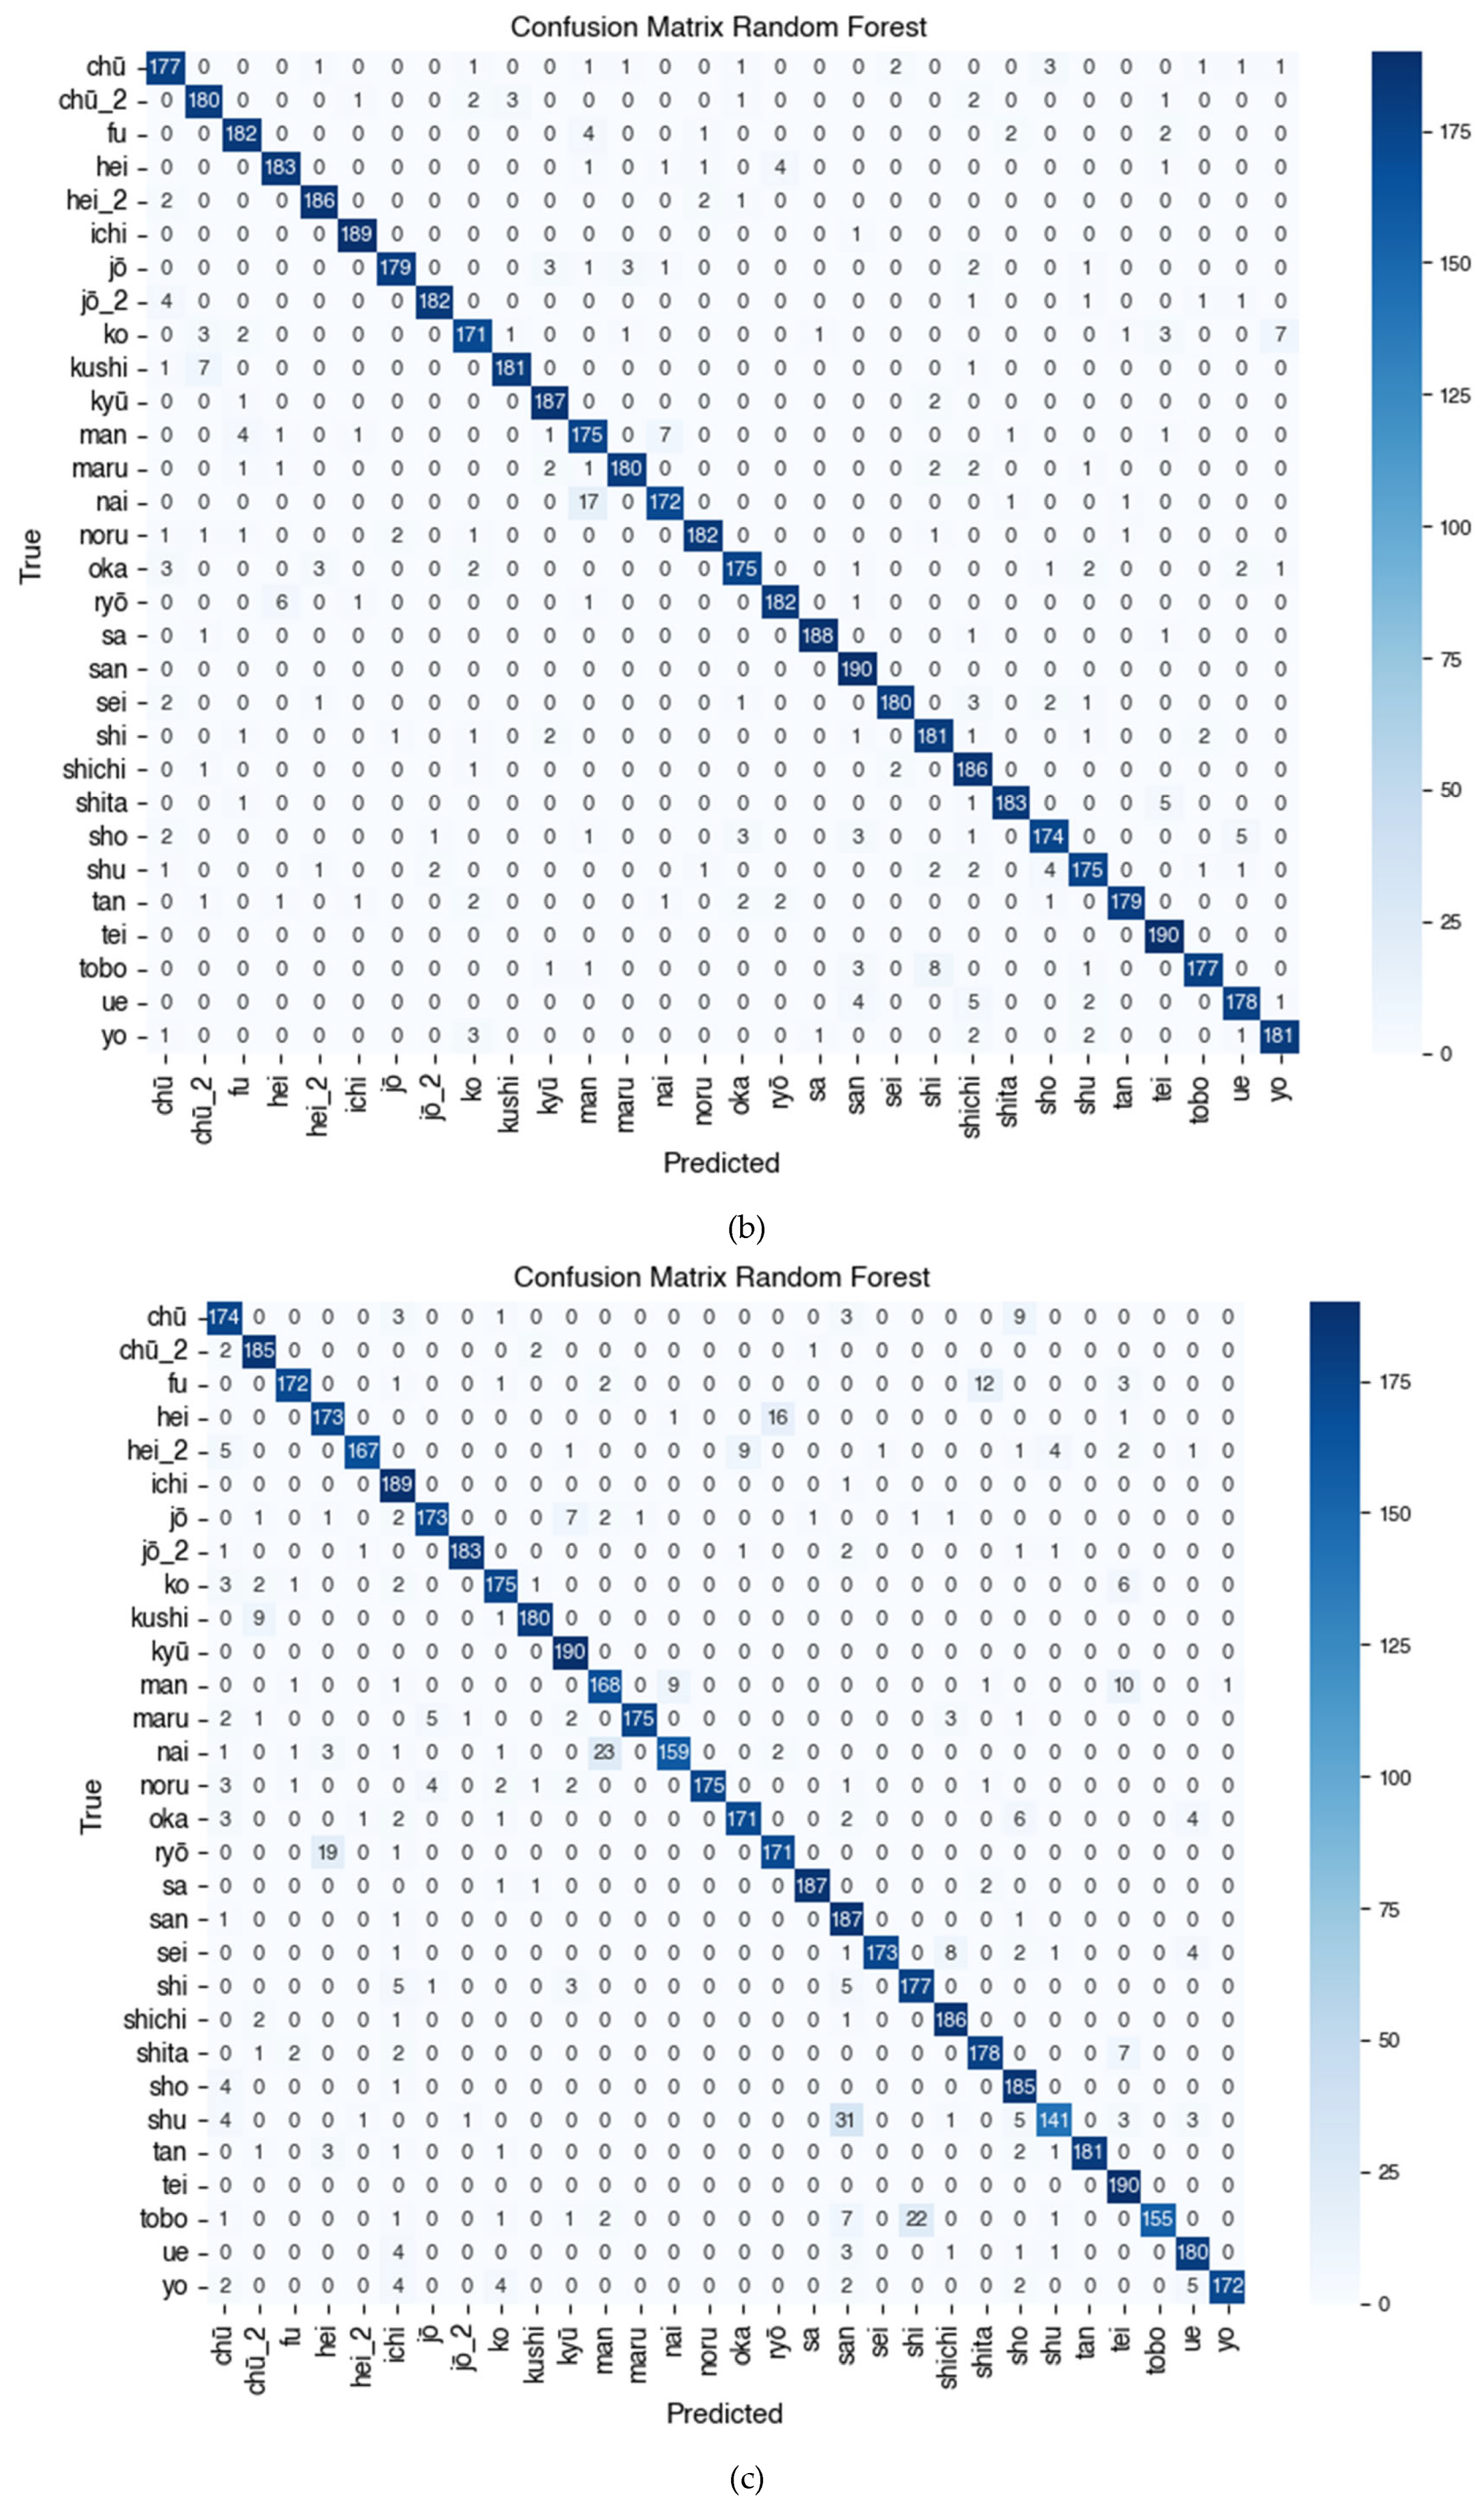
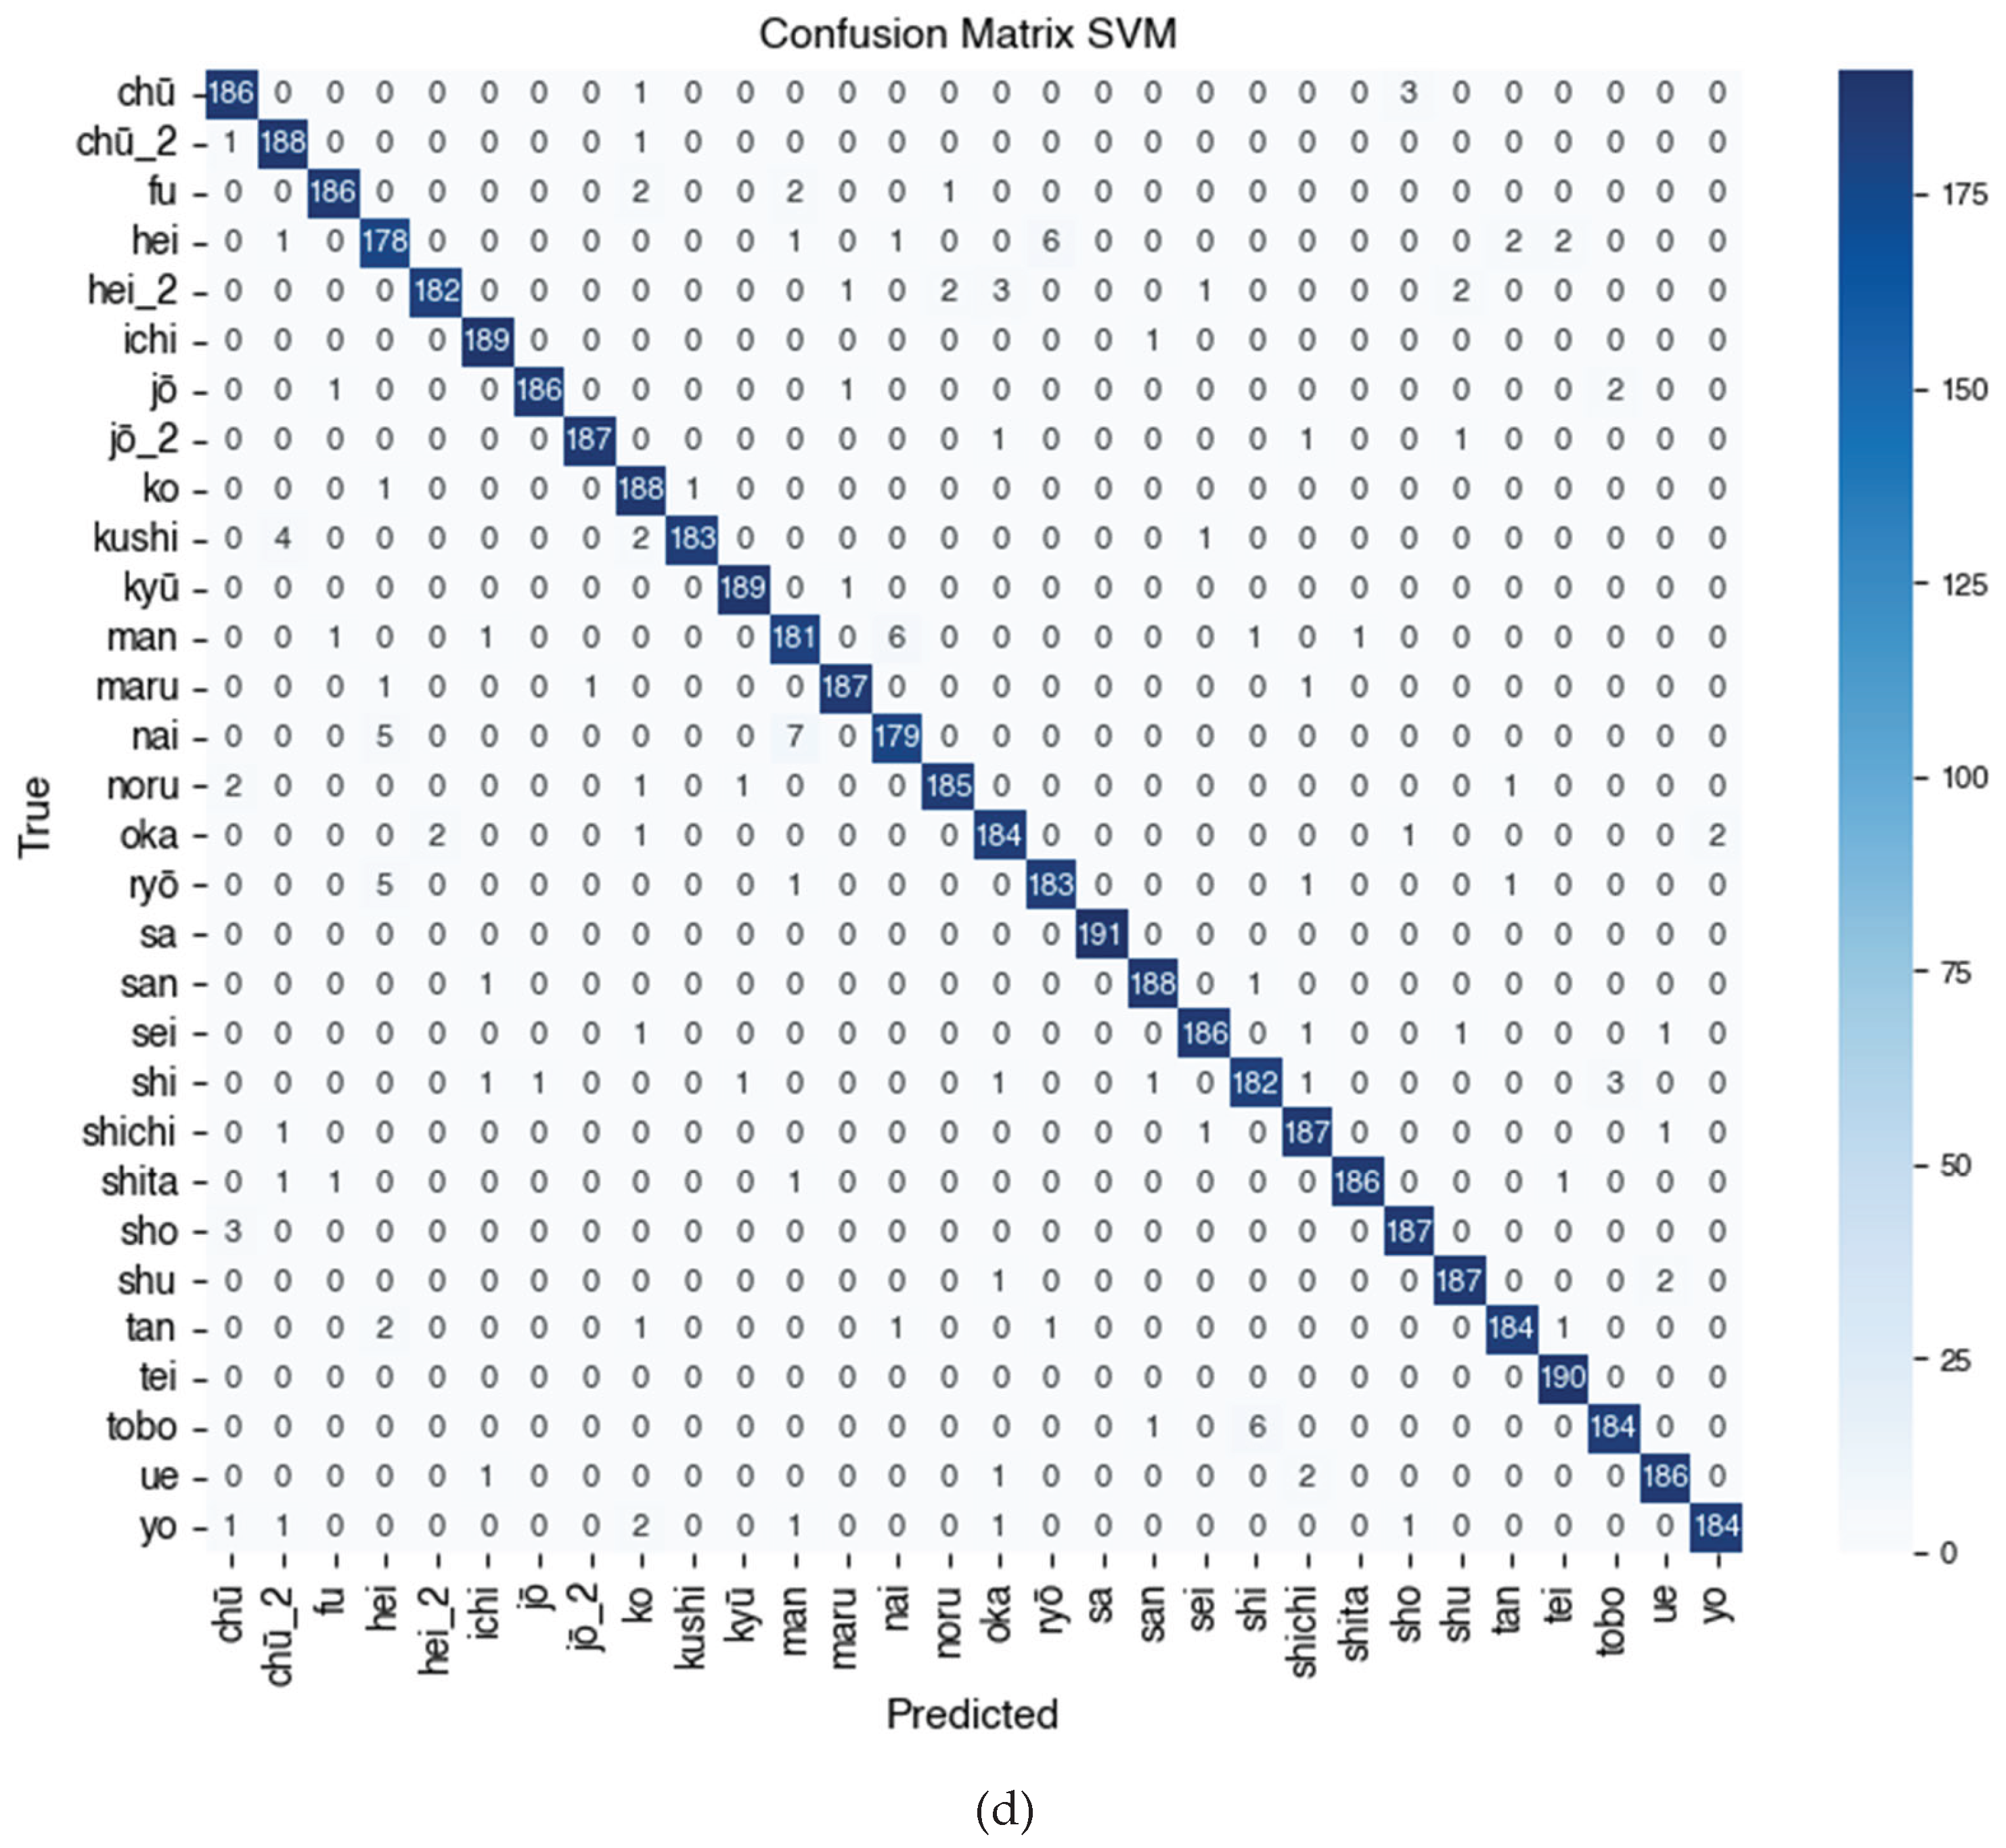
Table 1.
Gap Analysis of Previous Studies on Japanese Character Classification.
| Study | Methods Used | Strengths | Limitations |
|---|---|---|---|
| [10] | NB1, SVM, DT2, RF3, KNN | High accuracy achieved by SVM (96.97%) and KNN (89.39%) | Focused only on Hiragana vowels; did not use HOG features or Kanji characters |
| [11] | CNN, CNN-SVM | CNN-SVM combination yielded improved accuracy (88.21%) | Compared only two methods; did not explore other algorithms or HOG features |
| [12] | CapsNet + Pruning (Parasite, Magnitude, Similarity) | Accuracy maintained despite model pruning | Focused on optimizing CapsNet, not on comparing classification methods |
| [13] | 10-layer CNN (real-time) | Designed for real-time systems with validation and test experiments | Relatively low accuracy (max. 72%) and lacks comparison to classical ML models |
| [14] | Y-Autoencoder + CNN | High F1-score (up to 92%) through synthetic data augmentation | Focused on data enhancement; did not compare classical machine learning algorithms |
1Naive bayes, 2Decision Tree, 3Random Forest.
Table 2.
Summary of Experimental Configuration and Evaluation Metrics.
| Item | Description | Value / Configuration |
| Dataset | Source of handwritten Kanji character images | ETL9G (30 Kanji characters, 9,500 images) |
| Feature Extraction Method | Techniques used to generate feature representations from images | Histogram of Oriented Gradients (HOG) |
| HOG - Orientation | Number of gradient orientation bins | 9 |
| HOG - Pixels per Cell | Size of each cell in pixels (width × height) | (8, 8) |
| HOG - Cells per Block | Number of cells per block for normalization | (2, 2) |
| Machine Learning Algorithms | ML algorithms used for classification | Decision Tree, Random Forest, KNN, SVM |
| Decision Tree | Tree-structured decision-making model | DecisionTreeClassifier (default settings) |
| Random Forest | Ensemble model of multiple decision trees | RandomForestClassifier (n_estimators=100) |
| K-Nearest Neighbors | Instance-based model using neighbor similarity | KNeighborsClassifier (n_neighbors=k_best) |
| Support Vector Machine | Margin-based classifier using various kernels | SVC with kernels = {linear, RBF, polynomial, sigmoid} |
| Cross Validation | Validation technique to reduce partition bias | K-Fold Cross Validation with k = {3, 5, 7, 10} |
| Evaluation Metrics | Primary metrics for classification performance evaluation | Accuracy, Precision, Recall, F1-Score |
| Error Metrics | Regression-style error metrics to enrich model evaluation | MSE, MAE, RMSE, R² |
| Statistical Significance | Statistical testing of performance differences between models | Paired t-test |
| Selection Objective | Main goal of the experimental configuration | Identify the best configuration of each algorithm and kernel |
Table 3.
Sample Data of Kanji Characters.
| No | Label Code | Kanji Characters | No | Label Code | Kanji Characters |
|---|---|---|---|---|---|
| 1 | 0x4e00 | 一 | 16 | 0x4e1e | 丞 |
| 2 | 0x4e01 | 丁 | 17 | 0x4e21 | 両 |
| 3 | 0x4e03 | 七 | 18 | 0x4e26 | 並 |
| 4 | 0x4e07 | 万 | 19 | 0x4e2d | 中 |
| 5 | 0x4e08 | 丈 | 20 | 0x4e32 | 串 |
| 6 | 0x4e09 | 三 | 21 | 0x4e38 | 丸 |
| 7 | 0x4e0a | 上 | 22 | 0x4e39 | 丹 |
| 8 | 0x4e0b | 下 | 23 | 0x4e3b | 主 |
| 9 | 0x4e0d | 不 | 24 | 0x4e43 | 乃 |
| 10 | 0x4e0e | 与 | 25 | 0x4e45 | 久 |
| 11 | 0x4e11 | 丑 | 26 | 0x4e4b | 之 |
| 12 | 0x4e14 | 且 | 27 | 0x4e4d | 乍 |
| 13 | 0x4e16 | 世 | 28 | 0x4e4e | 乎 |
| 14 | 0x4e18 | 丘 | 29 | 0x4e4f | 乏 |
| 15 | 0x4e19 | 丙 | 30 | 0x4e57 | 乗 |
Table 4.
Rename Label Name.
| Label Name | |||||
|---|---|---|---|---|---|
| No | Before | After | No | Before | After |
| 1 | 0x4e00 | ichi | 16 | 0x4e1e | jō_2 |
| 2 | 0x4e01 | tea | 17 | 0x4e21 | ryō |
| 3 | 0x4e03 | Shichi | 18 | 0x4e26 | hey_2 |
| 4 | 0x4e07 | man | 19 | 0x4e2d | chū_2 |
| 5 | 0x4e08 | jo | 20 | 0x4e32 | kushi |
| 6 | 0x4e09 | san | 21 | 0x4e38 | maru |
| 7 | 0x4e0a | ue | 22 | 0x4e39 | tan |
| 8 | 0x4e0b | shita | 23 | 0x4e3b | shu |
| 9 | 0x4e0d | fu | 24 | 0x4e43 | nay |
| 10 | 0x4e0e | yo | 25 | 0x4e45 | kyu |
| 11 | 0x4e11 | chū | 26 | 0x4e4b | shi |
| 12 | 0x4e14 | sho | 27 | 0x4e4d | with |
| 13 | 0x4e16 | sei | 28 | 0x4e4e | come |
| 14 | 0x4e18 | okay | 29 | 0x4e4f | tobo |
| 15 | 0x4e19 | Hey | 30 | 0x4e57 | nora |
Table 5.
Decision Tree Accuracy Based on K-Fold Values.
| K-Fold | Accuracy (%) |
|---|---|
| 3 | 65.91 |
| 5 | 66.65 |
| 7 | 67.67 |
| 10 | 68.23 |
Table 6.
Random Forest Accuracy Based on K-Fold Values.
| K-Fold | Accuracy (%) |
|---|---|
| 3 | 93.88 |
| 5 | 94.76 |
| 7 | 94.60 |
| 10 | 95.01 |
Table 7.
KNN Accuracy Based on K-Fold Values.
| K-Fold | Best K value | Accuracy (%) |
|---|---|---|
| 3 | 6 | 91.11 |
| 5 | 5 | 91.80 |
| 7 | 5 | 92.11 |
| 10 | 5 | 92.33 |
Table 8.
SVM Accuracy Based on K-Fold Values.
| SVM | Sigmoid | RBF | Poly | Linear |
|---|---|---|---|---|
| K-Fold | Accuracy (%) | Accuracy (%) | Accuracy (%) | Accuracy (%) |
| 3 | 93.02 | 96.26 | 96.63 | 96.93 |
| 5 | 93.85 | 96.47 | 96.74 | 97.18 |
| 7 | 94.20 | 96.67 | 96.98 | 97.30 |
| 10 | 94.48 | 96.77 | 97.25 | 97.43 |
Table 13.
Comparison of Research Results.
| Study | Method | Accuracy (%) |
Precision (%) | Recall (%) |
F1-Score (%) | Notes |
|---|---|---|---|---|---|---|
| Our Study | SVM | 97.43 | 97.46 | 97.50 | 97.40 | - |
| [10] | NB, SVM, DT, RF, KNN | 89.4 | 89.6 | 89.4 | – | The highest accuracy was achieved by KNN (89.4%). Precision, recall, and F1-score were not reported. |
| [11] | CNN, CNN-SVM | 88.21 | – | – | – | CNN-SVM achieved an accuracy of 88.21%. No other evaluation metrics were provided. |
| [12] | CNN Ensemble | 96.43 | – | – | – | An accuracy of 96.43% was achieved on the K49 dataset. Other metrics were not reported. |
| [13] | CNN (10 layers) | 69.44 | – | – | – | Training accuracy was 69.44% and validation accuracy was 62.50%. Precision, recall, and F1-score were not available. |
| [14] | Y-AE + CNN | – | – | – | 92.81 | F1-score improved from 86.64 to 92.81 after incorporating synthetic data generated by Y-AE. Accuracy was not reported. |
Disclaimer/Publisher’s Note: The statements, opinions and data contained in all publications are solely those of the individual author(s) and contributor(s) and not of MDPI and/or the editor(s). MDPI and/or the editor(s) disclaim responsibility for any injury to people or property resulting from any ideas, methods, instructions or products referred to in the content. |
© 2025 by the authors. Licensee MDPI, Basel, Switzerland. This article is an open access article distributed under the terms and conditions of the Creative Commons Attribution (CC BY) license (http://creativecommons.org/licenses/by/4.0/).
Copyright: This open access article is published under a Creative Commons CC BY 4.0 license, which permit the free download, distribution, and reuse, provided that the author and preprint are cited in any reuse.


