Submitted:
22 July 2025
Posted:
24 July 2025
You are already at the latest version
Abstract
The maternal circulating proteome reflects critical physiological adaptations during pregnancy, yet standardized reference profiles for early gestation are lacking. In this pro-spective study, we employed targeted liquid chromatography-multiple reaction monitor-ing-mass spectrometry (LC-MRM-MS) with stable isotope-labeled (SIS) standards to char-acterize the serum proteome of 83 women with uncomplicated singleton pregnancies be-tween 11+2 to 13+6 weeks' gestation. Robust analysis quantified 115 proteins (83% of tar-gets), with 101 meeting ICH M10 standards. These included 38 FDA-approved, 19 CVD-related, and 25 CLIA-approved biomarkers. We identified 43 proteins significantly associated (p< 0.05) with gestational age, maternal factors (BMI, age, parity, myomas), and fetal sex. Key findings included identification of 12 proteins significantly associated with trisomy risk (|R|=0.21–0.45, p< 0.05), and extreme physiological variability in Pregnancy zone protein (PZP, 123.9-fold), followed by Apolipoprotein(a) (LPA; 9.9-fold), and Preg-nancy-associated plasma protein A (PAPPA, 9.3-fold). In contrast, Hemopexin (HPX) demonstrated remarkable stability (CV=8.5%), suggesting its utility as a reference marker. The study successfully implemented multiples of the median (MoM) transformation for clinical standardization of protein profiles, with RobNorm proving particularly effective for batch-effect correction in our dataset. These methodological advances, combined with the establishment of comprehensive pregnancy-specific reference ranges, provide a valua-ble foundation for future research. The optimized analytical framework and protein sig-natures identified in this work not only enable development of next-generation screening approaches but also offer new insights into the molecular adaptations occurring during early pregnancy.
Keywords:
proteomics
; blood
; serum
; pregnancy
; healthy volunteers
; biomarkers
; MRM
; mass spectrometry
1. Introduction
Human blood is a key source of protein biomarkers and a widely studied clinical specimen due to minimally invasive collection methods [1]. Blood plasma and serum contain proteins from diverse origins, making them vital for disease diagnosis and mechanistic studies [2]. Despite extensive research, clinically relevant plasma/serum proteome variability—linked to age, sex, and ethnicity—remains poorly understood [3,4,5,6,7,8]. Addressing these gaps could improve early disease detection and prognosis [2,9].
Several databases catalog plasma protein biomarkers, including GOBIOM, BiomarkerBase, and MarkerDB, which lists 142 markers [10]. Over 150 biomarkers are linked to cardiovascular disease (CVD) alone [11], with aptamer-based profiling identifying 156 CVD candidates [12]. Plasma proteomics also shows promise for detecting cancer, diabetes, Alzheimer’s, and pregnancy complications like preeclampsia (PE) and intrauterine growth restriction (IUGR) [13,14,15,16,17,18].
Before clinical use, biomarkers require validation for accuracy, specificity, and cross-lab reproducibility [1,19,20]. Variability in protein levels may reflect non-pathological factors like ethnicity or geography [7,8]. Comprehensive proteome profiling could enhance disease understanding, enabling earlier diagnosis and personalized medicine [21]. Technologies like Proximity Extension Assay (PEA) and Targeted Mass Spectrometry (MS) support these goals, as demonstrated by the Human Disease Blood Atlas, which covers 59 diseases (though pregnancy-related conditions are excluded) [22,23].
Mass spectrometry (MS)-based proteomics offers rapid, unbiased analysis, ideal for biomarker discovery [24,25]. Absolute quantification, particularly via multiple reaction monitoring (MRM) with stable-isotope-labeled standards (SIS) and natural synthetic proteotypic (NAT) peptides, is the gold standard, detecting analytes at low ng/mL to pg/mL levels with high specificity [26,27,28]. MRM panels, such as one profiling 270 plasma proteins (including 61 FDA-approved biomarkers), show robust reproducibility for diseases like CVD and cancer [29,30].
Biological and analytical variations, including age, BMI, and gestational stage, significantly influence protein quantification, necessitating pregnancy-specific reference ranges [5,6,31,32]. Standard reference values derived from non-pregnant populations are inadequate due to the profound physiological changes during pregnancy [33,34]. Among these factors, gestational age at blood collection is particularly critical for accurate interpretation [6,31,32].
To account for these variations, we employed linear multivariable models to adjust for biological confounders [32,35], while advanced normalization methods — including LOESS (locally estimated scatterplot smoothing), RobNorm, ComBat, and multiples of the median (MoM) — were applied to mitigate technical variability and batch effects [3,36]. These approaches outperform conventional methods like quantile normalization or standardization [37,38], with MoM correction proving especially valuable for cross-study harmonization by correcting both methodological and biological biases [39,40,41].
In this study, we quantified 139 first-trimester serum proteins in pregnant women using LC-MRM-MS with NAT and SIS tryptic peptides, establishing MoM-adjusted reference ranges. The assay, adapted from the BAK-270 kit (MRM Proteomics Inc., Montreal, QC, Canada), was previously validated in COVID-19 study [8,42]. Additionally, the assay includes 40 candidate PE blood markers [43].
2. Results
2.1. Clinical and Demographic Characteristics
This prospective study included 83 women with physiological pregnancies undergoing first-trimester screening. Participants had a median age of 30.5 years (range 20.5-37.3) and BMI of 21.2 kg/m² (range 15.6-30.1). Blood collection occurred at median 12.4 weeks' gestation (range 11+2 - 13+6). Key findings included uterine myoma in 8 women (10%), anemia in 27 (33%), and near-equal fetal sex distribution (49% male). Parity distribution was 48% primiparous, 39% secundiparous. Biomarker analysis revealed median pregnancy-associated plasma protein-A (PAPPA) of 3.03 mIU/mL (0.95 MoM), placental growth factor (PIGF) - 25.3 pg/mL (0.84 MoM), and free β-human chorionic gonadotropin (free β-hCG) - 52.61 ng/mL (0.99 MoM). Median uterine artery PI (UtA-PI) was 1.57 (0.99 MoM) and mean arterial pressure (MAP) - 83.33 mmHg (0.98 MoM). Pregnancy risks were: preeclampsia (PE) 1:1357, intrauterine growth restriction (IUGR) 1:554, and preterm delivery 1:2115 (median values). All data are detailed in Table 1.
2.2. Data Normalization
Among the 139 targeted proteins studied, 115 (82.7%) were reliably detected and quantified using LC-MRM-MS with corresponding SIS peptides (Supplementary Table S1). Twelve proteins—including Alpha-1-antitrypsin, Apolipoprotein A-I, Cholesteryl ester transfer protein, Clusterin, Complement C1q subcomponent subunit B, Fibrinogen alpha chain, Fibrinogen beta chain, Fibrinogen gamma chain, Kallistatin, Keratin type I cytoskeletal 9, Peroxiredoxin-2, and Serum paraoxonase/lactonase 3—were excluded due to quantification in fewer than 50% of samples.
Median coefficient of variation (CV) in calibration standards (A–H) and quality control (QC-A, QC-B, and QC-C) are summarized in Supplementary Table S2. For raw data, the median mean CV across proteins was 7.9%, with three proteins (Inter-alpha-trypsin inhibitor heavy chain H2, ITIH2, Inter-alpha-trypsin inhibitor heavy chain H1, ITIH1, and Serum amyloid A-1 and A-2 proteins, SAA1/2) exhibiting mean CVs of 20% or higher (Figure 1A). Normalization methods yielded varying results. Quantile normalization increased the median mean CV to 24% (Figure 1B). In contrast, LOESS normalization maintained a low median mean CV of 7.7%, though four proteins (ITIH1, ITIH2, L-selectin, SELL, and SAA1/2) had CVs of at least 20% (Figure 1C). RobNorm normalization further reduced the median mean CV to 7.2%, with only two proteins (ITIH2 and SAA1/2) exceeding the 20% threshold (Figure 1D). ComBat normalization resulted in the highest median mean CV at 30.3% (Figure 1E).
Both LOESS and RobNorm normalization significantly reduced the mean CV compared to raw data (p < 0.001 for each, paired Mann-Whitney test). Additionally, these methods effectively removed batch-associated variation (Figure 2). However, RobNorm outperformed LOESS normalization, yielding a lower mean CV (p < 0.001, paired Mann-Whitney test) and fewer proteins excluded due to excessive variation. These results suggest that RobNorm is the optimal method for batch effect correction in this dataset.
2.3. First Trimester Serum Proteome Profiling
A total of 101 proteins met all study quality control criteria, demonstrating analytical performance compliant with ICH M10 guidelines for bioanalytical method validation [44]. These proteins included 38 FDA-approved biomarkers [45], 19 CVD markers [46,47], and 25 Clinical Laboratory Improvement Amendments (CLIA)-approved clinical targets [48]. Additionally, 23 proteins represented potential markers for PE, a severe pregnancy-associated disorder [43].
Protein concentration analysis revealed a dynamic range spanning 5.3 orders of magnitude in both RobNorm-normalized and raw datasets (Figure 3A, Supplementary Figure S1A; Tables S3, S4). In RobNorm-normalized data, the lowest concentrations were observed for Protein deglycase DJ-1 (PARK7; 2.46 [1.81-3.43] nM), PAPPA (6.58 [4.85-8.82] nM), and Vasorin (VASN; 10.08 [9.19-11.39] nM). Conversely, the highest concentrations were found for Serum Albumin (ALB; 4.73×10⁵ [4.36×10⁵-5.08×10⁵] nM), Serotransferrin (TF; 2.45×10⁴ [2.18×10⁴-2.86×10⁴] nM), and Apolipoprotein A-II (APOA2; 2.05×10⁴ [1.81×10⁴-2.37×10⁴] nM). The raw data showed comparable concentration ranges for these proteins, with PARK7 (2.32 [1.54-3.51] nM), PAPPA (6.34 [4.39-8.47] nM), and VASN (9.88 [8.60-11.25] nM) at the lower end, and ALB (4.54×10⁵ [4.29×10⁵-4.95×10⁵] nM), TF (2.37×10⁴ [2.03×10⁴-2.77×10⁴] nM), and APOA2 (2.00×10⁴ [1.78×10⁴-2.38×10⁴] nM) at the higher end.
Fold change analysis demonstrated that 90 proteins in RobNorm-normalized data showed minimal variation (fold change < 3). Pregnancy zone protein (PZP) exhibited the most dramatic change (123.9-fold), followed by Apolipoprotein(a) (LPA; 9.9-fold), PAPPA (9.3-fold), and Carbonic anhydrase 1 (CA1; 7.3-fold). Hemopexin (HPX) was the most stable protein (1.3-fold change). Similar patterns were observed in raw data, where PZP showed 155.8-fold change, LPA (9.5-fold), PAPPA (8.5-fold), and CA1 (6.6-fold), with 87 proteins demonstrating fold changes <3 and ALB being most stable (1.4-fold change) (Figure 3B, Supplementary Figure S1B; Tables S4, S5).
To align serum proteome analysis with clinical diagnostic standards, we applied MoM transformation. Following MoM transformation (Supplementary Figure S2), the central 90% of values (5th-95th percentiles) ranged from 0.65 MoM, with extreme values observed for HPX (0.28 MoM) and LPA (5.4 MoM) (Supplementary Table S6).
2.4. Associations Between Serum Proteome and Clinical Parameters
First-trimester maternal serum protein levels demonstrated statistically significant associations with BMI, age, parity, fetal sex, and sample collection timing. A particularly notable finding was the moderate inverse correlation between maternal age and A2M (R = -0.41, p < 0.001). A2M showed strong positive correlations with both adjusted risk levels and background risk for trisomy 18 (R = 0.41 and R = 0.44 respectively, p < 0.001 for both), as well as for trisomies 13 and 21 (R = 0.44 and R = 0.42 respectively, p < 0.001 for both) (Supplementary Figure S3).
Several other proteins exhibited weaker but statistically significant associations with trisomy risk. IGFBP3 showed consistent weak positive correlations with background risk for all three trisomies (R = 0.23, p = 0.04). SERPING1 demonstrated similar associations for trisomies 13 and 18 (R = 0.24, p = 0.03) and a slightly weaker correlation for trisomy 21 (R = 0.22, p = 0.02). Negative correlations were observed for CST3 (R = -0.22 to -0.23, p = 0.04-0.047), CFI (R = -0.24 to -0.25, p = 0.03), SERPIND1 (R = -0.27 to -0.28, p = 0.01), and CPN2 (R = -0.26, p = 0.01 across all trisomies).
Additional protein-trisomy associations were identified in the adjusted risk analysis. For trisomy 13, weak correlations were found with AZGP1 (R = 0.26, p = 0.02), A2M (R = 0.27, p = 0.02), and SERPINA3 (R = -0.26, p = 0.02). Trisomy 18 showed associations with SERPINF1 (R = 0.23, p = 0.04), APOA4 (R = 0.26, p = 0.02), SERPING1 (R = 0.28, p = 0.01), AZGP1 (R = 0.24, p = 0.03), and negative correlations with CFI (R = -0.27, p = 0.01), SERPIND1 (R = -0.25, p = 0.02), C1QA (R = -0.22, p = 0.046), and CPN2 (R = -0.27, p = 0.01). Trisomy 21 demonstrated weak associations with PON1 (R = 0.23, p = 0.04), IGFBP3 (R = 0.22, p = 0.046), SERPING1 (R = 0.25, p = 0.02), and CFI (R = -0.26, p = 0.02).
Multiple linear regression analysis revealed significant associations between maternal characteristics and concentrations of 43 proteins (Table 2, Supplementary Table S7). BMI and parity showed the strongest effects, influencing 21 and 13 proteins, respectively. Fetal sex significantly modulated concentrations of 11 proteins, including alpha-1-antichymotrypsin (SERPINA3), beta-2-glycoprotein 1 (APOH), Ceruloplasmin (CP), Complement components C5 and C9, hemoglobin subunit alpha 1 (HBA1), Leucine-rich alpha-2-glycoprotein (LRG1), Vitamin K-dependent protein S (PROS1), and Zinc-alpha-2-glycoprotein (AZGP1). Eight multifactorial proteins - Attractin (ATRN), CP, Coagulation factor XII (F12), Apolipoprotein A-IV (APOA4), CA1, HBA1, Kininogen-1 (KNG1), and AZGP1 - demonstrated dependence on two or more clinical factors.
Following MoM value adjustment (Supplementary Figure S4), the median range (5th–95th percentile) was 0.64 MoM (Supplementary Table S6), with LPA and PZP remaining the most variable proteins.
2.5. Proteomic Data Comparison and Validation
Our proteomic profiling (n=83) demonstrated significant overlap with a previous study of first-trimester healthy pregnancies (n=13) using identical LC-MRM-MS methodology with the BAK-125 kit [17]. Of the detected proteins, 57 showed consistent expression patterns between both cohorts (Figure 4A), while only 12 proteins (Adipocyte plasma membrane-associated protein, Alpha-1 antitrypsin, Apolipoprotein A-1, Apoliporptotein C-4, Clusterin, Complement C1q Chain B, Fetuin-B, Inter-alpha-trypsin inhibitor heavy chain H2, Tissue inhibitor of metalloproteinases 2, Protein C inhibitor, Tenascin-X, Thrombospondin 1) were unique to the Starodubtseva et al. study [17]. Following batch adjustment, MoM normalization, and clinical value correction, the 57 common proteins showed excellent concordance in principal component analysis (Figure 4B) and MoM-transformed values (Supplementary Figure S5).
The comparison between measurement methods revealed important insights. Routine ELISA and LC-MRM-MS values showed strong correlation (R=0.65, p<0.001) in initial analyses. This association decreased following MoM transformation (R=0.56, p<0.001) but showed slight improvement with corrected LC-MS MoM values (R=0.58, p<0.001) (Table 3).
3. Discussion
This prospective study characterized serum proteome of 83 women with physiological pregnancies undergoing first-trimester screening between 11+2 and 13+6 weeks of gestation. The cohort demonstrated typical maternal characteristics, with a median age of 30.5 years and median BMI of 21.2 kg/m². The prevalences of uterine myoma (10%) and anemia (33%) were consistent with expected population rates. Fetal sex distribution was balanced (49% male), and nearly half of the women were primiparous (48%).
First-trimester biomarker profiles aligned with established norms, including MoM values of 0.95 for PAPP-A, 0.84 for PlGF, and 0.99 for free β-hCG. Hemodynamic assessments revealed normal UtA-PI (0.99 MoM) and MAP (0.98 MoM). The cohort demonstrated low baseline risks for adverse outcomes, with calculated probabilities of 1:1,357 for PE, 1:554 for IUGR, and 1:2,115 for preterm delivery.
Using liquid chromatography-multiple reaction monitoring mass spectrometry (LC-MRM-MS) with stable isotope-labeled standard peptides, we successfully quantified 115 out of 139 targeted proteins (83%), demonstrating robust analytical performance. Among these, 101 proteins met all quality control criteria in accordance with ICH M10 guidelines for bioanalytical method validation and were detected in more than 50% of samples. The measured protein concentrations exhibited a wide dynamic range spanning 5.3 orders of magnitude.
Analysis of first-trimester maternal serum proteins revealed statistically significant associations with several maternal characteristics, including BMI, age, parity, fetal sex, and gestational age. Furthermore, we identified 12 proteins that demonstrated statistically significant correlations with trisomy risk, with absolute correlation coefficients ranging from 0.21 to 0.45 (p<0.05). These findings highlight the potential utility of first-trimester serum protein profiling for understanding pregnancy physiology and assessing chromosomal abnormality risk.
We applied MoM transformation to serum protein concentrations to normalize for gestational age effects, account for inter-individual biological variation, and enable direct clinical interpretation through established risk assessment frameworks. This approach is well-established in prenatal screening, particularly for assessing risks of Down syndrome and neural tube defects through maternal serum markers (e.g., hCG MoM values) [39,40,41]. MoM normalization facilitates cross-laboratory result comparison by accounting for methodological variations and biological differences [49].
RobNorm represents an innovative normalization approach that employs a Gaussian mixture model to characterize protein expression distributions and account for sample effects [50]. A comprehensive evaluation by Arend et al. across six spike-in and three label-free/tandem mass tag datasets demonstrated that RobNorm-normalized data exhibited intermediate performance in pooled median absolute deviation — surpassing cyclic-LOESS while approximating quantile normalization [51]. Notably, RobNorm achieved superior discriminative power for first-trimester serum proteome data compared to alternative normalization methods.
ComBat, an established batch-effect correction technique widely applied in proteomics [52], typically outperforms both quantile normalization and cyclic-LOESS in correction efficacy [37,38]. However, our current analysis revealed reduced ComBat performance, potentially attributable to size-imbalanced batch composition. Importantly, we observed comparable magnitudes of batch-induced and intra-batch variation, suggesting suboptimal algorithm performance under these specific experimental conditions — a finding that contrasts with previous successful implementations reported in the literature.
Consistent with prior research, we observed that LPA concentrations vary drastically (10-fold between pregnant women), primarily due to genetic rather than clinical influences [53]. As the most genetically controlled lipoprotein, LPA's variability stems from its size polymorphism [54,55]. Strong evidence links high LPA to increased cardiovascular disease (CVD) risk, with recent UK Biobank data (460,000+ participants) showing a linear risk rise above median levels (19.6 nM) [56]. LPA's structural similarity to plasminogen suggests it bridges cholesterol transport and fibrinolysis, potentially modulating clotting balance [24]. It also carries oxidized phospholipids, activating pro-inflammatory pathways in arteries [57]. Monocytes from high-LPA individuals show enhanced endothelial transmigration and cytokine production, implicating LPA in endothelial dysfunction—key in conditions like PE [58].
PZP emerged as the most variable proteins in our study (fold change = 123), showing a strong association with gestational age. Our measurements revealed a PZP concentration of 388 nM (range: 7.74 nM - 2.5 µM), which appears lower than previously reported values. This finding contrasts with earlier studies using different methodologies: Ekelund et al. (1994) reported mean concentrations increasing from ≈1.8 µM in the first trimester to ≈4.3 µM later in pregnancy using electroimmunoassay [59], while another study using ELISA measured ≈2.5 µM (range: 89 nM - 8.9 µM) at 17-20 weeks gestation [60].
The extreme variability of PZP is well-documented, with Ekelund's study reporting a coefficient of variation exceeding 70% [59]. This wide dynamic range has been further corroborated by large-scale proteomic analyses, including a DIA-MS study of 253 proteins across 1800 cancer patient plasma samples, which identified both PZP and LPA as having exceptionally broad interquartile ranges [23].
Our analysis revealed CA1 as a highly dynamic protein in pregnancy, demonstrating both significant elevation (7.3-fold change) and considerable variability (CV=70%). This pattern stands in sharp contrast to the tightly regulated CA1 levels observed in non-pregnant healthy individuals, where Gao et al. reported remarkably consistent concentrations (12.8 ± 0.7 nM by ELISA; n=40) [61].
Intriguingly, our measured CA1 levels (20.9 ± 14.6 nM) more closely resembled the elevated and variable concentrations found in breast cancer patients (13.05 ± 16.25 nM by LC-MRM-MS; n=183) than those in healthy controls (5.21 ± 1.97 nM; n=51) from the Kim et al. study [62]. This similarity in protein dynamics between pregnancy and a pathological state, as measured by the same LC-MRM-MS methodology, suggests that CA1 may undergo similar regulation patterns in these distinct biological conditions. The substantial divergence from typical healthy control values (5.21-12.8 nM) strongly indicates that the observed CA1 profile represents a unique pregnancy-associated pattern, potentially reflecting the profound physiological adaptations occurring during gestation.
HPX demonstrated remarkable stability in our first-trimester serum proteome analysis, showing minimal fold change of 1.3 and remarkably low coefficient of variation (CV=8.5%). We observed a mean HPX concentration of 13.2 µM, ranging from 10.5 to 15.9 µM. This measurement appears consistently lower than values reported in other pregnancy studies using ELISA quantification [63,64,65].
Previous studies have reported higher HPX concentrations at different gestational stages [63,64,65]. For instance, HPX levels near delivery were measured at 4.5 ± 2.2 µM in a cohort of 49 healthy women [63]. First-trimester measurements showed even higher values, with a median of ≈17.5 µM among 100 controls [64] and a mean of ≈20.04 (95% CI: 19.49-20.61) µM in a larger study of 347 healthy pregnant women at 6-20 weeks gestation [65].
The observed differences between our results and previous findings may be attributed to several factors. Physiological changes in HPX concentration throughout pregnancy could explain some variation, while methodological differences between mass spectrometry and immunoassays may also contribute. Additionally, population-specific variations in protein levels cannot be ruled out. Despite these quantitative differences, the exceptional stability of HPX in our dataset underscores its potential value as a reference protein for first-trimester proteomic studies.
PAPP-A serves as a clinically significant marker for various pregnancy conditions, including Down syndrome screening, intrauterine growth restriction, preeclampsia, preterm birth, and pregnancy loss [66,67,68,69]. The protein's serum concentration demonstrates complex regulation, showing a near-exponential increase with gestational age [31] while being influenced by multiple factors including maternal medical history, race, IVF conception, and anthropometric measurements [35,70].
In our study, parity emerged as the strongest predictor of PAPP-A levels (β=-0.17, p=0.04), surpassing other potential associations. We observed a median PAPP-A concentration of ≈7.6 nM by ELISA, which closely aligned with our LC-MRM-MS quantification (6.6 nM) but was lower than the ≈10.9 nM reported by R. Caliscan et al. [71]. The methodological consistency between ELISA and mass spectrometry measurements, despite absolute concentration differences, supports the reliability of PAPP-A quantification across platforms. The observed variations highlight the need for standardized correction approaches when comparing proteomic data across different study designs and measurement techniques.
Our study presents a comprehensive quantitative analysis of first-trimester serum proteins in pregnancy using highly sensitive LC-MRM-MS with SIS peptides. From an in-itial screening cohort of over 1,800 women, we established a well-characterized reference group of 83 healthy pregnancies through stringent exclusion criteria. The analytical plat-form demonstrated robust performance, reliably quantifying 115 of 139 targeted proteins (83%), with 101 proteins meeting stringent ICH M10 validation criteria and detection in >50% of samples. The quantified proteins included clinically relevant biomarkers span-ning 38 FDA-approved targets, 19 CVD markers, and 25 CLIA-approved analytes, along with 23 potential PE markers. The assay's exceptional dynamic range (5.3 orders of mag-nitude) enabled precise measurement across diverse protein abundance levels. The es-tablishment of pregnancy-specific reference ranges using MoM adjustment represents a significant advance, properly accounting for gestational age and maternal characteristics that are often overlooked in conventional clinical interpretation.
Comparative analysis with our recent study, utilizing the same methodology (LC-MRM-MS with SIS) [17], validates the robustness of our proteomic approach and demonstrates high reproducibility across independent pregnancy cohorts. The strong concordance in protein expression patterns (50% overlap) despite different sample sizes supports the reliability of our findings. These results establish a foundation for future large-scale validation of pregnancy protein biomarkers, with particular emphasis on the 57 consistently expressed proteins as potential core markers for first-trimester screening applications. The successful normalization across studies further confirms the utility of MoM transformation for cross-study proteomic comparisons in pregnancy research.
Several important limitations should be considered when interpreting these find-ings. The sample size of 83 healthy pregnancies, while carefully selected from a larger screening population, may constrain the generalizability of results, particularly for rare pregnancy complications. The observed discrepancies between LC-MRM-MS and ELISA measurements highlight important methodological considerations - while mass spec-trometry provides superior specificity, absolute concentration differences may reflect both technical variations between platforms and inherent cohort characteristics.
The moderate attenuation in correlation between LC-MS and ELISA measurements following MoM transformation (R=0.58) for PAPP-A indicates that while this normalization approach enhances cross-platform comparability, further optimization may be necessary to achieve complete analytical harmonization. Notably, the 12 candidate protein markers for trisomy risk identified in this study will require extensive validation in large-scale prospective studies before consideration for clinical application.
Despite these limitations, our study establishes a robust methodological framework and provides essential reference data that will facilitate future investigations into first-trimester serum biomarkers. These findings pave the way for subsequent validation studies and the development of more comprehensive, protein-based screening approaches in prenatal care.
4. Materials and Methods
4.1. Study Design
This prospective cohort study was conducted at the I. Kulakov National Medical Research Center for Obstetrics, Gynecology, and Perinatology between January 2022 and December 2022. The study enrolled 1,869 women aged 18-45 years undergoing routine first-trimester screening at 11+2 to 13+6 weeks of gestation. Only women with confirmed singleton pregnancies were included in the analysis. Participants were excluded if their pregnancy resulted from assisted reproductive technology or if they had any of the following medical conditions: pre-existing diabetes mellitus, diagnosed autoimmune disorders, history of organ transplantation, or malignancies. Additional exclusions were applied for pregnancies subsequently complicated by fetal chromosomal abnormalities, PE, gestational hypertension (defined as blood pressure ≥140/90 mmHg on two separate measurements), gestational diabetes mellitus (diagnosed by oral glucose tolerance testing), preterm delivery before 37+0 weeks of gestation, or IUGR (defined as estimated fetal weight below the 10th percentile for gestational age).
All participants provided written informed consent prior to enrollment. The first-trimester screening protocol included comprehensive maternal evaluation with standardized measurements of weight, height, and blood pressure [72]. Transabdominal color Doppler ultrasound was performed to measure the UtA-PI [73]. Serum concentrations of PIGF and PAPP-A were quantified using the Delfia Xpress system (PerkinElmer Life and Analytical Sciences, USA) according to manufacturer protocols.
Through rigorous application of the inclusion and exclusion criteria to the initial cohort, a healthy control group of 83 participants was established. These control cases progressed to term delivery at or beyond 37+0 weeks with infants demonstrating appropriate growth parameters (birthweight between the 10th and 90th percentiles), while experiencing no pregnancy-related complications throughout gestation. This carefully selected group served as an optimal reference population for comparative analyses.
The study protocol was approved by the Institutional Review Board of the National Medical Research Center for Obstetrics, Gynecology and Perinatology (protocol No. 2, dated 9 March 2017). All procedures were conducted in accordance with the ethical standards of the Helsinki Declaration and Good Clinical Practice guidelines.
4.2. Sample Preparation
For proteome analysis, blood samples were obtained during routine first-trimester prenatal screening. Using SerumZ/9 tubes (Monovette, Sarstedt, Germany), serum samples were collected and centrifuged at 300 × g for 20 minutes. The resulting supernatant was aliquoted into cryo-tubes and stored at -80°C until analysis.
The study was performed using SIS “heavy” peptides, which were added to each sample and acted as internal standards for normalization, and unlabeled “light” NAT peptides, which were used to create quantitative calibration curves. Synthesis and characterization of SIS and NAT peptides was carried out in the Omics lab at Skoltech using standard procedures, which were previously described in detail [8,42].
Sample preparation followed established protocols [8,19,42], starting with 10 μL of serum. Proteins were denatured and reduced using 9 M urea, 20 mM dithiothreitol, and 200 mM Tris × HCl (pH 8.0, 37 °C, 30 min), then alkylated with 100 mM iodoacetamide (30 min, dark). For trypsinolysis, samples were diluted with 100 mM Tris × HCl (pH 8.0) to <1 M urea, treated with TPCK-trypsin (20:1 w/w), and incubated (18 h, 37 °C). The reaction was quenched with formic acid (1.0% final, pH ≤ 2), yielding ~1 mg/mL peptides. After SIS peptide addition, samples underwent SPE cleanup and were reconstituted in 34 μL of 0.1% formic acid (FA) for LC-MRM-MS.
For each calibration standard and QC sample, 40 μL of bovine serum albumin (BSA) surrogate matrix digest (143 μg/mL) was spiked with 10 μL of SIS peptides and 10 μL of level-specific NAT peptides. A pooled patient serum QC (CPL) was included to correct for batch effects. Standards and QCs underwent the same solid phase extraction (SPE) protocol as samples. SPE eluates were dried in a speed vacuum and stored at −80°C. Before LC-MRM-MS, samples were reconstituted in 34 μL of 0.1% FA.
4.3. LC-MRM-MS Analysis
Samples were analyzed in duplicate using an ExionLC™ UHPLC system (ThermoFisher Scientific, Waltham, MA, USA), coupled to a SCIEX QTRAP 6500+ mass spectrometer (SCIEX, Toronto, ON, Canada). Chromatographic separation used a C18 column (2.1 × 150 mm, 1.7 μm) with a 53-min 2-45% acetonitrile gradient (0.4 mL/min, 0.1% FA) [42]. MRM detection employed electrospray ionization (ESI, 4000 V, 450°C, 40 L/min); transitions are in Supplementary Table S8.
The samples were processed in three batches using 96-well plates, each containing calibration standards (A-G, A=LLOQ, G=HLOQ), QCs, and CPL.
4.4. Data Preprocessing, Quality Control and Quantitative Analysis
Raw MS data preprocessing including quantitative analysis was performed in Skyline software (version 20.2.0.343, University of Washington) [74]. Data quality evaluation and quantitation was conducted in compliance with the ICH guidelines for Bioanalytical Method Validation [44]. Calibration standards, consisting of seven levels (A–G), along with QC samples at three concentration levels (QC-A, QC-B, and QC-C), were employed to evaluate assay performance. Calibration curves were generated using 1/(x × x)-weighted linear regression methods to calculate the peptide and corresponding protein concentrations in the measured samples (fmol per 1 µL of plasma).
The acceptance criteria required that both accuracy and precision remain within 20% of the theoretical value, with calculated concentrations deviating no more than ±20% from their expected values. A calibration curve was deemed acceptable provided that a minimum of five out of the eight standards met these criteria. Furthermore, for the experiment to be considered valid, at least 66% of all QC samples and no less than 90% of the peptide calibration curves were required to fulfill the acceptance criteria. Proteins demonstrating calibration curves with R² > 0.99 were classified as quantified. For sample measurements falling below the lower limit of quantification (LLOQ, level A), the LLOQ value was assigned. Similarly, measurements exceeding the upper limit of quantification (HLOQ, level G) were assigned the HLOQ value. Additional exclusion criteria comprised proteins with concentrations below LLOQ or above HLOQ in more than 50% of study samples.
4.5. Statistical Analysis and Normalization
To minimize batch effects and analytical variance, four normalization approaches were evaluated and compared: quantile normalization [75], LOESS normalization [76,77], Robnorm [50], and ComBat normalization [78]. For each normalized dataset along with the raw data, CVs were calculated across standard and quality control samples. Proteins exhibiting a mean CV ≥ 20% were subsequently excluded from further analysis.
The processed datasets were autoscaled and visualized through principal component analysis. Statistical characterization was performed for both raw and optimally normalized data, including determination of median values, standard deviations, coefficients of variation, minimum/maximum values, and 5%/95% quantile levels. The fold change was computed as the ratio between the 95% and 5% quantile values.
4.6. Reference Value Establishment and Clinical Parameter Association
The relationship between normalized protein concentrations and first-trimester screening parameters was assessed using Spearman's correlation analysis, with statistical significance set at p<0.05. For quantitative analysis, protein concentrations were expressed as MoM, calculated by dividing each measured concentration (Ci,j) by the median concentration of the corresponding protein across all samples:
,
were Ci,j – concentration of protein i in the sample j.
Multiple linear regression modeling was employed to examine associations between protein MoM values and clinical parameters, including maternal age, body mass index, gestational age at blood collection, parity, and uterine myoma status. Each protein was analyzed through an iterative model refinement process, where non-significant predictors (p≥0.05) were sequentially removed starting with the least significant variable.
For each final model, we determined the clinical parameter values corresponding to the baseline protein expression level (1 MoM). These models were subsequently used to derive adjustment factors for protein concentration normalization.
All statistical computations and data transformations were performed using custom R scripts (version 4.3.3) incorporating the following packages: Sva (v3.50.0) for surrogate variable analysis [79], limma (v3.58.1) for linear modeling [80], reshape2 (v1.4.4) for data manipulation [81], ggplot2 (v3.5.2) for visualization [82], and pheatmap (v1.0.12) for heatmap generation [83].
5. Conclusions
This prospective study provides a comprehensive characterization of the first-trimester serum proteome in 83 women with singleton physiological pregnancies, establishing robust reference ranges for 101 rigorously validated proteins. Using our highly sensitive LC-MRM-MS platform, we achieved reliable protein quantification across an impressive 5.3-order-of-magnitude dynamic range, revealing significant associations between protein expression patterns and key maternal-fetal characteristics including BMI, age, parity, and fetal sex, as well as potential markers of trisomy risk. Through careful evaluation of normalization methods, we determined that the RobNorm approach most effectively addressed inter-batch variation in our dataset.
Among the study's most significant findings are the identification of twelve candidate protein markers for chromosomal abnormalities, the successful application of MoM transformation for cross-platform data harmonization, and the discovery of striking variability in pregnancy-associated proteins such as PZP, LPA, PAPPA, and CA1. These proteins demonstrate patterns that may reflect their unique roles in gestational physiology and pathology. Particularly noteworthy is CA1's dynamic behavior, which closely resembles patterns observed in malignant conditions, while HPX exhibited remarkable stability, suggesting its potential utility as a reference protein in pregnancy studies.
The study also revealed important methodological considerations. While MoM transformation improved comparability between platforms, the moderate post-transformation correlation (R=0.58) for PAPP-A measurements highlights ongoing challenges in cross-method standardization. This finding emphasizes the need for continued refinement of normalization strategies to enable more robust integration of proteomic data across different analytical platforms.
Although the study's moderate sample size and observed methodological variability represent limitations that warrant further investigation in larger cohorts, the current findings make substantial contributions to the field. The establishment of pregnancy-specific reference ranges for fifty-seven consistently detected proteins, including numerous FDA- and CLIA-approved biomarkers, creates a valuable resource for future research. The validated LC-MRM-MS workflow, which meets stringent ICH M10 standards, along with the identification of promising candidate biomarkers, provides a strong foundation for advancing prenatal screening.
Looking ahead, priority should be given to large-scale validation of the identified protein markers in diverse populations, deeper investigation of their biological mechanisms, and development of optimized analytical pipelines. These efforts will be crucial for translating these discoveries into clinical applications. By significantly expanding our understanding of first-trimester proteomic dynamics and demonstrating practical approaches to data standardization, this work represents an important step toward more precise and comprehensive prenatal care.
Supplementary Materials
The following supporting information can be downloaded at: Preprints.org, Figure S1: Raw protein concentration distributions (n=83): (A) Range and central tendency; (B) Inter-protein variability (95th:5th percentile ratio) with threshold (red line at 3). Figure S2: First-trimester maternal serum protein levels (MoM values). Figure S3: Correlation between RobNorm-normalized protein levels and pregnancy-related clinical parameters. Analyzed variables include FMF algorithm-derived risks (PE, IUGR, preterm birth, trisomy 21/18/13; shown as background (_b) and adjusted (_a) risks), uterine artery pulsatility index (UtA-PI), and mean arterial pressure (MAP). Figure S4: Clinically-adjusted maternal serum protein MoM values in first trimester. Figure S5. Adjusted first-trimester serum protein MoM values: comparative analysis with Starodubtseva et al. study. Table S1: Measured protein concentrations across first-trimester serum samples (n=83). Table S2: Protein level coefficients of variation (CV) in QC/calibration standards post-normalization. Table S3: Protein classification according to FDA/CVD/CLIA/PE marker lists. Table S4: Statistical characteristics of RobNorm-normalized proteins. Table S5: Statistical characteristics of non-normalized proteins (raw data). Table S6: MoM value ranges before and after adjustment for clinical confounders. Table S7: Linear models for MoM delta calculations (parameters, coefficients, CI, Wald's, p-values). Table S8: MRM transitions for NAT/SIS peptides (light/heavy) of 139 proteins evaluated by LC-MRM-MS.
Author Contributions
Conceptualization, N.S., A.K., V.F., E.N., and G.S.; data curation, N.S., A.P., A.T., E.K., and A.B. (Alexander Brzhozovskiy); formal analysis, V.F., A.T., and E.K.; funding acquisition, E.N., V.F., N.S., and G.S.; investigation, A.K., A.B. (Anna Bugrova), A.B. (Alexander Brzhozovskiy), E.K., and N.S.; methodology, A.K., A.B. (Anna Bugrova), A.T., E.K., A.P., and E.N.; project administration, E.N., N.S., A.K., V.F., and G.S.; resources, N.S., G.S., E.N., V.F., and A.K.; software, A.T., A.P., A.B. (Anna Bugrova), and A.B. (Alexander Brzhozovskiy); supervision, N.S., A.K., V.F., E.N., and G.S.; validation, A.T., A.B. (Alexander Brzhozovskiy), A.P., and E.K.; visualization, A.T., E.K., V.F., and A.B. (Anna Bugrova); writing—original draft, N.S., A.T., A.B. (Alexander Brzhozovskiy), A.B. (Anna Bugrova), A.P., and E.K.; writing—review and editing, A.K., V.F., E.N., and G.S. All authors have read and agreed to the published version of the manuscript.
Funding
This research was funded by the Russian Science Foundation (№ 24-14-00140).
Institutional Review Board Statement
The study was approved by the Ethical Committee of the National Medical Research Center for Obstetrics, Gynecology and Perinatology named after Academician V.I. Kulakov (protocol No. 2, dated 9 March 2017).
Informed Consent Statement
Informed consent was obtained from all subjects involved in the study.
Data Availability Statement
Data are contained within the Supplementary Material.
Acknowledgments
The authors acknowledge the support of Laboratory of Mass Spectrometry at Skolkovo Institute of Science and Technology for targeted proteomic analysis of blood sample of patients.
Conflicts of Interest
The authors declare no conflicts of interest.
Abbreviations
The following abbreviations are used in this manuscript:
| BMI | Body mass index |
| PE | Preeclampsia |
| IUGR | Intrauterine growth restriction |
| SIS | Stable isotope-labeled standards |
| NAT | Natural synthetic proteotypic peptides |
| CV | Coefficient of variation |
| DIA | Data-independent acquisition |
| ELISA | Enzyme-linked immunosorbent assay |
| PEA | Proximity Extension Assay |
| HLOQ | The highest limit of quantification |
| UHPLC | Ultra-high-performance liquid chromatography |
| LC-MS | Liquid chromatography-mass-spectrometry |
| LLOQ | The lowest limit of quantification |
| LOESS | Locally estimated scatterplot smoothing |
| MoM | Multiply of medians |
| MRM | Multiply reaction monitoring |
| MS | Mass-spectrometry |
| QC | Quality control |
| SPE | Solid phase extraction |
| MAP | Mean arterial pressure |
| UtA-PI | Pulsatility index of the left and right uterine arteries |
References
- Beimers, W.F.; Overmyer, K.A.; Sinitcyn, P.; Lancaster, N.M.; Quarmby, S.T.; Coon, J.J. Technical Evaluation of Plasma Proteomics Technologies. J. Proteome Res. 2025, 24, 3074–3087. [CrossRef]
- Sun, B.B.; Suhre, K.; Gibson, B.W. Promises and Challenges of populational Proteomics in Health and Disease. Mol. Cell. Proteomics 2024, 23, 100786. [CrossRef]
- Čuklina, J.; Lee, C.H.; Williams, E.G.; Sajic, T.; Collins, B.C.; Rodríguez Martínez, M.; Sharma, V.S.; Wendt, F.; Goetze, S.; Keele, G.R.; et al. Diagnostics and correction of batch effects in large-scale proteomic studies: a tutorial. Mol. Syst. Biol. 2021, 17, e10240. [CrossRef]
- Badrick, T. Biological variation: Understanding why it is so important? Pract. Lab. Med. 2021, 23, e00199. [CrossRef]
- Xu, R.; Gong, C.X.; Duan, C.M.; Huang, J.C.; Yang, G.Q.; Yuan, J.J.; Zhang, Q.; Xiong, X.; Yang, Q. Age-Dependent Changes in the Plasma Proteome of Healthy Adults. J. Nutr. Heal. Aging 2020, 24, 846–856. [CrossRef]
- Murtoniemi, K.; Kalapotharakos, G.; Vahlberg, T.; Räikkonen, K.; Kajantie, E.; Hämäläinen, E.; Åkerström, B.; Villa, P.M.; Hansson, S.R.; Laivuori, H. Longitudinal changes in plasma hemopexin and alpha-1-microglobulin concentrations in women with and without clinical risk factors for preeclampsia. PLoS One 2019, 14, e0226520. [CrossRef]
- García-Bailo, B.; Brenner, D.R.; Nielsen, D.; Lee, H.J.; Domanski, D.; Kuzyk, M.; Borchers, C.H.; Badawi, A.; Karmali, M.A.; El-Sohemy, A. Dietary patterns and ethnicity are associated with distinct plasma proteomic groups. Am. J. Clin. Nutr. 2012, 95, 352–361. [CrossRef]
- Kononikhin, A.S.; Starodubtseva, N.L.; Brzhozovskiy, A.G.; Tokareva, A.O.; Kashirina, D.N.; Zakharova, N. V.; Bugrova, A.E.; Indeykina, M.I.; Pastushkova, L.K.; Larina, I.M.; et al. Absolute Quantitative Targeted Monitoring of Potential Plasma Protein Biomarkers: A Pilot Study on Healthy Individuals. Biomedicines 2024, 12, 2403. [CrossRef]
- Kolenc, Z.; Pirih, N.; Gretic, P.; Kunej, T. Top Trends in Multiomics Research: Evaluation of 52 Published Studies and New Ways of Thinking Terminology and Visual Displays. Omi. A J. Integr. Biol. 2021, 25, 681–692. [CrossRef]
- Wishart, D.S.; Bartok, B.; Oler, E.; Liang, K.Y.H.; Budinski, Z.; Berjanskii, M.; Guo, A.; Cao, X.; Wilson, M. MarkerDB: An online database of molecular biomarkers. Nucleic Acids Res. 2021, 49, D1259–D1267. [CrossRef]
- Anderson, N.L. The clinical plasma proteome: A survey of clinical assays for proteins in plasma and serum. Clin. Chem. 2010, 56, 177–185. [CrossRef]
- Ngo, D.; Sinha, S.; Shen, D.; Kuhn, E.W.; Keyes, M.J.; Shi, X.; Benson, M.D.; O’Sullivan, J.F.; Keshishian, H.; Farrell, L.A.; et al. Aptamer-Based Proteomic Profiling Reveals Novel Candidate Biomarkers and Pathways in Cardiovascular Disease. Circulation 2016, 134, 270–285. [CrossRef]
- Jones, J.J.; Wilcox, B.E.; Benz, R.W.; Babbar, N.; Boragine, G.; Burrell, T.; Christie, E.B.; Croner, L.J.; Cun, P.; Dillon, R.; et al. A plasma-based protein marker panel for colorectal cancer detection identified by multiplex targeted mass spectrometry. Clin. Colorectal Cancer 2016, 15, 186-194.e13. [CrossRef]
- Landegren, U.; Hammond, M. Cancer diagnostics based on plasma protein biomarkers: hard times but great expectations. Mol. Oncol. 2021, 15, 1715–1726. [CrossRef]
- Tans, R.; Verschuren, L.; Wessels, H.J.C.T.; Bakker, S.J.L.; Tack, C.J.; Gloerich, J.; van Gool, A.J. The future of protein biomarker research in type 2 diabetes mellitus. Expert Rev. Proteomics 2019, 16, 105–115. [CrossRef]
- Zakharova, N. V; Bugrova, A.E.; Indeykina, M.I.; Fedorova, Y.B.; Kolykhalov, I. V; Gavrilova, S.I.; Nikolaev, E.N.; Kononikhin, A.S. Proteomic Markers and Early Prediction of Alzheimer’s Disease. Biochemistry. (Mosc). 2022, 87, 762–776. [CrossRef]
- Starodubtseva, N.; Tokareva, A.; Kononikhin, A.; Brzhozovskiy, A.; Bugrova, A.; Kukaev, E.; Muminova, K.; Nakhabina, A.; Frankevich, V.E.; Nikolaev, E.; et al. First-Trimester Preeclampsia-Induced Disturbance in Maternal Blood Serum Proteome: A Pilot Study. Int. J. Mol. Sci. 2024, 25, 10653. [CrossRef]
- Starodubtseva, N.L.; Tokareva, A.O.; Volochaeva, M. V.; Kononikhin, A.S.; Brzhozovskiy, A.G.; Bugrova, A.E.; Timofeeva, A. V.; Kukaev, E.N.; Tyutyunnik, V.L.; Kan, N.E.; et al. Quantitative Proteomics of Maternal Blood Plasma in Isolated Intrauterine Growth Restriction. Int. J. Mol. Sci. 2023, 24, 16832. [CrossRef]
- Gaither, C.; Popp, R.; Mohammed, Y.; Borchers, C.H. Determination of the concentration range for 267 proteins from 21 lots of commercial human plasma using highly multiplexed multiple reaction monitoring mass spectrometry. Analyst 2020, 145, 3634–3644. [CrossRef]
- Kitteringham, N.R.; Jenkins, R.E.; Lane, C.S.; Elliott, V.L.; Park, B.K. Multiple reaction monitoring for quantitative biomarker analysis in proteomics and metabolomics. J. Chromatogr. B Anal. Technol. Biomed. Life Sci. 2009, 877, 1229–1239. [CrossRef]
- Geyer, P.E.; Holdt, L.M.; Teupser, D.; Mann, M. Revisiting biomarker discovery by plasma proteomics. Mol. Syst. Biol. 2017, 13, 1–15. [CrossRef]
- Álvez, M.B.; Edfors, F.; von Feilitzen, K.; Zwahlen, M.; Mardinoglu, A.; Edqvist, P.H.; Sjöblom, T.; Lundin, E.; Rameika, N.; Enblad, G.; et al. Next generation pan-cancer blood proteome profiling using proximity extension assay. Nat. Commun. 2023, 14. [CrossRef]
- Kotol, D.; Woessmann, J.; Hober, A.; Álvez, M.B.; Tran Minh, K.H.; Pontén, F.; Fagerberg, L.; Uhlén, M.; Edfors, F. Absolute Quantification of Pan-Cancer Plasma Proteomes Reveals Unique Signature in Multiple Myeloma. Cancers (Basel). 2023, 15. [CrossRef]
- Hüttenhain, R.; Soste, M.; Selevsek, N.; Röst, H.; Sethi, A.; Carapito, C.; Farrah, T.; Deutsch, E.W.; Kusebauch, U.; Moritz, R.L.; et al. Reproducible quantification of cancer-associated proteins in body fluids using targeted proteomics. Sci. Transl. Med. 2012, 4, 142ra94. [CrossRef]
- Bader, J.M.; Albrecht, V.; Mann, M. MS-Based Proteomics of Body Fluids: The End of the Beginning. Mol. Cell. Proteomics 2023, 22, 100577. [CrossRef]
- Ong, S.E.; Mann, M. Mass Spectrometry–Based Proteomics Turns Quantitative. Nat. Chem. Biol. 2005, 1, 252–262. [CrossRef]
- Addona, T.A.; Shi, X.; Keshishian, H.; Mani, D.R.; Burgess, M.; Gillette, M.A.; Clauser, K.R.; Shen, D.; Lewis, G.D.; Farrell, L.A.; et al. A pipeline that integrates the discovery and verification of plasma protein biomarkers reveals candidate markers for cardiovascular disease. Nat. Biotechnol. 2011, 29, 635–643. [CrossRef]
- Tsai, I.J.; Su, E.C.Y.; Tsai, I.L.; Lin, C.Y. Clinical assay for the early detection of colorectal cancer using mass spectrometric wheat germ agglutinin multiple reaction monitoring. Cancers (Basel). 2021, 13, 2190. [CrossRef]
- Bhardwaj, M.; Weigl, K.; Tikk, K.; Holland-Letz, T.; Schrotz-King, P.; Borchers, C.H.; Brenner, H. Multiplex quantitation of 270 plasma protein markers to identify a signature for early detection of colorectal cancer. Eur. J. Cancer 2020, 127, 30–40. [CrossRef]
- Domanski, D.; Percy, A.J.; Yang, J.; Chambers, A.G.; Hill, J.S.; Freue, G.V.C.; Borchers, C.H. MRM-based multiplexed quantitation of 67 putative cardiovascular disease biomarkers in human plasma. Proteomics 2012, 12, 1222–1243. [CrossRef]
- Wortelboer, E.J.; Koster, M.P.H.; Kuc, S.; Eijkemans, M.J.C.; Bilardo, C.M.; Schielen, P.C.J.I.; Visser, G.H.A. Longitudinal trends in fetoplacental biochemical markers, uterine artery pulsatility index and maternal blood pressure during the first trimester of pregnancy. Ultrasound Obstet. Gynecol. 2011, 38, 383–388. [CrossRef]
- Tsiakkas, A.; Duvdevani, N.; Wright, A.; Wright, D.; Nicolaides, K.H. Serum placental growth factor in the three trimesters of pregnancy: Effects of maternal characteristics and medical history. Ultrasound Obstet. Gynecol. 2015, 45, 591–598. [CrossRef]
- Papapavlou Lingehed, G.; Hellberg, S.; Huang, J.; Khademi, M.; Kockum, I.; Carlsson, H.; Tjernberg, I.; Svenvik, M.; Lind, J.; Blomberg, M.; et al. Plasma protein profiling reveals dynamic immunomodulatory changes in multiple sclerosis patients during pregnancy. Front. Immunol. 2022, 13, 1–15. [CrossRef]
- Pernemalm, M.; Sandberg, A.; Zhu, Y.; Boekel, J.; Tamburro, D.; Schwenk, J.M.; Björk, A.; Wahren-Herlenius, M.; Åmark, H.; Östenson, C.G.; et al. In-depth human plasma proteome analysis captures tissue proteins and transfer of protein variants across the placenta. Elife 2019, 8, 1–24. [CrossRef]
- Wright, D.; Silva, M.; Papadopoulos, S.; Wright, A.; Nicolaides, K.H. Serum pregnancy-associated plasma protein-A in the three trimesters of pregnancy: Effects of maternal characteristics and medical history. Ultrasound Obstet. Gynecol. 2015, 46, 42–50. [CrossRef]
- Jiang, Y.; Rex, D.A.B.; Schuster, D.; Neely, B.A.; Rosano, G.L.; Volkmar, N.; Momenzadeh, A.; Peters-Clarke, T.M.; Egbert, S.B.; Kreimer, S.; et al. Comprehensive Overview of Bottom-Up Proteomics Using Mass Spectrometry. ACS Meas. Sci. Au 2024, 4, 338–417. [CrossRef]
- Dubois, E.; Galindo, A.N.; Dayon, L.; Cominetti, O. Assessing normalization methods in mass spectrometry-based proteome profiling of clinical samples. BioSystems 2022, 215–216, 104661. [CrossRef]
- Chua, A.E.; Pfeifer, L.D.; Sekera, E.R.; Hummon, A.B.; Desaire, H. Workflow for Evaluating Normalization Tools for Omics Data Using Supervised and Unsupervised Machine Learning. J. Am. Soc. Mass Spectrom. 2023, 34, 2775–2784. [CrossRef]
- Yalçın, E.; Aslan, S.; Toğaçar, M.; Demir, S.C. A Hybrid Artificial Intelligence Approach for Down Syndrome Risk Prediction in First Trimester Screening. Diagnostics 2025, 15, 1444. [CrossRef]
- Sørensen, S.; Momsen, G.; Sundberg, K.; Friis-Hansen, L.; Jørgensen, F.S. First-trimester risk calculation for trisomy 13, 18, and 21: Comparison of the screening efficiency between 2 locally developed programs and commercial software. Clin. Chem. 2011, 57, 1023–1031. [CrossRef]
- Muñoz-Cortes, M.; Arigita, M.; Falguera, G.; Seres, A.; Guix, D.; Baldrich, E.; Acera, A.; Torrent, A.; Rodriguez-Veret, A.; Lopez-Quesada, E.; et al. Contingent screening for Down syndrome completed in the first trimester: A multicenter study. Ultrasound Obstet. Gynecol. 2012, 39, 396–400. [CrossRef]
- Bugrova, A.E.; Strelnikova, P.A.; Kononikhin, A.S.; Zakharova, N. V; Diyachkova, E.O.; Brzhozovskiy, A.G.; Indeykina, M.I.; Kurochkin, I.N.; Averyanov, A. V; Nikolaev, E.N. Targeted MRM-analysis of plasma proteins in frozen whole blood samples from patients with COVID-19: a retrospective study. Clin. Chem. Lab. Med. 2024. [CrossRef]
- Starodubtseva, N.; Poluektova, A.; Tokareva, A.; Kukaev, E.; Avdeeva, A.; Rimskaya, E.; Khodzayeva, Z. Proteome-Based Maternal Plasma and Serum Biomarkers for Preeclampsia: A Systematic Review and Meta-Analysis. Life 2025, 15, 776. [CrossRef]
- European Medicines Agency ICH guideline M10 on bioanalytical method validation and study sample analysis; 2022; Vol. 44.
- Bhowmick, P.; Roome, S.; Borchers, C.H.; Goodlett, D.R.; Mohammed, Y. An Update on MRMAssayDB: A Comprehensive Resource for Targeted Proteomics Assays in the Community. J. Proteome Res. 2021, 20, 2105–2115. [CrossRef]
- Kuku, K.O.; Oyetoro, R.; Hashemian, M.; Livinski, A.A.; Shearer, J.J.; Joo, J.; Psaty, B.M.; Levy, D.; Ganz, P.; Roger, V.L. Proteomics for heart failure risk stratification: a systematic review. BMC Med. 2024, 22, 1–14. [CrossRef]
- Stakhneva, E.M.; Striukova, E.V.; Ragino, Y.I. Proteomic studies of blood and vascular wall in atherosclerosis. Review. Int. J. Mol. Sci. 2021, 22. [CrossRef]
- Clinical Laboratory Improvement Amendments Available online: https://www.fda.gov/medical-devices/medical-device-databases/clinical-laboratory-improvement-amendments-download-data.
- Rifai, N. Tietz Fundamentals of Clinical Chemistry and Molecular Diagnostics; 8th ed.; Elsevier: Amsterdam, 2018; ISBN 9780323549738.
- Wang, M.; Jiang, L.; Jian, R.; Chan, J.Y.; Liu, Q.; Snyder, M.P.; Tang, H. RobNorm: Model-based robust normalization method for labeled quantitative mass spectrometry proteomics data. Bioinformatics 2021, 37, 815–821. [CrossRef]
- Arend, L.; Adamowicz, K.; Schmidt, J.R.; Burankova, Y.; Zolotareva, O.; Tsoy, O.; Pauling, J.K.; Kalkhof, S.; Baumbach, J.; List, M.; et al. Systematic evaluation of normalization approaches in tandem mass tag and label-free protein quantification data using PRONE. Brief. Bioinform. 2025, 26, bbaf201. [CrossRef]
- Patel, M.A.; Fraser, D.D.; Daley, M.; Cepinskas, G.; Veraldi, N.; Grazioli, S. The plasma proteome differentiates the multisystem inflammatory syndrome in children (MIS-C) from children with SARS-CoV-2 negative sepsis. Mol. Med. 2024, 30. [CrossRef]
- Kronenberg, F.; Utermann, G. Lipoprotein(a): Resurrected by genetics. J. Intern. Med. 2013, 273, 6–30. [CrossRef]
- Tsimikas, S. A Test in Context: Lipoprotein(a): Diagnosis, Prognosis, Controversies, and Emerging Therapies. J. Am. Coll. Cardiol. 2017, 69, 692–711. [CrossRef]
- Kronenberg, F. Lipoprotein(a). Handb. Exp. Pharmacol. 2022, 270, 201–232. [CrossRef]
- Patel, A.P.; Wang, M.; Pirruccello, J.P.; Ellinor, P.T.; Ng, K.; Kathiresan, S.; Khera, A. V. Lp(a) (Lipoprotein[a]) Concentrations and Incident Atherosclerotic Cardiovascular Disease New Insights from a Large National Biobank. Arterioscler. Thromb. Vasc. Biol. 2021, 41, 465–474. [CrossRef]
- Bergmark, C.; Dewan, A.; Orsoni, A.; Merki, E.; Miller, E.R.; Shin, M.J.; Binder, C.J.; Hörkkö, S.; Krauss, R.M.; Chapman, M.J.; et al. A novel function of lipoprotein [a] as a preferential carrier of oxidized phospholipids in human plasma. J. Lipid Res. 2008, 49, 2230–2239. [CrossRef]
- Van Der Valk, F.M.; Bekkering, S.; Kroon, J.; Yeang, C.; Van Den Bossche, J.; Van Buul, J.D.; Ravandi, A.; Nederveen, A.J.; Verberne, H.J.; Scipione, C.; et al. Oxidized phospholipids on Lipoprotein(a) elicit arterial wall inflammation and an inflammatory monocyte response in humans. Circulation 2016, 134, 611–624. [CrossRef]
- Ekelund, L.; Laurell, C.B. The pregnancy zone protein response during gestation: A metabolic challenge. Scand. J. Clin. Lab. Invest. 1994, 54, 623–629. [CrossRef]
- Fosheim, I.K.; Jacobsen, D.P.; Sugulle, M.; Alnaes-Katjavivi, P.; Fjeldstad, H.E.S.; Ueland, T.; Lekva, T.; Staff, A.C. Serum amyloid A1 and pregnancy zone protein in pregnancy complications and correlation with markers of placental dysfunction. Am. J. Obstet. Gynecol. MFM 2023, 5, 100794. [CrossRef]
- Gao, G.; Xuan, C.; Yang, Q.; Liu, X.C.; Liu, Z.G.; He, G.W. Identification of Altered Plasma Proteins by Proteomic Study in Valvular Heart Diseases and the Potential Clinical Significance. PLoS One 2013, 8. [CrossRef]
- Kim, Y.; Kang, U.B.; Kim, S.; Lee, H.B.; Moon, H.G.; Han, W.; Noh, D.Y. A validation study of a multiple reaction monitoring-based proteomic assay to diagnose breast cancer. J. Breast Cancer 2020, 23, 113–114. [CrossRef]
- Youssef, L.; Erlandsson, L.; Åkerström, B.; Miranda, J.; Paules, C.; Crovetto, F.; Crispi, F.; Gratacos, E.; Hansson, S.R. Hemopexin and α1-microglobulin heme scavengers with differential involvement in preeclampsia and fetal growth restriction. PLoS One 2020, 15, 1–13. [CrossRef]
- Kalapotharakos, G.; Murtoniemi, K.; Åkerström, B.; Hämäläinen, E.; Kajantie, E.; Räikkönen, K.; Villa, P.; Laivuori, H.; Hansson, S.R. Plasma heme scavengers alpha-1microglobulin and hemopexin as biomarkers in high-risk pregnancies. Front. Physiol. 2019, 10, 300. [CrossRef]
- Anderson, U.D.; Gram, M.; Ranstam, J.; Thilaganathan, B.; Åkerström, B.; Hansson, S.R. Fetal hemoglobin, α1-microglobulin and hemopexin are potential predictive first trimester biomarkers for preeclampsia. Pregnancy Hypertens. 2016, 6, 103–109. [CrossRef]
- Smith, G.C.S.; Stenhouse, E.J.; Crossley, J.A.; Aitken, D.A.; Cameron, A.D.; Michael Connor, J. Early pregnancy levels of pregnancy-associated plasma protein A and the risk of intrauterine growth restriction, premature birth, preeclampsia, and stillbirth. J. Clin. Endocrinol. Metab. 2002, 87, 1762–1767. [CrossRef]
- Krantz, D.; Goetzl, L.; Simpson, J.L.; Thom, E.; Zachary, J.; Hallahan, T.W.; Silver, R.; Pergament, E.; Platt, L.D.; Filkins, K.; et al. Association of extreme first-trimester free human chorionic gonadotropin-β, pregnancy-associated plasma protein A, and nuchal translucency with intrauterine growth restriction and other adverse pregnancy outcomes. Am. J. Obstet. Gynecol. 2004, 191, 1452–1458. [CrossRef]
- Livrinova, V.; Petrov, I.; Samardziski, I.; Jovanovska, V.; Boshku, A.A.; Todorovska, I.; Dabeski, D.; Shabani, A. Clinical importance of low level of PAPP-A in first trimester of pregnancy-An obstetrical dilemma in chromosomally normal fetus. Open Access Maced. J. Med. Sci. 2019, 7, 1475–1479. [CrossRef]
- Dugoff, L.; Hobbins, J.C.; Malone, F.D.; Porter, T.F.; Luthy, D.; Comstock, C.H.; Hankins, G.; Berkowitz, R.L.; Merkatz, I.; Craigo, S.D.; et al. First-trimester maternal serum PAPP-A and free-beta subunit human chorionic gonadotropin concentrations and nuchal translucency are associated with obstetric complications: A population-based screening study (The FASTER Trial). Am. J. Obstet. Gynecol. 2004, 191, 1446–1451. [CrossRef]
- Savvidou, M.D.; Syngelaki, A.; Muhaisen, M.; Emelyanenko, E.; Nicolaides, K.H. First trimester maternal serum free β-human chorionic gonadotropin and pregnancy-associated plasma protein A in pregnancies complicated by diabetes mellitus. BJOG An Int. J. Obstet. Gynaecol. 2012, 119, 410–416. [CrossRef]
- Caliskan, R.; Atis, A.; Aydin, Y.; Acar, D.; Kiyak, H.; Topbas, F. PAPP-A concentrations change in patients with gestational diabetes. J. Obstet. Gynaecol. (Lahore). 2020, 40, 190–194. [CrossRef]
- Poon, L.C.Y.; Zymeri, N.A.; Zamprakou, A.; Syngelaki, A.; Nicolaides, K.H. Protocol for measurement of mean arterial pressure at 11-13 weeks’ gestation. Fetal Diagn. Ther. 2012, 31, 42–48. [CrossRef]
- Plasencia, W.; Maiz, N.; Bonino, S.; Kaihura, C.; Nicolaides, K.H. Uterine artery Doppler at 11 + 0 to 13 + 6 weeks in the prediction of preeclampsia. Ultrasound Obstet. Gynecol. 2007, 30, 742–749. [CrossRef]
- MacLean, B.X.; Pratt, B.S.; Egertson, J.D.; MacCoss, M.J.; Smith, R.D.; Baker, E.S. Using Skyline to Analyze Data-Containing Liquid Chromatography, Ion Mobility Spectrometry, and Mass Spectrometry Dimensions. J. Am. Soc. Mass Spectrom. 2018, 29, 2182–2188. [CrossRef]
- Lee, J.; Park, J.; Lim, M.S.; Seong, S.J.; Seo, J.J.; Park, S.M.; Lee, H.W.; Yoon, Y.R. Quantile normalization approach for liquid chromatography- mass spectrometry-based metabolomic data from healthy human volunteers. Anal. Sci. 2012, 28, 801–805. [CrossRef]
- Ballman, K. V.; Grill, D.E.; Oberg, A.L.; Therneau, T.M. Faster cyclic loess: Normalizing RNA arrays via linear models. Bioinformatics 2004, 20, 2778–2786. [CrossRef]
- Bolstad, B.M.; Irizarry, R.A.; Astrand, M.; Speed, T.P. A comparison of normalization methods for high density oligonucleotide array data based on variance and bias. Bioinformatics 2003, 19, 185–193. [CrossRef]
- Johnson, W.E.; Li, C.; Rabinovic, A. Adjusting batch effects in microarray expression data using empirical Bayes methods. Biostatistics 2007, 8, 118–127. [CrossRef]
- Leek, J.T.; Johnson, W.E.; Parker, H.S.; Jaffe, A.E.; Storey, J.D. The SVA package for removing batch effects and other unwanted variation in high-throughput experiments. Bioinformatics 2012, 28, 882–883. [CrossRef]
- Ritchie, M.E.; Phipson, B.; Wu, D.; Hu, Y.; Law, C.W.; Shi, W.; Smyth, G.K. Limma powers differential expression analyses for RNA-sequencing and microarray studies. Nucleic Acids Res. 2015, 43, e47. [CrossRef]
- Wickham, H. Reshaping data with the reshape package. J. Stat. Softw. 2007, 21, 1–20.
- Wickham, H. Elegant Graphics for Data Analysis: ggplot2; 2008; ISBN 978-0-387-78170-9.
- Kolde, R. pheatmap: Pretty Heatmaps; 2025.
Figure 1.
Protein variability assessment using mean CV in calibration standards (A–H) and quality control (QC-A, QC-B, and QC-C) under five data processing approaches: (A) raw data, (B) quantile normalization, (C) LOESS normalization, (D) RobNorm normalization, and (E) ComBat normalization. The red dashed line represents the study's maximum permitted CV threshold (20%), highlighting proteins exceeding acceptable variability.
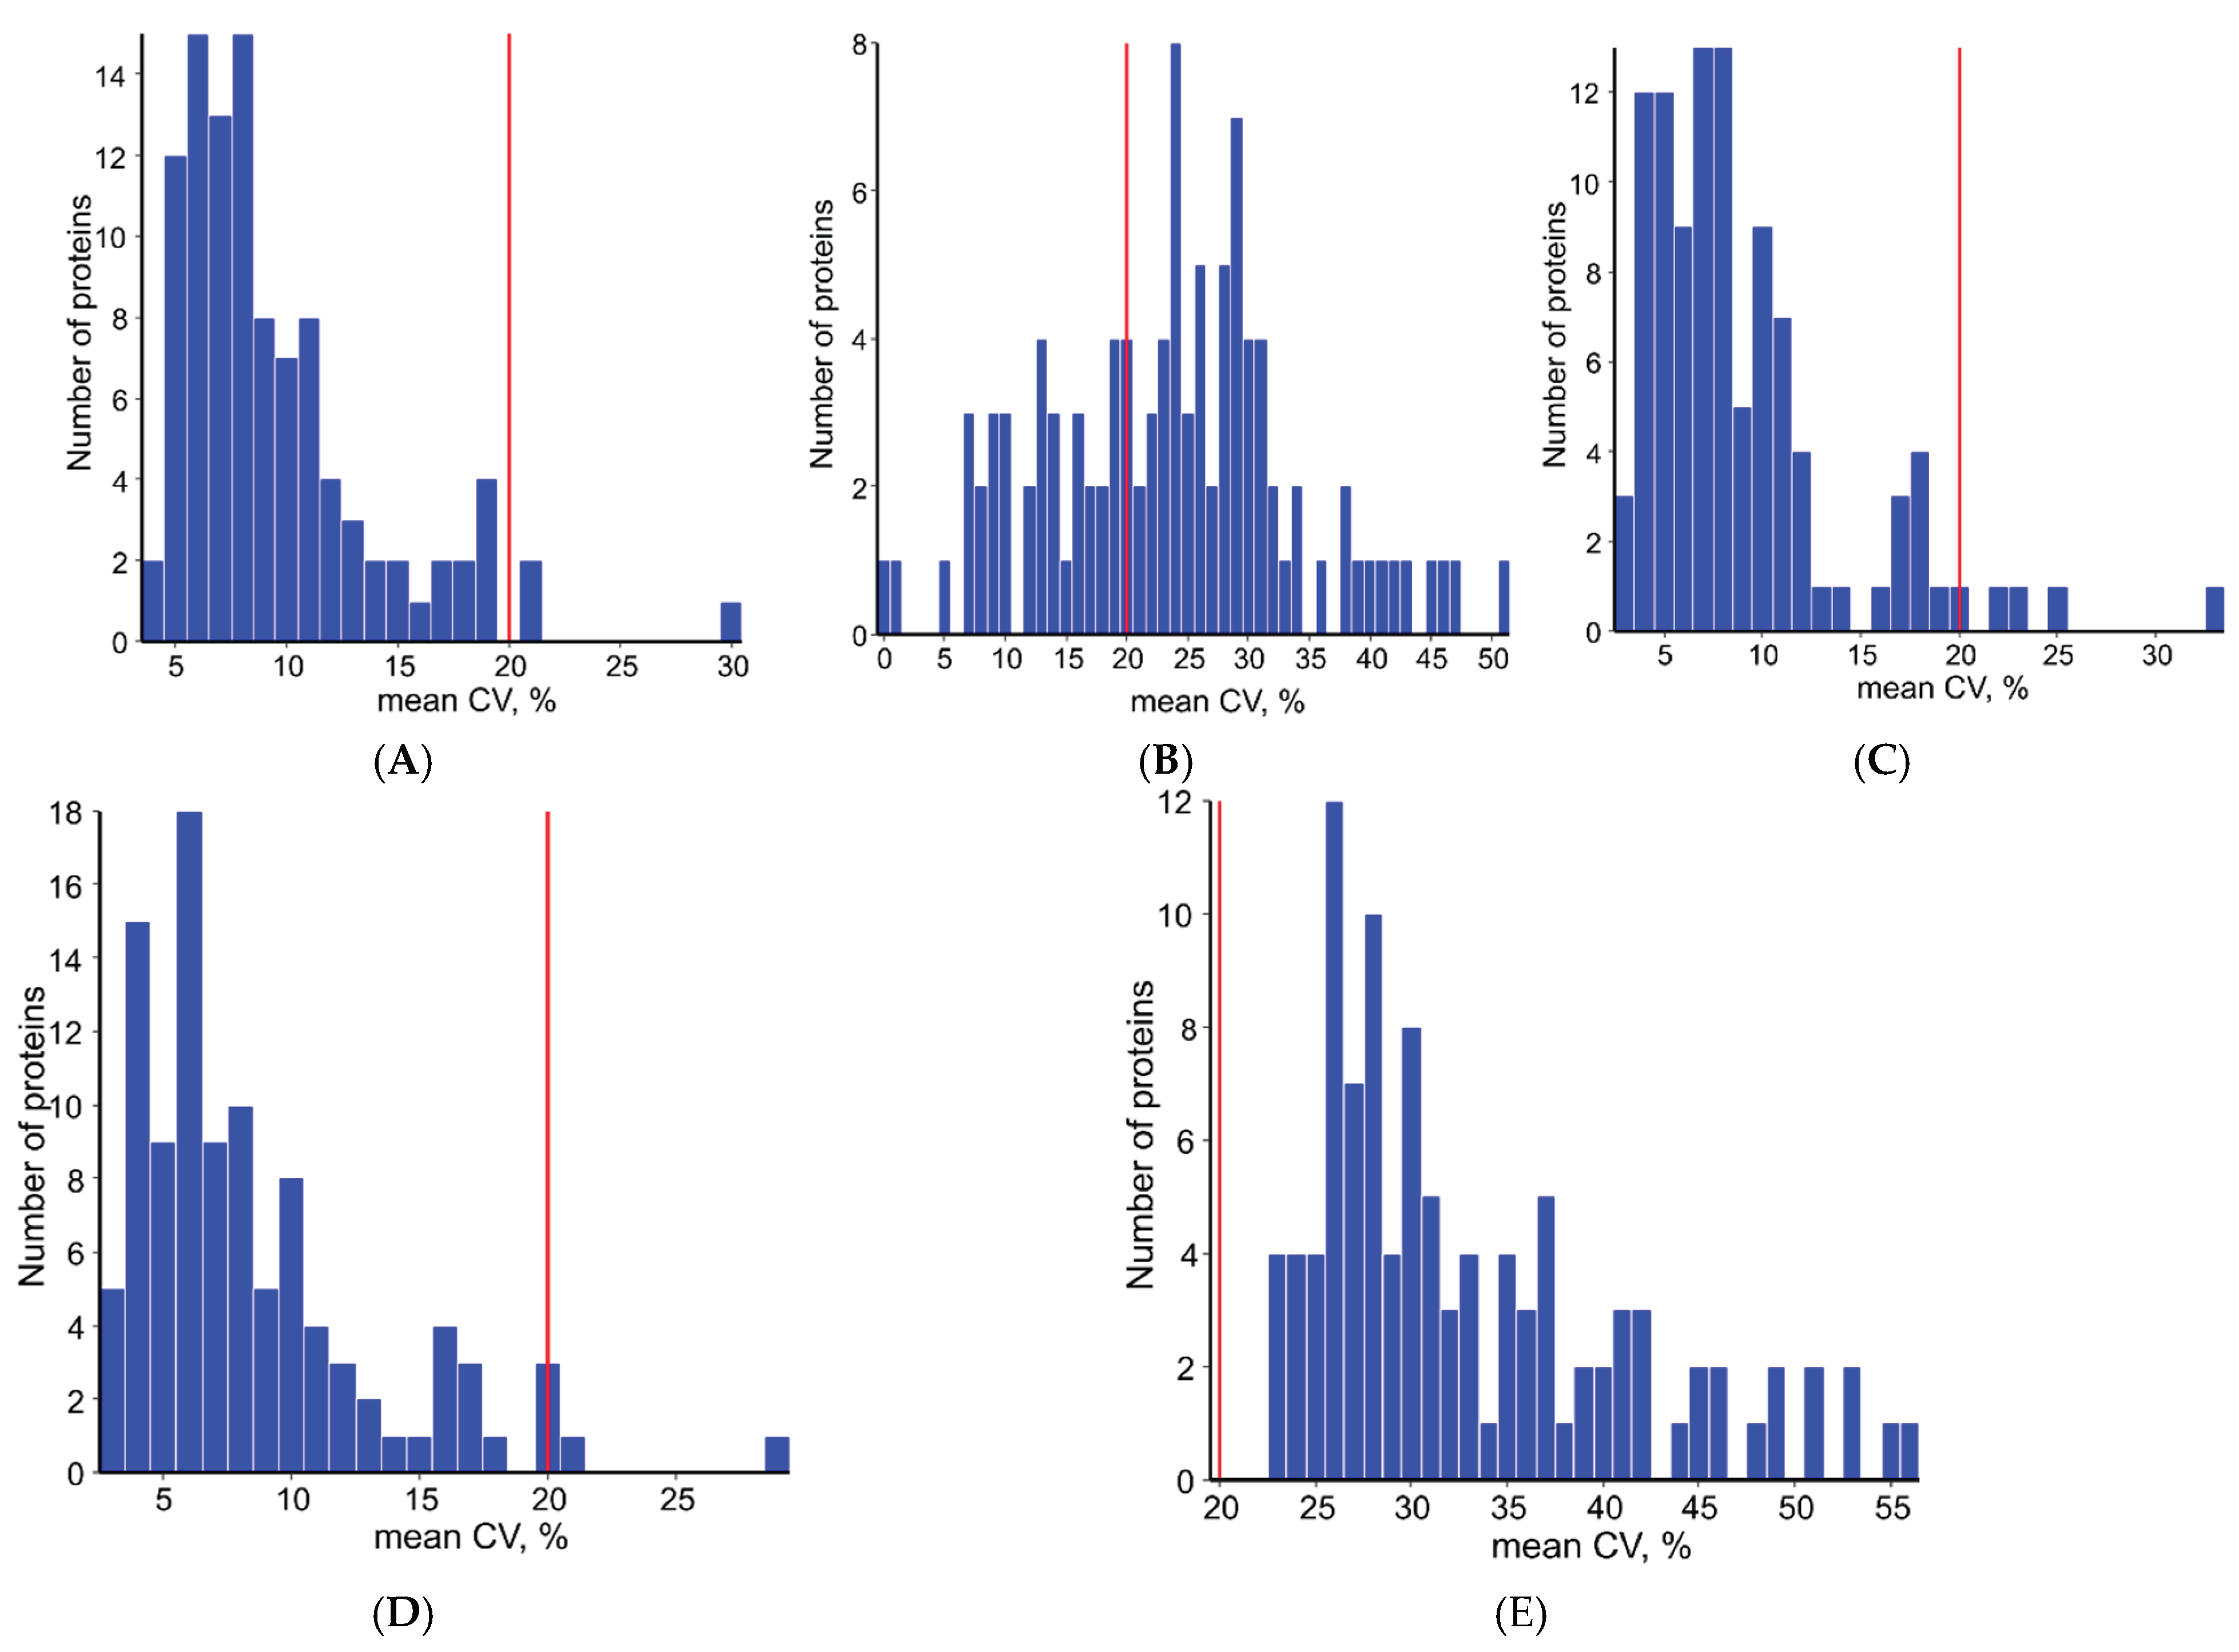
Figure 2.
Visualization of normalization efficacy on batch effects using principal component analysis: (A) raw data exhibits strong batch clustering, while (B) LOESS and (C) RobNorm normalization show progressively improved sample mixing, indicating effective technical artifact removal.
Figure 2.
Visualization of normalization efficacy on batch effects using principal component analysis: (A) raw data exhibits strong batch clustering, while (B) LOESS and (C) RobNorm normalization show progressively improved sample mixing, indicating effective technical artifact removal.
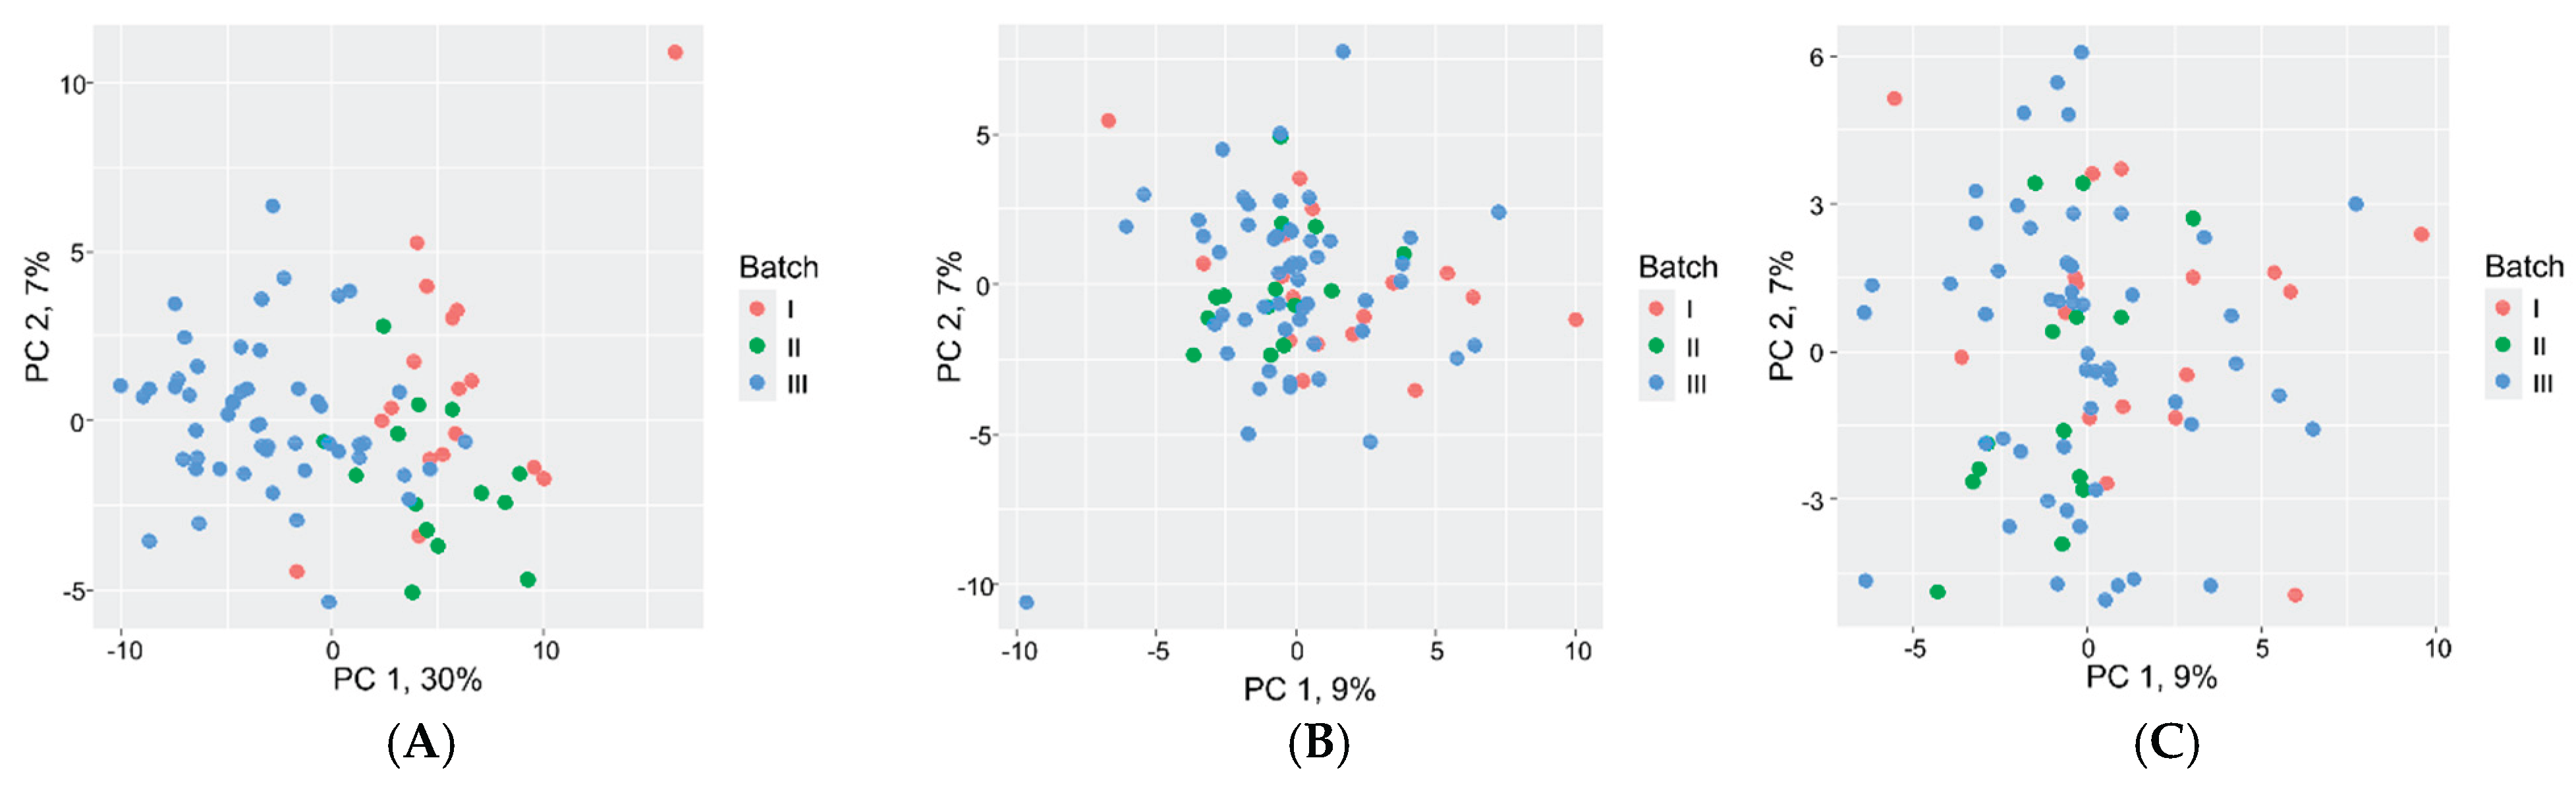
Figure 3.
Protein concentration profiles after RobNorm normalization (n=83): (A) Distribution metrics (range, central tendency); (B) Variability analysis (95th:5th percentile ratios; threshold=3, red line).
Figure 3.
Protein concentration profiles after RobNorm normalization (n=83): (A) Distribution metrics (range, central tendency); (B) Variability analysis (95th:5th percentile ratios; threshold=3, red line).
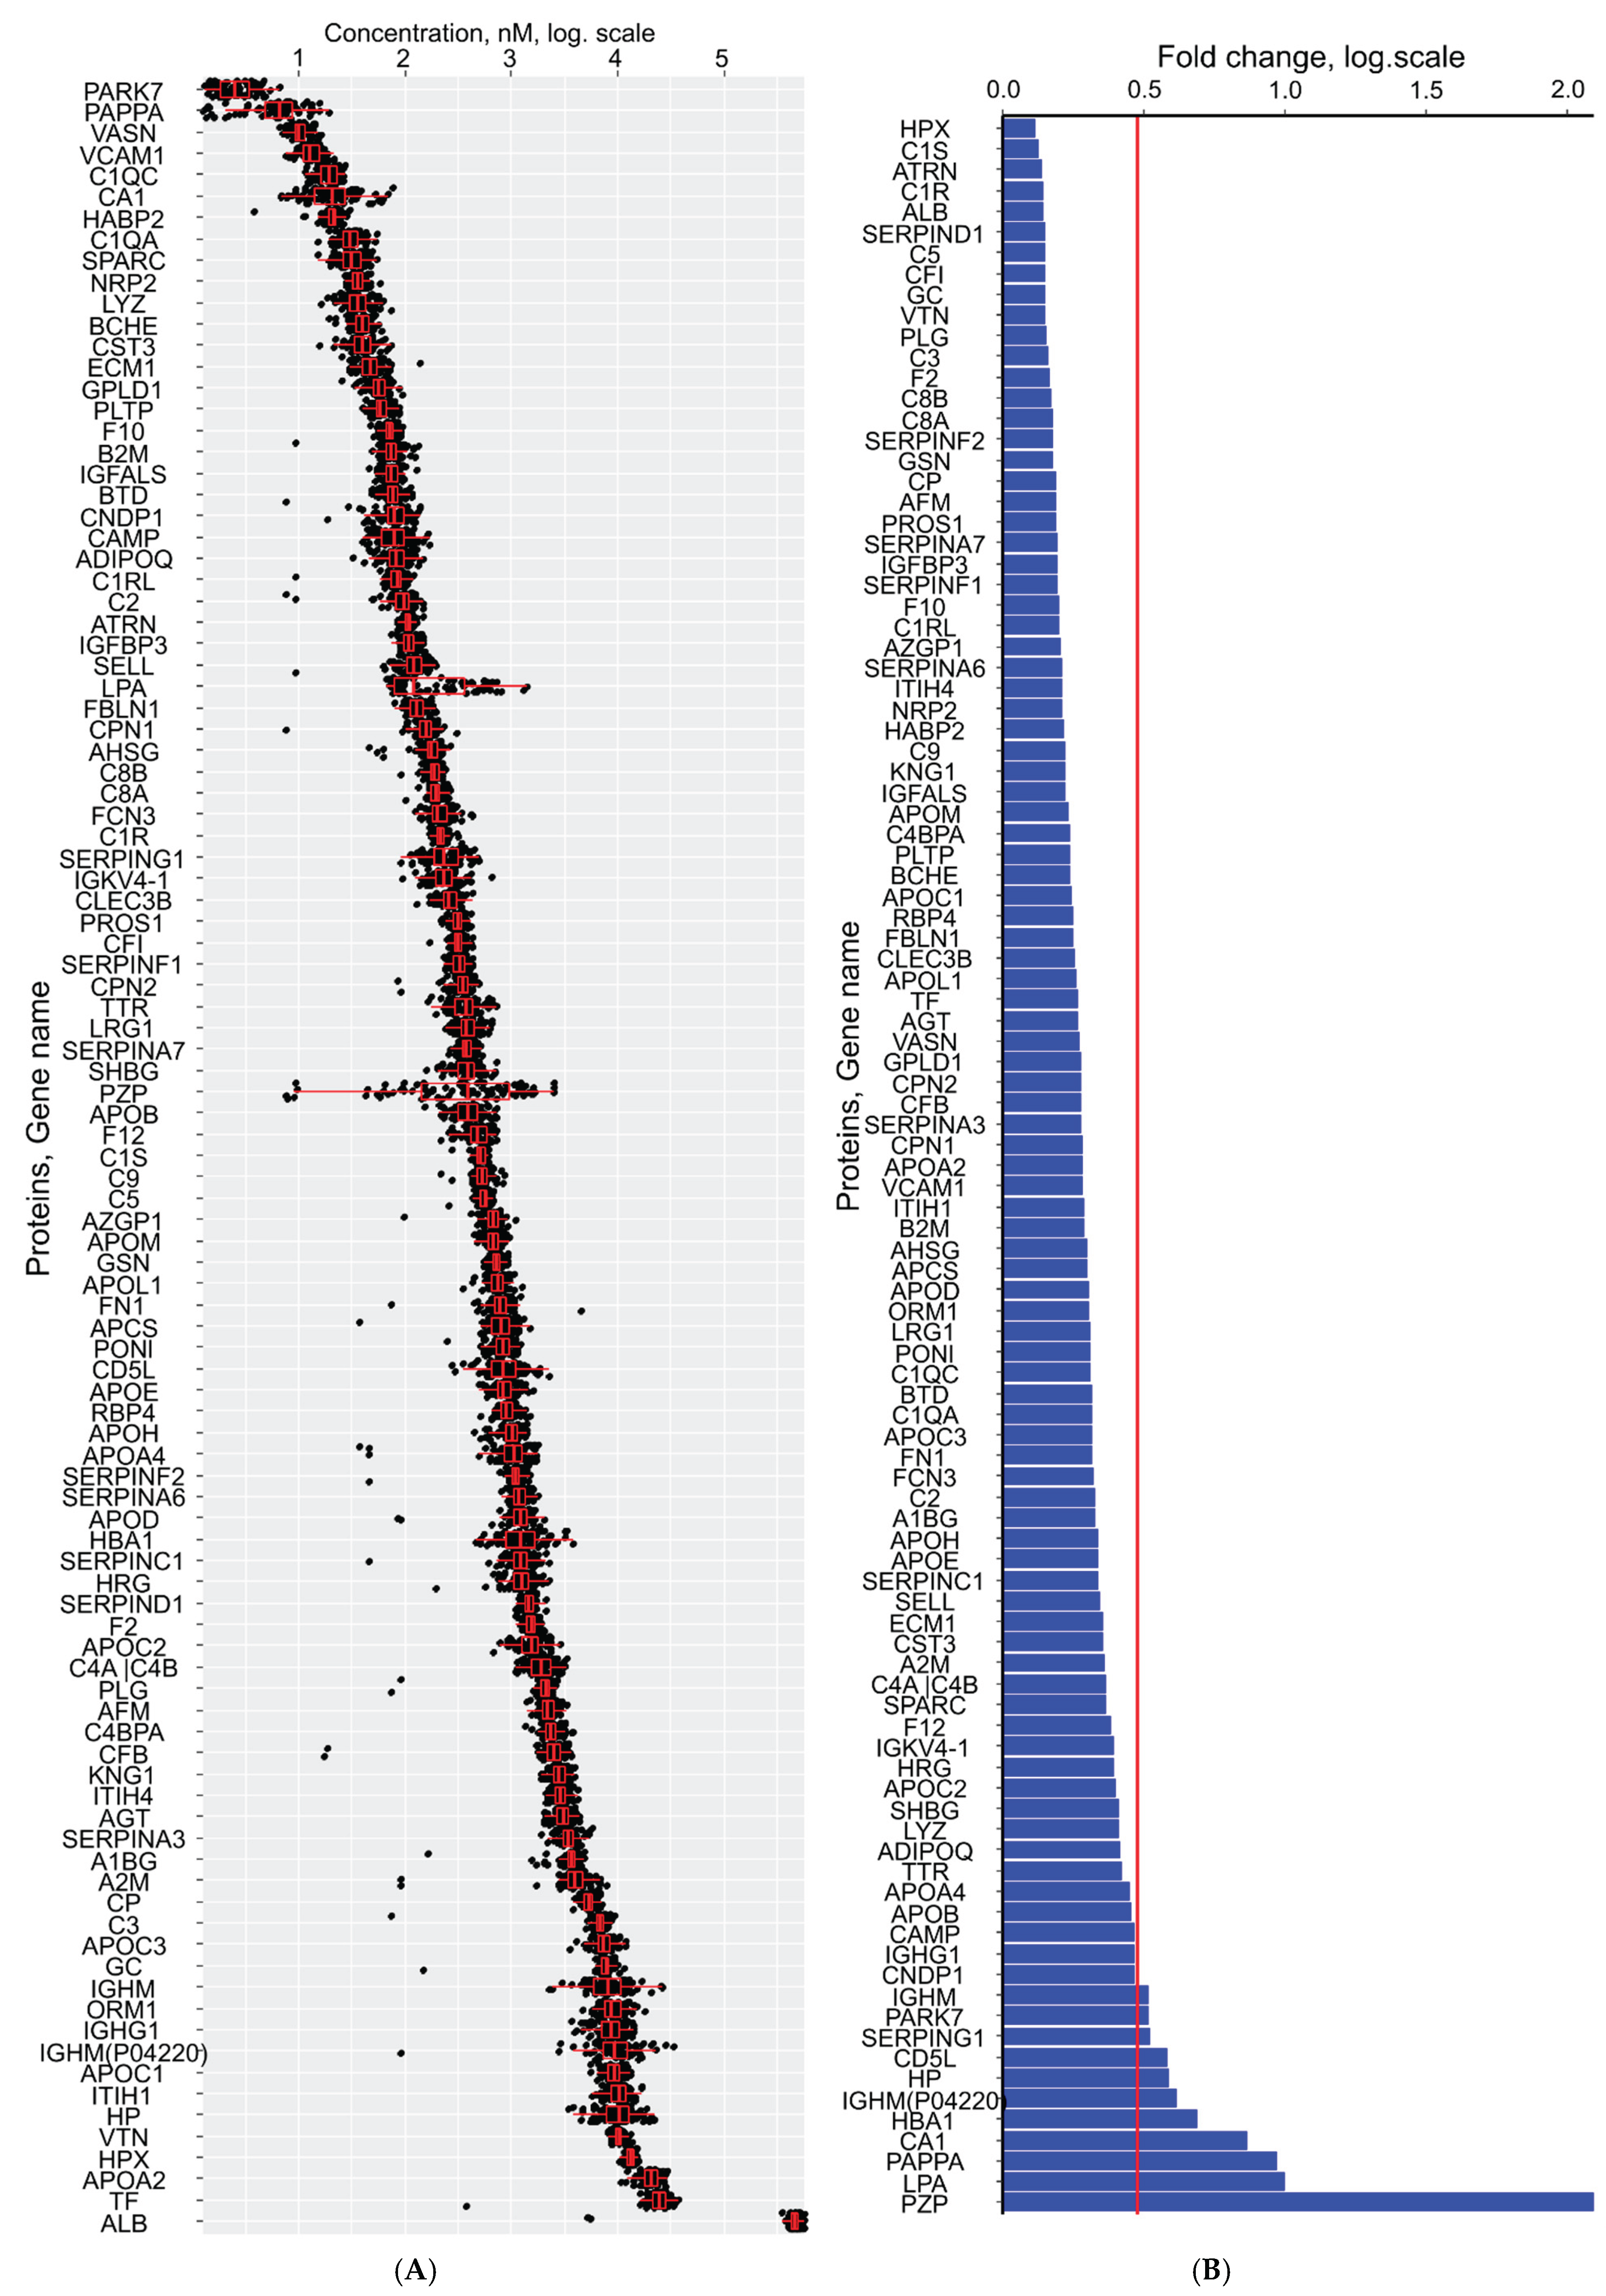
Figure 4.
Concordance between first-trimester serum proteomes (LC-MRM-MS). (A) Overlap of quantified proteins between the current study (n=83) and healthy pregnancies from Starodubtseva et al. (n=13) [17]. (B) Principal component analysis of batch-adjusted and MoM-normalized proteomic profiles from both cohorts.
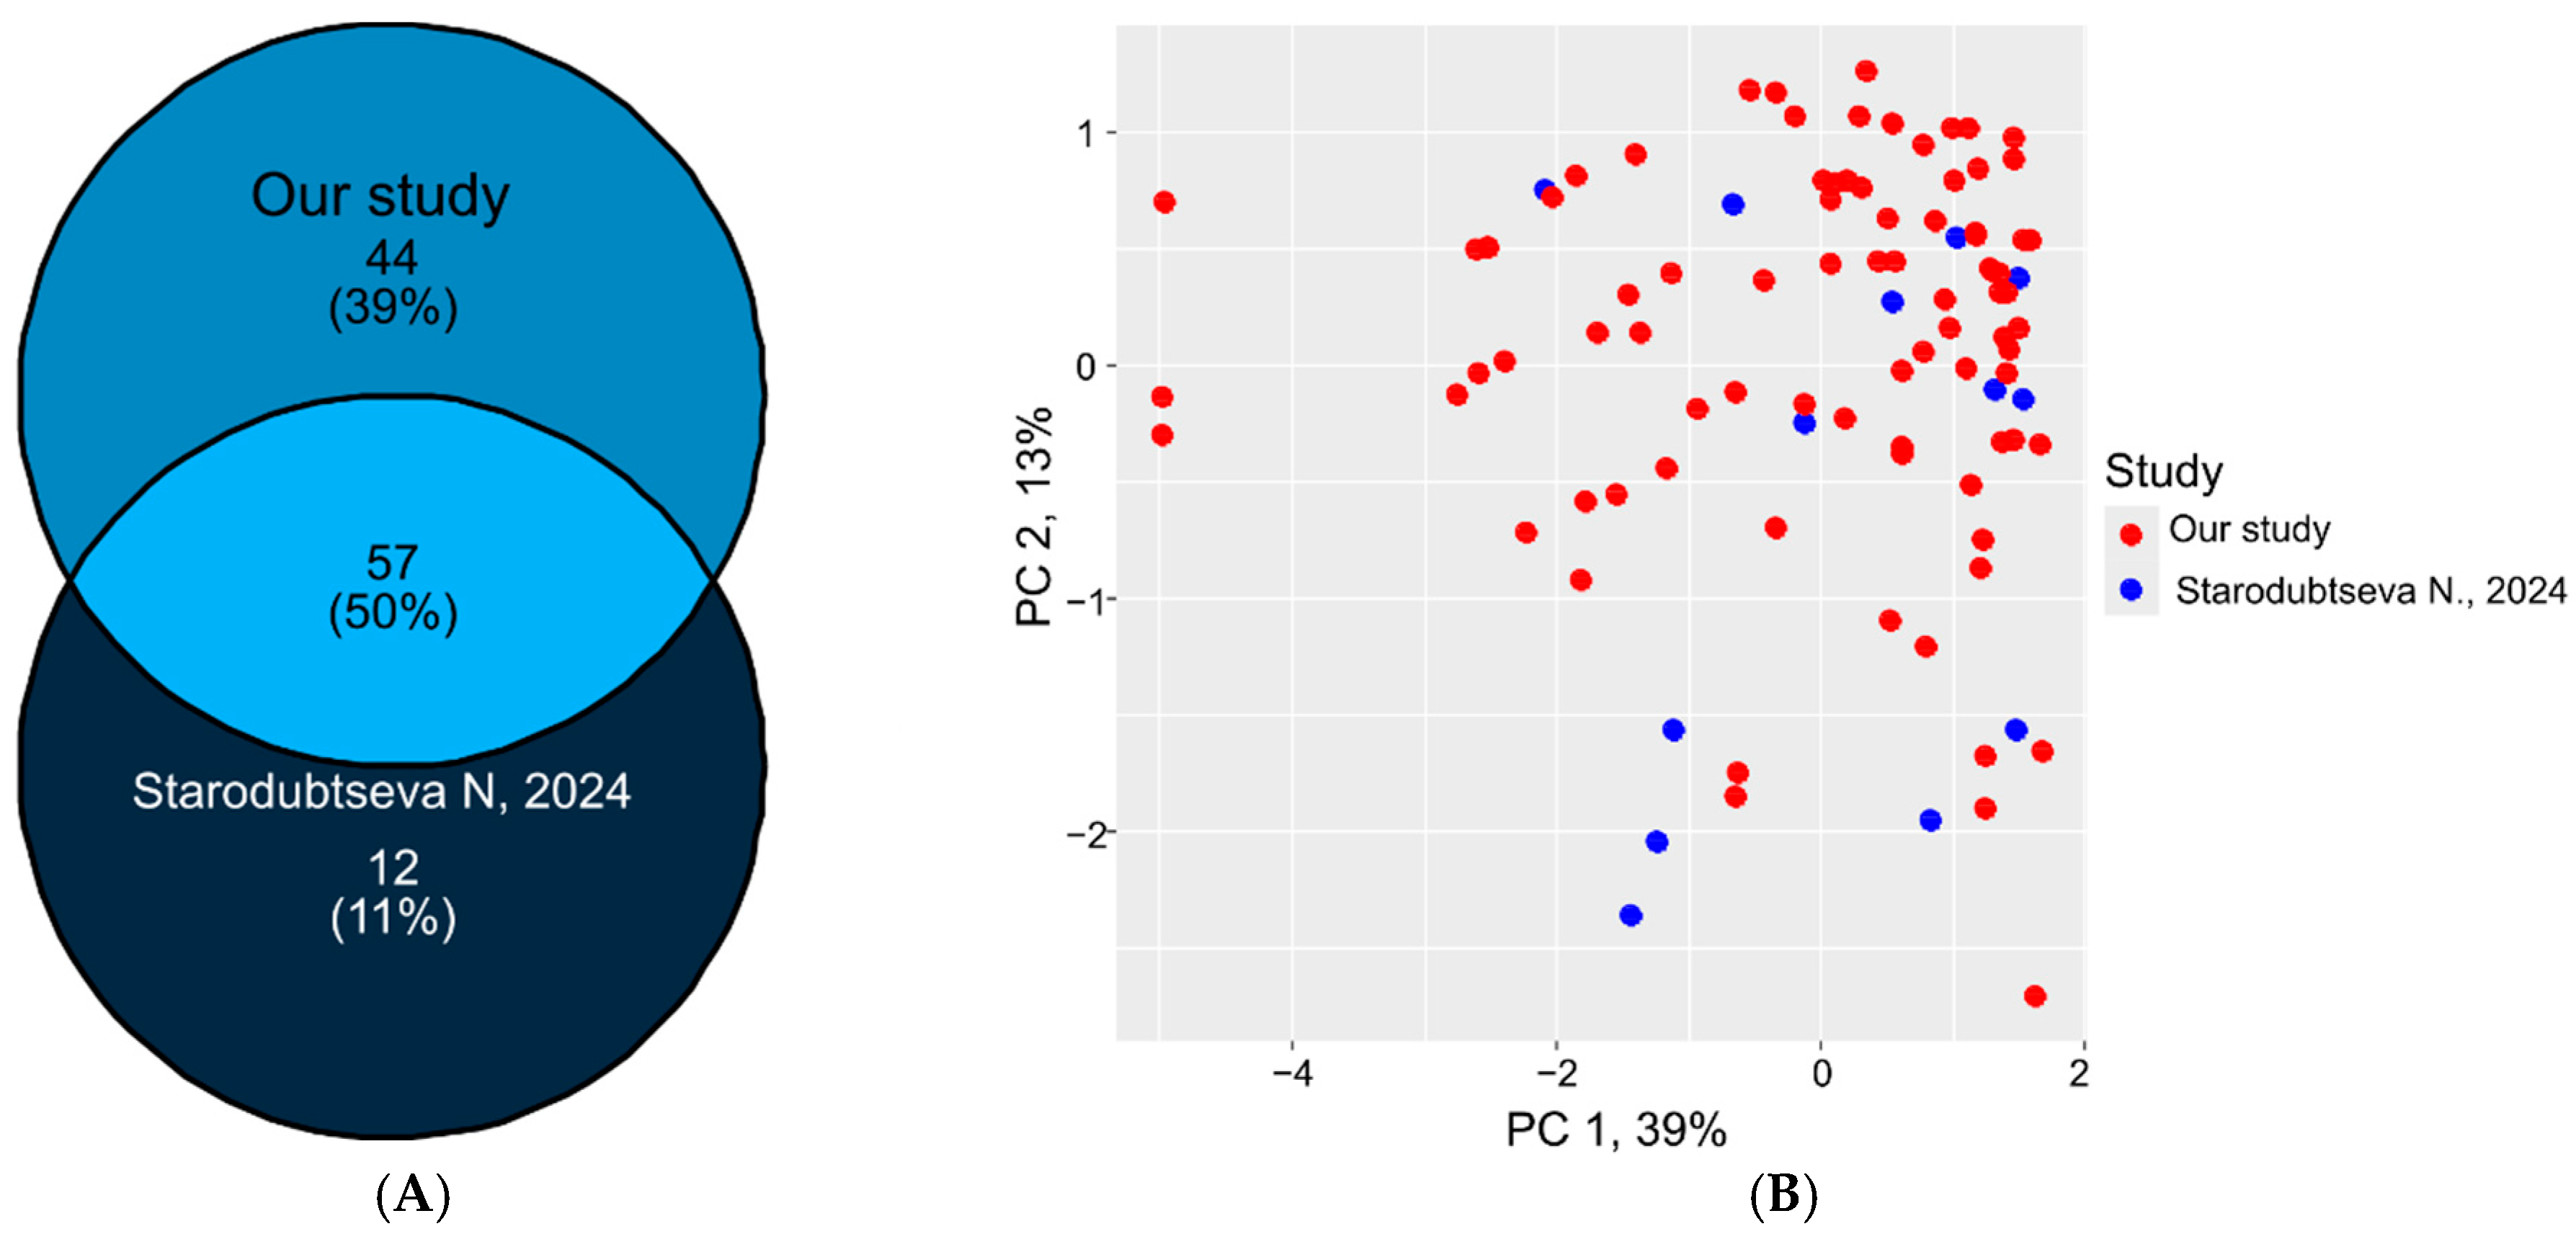

Table 1.
Clinical characteristics of patients. Continuous variables were reported as median (1st quartile; 3rd quartile) with minimum and maximum values. Categorical variables were presented as frequency counts and percentages within the group. BMI – body mass index, PAPPA - Pregnancy-associated plasma protein A, PlGF - Placental growth factor, hCG - human chorionic gonadotropin, MoM - multiples of the median, MAP - mean arterial pressure, UtA-PI - pulsatility index of the left and right uterine arteries, PE – preeclampsia, IUGR - intrauterine growth restriction.
| Clinical Characteristic | Value |
|---|---|
| Age, years | 30.5 (27.4; 32.8) 20.5 - 37.3 |
| BMI, kg/m2 | 21.2 (19.2; 23.0) 15.6 - 30.1 |
| Gestational age at blood collection, weeks | 12.4 (12.1; 12.9) 11.3 - 13.9 |
| Gestational age at delivery, weeks | 39.5 (39; 40.2) 37.5 - 41.2 |
| Uterine myoma, n(%) | 8(10%) |
| Anemia during pregnancy, n(%) | 27(33%) |
| Fetal sex (male) | 41(49%) |
| Parity, n(%) | 1 - 40(48%) 2 - 32(39%) 3 - 10(12%) 4 - 1(1%) |
| 1st screening | |
| PAPPA, mLU/mL | 3.03 (2.08; 4.59) 0.598 - 9.761 |
| PAPPA, MoM | 0.95 (0.65; 1.47) 0.196 - 4.271 |
| PlGF, pg/ml | 25.3 (20.2; 35) 13.3 - 54 |
| PlGF, MoM | 0.84 (0.61; 1.03) 0.374 - 1.521 |
| free β-HGC, ng/ml | 52.61 (37.38; 75.54) 12.57 - 224.31 |
| free β-HGC, MoM | 0.99 (0.78; 1.2) 0.533 - 1.667 |
| UtA-PI | 1.57 (1.29; 2.02) 0.89 - 2.655 |
| UtA-PI, MoM | 0.99 (0.78; 1.2) 0.533 - 1.667 |
| MAP, mmHg | 83.33 (77.46; 86.46) 66 - 98.833 |
| MAP, MoM | 0.98 (0.94; 1.04) 0.8027 - 1.1755 |
| Risk of PE | 1357.5 (516.75; 2816.5) 63 - 15320 |
| Risk of IUGR | 554 (377; 877) 81 - 2501 |
| Risk of preterm delivery | 2115.5 (890; 3209.75) 5 - 5026 |
Table 2.
List of proteins exhibiting statistically significant (p<0.05) linear relationships with maternal/fetal clinical characteristics. Proteins dependent on two or more clinical factors are highlighted in bold.
Table 2.
List of proteins exhibiting statistically significant (p<0.05) linear relationships with maternal/fetal clinical characteristics. Proteins dependent on two or more clinical factors are highlighted in bold.
| Clinical | Direction of Association | Protein (Gene Name) |
|---|---|---|
| BMI | direct | ATRN, CA4BPA, CP, F12, C1QA, C1R, C3, CFB, CFI, HP, HABP2, APCS |
| reverse | AHSG, SERPINC1, APOA4, APOD, CA1, HBA1, IGFBP3, SERPING1, AZGP1 | |
| Age | direct | SERPIND1 |
| reverse | A2M | |
| Parity | direct | AGT, APOC3, CNDP1, CA1, IGHG1, KNG1, PLG |
| reverse | ATRN, F12, SERPINA6, SELL, PAPPA, ALB | |
| Gestational age at blood collection | direct | VTN |
| reverse | HRG | |
| Uterine myoma | direct | KNG1 |
| reverse | APOA4, SPARC | |
| Male fetal sex | direct | BTD, CA1 |
| reverse | SERPINA3, APOH, CP, C5, C9, HBA1, LRG1, PROS1, AZGP1 |
Table 3.
Association according Pearson’s test between PAPPA levels, quantified and processed two methods.
Table 3.
Association according Pearson’s test between PAPPA levels, quantified and processed two methods.
| Screening | LC-MS | R | p-Value |
|---|---|---|---|
| IU/ml | nM | 0.65 | <0.001 |
| MoM | nM | 0.56 | <0.001 |
| MoM | MoM | 0.58 | <0.001 |
Disclaimer/Publisher’s Note: The statements, opinions and data contained in all publications are solely those of the individual author(s) and contributor(s) and not of MDPI and/or the editor(s). MDPI and/or the editor(s) disclaim responsibility for any injury to people or property resulting from any ideas, methods, instructions or products referred to in the content. |
© 2025 by the authors. Licensee MDPI, Basel, Switzerland. This article is an open access article distributed under the terms and conditions of the Creative Commons Attribution (CC BY) license (http://creativecommons.org/licenses/by/4.0/).
Copyright: This open access article is published under a Creative Commons CC BY 4.0 license, which permit the free download, distribution, and reuse, provided that the author and preprint are cited in any reuse.


