Submitted:
22 July 2025
Posted:
24 July 2025
You are already at the latest version
Abstract
The Hubble-Lemaître law plays a fundamental role in cosmology. It describes the expanding Universe in terms of the velocity-distance relationship of galaxies. This review is focussed on observations, and challenges the long-held assumption that gravitationally bound bodies do not take part in cosmological expansion. Over fifty years ago it was noted that the measured rate of recession of the Moon from the Earth was close to that predicted by the Hubble-Lemaître law. That was, and continues to be, regarded by many as a coincidence. However, in the past few years, considerable further evidence has accumulated to show that many similar ‘coincidences’ occur throughout the Solar System. The conventional explanation for the orbital expansion of planetary moons is framed in terms of tidal effects, but this requires many assumptions about tidal heat flows and dissipation factors. In contrast, Hubble-Lemaître flow provides a far simpler explanation without invoking any other theoretical basis. It is concluded that while tidal effects certainly contribute to orbital evolution, they are far less important than the cosmological contribution. Furthermore, considerable indirect evidence supports the conclusion that cosmological expansion operates locally, for example the Faint Young Sun Paradox and the anomalously large orbit of Neptune.
Keywords:
cosmology
; Hubble-Lemaître law
; planets
; moons
; recession
; local expansion
; tidal theory
1. Introduction
“An important scientific innovation rarely makes its way by gradually winning over and converting its opponents: it rarely happens that Saul becomes Paul. What does happen is that its opponents gradually die out, and that the growing generation is familiarized with the ideas from the beginning…” Max Planck, 1950
1.1. Gravitationally Bound Systems: The Current Paradigm
The Hubble-Lemaître law plays a fundamental role in cosmology. It describes the expanding Universe in terms of the relationship between the recessional velocity (v) and the distance (r) of galaxies, i.e., v = (H0)r, where H0 is the current value of the Hubble-Lemaître parameter. It is generally stated that this expansion does not operate at the local level by which is meant, for example, not just planetary systems but between the stars and other matter within individual galaxies and even between some galaxies. The conventional view is that expansion is unable to overcome the force of gravitational attraction. However, that assumes expansion is a force. But since it seems to operate on all matter equally regardless of mass then it is clearly not a force in the Newtonian sense. It is better seen as an expansion of space itself. In earlier times it was assumed that the expansion of the Universe was a result of a primeval ‘Big Bang’. In the past few decades, the Λ-CDM cosmological model has gained wide acceptance; it suggests that an accelerating expansion is driven by dark energy, the dominant form of mass-energy in the Universe. The source and physical basis of dark energy remains unclear, but it must pervade all parts of the Universe.
The belief that gravitationally bound systems do not share the universal cosmological expansion is widespread. Statements to that effect can be found in books on astronomy such as that by the Astronomer Royal [1] where we read: “…at a local scale, gravity dominates over cosmological expansion and holds matter together. The scale at which this happens is surprisingly large – even entire clusters of galaxies resist expansion and hold together”. An online encyclopaedia notes that “The expansion of the universe is the increase in distance between gravitationally unbound (emphasis added) parts of the observable universe“. In addition, numerous personal and institutional websites repeat the same message, for example, Baird [2]: “The expansion of the universe does not affect the relative position of astronomical bodies within galaxies. It is true that the universe is expanding, but this does not alter the distance between the earth and the sun”. Wiegert [3] notes: “Yes, the universe is in fact expanding. No, the planets aren't growing farther apart…On the distance scales of atoms, people, solar systems, or even galaxies, these forces are strong enough to counteract the expansion of the universe. It's only when you look at distances much larger than a galaxy that we begin to see the expansion of the universe winning the tug-of-war…Even at the larger galactic scales, the expansion has to fight against gravitational attraction". According to Palma [4]: “The expansion of the universe can be thought of as a global force that is pulling on all objects. However, it is only strong on very large scales. At the scale of a galaxy, the gravitational force binding a galaxy together is much stronger than the "expansion force," so the galaxy does not expand. At the scale of the Solar System, the imbalance is even larger, so the gravitational binding of the Solar System easily overwhelms the "expansion force," keeping Pluto's orbital separation from the Sun the same over time”.
Another argument against local expansion within the Solar System is that it conflicts with the conservation of angular momentum. But that assumes that the Earth and the Moon, for example, represent a closed system. In reality, both are subject to the gravitational influence of the Sun and, to a lesser extent, other planets. Local cosmological expansion might also seem to violate the conservation of mass-energy since the total of the kinetic and potential energy in an expanding planetary system will gradually become less negative. Conservation may therefore only apply to small-scale closed systems or over time scales which are much shorter than the age of the Universe. It is not at all clear that conservation applies to a Universe where, in the standard cosmological model, a major creation event happened in the past. Even the now defunct Steady State Model, which proposed continuous creation of matter, was eventually discarded for being inconsistent with observations of the cosmic microwave background radiation and the distribution of quasars, not because it violated the conservation of mass-energy. Some theoretical treatments, such as the Dynamic Universe [5,6], avoid this issue of matter creation by postulating that the overall mass-energy of the Universe is zero. In the current Ʌ-CDM cosmological model, if dark energy is assumed to be a manifestation of the cosmological constant, then it must be continuously created such that its density could remain constant while the Universe expands. However, in an alternative interpretation, dark energy manifests as a fifth fundamental force (quintessence).
Other objections to local expansion are often little more than assumptions. For example, arguments are often based on Einstein’s General Theory of Relativity and particularly the Friedmann-Lemaître-Robertson-Walker (FLRW) metric. But the FLRW metric describes an expanding Universe which assumes isotropy and homogeneity. Since local systems such as the planets and their satellites in the Solar System are neither isotropic nor homogeneous, then it is often stated that these cannot therefore take part in the overall expansion. However, a more logical conclusion is that they are beyond the scope of the FLRW metric, and no deduction can be made about their dynamics.
The conventional explanation for the orbital expansion of planetary moons is framed in terms of tidal effects, but this requires many assumptions about tidal heat flows and tidal dissipation factors. The tidal paradigm, as the sole explanation for the evolution of orbits, leads to a situation where astronomical complexity increases far more rapidly than its ability to solve a problem.
1.2. The Hubble-Lemaître Parameter
What used to be called the Hubble constant is now, following a decision by the International Astronomical Union [7] in 2018, correctly known as the Hubble-Lemaître parameter, the current value of which is denoted H0, to recognize the contribution made by Georges Lemaître. Most studies assume a value of H0 = 70 (km/s)/Mpc. This is equivalent to H0 = 0.071 (AU/Gyr)/AU, where AU = astronomical unit (1.496 x 10⁸ km). On smaller scales, the conversion H0 = 7.2 (cm yr-1)/106 km is more useful. In studies of relative mean motion acceleration, the Hubble-Lemaître parameter may also be expressed as H0 = 0.71 x 10⁻¹⁰ yr-1. The reciprocal of H0 is close to the accepted age of the Universe i.e., 1/H0 = 4.41 x 10¹⁷ s = 14.0 x 10⁹ yr. There is continued uncertainty about the best value of H0, known as the Hubble tension, and whether that might conflict with the Ʌ-CDM model of cosmology [8,9]. The tension refers to the incompatibility of two types of measurement of H0. Thus, an analysis of the cosmic background radiation by the European Space Agency Planck satellite leads to H0 = (67.4 +/- 0.5) (km/s)/Mpc. When based on the luminosity of type 1a supernova, the corresponding value is (73.04 +/- 1.04) (km/s)/Mpc [9]. The approximately 10% discrepancy is far greater than the statistical uncertainty in either measurement. Attempts to resolve this have led to suggestions that H0 could be scale-dependent [10,11]. Yet a form of scale-dependency is already a factor in the existing astrophysical paradigm, which asserts that gravitationally bound matter does not experience the Hubble-Lemaître flow. In other words, within the Solar System, and indeed within and between some galaxies, the effective value of H0 is assumed to be zero.
According to Dumin [12], the recession of the Moon based on the increasing length of the day leads to the conclusion that the value of the Hubble-Lemaître parameter within the Solar System is only 33 ± 5 (km/s)/Mpc. That analysis assumes conservation of angular momentum but, as noted above, that may not apply to planet-moon systems. Nevertheless, some limited data, particularly in the Sun-Earth-Moon system, also point to lower values of H0. (see Section 3.3.1 and 3.3.2). These discrepancies might almost be termed a local Hubble tension. Even though there has probably been variation in H0 since the formation of the Solar System, it is often assumed that the recessional velocity of a body has remained constant in that period.
1.3. Local Cosmology
The continuing view in the astrophysical community, that the expansion of the Universe only occurs at the inter-galactic scale, is therefore still very much alive. Until recently there was little evidence of local expansion. In 1969, the Apollo 11 astronauts placed corner cube reflectors on the surface of the Moon. This became the Lunar Laser Ranging Project (LLRP). Within a few months, the rate of recession of the Moon could be calculated. It was soon recognised that this retreat was close to the rate expected from the Hubble-Lemaître law [13]. However, at that time, other direct or even indirect evidence that cosmological expansion operated in the Solar System was almost entirely lacking. The ‘Faint Young Sun Paradox’ was known, but in those days, as now, it was seen as a greenhouse gas effect. Similarly, it had long been known from studies of fossil corals and tidal rhythmites laid down in ancient sediments that the Earth’s rotation was slowing. But separating tidal effects and geophysical phenomena from the cosmological recession of the Moon from the Earth and the Earth from the Sun continues to be problematic.
There have been a number of theoretical approaches to the question of local expansion, the earliest of which can be traced back to McVitie [14]. Bonnor [15] noted that a local set of charged particles expands with the rest of the Universe, but was unable to show that this applied to local systems of other material, describing that as “an open question”. More recently, Bonnor [16] has discussed the question of local dynamics and the expansion of the Universe. However, most studies, for example Cooperstock et al. [17], have either shown no effect or that local expansion effects are so small they can be ignored. In the latter case, a report by the National Radio Astronomy Observatory [18] calculated the stretching of the Earth-Sun separation but then goes on to describe it as: “an amount of stretching that we would have great difficulty measuring”. While that difficulty may be true for the Earth-Sun distance, it is certainly not true for many planet-satellite systems.
The “no local expansion” idea may have been acceptable in the long period from around 1930 to 1998 when the majority of cosmologists based their thinking on the matter-dominated Universe of Einstein and de Sitter [19] where the density parameter of baryons (Ωm) was equal to the critical density parameter, i.e., Ω0 = Ωm = 1. However, in the past twenty-five years, the Ʌ-CDM model [20] has been widely accepted. This model incorporates a cosmological constant (Ʌ). Whatever the physical origin of Ʌ, it is the dominant form of mass-energy in the Universe with a density parameter ΩɅ ~ 0.68.
Even in the absence of observational data, the involvement of dark energy alone should change our views about the dynamics of local expansion. If dark energy is a major component of the mass-energy in the Universe, then it can hardly be argued that it only occurs in inter-galactic space; it must be present at all scales. Dark energy also seems to provide the mechanism for the expanding Universe; it may have started around 13.8 x 10⁹ years (13.8 Gyr) ago with a ‘Big Bang’, which, according to Peebles [20] is an unfortunate term, but a ‘Big Bang’ cannot explain why the Solar System should expand since it only formed around 4.6 Gyr ago.
In the past few years, much more direct and indirect evidence has accumulated that supports local cosmological expansion [12,21,22,23,24,25,26,27,28,29,30,31,32,33,34,35,36,37]. While it is accepted that the expansion of the orbits of planets and their satellites in the Solar System is partly due to tidal effects, it is concluded that the Solar System experiences the Hubble-Lemaître flow as the dominant feature.
Recent research on local cosmology has focused on the dynamics of planetary moons rather than the planets themselves and is illustrated by the recession of planetary moons, is based on either direct measurement, comparison with the results of tidal theory, relative mean motion accelerations or, in some cases, as explanations of the orbital evolution and more recent origin of certain moons. This has the advantage that it avoids the complication of possible expansion of planetary orbits caused by mass loss from the Sun, General Relativity effects such as orbital precession as well as perturbations of the inner planets by Jupiter. Although rates of expansion measured in centimetres per annum might seem trivial on a human timescale, they are not trivial when examined in respect of the long evolution of the Solar System, which is generally accepted to be 4.6 Gyr old. That is similar to Darwin’s theory of evolution; it describes how life became what we see today. We do not reject that theory just because we may not see the process happening in our own lifetime. Finally, such rates of local expansion are not trivial insofar as they raise the question: “What causes that expansion?”.
The conventional explanation for the current orbits of the major planets is based on either the Grand Tack hypothesis or the Nice model. In the former, it is proposed that Jupiter formed at 3.5 AU from the Sun but then underwent an inwards migration to 1.5 AU before migrating outwards to its present orbit at 5.2 AU. A similar, but smaller effect is suggested for Saturn. This hypothesis requires many assumptions about the early structure of the Solar System including the location of an asteroid belt and a gas disc, an early 2:3 mean motion resonance of Saturn with Jupiter and the exchange of angular momentum between the planets and the gas disc.
An alternative hypothesis, the Nice model, was partly elaborated to explain the anomalously large orbit of Neptune and how it could have formed in a region that in the early evolution of the Solar System was relatively deficient in matter. The model proposes that after the dissipation of the gas and dust in the early Solar System, Jupiter, Saturn, Uranus and Neptune were originally located in orbits between 5.5 and 17 AU from the Sun. It is then suggested that planetesimals in the outer reaches of the System underwent gravitational encounters with those major planets causing them to be forced outwards as they gain angular momentum from those encounters. Moving inwards, this process occurs with each major planet until the planetesimals reach the orbit of Jupiter. This causes the planetesimals to be forced into highly elliptical orbits or ejected from the Solar System while Jupiter moves inward.
Table 1.1 shows the predicted rate of cosmological expansion for the planets and their distance from the Sun after 7 Gyr from now based solely on Hubble-Lemaître flow with H0 = 70 (km/s)/Mpc. Orbital histories, particularly for the terrestrial planets, should not be extrapolated too far into the past. Those planets are predicted to have once been much closer, but there may have been significant planet-planet interactions such as in those theories that describe the origin of the Moon as a result of major impacts and other disturbances in the inner Solar System.
Apart from the eight planets and nearly all of their satellites, it is expected that the many minor bodies in the Solar System, such as those in the Kuiper belt, asteroids and comets, will also undergo orbital expansion. Although their rate of cosmological recession can be calculated there are little or no other data with which such predictions can be compared. The only objects that do not have expanding orbits are those, mostly minor, moons that sit below the synchronous orbit as well as those, relatively few, moons with retrograde orbits, all of which are destined to approach the central planet because of tidal forces (Appendix A).
The focus of this review is essentially about observational data and other circumstantial evidence that the Solar System is expanding in line with the rest of the Universe. There is no discussion of theoretical aspects. To a large extent, evidence for local expansion relates more to the moons rather than the planets themselves. The reason here is that most published data on the recession of the moons from their planets is based on their tidal interaction; a method that is not feasible in Sun-planet systems. The approach taken has been to examine published data based on orbital evolution and compare them with cosmological expansion. In some cases, there are direct measurements of recession, for others tidal theory has been used to estimate orbital expansion, although that often requires many assumptions about tidal quality factors and tidal heat flows. Finally, limited data are available on the relative mean motion accelerations of some satellites. These comparative analyses have been used with some success for the Moon, for the Martian moons (Phobos and Deimos), the Galilean satellites of Jupiter (Io, Europa, Ganymede and Callisto), Titan and the large inner moons of Saturn (Rhea, Dione, Tethys, Enceladus and Mimas), Miranda and Ariel - two of the larger moons of Uranus, and for Hippocamp and Proteus two of the moons of Neptune.
Finally, there is no suggestion here that expansion occurs in condensed matter bound by electronic interactions. It is also accepted that the Universe is expanding and that the red shift in the electromagnetic radiation from distant galaxies is a result of recessional velocity. This may be contrasted with those theories, for example Müller [38,39], that interpret the red shift as no more than a scale shift where it is only units of length that are expanding.
2. Mercury and Venus
2.1. Planetary Recession
As shown in Table 1.1, the expected cosmological recessional velocity of Mercury from the Sun is 4.18 m yr-1. In an analysis of data returned by the Messenger probe, it was estimated [40,41] that this rate of recession was less than 1 cm yr-1, and was attributed to mass loss from the Sun. However, cosmological recession of the Messenger probe itself would have affected that analysis. By contrast, Křižek and Somer [29], in their discussion of the anthropic principle and its relevance to the Solar System, have described earlier work on the secular acceleration of Venus and Mercury. Citing Jones [42] and Kolesnik and Masreliez [43], they show that, based on observations of the secular change in longitude over 250 years, Venus and Mercury have receded from the Sun at a rate equivalent to H0 = 57 and 60 (km/s)/Mpc respectively. It is noteworthy that these measurements of the Hubble-Lemaître parameter within the Solar System produce values lower than 70 (km/s)/Mpc. Nevertheless, they are broadly consistent with investigations of the relative mean motion acceleration of the Moon, Deimos and the Galilean satellites as described in other Sections.
2.2. The Absence of Natural Satellites
Mercury and Venus are the only planets not to have natural satellites. An examination of their orbital and rotational properties throws light on why this is. Table 2.1 shows the radii of the respective synchronous orbits (Rsyn) of the planets and the approximate Hill radii relative to the Sun (RH).
The Hill radius marks the point, in these cases, at which the gravitational influence of the Sun matches that of the planet. For both Mercury and Venus, the Hill radii are less than the radii of the synchronous orbits. A satellite orbiting above the Hill radius would be captured by the Sun. However, moons in orbits below the Hill radius will also be below the synchronous orbits; they will be unstable and tidal effects will cause them to spiral down towards the surface of the planets. In the case of Mercury and Venus, this situation arises partly because the rotational periods of both about their spin axes are so long and therefore the synchronous orbits are so large, but also because their relatively low mass and proximity to the Sun means the Hill radii are close to the planet.
The slow rotation of Mercury and Venus probably arose from the tidal drag caused by the Sun during the early stages of the evolution of the Solar System. Thus, Křižek and Somer [28] and Dumin [24] suggested that their slow rotations could be evidence of cosmological expansion insofar as they would have been closer to the Sun in the past and even more exposed to tidal effects.
It might be asked if stable satellite orbits could have existed in the past but have since been lost. If Mercury and Venus had shorter days in the past, then the synchronous orbits will have been lower. However, if those planets had been closer to the Sun, the Hill radius will also have been even closer to the surface of the planets. Although the effect of tides is difficult to quantify precisely, it is possible that these two factors may have balanced. This suggests that there never were any stable orbits.
3. Earth and Moon
3.1. Introduction
The local cosmological model based on the Hubble-Lemaître flow suggests that at 4.6 Gyr ago Earth would have originated at 0.67 AU from the Sun while the Moon would have been 2.57 x 10⁵ km from Earth. Given H0 = 70 (km/s)/Mpc, then the Earth-Sun distance is expected to increase by
10.8 m yr-1. However, Křižek and Somer [28,29] have pointed out that direct measurement of such a change in the astronomical unit is fraught with uncertainties. One of the many problems is that the barycentre of the Solar System moves about 1,000 km each day. In this respect, those authors consider an estimate of the Earth-Sun recession as calculated by Krasinsky and Brumberg [44], namely 0.15 +/- 4 m yr-1, as unreliable. Henry et al. [45] derived an even smaller value for the increase in the distance between the Earth and the Sun of ~1 cm yr-1.
3.2. Lunar Laser Ranging Program (LLRP)
During the Apollo 11 mission in 1969, corner cube reflectors were set up on the surface of the Moon. These allowed accurate measurements of the Moon’s recession: the LLRP. Within a matter of months, the first results yielded a value of ~ 3 cm yr-1 [46]. The most recent measurements of the Moon’s recession give 3.82 cm yr-1 [47]. This may be compared with 2.8 cm yr-1, the rate of recession derived from the Hubble-Lemaître law. The application of the LLRP to the question of local Hubble-Lemaître expansion was discussed by Dumin [12]. However, the apparent coincidence between the observed rate and the rate predicted by local expansion has been recognized for over fifty years [13].
3.3. Ancient Tidal Rhythmites and Fossil Corals
3.3.1. Introduction
It has long been known from fossil records that the length of a day has been slowly increasing. This was attributed to the effect of the Moon raising tides on Earth such that the rotational speed of the Earth was gradually decreased. A corresponding drag on the orbital rotation of the Moon caused its orbital radius to increase, a process often described as transfer of angular momentum from the Earth to the Moon. An investigation by Sipilä [31,32], discussed in detail below, has shown that this allows H0 to be estimated by non-cosmological means. Zhang et al. [48] used the growth patterns on fossils to suggest that the Earth-Sun distance has been increasing at a rate equivalent to 35 (km/s)/Mpc.
3.3.2. Tidal Rhythmites and Lunar Recession
Williams [49] studied tidal rhythmites in South Australia. These were laid down ~ 620 million years ago (Myr), a date later corrected to 635 Myr [31] and covered a continuous 60-year period. It was calculated that there were 13.1 +/- 0.1 synodic months in a year, 400 +/- 7 Solar days in a year and the day length was 21.9 +/- 0.4 hours. Williams [49] then showed that this represented a rate of Lunar recession equal to 2.17 cm yr-1 +/- 0.31 cm yr-1. But, as noted above, the observed rate is 3.82 cm yr-1. However, allowance must be made for the recession of the Earth from the Sun. If we assume that the orbit of the Earth has expanded at a rate given by H0 = 70 (km/s)/Mpc then 635 Myr ago the orbital radius of the Earth would have been 0.955 AU.
Kepler’s 3rd law states that the square of an orbital period is proportional to the cube of the orbital radius. Therefore (Px/P0)2 = (rx/r0)3 where Px is the orbital period 635 Myr ago and P0 is the orbital period today (365 days). The orbital radius of the Earth 635 Myr ago is rx ; the current radius r0 = 1AU. It follows that: (Px)2 = (0.955)3 (365)2 and therefore Px = 340.6 (current) days.
Since there were 14.1 sidereal months (i.e., 13.1 synodic months) in a year at that time, then a sidereal month would have consisted of the equivalent of 340.6/14.1, i.e., 24.2 current days. Again, from Kepler’s 3rd law (P1/P2)2 = (r1/r2)3 where P1 and P2 are now the respective periods of the Moon’s orbit 635 Myr ago and today, and where the current sidereal month is 27.3 days. The respective radii of the Moon’s orbit are r1 and r2. The current mean value of r2 is 3.841 x 10⁵ km. This shows that the radius of the Moon’s orbit 635 Myr ago was 3.543 x 10⁵ km. Thus, the Moon has receded at a rate of 2.98 x 10⁴ km in that time. i.e., 4.7 cm yr-1, which is now greater than the observed rate. This result could be improved if the value of H0 had been lower than 70 (km/s)/Mpc in the Sun-Earth-Moon system. Sipilä [32] has shown that an improved rate of recession is obtained by invoking the principles of the ‘Dynamic Universe’ [5]. However, that introduces an element of theory whereas the philosophy of the current review is strictly observational, supported only by the basics of orbital mechanics and the Hubble-Lemaître law.
A more critical analysis of the extensive literature on using tidal rhythmites to estimate the evolution of the Moon’s orbit shows that this area is compounded by ambiguities. Mazumder and Arima [50] noted that the determination of the absolute Earth-Moon distances and Earth’s paleorotational parameters in the geological past from tidal rhythmites presents difficulties in determining the absolute length of the ancient Lunar sidereal month.
Lopez de Azarevich and Azarevich [51] calculated the Lunar retreat at various stages of the Earth’s history. They obtained 6.93 cm yr-1 in the Archean-Paleoproterozoic (up to 4,000 Myr ago), 7.01 cm yr-1 in the Neoproterozoic I – Ediacaran (up to nine hundred Myr ago) and 6.48 cm yr-1 in the Edicaran – early Cambrian periods (up to 543 Myr ago). All of these are higher than the observed rate and all assume that the Earth’s orbit has remained constant. Those authors noted that there are a number of factors which may have also affected the Lunar recession rate. These included meteorite impacts on the Earth and Moon, reconfiguration of landmasses accompanied by earthquakes that generated changes in the rotational (spin) axis of the Earth and glaciation/deglaciation processes.
3.3.3. Fossil Corals and Lunar Recession
In his earlier work, Sipilä [31] provided an analysis which involved data from coral fossils covering a period of 800 Myr. When corals grow, they develop daily layers. Years can be recognised since the layers are thinner in winter when there is less light, and the water is colder. This showed that the data were consistent with a value of the Hubble-Lemaître parameter close to the accepted value. However, just as with the tidal rhythmite method, different investigations have produced a wide range of values for the Lunar retreat. As an extreme example of this, Kahn and Pompea [52] examined daily growth lines and monthly septa formed in the shells of Nautilus pompilius L. They concluded that about 375 Myr ago, the Earth-Moon distance was only half of its present value. This represents an improbable rate of retreat of ~ 50 cm yr-1.
In conclusion, it appears that the use of both ancient tidal rhythmites and coral fossil data to determine H0 is not entirely satisfactory. Maeder and Gueorguiev [53] have concluded that attempts to relate the length of a day to Lunar recession are bedevilled with problems to the extent that this line of study cannot be said to provide any firm evidence for the presence of a local cosmological effect. Confounding factors include geological phenomena such as plate tectonics and glaciation that may have changed the rotation rate of Earth as well as the difficulty of disentangling the Earth-Moon and Earth-Sun cosmological expansion from Earth-Moon tidal effects.
3.4. Lunar Relative Mean Motion Acceleration
The direct determination of orbital expansion is usually based on the measurement of the secular change in the orbital radius. An alternative approach is to determine the mean motion acceleration (also known as secular acceleration or acceleration of longitude). A planet or satellite that is receding from a central body will experience a deceleration as it moves to a higher orbit with a lower orbital velocity. The mean motion acceleration is defined as n = 1/P, where P is the orbital period. Values of n are usually expressed as an angular velocity. The mean motion acceleration is thus dn/dt, and the relative mean motion acceleration is then given by a = (dn/dt)/n = ṅ/n, where a has units of reciprocal time. Negative values of a indicate recession while positive values refer to motion towards a central body.
Chapront et al. [54] reported a value of -25.86 arc-seconds cyr-2 for the acceleration of the Lunar longitude. It should be noted that this result does not represent an entirely independent assessment of recession. Some measurements of the secular acceleration of the Moon pre-date the LLRP, from which it can be derived but, as listed by Chapront et al. [54], they are in broad agreement with the most recent data. The sidereal period of the moon is 27.3 days. In 100 years, the Moon’s orbit will trace out 1.73 x 10⁹ arc-seconds. Since (dn/dt) = -25.86 arc-seconds cyr-2, then the relative mean motion acceleration is given by: a = (-25.86/100)/(1.73 x 107) yr-1, i.e., -1.49 x 10⁻¹⁰ yr-1. For comparison, if the Hubble-Lemaître parameter is given by H0 = 70 (km/s)/Mpc, i.e. H0 = 0.71 x 10⁻¹⁰ yr-1, then this result shows that cosmological recession accounts for exactly 50% of the Lunar retreat. This may be compared with the analysis described earlier based directly on LLRP data which indicates that cosmological recession accounts for 75% of the recession. This discrepancy suggests H0 < 70 (km/s)/Mpc.
3.5. The Faint Young Sun Paradox
Although the basic features of stellar evolution have been known for a considerable time, the problem of the ‘Faint Young Sun’ seems not to have been discussed in any detail until around fifty years ago when Sagan and Mullen [55] described the evolution of atmospheres and surface temperatures on Earth and Mars. The paradox, which has been recently reviewed by Feulner [56], arises because there is a contradiction between observations of liquid water early in Earth's history and the astrophysical expectation that the Sun’s output would be only 70% as intense around 3 Gyr ago as it is now. That would have meant that the Earth was completely frozen. Apart from the geophysical evidence, it is also apparent from paleontological data that conditions on Earth were suitable for life to evolve around 3-4 Gyr ago [57]. Many explanations have been suggested for this paradox including denser cloud cover or greenhouse gas effects, yet none is satisfactory nor widely accepted.
However, if we assume that the Earth and all other planets have followed the cosmological expansion then the paradox is readily solved. The Solar radiation experienced by a body at distance r is proportional to 1/r2. The rate of recession is H0 = 70 (km/s)/Mpc. It is assumed that the recessional velocity of a body has remained constant. Thus, if the current radiation experienced by Earth is taken as unity, and the Earth-Sun distance at 3 Gyr ago was 0.787 AU, then the radiation experienced by Earth at that time is given by (0.7)/ (0.787)2 = 1.13. Thus, despite the Sun producing only around 70% of its current intensity in that earlier epoch, the radiation reaching the Earth would have been slightly higher than it is today. However, some caution is needed in interpreting these data since there may have been significant planet-planet interactions such as in those theories that describe the origin of the Moon because of major disturbances in the inner Solar System.
The paradox has been discussed in detail by Křižek and Somer [29] in terms of the anthropic principle and how early biological evolution on Earth was only possible for certain values of the Hubble-Lemaître parameter. Dumin and Savinykh [58] have shown how the determination of the rate of local expansion is strongly affected by uncertainties in our current knowledge of the thermal history of the early Earth.
4. Mars
4.1. The Faint Young Sun Paradox
The local cosmological model based on the Hubble-Lemaître flow suggests that at 4.6 Gyr ago Mars would have originated at 2.54 AU from the Sun. Just as the evolution of life on Earth can be understood in terms of the Earth-Sun distance and the output of the Sun both being lower in the past, as discussed in Section 3.5, so the history of Mars is clarified. Around 3 Gyr ago, Mars would have received just over 10% greater Solar radiation than today. Thus, there is strong evidence for the presence of liquid water on the surface of Mars in the distant past [59], even though Mars is now a frozen body. That finding cannot be explained by greenhouse gases or other explanations advanced in the case of the Earth. Further support for higher temperatures during the early history of Mars comes from the structure and chemical composition of zircon crystals in meteorite NWA7034 that is known to originate from Mars [60].
4.2. Recession of Mars
According to Maeder and Bouvier [61], the orbital expansion of Mars relative to Earth is 4.3 m yr-1. That result is obtained by considering a scale invariant approach to Einstein’s General Theory of Relativity. As those authors write: “Thus, the trajectories of planets are very close to the usual Keplerian orbits, but with a very slight superimposed motion of expansion, which makes the orbits progressively spiralling outwards. The present analysis shows that the expansion rate of a two-body system is, in this framework, just the Hubble expansion rate.” The recession of Mars from Earth at 4.3 m yr-1 can be compared with the expected recession of the Earth from the Sun (using H0 = 70 (km/s)/Mpc), namely 10.8 m yr-1, and the expected rate of recession of Mars from the Sun (16.4 m yr-1; Table 1.1), which yields the expected recession of Mars from Earth as (16.4 – 10.8) = 5.6 m yr-1 and therefore close to the estimate made by Maeder and Bouvier [61].
4.3. Deimos and Phobos
4.3.1. Introduction
Parts of the following text [33] are reproduced from Physics Essays, 37(3), 191-192, 2024 with permission from Physics Essays Publication (https://physicsessays.org/).
The two moons of Mars, Phobos and Deimos, are relatively small, irregularly shaped objects with approximate diameters of 22.2 and 12.6 km, and prograde orbital periods. Their orbits are almost circular which, in the case of Phobos, is close to the equatorial plane of Mars, but the orbit of Deimos is inclined at around 2 degrees; their major properties are shown in Table 4.1.
The moons have surface features reminiscent of asteroids, but evidence from the UAE’s Hope mission suggests their composition is closer to that of Mars itself [62]. The semi-major orbital axis of Phobos is 9,377 km, and for Deimos it is 23,460 km. These characteristics have led to considerable debate about the origin of these satellites, and it is generally accepted that their orbital dynamics make it unlikely that they are simply captured asteroids.
Bagheri et al. [63] have recently described a mechanism for the origin of Phobos and Deimos whereby these moons originated in the fragmentation of a common progenitor long after the formation of the Solar System. That event is believed to have taken place between 1 and 2.7 Gyr ago when that original body was close to a synchronous equatorial orbit (Appendix A), which has a current radius of 20,428 km. The orbits of the two fragments, initially eccentric, became circularised through tidal drag causing Phobos to adopt an orbit closer to Mars while Deimos receded. Phobos is a ‘fast’ satellite; its orbital period is less than the rotational period of Mars. Tidal theory shows that it will be drawn ever closer to Mars and will either disintegrate as it reaches the Roche limit to form a ring, or it will eventually crash into the surface of Mars. Further evidence of tidal effects, at least in the past, is shown by the fact that both moons have rotational periods that match their orbital periods such that, as with Earth’s Moon, the same aspect always faces the central body. Although it is often assumed that Deimos will continue to recede through tidal effects, there are no direct measurements of its recessional velocity. That may change when data become available in the next few years from the Japan Aerospace Exploration Agency Martian Moons Exploration mission (MMX) [64].
4.3.2. Recession of Deimos
Following the analysis by Bagheri et al. [63], the time of formation of Phobos and Deimos will be taken here as the mean of the estimated period, that is 1.85 Gyr ago. The rate of recession of Deimos from a synchronous orbit to its present position is therefore (23,460 – 20,428) km/(1.85 x 109) years, i.e., 0.16 cm yr-1. Using a Hubble-Lemaître parameter H0 = 70 (km/s)/Mpc, then from the velocity-distance relationship v = (H0)r, where r = 23,460 km, the expected rate of recession (v) of Deimos from its current position is 0.17 cm yr-1. The role of the Hubble-Lemaître law is also supported by observations of the relative mean motion acceleration of Deimos.
The acceleration of longitude (see Section 3.4) of Deimos was determined, with great uncertainty, by Shor [65] as +(0.06 +/- 0.34) x 10-9 deg day-2. There appear to have been no more recent measurements. The sidereal period of Deimos is 1.26 days, thus the mean motion (a) is (360/1.26) = 286 deg day-1. The relative mean motion acceleration is therefore given by:
a = +[365 x (0.06 +/- 0.34) x 10-9]/(286) yr-1 = +(0.77 +/- 4.34) x 10-10 yr-1. That result is at least consistent with H0 = 70 (km/s)/Mpc, i.e., H0 = 0.71 x 10⁻¹⁰ yr-1.
4.3.3. The Orbit of Phobos
Although cosmological expansion is also expected to operate on the orbit of Phobos, its tidal descent to Mars is currently 18 cm yr-1 [66]. That can be compared with an expected rate of cosmological expansion of less than 0.1 cm yr-1. It was estimated by Bagheri et al. [63] that Phobos will reach the surface of Mars in 39 million years. Figure 4.1 depicts the orbital evolution of Deimos and Phobos over the past 1.85 Gyr. In the absence of other data, the descent path of Phobos in Figure 4.1 should be viewed as purely schematic, but it can be assumed that Phobos would accelerate as it moves closer to Mars.
5. Jupiter
5.1. Jupiter and Its Moons
Jupiter is currently 5.2 AU distant from the Sun. Although the Grand Tack hypothesis and the Nice model provide the conventional explanation for the current orbit of Jupiter, the local cosmological model based on the Hubble-Lemaître flow suggests that 4.6 Gyr ago Jupiter would have originated at a distance of 3.5 AU from the Sun.
There are almost a hundred named moons of Jupiter and many more moonlets, but apart from Io, Europa, Ganymede and Callisto, which comprise well over 99% of the mass of the satellite system, they are small bodies. The major properties of the four Galilean moons, namely Io, Europa, Ganymede and Callisto are shown in Table 5.1.
These moons have been extensively studied since their discovery by Galileo Galilei in 1610. In recent decades, that system has been visited by numerous spacecraft with others in progress, for example the Europa Clipper mission [67] and the JUICE (Jupiter Icy Moons Explorer) mission [68] which reach the Jovian system in 2030 and 2031 respectively. It is generally accepted that these large moons, like others in the Solar System, are subject to tidal forces, the magnitude and direction of which depend on the respective masses of the satellite and the central, planetary, body, as well as the location of the satellite orbit relative to the synchronous orbit (Appendix A).
5.1.1. The Galilean Moons
Parts of the following text and Tables [34] are reproduced from Physics Essays, 37(4), 279-280, 2024 with permission from Physics Essays Publication (https://physicsessays.org/).
Lari et al. [69] examined the long-term evolution of the Galilean satellites. The mean motions of Io, Europa and Ganymede are in a 4:2:1 resonance, and the implications of this on the dynamics of the satellites have been studied in much detail over many years as reviewed by Lari et al. [69]. Nevertheless, such studies have not produced a coherent picture largely because of the mathematical complexities and numerous assumptions involved. Table 5.2 shows an example of the orbital evolution of the satellites based on interpolation of Figure 1 in Lari et al. [69]. However, orbital evolution based on other assumptions, particularly whether the current resonances have been stable, yields different results. Table 5.2 also includes the evolution of orbits based on the Hubble-Lemaître law. Values are expressed as RJ/Gyr where RJ is the orbital radius relative to the equatorial radius of Jupiter (7.15 x 10⁴ km). These data are shown diagrammatically for Io, Europa and Ganymede in Figure 2.1. Insufficient tidal data were available for Callisto, which was shown not to recede by Lari et al. [69] in the dataset examined here. In all cases, the three moons are shown to originate above the current synchronous orbit.
It will be seen that there is broad agreement between the two sets of recessional velocities. Bearing in mind the many uncertainties in calculating tidal effects, it is found that the orbital evolution of the Galilean satellites can equally well be described by local cosmological expansion.
The role of the Hubble-Lemaître law in the Jovian moon system is also supported by observations of the relative mean motion acceleration (see Section 3.4) of the Galilean satellites. Numerous studies have been made using astrometric measurements relating to the orbital motion of the Galilean satellites. Such data have been derived from direct observations over many years and, in some cases, are based on a substantial body of eclipse data dating back several centuries. Values of a, the relative mean motion acceleration, have been reported for Io, Europa and Ganymede, as listed by Lainey et al. [70], although data for Callisto are lacking. Table 5.3 shows the most recent data for the relative mean motion accelerations of these moons. As reviewed by Lainey et al. [70], there has been a wide range of reported values of a, not all of which suggest that Io is moving towards Jupiter; they simply reflect the experimental difficulty of this measurement. It will be seen from Table 5.3 that values of a for the Galilean satellites are reasonably close to each other and to the Hubble-Lemaître parameter, i.e., H0 = 0.71 x 10⁻¹⁰ yr-1.
6. Saturn
6.1. Saturn and Its Moons
Parts of the following text, Table 6.2 and Figure 6.1 are based on the article ‘Evolution of Saturn’s Large Inner Moons: An Alternative Explanation’ published in Gravitation and Cosmology, Vol. 31(2), 181-184, Pleiades Publishing, 2025, by this author [35] (https://link.springer.com/journal/12267/articles) and are reproduced with permission from SNCSC.
Saturn is currently 9.58 AU from the Sun. As with the other major planets, the Grand Tack hypothesis and the Nice model provide the conventional explanation for the current orbit of Saturn. The local cosmological model based on the Hubble-Lemaître flow suggests that at 4.6 Gyr ago Saturn would have originated at 6.42 AU from the Sun. The major properties of Saturn’s seven largest moons are shown in Table 6.1. There are several hundred objects orbiting Saturn, most of them better described as moonlets, as well as a ring system that probably formed from the destruction of previous satellites that were once below the synchronous orbit (Appendix A). The moons listed in Table 6.1 comprise over 99% of the total mass of satellites.
The dynamics and physical structure of Saturn’s large inner moons (Rhea, Dione, Tethys, Enceladus and Mimas) lead to conflicting evidence for determining their origin and age. As noted by Neveu and Rhoden [71], the evolution of their orbits has been notably difficult to understand; the crater distribution on many of their surfaces suggests that the moons co-evolved with the Solar System, which is generally taken as 4.6 Gyr ago. However, the expansion of their orbits, thought to be due to tides raised by the moons on Saturn, points to much more recent formation. Fuller et al. [72] have shown that a theory involving a constant tidal quality factor (Q) places the origin of Mimas as recently as 0.5 Gyr ago. It is unlikely that these moons could have been captured by Saturn in the recent past. This led Ćuk et al. [73] to state: “We propose that the midsized moons re-accreted from a disk about 100 Myr ago, during which time Titan acquired its significant orbital eccentricity. We speculate that this disk has formed through orbital instability and massive collisions involving the previous generation of Saturn’s midsized moons.” Teodoro et al. [74] also suggested that the mid-sized moons were formed recently by a collisional cascade leading to their reformation. Yet such recent formation is inconsistent with the large number of impact features on their surfaces.
6.1.1. Titan
The predicted cosmological rate of recession of Titan, the large outer moon of Saturn, is 8.6 cm yr-1, while the observed rate [75] is 11.3 cm yr-1. The difference between these two values of 2.7 cm yr-1 can be attributed to tidal effects. A similar situation arises in the Earth-Moon system where the predicted cosmological rate of recession of the Moon is 2.8 cm yr-1, while the observed rate of recession is 3.82 cm yr-1 [25]. In both cases, this suggests that tidal effects currently contribute only around 25% to the outward migration, although that may have been different in the past.
6.1.2. The Large Inner Moons
In their discussion of tidal migration via resonances, Fuller et al. [72] provided a calculation of the evolution of the moons by integrating equations backwards from the present era. However, this was based on a theoretical construct that tidal dissipation and outward orbital migration of moons is greatly enhanced by resonances between tidal forcing frequencies and discrete ‘mode frequencies’. This in turn relies on assumptions about the structure of the outer layers of Saturn. Lainey et al. [75] later used a similar tidal resonance approach and noted: “Our results for Titan and five other moons agree with the predictions of a resonance-locking tidal theory, sustained by excitation of inertial waves inside the planet.” However, as noted above, the recession of Titan from Saturn can be largely explained by invoking local cosmological expansion without the need for the mathematically-complex analysis of tidal resonances.
The calculated orbital radii of Rhea, Dione, Tethys, Enceladus and Mimas at 4.6 Gyr ago, as shown in Table 6.2, were interpolated from Figure 4 in Fuller et al. [72]. The orbital radius of Rhea is 527,108 km while the radius of Saturn is 58,232 km. Thus, the relative orbital radius of Rhea is Rs = 9.05. Using a Hubble-Lemaître parameter of H0 = 70 (km/s)/Mpc, then from the velocity-distance relationship v = (H0)r, the values of Rs at t = 0 (4.6 Gyr ago), based on cosmological recession are included in Table 6.2.
The general magnitudes of Rs at t = 0, as shown by Fuller et al. [72] from tidal theory are presumed to be realistic estimates. Broadly similar results based on a tidal resonance method were obtained by Lainey et al. [75]. However, it will be seen that local cosmological expansion leads to the same conclusion.
The radius of the current synchronous orbit of Saturn is located at 1.13 x 10⁵ km. Thus, all predicted orbits at t = 0 lie outside this limit. However, the rate of rotation of Saturn about its axis will have decreased since its formation because of the tidal drag exerted by the moons; the radius of the synchronous orbit at t = 0 would therefore have been less than 1.13 x 10⁵ km. It is also recognised that a small part of the outward migration of the moons is due to tidal effects. In view of the uncertainties involved, both sets of calculations should not be overinterpreted.
The moons show several orbital resonances, which could have been locked in at an early stage of their evolution. For example, Mimas is in a 2:1 mean motion resonance with the larger moon Tethys while Enceladus is currently in a 2:1 mean motion orbital resonance with Dione. From Kepler’s 3rd law, the ratio of the respective orbital periods of two bodies is determined by the ratio of their mean orbital radii. Since local expansion, as described here, produces a proportional increase in all orbital radii, the ratio of their mean orbital radii and hence the ratio of their periods remains constant. The predicted outward migration of the large inner moons of Saturn is consistent with their co-evolution with the Solar System. It is concluded that tidal effects make only a minor contribution to the moons’ recession. In this respect, it is recognised that while tidal forces are inversely related to the cube of the distance, the rate of cosmological expansion increases with distance.
7. Uranus
7.1. Uranus and Its Moons
Parts of the following text, Table 7.1 and Figure 7.1 [36] are reproduced from Physics Essays, 38(1), 55-56, 2025 with permission from Physics Essays Publication (https://physicsessays.org/).
Uranus is currently at 19.91 AU from the Sun. As with the other major planets, the Grand Tack hypothesis and the Nice model provide the conventional explanation for the current orbit of Uranus. The local cosmological model based on the Hubble-Lemaître flow suggests that at 4.6 Gyr ago Uranus would have originated at 13.3 AU from the Sun. The orbital history of the moons of Uranus has received only limited attention. This is certainly because most of what we know about the Uranian system comes from the only space probe to have visited, namely the Voyager 2 Mission in 1986. There are 28 known moons, but apart from the five largest (Miranda, Ariel, Umbriel, Titania, and Oberon; Table 7.1) they are much smaller bodies. As with the other large outer planets, many of the minor moons are in retrograde orbits or have high eccentricities or high inclinations all of which points to them being captured objects.
7.1.1. Miranda and Ariel
Nimmo [76] has described tidal dissipation and outward migration rates for Miranda and Ariel, although similar data are not available for the other moons. The analysis was based on the ‘resonance locking hypothesis’ [72]. Table 7.1 shows the evolution of the two moons as determined by Nimmo [76] using data obtained by interpolation of Figure 2 in that paper.
Although the orbital radii of Miranda and Ariel were shown to be accelerating over the past 4.6 Gyr, Table 7.1 lists the overall rate of change. As noted by Nimmo [76], the estimates are based on a number of assumptions including an appropriate tidal quality factor (Q) and estimates of heat fluxes on the moons. These uncertainties are encapsulated in the title of that article: “Strong Tidal Dissipation at Uranus?”. Thus, Q (Uranus) is expected to be close to 103 based on tidal heating, but this means both satellites would be less than 1 Gyr old: a result in conflict with the cratering of their surfaces. Table 7.1 includes predictions based on local cosmological expansion with the Hubble-Lemaître parameter taken as H0 = (70 km/s)/Mpc. In all cases, Ru refers to the orbital radius relative to the equatorial diameter of Uranus (2.54 x 10⁴ km). Thus, the orbital expansion of Miranda and Ariel, as described by local cosmology, is broadly similar to the rate estimated from tidal theory.
Assuming that the moons formed 4.6 Gyr ago, then from their evolution based only on Hubble-Lemaître flow (Figure 7.1), it will be seen that the orbit of Miranda was close to the present radius of the current relative synchronous orbit of Uranus (Appendix A) given by Ru = 3.23. Tidal effects will have led to an even greater orbital expansion since the formation of the moons. However, those same effects will have caused an increase in the rotation period of Uranus. That, in turn, would have produced a lower synchronous orbit at the time of their formation. It can be concluded that Miranda and the other large moons of Uranus were probably always outside the synchronous orbit. These data are shown diagrammatically in Figure 7.1.
8. Neptune
8.1. Neptune and Its Moons
Parts of the following text, Table 8.1 and Figure 8.1 [37] are reproduced from Physics Essays, 38(2), 95-97, 2025 with permission from Physics Essays Publication (https://physicsessays.org/).
It is not known how Neptune at 30 AU could have formed so far from the Sun when the original protoplanetary disc was sparsely populated at that distance. The Grand Tack hypothesis and the Nice model suggest that Neptune formed much closer to the Sun and later migrated outwards. Local expansion provides a much simpler explanation and indicates that at 4.6 Gyr ago, Neptune would have been about 20 AU distant from the Sun.
It is widely accepted that many of the 16 moons that now orbit Neptune are not the original satellites that existed at the time of the formation of the Solar System, 4.6 Gyr ago. The moons fall into several groups. The inner five (Naiad, Thalassa, Despina, Galatea, Larissa) all have orbital periods less than the sidereal rotational period of Neptune (0.6713 days); they are therefore ‘fast satellites’ that sit inside the current synchronous orbit of Neptune (Appendix A), which is located at a radius of 83,395 km. Tidal drag will gradually reduce their orbital radii causing them either to break up at the Roche limit or crash onto the surface of Neptune. Hubble-Lemaître flow is projected to operate on all orbiting bodies in the Solar System. If the dynamics of the Martian moon Phobos can be used as a guide, then the rate of tidal descent of the inner moons is likely to be far higher than their expected rate of cosmological recession.
The second group contains Hippocamp and Proteus. The former was first described by Showalter et al. [77] and Showalter [78] while Proteus was discovered from the images taken by the Voyager 2 space probe shortly before its Neptunian flyby in August 1989. The principal properties of Hippocamp and Proteus are shown in Table 8.1.
Both moons are in prograde orbits outside the current synchronous orbit of Neptune. Proteus is the second largest moon of Neptune whereas Hippocamp is much smaller (Table 8.1). Proteus is not fully spherical but resembles an irregular polyhedron. Both Hippocamp and Proteus have low orbital inclinations (< 0.075o) and similar low eccentricities (ε = 0.0005). It has been speculated that they are not original bodies but represent the residues from the break-up of an earlier moon such that Hippocamp is a small fragment from that disintegration [77,78].
Triton, by far the largest moon of Neptune, contains over 99% of the total mass of the satellite system. The orbit of Triton is retrograde, and it is considered to be an object captured from the Kuiper belt long after the formation of the Solar System [79]. It is believed that Triton then disrupted and ejected some of the original satellites of Neptune. Because of its retrograde motion, Triton, although well outside the synchronous orbit but just like sub-synchronous orbiting bodies, will experience tidal forces causing it to descend towards Neptune. It is unclear when Triton was captured, but this may have happened relatively recently. In the Mars-Phobos-Deimos system [33,63], a progenitor body was believed to have been disrupted by an impacting object as early as 2.7 Gyr ago. This might suggest a similar timescale for the origin of Hippocamp and Proteus. The continued existence of the five sub-synchronous bodies, which are forced to have a limited life, points to a similar conclusion.
The final, and outermost eight satellites (sometimes subdivided into three further groups), are Nereid, Halimede, Sao, S/2002 N5, Laomedeia, Psamathe, Neso and S/2021 N1. Apart from Nereid
(~ 2.4 x 10¹⁹ kg) they are all small bodies (< ~1017 kg), some of which have retrograde orbits and are probably captured asteroids.
8.1.1. Hippocamp and Proteus
The orbital evolution of both Hippocamp and Proteus can be calculated from the Hubble-Lemaître law. Prograde satellites will experience tidal effects which will lead to their recession from Neptune. In both the Earth-Moon and Saturn-Titan systems it has been shown [25,26] that tidal effects currently contribute around 25% to the total outward migration; the remaining 75% is the result of Hubble-Lemaître flow. However, tides will be more significant for larger moons. As noted by Showalter [78], Proteus will therefore migrate outwards faster than Hippocamp. If an estimate is now included for tidal recession (T), equal to a third of the cosmological rate, then for Proteus (H0 +T) = (7.2 + 2.4) (cm yr-1)/106 km while for Hippocamp this rate is just H0 = 7.2 (cm yr-1)/106 km.
The calculated relative orbital radii of Hippocamp and Proteus are shown in Figure 8.1. The current synchronous orbit is also shown (RN = 3.37) as a horizontal line. It is assumed that the cosmological rate of recession has been constant over this period. It will be seen that the orbits of Hippocamp and Proteus intersect close to the current synchronous orbit around 3.3 Gyr ago. It may be noted that this epoch is consistent with timings in those theories of ‘Late Heavy Bombardment’ whereby planets and their satellites experienced major asteroid impacts long after the formation of the Solar System. Thus, Cohen et al. [80] presented evidence, based on the argon isotope analysis of Lunar meteorites, that the Moon underwent a major cataclysm between 2.76 and 3.92 Gyr ago. If the tidal recession of Proteus had been greater than 25% of the overall rate of recession, then the orbital coincidence of Proteus and Hippocamp would have been later and above the current synchronous orbit. It is unlikely that tidal effects for Proteus could have been much less than 25% of the overall rate of recession since that would place the orbital coincidence well below the current synchronous orbit. If that were also below the original synchronous orbit then the outward migration of the two satellites would have been impossible.
Although tidal effects from the various satellites will have acted to reduce the rate of rotation of Neptune, apart from Triton their combined mass would have had little gravitational influence. Since Triton may not have existed as a satellite of Neptune until around 3 Gyr ago, the rotational period of Neptune and hence the radius of the synchronous orbit will only have increased more recently, by which time both Proteus and Hippocamp would already have been receding as separate bodies. Finally, it may be noted that the capture of Triton could have been facilitated by local expansion since the orbits of Neptune and Kuiper belt objects would have been closer in the past.
In conclusion, orbital analysis based on local cosmological expansion shows that neither Hippocamp nor Proteus can be original moons of Neptune since both have only been outside the synchronous orbit of Neptune for about 3.3 Gyr. Furthermore, the orbits of Hippocamp and Proteus coincided at that time. This supports earlier ideas that these two moons arose from the fragmentation of an original body. It is considered unlikely that the rate of recession caused by tidal effects would be much greater in the Neptunian system than are seen in other planetary systems. Thus, tides alone cannot adequately explain the orbital evolution of Hippocamp and Proteus.
9. Miscellaneous Issues
9.1. The Pioneer ‘Anomaly’
The Pioneer 10 and 11 spacecraft were launched in 1972 and 1973 respectively. By 1983, Pioneer 10 had effectively entered the edge of interstellar space, and in 1997 it was at 67 AU from the Sun, travelling outwards at a constant velocity of around 12.2 km s-1. Anderson et al. [81] reported that Pioneer 10 showed an anomalous acceleration towards the Sun amounting to ~ 8 x 10⁻⁸ cm s-2. Many suggestions were made for the origin of the forces acting on the spacecraft including the effects of planetary perturbations, ‘new’ gravitational effects, radiation pressure, the interplanetary media, as well as drift in the Doppler signal. However, this was seen by some authors as a cosmological effect. Thus, Müller [38] noted that this acceleration was close to the product of the Hubble-Lemaître parameter and the velocity of light, i.e., cH0 = 6.6 x 10⁻⁸ cm s-2 . It is not clear that this apparent numerical coincidence has any physical significance, particularly as the observed acceleration was towards the Sun. Further investigations by Lachièze-Rey [82] and others showed that the anomaly was not a cosmological effect but was caused by anisotropic radiation pressure from the onboard radioisotope thermoelectric generator.
9.2. Condensed Matter
The question is often asked whether all objects in the Universe participate in the expansion. This in turn is related to the question whether space itself is scale invariant. However, it is not suggested that such expansion occurs in condensed matter bound by electronic interactions; there is no evidence that the fundamental constants, which define the size and structure of matter at the atomic scale, such as the fine-structure constant (α) or the Rydberg constant (R∞), undergo secular changes at least on the time-scale of the Solar System’s evolution.
Nevertheless, a number of suggestions have been made over the years that the Earth itself is expanding. Most recently, Müller [39] has claimed that the radius of the Earth increases in line with the cosmological rate. However, that expansion was given as 0.01 +/- 0.02 cm yr-1. In other words, the data are also consistent with both no expansion and even shrinkage. Even if it is accepted that there has been some expansion of the Earth, this could be caused by geological processes. Müller [39] also provided support for Earth’s expansion based on the ratio of the area of the continents, including continental shelves, to the area of the oceans. Thus, the continental area is calculated as 177 x 106 km2. If the early Earth had been covered by land with no space for oceans, then its radius would have been 3,750 km. Since the current radius of the Earth is 6,370 km, this represents an increase by a factor of 1.7. That is broadly similar to the increase in satellite orbits (i.e., a factor of 1.5) since the formation of the Solar System 4.6 Gyr ago. However, this assumes that the current continents were already in existence at that epoch. If the radius of Earth was only 0.67 of its current radius 4.6 Gyr ago, then the volume would have been only 0.3 of the current value. But unless it is assumed that the mass of the Earth has increased substantially then the density would have been around three times greater. Given our understanding of the atomic structure of matter that must be considered extremely improbable.
9.3. The Sun and the Gas Giants
As noted above, it is accepted that condensed matter does not expand. However, that may not apply to gases such as are found in the atmospheres of Jupiter and Saturn or to the plasma in the outer layers of the Sun. Gaseous atmospheres are held in place by gravitational forces and, as is clear from other evidence, cosmological expansion occurs regardless of gravitational forces. We must therefore conclude that those atmospheres have expanded and become less dense. In the case of the Sun, the outer plasma atmosphere is also influenced by long range electromagnetic forces, and it is unclear if that atmosphere also expands. Current theories of stellar evolution predict that the radius of the Sun will double in 7 Gyr. If Hubble-Lemaître expansion applies to the Sun, then, in 7 Gyr it’s radius will have increased by 50% . It follows that cosmological expansion would account for part of the enlargement of the ageing Sun and other stars. It is normally predicted that once the Sun becomes a red giant, it will overwhelm the terrestrial planets. However, the orbits of those planets are also expected to increase. Thus, in 7 Gyr, the orbit of the Earth will also have expanded by 50% to reach the current orbital distance of Mars. This has implications for the suggested destruction of the inner planets at that time.
9.4. Kuiper Belt Objects
In the Kuiper belt, there are a number of systems where two bodies of broadly similar mass rotate about a barycentre that may be external to both bodies. The best example is the Pluto-Charon pair, but the Eris–Dysnomia pair are similar while in the case of the strange object Arrokoth, it appears that two bodies have merged. The Pluto-Charon pair are tidally locked; both face each other as if rigidly connected, and both are in a synchronous orbit. However, this does not prevent cosmological expansion from operating. Thus, as the pair move apart, the rotational period of each increases. This causes the radius of the synchronous orbit to increase such that tidal locking is maintained. It has been suggested by Kenyon and Bromley [83] that the orbits of Pluto’s smaller moons may have expanded since their formation following a major impact, although it is unclear when such an impact occurred. Denton et al. [84] have provided a simulation whereby Pluto captured Charon such that they were physically adjacent but did not coalesce. The two bodies then drifted apart to their present position. That orbital expansion can now be explained by a combination of tidal and local cosmological effects.
10. Conclusions
The observational support for local cosmological expansion presented in this review falls into several categories. One part involves the orbital expansion of planetary moons. Here the current paradigm accepts that recession occurs but interprets that retreat as entirely due to tidal factors. Yet that approach requires many assumptions about heat flows and tidal quality factors as well as being mathematically complex. In contrast, it is shown that the Hubble-Lemaître law provides a broadly similar result. There is no doubt that tides play a part in the orbital expansion of the satellites, at least for those above the synchronous orbit. But the conclusion drawn is that they are less significant than the cosmological effect. In other words it is suggested that the published estimates of the rates of tidal recession for some satellites, particularly in the Jovian, Saturnian and Uranian systems, are too high. Thus, for the Moon and Titan, the largest satellite of Saturn, where direct measurements are available, Hubble-Lemaître flow appears to account for around 75% of their rate of recession.
In the case of Deimos and Phobos, the two satellites of Mars, it is shown that if, as proposed by others, that system was disrupted by an impacting object during the early history of the Solar System, then the subsequent evolution of Deimos can be accurately explained by local expansion. In the Jovian system, the relative mean motion acceleration of the Galilean satellites, which has units of reciprocal time, is remarkably close to the accepted value of the Hubble-Lemaître parameter. Although subject to much greater uncertainty, the relative mean motion acceleration of Deimos is consistent with the same conclusion. It should be possible to determine values for the major moons of Saturn, Uranus and Neptune. However, because the orbital periods of the outer planets are so long, it would seem unlikely that their relative mean motion acceleration could be measured on a short time scale.
For the Galilean moons of Jupiter (Io, Europa, Ganymede and Callisto), the large inner moons of Saturn (Rhea, Dione, Tethys, Enceladus and Mimas ) and for Ariel and Miranda, two of the larger moons of Uranus, the predicted rate of orbital expansion is similar to that derived from tidal theory. In the Neptunian system, local expansion supports the early disruption of a progenitor body that formed Hippocamp and Proteus as well as the subsequent orbital evolution of those moons.
The use of fossil evidence, including tidal rhythmites and ancient corals to determine the day length on Earth in the past, can be used to evaluate the recession of Earth’s Moon. However, these methods are fraught with conflicting conclusions on that recession, partly driven by the presence of geological and other phenomena that may have changed the rotation rate of Earth, and partly the difficulty of disentangling the Earth-Moon cosmological retreat from the Earth’s orbital expansion and Earth-Moon tidal effects.
Rather less direct evidence is available to determine if the planets themselves are receding from the Sun. However, measurements taken over 250 years of the secular acceleration of Mercury and Venus have shown that these inner planets are receding from the Sun at a rate close to that predicted by the Hubble-Lemaître law. More indirect evidence of local expansion, such as the Faint Young Sun Paradox, provides a simple explanation for the early thermal history of Earth and Mars. Similarly, the anomalously large orbit of Neptune can be described as a simple cosmological effect whereas the alternative Grand Tack and Nice hypotheses involve many assumptions about the early structure of the Solar System.
The absence of moons around Mercury and Venus might be connected with local cosmological expansion insofar as those planets would have once been much closer to the Sun. That would have produced large tidal effects causing their rate of spin rotation to become so slow compared to other planets. As a consequence, in both cases, the respective Hill radii are now below the synchronous orbits meaning there can be no stable satellite orbits.
While most studies assume the Hubble-Lemaître parameter is given by H0 = 70 (km/s)/Mpc, a few investigations of the Sun-Earth and Earth-Moon systems have suggested that H0 is lower. Similarly, the evolution of the planetary moons is traditionally described by tidal theory, but cosmological expansion provides an almost identical rate of recession. In both scenarios, some of the inner moons originated close to the current synchronous orbit. Since those moons could not have originated below the synchronous orbit then the estimated tidal and cosmological recession cannot therefore both occur. A possibility is that the rate of cosmological recession could be lower to allow some tidal recession. In other words, both have been overestimated from which it follows that the effective local value of H0 must be less than 70 (km/s)/Mpc. In an expanding homogeneous and isotropic Universe, the Hubble-Lemaître parameter is related to the density (ρ) of the Universe by the Friedmann equation (H0)2 = 8πGρ/3 where G is the Newtonian gravitational constant. It shows that the Hubble-Lemaître parameter was higher when the density was higher, such as obtained in the early evolution of the Universe. However, the Solar System is neither homogeneous nor isotropic, and therefore this expression has no validity for such a local environment. A possible explanation for a lower local value of H0 is that cosmological expansion is suppressed but not eliminated by gravitation.
Evidence in support of local expansion may throw light on the origin of the effect, be that dark energy or some other phenomenon, since it may not be a force in the sense of an interaction that competes with gravitation. Local expansion contradicts accepted physical theory, but as Galileo Galilei might have said: “And yet it moves”. Interest in ‘local cosmology’ has continued to grow as evidenced by the biennial conferences organised since 2016 by the Czech Academy of Sciences [85]. Much of the published work in this area has appeared in the past twenty years and, to a certain extent, reflects our increasing knowledge of the dynamics of the planets and their satellites brought about by data from unmanned probes. It is expected that further support for local cosmological expansion will arise with the continued exploration of the Solar System in the years to come. But the history of scientific revolutions [86] provides many examples where paradigm shifts not only take years or even decades to gain traction, but they may only occur when data become overwhelming and current theories become untenable. It is also likely that the timescale for achieving a widely-accepted theoretical understanding of local expansion is much less certain. To paraphrase Max Planck, science progresses one funeral at a time.
If it is accepted that local cosmological expansion operates within the Solar System then that expansion is clearly unrelated to a primeval ‘Big Bang’. Although it is beyond the scope of the present review, local expansion would also be expected to operate on the overall structure of galaxies. The measured rotation rate of a galaxy is then a vector sum of the true rotational velocity and the outward cosmological radial velocity. This might have implications for current theories of the dark matter problem.
Local cosmological expansion is quite capable of experimental analysis. Thus an artificial satellite in a suitable Earth orbit could be equipped with corner cube reflectors or some equivalent device such that, just as in the LLRP, the dynamics of that satellite could be measured.
Funding
This research received no external funding.
Conflicts of Interest
The author declares no conflicts of interest.
Appendix A
A.1. Tidal Effects
The orbits of most natural satellites in the Solar System are expanding, but the standard explanation is based entirely on tidal theory. As will be seen from the earlier Sections, the tidal contribution to expansion is important but it is probably much smaller than expansion caused by the Hubble-Lemaître flow. Furthermore, the magnitude of tidal interactions is proportional to the inverse cube of the distance, whereas cosmological expansion increases directly with distance. In some of the planetary moon systems, it is estimated that tides currently make up about 25% of the total rate of recession. Dumin [12] has suggested that in the Earth-Moon system the contribution of tidal effects is greater than 25%.
Tides not only cause recession of a body in orbit but, depending on the orbital characteristics, they can also lead to that satellite eventually falling into the central body. The main characteristics of satellite behaviour are primarily due to whether the orbit lies inside or outside the synchronous orbit, whether the orbit is prograde (i.e., in the same direction of rotation as the axial rotation of the primary), whether the axial rotation vectors of the two bodies are similar as well as the magnitude of the spin-axis obliquity. Tides can lead to tidal locking, and in multi-satellite systems, to orbital synchrony.
A.2.Synchronous Orbits
When the rotational period of a prograde orbiting body is equal to the rotational period of the primary then it is in a synchronous or stationary orbit. Whereas tidal effects contribute to the recession of a body outside the synchronous orbit, they cause a body inside the synchronous orbit to descend towards the primary. However, the term synchronous is also used to refer to synchrony between the axial rotation of a satellite and its orbital rotation. An example here is where the synodic rotation period of Neptune’s moon Triton is described as “synchronous”. That effect is more commonly, and more appropriately, described as “tidal locking”.
The radius (Rsyn) of the synchronous orbit is expressed by Rsyn3 = P2GM/4π2 where P is the period of rotation of the primary, M is the mass of the primary and G is the Newtonian gravitational constant. In the case of Saturn, P = 3.88 x 10⁴ sec, M = 5.68 x 1026 kg and G = 6.67 x 10⁻¹¹. Thus Rsyn (Saturn) = 1.12 x 10⁵ km. Values of Rsyn for the planets are shown in Table 2.1.
A.3. Satellites Above the Synchronous Orbit
As the satellite moves in its orbit and the central body rotates, tidal bulges experience hysteresis; a lag caused by the slower rate at which the material in the bulge relaxes. Because the central body is rotating faster than the satellite, the bulge on the central body moves ahead. This leads to an off-centre gravitational force that acts on the central body to slow its rotation and to increase the orbital velocity of the satellite causing it to move to a higher orbit. Tidal drag eventually leads to tidal locking of the satellite. In this situation, the same face of the satellite faces the central body; its orbital rotation matches its axial rotation. Tidal locking of this type is seen with the Earth’s Moon and several other planet-moon systems.
A.4. Satellites Below the Synchronous Orbit
There are at least nineteen moons in the Solar System that have orbital radii less than the local synchronous orbit; they are termed fast satellites and all are small bodies that were probably captured long after the formation of the Solar System. An off-centre gravitational force now acts to increase the rate of rotation of the central body and to decrease the orbital velocity of the satellite. This causes the satellite to lose altitude and eventually crash onto the surface of the central body or break apart at the Roche limit. Although it has been suggested by Křižek and Somer [28,29] that local cosmological expansion might resist the tidal descent of these bodies, in the case of Phobos, the rate of inward motion is far greater than the expected cosmological recessional effect. It is therefore likely that a similar situation will exist for other fast satellites.
A.5. Orbital Resonance
When orbiting bodies exert regular, periodic gravitational influence on each other, usually because their orbital periods are related by a ratio of small integers, they are said to be in resonance. Resonance can occur in binary as well as multiple moon systems. Examples in the Solar System include Neptune and Pluto (ratio of their orbital periods = 2:3), and Jupiter’s moons Ganymede, Europa and Io (ratio of their orbital periods = 1:2:4). It is likely that these resonances became locked in at an early stage. Cosmological expansion does not affect orbital resonance since from Kepler’s 3rd law, the square of an orbital period is proportional to the cube of the orbital radius. Thus, if Px and P0 are the orbital periods of two satellites and their respective radii are rx and r0, then given that (Px/P0)2 = (rx/r0)3, cosmological expansion does not change rx/r0 and hence does not change Px/P0.
References
- Rees, M. (Ed.) . Universe: the definitive visual guide. Dorling Kindersley Ltd.: London, UK, 2020, ISBN: 978-1-4093-7650-7. 2012.
- Baird, C. S. How long before the expansion of the universe causes our Earth to drift away from the Sun? Available online: https://wtamu.edu/~cbaird/sq/2013/05/04/how-long-before-the-expansion-of-the-universe-causes-our-earth-to-drift-away-from-the-sun/. (accessed on 21 July 2025).
- Wiegert, C. Physics questions people ask Fermilab. Available online: https://www.fnal.gov/pub/science/inquiring/questions/expandinguniverse.html. (accessed on 21 July 2025).
- Palma, C. The implications of Hubble’s Law: An expanding universe. Available online: https://www.e-education.psu.edu/astro801/content/l10_p4.html. (accessed on 21 July 2025).
- Suntola, T. THE DYNAMIC UNIVERSE - Toward a unified picture of physical reality; : CITY, COUNTRY ISBN:.
- Suntola, T. In a holistic perspective, time is absolute and relativity a direct consequence of the conservation of total energy. Phys. Essays 2021, 34, 486–501. [Google Scholar] [CrossRef]
- International Astronomical Union Resolution B4. Available online: https://drive.google.com/file/d/1T6FPxirWzZlwwykZy2-lCVmDO78PiMVJ/view (accessed on 21 July 2025).
- Knox, L.; Millea, M. The Hubble hunter’s guide. Available online: https://arxiv.org/abs/1908.03663v1. (accessed on 21 July 2025).
- Poulin, V. The Hubble tension. Cerncourier, Available online:. Available online: https://cerncourier.com/a/the-hubble-tension/, (accessed on 21 July 2025).
- Dumin, Y. V. Is the Hubble constant scale-dependent? Gravitation Cosmol. 2018, 24(2), 171-172. https://arxiv.org/pdf/1712.09340.
- Lee, N.; Braglia, M.; Ali-Haïmond, Y. What it takes to solve the Hubble tension through scale-dependent modifications of the primordial power spectrum. Available online: https://arxiv.org/pdf/2504.07966,. (accessed on 21 July 2025).
- Dumin, Y. A new application of the lunar laser retroreflectors: Searching for the “local” hubble expansion. Adv. Space Res. 2003, 31, 2461–2466. [Google Scholar] [CrossRef]
- King, L. A. Any ideas? New Sci., 1970, 45(684), 127.
- McVittie, G.C. The Mass-Particle in an Expanding Universe. Mon. Not. R. Astron. Soc. 1933, 93, 325–339. [Google Scholar] [CrossRef]
- Bonnor, W.B. The cosmic expansion and local dynamics. Mon. Not. R. Astron. Soc. 1996, 282, 1467–1469. [Google Scholar] [CrossRef]
- Bonnor, W.B. Local Dynamics and the Expansion of the Universe. Gen. Relativ. Gravit. 2000, 32, 1005–1007. [Google Scholar] [CrossRef]
- Cooperstock, F.I.; Faraoni, V.; Vollick, D.N. The Influence of the Cosmological Expansion on Local Systems. Astrophys. J. 1998, 503, 61–66. [Google Scholar] [CrossRef]
- National Radio Astronomy Observatory, Available online:. Available online: https://public.nrao.edu/ask/can-one-measure-the-expansion-of-the-universe-within-our-solar-system/. (accessed on 21 July 2025).
- Einstein, A.; de Sitter, W. On the Relation between the Expansion and the Mean Density of the Universe. Proc. Natl. Acad. Sci. 1932, 18, 213–214. [Google Scholar] [CrossRef]
- Peebles, P. J. E. Cosmology’s century: an inside history of our modern understanding of the Universe; Princeton University Press: Princeton, USA, 2020; ISBN 978-0-691-20166-5. [Google Scholar]
- Křížek, M. Dark energy and the anthropic principle. New Astron. 2012, 17, 1–7. [Google Scholar] [CrossRef]
- Dumin, Y. V. On a probable manifestation of Hubble expansion at the local scales, as inferred from LLR data. [CrossRef]
- Dumin, Y.V. TESTING THE DARK-ENERGY-DOMINATED COSMOLOGY BY THE SOLAR-SYSTEM EXPERIMENTS. Proceedings of the MG11 Meeting on General Relativity. LOCATION OF CONFERENCE, GermanyDATE OF CONFERENCE; pp. 1752–1754.
- Dumin, Y. V. Local Hubble expansion: current state of the problem. [CrossRef]
- King, L.A.; Sipilä, H. Cosmological expansion in the Solar System. Phys. Essays 2022, 35, 139–142. [Google Scholar] [CrossRef]
- Křížek, M.; Gueorguiev, V.G.; Maeder, A. An Alternative Explanation of the Orbital Expansion of Titan and Other Bodies in the Solar System. Gravit. Cosmol. 2022, 28, 122–132. [Google Scholar] [CrossRef]
- Křížek, M.; Somer, L. Antigravity—Its Manifestations and Origin. Int. J. Astron. Astrophys. 2013, 03, 227–235. [Google Scholar] [CrossRef]
- Křížek, M.; Somer, L. Manifestations of dark energy in the solar system. Gravit. Cosmol. 2015, 21, 59–72. [Google Scholar] [CrossRef]
- Křižek, M.; Somer, L. Anthropic principle and the local Hubble expansion. In Proceedings of the International Conference on Cosmology on Small Scales, Institute of Mathematics, Czech Academy of Science, Prague, Czechia, Křižek M. and Dumin, Y., Eds. Available online: https://css2016.math.cas.cz/proceedingsCSS2016.pdf. (accessed on 21 July 2025). 2016. Available online: https://css2016.math.cas.cz/proceedingsCSS2016.pdf. (accessed on 21 July 2025).
- Křížek, M.; Somer, L. Mathematical Aspects of Paradoxes in Cosmology; Springer Nature: Dordrecht, GX, Netherlands, 2023. [Google Scholar]
- Sipilä, H. Is the Solar System expanding?.CONFERENCE NAME, LOCATION OF CONFERENCE, COUNTRYDATE OF CONFERENCE;
- Sipilä, H. Recalculation of the Moon retreat velocity supports expansion of gravitationally bound local systems, In Proceedings of the International Conference on Cosmology on Small Scales, Institute of Mathematics, Czech Academy of Science, Prague, Czechia, 2022, Křižek M. and Dumin, Y., Eds. Available online: https://css2022.math.cas.cz/proceedingsCSS2022.pdf. (accessed on 21 July 2025); Available online: https://css2022.math.cas.cz/proceedingsCSS2022.pdf. (accessed on 21 July 2025).
- King, L.A. Recession of Deimos from Mars: A cosmological interpretation. Phys. Essays 2024, 37, 191–192. [Google Scholar] [CrossRef]
- King, L.A. Cosmological recession of the Galilean moons from Jupiter. Phys. Essays 2024, 37, 279–280. [Google Scholar] [CrossRef]
- King, L.A. Evolution of Saturn’s Large Inner Moons: An Alternative Explanation. Gravit. Cosmol. 2025, 31, 181–184. [Google Scholar] [CrossRef]
- King, L. A.; Orbital expansion of the Uranus moons Miranda and Ariel: cosmological interpretation. Phys. Essays 2025, 38(1), 55-56, Available online:. Available online: https://www.researchgate.net/profile/Leslie-King-5/research. (accessed on 21 July 2025).
- King, L.A. Orbital evolution of the Neptunian moons Hippocamp and Proteus. Phys. Essays 2025, 38, 95–97. [Google Scholar] [CrossRef]
- Müller, V. Cosmological expansion rate – various measurement results and interpretation. [CrossRef]
- Müller, V. Cosmic expansion clues from the Earth. [CrossRef]
- Steigerwald, W. NASA team studies middle-aged Sun by tracking motion of Mercury. Available online: https://www.nasa.gov/missions/nasa-team-studies-middle-aged-sun-by-tracking-motion-of-mercury/. (accessed on 21 July 2025).
- Genova, A.; Mazarico, E.; Goossens, S.; Lemoine, F.G.; Neumann, G.A.; Smith, D.E.; Zuber, M.T. Solar system expansion and strong equivalence principle as seen by the NASA MESSENGER mission. Nat. Commun. 2018, 9, 1–9. [Google Scholar] [CrossRef]
- Jones, H. S. The rotation of the Earth, and secular acceleration of the Sun, Moon and planets. Mon. Not. R. Astron. Soc. 1939, 99, 541–558. [Google Scholar] [CrossRef]
- Kolesnik, Y.B.; Masreliez, C.J. Secular Trends in the Mean Longitudes of Planets Derived from Optical Observations. Astron. J. 2004, 128, 878–888. [Google Scholar] [CrossRef]
- Krasinsky, G.A.; Brumberg, V.A. Secular increase of astronomical unit from analysis of the major planet motions, and its interpretation. Celest. Mech. Dyn. Astron. 2004, 90, 267–288. [Google Scholar] [CrossRef]
- Henry, J.; Yurukeu, M.; Nnanna, G. How fast is the distance between Earth and the Sun changing in the Solar System? [CrossRef]
- Wade, N. Three Origins of the Moon. Nature 1969, 223, 243–246. [Google Scholar] [CrossRef]
- Dickey, J.O.; Bender, P.L.; Faller, J.E.; Newhall, X.X.; Ricklefs, R.L.; Ries, J.G.; Shelus, P.J.; Veillet, C.; Whipple, A.L.; Wiant, J.R.; et al. Lunar Laser Ranging: A Continuing Legacy of the Apollo Program. Science 1994, 265, 482–490. [Google Scholar] [CrossRef]
- Zhang, W.; Li, Z.; Lei, Y. Experimental measurement of growth patterns on fossil corals: Secular variation in ancient Earth-Sun distances. Chin. Sci. Bull. 2010, 55, 4010–4017. [Google Scholar] [CrossRef]
- Williams, G.E. Geological constraints on the Precambrian history of Earth's rotation and the Moon's orbit. Rev. Geophys. 2000, 38, 37–59. [Google Scholar] [CrossRef]
- Mazumder, R.; Arima, M. Tidal rhythmites and their implications. Earth-Science Rev. 2005, 69, 79–95. [Google Scholar] [CrossRef]
- de Azarevich, V.L.L.; Azarevich, M.B. Lunar recession encoded in tidal rhythmites: a selective overview with examples from Argentina. Geo-Marine Lett. 2017, 37, 333–344. [Google Scholar] [CrossRef]
- Kahn, P.G.K.; Pompea, S.M. Nautiloid growth rhythms and dynamical evolution of the Earth–Moon system. Nature 1978, 275, 606–611. [Google Scholar] [CrossRef]
- Maeder, A.M.; Gueorguiev, V.G. On the relation of the lunar recession and the length-of-the-day. Astrophys. Space Sci. 2021, 366, 1–21. [Google Scholar] [CrossRef]
- Chapront, J.; Chapront-Touzé, M.; Francou, G. A new determination of lunar orbital parameters, precession constant and tidal acceleration from LLR measurements. Astron. Astrophys. 2002, 387, 700–709. [Google Scholar] [CrossRef]
- Sagan, C.; Mullen, G. Earth and Mars: Evolution of Atmospheres and Surface Temperatures. Science 1972, 177, 52–56. [Google Scholar] [CrossRef]
- Feulner, G. The faint young Sun problem. Rev. Geophys. 2012, 50. [Google Scholar] [CrossRef]
- Pearce, B.K.; Tupper, A.S.; Pudritz, R.E.; Higgs, P.G. Constraining the Time Interval for the Origin of Life on Earth. Astrobiology 2018, 18, 343–364. [Google Scholar] [CrossRef]
- Dumin, Y.V.; Savinykh, E.S. Křížek–Somer Anthropic Principle and the Problem of Local Hubble Expansion. Gravit. Cosmol. 2025, 31, 205–209. [Google Scholar] [CrossRef]
- Squyres, S.W. Urey prize lecture: Water on Mars. Icarus 1989, 79, 229–288. [Google Scholar] [CrossRef]
- Gillespie, J.; Cavosie, A.J.; Fougerouse, D.; Ciobanu, C.L.; Rickard, W.D.A.; Saxey, D.W.; Benedix, G.K.; Bland, P.A. Zircon trace element evidence for early hydrothermal activity on Mars. Sci. Adv. 2024, 10, eadq3694. [Google Scholar] [CrossRef] [PubMed]
- Maeder A., M.; Bouvier, P. Scale invariance, metrical connection and the motions of astronomical bodies. Astron. Astrophys. 1979, 73, 82–89. [Google Scholar]
- Castelvecchi, D. First up-close images of Mars’s little-known moon Deimos. Nature 2023, 617, 19–19. [Google Scholar] [CrossRef] [PubMed]
- Bagheri, A.; Khan, A.; Efroimsky, M.; Kruglyakov, M.; Giardini, D. Dynamical evidence for Phobos and Deimos as remnants of a disrupted common progenitor. Nat. Astron. 2021, 5, 539–543. [Google Scholar] [CrossRef]
- MMX Martian Moons Exploration. Available online: https://www.mmx.jaxa.jp/en/. (accessed on 21 July 2025).
- Shor, V.A. The motion of the Martian satellites. Celest. Mech. Dyn. Astron. 1975, 12, 61–75. [Google Scholar] [CrossRef]
- NASA (National Aeronautics and Space Administration). Available online: https://science.nasa.gov/mars/moons/phobos/. (accessed on 21 July 2025).
- NASA (National Aeronautics and Space Administration). Available online: https://science.nasa.gov/mission/europa-clipper/. (accessed on 21 July 2025).
- The European Space Agency, Juice_Jupiter Icy Moons Explorer. Available online: https://www.esa.int/Science_Exploration/Space_Science/Juice. (accessed on 21 July 2025).
- Lari, G.; Saillenfest, M.; Fenucci, M. Long-term evolution of the Galilean satellites: the capture of Callisto into resonance. Astron. Astrophys. 2020, 639, A40. [Google Scholar] [CrossRef]
- Lainey, V.; Arlot, J.-E.; Karatekin, Ö.; Van Hoolst, T. Strong tidal dissipation in Io and Jupiter from astrometric observations. Nature 2009, 459, 957–959. [Google Scholar] [CrossRef]
- Neveu, M.; Rhoden, A.R. Evolution of Saturn’s mid-sized moons. Nat. Astron. 2019, 3, 543–552. [Google Scholar] [CrossRef] [PubMed]
- Fuller, J.; Luan, J.; Quataert, E. Resonance locking as the source of rapid tidal migration in the Jupiter and Saturn moon systems. Mon. Not. R. Astron. Soc. 2016, 458, 3867–3879. [Google Scholar] [CrossRef]
- Ćuk, M.; Dones, L.; Nesvorný, D. DYNAMICAL EVIDENCE FOR A LATE FORMATION OF SATURN’S MOONS. Astrophys. J. 2016, 820, 97. [Google Scholar] [CrossRef]
- Teodoro, L.F.A.; Kegerreis, J.A.; Estrada, P.R.; Ćuk, M.; Eke, V.R.; Cuzzi, J.N.; Massey, R.J.; Sandnes, T.D. A Recent Impact Origin of Saturn’s Rings and Mid-sized Moons. Astrophys. J. 2023, 955, 137. [Google Scholar] [CrossRef]
- Lainey, V.; Casajus, L.G.; Fuller, J.; Zannoni, M.; Tortora, P.; Cooper, N.; Murray, C.; Modenini, D.; Park, R.S.; Robert, V.; et al. Resonance locking in giant planets indicated by the rapid orbital expansion of Titan. Nat. Astron. 2020, 4, 1053–1058. [Google Scholar] [CrossRef]
- Nimmo, F. Strong Tidal Dissipation at Uranus? Planet. Sci. J. 2023, 4, 241. [Google Scholar] [CrossRef]
- Showalter, M.R.; de Pater, I.; Lissauer, J.J.; French, R.S. The seventh inner moon of Neptune. Nature 2019, 566, 350–353. [Google Scholar] [CrossRef]
- Showalter, M.R. The rings and small moons of Uranus and Neptune. Philos. Trans. R. Soc. A: Math. Phys. Eng. Sci. 2020, 378, 20190482. [Google Scholar] [CrossRef] [PubMed]
- Banfield, D.; Murray, N. A dynamical history of the inner Neptunian satellites. Icarus 1992, 99, 390–401. [Google Scholar] [CrossRef]
- Cohen, B.A.; Swindle, T.D.; Kring, D.A. Support for the Lunar Cataclysm Hypothesis from Lunar Meteorite Impact Melt Ages. Science 2000, 290, 1754–1756. [Google Scholar] [CrossRef] [PubMed]
- Anderson, J.D.; Laing, P.A.; Lau, E.L.; Liu, A.S.; Nieto, M.M.; Turyshev, S.G. Study of the anomalous acceleration of Pioneer 10 and 11. Phys. Rev. D 2002, 65, 082004. [Google Scholar] [CrossRef]
- Lachièze-Rey, M. Cosmology in the solar system: the Pioneer effect is not cosmological. Class. Quantum Gravity 2007, 24, 2735–2741. [Google Scholar] [CrossRef]
- Kenyon, S.J.; Bromley, B.C. THE FORMATION OF PLUTO'S LOW-MASS SATELLITES. Astron. J. 2013, 147. [Google Scholar] [CrossRef]
- Denton, C.A.; Asphaug, E.; Emsenhuber, A.; Melikyan, R. Capture of an ancient Charon around Pluto. Nat. Geosci. 2025, 18, 37–43. [Google Scholar] [CrossRef]
- Cosmology on Small Scales. Institute of Mathematics, Czech Academy of Sciences, Prague, Available online:. Available online: https://css2024.math.cas.cz/proceedingsCSS2024.pdf. (accessed on 21 July 2025).
- Kuhn, T. S. The Structure of Scientific Revolutions, 2nd ed.; The University of Chicago Press, Chicago, USA, 1970. ISBN: 0-226-45804-0.
Figure 4.
1. Orbital evolution of Deimos and Phobos over the past 1.85 Gyr. The vertical axis shows distance from the centre of Mars. The lower solid horizontal line, which represents the surface of Mars, is located at 3,396 km from the centre of Mars. The upper solid horizontal line represents the current synchronous orbit located at 20,428 km from the centre of Mars. The current and original positions of Phobos are shown, but the locus of the descent path is illustrative only.
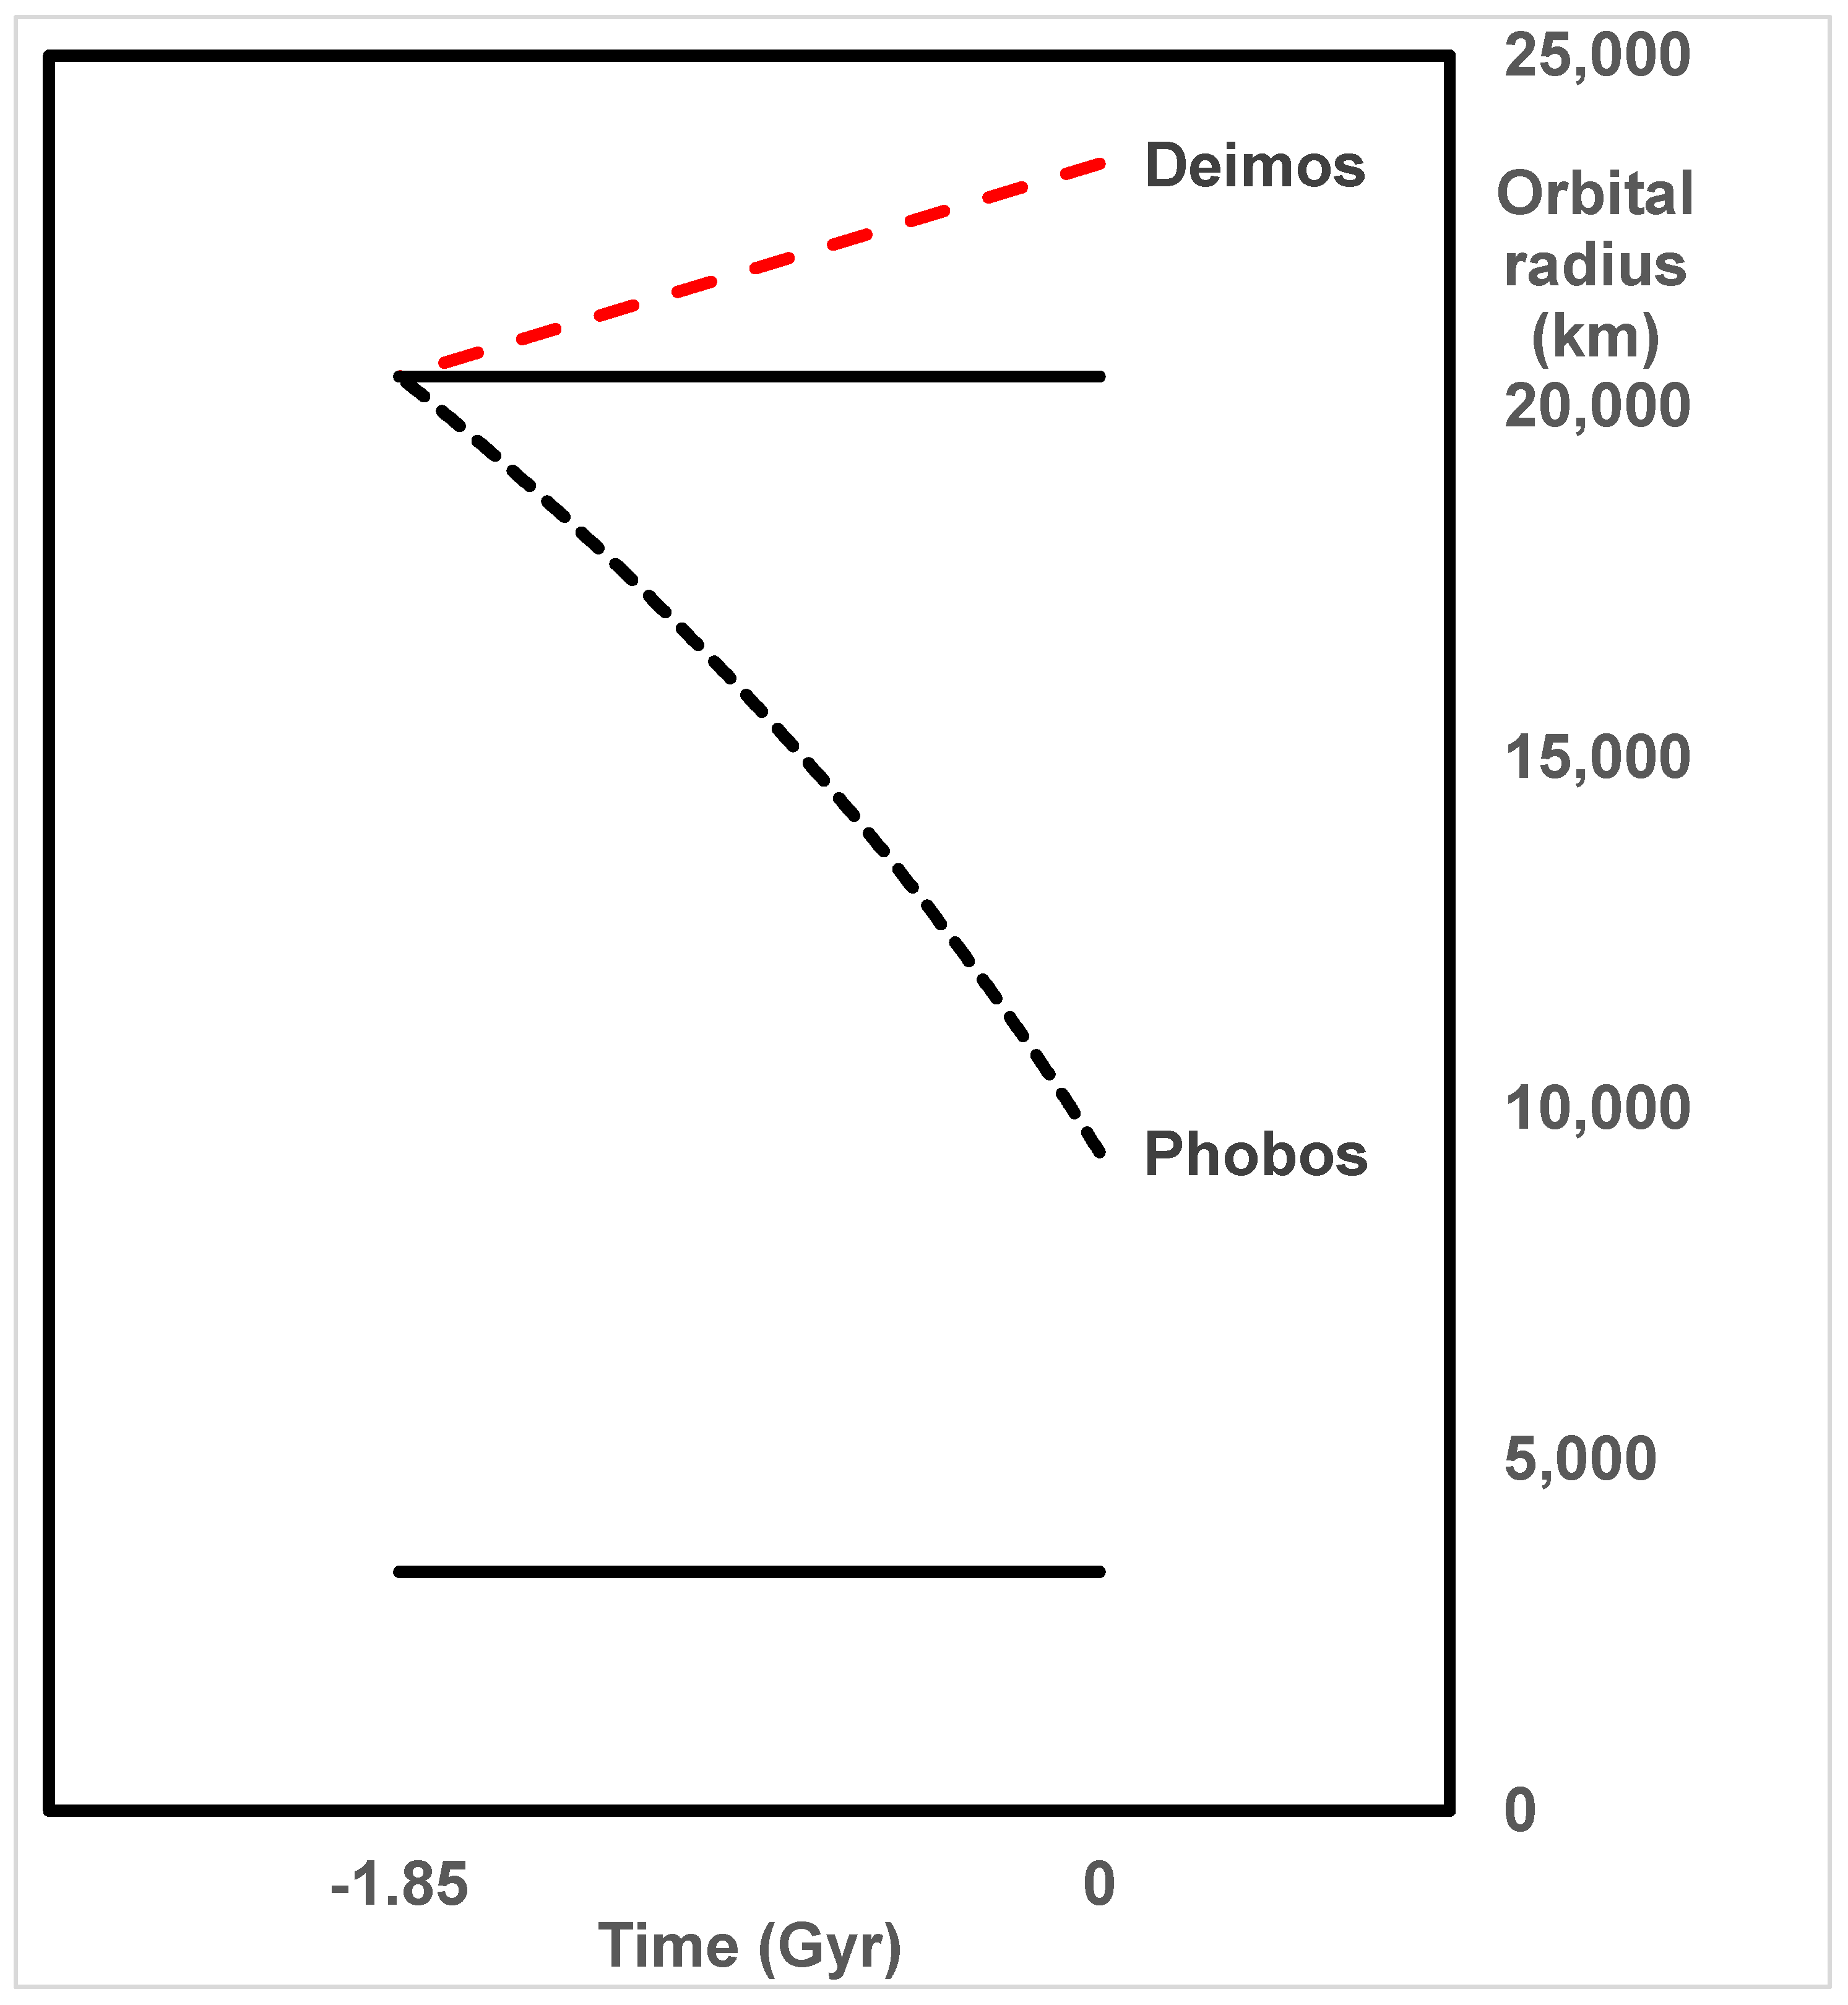
Figure 5.
1. Recession of three Galilean moons of Jupiter (Io, Europa and Ganymede). The relative orbital radii (Rj) are shown for the period from 4.6 Gyr ago to the present (extrapolated from values of RJ/Gyr in Table 5.2). The orbital paths derived from Figure 1 in Lari et al. [69} are shown as dashed lines while the paths based on the assumption that the moons have receded to their current positions solely because of the Hubble-Lemaître flow are shown as solid lines. The current relative synchronous orbit, shown as a horizontal line, is located at Rj = 2.23.
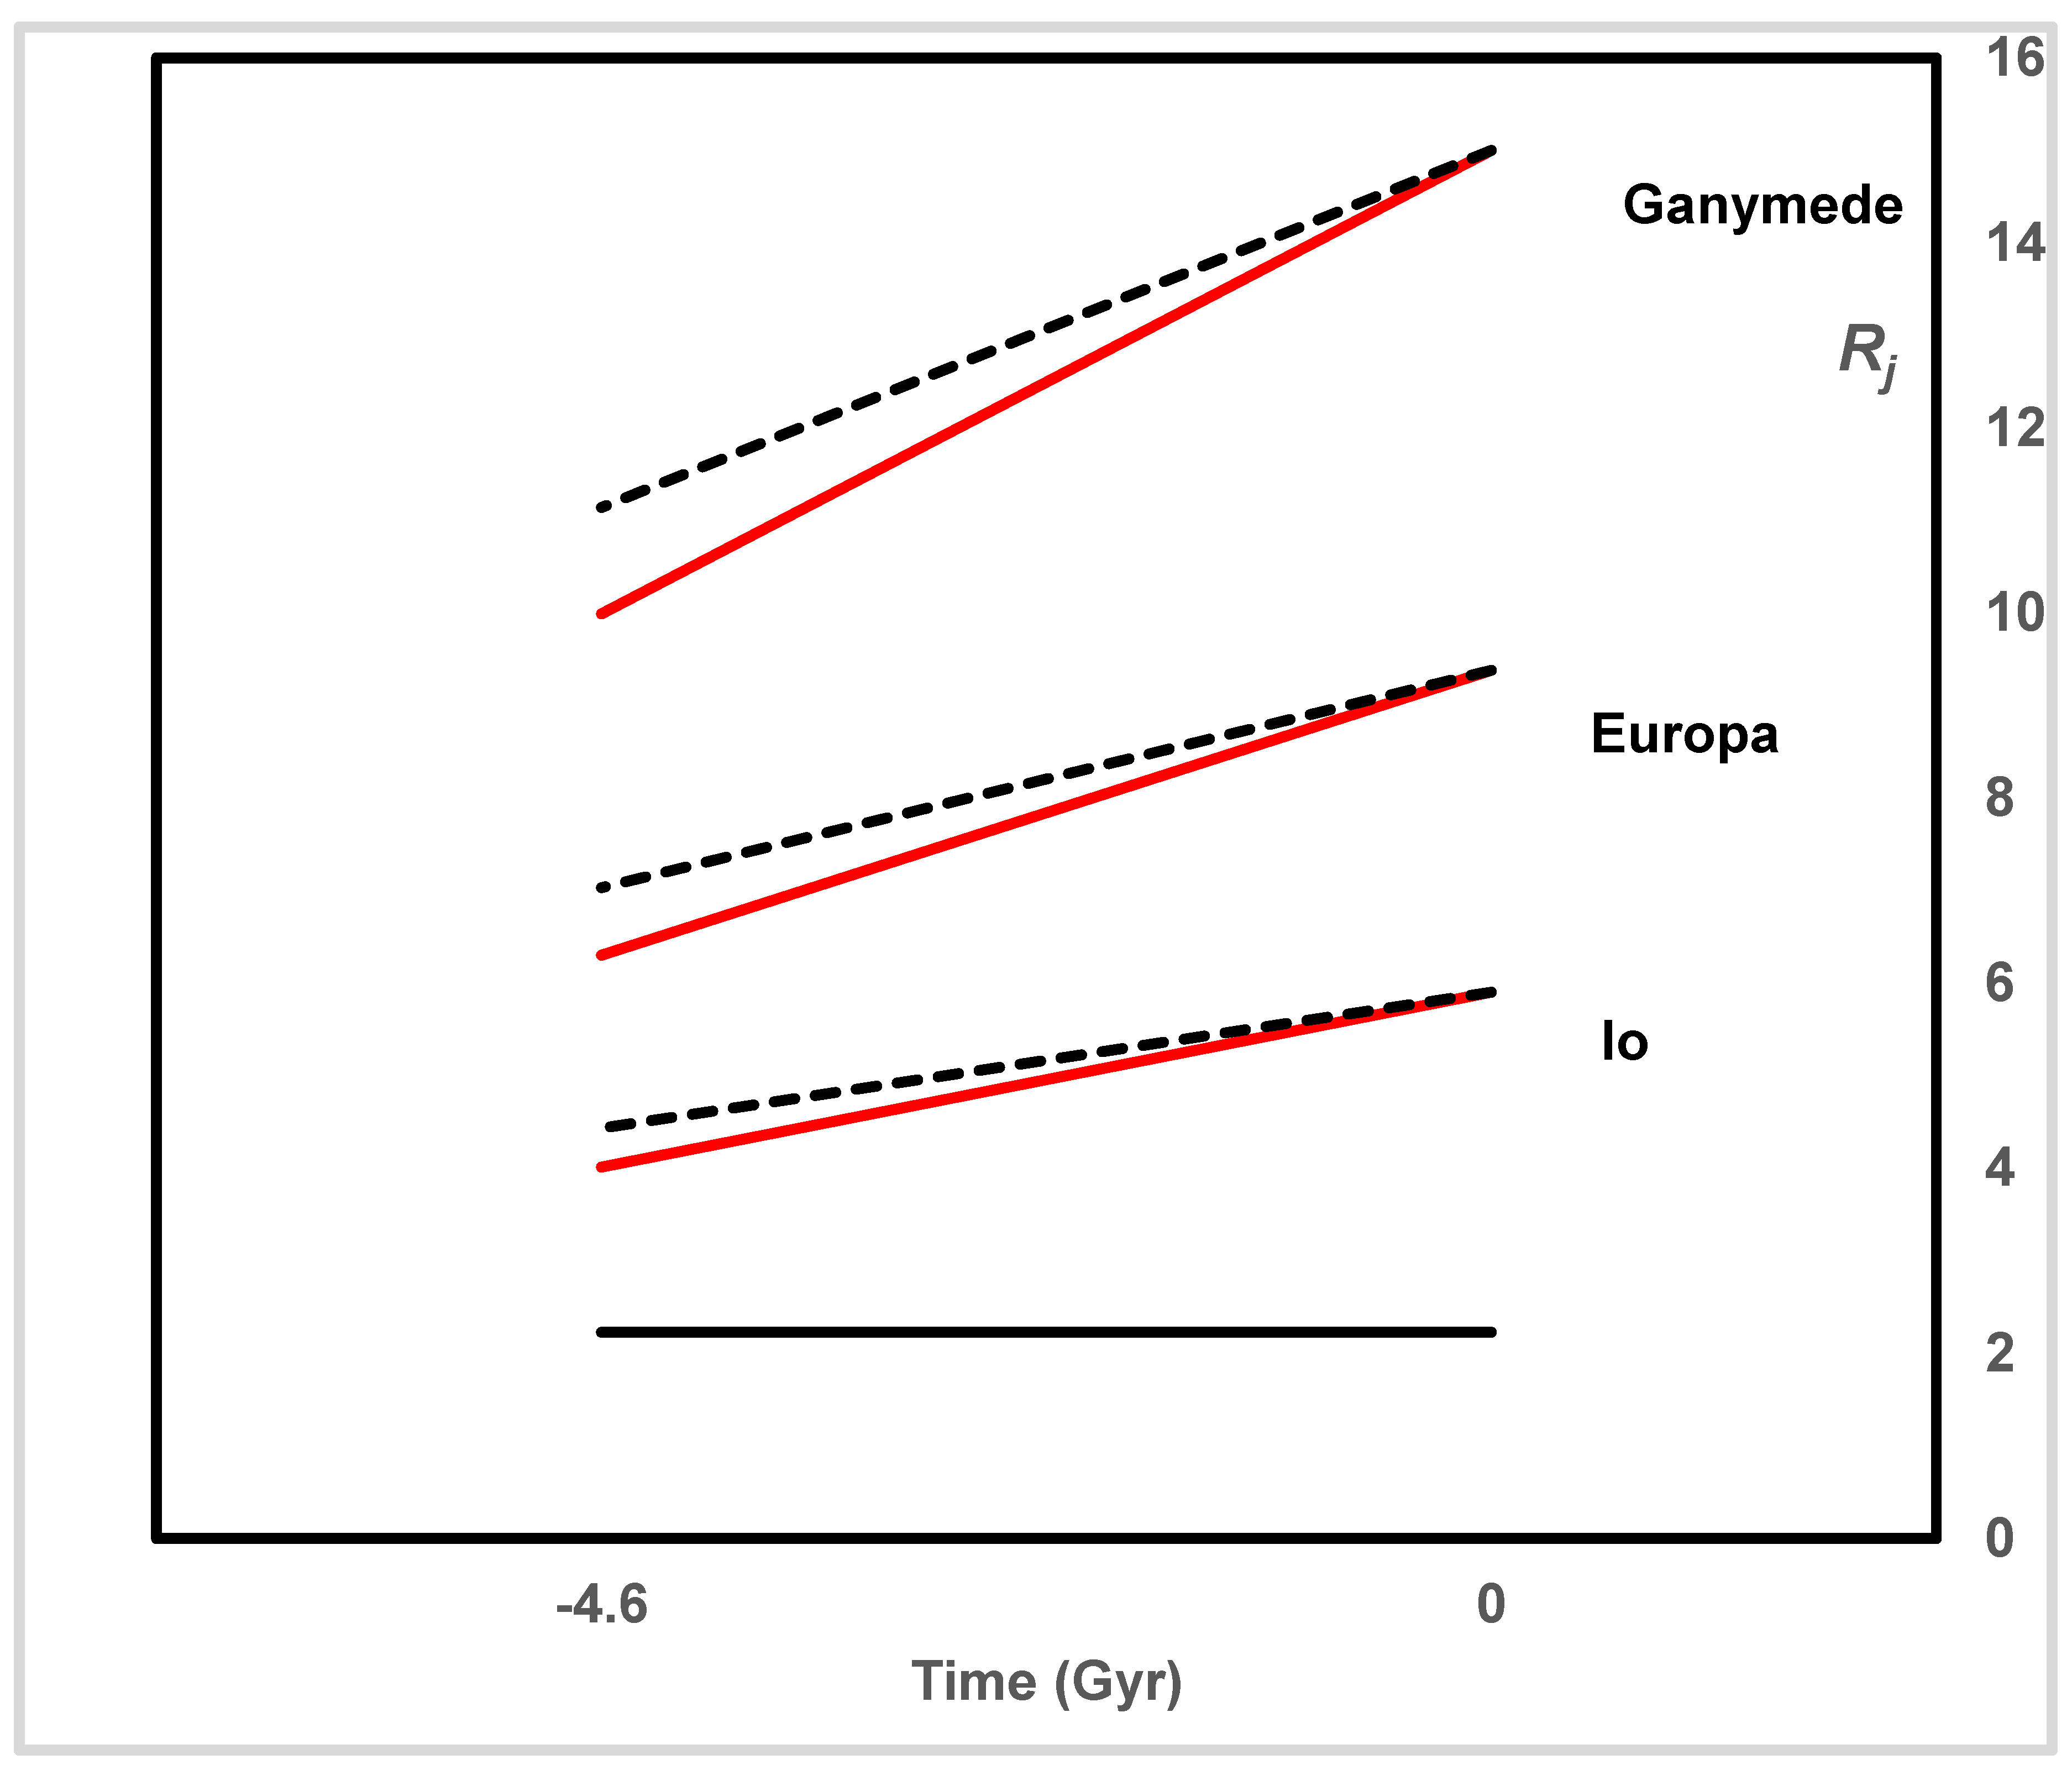
Figure 6.
1. Recession of the five large inner moons of Saturn. The relative orbital radii (Rs) are shown for the period from 4.6 Gyr ago to the present. The orbital paths derived from Figure 4 in Fuller et al. [72] are shown as dashed lines while the paths based on the assumption that the moons have receded to their current positions solely because of the Hubble-Lemaître flow are shown as solid lines. The two paths for Mimas coincide. The current relative synchronous orbit (Rs = 1.92) is shown as a horizontal line.
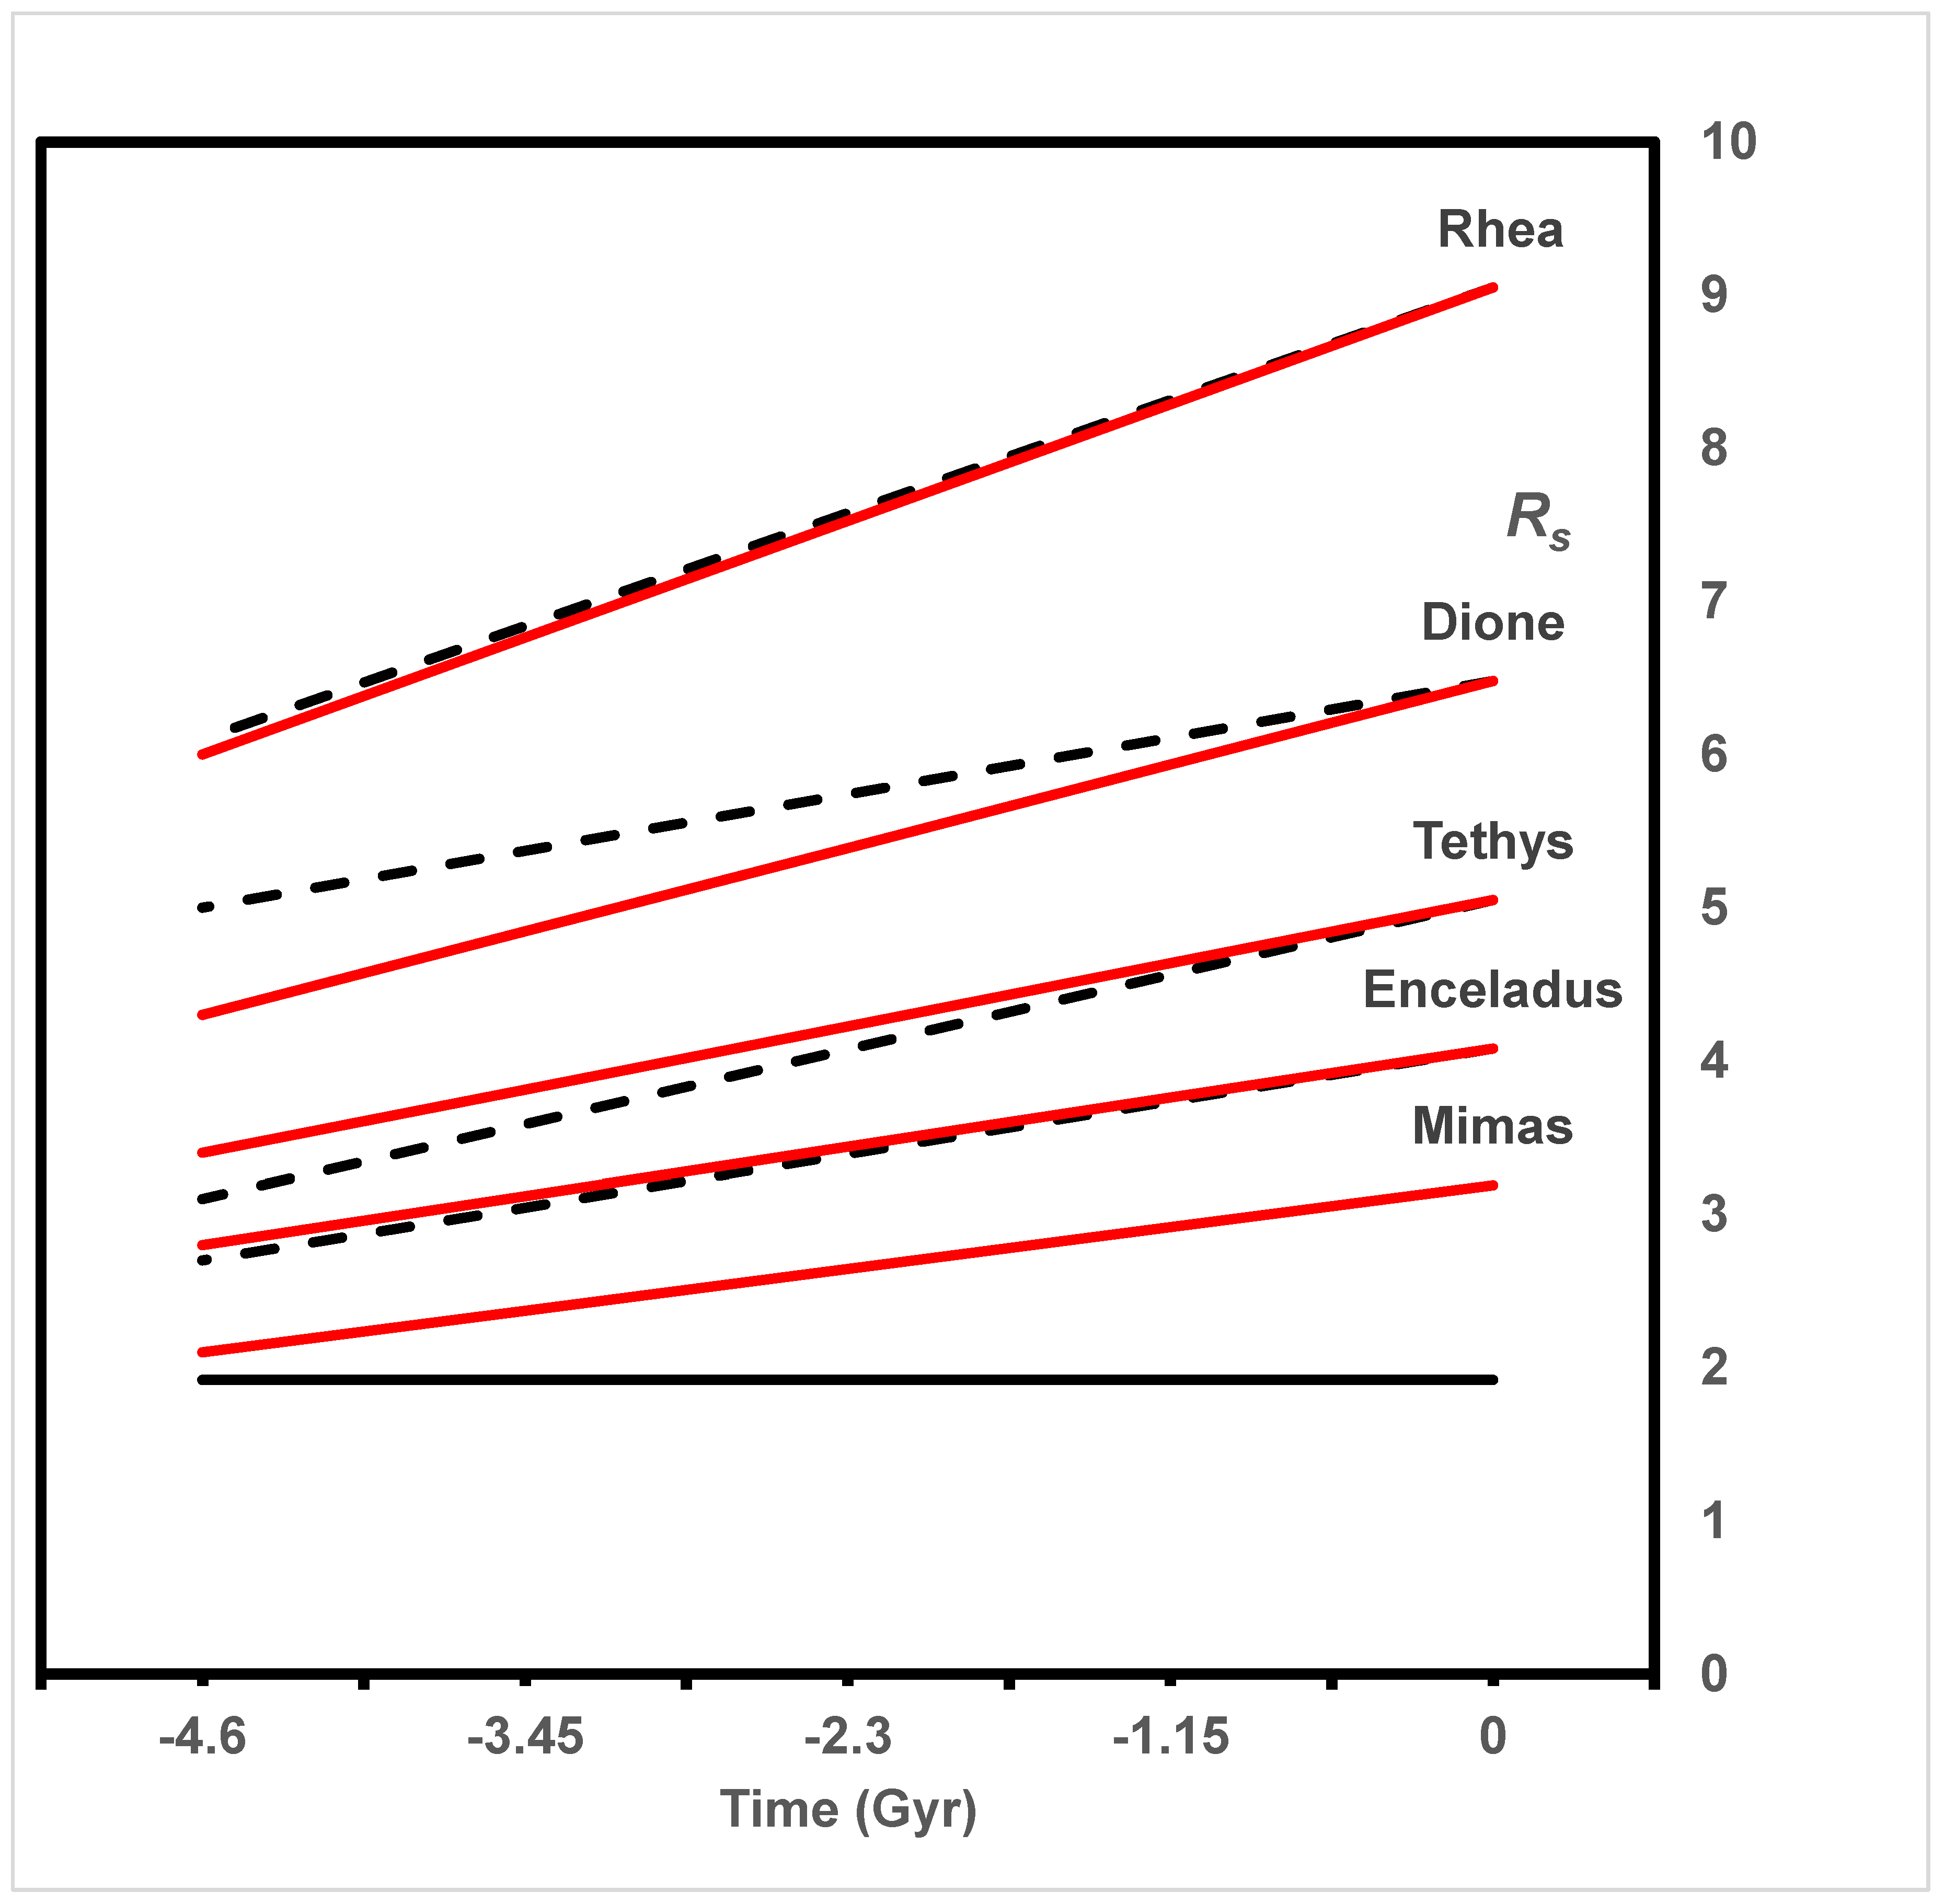
Figure 7.
1. Recession of the moons Miranda and Ariel from Uranus.The relative orbital radii (Ru) are shown for the period from 4.6 Gyr ago to the present. The orbital paths for Miranda and Ariel, derived from Figure 2 in Nimmo [76], are shown as dashed lines while the paths based on the assumption that the moons have receded to their current positions solely because of the Hubble-Lemaître flow are shown as solid lines. The current relative synchronous orbit (Ru = 3.23) is shown as a horizontal line.
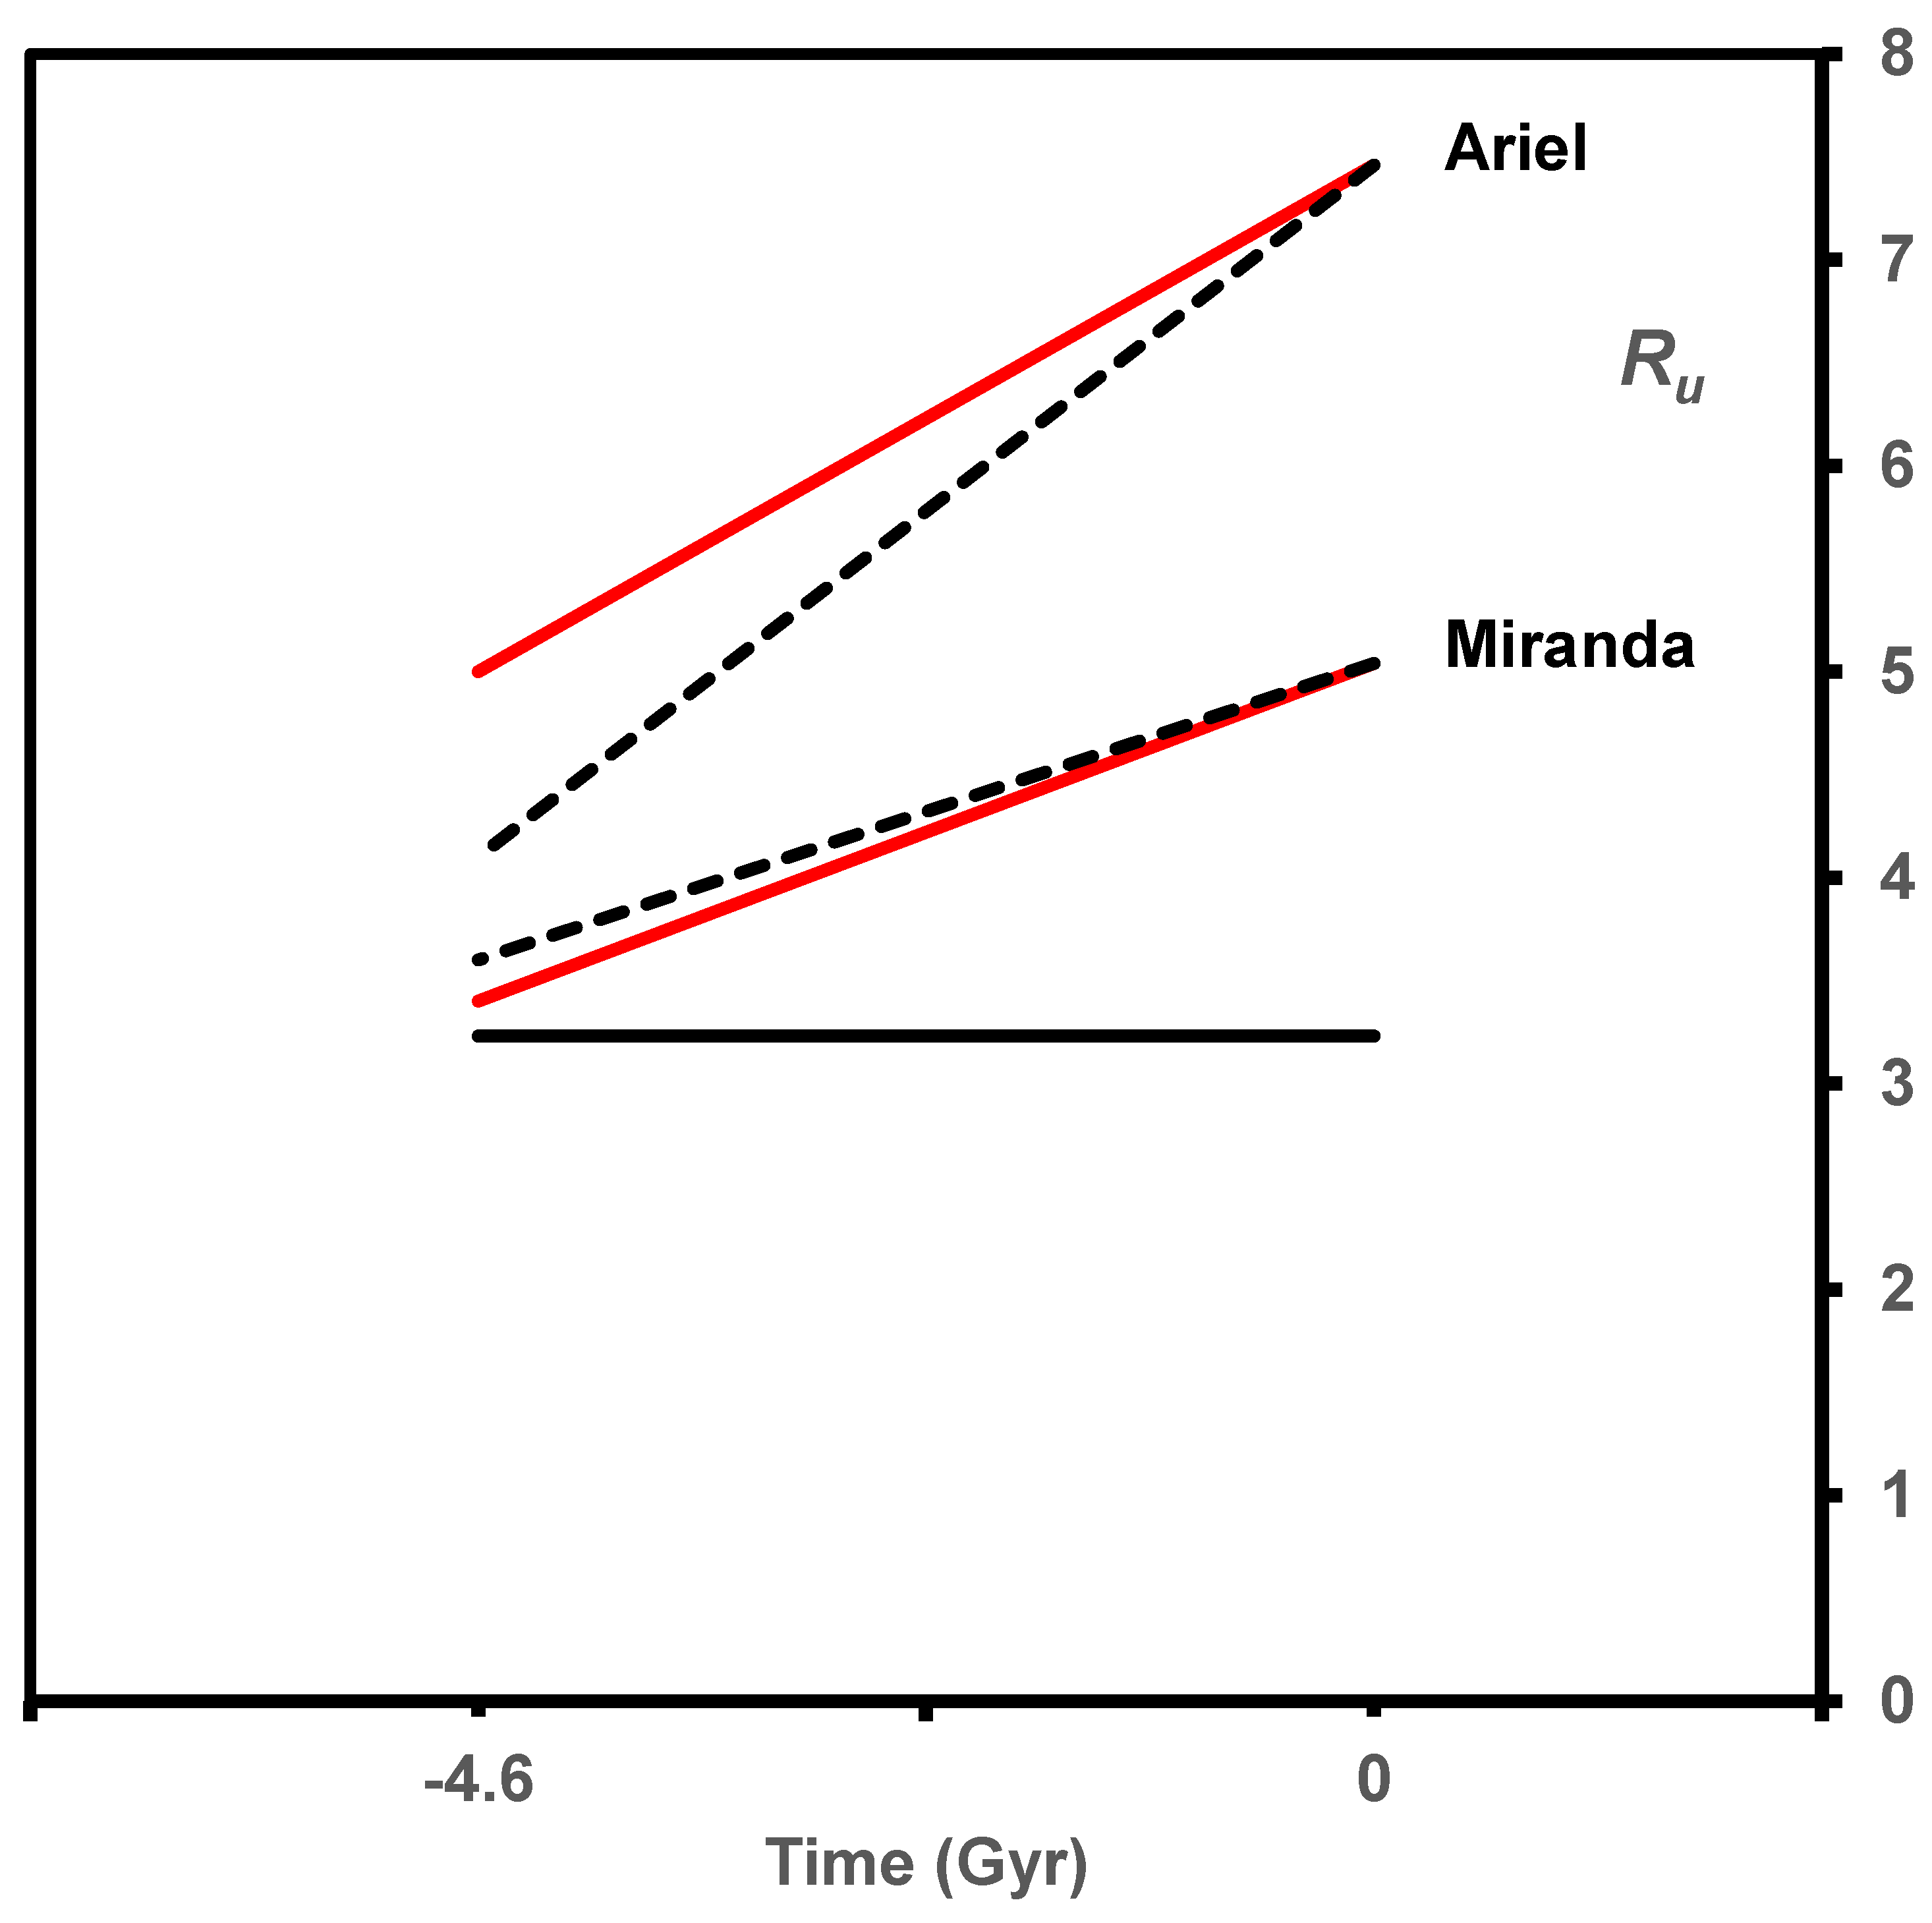
Figure 8.
1. Recession of the orbits of Hippocamp and Proteus from Neptune. For Proteus, Hubble-Lemaître cosmological expansion includes an element of tidal retreat. The ordinate shows relative orbital radii (RN). The current relative synchronous orbit is shown as a solid horizontal line (RN = 3.37).
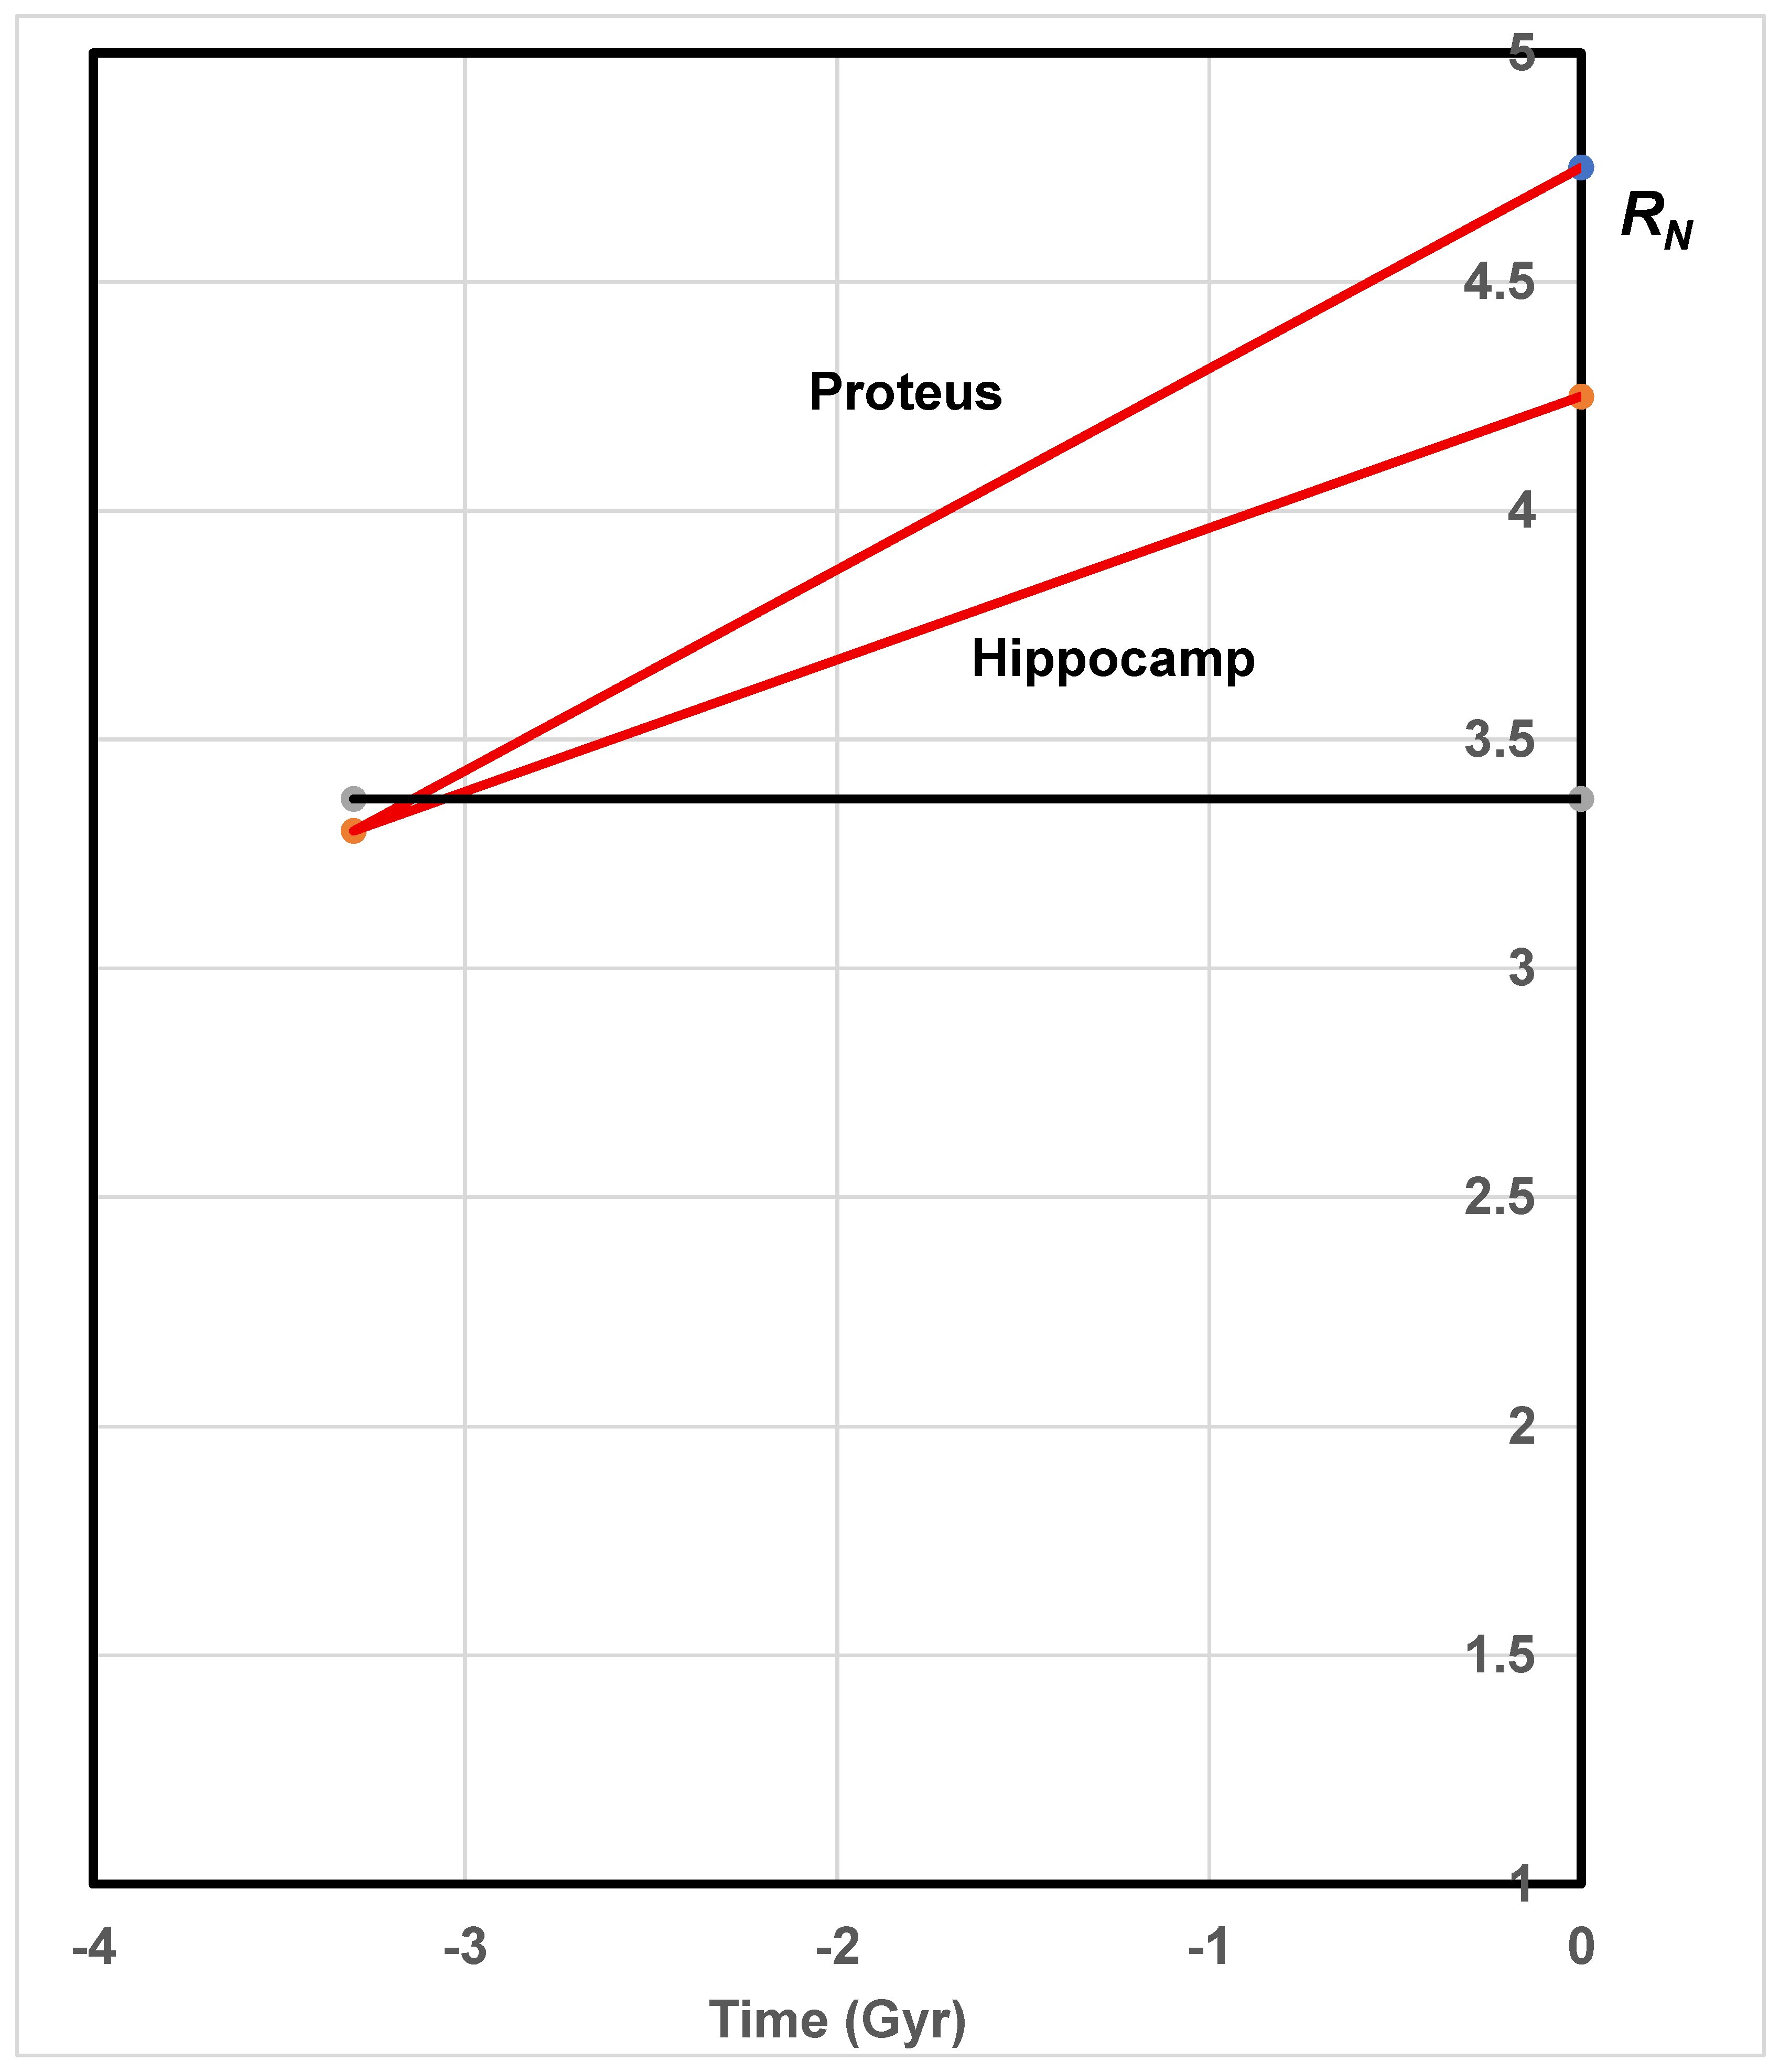

Table 1.
1. The predicted recession of the planets based solely on Hubble-Lemaître flow (H0 = 70 (km/s)/Mpc).
Table 1.
1. The predicted recession of the planets based solely on Hubble-Lemaître flow (H0 = 70 (km/s)/Mpc).
| Planet | Current mean orbital radius (AU) |
Mean orbital radius (AU) in 7 Gyr |
Predicted recessional velocity from the Sun (m yr-1) |
| Mercury | 0.39 | 0.58 | 4.18 |
| Venus | 0.72 | 1.08 | 7.78 |
| Earth | 1.00 | 1.50 | 10.8 |
| Mars | 1.52 | 2.28 | 16.4 |
| Jupiter | 5.20 | 7.80 | 56.1 |
| Saturn | 9.54 | 14.4 | 103 |
| Uranus | 19.2 | 29.9 | 207 |
| Neptune | 30.1 | 45.0 | 324 |
Table 2.
1. The synchronous orbital radii and the approximate Hill radii for the eight planets.
| Planet |
Synchronous orbital radius (Rsyn, km) |
Hill radius (RH, km) |
| Mercury | 242,843 | 180,000 |
| Venus | 1,535,681 | 1,000,000 |
| Earth | 35,786 | 1,500,000 |
| Mars | 20,429 | 980,000 |
| Jupiter | 160,052 | 51,000,000 |
| Saturn | 111,606 | 62,000,000 |
| Uranus | 82,674 | 67,000,000 |
| Neptune | 83,395 | 115,000,000 |
Table 4.
1. The two moons of Mars.
| Moon | Orbital eccentricity | Semi-major axis (km/103) |
Sidereal period (days) |
Mass (kg/1015) |
| Phobos | 0.0151 | 9.38 | 0.320 | 10.7 |
| Deimos | 0.00033 | 23.5 | 1.26 | 1.5 |
Table 5.
1. The Galilean moons of Jupiter. RJ is the orbital radius relative to the equatorial radius of Jupiter (7.15 x 10⁴ km).
Table 5.
1. The Galilean moons of Jupiter. RJ is the orbital radius relative to the equatorial radius of Jupiter (7.15 x 10⁴ km).
| Moon | Orbital eccentricity | Semi-major axis (km/106) |
Semi-major axis (RJ) |
Sidereal period (days) |
Mass (kg/1023) |
| Io | 0.0041 | 0.422 | 5.90 | 1.76 | 0.893 |
| Europa | 0.0090 | 0.671 | 9.38 | 3.53 | 0.480 |
| Ganymede | 0.0013 | 1.07 | 15.0 | 7.16 | 1.48 |
| Callisto | 0.0074 | 1.88 | 26.3 | 16.7 | 1.08 |
Table 5.
2. Orbital evolution of Io, Europa and Ganymede based on tidal theory and Hubble-Lemaître flow. Values are expressed as RJ/Gyr where RJ is the orbital radius relative to the equatorial radius of Jupiter (7.15 x 10⁴ km).
Table 5.
2. Orbital evolution of Io, Europa and Ganymede based on tidal theory and Hubble-Lemaître flow. Values are expressed as RJ/Gyr where RJ is the orbital radius relative to the equatorial radius of Jupiter (7.15 x 10⁴ km).
| Method | Io | Europa | Ganymede | Callisto |
| Lari et al.[69] | 0.32 | 0.51 | 0.84 | 0 |
| Hubble-Lemaître law | 0.41 | 0.67 | 1.09 | 1.89 |
Table 5.
3. The relative mean motion acceleration (a) for three Galilean moons (Io, Europa and Ganymede) compared with the Hubble-Lemaître parameter.
Table 5.
3. The relative mean motion acceleration (a) for three Galilean moons (Io, Europa and Ganymede) compared with the Hubble-Lemaître parameter.
| Moon | Relative mean motion acceleration (a)/10-10 yr-1 |
Mean (a)/10-10 yr-1 |
| Io | +0.144 +/- 0.01 | } } 0.62 } |
| Europa | -0.43 +/- 0.10 | |
| Ganymede | -1.57 +/- 0.27 | |
| Hubble-Lemaître parameter/(10-10 yr-1) | 0.71 | |
Table 6.
1. The seven largest moons of Saturn.
| Moon | Orbital eccentricity | Semi-major axis (km/106) |
Sidereal period (days) |
Mass (kg/1020) |
| Mimas | 0.020 | 0.186 | 0.94 | 0.375 |
| Enceladus | 0.005 | 0.238 | 1.37 | 1.08 |
| Tethys | 0.001 | 0.295 | 1.89 | 6.17 |
| Dione | 0.002 | 0.378 | 2.74 | 11.0 |
| Rhea | 0.001 | 0.527 | 4.52 | 23.1 |
| Titan | 0.029 | 1.22 | 15.9 | 135 |
| Iapetus | 0.028 | 3.56 | 79.3 | 18.1 |
Table 6.
2. The relative orbital radii (Rs), of the five Saturnian moons at t = 0 (4.6 Gyr ago), firstly based on interpolation of Figure 4 in Fuller et al. [72], and, secondly, on the assumption that the moons have receded to their current positions solely because of the Hubble-Lemaître flow. The recessional velocity, orbital advance since t = 0 and orbital radius at t = 0 are calculated from v = (H0)r where H0 = 70 (km/s)/Mpc. All orbits at t = 0 lie outside the synchronous orbit, the radius of which is located at 1.13 x 10⁵ km.
| Moon |
Current orbital radius (km/105) |
Rs at current position |
Rs tidal at t = 0 |
Orbital advance (km/105) since t = 0 |
Orbital radius (km/105) at t = 0 |
Rs Local expansion at t = 0 |
Recessional velocity (cm yr-1) |
| Rhea | 5.27 | 9.05 | 6.1 | 1.8 | 3.47 | 6.0 | 3.9 |
| Dione | 3.77 | 6.48 | 5.0 | 1.3 | 2.47 | 4.3 | 2.8 |
| Tethys | 2.95 | 5.05 | 3.1 | 1.0 | 1.95 | 3.4 | 2.2 |
| Enceladus | 2.38 | 4.08 | 2.7 | 0.78 | 1.60 | 2.8 | 1.7 |
| Mimas | 1.86 | 3.19 | 2.1 | 0.64 | 1.22 | 2.1 | 1.4 |
Table 7.
1. The predicted orbital evolution of the five largest moons of Uranus based on Hubble-Lemaître flow (shown as ‘H-L’) and, for Miranda and Ariel only, based on the tidal theory of Nimmo [76] from t = 0 (4.6 Gyr ago). The relative orbital radius is the ratio of the current orbital radius to the equatorial radius of Uranus (2.56 x 10⁴ km).
| Moon | Semi-major axis (km/105) |
Current relative orbital radius (Ru) |
Estimated relative orbital radius (Ru) at t = 0 Nimmo [76] |
∆Ru Nimmo [76] |
Predicted relative orbital radius (Ru) at t = 0 ‘H-L’ |
∆Ru ‘H-L’ |
| Miranda | 1.29 | 5.04 | 3.6 | 1.8 | 3.4 | 1.6 |
| Ariel | 1.91 | 7.46 | 4.1 | 3.4 | 5.0 | 2.5 |
| Umbriel | 2.66 | 10.4 | - | - | 7.0 | 3.4 |
| Titania | 4.36 | 17.0 | - | - | 11.4 | 5.6 |
| Oberon | 5.83 | 22.8 | - | - | 15.3 | 7.5 |
Table 8.
1. The principal properties of Hippocamp and Proteus.
| Moon | Sidereal period (days) | Semi-major axis (km) | Mass (kg) |
| Hippocamp | 0.9500 | 105,283 | ~ 2 x 10¹⁶ |
| Proteus | 1.1223 | 117,646 | ~ 3.9 x 10¹⁹ |
Disclaimer/Publisher’s Note: The statements, opinions and data contained in all publications are solely those of the individual author(s) and contributor(s) and not of MDPI and/or the editor(s). MDPI and/or the editor(s) disclaim responsibility for any injury to people or property resulting from any ideas, methods, instructions or products referred to in the content. |
© 2025 by the author. Licensee MDPI, Basel, Switzerland. This article is an open access article distributed under the terms and conditions of the Creative Commons Attribution (CC BY) license (https://creativecommons.org/licenses/by/4.0/).
Copyright: This open access article is published under a Creative Commons CC BY 4.0 license, which permit the free download, distribution, and reuse, provided that the author and preprint are cited in any reuse.


