
Submitted:
21 July 2025
Posted:
22 July 2025
You are already at the latest version
Abstract
The increase in demand for wood in recent times has led to the expansion of various treatments on it, in order to broaden the areas of use for the same wood species. In this sense, the torrefaction treatment of wood comes to complement the classic areas of use with new ones, through a reduced affinity for water and an increase in its durability, under conditions of unchanged or slightly reduced physical and mechanical properties. The paper aimed to evaluate the physical and mechanical properties of spruce and mountain maple wood that were torrefied at temperatures of 180ºC-200ºC for 1-3 hours, in comparison with the non-torrefied wood of these two wood species. The results obtained showed that torrefied wood has better properties in terms of water affinity and quite goof in terms of the analyzed mechanical properties, such as compressive strength, tensile strength parallel to the wood grain, static bending strength or Brinell hardness. The general conclusion of the paper shows that the two torrefied species have better properties than the non-torrefied ones, thus broadering their base of uses.
Keywords:
water absorption
; torrefaction
; spruce
; moisture content
; sycamore
1. Introduction
From the past to the present, wood of various species has been used for finished outdoor products and exterior design, with or without chemical, finishing or thermal treatments to improve the wood's resistance to external factors. It is known that under the influence of external factors especially moisture content wood has two major disadvantages, these being dimensional instability in moisture content and biodegradability (or natural durability). The wood finishes made to withstand outdoor conditions, besides being un ecological and polluting, are very laborious and of considerable thickness, and, in addition, they exfoliate or crack under the prolonged action of environmental factors. Therefore, ecological heat treatment processes have been sought, boiling wood it oils or heating in superheated steam at temperatures of 180ºC-220ºC. In this regard, to improve the dimensional stability and durability of wood, the wood torrefaction process is also used [1,2], with the use of hot air in a reduced oxygen environment.
Worldwide, wood species are classified in two large groups, namely softwood species (fir, spruce, pin, larch, Douglas fir) and hardwood (sycamore, ash, acacia, poplar, cherry), their main difference being the density of the wood, but not only that. That is why a series of authors [3,4] have comparatively analyzed in tandem one softwood species and one hardwood. The light color of spruce wood contributes to its use for applications where superior aesthetics are desired, the fine texture of spruce wood being an important asset for the manufacture of furniture (beds, tables, chairs, cabinets). In addition to the manufacture of furniture, the resonance spruce wood is suitable to produce musical instruments (e.g. soundboards for pianos, violins, guitars). The resonance spruce, through its sound transmission qualities, contributes to the modulation of the sounds produced by the musical instruments in which it is incorporated.
Figure 1 shows the stages of wood thermal treatment, starting of course from wood drying, usually at 70 ºC-90 ºC, but which can also reach temperatures of 105ºC. In this first stage, only the water in the wood evaporates, the chemical compounds don't degrade at all. The next stage is that of wood torrefaction, at usual temperatures of 190 ºC-240 ºC, the period in which the wood begins to thermally decompose. In this stage, the hemicelluloses in the wood are mainly degraded, obtaining some wood with a low affinity for moisture content and water in the external environment and a weaker bio-degradability. Also, this treatment is done only in the absence of oxygen or with a reduced supply of oxygen. During the torrefaction process, the properties of the wood are modified, due to the chemical reactions that take place in the structure of the wood at high temperatures, especially due to the degradation of the hemicelluloses in the wood. The degradation of hemicelluloses in wood leads in the first phase, up to temperatures of 195 ºC, to dimensional stability and a decrease in the avidity towards water and moisture, since hemicelluloses are the most moisture-loving component of wood.
In a second stage, above 200 ºC, the wood is sterilized and acquires properties to better resist the action of external factors such as insects and xylophagous fungi. It has also been demonstrated that the heat treatment temperature has a greater influence on the properties of wood than the torrefaction time [5,6]. The torrefaction process has been studied for a long time, especially in the European Union, which has led to the intensification of the industrial development of the process in the so-called torrefaction guns. The third and last period of heat treatment is that of pyrolysis of the wood, at temperatures of about 400 ºC and is also done with reduced oxygen supply. As a result of this heat treatment, charcoal is obtained as the main product after a long treatment (used in steelmaking to obtain high-quality steels) and/or a light combustible gas with a usual content of carbon monoxide and hydrogen (when the heat treatment is carried out over a short period of time). This light combustible gas can be transformed into a combustible liquid by refrigeration. Due to its fine texture and very light color, sycamore wood is used for the manufacture of furniture, musical instruments, but also for decorative applications. Sycamore is used in furniture for their bodies and tops, which due to its rigidity contribute to maintaining their stability. Due to its high density, sycamore wood is also used for floors, steps and furniture tops. Sycamore wood is very well processed, and due to its smooth processed surfaces, it creates a thin and pleasant film of paints and varnishes [7,8]. This results in high-quality finishes. Sycamore wood, due to its good machinability properties, is used to create decorative details in furniture (inlays and fine sculptures).
The main objective of the paper is to observe the effect of the thermal torrefaction process on the density, dimensional stability and strength properties of spruce and sycamore wood. The two wood species grown in Southeastern Europe were chosen, due to the significant differences between them, as they belong to different species groups, namely softwood and hardwood, but also to the similarities regarding their light color.
2. Materials and Methods
The main physical properties (moisture content, density, water absorption and swelling in the radial/tangential direction) and mechanical properties (static bending strength, compressive strength, tensile strength parallel to the fibers) of the two types of heat-treated/untreated wood species were determined. To cut the samples, several clean, knot-free boards were chosen, which were planed to a thickness of 20 mm and cut into samples with the dimensions specific to each test [9,10].
Density. Before determining the density, the samples were kept in a conditioning chamber at 65% air moisture content and 20 ºC air temperature, to obtain a moisture content of 12% of the samples, corresponding to their testing. The samples for density determination had dimensions of 100 x 20 x 20 mm. The density determination procedure consisted in determining the mass of each conditioned sample with a Kern type analytical balance (2020 year) and their dimensions with an electronic caliper, with an accuracy of one decimal place.
Considering the shape of the rectangular samples, the determination ratio was the followingː
Whereː m-mass of the sample, in g; l-length of the sample, in mm; b-width of the sample, in mm; g-thickness of the sample, in mm.
The heat treatment of wood torrefaction was carried out in a laboratory oven, at temperatures of 160, 180 and 200 ºC, for 1, 2 and 3 hours. To determine the degree of torrefaction, the mass loss of the samples was determined, using ratio of the following formː
Whereː mi-initial mass of the samples, in g; mf-final mass of the samples after torrefaction, in g.
10 valid samples were determined for this test, for each wood species, temperature and duration of the heat treatment.
The tensile strength parallel to the fibers was determined on sample with dimensions of 300 x 20 x 20 mm, having a milling in the central area, as in Figure 2, to break exclusively in the thinned central area.
Before performing the tensile test parallel to the fibers, the widths of the samples were measured in the median area. The tensile strength parallel to the wood fibers was determined as the ratio between the breaking force and the breaking area, respectivelyː
Whereː Fmax-maximum breaking force, in N; b1-width of the sample in the narrowed area, in mm; b – width of the sample, in mm.
The water absorption of the wood of the two wood species was carried out on dry samples, with dimensions of 100 x 20 x 20 mm, the mass of the samples being determined using an electronic scale with a precision of one decimal.
The duration of the test was for samples immersed in 2 and 24 hours, to observe the dynamics of water absorption. Thr mass of the samples before and after immersion in water was determined. Considering the duration of immersion in water, the ratios for determining the water absorption after immersion were as followsː
Where ːA2h- absorption for 2 hours; mf2h- mass of the samples immersion for 2 hours; mi2h-mass of the samples before immersion for 2 hours; A24h- absorption for 24 hours; mf2h- mass of the samples immersion for 24 hours; mf24h-mass of the samples before immersion for 24 hours;
The swelling in thickness of the samples of two wood species, for the radial and tangential direction and the immersion duration of 2 and 24 hours was done on the same type of samples as the water absorption, by means of the following calculation ratiosː
10 samples of each type of sample were used, including the torrefied and non-torrefied.
Determination of the compressive strength was carried out on conditioned specimens., with ddimensions of 100 x 20 x 20 mm. Comprssion parallel to the fibers was chosen, because this determination is sampler and has an easily quantifiable value and is comparable to other wood species[2]. Considering that this resistance represents a ratio between the force and the breaking area of the specimens, the calculation ratio had the following formː
Whereː ϭc – compressive strength; Fr – force; b1- width [mm]; b2-thickness [mm].
The determination of the Brinell hardness was carried out on the same specimens used t determine the wood density, specifying the radial/tangential surface and the type of specimen (torrefied/non-torrefied) on which the determination was made[1]. Two determinations were carried out on each surface, and the number of cpecimens used was 10 pieces. The calculation ratio that was taken into consideration was dependent on the diameter of the mark left by the punch with a ball diameter of 10 mm on the wooden surface, and considered that the lateral surface of the mark left on the wooden specimen is that of a spherical cap, respectivelyː
Whereː P-pressing force of the punch, in N (taking into account the densities of the two wood species, a force of 500 N was used); D-diameter of the ball at the tip of the punch, in mm ( equal to 10 mm); D- diameter of the ball at the tip of the punch, in mm (equal to 10 mm); d-diameter of the mark left by the ball on the specimen, in mm (to highlight this, a copy paper was used).
Determination of static bending resistance. Static bending resistance was performed on Parallelipiped specimens, with a square section with a side of 20 mm. It was also considered that the distance between the supports was 240 mm. The bending method with a single punch was used to apply the force in the radial direction of the wooden specimen. The calculation ratio considered the distance between the supports and the dimensions of the specimen, namelyː
Whereː Fmax – maximum breaking force of the specimen, in N; l-distance betweeen supports, in mm; b-width of the specimen, in mm; g-thickness of the specimen, in mm.
Statistical analysis of the results. To evaluate the research results, statistical parameters such as the arithmetic mean (survey median) and the standard deviation for an error of 0.05 in the first stage were determined [11]. The standard deviation of the calues was also visible on the graphs made. After that, the coefficient of determination R2 could be determined, for analyzing the distribution of the values and finding the best approximation ratio of the trend of the values.
3. Results
The results obtained were centralized in tables, after which they were posted in the form of graphs, for visibility and a paper comparison between different species and treatments.
3.1. Wood density results
The density of the two analyzed wood species was different (Figure 3), since spruce is a softwood species and maple is a hardwood species, with different properties. Even though both species are part of the light species category, maple had a density 57.3% higher than spruce, thereby having expectations regarding its higher resistance.
3.2. Wood absorption results
Water absorption varied depending on the existence or absence of heat treatment, the wood species, and the torrefaction temperature. In Figure 4, the variation in water absorption in the case of spruce wood is observed.
From Figure 4, the decreasing trend in water absorption is observed, with increasing torrefaction degree. In this figure, the other torrefaction parameter, namely the duration of the heat treatment, wasn't introduced, because its influence was insignificant. It is observed that the decrease is constant for both immersion durations, respectively 5%-6%/20 ºC. The existence of R2 determination coefficients greater than 0.9 denotes that the linear variation that approximated the decreasing trend of the values is a correctly chosen one. It is also observed that the difference between the absorption at 2 hours and that at 24 hours is somewhere in half, which means that in the first stage of water absorption at 2 hours half of the phenomenon occurs, and the other half of the phenomenon occurs in the following 22 hours.
Figure 4.
Spruce absorption.
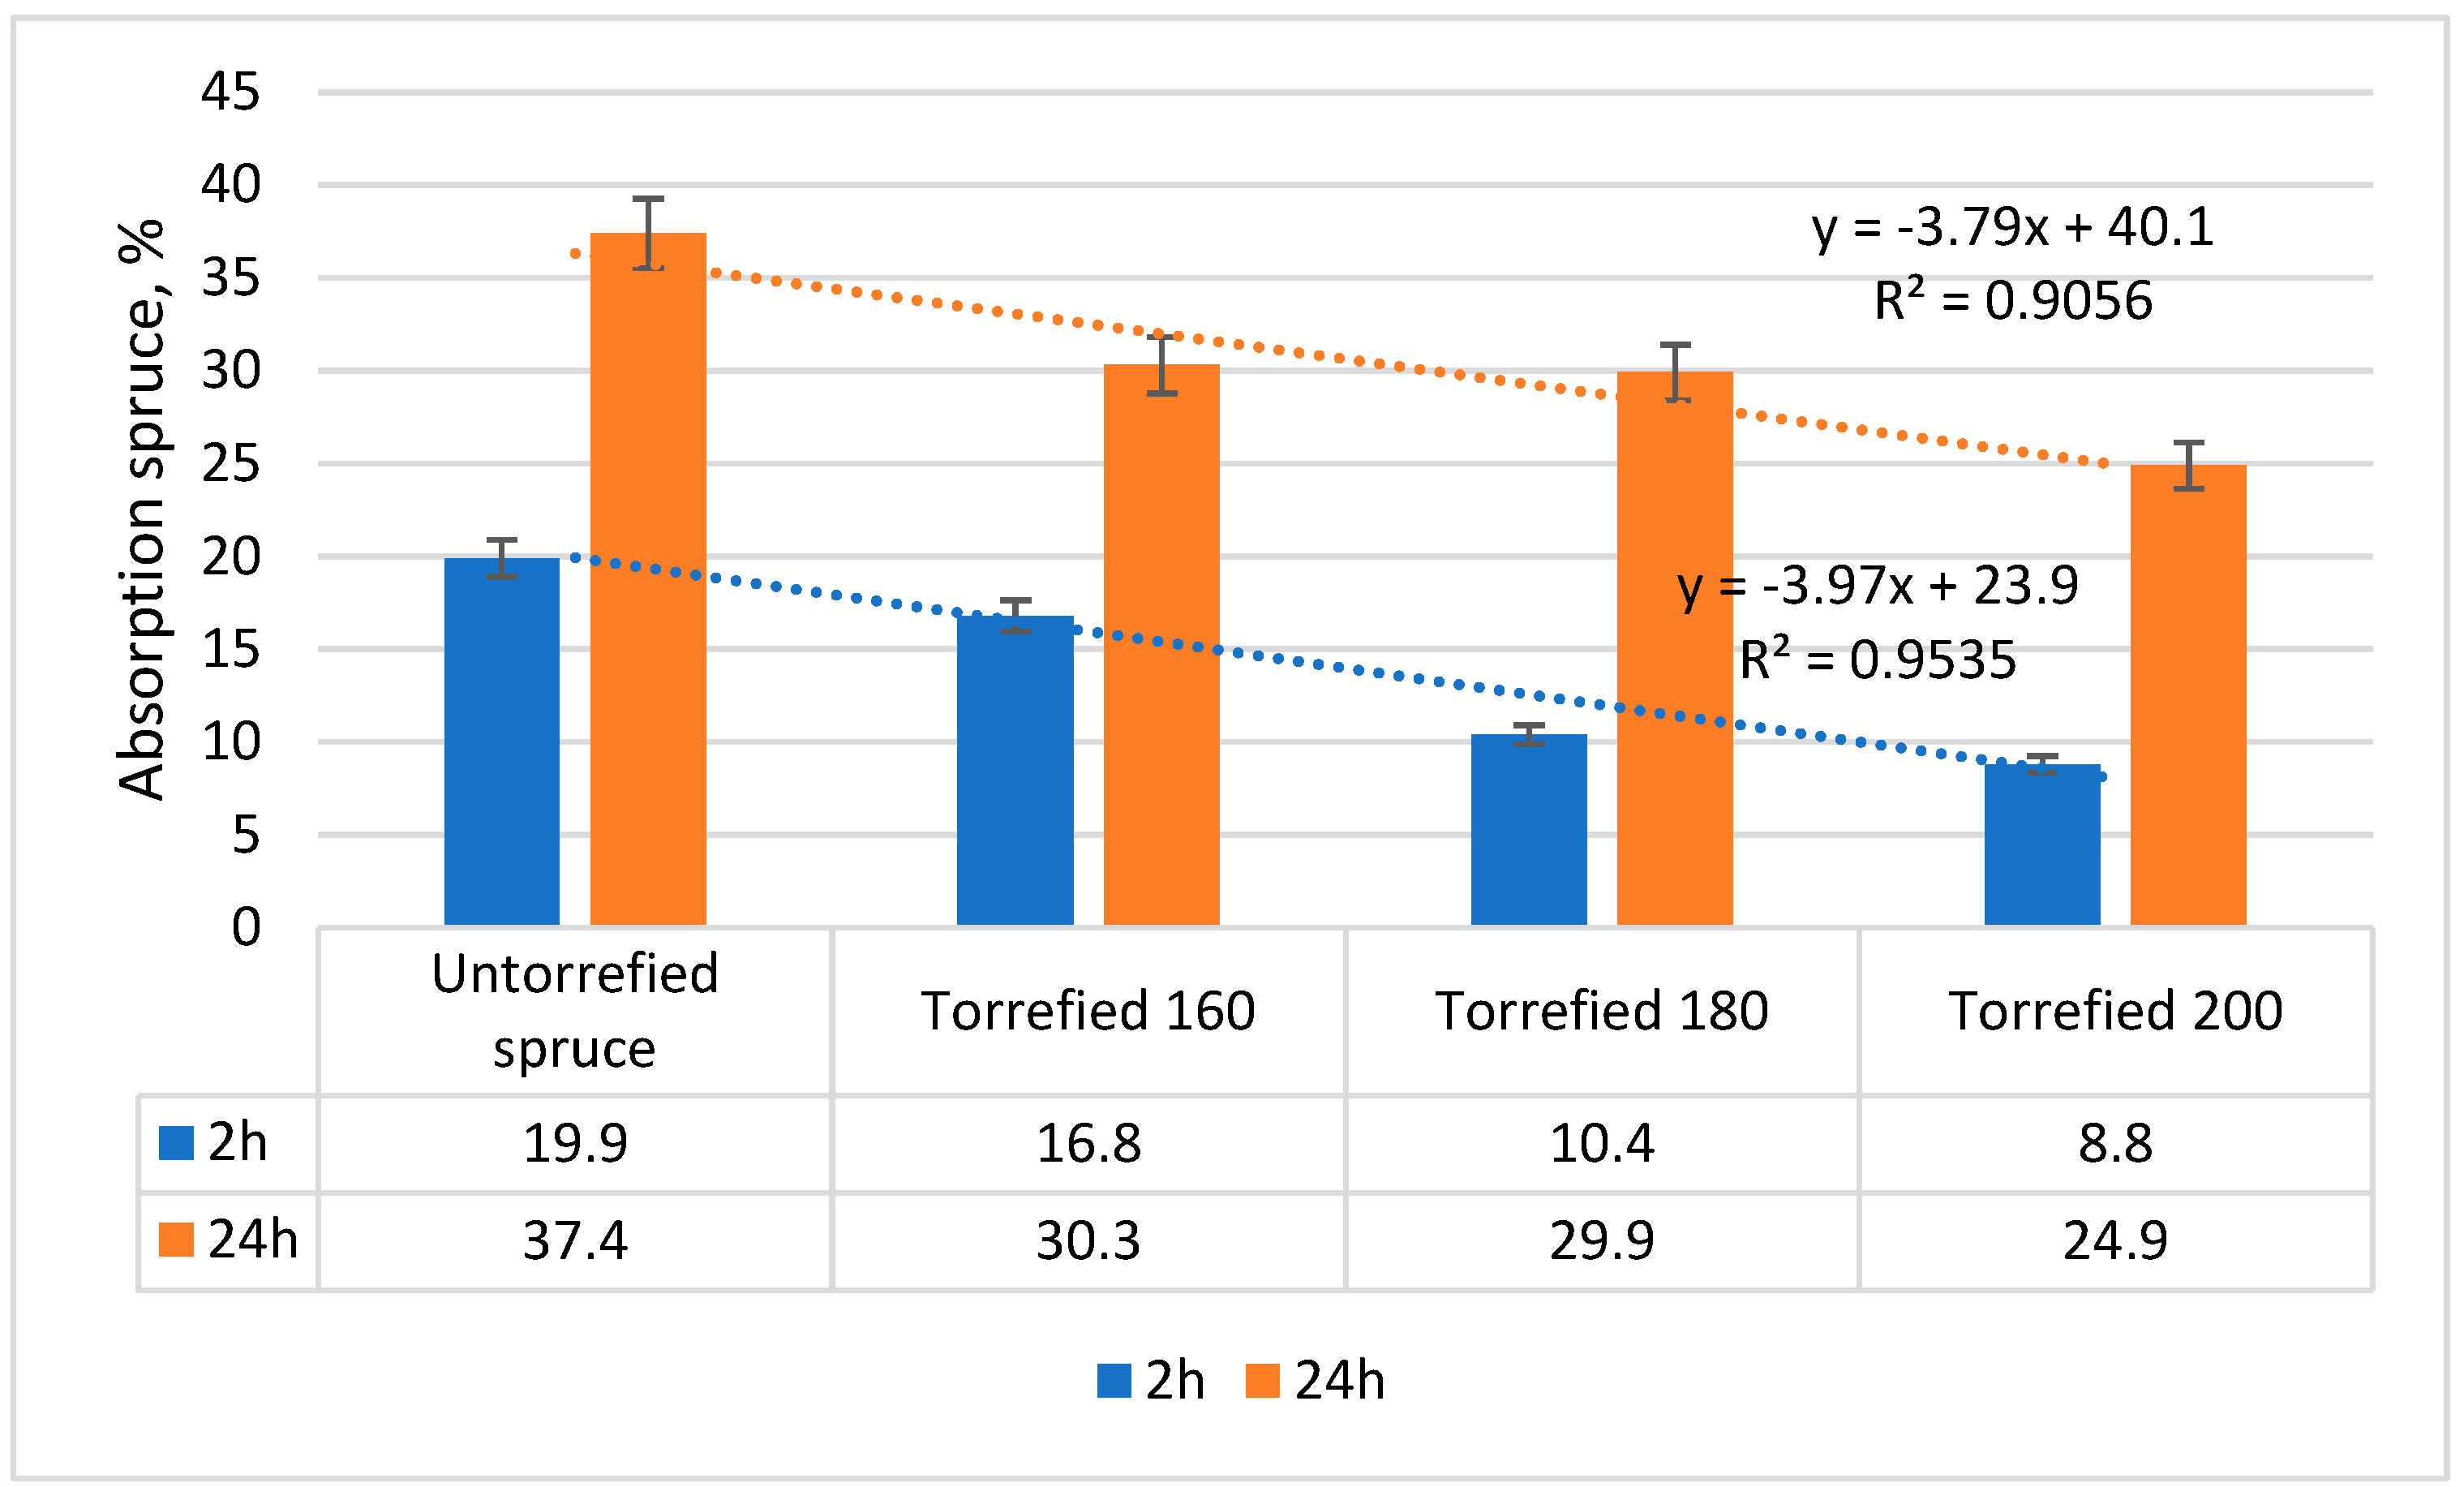
Figure 5.
Absorption of maple wood after total immersion in water.
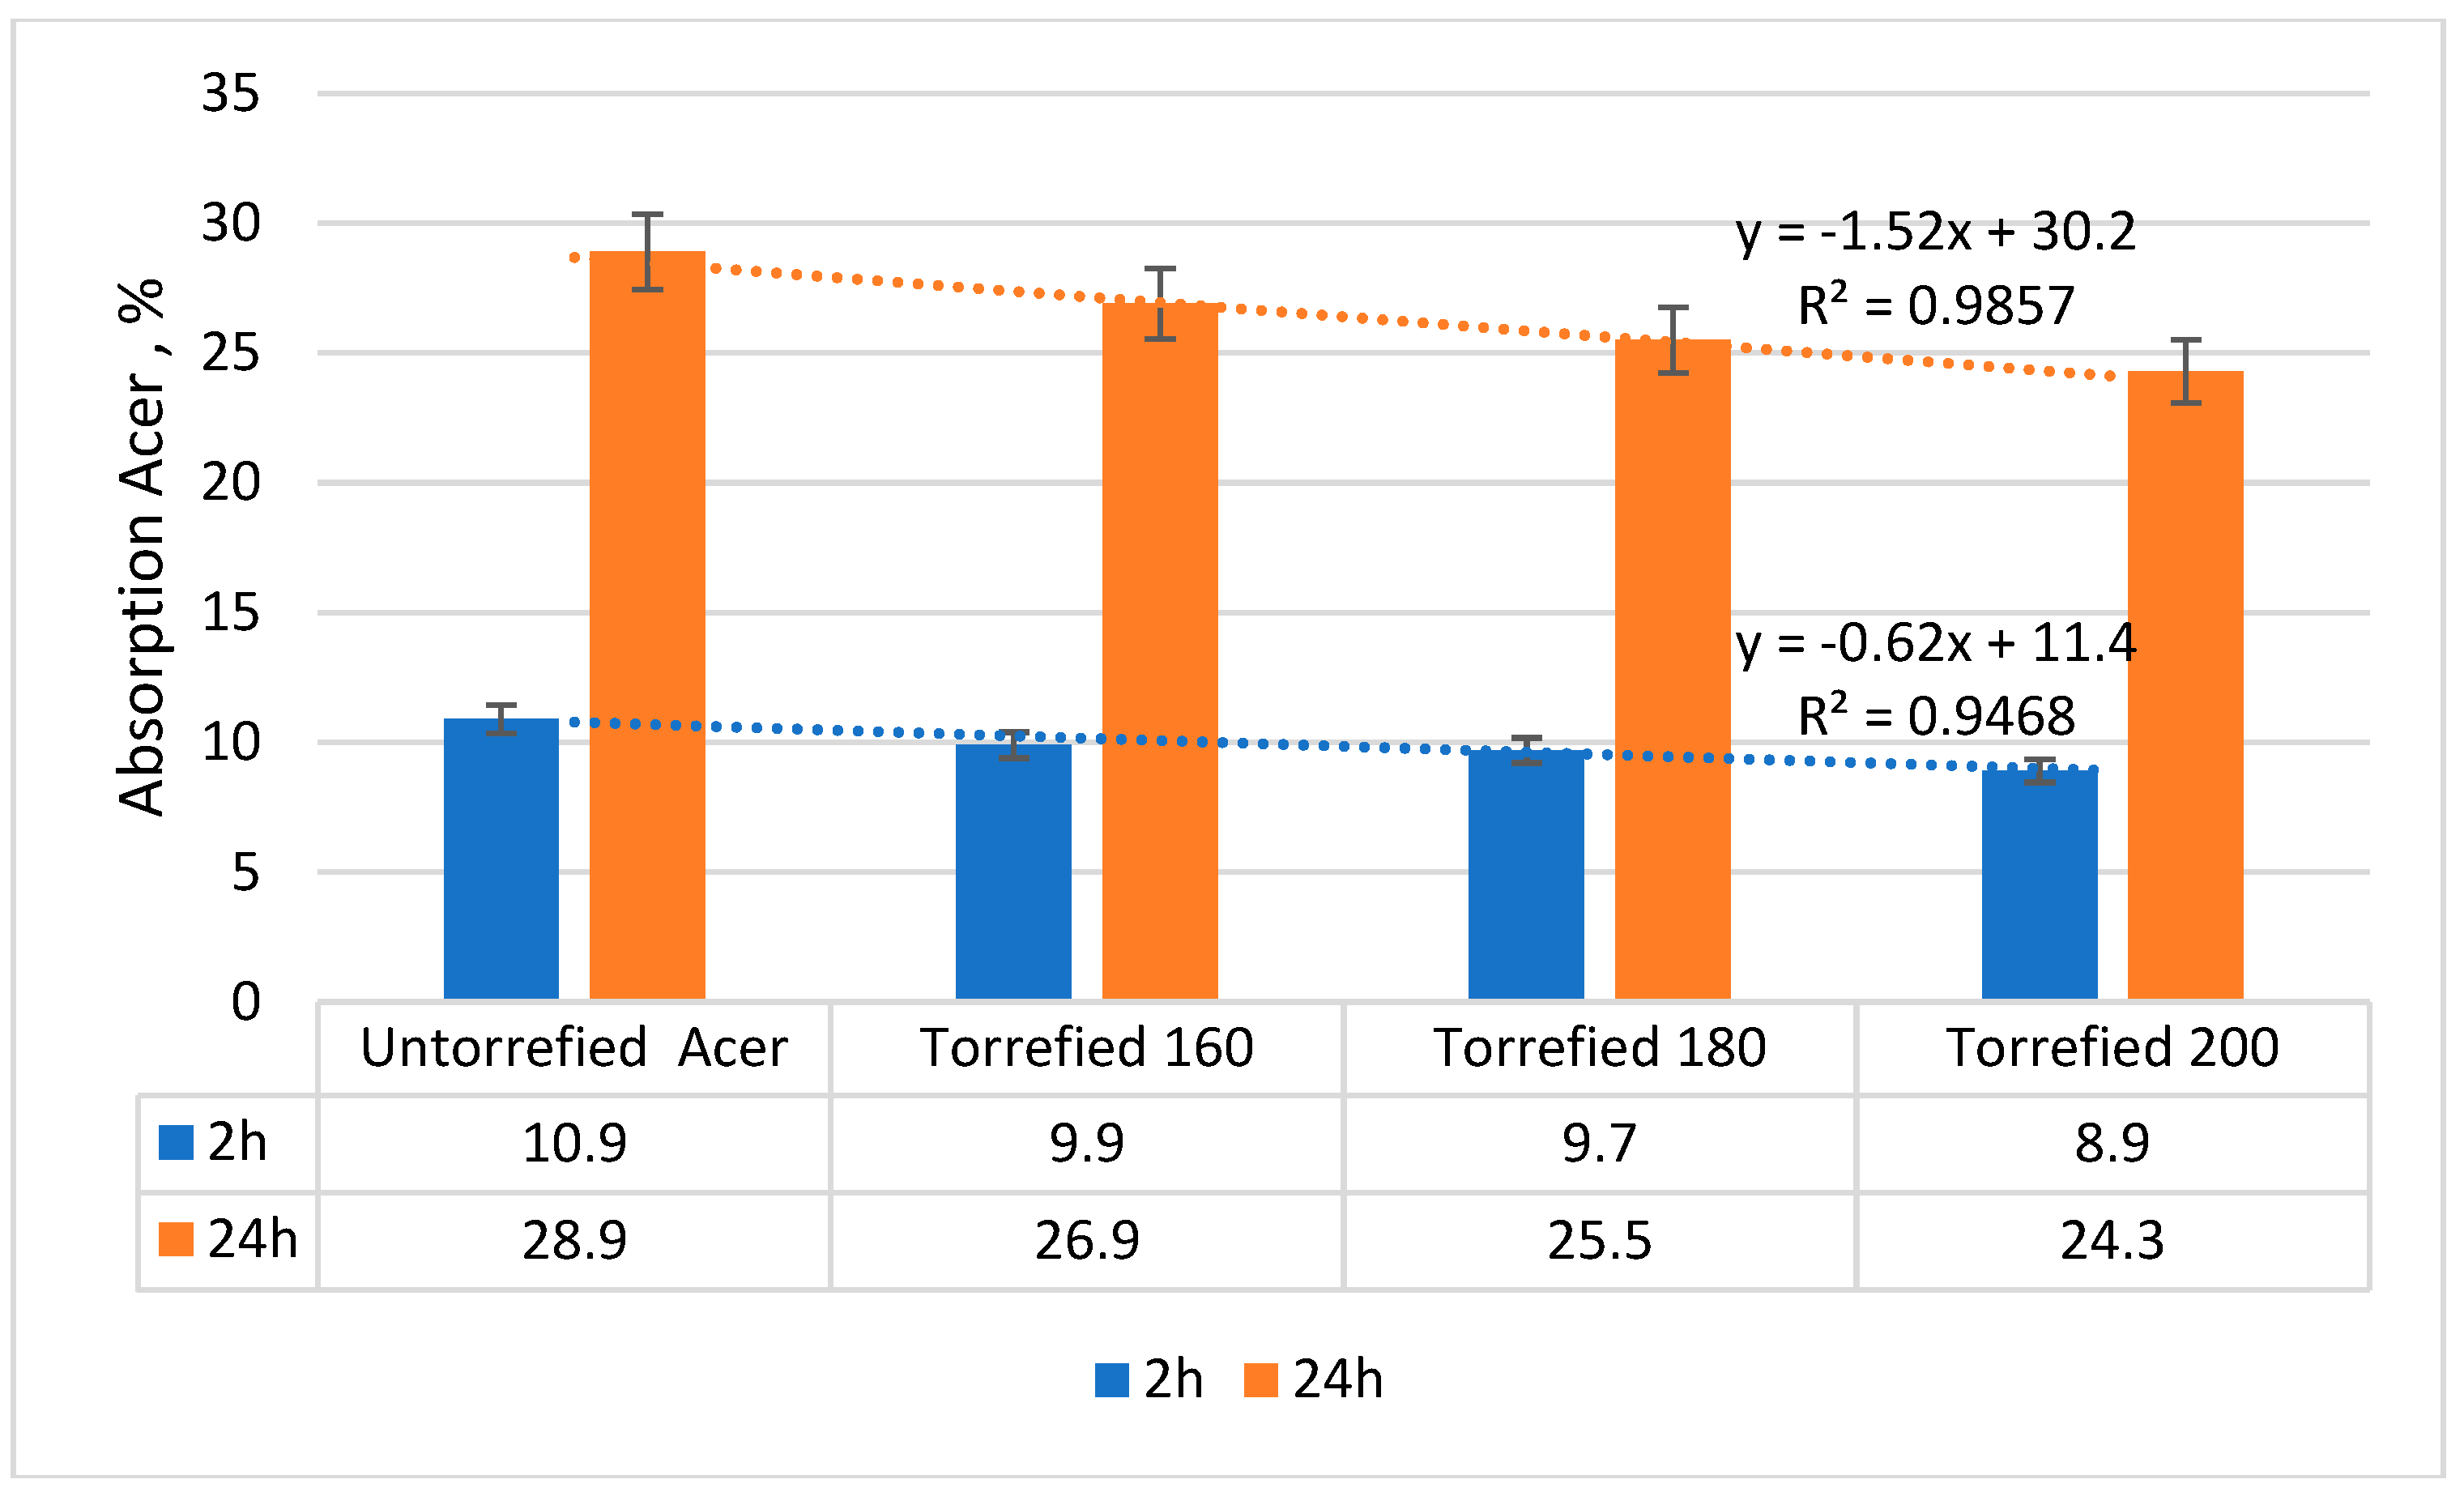
Water absorption in the case of maple kept the same trends of improvement of this property with the increase in the degree of torrefaction , but with different values. Thus, the difference between the absorption at 2 hours compared to that at 24 hours increased, the one at 2 hours representing about 30%-40% of that at 24 hours, meaning that in the case of maple, the absorption is slightly uniformed in the 24 hours. This difference is due to the increased density and the more compact structure of maple compared to spruce. It is observed that the values of the coefficient of determination R2 are higher, which means better homogeneity of the maple. In the context of the same idea above, it is observed that the differences in absorption between different degrees of torrefation are samller, overall having average values of 0.6%/20 ºC.
3.3. Wood selling results
Wood swelling considered another important parameter of water affinity, namely the Tangential or radial direction of the wood with respect to the wood fibers.
Figure 6.
Radial/tangential swelling of acer wood after 2 h/24 h immersion in water.
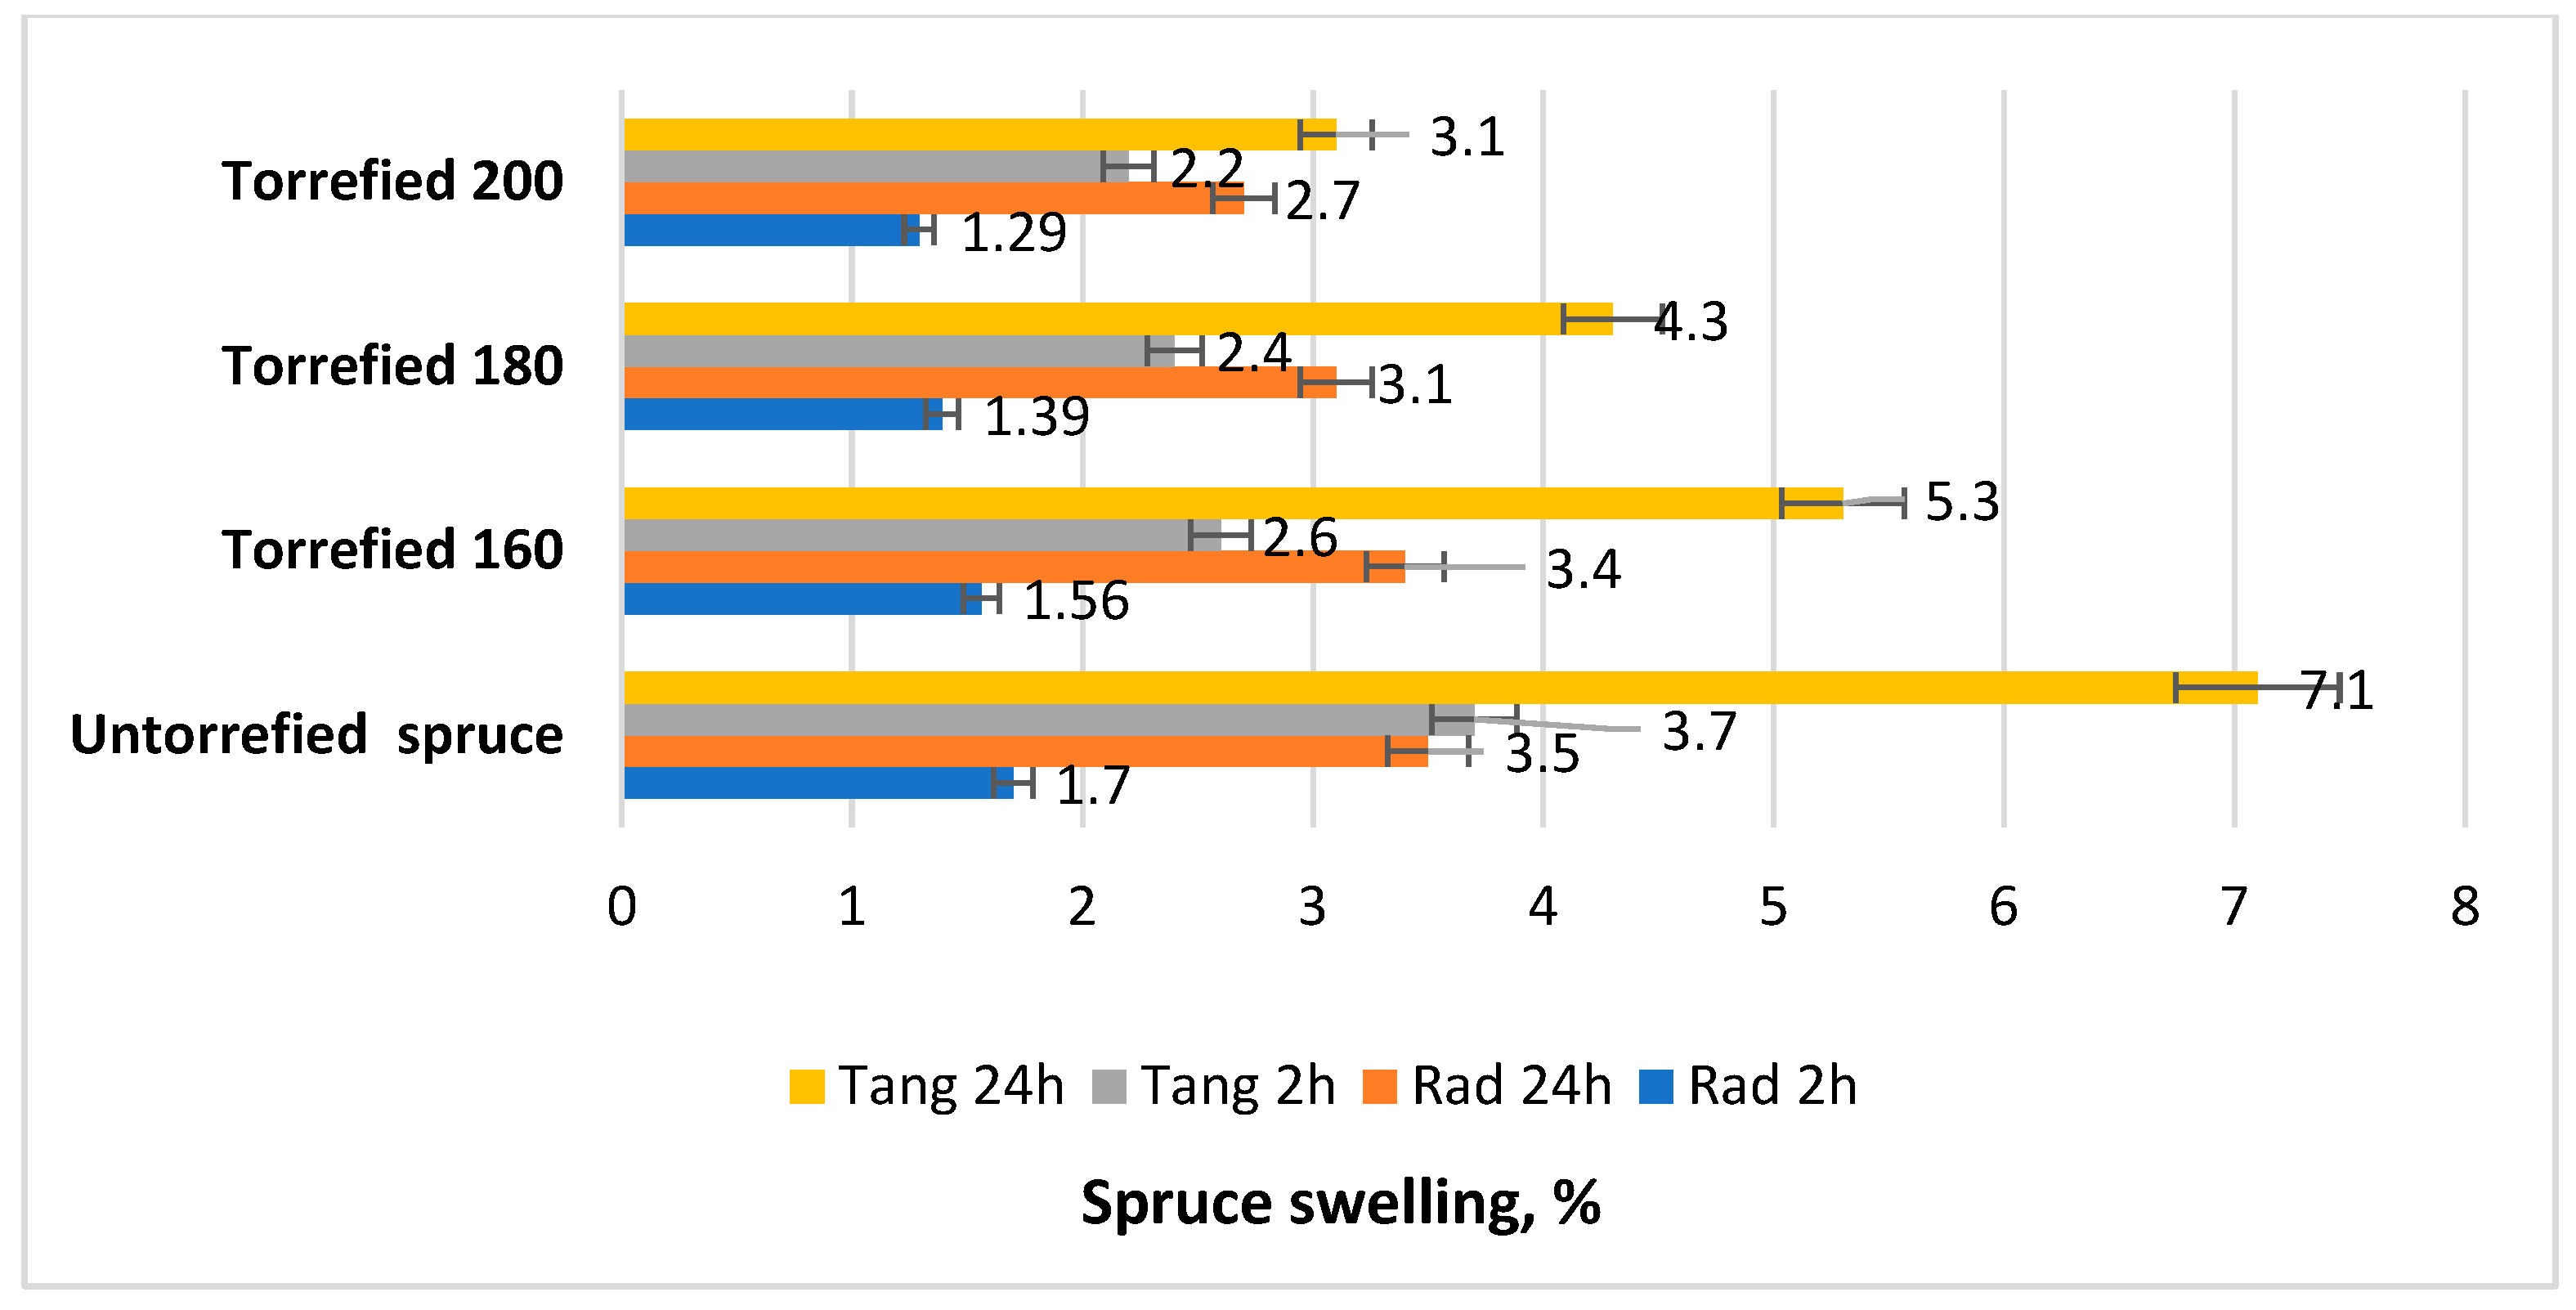
In general , the swelling in the tangential direction had a much higher value than the swelling in the radial direction, which corresponds to the general trend of all wood species. Thus, for spruce wood torrefied at 200 ºC, the swelling in the tangential direction was 70.5% higher than in the radial direction for 2 hours of immersion and 14.8% for a 24-hour immersion, for torrefaction at 180 ºC the swelling in the tangential direction was 72.6% higher than in the radial direction for 2 hours of immersion and 38.7% for a 24-hour immersion, for wood torrefied at 160 ºC the swelling in the tangential direction was 66.6% higher than in the radial direction for 2 hours of immersion and 103.8% for a 24-hour immersion, and for the non-torrefied reference wood all values were higher, respectively the swelling in the tangential direction for 2 hours immersion and 102.8% for a 24-hour immersion.
From the point of view of the torrefaction temperature, the thickness swelling values were lower for torrefied wood than for the torrefied one. Thus, radial spruce wood torrefied at 160 ºC had a linear swelling at 2 hours 11.7% lower than the non-torrefied one, and at 24 hours 2.8 % lower than the non-torrefied wood, radial spruce wood torrefied at 180 ºC had a linear swelling at 2 hour 18.2% lower than the non-torrefied one, and at 24 hours 11.4% lower than the non-torrefied wood, and radial spruce wood torrefied at 200 ºC had a linear swelling at 2 hours 24.1% lower than the non-torrefied one, and at 24 hours 22.8% lower than the non-torrefied wood.
If the analysis of the swelling in thickness of spruce wood is made depending on the duration of immersion in water, then a slight increase in swelling is observed for 24 hours of immersion compared to 2 hours of immersion. It was found that there is no proportionality of swelling with the duration of immersion, respectively in the first 2 hours about half of the total linear swelling in 24 hours was oriented.
It was observed (Figure 7) that the swelling of maple wood follows the same general rules as that of spruce, but the values were slightly different. In general, the sweling in the tangential direction had a much higher value than that in the radial direction, sometimes enen double. Thus, as examples, for maple wood torrefied at 200 ºC, the swelling in the tangential direction was 218.8% higher than the radial direction for 2 hours of immersion and 635.8% for a 24-hours immersion.
From the point of view of the torrefaction temperature, the values of the swelling in thickness were lower for the torrefied wood than for the torrefied one. Thus, the radially torrefied maple wood at 200 ºC had a linear swelling at 2 hours 62.1% lower than the non-torrefied wood.
3.4. Compression parallel to the fibers
The rupture that occured in the compression test was in most cases by sliding of the wood layers, due to shear stresses. Few cases of breakage were when the specimens were crushed at the ends, but there were also torrefied specimens that broke in two in the median longitudinal area. In Figure 8, the main fracture patterns in compression parallel to the fibers are observed.
Unlike the case of other properties of torrefied wood, the values of the compressive strength parallel to the fibers were slightly increased for torrefied wod compared to non torrefied wood, the curves of approximation of the trend of the values being polynomials of 2nd degree with a Pearson coefficient of over 0.87% (Figure 9).
The decrease in compression strength parallel to the fibers of torrefied wood had slightly higher values at the first two temperatures of 160 and 180 ºC and lower at 200 ºC, as follows:
- -
- For the torrefaction temperature of 160 ºC, the compressive strength decreased by 16.2% for spruce wood and by 0.7% for maple wood;
- -
- For the torrefaction temperature of 180 ºC, the compresive strength decreased by 41.5% for spruce wood and by 5.2% for maple wood;
- -
- For the torrefaction temperature of 200 ºC, the compressive strength decreased by 32.8 % for spruce wood and by 19.9% for maple wood.
3.5. Parallel to the fibers
In this determination, all the breaks were made in the median and thinned area of the specimens (4.5 mm size), as seen in Figure 10.
It was found that the side on which the milling was done in the specimen (radial or tangentail) didn't influence the tensile strength parallel to the fibers (Figure 11).
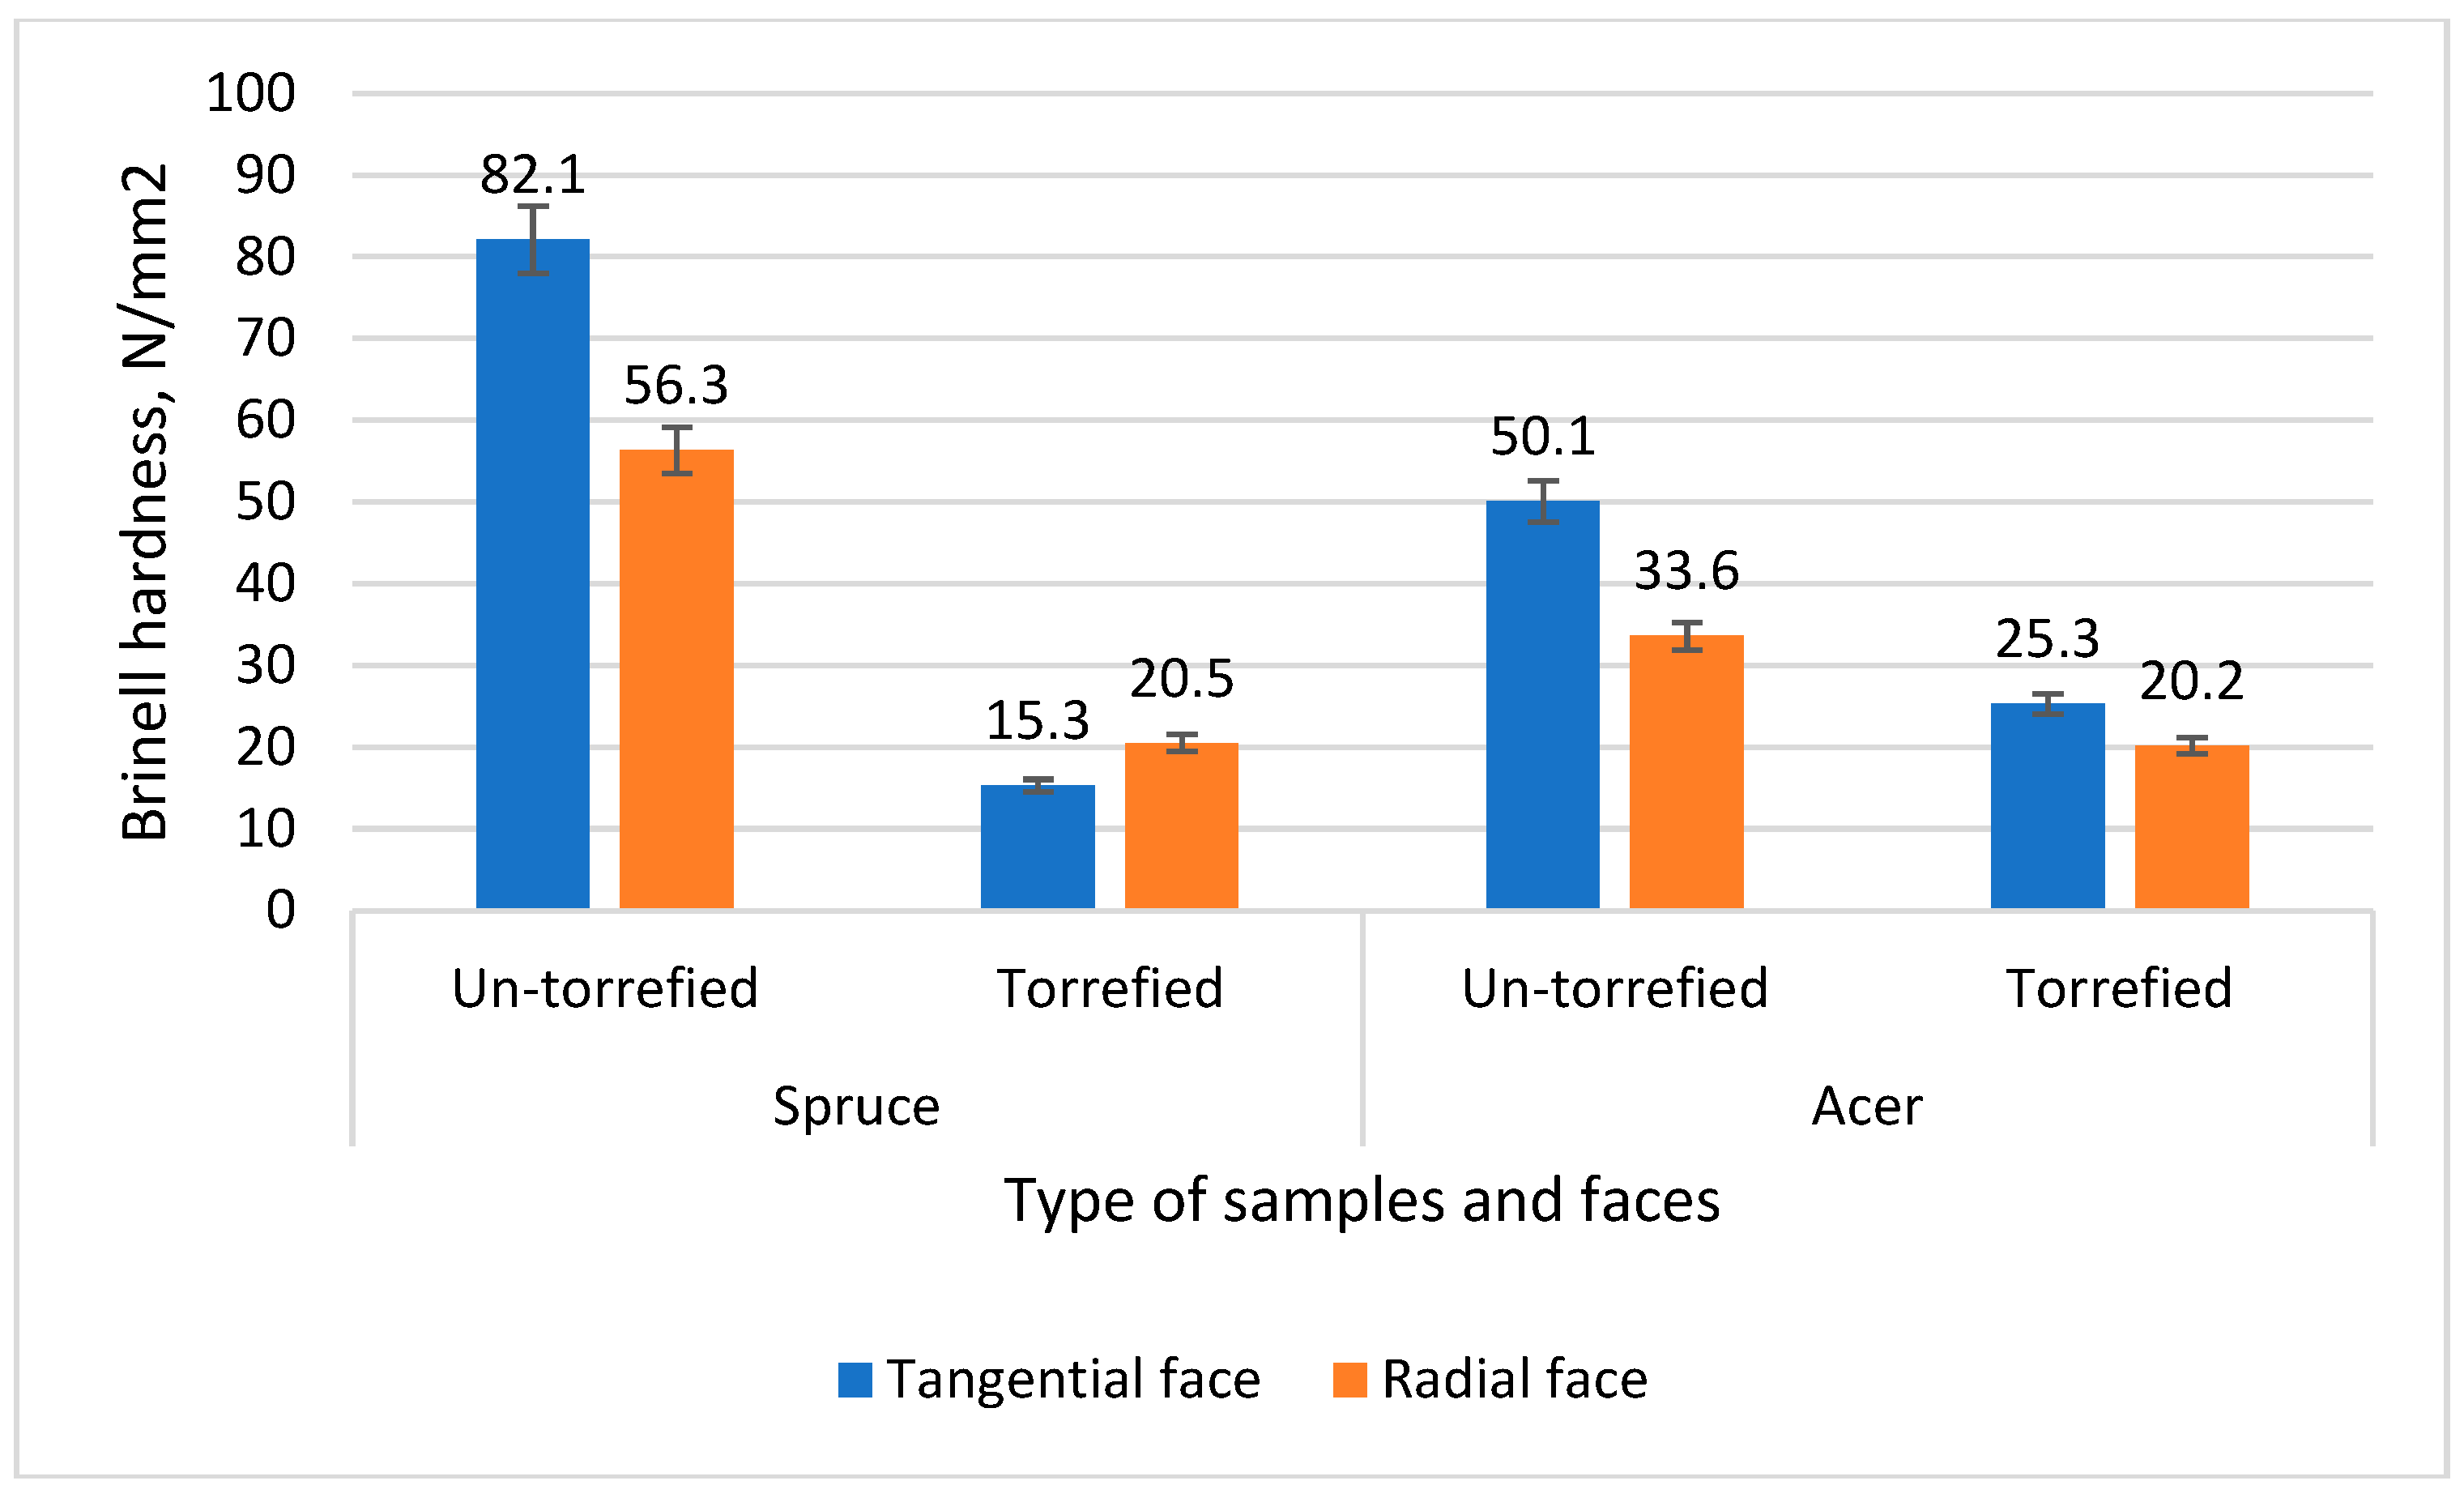
3.6. Brinell hardness
Brinell hardness was the property most influenced by the torrefaction treatment of the wood, with differences of over 100 % in the case of spruce wood and over 50% in the case of maple wood (Figure 12), These large differences show that the thermal torrefaction treatment of the wood had a great influence on the outer surface of the wood, by slightly degrading it.
Wood degradation by torrefaction created the largest differences in Brinell hardness for spruce wood, respectively a decrease on the tangential side by 81.3% and by 63.8% on the radial side, and for sycamore wood the decrease was more moderate, respectively by 49.5% on the tangential side and by 39.8% on the radial side
3.7. Static bending strength
Static bending strength followed the general trend of decreasing value during torrefaction, obtaining in the case of spruce a decrease of 7.5% for torrefaction at 160 ºC, a decrese of 15.7% for torrefaction at 180 ºC and 19.1% for torrefaction at 200 ºC.
Figure 13.
Static bending strength of torrefied and non-torrefied wood.
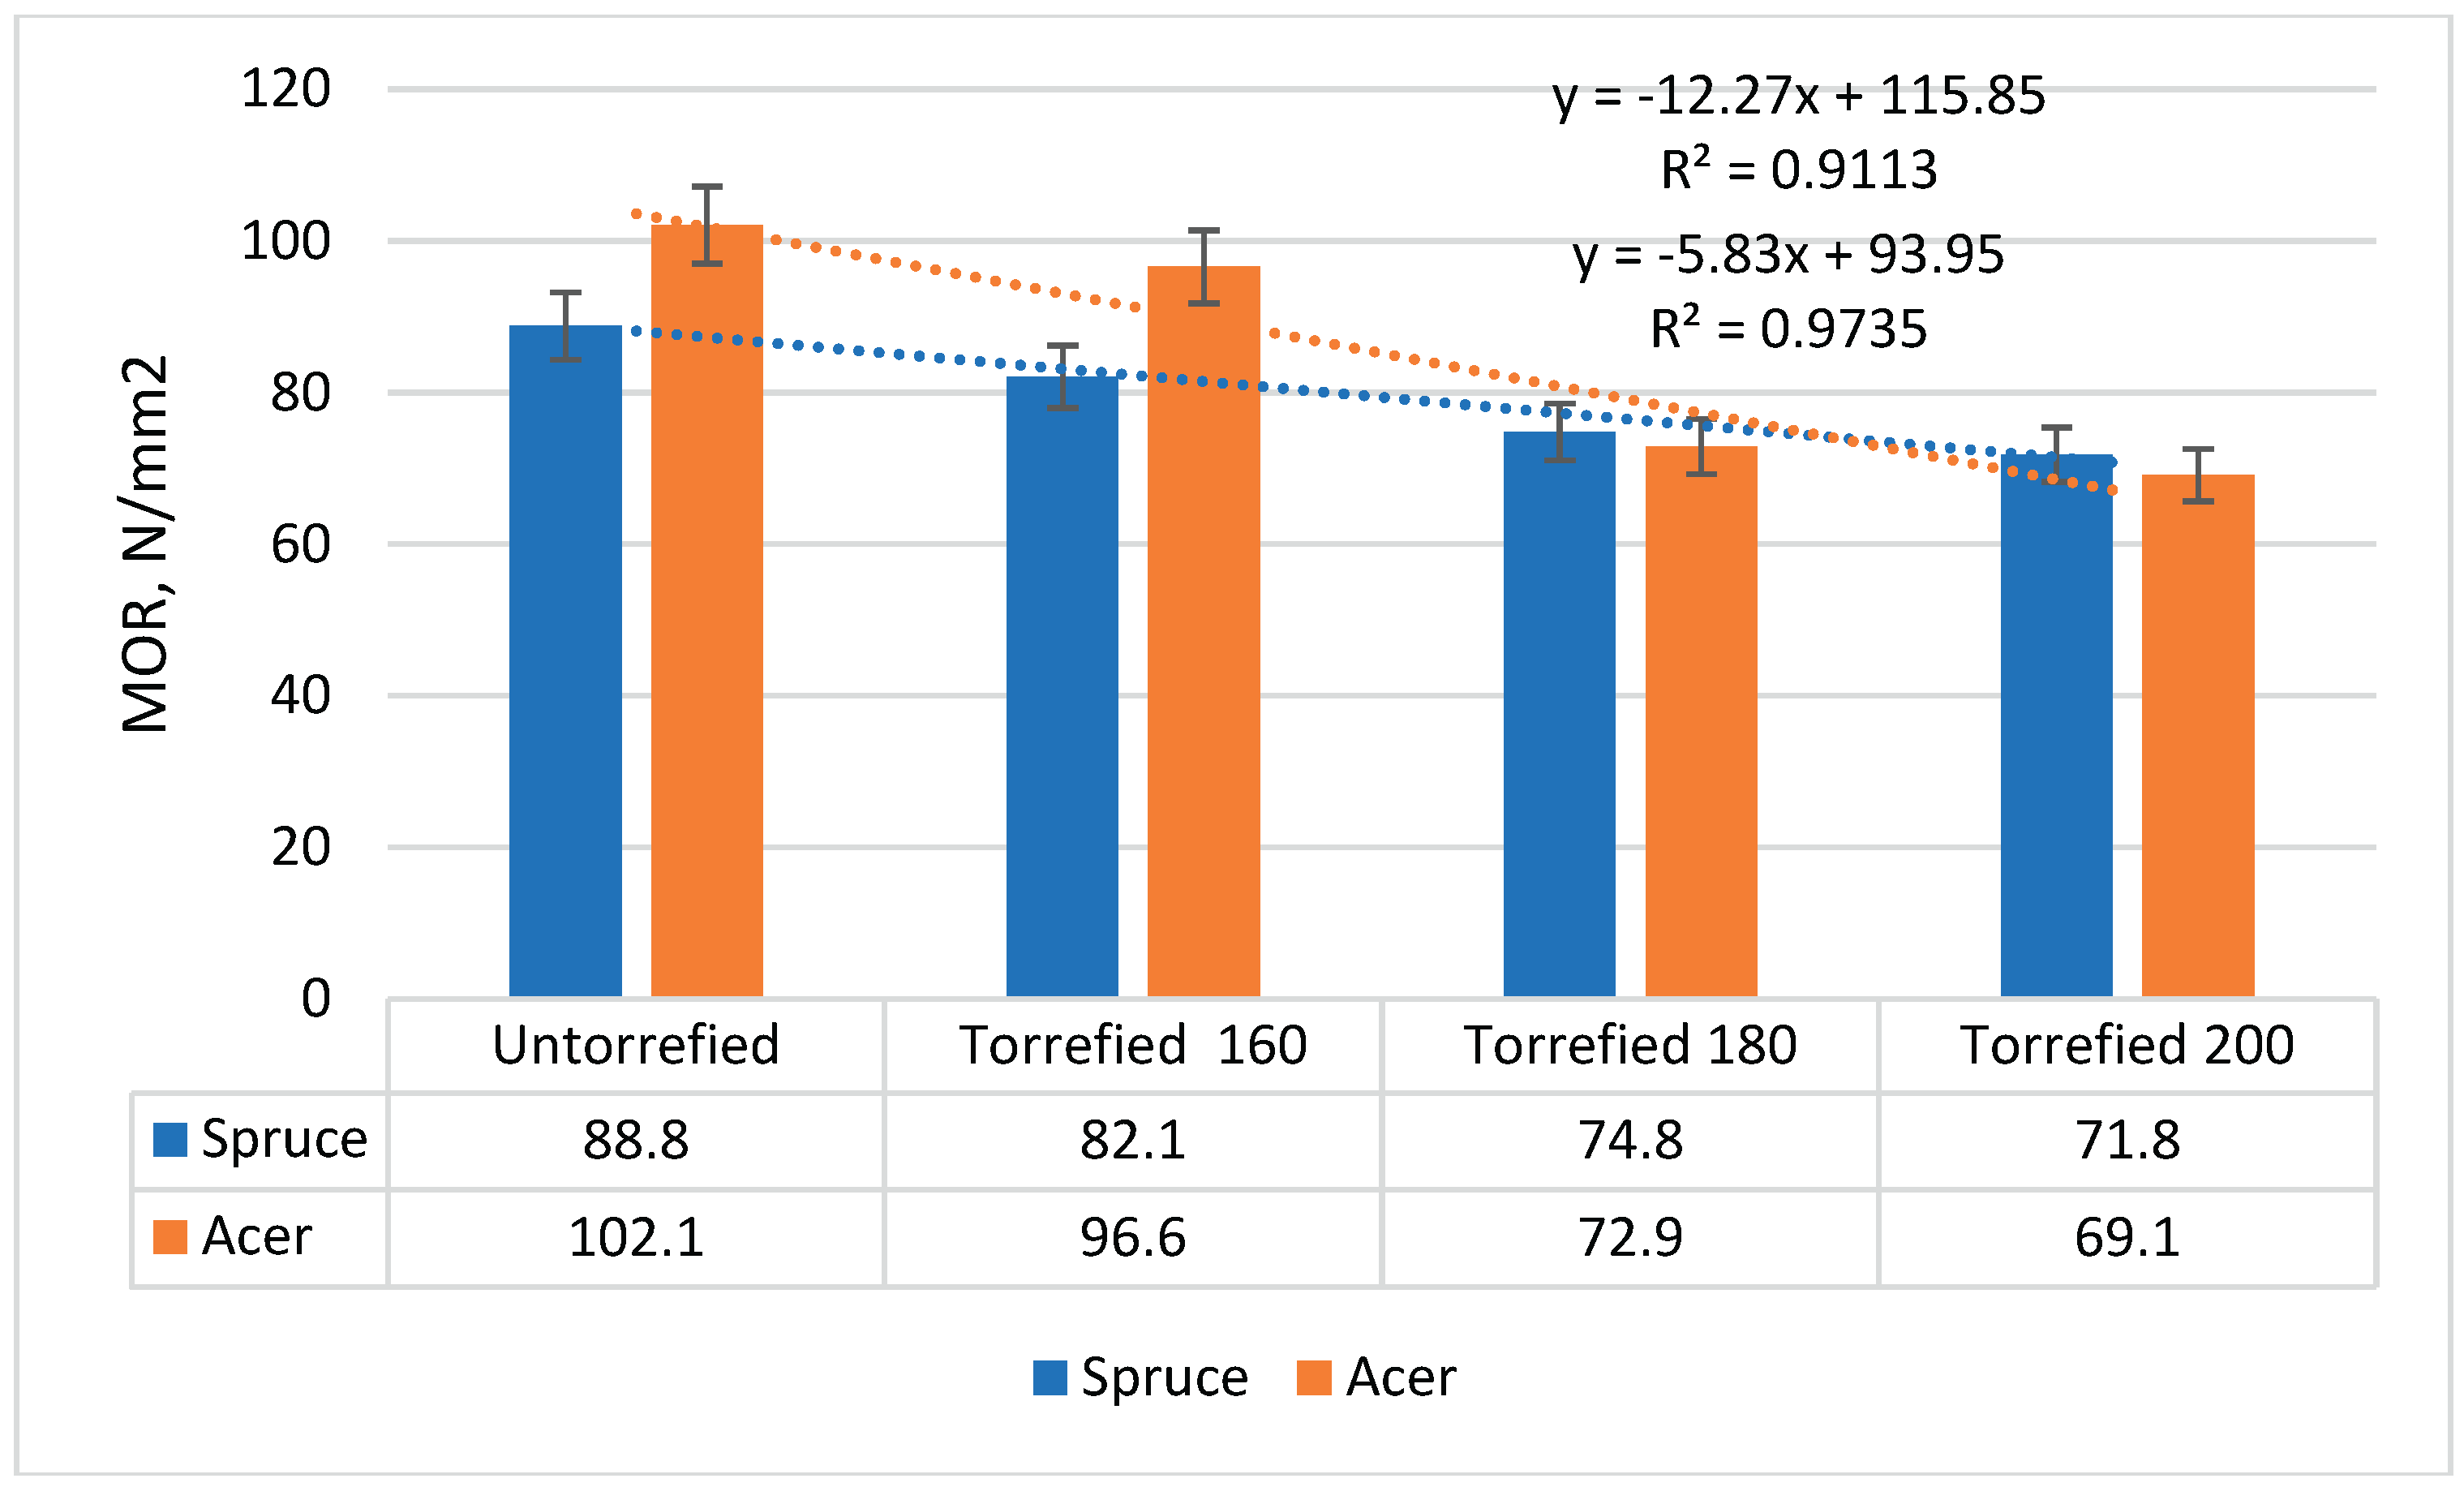
In the case of sycamore wood, the decrease in strength was more spectacular, and the increase in the coefficent of determination R2 to over 0.97 showed that torrefied sycamore wood is more uniform and weaker. Thus, we had a decrease of 5.3% when torrefaction was done at 160 ºC, of 28.9% when torrefaction was done at 180 ºC and of 32.3% when torrefaction took place at 200 ºC.
4. Discussion
Temperature has a greater influence on many properties of wood and composite materials their roasting time.
The light color of spruce wood contributes to its use for applications when high quality aesthetics are desired.
The moisture content of spruce and sycamore species were 7.0 ± 0.2% and 5.8 ± 0.2%, respectively, because of thermal modification at 135 °C and 185 °C temperatures. After modifying at 160 °C, the moisture content of the spruce and sycamore specimens were different [12,13]. Moisture content of the spruce wood was 6.4 ± 0.2%, and moisture content of sycamore reached was 5.8 ± 0.2%.
The results showed that the mass loss of both wood species increased with temperature, which agrees with earlier results for spruce [14] and sycamore [15]. The mass loss values were similar to the results found in other studies of thermally modified softwoods and hardwoods [16,17]. The extent depends upon temperature and treatment time [18-20].
Thermal modification at lower temperatures led to a lower mass reduction associated mainly with the loss of volatiles and bound water. Higher mass loss was observed when the samples were treated at temperatures above 150 °C, which is the effect of the partial decomposition of hemicellulose and cellulose, but also other changes in the chemical structure of the thermally modified wood [4,6]. The intensity of thermic degradation (mass loss) sycamore was higher than spruce wood. It can be explained through the differences in chemical composition of hardwoods and softwoods because hardwoods contain slightly more hemicelluloses (25%) compared to softwoods (20%), which are the least resistant to thermal degradation [21,22].
5. Conclusions
With the increase in the degree of torrefaction, but especially the torrefaction temperature, the water affinity characteristics (water absorption and swelling in thickness after 2 and 24 hours) of the two wood species improved significantly.
All the strengths of the torrefied wood decreased slightly, with values of maximum 32.3% in static bending, maximum 41.5% in compassion and 19% in traction parallel to the fibers.
The greatest decrease in the properties of torrefied wood was in the case of Brinell hardness for spruce wood (81.3% on the tangential side and 63.8% on the radial side) compared to that of maple wood (49.5% on the tangential side and 39.8% on the radial side).
The failure of the specimens in compression parallel to the fibers was predominantly caused by sliding of the layers by shear in the case of non-torrefied wood and by longitudinal detachment on the layers in the case of torrefied wood.
Author Contributions
Conceptualization, C.S..; methodology, C.S.; software, A.L.; validation, C.S., A.L; formal analysis, C.I.; investigation, A.L.; resources, C.S.; data curation, C.S..; writing—original draft preparation, C.S..; writing—review and editing, C.S.; visualization, A.L.; supervision, C.S.; project administration, C.S.; funding acquisition, C.S.. All authors have read and agreed to the published version of the manuscript.
Institutional Review Board Statement
Not applicable.
Informed Consent Statement
Not applicable.
Data Availability Statement
Not applicable.
References
- Havreljuk, F. Achim, A. , Pothier, D. Regional variation in the proportion of red heartwodd in sugar maple and yellow birch, Can J.For.Res, 2013, 43, 278–287. [Google Scholar] [CrossRef]
- Kamdem, D.P. , Pizzi, A. , Jermannaud, A. Durability of heat-treated wood, Holz Roh Werkst, 2022, 60, 1–6. [Google Scholar] [CrossRef]
- Bekhta, P. , Niemz, P. Effect of high temperature on the change in color, dimensional stability and mechanical properties of spruce wood, Holzforschung, 2003, 57, 539–546. [Google Scholar] [CrossRef]
- Chen, Y. , Gao, J. , Fan, Y., Tshabalata, M.A., Stark, N.M. Heat-induced chemical and color changes of extractiv-free black locust (Robinia pseudoacacia) wood, BioResources, 2012, 7, 2236–2248. [Google Scholar] [CrossRef]
- Sahin Kol, H. Charactristics of heat-treated Turkish pine and fir wood after ThermoWood processing, J. Envirom. Biol., 2010, 31, 1007–1011. [Google Scholar]
- Vybohová, E. , Geffertová, J. , Geffert, A. Impact of steaming on the chemical composition of maple wood, BioResources, 2018, 13, 5862–5874. [Google Scholar]
- EN 408ː2010+A1ː2012. Timber structures-Structural timber and glued laminated timber-Determination of some physical and mechanical properties.
- Akyildz, M.H. , Ates, S. Effect of heat treatment on equilibrium moisture content of some wood species in Turkey, Research Journal of Agriculture and Biological Sciences, 2008, 4, 660–665. [Google Scholar]
- Bhuiyan, T.R. , Hirai, N.,Sobue, N. Changes of cristalinity in wood cellulose by heat treatment under dried and most conditions, J.Wood Sci, 2000. 46, 46. [CrossRef]
- Duchense, I. , Vincent, M., Wang, X., Ung, C.H., Swift D.E. Wood mechanical properties and discoloured heartwood proportion in sugar maple and yellow birch grown in New Brunswick, BioResources, 11, 2007-2019.
- Karlsoon, O. , Sidorava, E. , Moren, T. Influence of heat transferring media on durability of thermally modified wood, BioResources, 2011, 6, 356–372. [Google Scholar]
- Sahin Kol, H. Charactristics of heat-treated Turkish pine and fir wood after ThermoWood processing, J. Envirom. Biol., 2010, 31, 1007–1011. [Google Scholar]
- Korkut, S. , Akgul, M. , Dundar, D. The effects of heat treatment on some technological properties of scots pine (Pinus sylvestris L.) wood, Bioresour.Technol., 2008, 99, 1861–1868. [Google Scholar] [CrossRef]
- Yildiz, S. , Gezer, E. D., Yildiz, U.C. Mechanical and chemical behavior of spruce wood modified by heat, Build Environm., 2006, 41, 1762–1766, DOIː10. [Google Scholar]
- Kortelainen, S.M. , Antikainen, T. , Viitaniemi, P. The water absorption of sapwood and heartwood of Scots pine and Norway spruce heat-treated at 170 ºC, 190 ºC, 210 ºC and 230 ºC, Holz Roh Werkst., 2006, 64, 192–197. [Google Scholar] [CrossRef]
- Repellin, V. , Guyonnet, R. Evaluation of heat-treated wood swelling by differential scanning calorimetry in relation to chemical composition, Holzforschung, 2005, 59, 28–34. [Google Scholar] [CrossRef]
- International Standard ISO 13061-6ː2014 Physical and mechanical properties of wood-Test methods for small clear wood specimens –Part 1ː Determination of moisture content for physical and mechanical tests-Part 2ː Determination of density for physical and mechanical tests-Part 3ː Determination of ultimate strength in static bending-Part 4ː Determination of modulus elasticity in static bending- Part 5ː Determination of strength in compression perpendicular to grain-Part 6ː Determination of ultimate tensile stress parallel to grain_Part 7ːDetermination of ultimate tensile stress perpendicular to grain-Part 7ːDetermination of ultimate tensle stress perpendicular to grain-Part 7ː Determination of ultimate tensile stress perpendicular to grain-Part 10ː Determination of impact bending strength-Part 11ː Determination of resistance to impact indentation -Part 12 Determination of static hardness-Part 13ː Determination of radial and tangemtial shrinkage-Part 14ː Determination of volumetric shrinkage-Part 15ː Determination of radial and tangential swelling-Part 16ːDetermination of volumetric swelling-Part 17ːDetermination of strength in compression parallel to grain.
- Esteves, B.M. , Domingos, I. J., Pereira, H.M. Heat treatment of pine wood, BioResources, 2008, 3, 142–154. [Google Scholar]
- Guller, B. Effects of heat treatment on density, dimensional stability and color of Pinus nigra wood, Afr.J.Biotechnol., 2012,11, 2204-2209.
- Havreljuk, F. Achim, A. , Pothier, D. Regional variation in the proportion of red heartwodd in sugar maple and yellow birch, Can J.For.Res, 2013, 43, 278–287. [Google Scholar] [CrossRef]
- Hillis, W.E. High temperature and chemical effects on wood stability, Wood Sci. Technol., 1996, 18, 281–293. [Google Scholar] [CrossRef]
- Icel, B. , Guler, G. , Isleyan, O., Beram, A., Mutlubas, M. Effects of industrial heat treatment on the properties of spruce and pine woods, BioResources, 2015, 10, 5159–5173. [Google Scholar]
Figure 1.
Stages of heat treatment of wood.
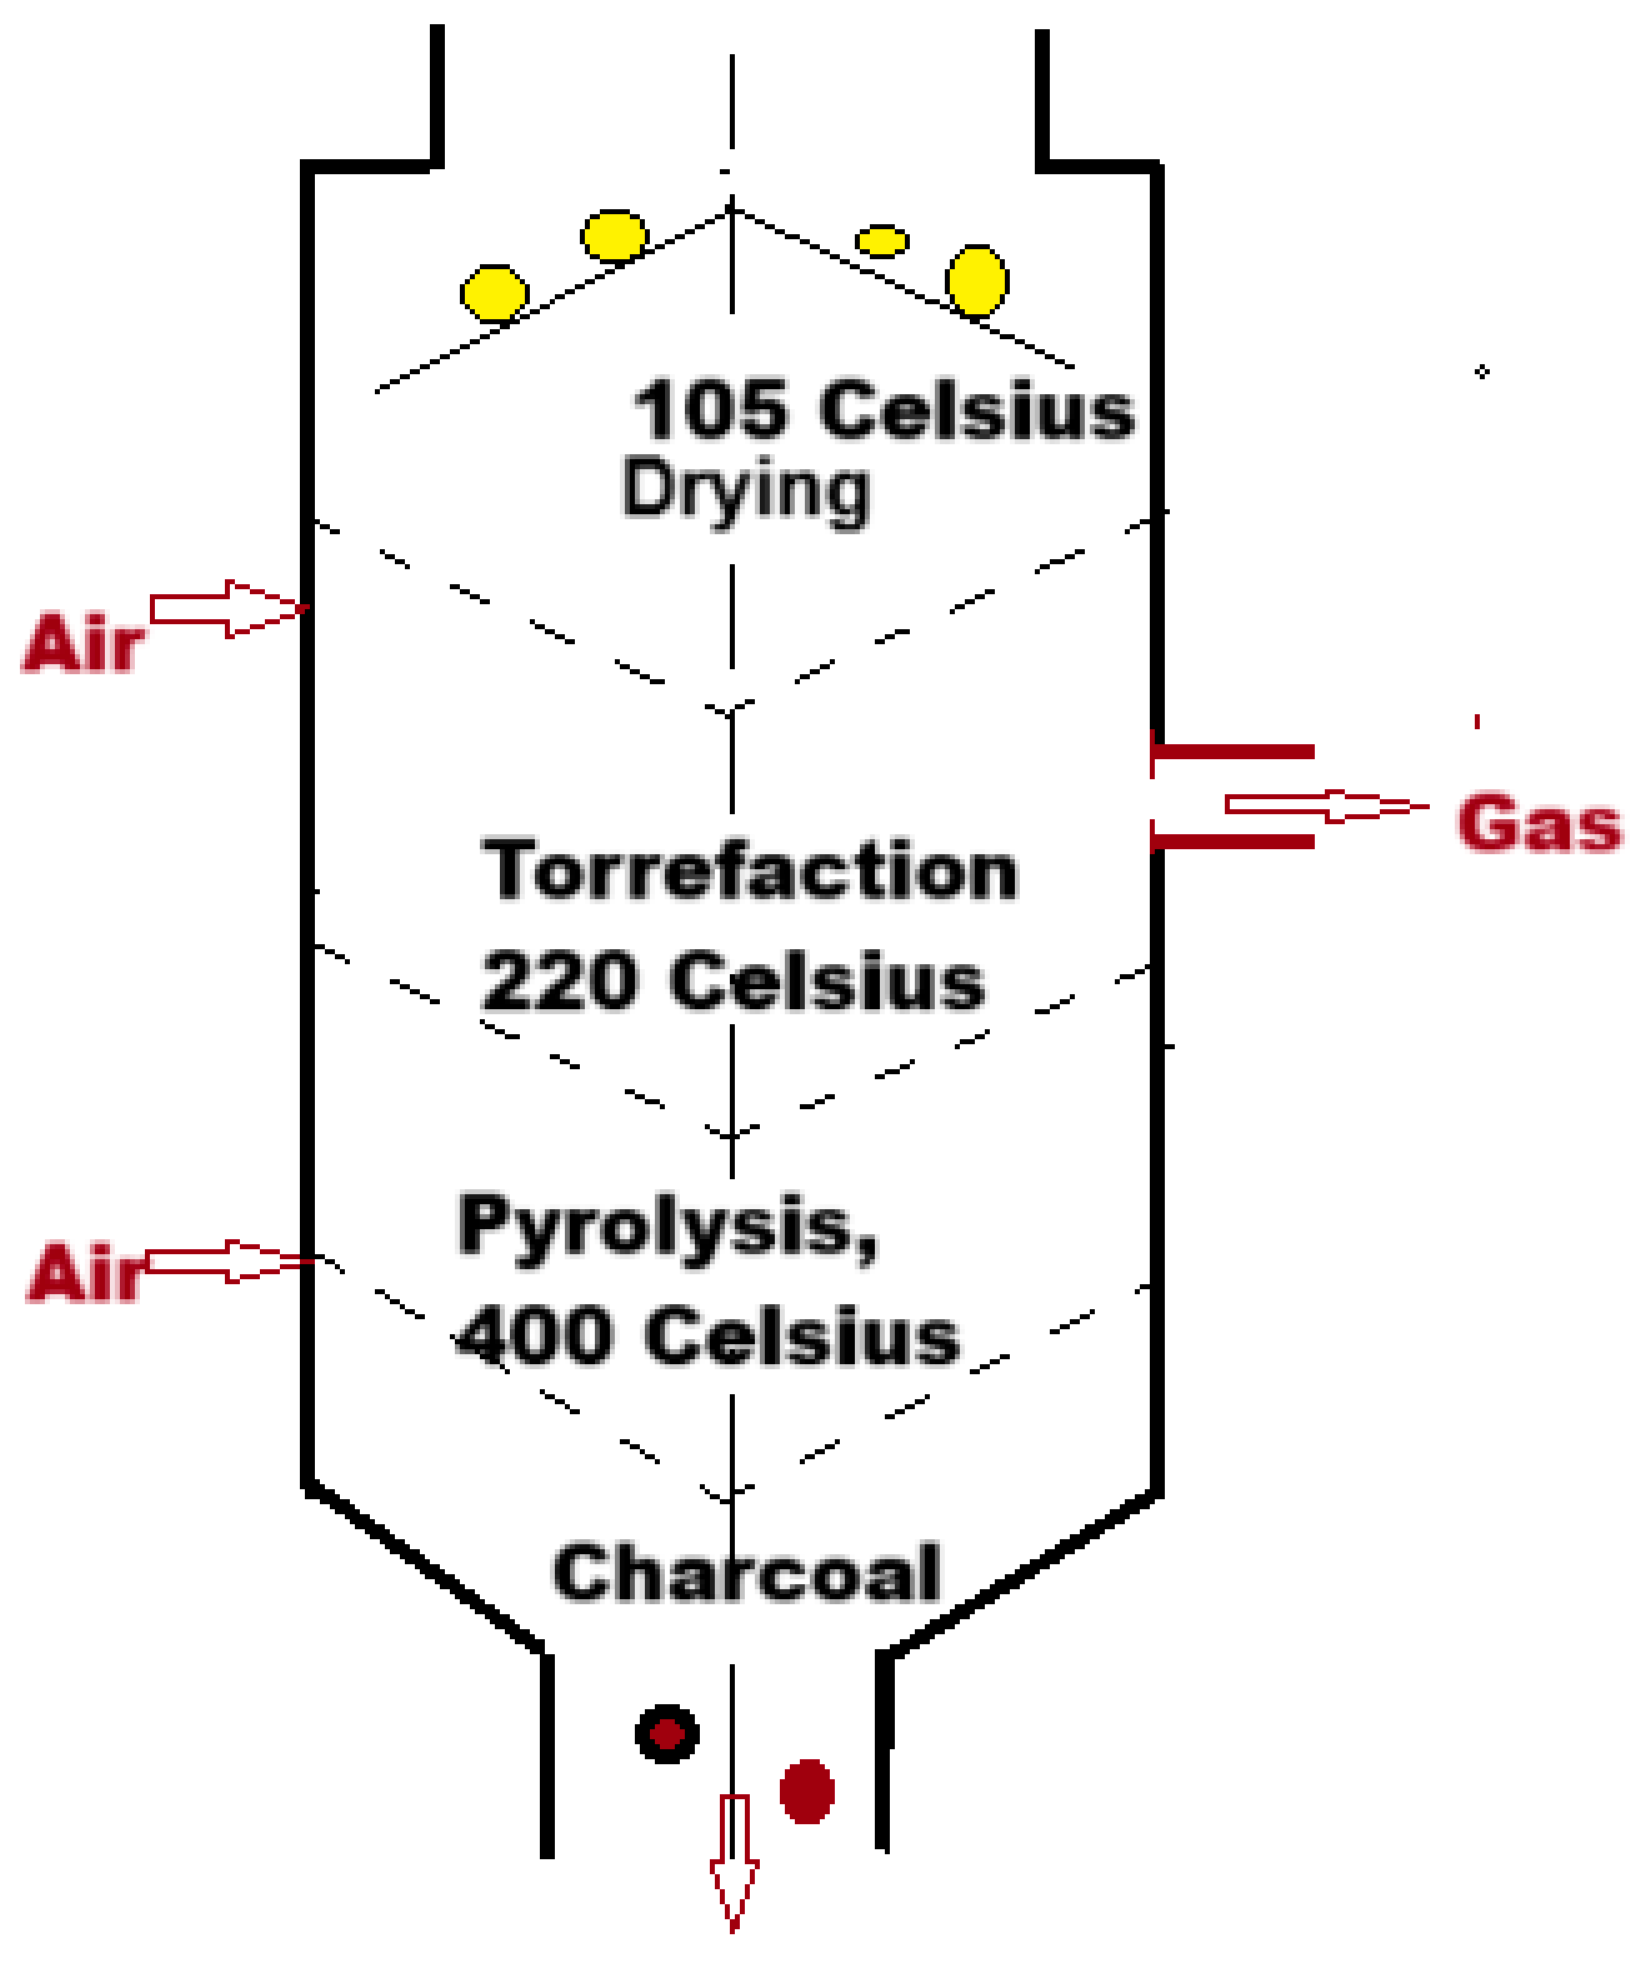
Figure 2.
Determination of the tensile strength parallel to the wood fibersː a- sample shape; b-fixing in the blades of the tensile testing machine.
Figure 2.
Determination of the tensile strength parallel to the wood fibersː a- sample shape; b-fixing in the blades of the tensile testing machine.
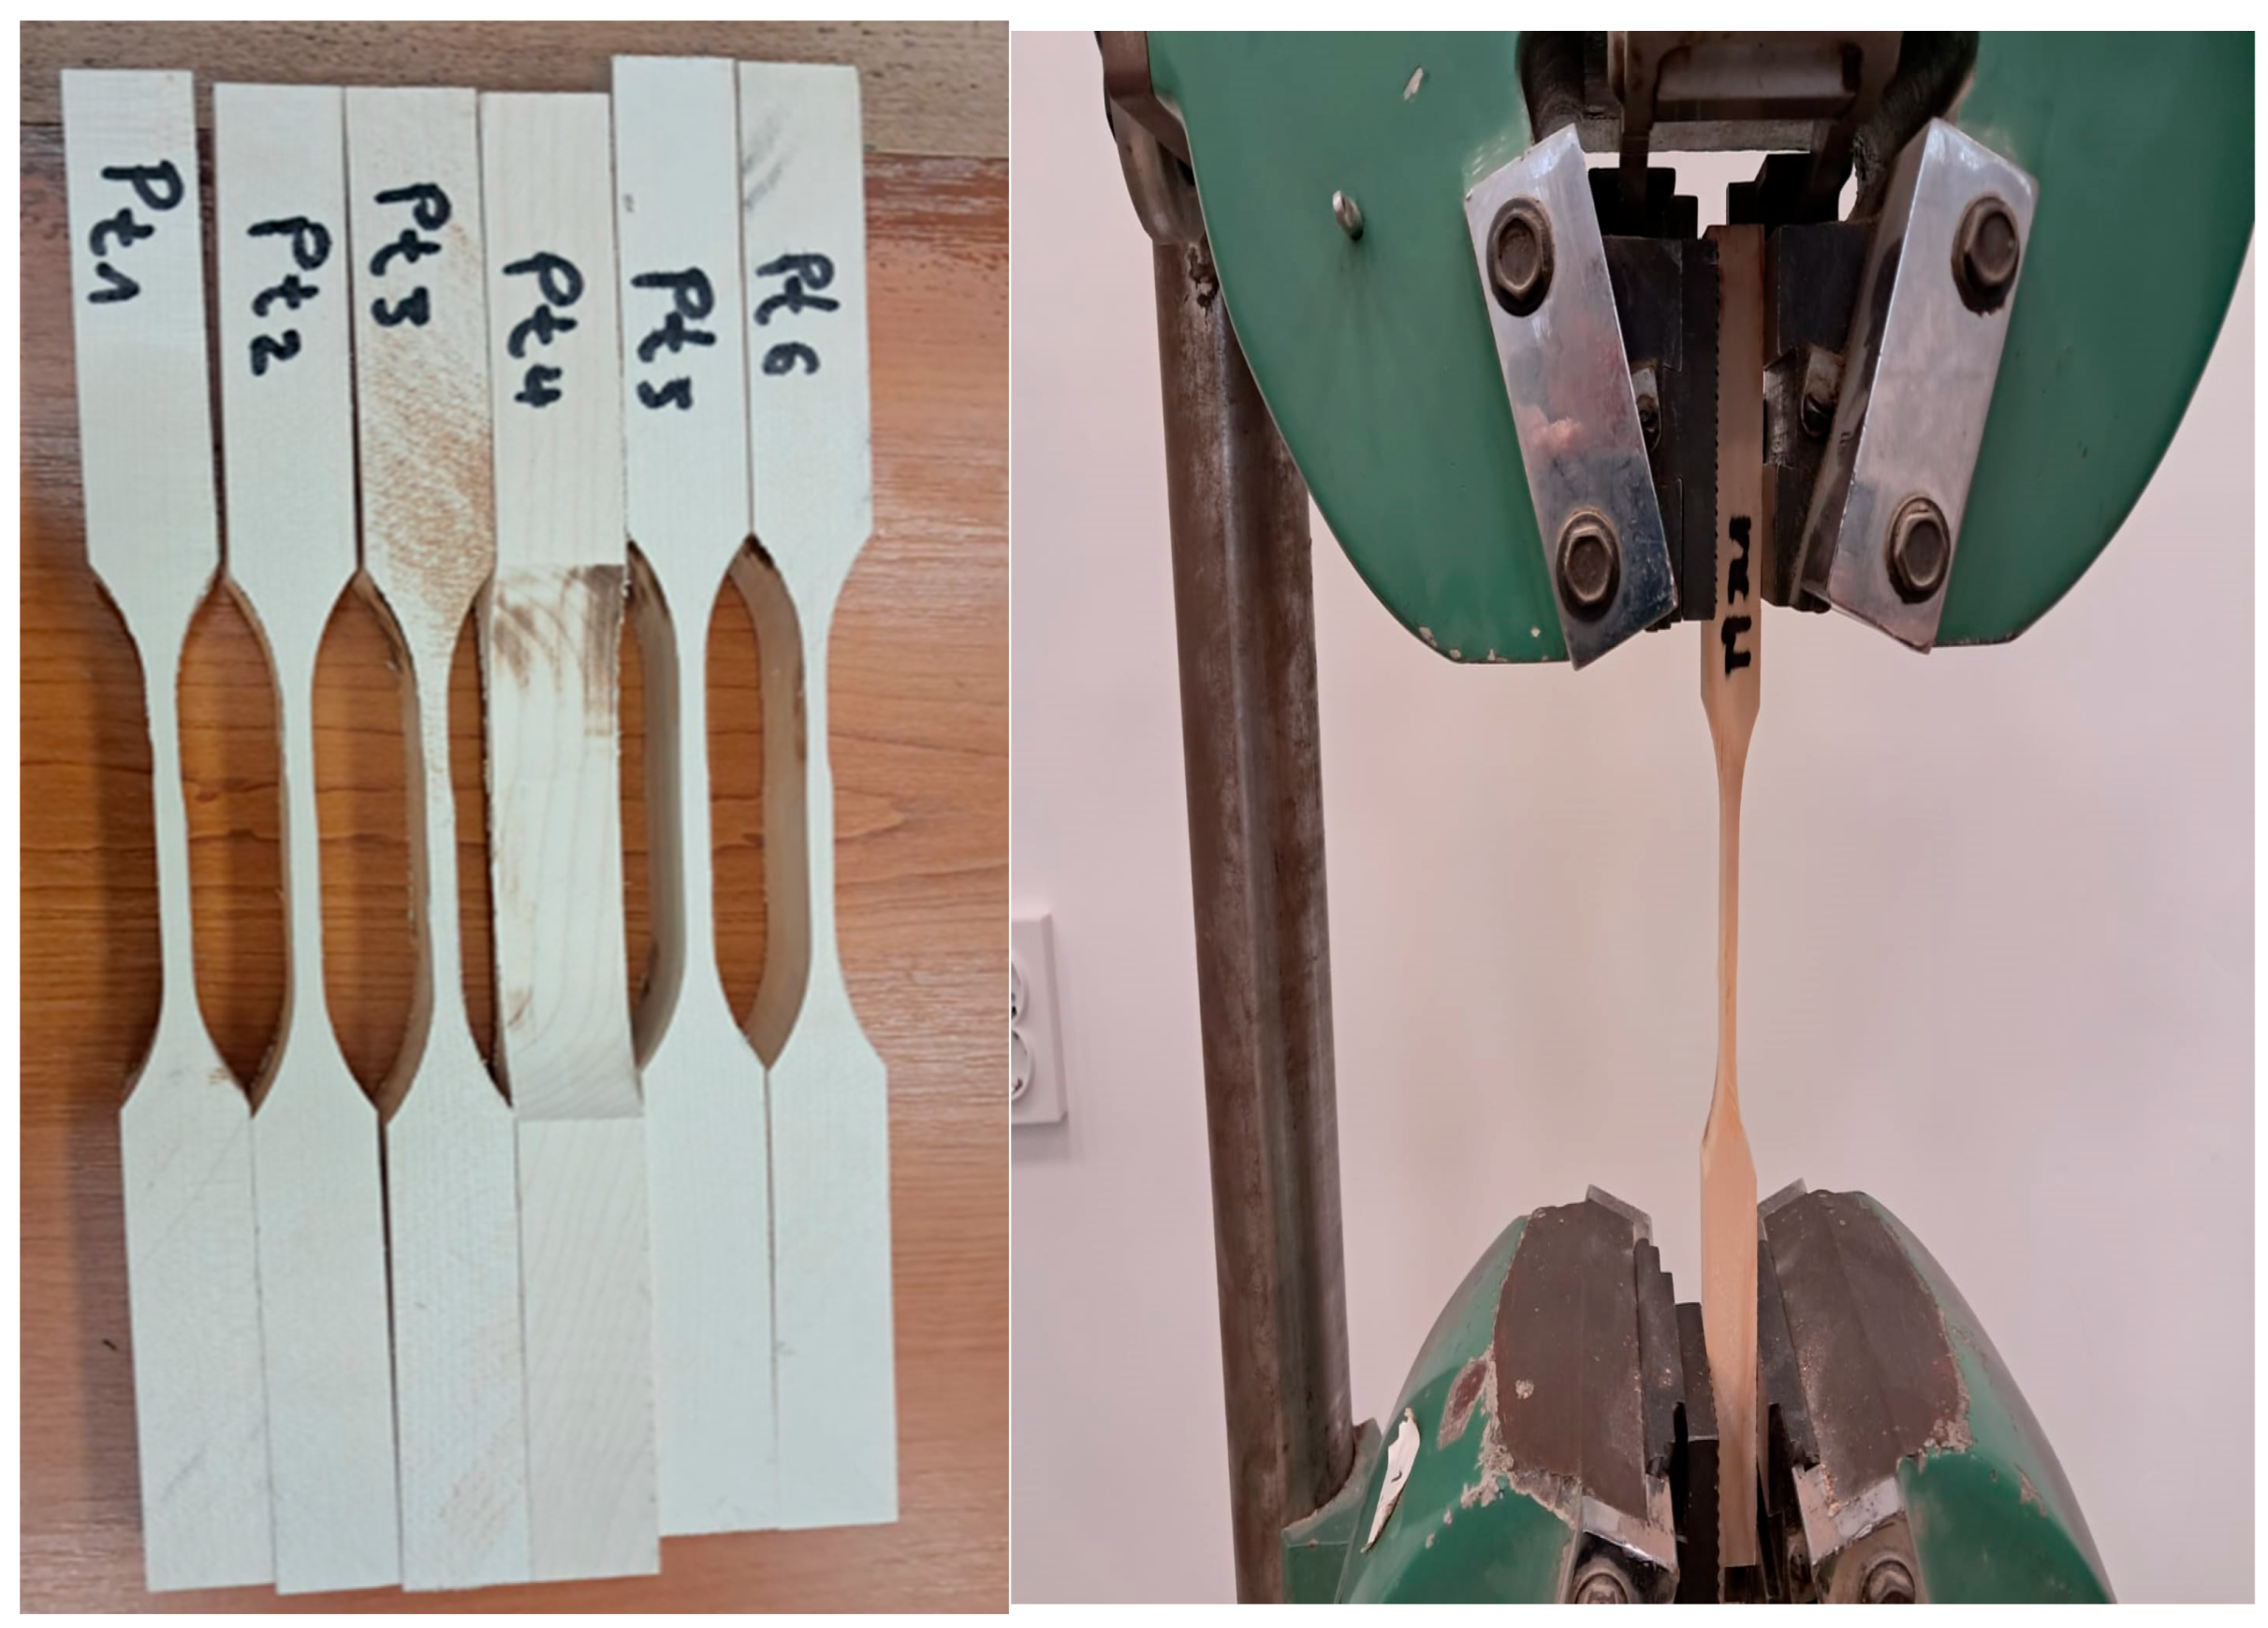
Figure 3.
Apparent density of the two species analyzed.
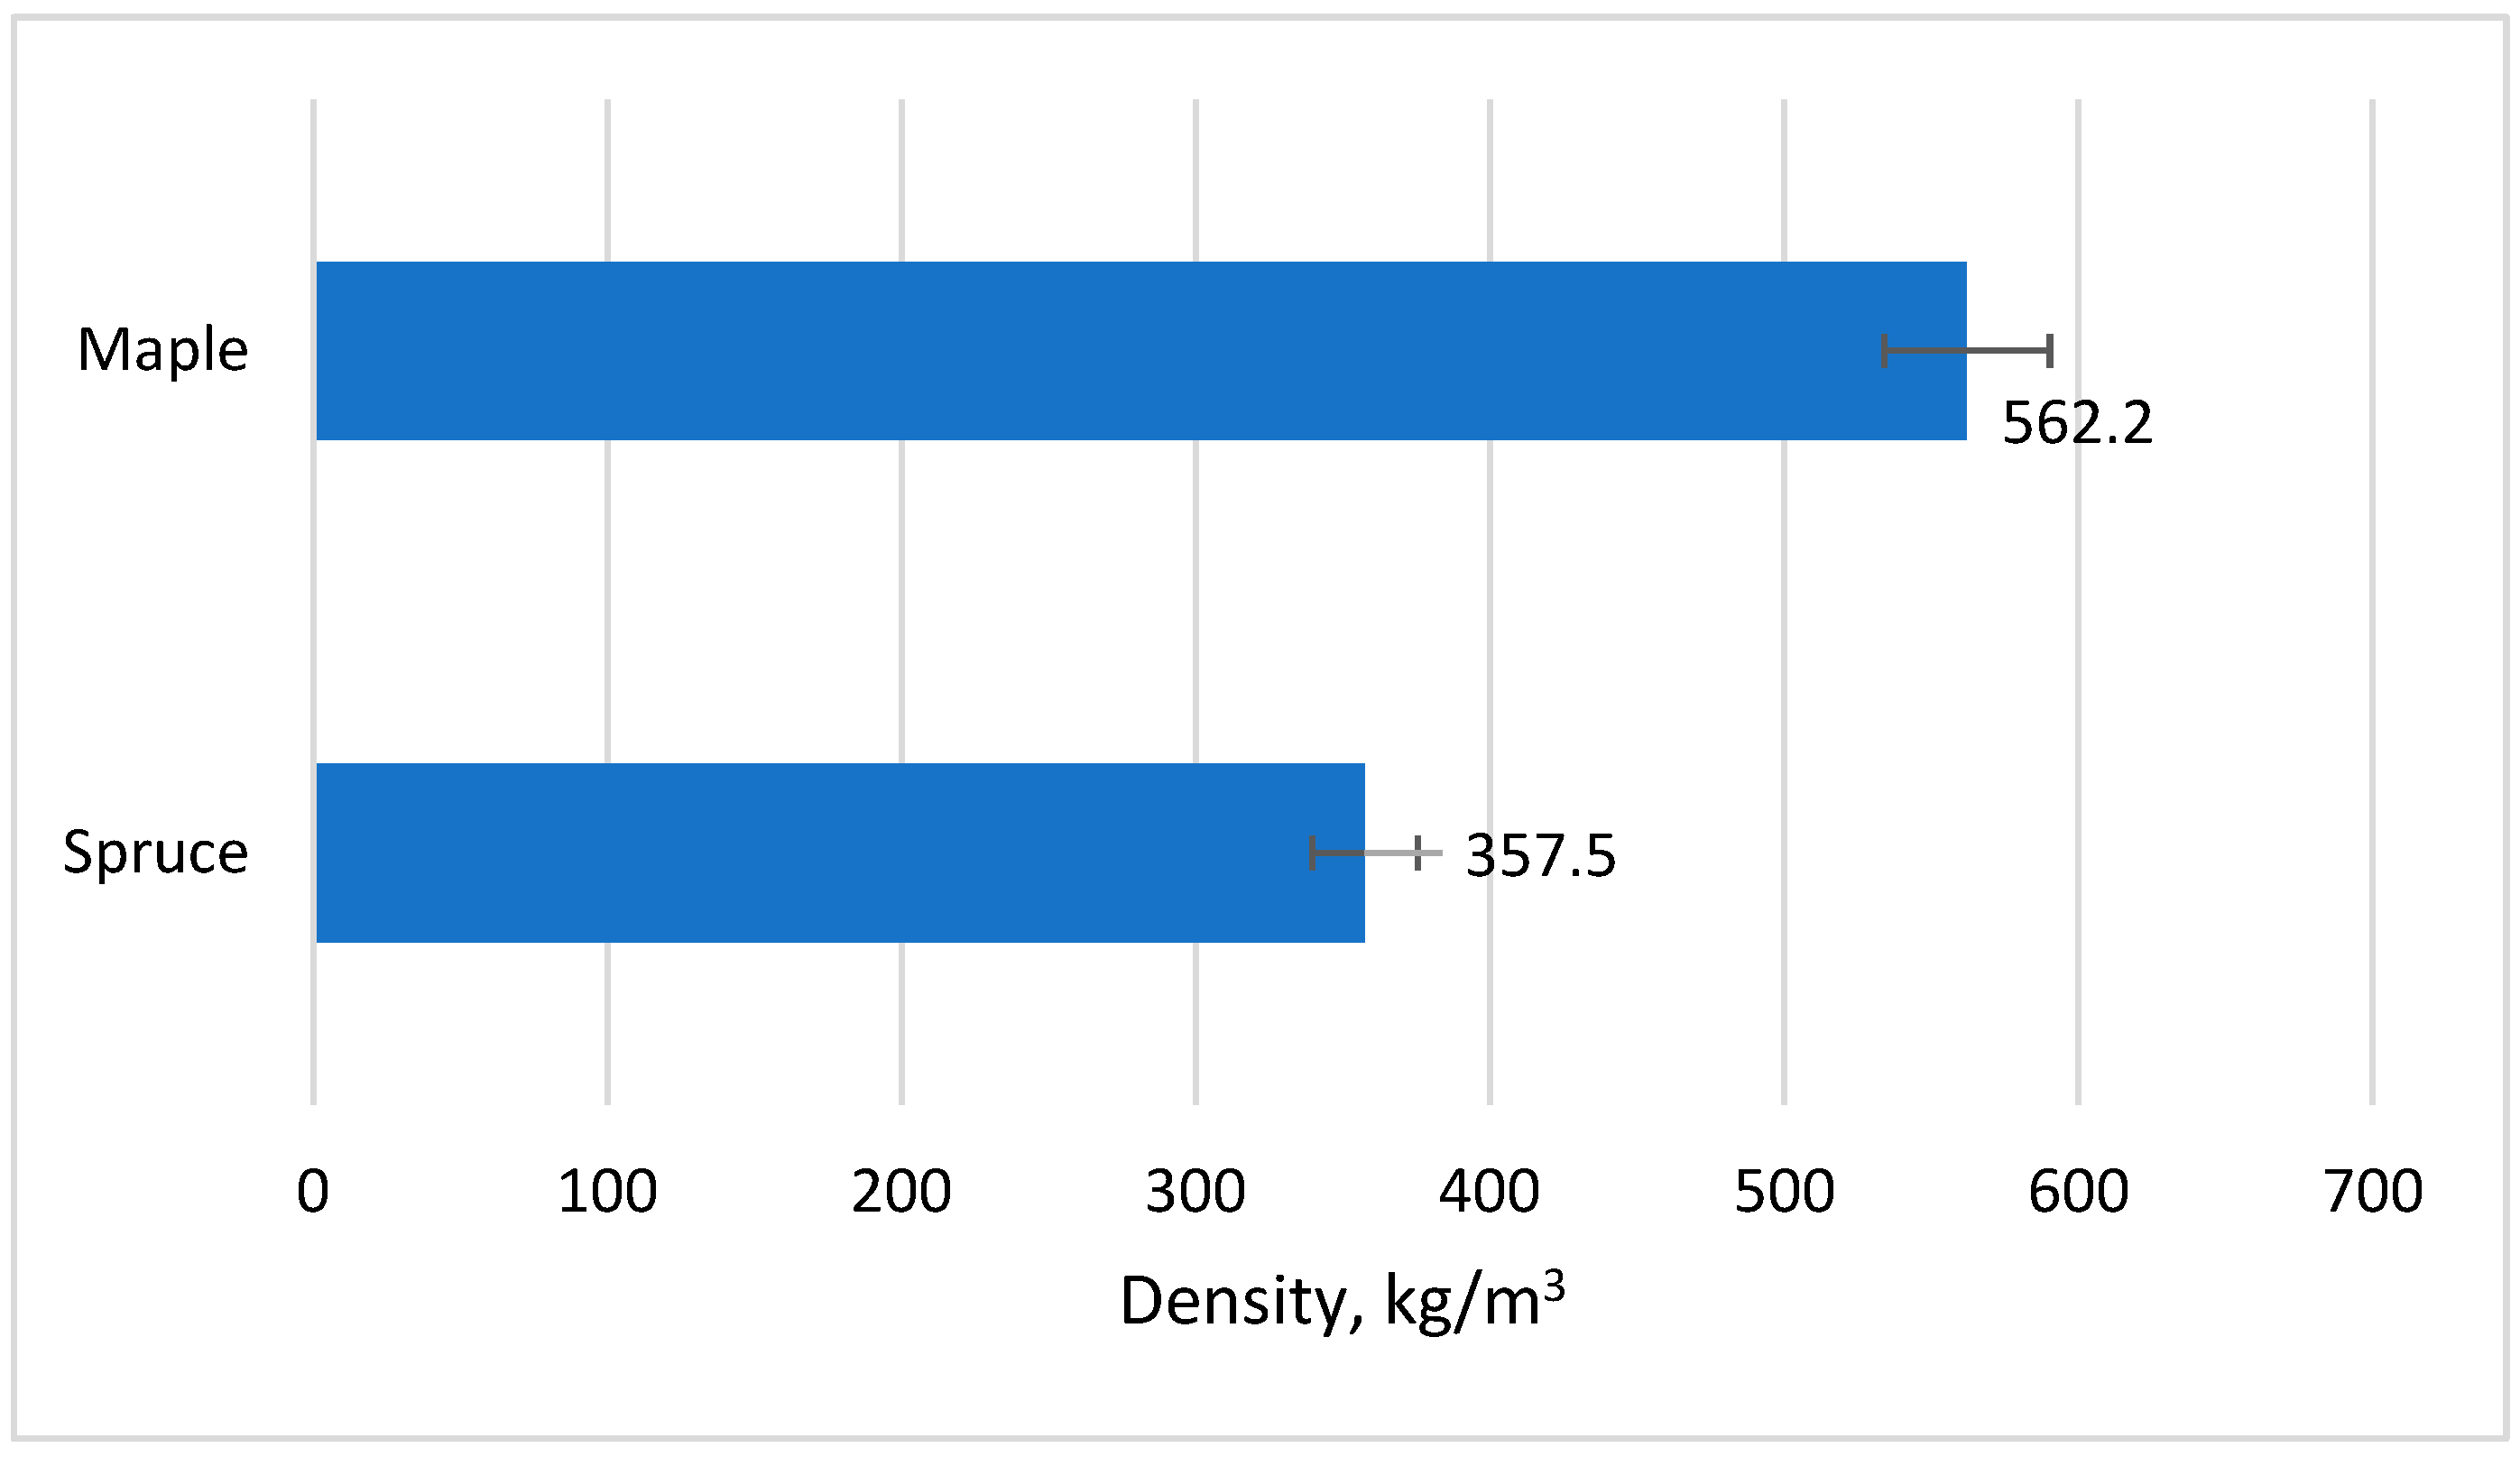
Figure 7.
Radial/tangential swelling of Acer wood after 2h/24 h imersion in water.
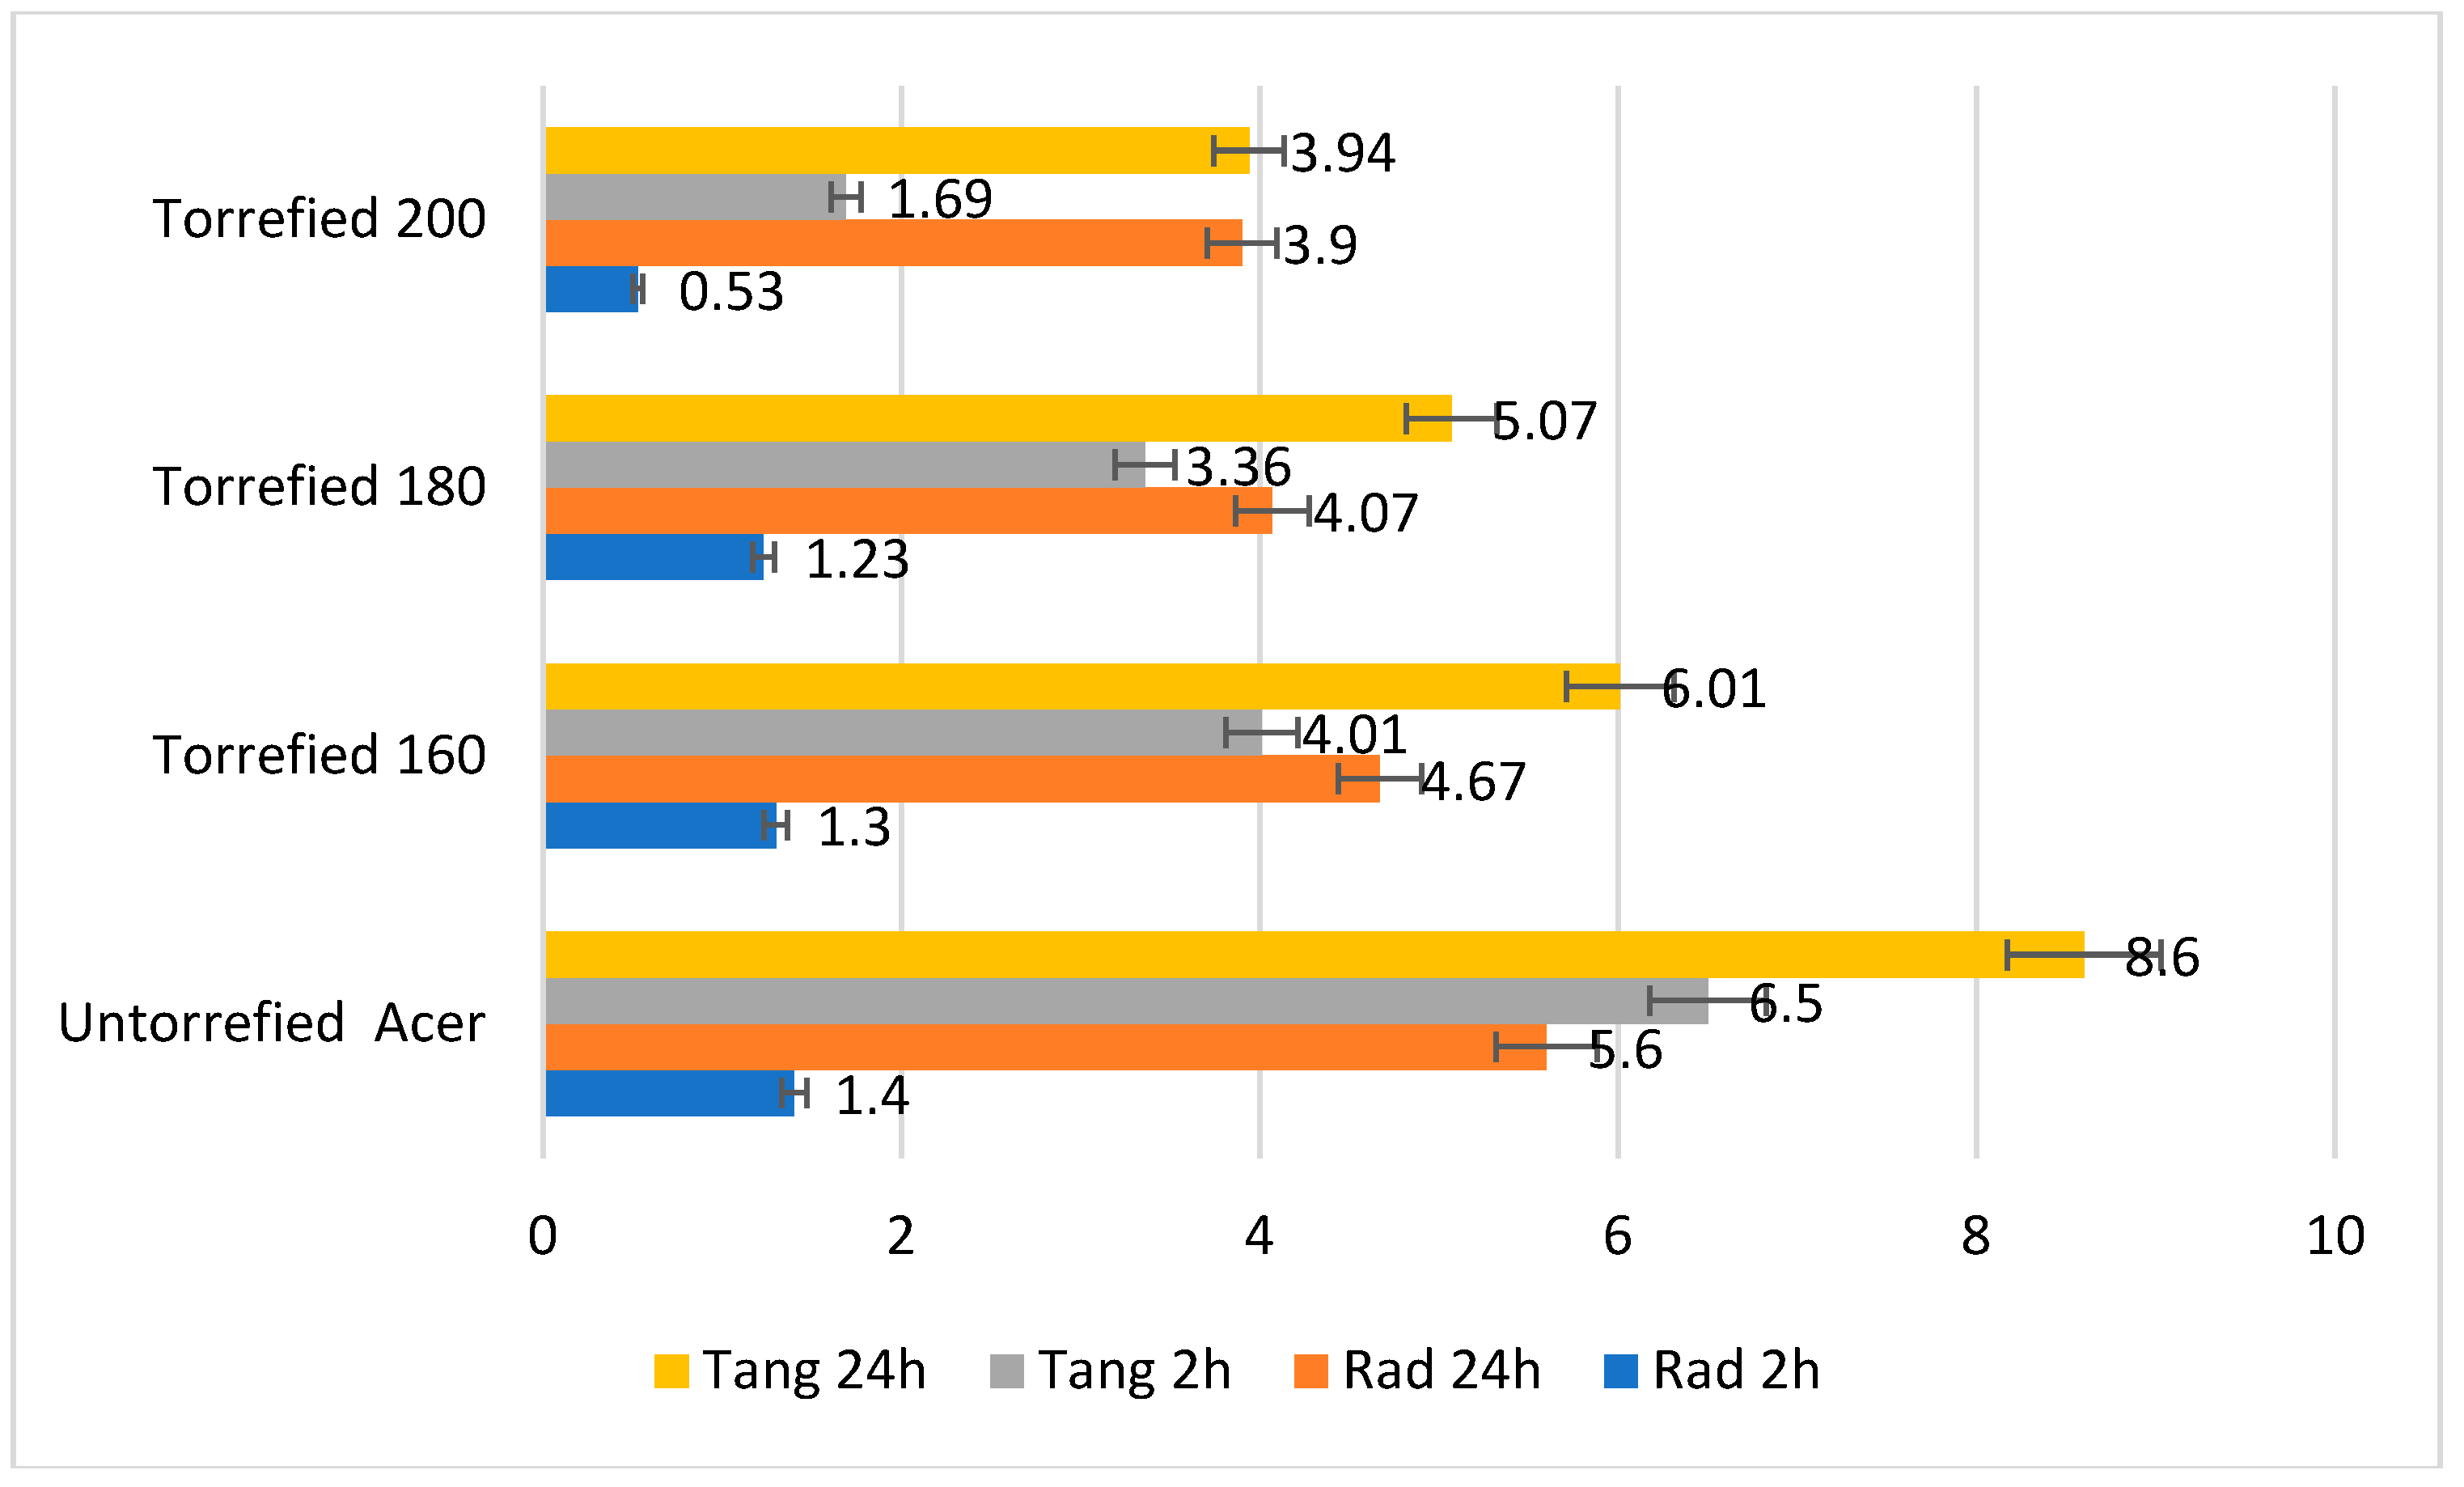
Figure 8.
Fracture patterns of wood in compression parallel to the wood fibers.
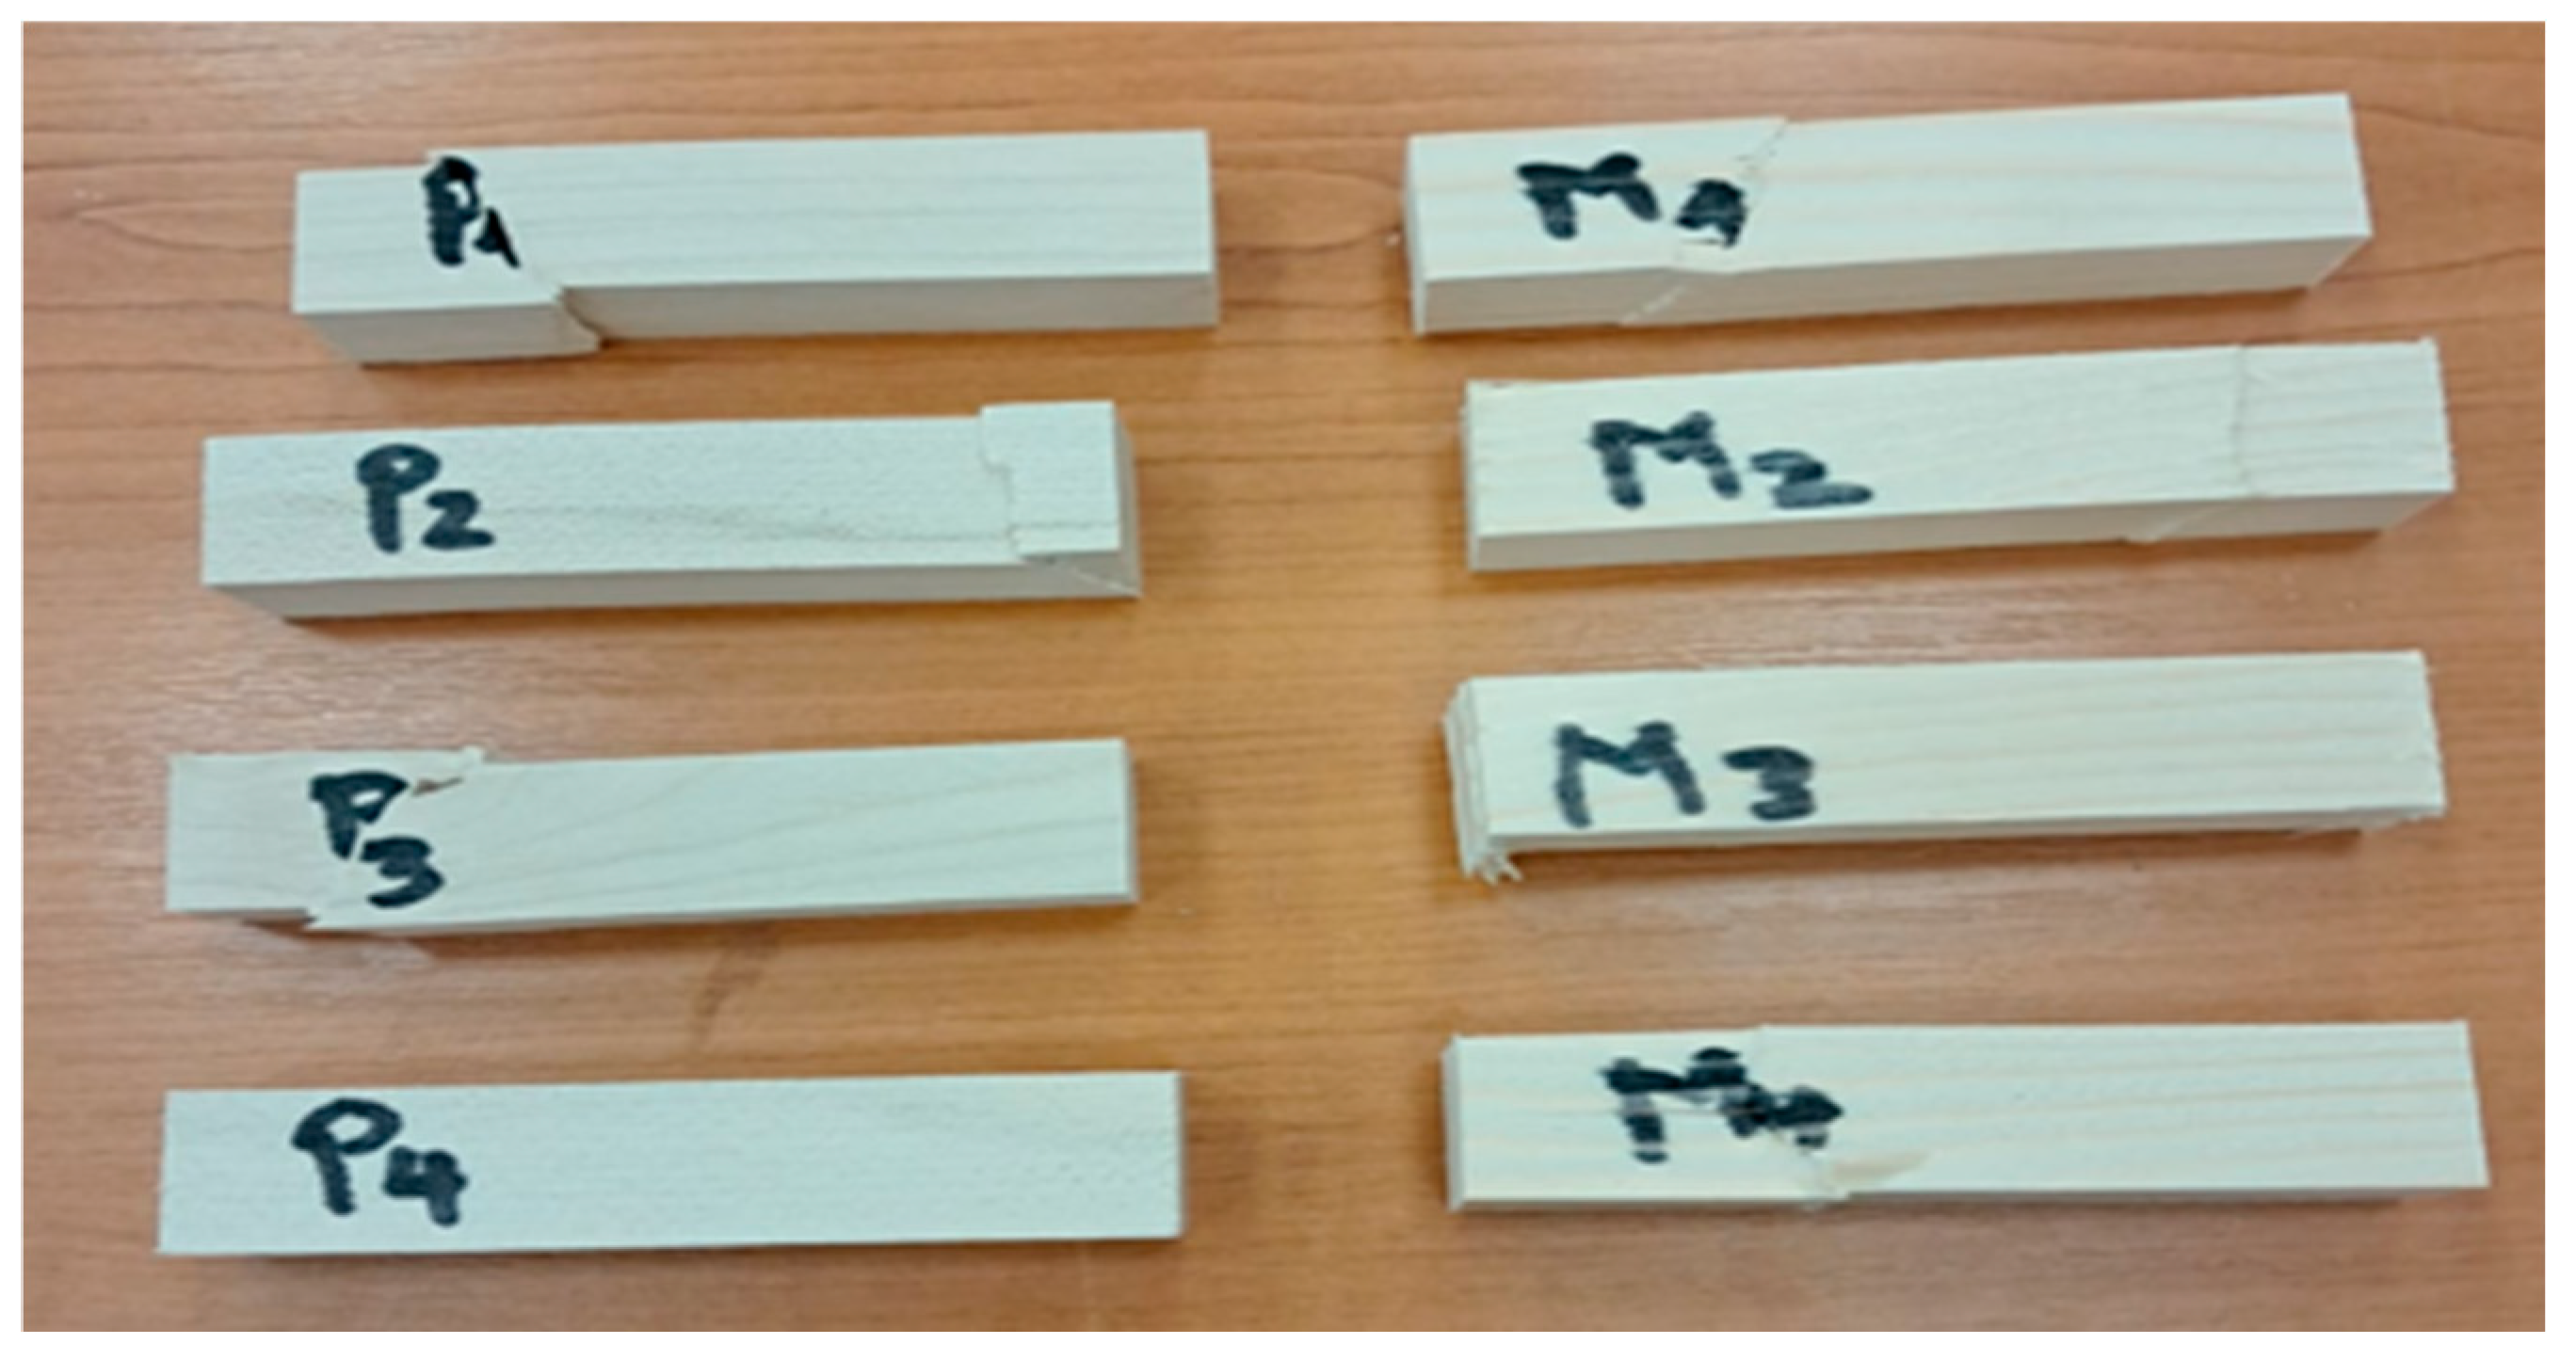
Figure 9.
Compression parallel to the wood fibers for torrefied and non-torrefied wood.
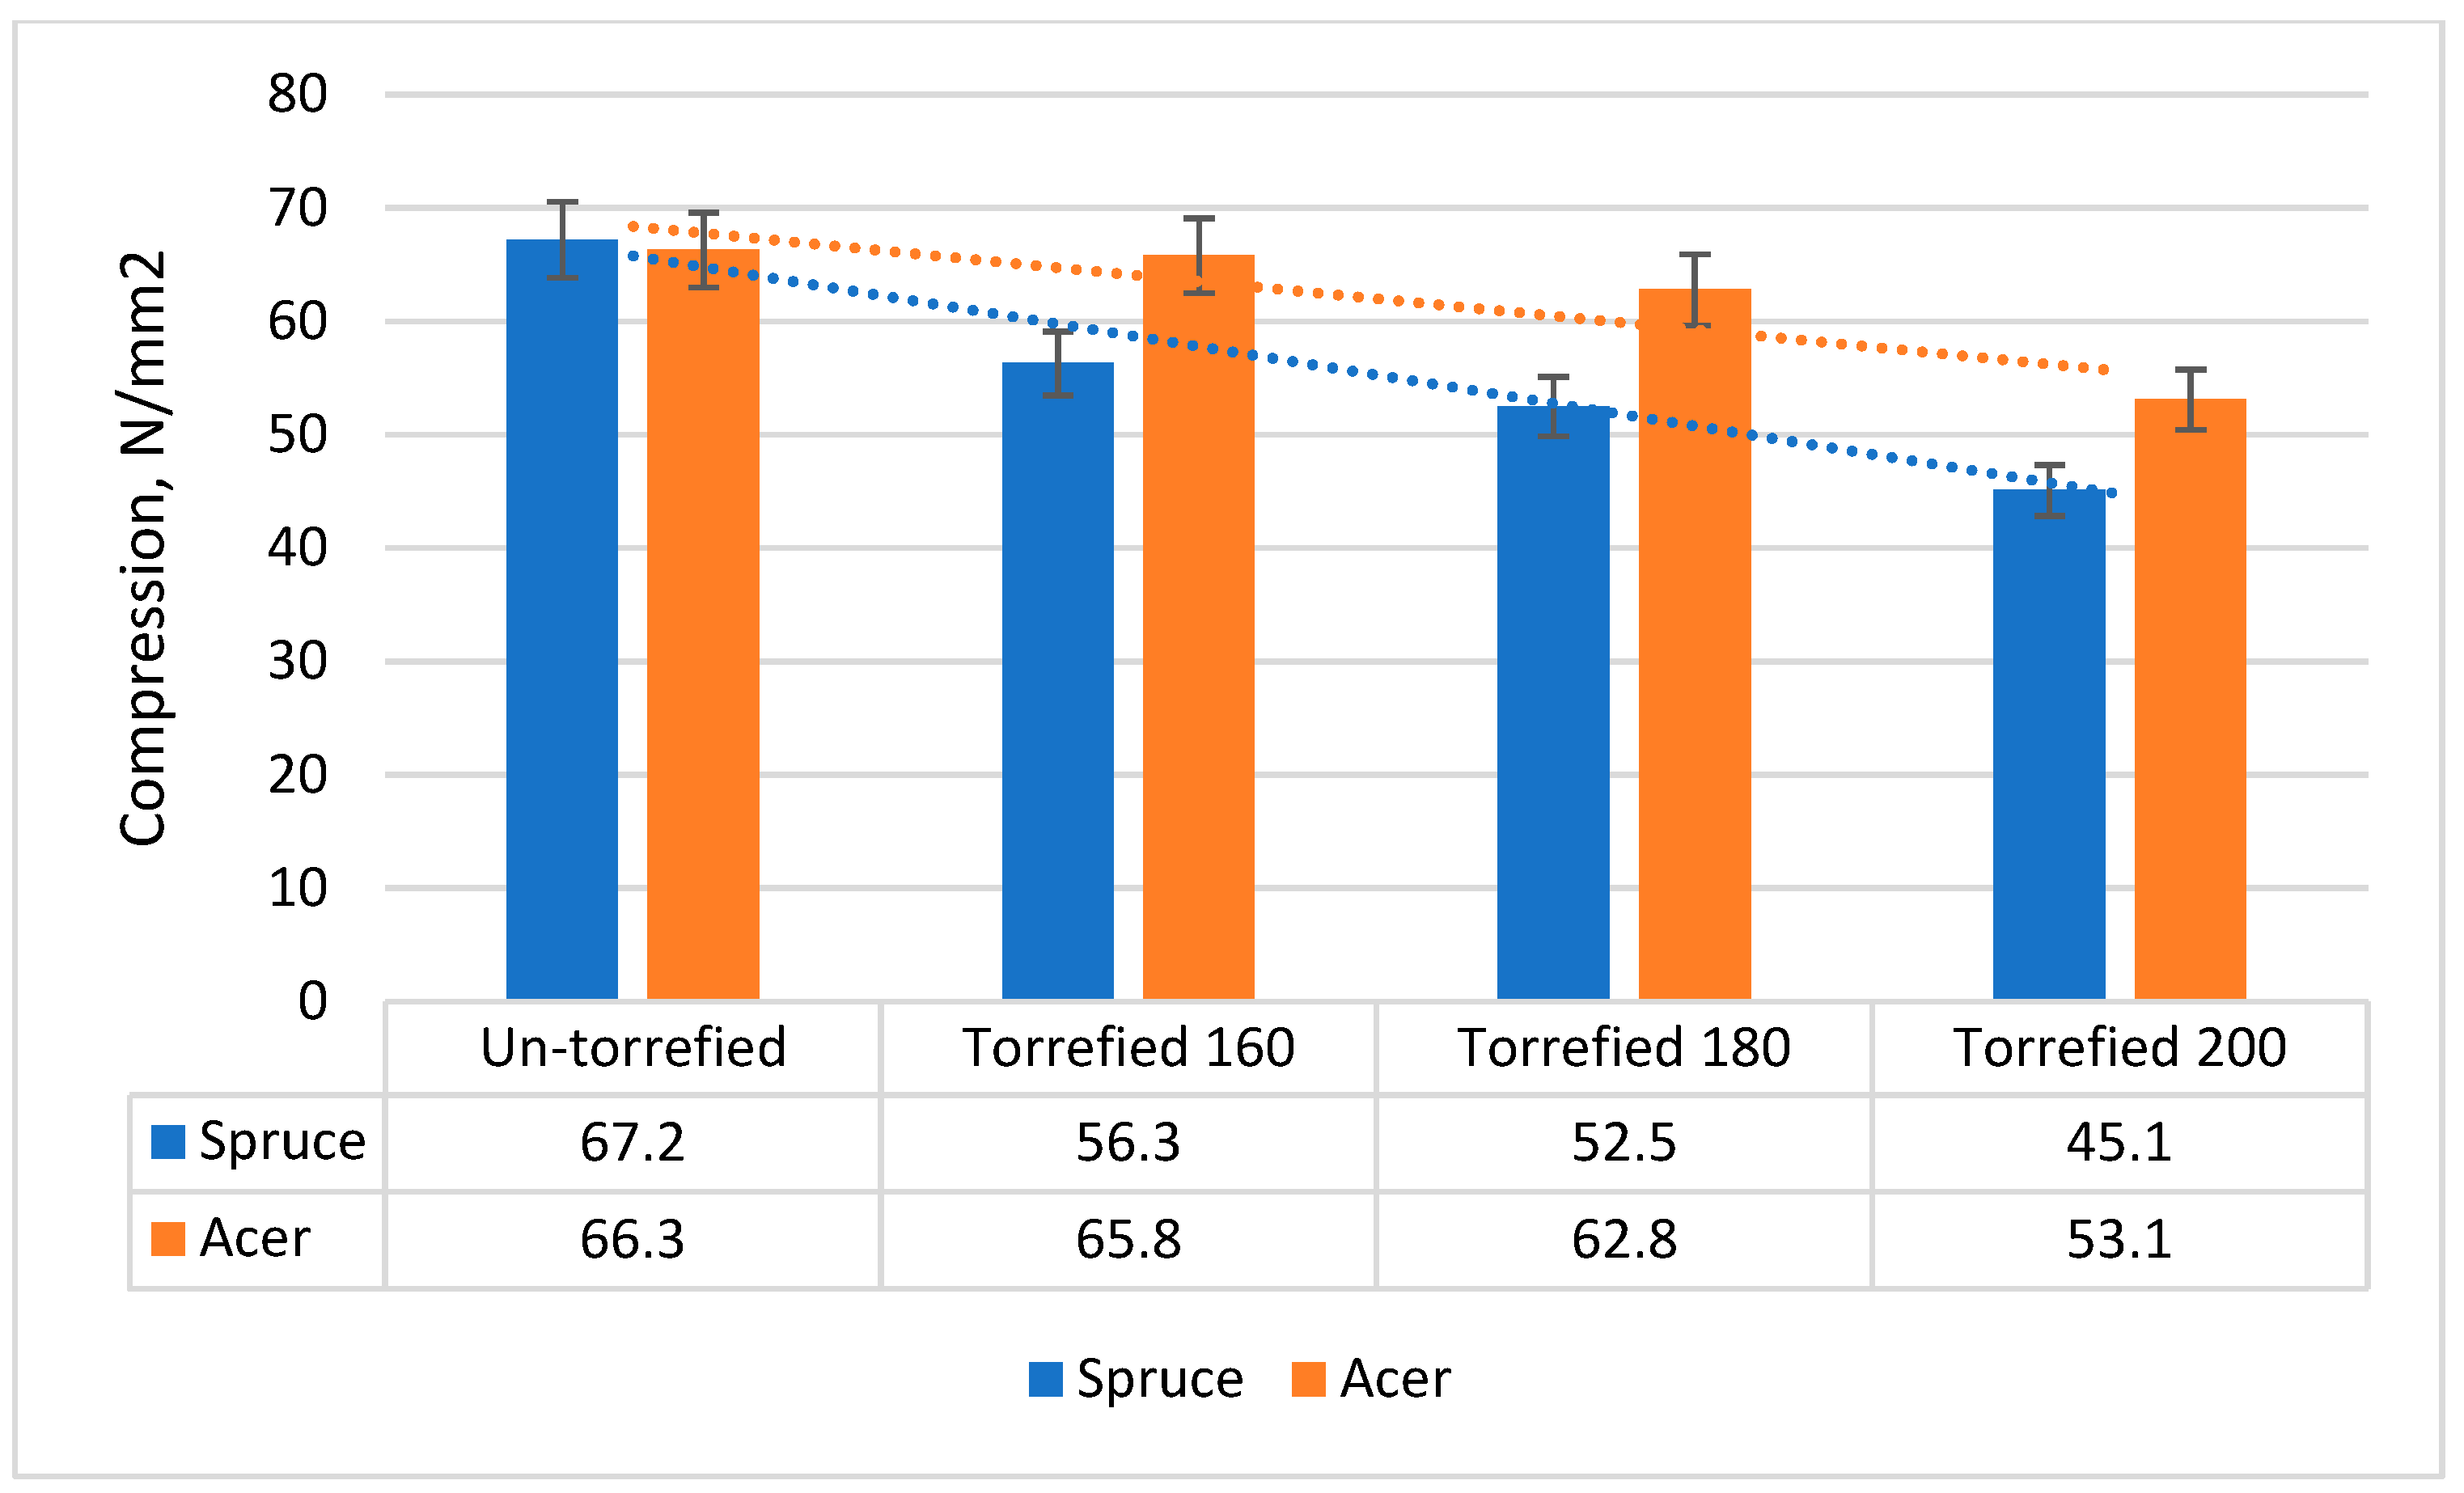
Figure 10.
Shape of the breaks parallel to the wood fibers.
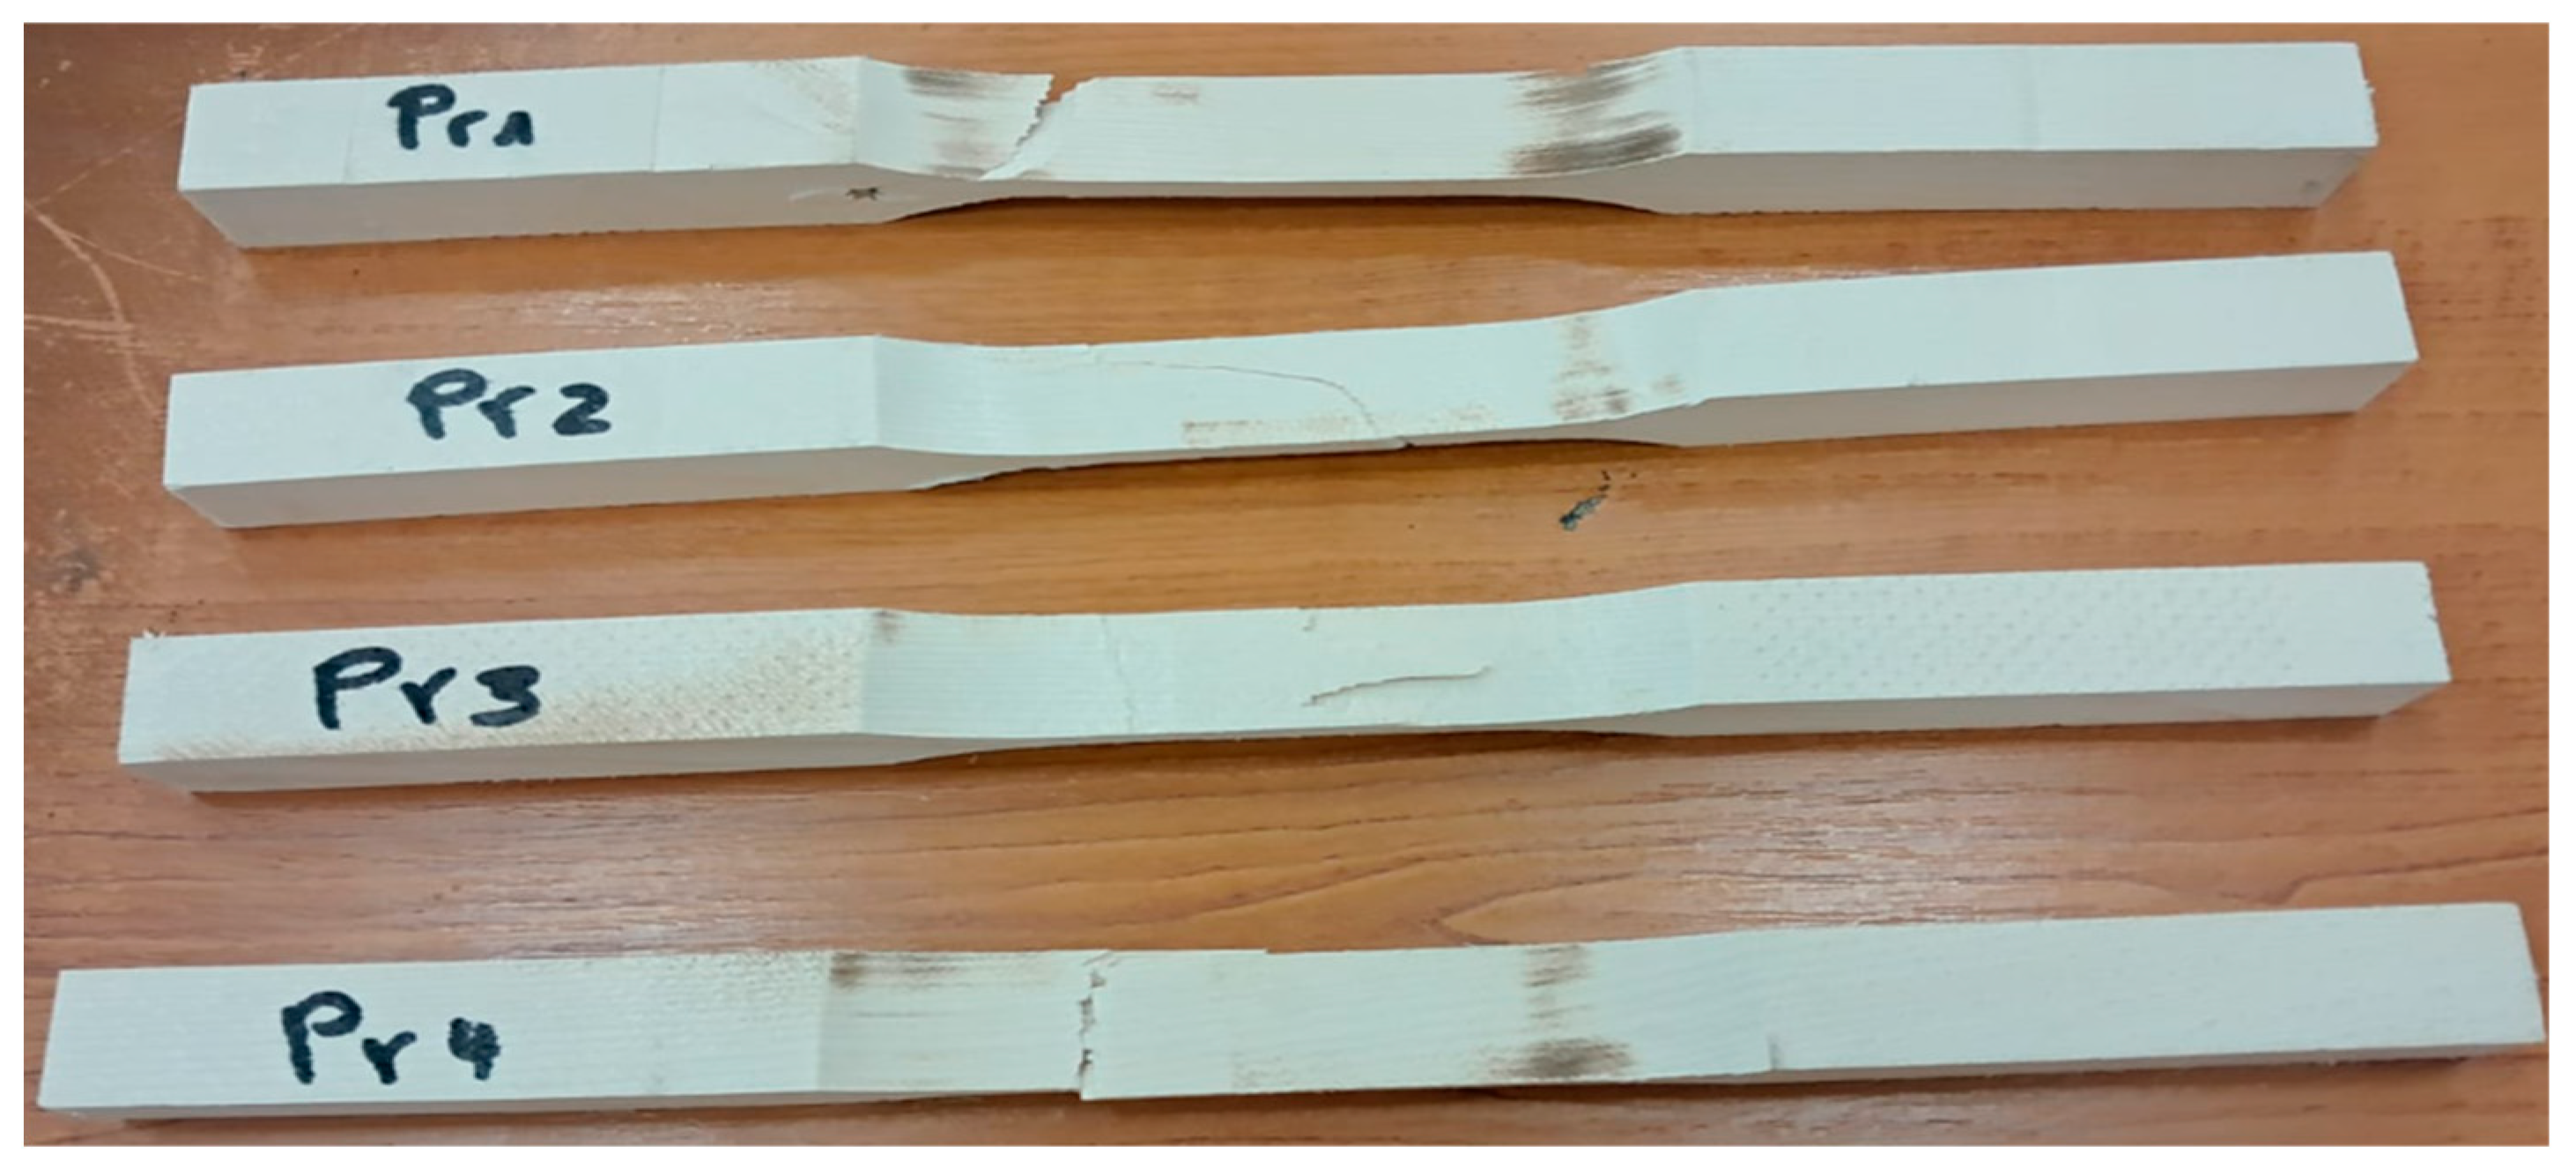
Figure 11.
Tensile strength parallel to the wood fibers.
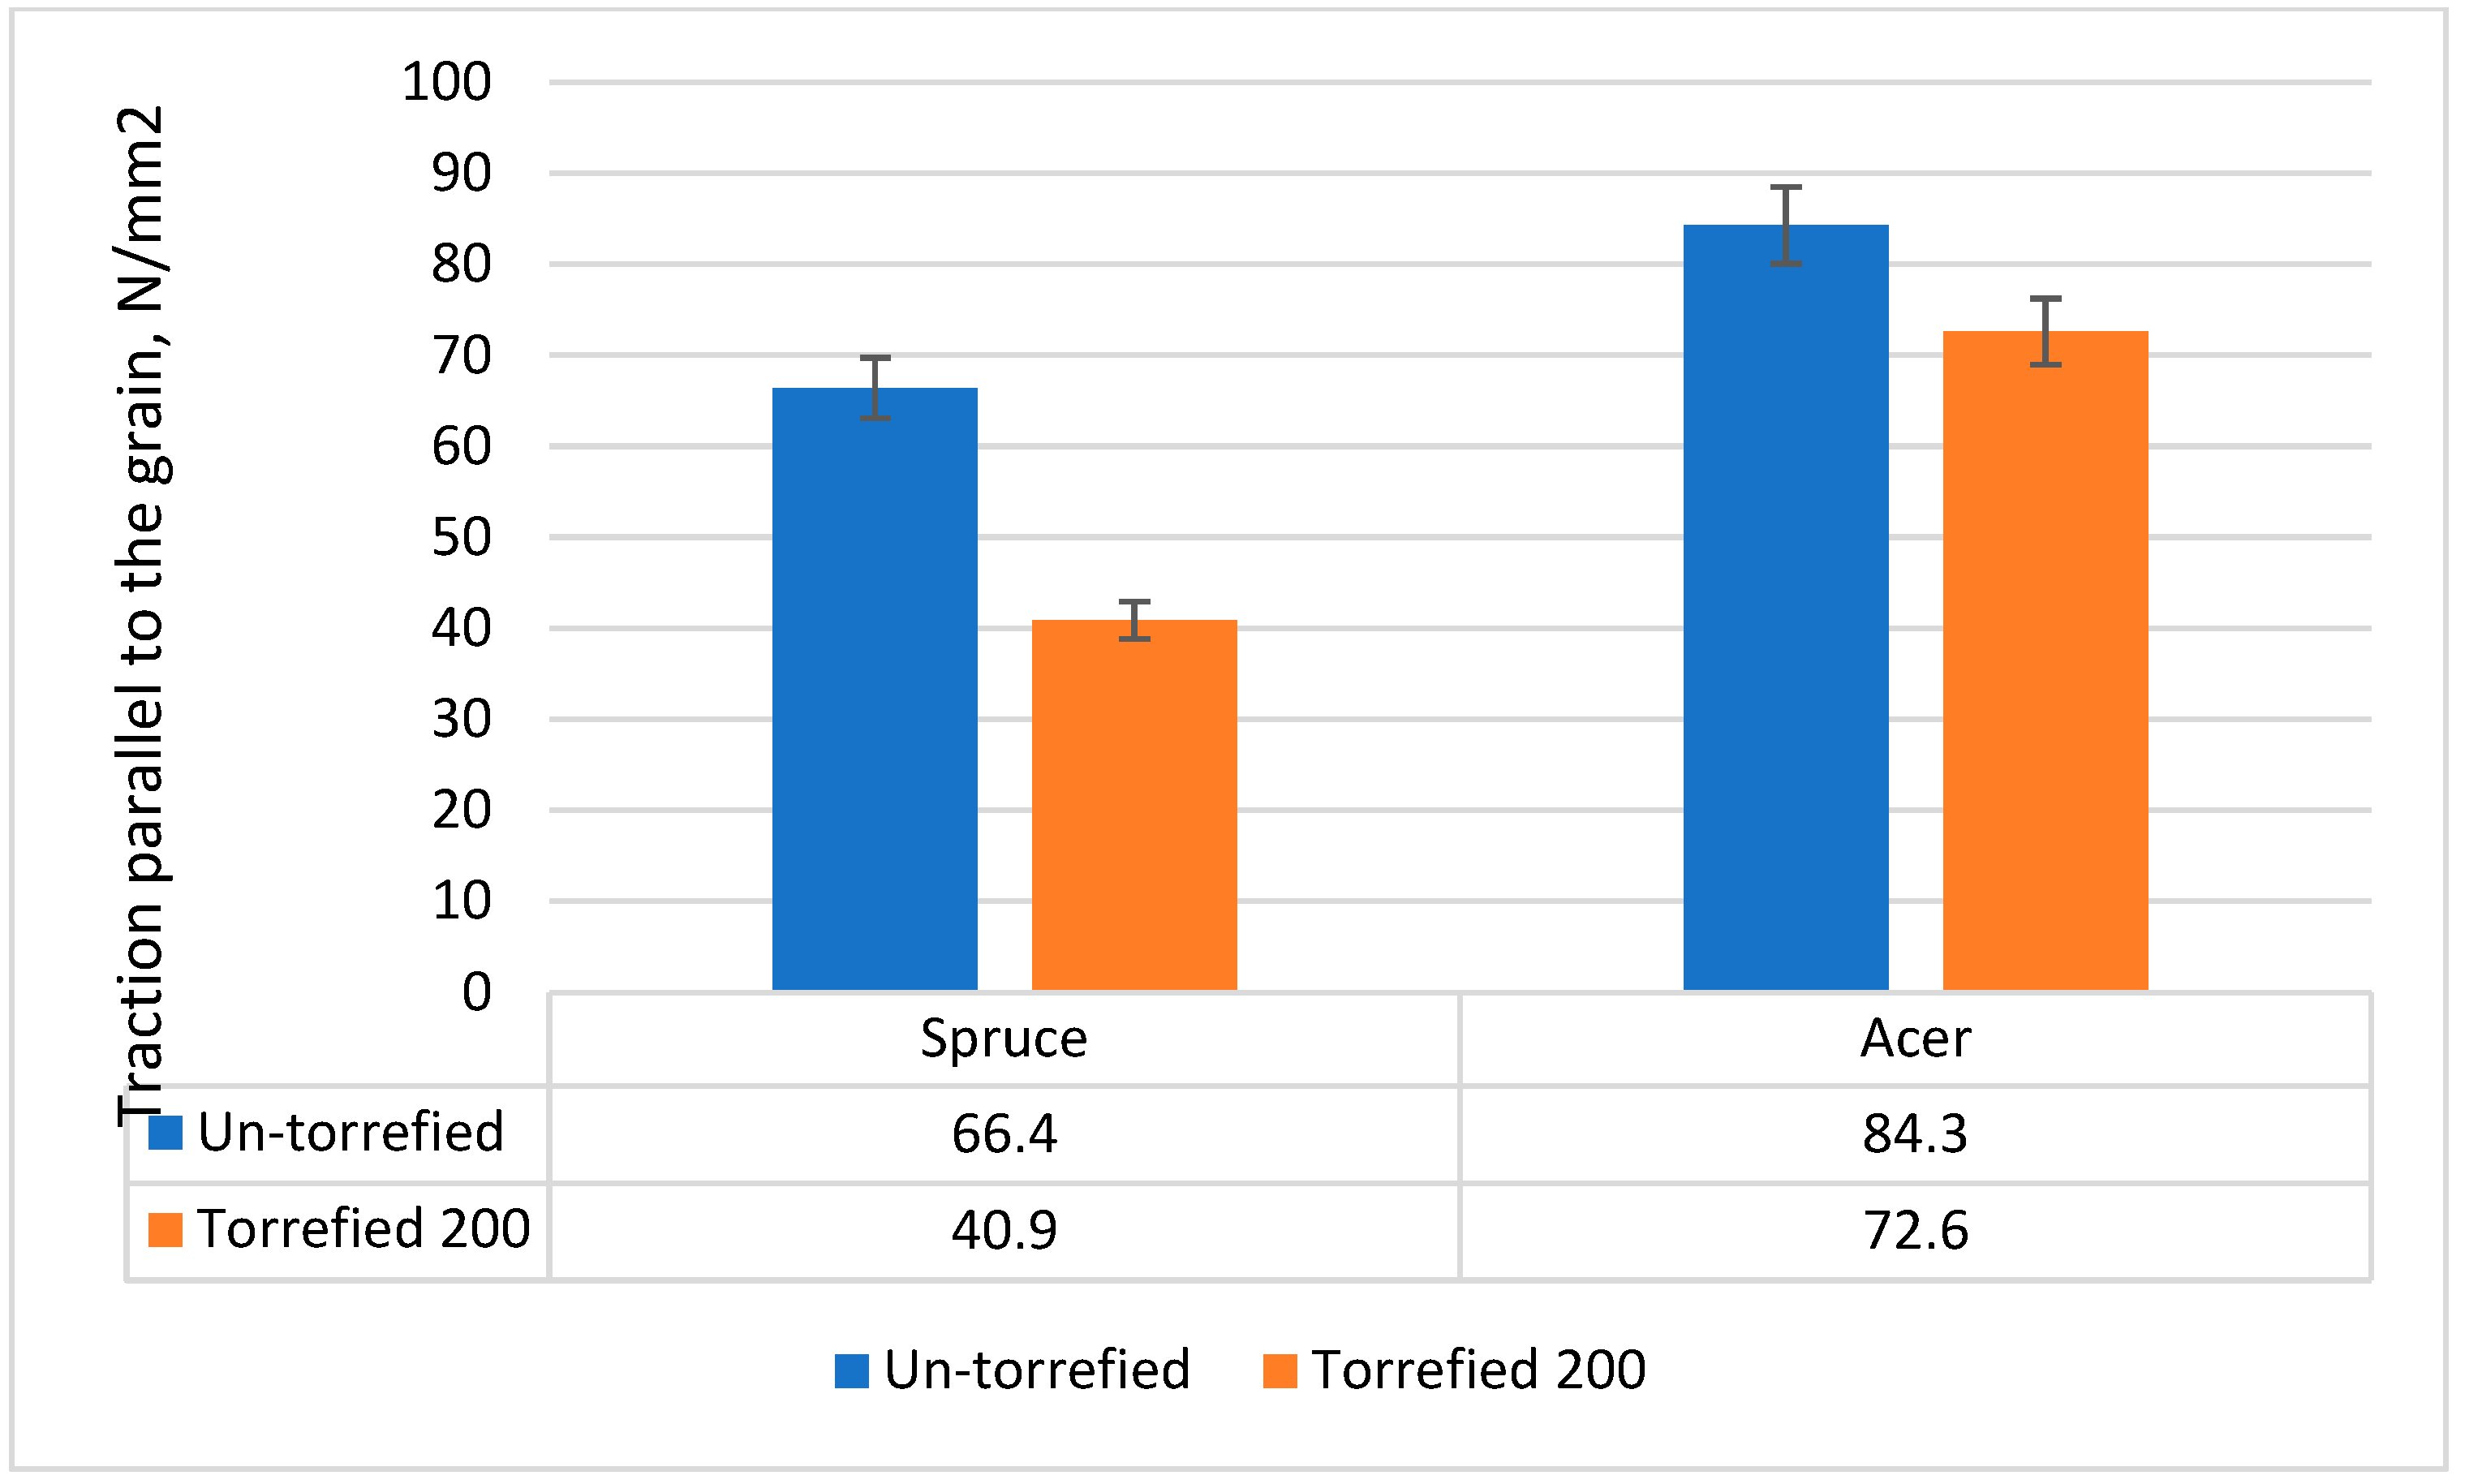
Figure 12.
Comparative Brinell hardness of torrefied and non-torrefied wood.
Disclaimer/Publisher’s Note: The statements, opinions and data contained in all publications are solely those of the individual author(s) and contributor(s) and not of MDPI and/or the editor(s). MDPI and/or the editor(s) disclaim responsibility for any injury to people or property resulting from any ideas, methods, instructions or products referred to in the content. |
© 2025 by the authors. Licensee MDPI, Basel, Switzerland. This article is an open access article distributed under the terms and conditions of the Creative Commons Attribution (CC BY) license (http://creativecommons.org/licenses/by/4.0/).
Copyright: This open access article is published under a Creative Commons CC BY 4.0 license, which permit the free download, distribution, and reuse, provided that the author and preprint are cited in any reuse.


