
Submitted:
21 July 2025
Posted:
22 July 2025
You are already at the latest version
Abstract
Banana (Musa AAA) can be affected by maturity bronzing, a physiological disorder that appears in the form of bronzing on the fruit’s epidermis, compromising its quality and generating economic losses due to commercial rejection. Since the symptoms are only evidenced at harvest, it is necessary to identify the associated factors in order to develop preventive strategies. This research analyzed morphometric and nutritional characteristics potentially related to the formation of the stain on two banana-exporting farms in Antioquia and Magdalena (Colombia). Monitoring parcels were established, wherein 120-170 productive units were evaluated over 52 weeks. In all units, the height, the pseudostem perimeter, the weight and number of hands of the bunch, and the weight of the affected fruit were recorded. In addition, foliar and soil analyses were conducted in each production unit, and some climatic components were characterized. Through multiple logistic regression, it was determined that a plant height lower than 3.0 m and a pseudostem perimeter lower than 70 cm (measured at 50 cm from the base) increase the probability of stain formation. On the other hand, foliar B and Zn concentrations higher than 100 and 22.5 mg/kg, respectively, reduced the incidence of this disorder. These findings provide new factors associated with maturity bronzing and open opportunities for future research aimed at its prevention.
Keywords:
maturity stain
; physiological disorder
; pseudostem perimeter
; odds ratios
; logistic regression
1. Introduction
In the global market, musaceae are among the fruits with the highest production, consumption, and commercialization. Within this group, the Cavendish banana, mainly cultivated in tropical and subtropical regions, reaches an annual production volume of approximately 50 million tons [1]. Banana farming for export is one of the main economic activities of the agricultural sector in Colombia, a country that ranks among the most important in the world with regard to banana production and export [2,3]. In 2023, approximately 106 million boxes (20 kg) were commercialized, amounting to USD $969 million, the average productivity was 2.023 boxes (20 kg) per hectare [4].
However, in banana farming, a diversity of disorders affecting production and quality may appear. One of them is the maturity bronzing (or maturity stain, MB), regarded as a serious problem in several producing regions around the world, including Colombia [5,6,7]. This physiological disorder manifests in the form of a reddish or brown bronzing on the outer surface of the fruit (Figure 1), mostly at the tips of the hands, this is evident at the time of harvest or close to it [5,8,9] This disorder does not affect production or organoleptic quality, but it does considerably affect commercial quality [5], generating significant economic losses [6,7,8]. It has been reported that MB may be visible starting from the ninth week of fruit development, i.e., in the weeks ahead of harvest [8,10], which does not allow for preventive action to reduce losses. Additionally, this is an under-researched issue, and very little is known about its causes and handling [5,7,11].
The causes of MB are still unknown. Its symptoms seem to be the result of an undefined stress on the outer layers of the banana fruit epidermis, followed by a rapid fruit growth and expansion. This condition has also been associated with water deficits at the time of bunch emergence during periods of rapid growth in humid and warm climates [5,8,9]. It has also been reported that MB is associated with calcium (Ca) deficiencies during the floral differentiation of the apical meristem, which triggers a decline in quality [6,7,8,9,11,12]. The relationship between the symptoms and Ca is presumed based on the structural role of this nutrient in membranes [13]; as deficiencies manifest in the fruits, the membranes lose their ability to expand, and they disintegrate easily [7,14]. [8] and [10] report that MB may be related to the climate, Ca, and the diameter of the fruit fingers. This indicates that the possible causes of MB are diverse and complex, as they at least involve the climate, mineral nutrition, and the morphometric characteristics of the fruit
Mineral elements availability is one of the reasons associated with low yields. Hence, nutrition is one of the most important factors in increasing the production and quality of a crop, in order to obtain bunches with the conditions and characteristics demanded by the international market [15,16]. In this sense, research on mineral nutrition and fertilization issues is a priority in banana farming [3,9].
In light of the above, the objective of this research was to evaluate the incidence of MB in two banana-exporting regions of Colombia, i.e., the departments of Antioquia (Urabá) and Magdalena. This, in relation to the nutritional content of the foliar tissue, crop morphometric variables, and some climatic variables.
2. Materials and Methods
2.1. Location and Sampling of the Productive Units
This study was carried out on two banana farms (Musa AAA, Cavendish cv. Williams subgroup). The first unit, meant for monitoring and evaluation, was established on the San Bartolo farm, located in the municipality of Chigorodó, department of Antioquia (coordinates: 7.7073951, -76.7103789), at an altitude of 31.34 MASL. On plots 10 and 11, the parcels San Bartolo-1 (SB1) and San Bartolo-2 (SB2) were established, where 67 and 69 productive units (PUs) were evaluated. The evaluation was carried out between week 33 of 2018 and week 34 of 2019. During this period, 11 samplings were conducted, separated by approximately five weeks. The second unit was set up on the California farm, located in the municipality of Zona Bananera, in the township of Guacamayal, in the department of Magdalena (coordinates: 10.7654281, -74.2000294), at an altitude of 30.21 MASL. On plot 10, two monitoring and experimentation parcels were established, i.e., California-1 (C1) and California-2 (C2), where 89 and 85 PUs were evaluated. Monitoring was carried out between week 37 of 2018 and week 35 of 2019, during which eight sampling were performed, separated by about six weeks. Monitoring and sampling were carried out for each PU, which comprised the plant with the bunch, known as the mother plant or the main plant, and the other developing plant called the sucker, which stems from a lateral bud. Each PU underwent monitoring throughout the evaluation period. Once the mother plant had been harvested, the sucker was coded. The emerging bunch of the mother plant was marked on the stem until harvest, with the purpose of identifying the PU of origin of each bunch during postharvest.
2.2. Monitoring Variables
In each sampling, all the PUs in each parcel were evaluated. Once the mother plant had been harvested, measurement proceeded with the sucker. Additionally, during postharvest, the harvested bunch was evaluated along with its origin identification. In each case, plant height (H) was measured from the pseudostem base on the ground to the vertex formed by the union of the last pair of leaves, using a rigid measuring tape with 1 mm accuracy; as well as the pseudostem perimeter (P50) from the base on the ground, by means of a flexible tape measure with 1 mm accuracy. When the plant was less than 50 cm in total height, no records were taken [17]. Moreover, the phenological stage of each plant in the PU was recorded according to its morphological aspects [18,19]. The classification was as follows: a) vegetative dependent: plants before F10; leaves narrower than 10 cm, not yet photosynthetically active; b) vegetative independet: plants after F10 and before apical meristem differentiation; photosynthetically active plants; c) reproductive: plants after apical meristem differentiation, inflorescence already developed, emerging through the pseudostem; d) productive: plants that have already developed inflorescence.
Afterwards, a foliar analysis was conducted while following the procedure described by [20]. For leaf no. 3, the following composition was determined: copper (Cu), iron (Fe), manganese (Mn), Zn, boron (B; mg/kg), Ca, magnesium (Mg), potassium (K), and sodium (Na) (%). Samples were taken at the onset of flowering (beginning of the productive stage), on the first week after the emergence of the inflorescence (bunch) and prior to bract drop, at which time sampling for soil analysis was also carried out. For said analysis, a 500 g sample was taken from the PU when the inflorescence emerged apically, following the methodology by [20]. Samples were taken when flowering coincided with the sampling week. In this analysis, the following physicochemical properties were determined: texture: sand (A %), silt (L %), clay (AR %), pH, organic matter (%), aluminum (Al), Ca, Mg, K, Na, cation exchange capacity (CEC), phosphorus (P), sulfur (S), Fe, Mn, Cu, Zn, and B. Table 1 presents the results of the soil analysis, averaged from 18 samples taken from California farm and 24 from San Bartolo
Another was associated with the bunches during postharvest, which were harvested ten weeks after emergence. The weight of each bunch (kg) was recorded, as well as the number of hands, and the location where fruits with MB were found. Figure 1 (left) shows a bunch with six hands, which exhibits lesions caused by this physiological disorder on hands no. 1, 2, and 3, as well as fruits with the typical bronzing generated by MB (right).
To relate the presence or absence (P/A) of MB to certain morphometric variables, the cross-sectional area of the pseudostem (AS50) at 50 cm from the base on the ground, with which the total leaf area of the plant was estimated, according to the model proposed by [17]. Finally, climatic data corresponding to the areas surrounding the studied farms were recorded. This information was compiled from two automatic meteorological stations belonging to the Institute for Hydrology, Meteorology, and Environmental Studies (IDEAM), namely: Chigorodó station (code 12015110) for San Bartolo farm and Paldema station (code 12015110) for California farm. During this recording process, daily data were captured which included the total precipitation of the day (mm), and the maximum air temperature (°C) at a 2 m height.
2.2. Monitoring Variables
First, a descriptive analysis of each plot was conducted in order to explore the possible association between the described variables, separating them based on the P/A of MB per farm. In addition, the average weight of the bunches with and without MB in each of the parcels was calculated. Statistics of the nutrient concentration in the foliar tissue were also calculated, which turned out to be of interest during modeling. As for soil analysis, only the laboratory results were described. A multiple logistic regression model [21] was employed to analyze the relationship between the response variable (P/A of MB) and different sets of explanatory variables. Independent models were developed for morphometric and production variables, as well as a global model for the foliar content of the most relevant mineral elements associated with the formation of MB.
Considering the set of p explanatory variables denoted by the transposed vector T = ( 1, 2, . . ., p), and assuming that the conditional probability of the response being present (presence of MB) is Pr(Y = 1| ) = π(), the logit of the multiple logistic regression is given by the Equation (1):
Where represent the coefficients associated with each explanatory variable in .
The logistic model considers the following epidemiological framework: the variables in have been observed in the studied PUs, for which the state of the physiological disorder is determined as Y= 1 if there is presence of MB. Conversely, the value is 0 in the absence of MB. The modeled probability is expressed via a conditional probability statement: Pr(Y = 1| ) = π().
To facilitate the interpretation of the model’s results, odds ratios were introduced, allowing for a quantitative evaluation of the effect of each explanatory variable. Particularly, the odds ratio of the response in with respect to (thus comparing both farms) was estimated while keeping the remaining model variables constant. This was expressed via the Equation (2):
The odds ratio obtained represents the ratio of the response’s probability of occurrence on California farm in comparison with San Bartolo farm. Based on the probabilistic predictions generated by the model, graphs were constructed which described the variation in the response probability as a function of different scenarios. These scenarios were selected while considering variables that met the model’s assumptions of linearity and fit. Initially, a specific model for the morphometric and production variables was adjusted, as this database was independent of that corresponding to the mineral element content in the foliar tissue. In this first model, the analysis was performed individually for each farm, given that it was impossible to obtain an adequate fit when incorporating the effect of the farms as covariables. The variables that were finally included in the model were the cross-sectional area, the estimated leaf area, the bunch weight, and the quasi-surface (defined as the product between the pseudostem perimeter at 50 cm and the total plant height).
In the subsequent modeling phase, using data on the mineral elements in the tissue, the model’s stability (i.e., the suitability of the fit and the statistical effects) allowed grouping both farms, although, in the end, this effect was left out of the model. The variables selected for this model were the concentrations of Ca, Mg, Zn, and B in the foliar tissue.
The analyses were conducted using the R software [22]. Initially, purely additive structures were adjusted in all models, followed by models incorporating interactions between covariables. This allowed evaluating the combined effect of the variables and optimize the model’s fit. The goodness of fit was determined using the Hosmer-Lemeshow test [23].
3. Results
Next, the results regarding the variables with more explanatory value in the formation of MB are presented, addressing both their descriptive characterization and their inferential component. We incorporated information regarding morphometry, production, the mineral elements in the foliar tissue, and the climate in the regions where the two studied farms were located. Table 2 summarizes the descriptive statistics of the variables that were later included in the multiple logistic regression model, differentiated by farm and the P/A of MB. These variables were the height of the main plant (mother plant, H), the pseudostem perimeter at 50 cm (P50), the cross-sectional area of the pseudostem (SA50), the estimated leaf area (LA50) [17], and the bunch weight (WB).his section may be divided by subheadings. It should provide a concise and precise description of the experimental results, their interpretation, as well as the experimental conclusions that can be drawn.
As observed in Table 2, when comparing each variable in terms of the P/A of MB within each farm, all the coefficients obtained were higher than 1. This indicates that the formation of MB is associated with lower values in comparison with cases where the disorder is absent, evidencing a reduction in all the averages of the evaluated variables.
Table 3 presents the average weight values for the fruits affected by MB in each parcel of the California and San Bartolo farms. Only the weight of the rejected fruits is reported, i.e., those that could not be commercialized due to peel bronzing, without considering the total bunch weight.
Table 4 presents the distribution of the foliar contents in the same groups analyzed in Table 2. As with the previously reported morphometric variables, the quotients of the concentrations of Ca, Mg, Zn, and B in the foliar tissue were higher than 1 in both farms, which suggests an association between the formation of MB and a lower concentration of these elements, among which B exhibited the most significant variation in both farms, at approximate ratios of 1.4 in California and 1.2 in San Bartolo. These results indicate that the most pronounced changes and the direct response in the manifestation of the disorder could be closely related to the concentration of this element in the foliar tissue.
To generate the results of the modeling, we started with an individual adjustment for each farm, as it was not possible to establish a single usable model that incorporated the effect of the farm factor (this, due to the violation of assumptions). Table 5 presents the modeling results after the selection of the variables that allowed validating the fit for both farms. It can be observed that all the included coefficients provided sufficient statistical evidence to be considered non-null, which indicates that these variables explained the P/A of MB on each farm under the evaluated conditions.
The models adjusted for each farm did not exhibit overdispersion, as indicated by the relationship between the residual deviance and the degrees of freedom (California 292.05/330=0.885; San Bartolo 285.90/289=0.989). The Hosmer-Lemeshow test supported the hypothesis of a good model fit (California: p=0.2077; San Bartolo: p=0.4423; eight degrees of freedom) [24]. Based on these results, the probabilities of each observation were estimated, and dispersion diagrams for the explanatory variables in Table 3 and Table 4 were generated, along with the probability of MB P/A.
Figure 2 presents the results obtained for the California farm, evidencing that the highest probabilities for the formation of MB are associated with reduced values regarding SA50, LA50, WB, and the so-called quasi-surface variable, which is defined as the product between the pseudostem perimeter and the total plant height.
Figure 3 presents the results obtained for the San Bartolo farm, evidencing that the highest probabilities of MB occurrence are once again associated with reduced values for the previously described variables (Figure 2).
The results of the nutritional content modeling, which used an independent database, are presented below. Although multiple variables were evaluated (as listed in the methodology section), we only report those that allowed for model with good fit and whose coefficients and significance level were relevant given their potential contribution to new findings. In this analysis, the farms were not differentiated, and the data were processed jointly, initially including the farm factor. However, this factor was excluded from the model, since no statistical evidence was found which suggested meaningful differences (Table 6).
In Table 6, only the coefficients corresponding to B and Zn provided sufficient statistical evidence to be considered non-null, which indicates that these elements could explain, under the evaluated conditions, the P/A of MB. In addition, the results showed no overdispersion, as the relationship between the residual deviance and the degrees of freedom was 66.045/57 = 1.16. The Hosmer-Lemeshow test supported the hypothesis of an adequate model fit (p=0.2621; eight degrees of freedom). Four mineral elements essential for cultivation were included, which, from a modeling perspective, fulfilled the assumptions required for the application of this approach.
Figure 4 illustrates the relationship between the P/A of MB and the probabilities estimated based on the model. In the case of B (Figure 4A), the formation of MB occurs along with foliar concentrations lower than 100 mg/kg, with probabilities higher than 50% when the levels fall below 80 mg/kg. As for Zn (Figure 4B), although the disorder is observed within the 15-35 mg/kg range, its occurrence is higher when the concentrations are lower than 25 mg/kg.
Although Ca and Mg were not incorporated into the final model, their corresponding estimated probabilities were related as a function of their concentration to identify possible ranges associated with the formation of the analyzed physiological disorder. Figure 5 presents the relationship between these elements and the P/A of MB, highlighting their relevance in the discussion.
In logistic regression models, the odds ratios construction allows comparing different scenarios. In this context, based on the adjusted model of each farm, the odds ratio for the P/A of MB was calculated while following a procedure similar to that described in Equation (2). To this effect, the models for the California farm and for the San Bartolo farm were defined, both dependent on the same explanatory variables. Using the information in Table 3, and considering , the ratio was expressed in Equation (3):
Considering for the WB (kg) and for the quasi-surface (cm2) (values observed in the data) yields and . Thus, the odds ratio for the California farm is= 0.0999, approximately 0.1 (1/10), which indicates that, under these conditions, the probability of MB not forming is ten times greater than that of the disorder manifesting. On San Bartolo farm, the odds ratio is , which is close to 0.9 (1/10), suggesting a ratio of 10:9 in favor of the absence of MB. These results indicate that, considering the analyzed morphometric and production conditions, the probability of the disorder appearing is higher on the California farm (Magdalena) than on San Bartolo (Antioquia).
Table 7 presents the behavior of the analyzed climatic variables for the years 2018 and 2019. This includes the precipitation mean and range (minimum/maximum values in parentheses), and temperature, recorded at the hydrometeorological stations of IDEAM that were closest to the farms.
The data in Table 7 evidence differences in the precipitation and temperature conditions of the California and San Bartolo farms between 2018 and 2019. On California farm, between November and May 2018, the mean precipitation was 138.5 mm, whereas, between June and October, this value decreased to 1.5 mm. Temperatures remained high in both periods, with mean values of 31 °C. In contrast, on San Bartolo farm, the mean precipitation for 2018 was lower than that on California farm. The temperatures were moderate, with a mean of 27.8 °C in the first period and 24 °C in the second one. During the last period of 2018 and the first one of 2019, the precipitation on California farm continued to decrease, while the temperature remained at a mean close to 33.5 °C. On San Bartolo, the mean precipitation was higher, reaching 144.4 and 188.7 mm, with temperatures lower than those observed on California farm, oscillating between 27.0 and 26.0 °C.
4. Discussion
Regarding the morphometric variable, the results presented in Figure 4 and Figure 5 evidence that, as the SA50, the leaf area, and the ratio between plant height and pseudostem perimeter increase, the probability of MB occurrence decreases. This set of variables shows a close relationship with the structure and development of the plant and are related to the vigor of the plantation, to the extent that a larger leaf area is associated with a thicker pseudostem, given the overlapping of the leaf sheaths that make up its structure [25]. This growth takes place in a continuous fashion, allowing the plant to reach its maximum height with the apical emission of inflorescence, which indicates a better nutritional status. The interaction between pseudostem size and leaf area directly influences the plant’s physiological processes [12,19,26,27].
The increase in leaf area stimulates transpiration and nutrient absorption by optimizing the capture of photosynthetically active radiation, thereby promoting photosynthesis [28,29]. Moreover, increasing the transpiration surface favors mineral transport from the roots to the upper organs of the plant [12,19,30]. However, the absorption and distribution of nutrients and photoassimilates are affected by a diversity of interactions in the plant. In banana cv. Hartón (Musa AAA), a positive linear relationship between yield and leaf number [31], which suggests that leaf morphology is closely linked to assimilation efficiency.
The efficient transport of nutrients such as Ca and B is essential for maintaining the nutritional balance of banana plants and reducing the incidence of physiological disorders [5,12,13,14,29]. The results suggest that the possibility of the development of this disorder may be related to plant morphometric parameters such as pseudostem thickness and leaf area (Figure 2 and Figure 3). These parameters are directly linked to the transport of photoassimilates and water through the plant [28,29,32], which influences the adequate partition of assimilates during fruit formation [33]. Under limited conditions, this may lead to changes in epicuticular morphology, causing cell membranes to collapse, with the subsequent oxidation of intracellular fluids, giving rise to the maturity stain [34,35].
Figure 2C and Figure 3C also show that a lower WB is related to a higher probability of MB formation. This result agrees with that reported by [36], who identified an increase in incidence and damage severity in bunches with a lower number of hands and lower weight. The WB reflects both the size and the density of the fruit [30,32,36]. The bunch acts as a reservoir for the photo assimilates generated by the plant during the vegetative growth phase. Nevertheless, the formation of inflorescences occurs during the transition between the vegetative and reproductive phases with meristematic differentiation and cell specialization, which are key processes in fruit development [19]. Therefore, the focus on the relationship between WB and the incidence of this physiological disorder could be reoriented towards the selection of banana plants with a higher capacity in their storage organs, as well as towards a more efficient translocation of photoassimilates and the improvement of the radical system’s health and the soil’s nutrient absorption [37]. These characteristics would improve plant resistance, which could in turn influence the formation of the physiological disorder studied.
As for the foliar concentration of B, Figure 4A presents the distribution of the probabilities estimated by the model for the P/A of MB as a function of the changes in the concentration of said nutrient. When the foliar concentration of B is lower than 100 mg/kg, most cases with MB are observed, with a probability greater than 0.25 that the disorder will occur. Nevertheless, some cases without MB are also within this range. When considering a higher probability threshold (e.g., higher than 0.5), the concentration of B descends to 70 mg/kg, suggesting that foliar levels of B lower than 100 mg/kg increase the probability of MB. On the contrary, as the concentration of B approaches or surpasses the sufficiency levels, according to [38], the probability of this physiological disorder’s development is reduced. This behavior can be attributed to the essential role played by B in key stages of plant development, particularly during the apical meristem’s transition from the vegetative to the reproductive stage, the formation and initial growth of the fruit, and the transition towards the reproductive phase [19,30,32,38,39].
B plays an essential role in cell division and formation, in cell wall stabilization, and in maintaining the structural integrity of tissues. Furthermore, it is necessary for the correct functioning of the plasma membrane and the incorporation of components such as lignin and hemicellulose into the cell walls. Consequently, a deficiency of B may generate an increase in cellular permeability, compromising membrane stability and favoring the degradation of cell structures [14,30,40,41,42], conditions which may be related to the appearance of the physiological disorder observed in the fruit. This suggests that reduced concentrations of B in the foliar tissue may negatively affect the cohesion of epidermal cells, which could favor the intracellular cracking of the banana peel, thus evidencing the characteristic symptom of the damage in fruits with MB, as described by [10]. B also influences the oxidation of phenols, a type of compound that may affect the fruit and contribute to aging and deterioration processes, so an adequate supply of B can mitigate these negative effects, thereby ensuring quality [26,40,43]. The above suggests that managing nutrition with B during the critical stages of fruit development, such as meristem differentiation [19], could constitute a strategic approach to minimize the prevalence and incidence of MB. In plantains (Musa AAB), it has been documented that reductions in the availability of B significantly affect fruit filling, causing malformations in the fingers, premature maturation, and size reduction, which negatively impacts quality and productivity [44]. More recent research on Berangan bananas (Musa AA) has demonstrated that the foliar application of B to the bunch, both at the opening of the last hands and at 30 days, increases the WB and improves the yield [45]. A similar effect has been reported in apples after the application of Ca and B during the first five to six weeks [40], which is attributed to the role of B in the absorption and mobility of Ca [14,30,39]. These findings support the hypothesis that the application of soluble Ca could help to reduce the incidence of MB, as suggested by previous banana studies [7,27,46,47].
Figure 4B presented the relationship between the probability of the P/A of MB and the concentration of Zn in the foliar tissue. Although the response is not as evident as in the case of B (Figure 4A), it was observed that most of the bunches affected by MB exhibited lower concentrations of foliar Zn, specifically when this value was lower than 22.5 mg/kg here, the probability of MB appearance was higher than 0.5. This finding suggests that Zn concentrations below this threshold could be associated with a greater presence of MB. It should be highlighted that the 21-35 mg/kg range is considered high according to the classification established by [48]. The relationship between Zn and MB reduction could be attributed to the key role of this element in photosynthesis, in carbohydrate synthesis, and in the conversion of sugars into starch, as well as in the biosynthesis of tryptophan, a precursor of auxins (AIA), i.e., the hormones regulating cell division and elongation, which influences the size, shape, and overall development of the fruit [14,29,49]. In this context, Zn deficiencies could compromise bunch growth and cause abnormalities [38,48,50,51].
The results described regarding the effect of B and Zn in the formation of MB must be interpreted while considering the high positive correlation between both nutrients in bananas [52]. The evidence suggests that the combined supplementation of Zn and B in commercial production systems improves yields [53]. In Figure 4, it was observed that, when the foliar concentration of these nutrients surpasses the adequate threshold and falls within a high range [48], the prevalence of MB decreases, which suggests an optimal nutritional threshold to mitigate this physiological disorder. Our results represent the first scientific report relating the formation of MB to low foliar concentrations of B and Zn.
On the other hand, although Ca and Mg were not incorporated into the model, the relationship between the estimated probabilities of each observation and the values for this element was evaluated, with the purpose of describing the ranges that could be associated to the physiological disorder under study, as is shown in Figure 5. An imbalance in nutrients such as Ca, B, and Zn could destabilize the cell walls, affecting the quality of the fruit and favoring the appearance of physiological disorder, in addition to influencing their severity [6,7,27,54].
The differences in the climatic factors presented in Table 7, such as the higher precipitation and moderate temperatures of the San Bartolo farm (Antioquia), could have influenced the amount of fruit lost due to MB. This is reflected on the comparison of scenarios based on the odds ratios, which evidenced a higher probability that the disorder occurs on the California farm. These results coincide with those of diverse authors who have linked low water availability and high temperatures with the formation of MB [6,7,8,9,11].
The findings of this research constitute the first scientific report that establishes a relationship between the maturity stain and multiple factors in a simultaneous fashion, and they add to those previously known [5,7,8]. Among the most relevant morphometric parameters that predispose the formation of the studied physiological disorder, a total plant height lower than 3.0 m, a pseudostem perimeter lower than 70 cm (measured at 50 cm from the base), and foliar concentrations of B and Zn lower than 100 and 22.5 mg/kg were identified
Author Contributions
Conceptualization, A.M. and A.D; methodology, A.M.M., and A.D.; investigation, A.M.M. and A.D., data curation A.D., N.G. and M.F.; compilation and analysis of the results, A.M.M., A.D., N.G. and M.F.; writin original draft preparation, A.M.M and A.D.; writing—review and editing, A.M.M., A.D. and H.E.B. All authors have read and agreed to the published version of the manuscript.
Funding
This research was funded by COLFUTURO.
Data Availability Statement
The original contributions presented in the study are included in the article and Supplementary Materials. Further inquiries can be directed to the corresponding author.
Conflicts of Interest
The authors declare no conflicts of interest.
Abbreviations
The following abbreviations are used in this manuscript:
| MB | maturity bronzing |
| SB1 | San Bartolo-1 |
| SB2 | San Bartolo-2 |
| C1 | California-1 |
| C2 | California-2 |
| PUs | Productive units |
| P/A | Presence or absence of MB |
| H | Height of the main plant (mother plant) |
| P50 | Pseudostem perimeter at 50 cm |
| SA50 | Cross-sectional area of the pseudostem |
| LA50 | Estimated leaf area |
References
- FAO. Banano. Análisis del Mercado 2022. 2023 Roma. Available online: https://www.fao.org/3/cc6952es/cc6952es.pdf (accessed on 13 June 2025).
- Valbuena-Tellez, E. Y.; Patiño-Guio, J. E.; Balaguera-Lopez, H. E. Efecto de la aplicación de 1-MCP y etileno en la maduración y proceso de desverdizado de frutos de banano cv. Barranquillo. Revista U.D.C.A Actualidad & Divulgación Científica 2023, 26. [Google Scholar] [CrossRef]
- García-Guzmán, S. D.; Morales Romero, S. C.; Torres Bazurto, J.; Sánchez, J. D. Relationships between mineral nutrients in banana (Musa AAA Simmonds cv. Williams) bunches fertilized with nitrogen in two production cycles. Agronomía Colombiana, 2021, 39, 234–242. [Google Scholar] [CrossRef]
- AUGURA. Coyuntura Económica 2023. Medellín, Colombia. Available online https://augura.com.co/wp-content/uploads/2024/04/Coyuntura-Bananera-2023.pdf. 2024. [Google Scholar]
- Nelson, S.J.; Pethybridge, S. Banana. In Postharvest Physiological Disorders in Fruits and Vegetables, 1st ed.; Tonetto de Freitas, S., Pareek, S., Eds.; CRC Press: Boca Raton, FL, USA, 2019; pp. 349–375. [Google Scholar] [CrossRef]
- Sánchez, J.; Henao, S.; Betancur, G.; Leiva, A. Efecto de la variabilidad climática sobre el desorden fisiológico mancha de madurez del banano. In XX Reunião Internacional da Associação para a Cooperação em Pesquisa e Desenvolvimento Integral das Musáceas (Bananas e Plátanos). Fortaleza CE, Brazil. 2013. [Google Scholar]
- Díaz, A. , Cayón, G., Mira, J. Metabolismo del calcio y su relación con la “mancha de madurez” del fruto de banano. Una revisión. 2007. Agronomía Colombiana.
- Williams, M. H.; Vesk, M.; Mullins, M. G. Development of the banana fruit and occurrence of the maturity bronzing disorder. Annals of Botany 1990, 65, 9–19. [Google Scholar] [CrossRef]
- Segura, A. Ecofisiologia del Cultivo de Banano, 1st ed.; McGilligan Publishing: Estados Unidos de América, 2025. [Google Scholar]
- Williams, M.; Vesk, M.; Mullins, M. A scanning electron microscope study of formation and surface characteristics of the peel of banana the peel of banana fruit during its development. Botanical Gazette 1989, 150, 30–40. [Google Scholar] [CrossRef]
- Daniells, J.W.; Lisle, A.T.; O’Farrell, P.J. Effect of bunch-covering methods on maturity bronzing, yield, and fruit quality of bananas in North Queensland. Australian Journal of Experimental Agriculture 1992, 32, 121–125. [Google Scholar] [CrossRef]
- Sánchez, J.; Mira, J. Principios para la nutrición del cultivo de banano. Asociación de Bananeros de Colombia – AUGURA: Colombia. 2013. [Google Scholar]
- Jaime-Guerrero, M.; Álvarez-Herrera, J. G.; Fischer, G. Effect of calcium on fruit quality: A review. Agronomía Colombiana 2024, 42, e112026. [Google Scholar] [CrossRef]
- Rengel, Z.; Cakmak, I.; White, P.J. Marschner’s mineral nutrition of plants, 4th ed.; Elsevier: London, UK, 2023. [Google Scholar]
- Bindraban, P.; Dimkpa, C.; Nagarajan, L. Roy, A. Rabbinge, R. Revisiting fertilisers and fertilisation strategies for improved nutrient uptake by plants. Biology and Fertilility of Soils 2015, 51, 897–911. [Google Scholar] [CrossRef]
- Guan, D.-X.; Menezes-Blackburn, D.; Li, G. The Importance of Mineral Elements for Sustainable Crop Production. Agronomy 2024, 14, 209. [Google Scholar] [CrossRef]
- Martínez, A.; Cayón, D.; Darghan, E. Discriminant analysis for estimating meristematic differentiation point based on morphometric indicators in banana (Musa AAA). Agronomía Colombiana 2022, 40, 354–360. [Google Scholar] [CrossRef]
- Borja, W.; Osorio, J.; Herrera, N.; Sánchez, J. Fundamentos en fenología de banano Cavendish (Musa AAA) en cultivo establecido. Boletín Técnico Cenibanano 2018, 1, 1–4. [Google Scholar]
- Robinson, J.C.; Galán, V. Bananas and Plantains, 2nd ed.; Stylus Publishing: Stylus Sterling, VA, USA, 2011. [Google Scholar]
- Lahav, E.; Turner D., W. Fertilización del banano para rendimientos altos. Boletín 7. Instituto de la Potasa y el Fósforo. 1992. [Google Scholar]
- Cox, D.; Snell, E. J. Analysis of Binary Data, 2nd ed. Chapman & Hall: Boca Raton, Fl, USA, 1989.
- R: A language and environment for statistical computing. Available online: https://www.R-project.org/ (accessed on 13 June 2025).
- Hosmer, D. W., Jr.; Lemeshow, S.; Sturdivant, R. X. Applied Logistic Regression, 3rd ed.; John Wiley & Sons: Hoboken, NJ, USA, 2013. [Google Scholar]
- Lindsey, J. K. On the use of corrections for overdispersion. Applied Statistics 1999, 48, 553–561. [Google Scholar] [CrossRef]
- Torres, J.; Sánchez, D. Efecto de dosis de nitrógeno sobre peso de racimo de banano y variables de crecimiento: hacia uso eficiente del nitrógeno. Acorbat Revista de Tecnología y Ciencia 2024, 1, 66–74. [Google Scholar] [CrossRef]
- Meya, A.; Ndakidemi, P.; Mtei, K.; Swennen, R.; Merckx, R. Optimizing soil fertility management strategies to enhance banana production in volcanic soils of the northern highlands, Tanzania. Agronomy 2020, 10, 1–21. [Google Scholar] [CrossRef]
- Ruíz, J. Aplicación al suelo de silicio y calcio para el manejo del desorden fisiológico “Mancha de Madurez” en frutos de banano (Musa AAA) Subgrupo Cavendish cv. Gran Enano. Undergraduate thesis, Universidad de Costa Rica, San Pedro, Costa Rica, 2023. https://repositorio.sibdi.ucr.ac.cr/handle/123456789/20808. [Google Scholar]
- Poorter, H.; Nklas, K.J.; Reich, P.; Oleksyn, J.; Poot, P.; Mommer, L. Biomass allocation to leaves, stems and roots: meta-analyses of interspecific variation and environmental control. New Phytologist 2012, 193, 30–50. [Google Scholar] [CrossRef] [PubMed]
- Taiz, L.; Møller, I.; Murphy, A.; Zeiger, E. Plant Physiology and Development, 7th ed.; Sinauer Associates Inc.: Sunderland, UK, 2023. [Google Scholar]
- Nyombi, K. Diagnosis and management of nutrient constraints in bananas (Musa spp.). In Fruit Crops: Diagnosis and Management of Nutrient Constraints; Srivastava, A. K., Hu, C., Eds.; Elsevier: Amsterdam, Netherlands, 2020. [Google Scholar] [CrossRef]
- Rodríguez, V.; da Silva, A.; Rodríguez, O. Balance nutricional y número de hojas como variables de predicción del rendimiento del plátano Hartón. Pesquisa Agropecuária Brasileira 2005, 40, 175–177. [Google Scholar] [CrossRef]
- Turner, D.; Fortescue, J.; Thomas, D. Environmental physiology of the bananas (Musa spp.). Brazilian Journal of Plant Physiology 2007, 19, 463–484. [Google Scholar] [CrossRef]
- Martínez, A.; Cayón, D. Dinámica del crecimiento y desarrollo del banano (Musa AAA Simmonds cvs. Gran Enano y Valery). Revista Facultad Nacional de Agronomia 2011, 64, 6055–6064. [Google Scholar]
- Daniells, J.W.; Watson, B.J.; O’Farrell, P.J.; Mulder, J.C. Soil water stress at bunch emergence e increases maturity bronzing of banana fruit. Queensland Journal of Agricultural Animal Sciences 1987, 44, 97–100. [Google Scholar]
- Williams, M.; Vesk, M.; Mullins, M. Characteristics of the surface of banana peel in cultivars susceptible and resistant to maturity bronzing. Canadian Journal of Botany 1989, 67, 2154–2160. [Google Scholar] [CrossRef]
- Campbell, S. J.; Williams, W. T. Factors associated with “maturity bronzing” of banana fruit. Australian Journal of Experimental Agriculture 1976, 16, 428–432. [Google Scholar] [CrossRef]
- Stoorvogel, J.J.; Segura, R.A. Nutrition and soil management in banana cultivation. In Achieving Sustainable Cultivation of Bananas; Kema, G. H. J., Drenth, A., Eds.; Burleigh Dodds Science Publishing: Cambridge, UK, 2018. [Google Scholar]
- López, A.; Espinosa, J. Manual de nutrición y fertilización del banano; Instituto de la Potasa y el Fósforo, Casilla Postal: Quito, Ecuador, 1995. [Google Scholar]
- Shetty, G.P.; Meghana, A.; Shetty, M. Calcium and boron: A quality determiner of apple: A review. International Journal of Research in Agronomy 2024, 7, 329–332. [Google Scholar] [CrossRef]
- Pereira, G. L.; Siqueira, J. A.; Batista-Silva, W.; Cardoso, F. B.; Nunes-Nesi, A.; Araújo, W. L. Boron: More than an essential element for land plants. Frontiers in Plant Science 2021, 11, 610307. [Google Scholar] [CrossRef] [PubMed]
- Wimmer, M.A.; Abreu, I.; Bell, R.W.; Bienert, M.D.; Brown, P.H.; Dell, B.; Fujiwara, T.; Goldbach, H.E.; Lehto, T.; Mock, H.P.; et al. Boron: an essential element for vascular plants. New Phytologist 2019, 226, 1232–1237. [Google Scholar] [CrossRef] [PubMed]
- Ganie, M.; Akhter, F.; Bhat, M.A.; Malik, A.R.; Junaid, J.; Shah, M.; Bhat A., H.; Bhat, T.A. Boron – a critical nutrient element for plant growth and productivity with reference to temperate fruits. Current Science 2013, 104, 76–85, https://www.jstor.org/stable/24110665. [Google Scholar]
- Thakur, B.S. Effect of boron on growth, fruit quality and production of apple. Journal of Pharmacognosy and Phytochemistry 2021, 10, 2602–2609. [Google Scholar]
- Bolaños, M.; García, A. Dinámica del boro en un suelo cultivado con plátano (Musa AAB cv. Dominico hartón) en el Quindío, Colombia. INFOMUSA 2002, 11, 30–33. [Google Scholar]
- Izzah, A.H.; Wan-Asrina, W.Y.; Phebe, D.; Nurulhikma, M.I.; Norliza, A.B.; Mohd-Razi, I. Effect of boron application on selected bunch characteristics of Berangan. 15th International Conference of the East and Southeast Asia Federation of Soil Science Societies, Kuala Lumpur, Malaysia, 2022; p. 2. [Google Scholar]
- Abarca, J. Efecto de la fertilización con calcio en la fruta de banano (Musa AAA cv. Gal) para el control de la mancha de madurez. Undergraduate thesis, Universidad de Costa Rica, San Pedro, Costa Rica, 2017. https://repositorio.sibdi.ucr.ac.cr/handle/123456789/4900. [Google Scholar]
- Toro, M. Contenidos nutricionales en frutos de banano (Musa AAA) y su relación con la mancha de madurez. Undergraduate thesis, Universidad Nacional de Colombia, Bogotá DC, Colombia, 2014. [Google Scholar]
- López, A.; Vargas, A.; Espinosa, J.; Vargas, R. Guía de campo. Síntomas de deficiencias nutricionales y otros desórdenes fisiológicos en el cultivo de banano (Musa AAA); Instituto de la Potasa y el Fósforo: Quito, Ecuador, 2001. [Google Scholar]
- Mustaffa, M.M.; Kumar, V. Banana production and productivity enhancement through spatial, waterand nutrient management. Journal of Horticultural Sciences 2012, 7, 1–28. [Google Scholar] [CrossRef]
- Silva-Arero, E.; Cardona, W.; Bolaños-Benavides, M.M.; Morales-Osorno, H. Inyección de nutrientes: una técnica eficiente para incrementar el rendimiento del cultivo de plátano (Musa AAB). Agronomía Mesoamericana 2022, 33, 48192. [Google Scholar] [CrossRef]
- Torres-Bazurto, J.; Magnitskiy, S.; Sánchez, J.D. Accumulation and distribution of micronutrients in banana cv. Williams (Musa AAA Simmonds) with different doses of nitrogen. Revista Colombiana de Ciencias Hortícolas 2021, 15, e11795. [Google Scholar] [CrossRef]
- García-Guzmán, S.; Morales, S.; Torres, J.; Sánchez, J. Relationships between mineral nutrients in banana (Musa AAA Simmonds cv. Williams) bunches fertilized with nitrogen in two production cycles. Agronomía Colombiana 2022, 39, 234–242. [Google Scholar] [CrossRef]
- Ningavva, B.; Hipparagi, K.P.; Paramappa, M.K.; Nadukeri, V.C. Effect of soil application and foliar spray of zinc and boron on quality of ratoon banana cv. Grand Naine under hill zone of Karnataka. Trends in Biosciences. 2014, 7, 3294–3296. [Google Scholar]
- White, P. J.; Broadley, M. R. Calcium in plants. Annals of Botany 2003, 92, 487–511. [Google Scholar] [CrossRef] [PubMed]
Figure 1.
Banana (Musa AAA) bunch with MB (left) and symptoms on the fruit (right).
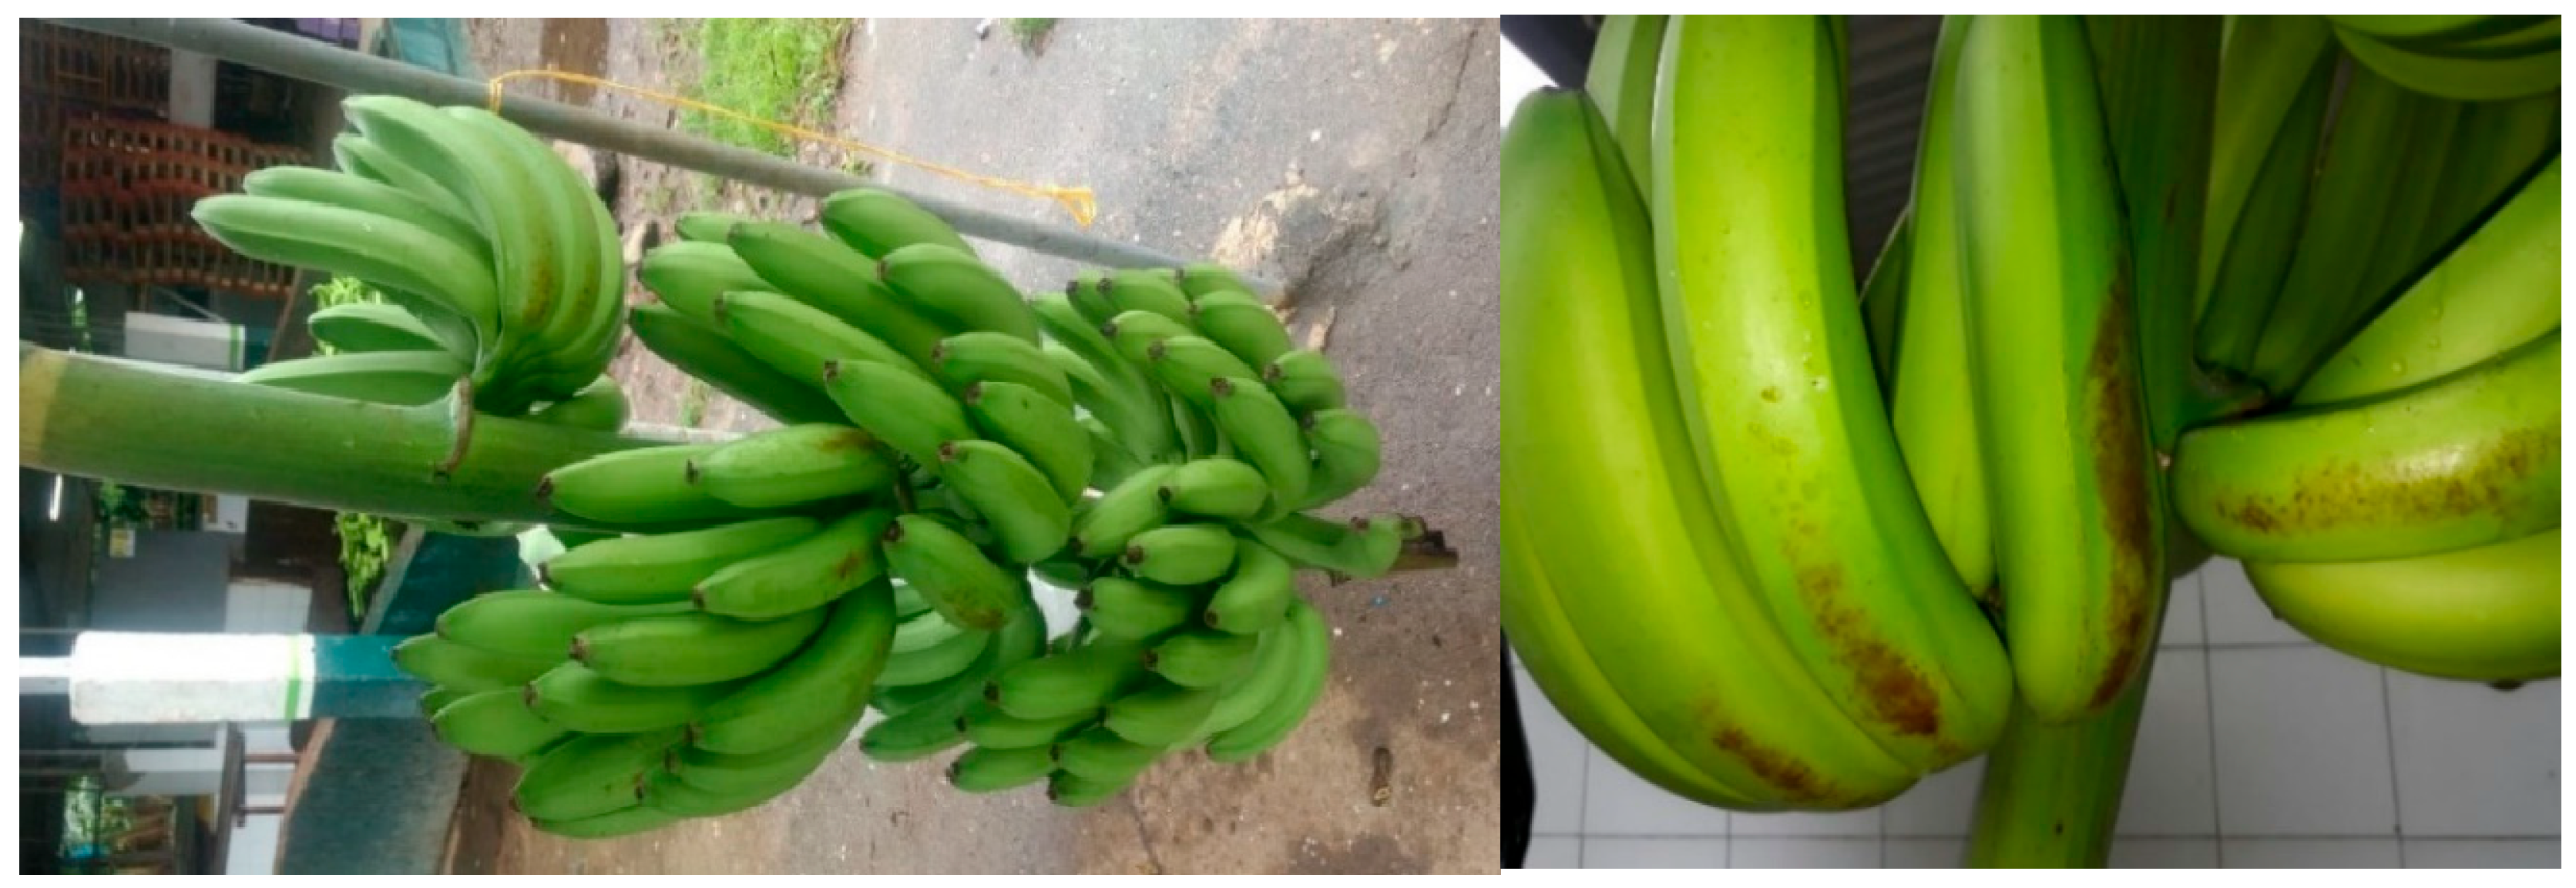
Figure 2.
Estimated probabilities for the P/A of MB in banana bunches on the California farm, as a function of morphometric and production variables.
Figure 2.
Estimated probabilities for the P/A of MB in banana bunches on the California farm, as a function of morphometric and production variables.
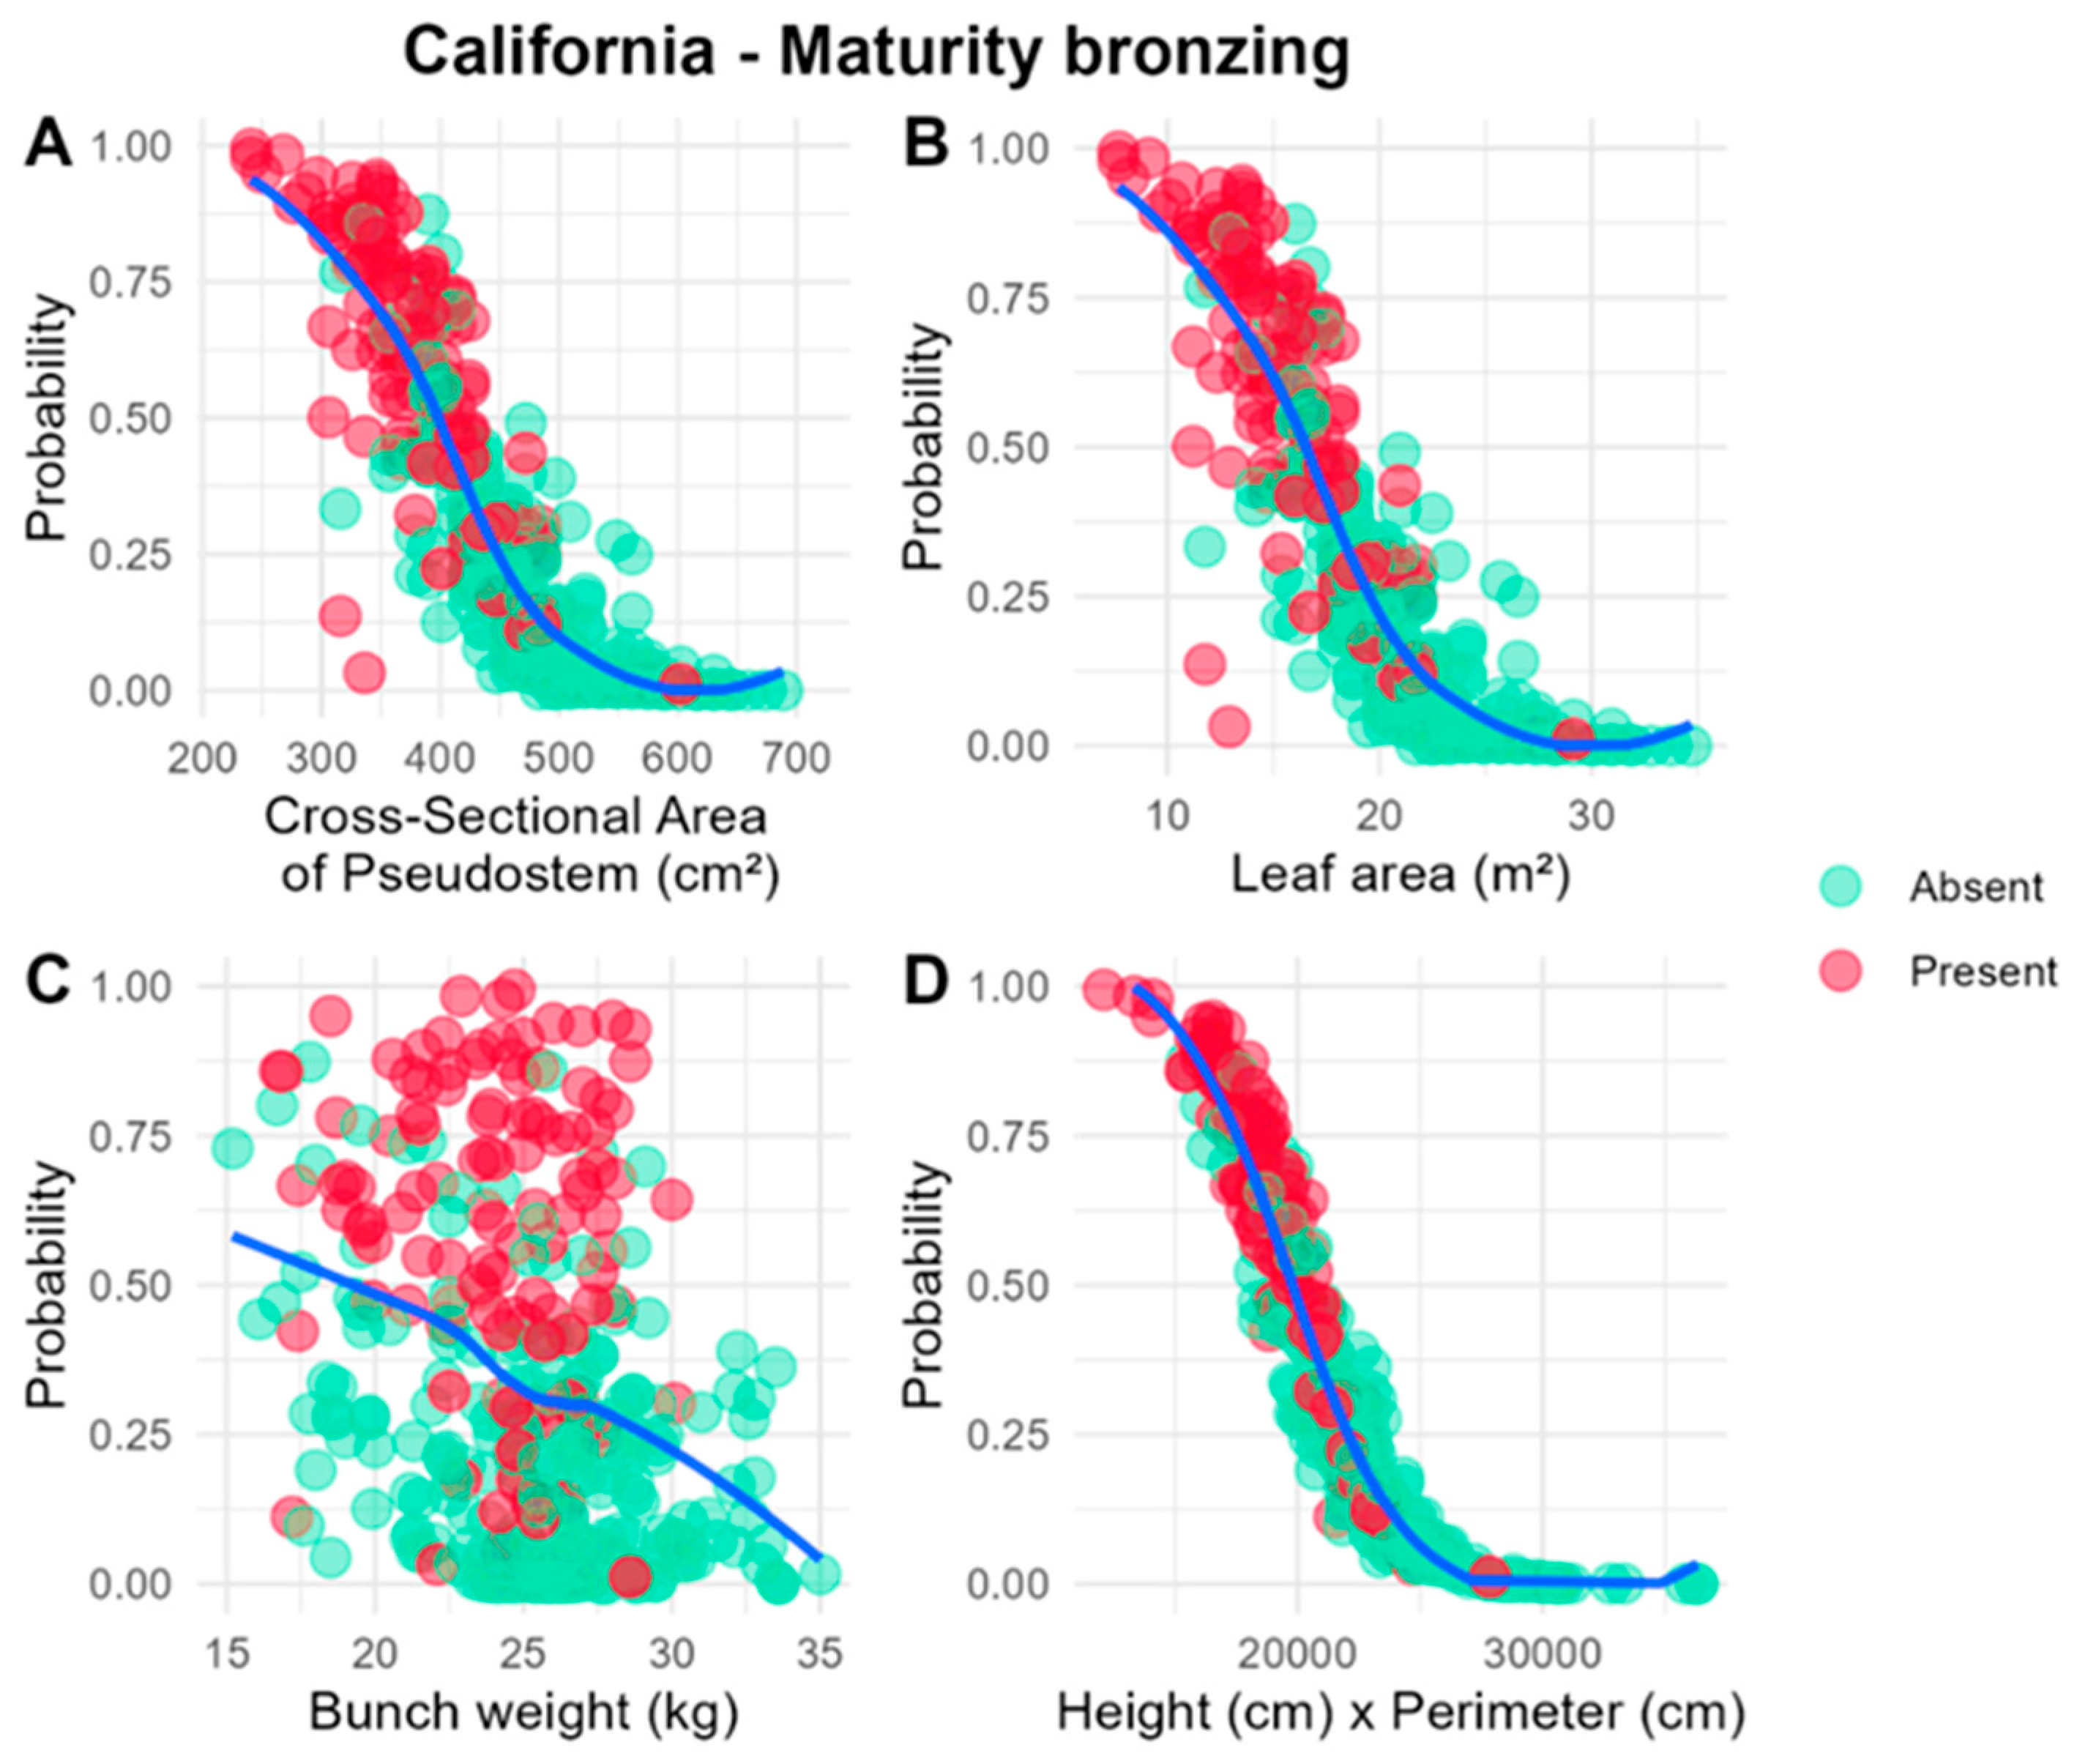
Figure 3.
Estimated probabilities for the P/A of MB in banana bunches on the San Bartolo, as a function of morphometric and production variables.
Figure 3.
Estimated probabilities for the P/A of MB in banana bunches on the San Bartolo, as a function of morphometric and production variables.
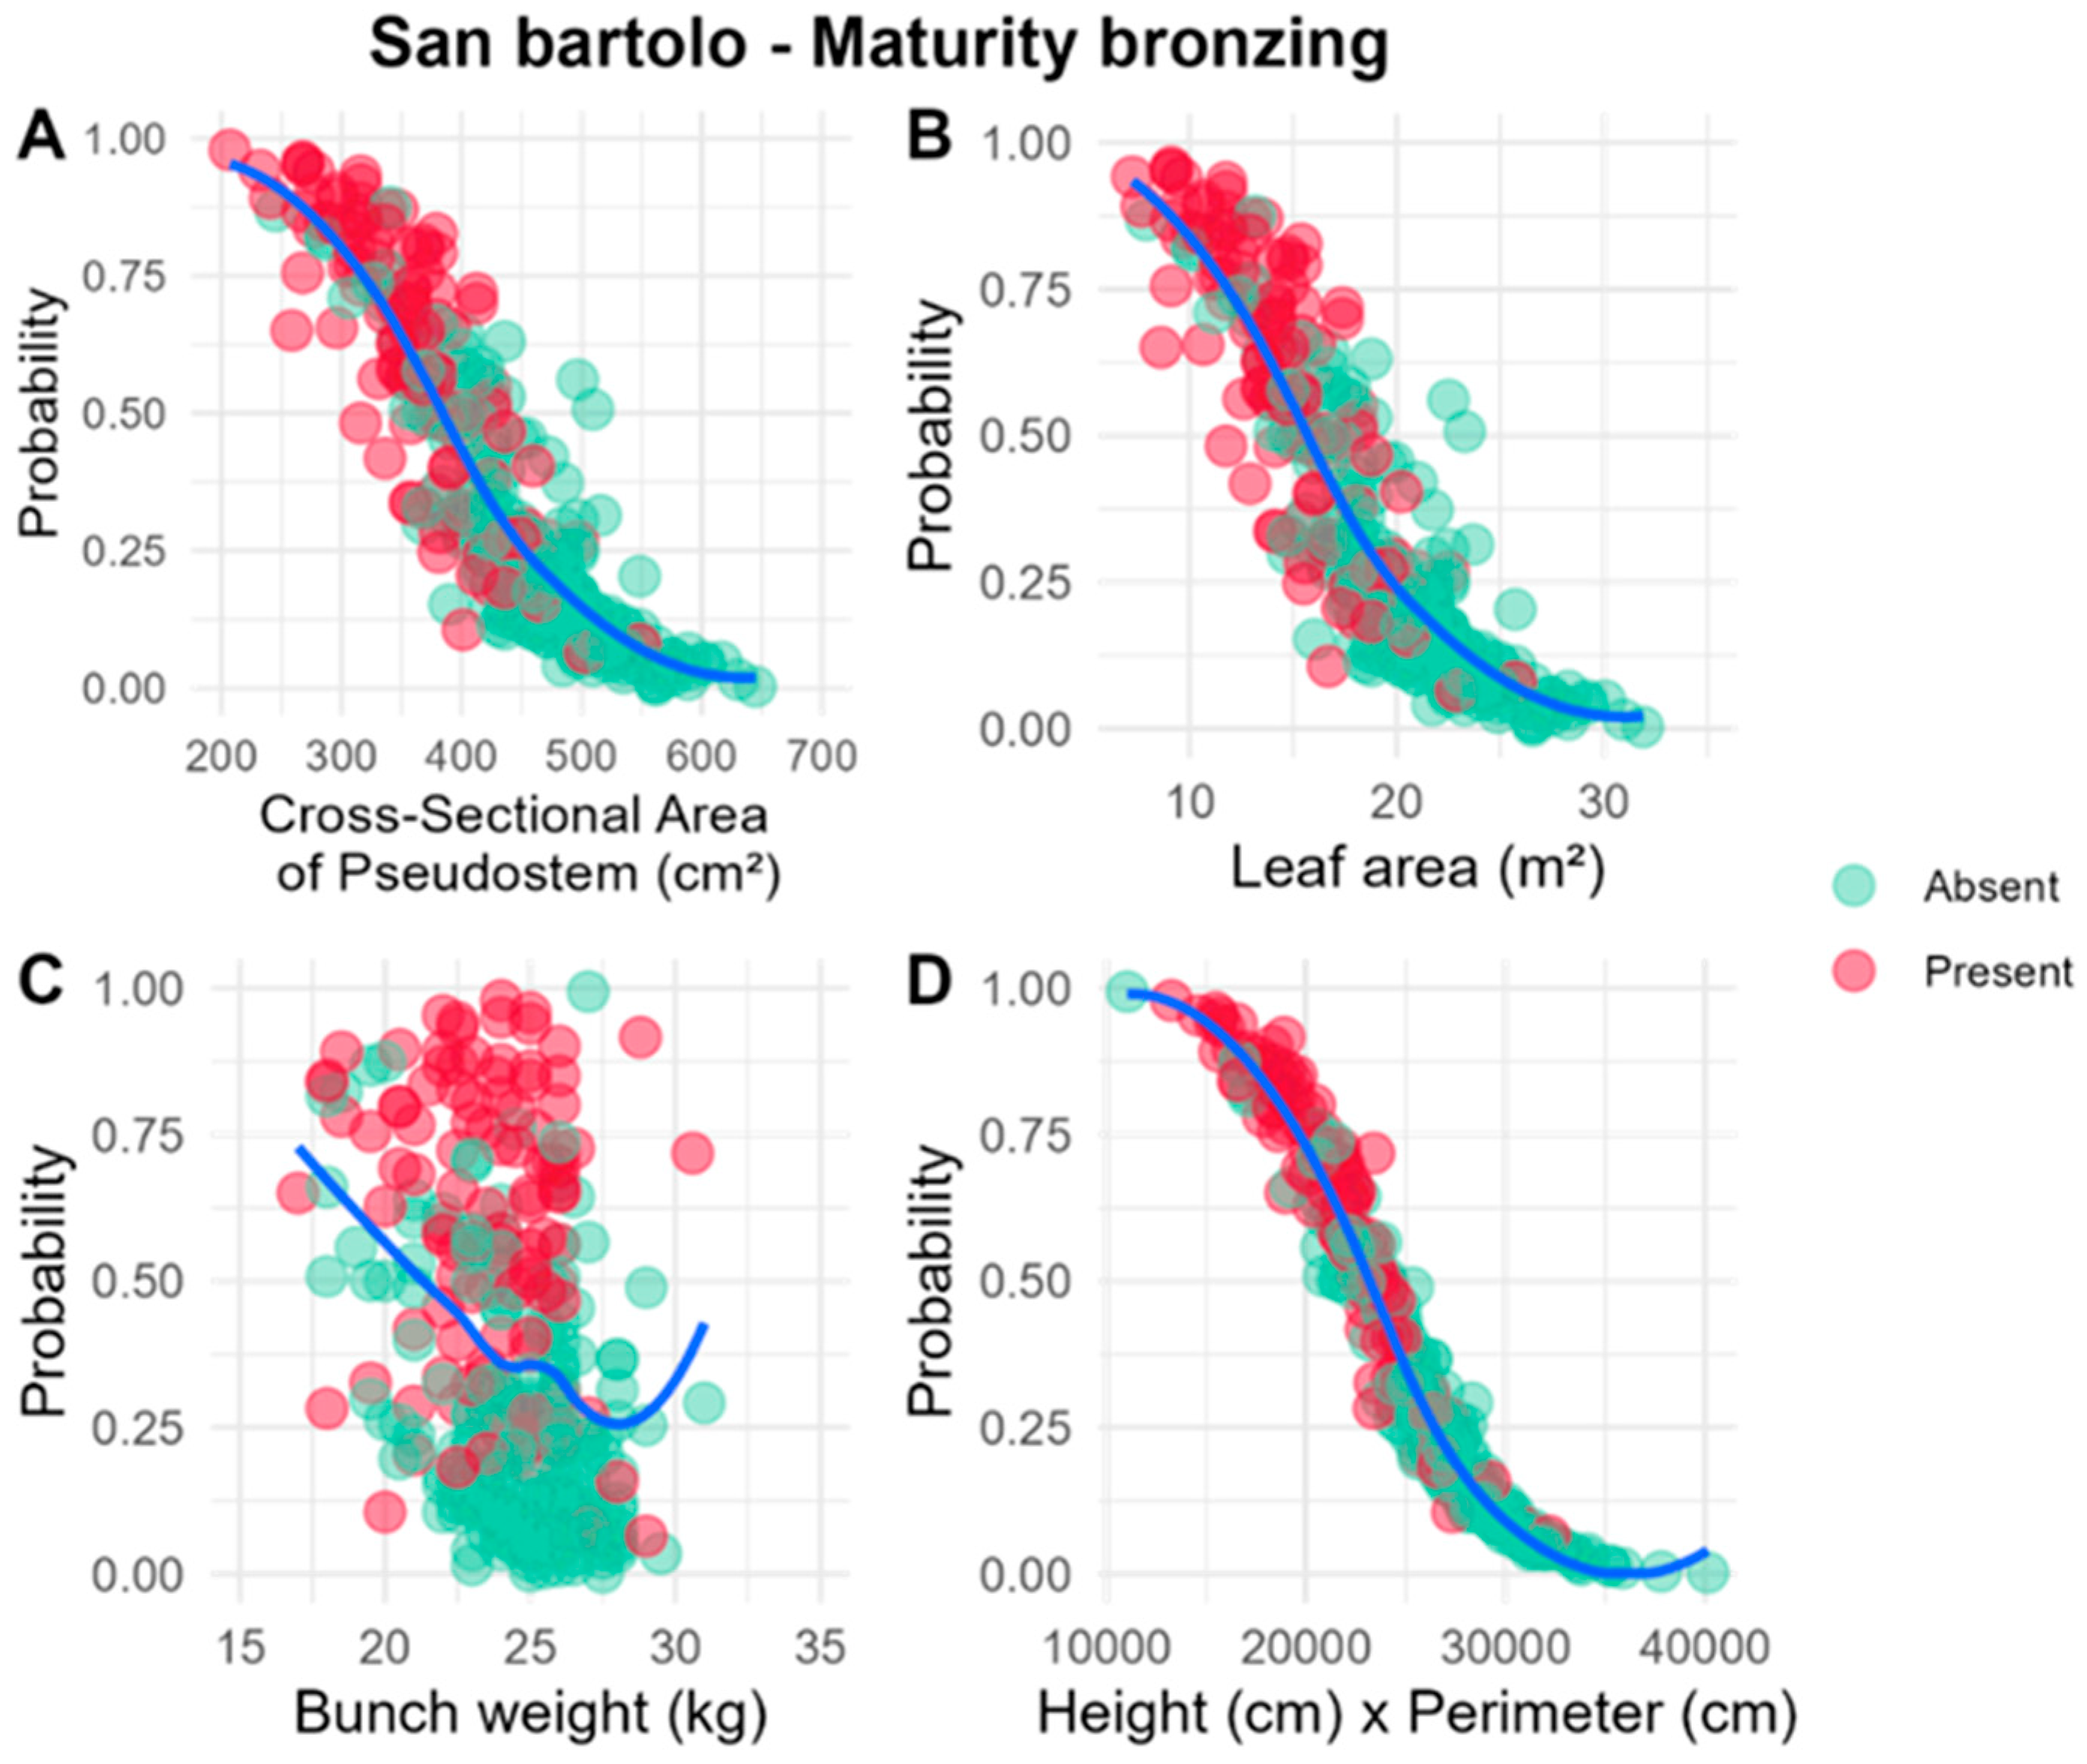
Figure 4.
Estimated probability of the P/A of MB in banana (Musa AAA) bunches, as a function of the concentration of B (A) and Zn (B) in the foliar tissue.
Figure 4.
Estimated probability of the P/A of MB in banana (Musa AAA) bunches, as a function of the concentration of B (A) and Zn (B) in the foliar tissue.
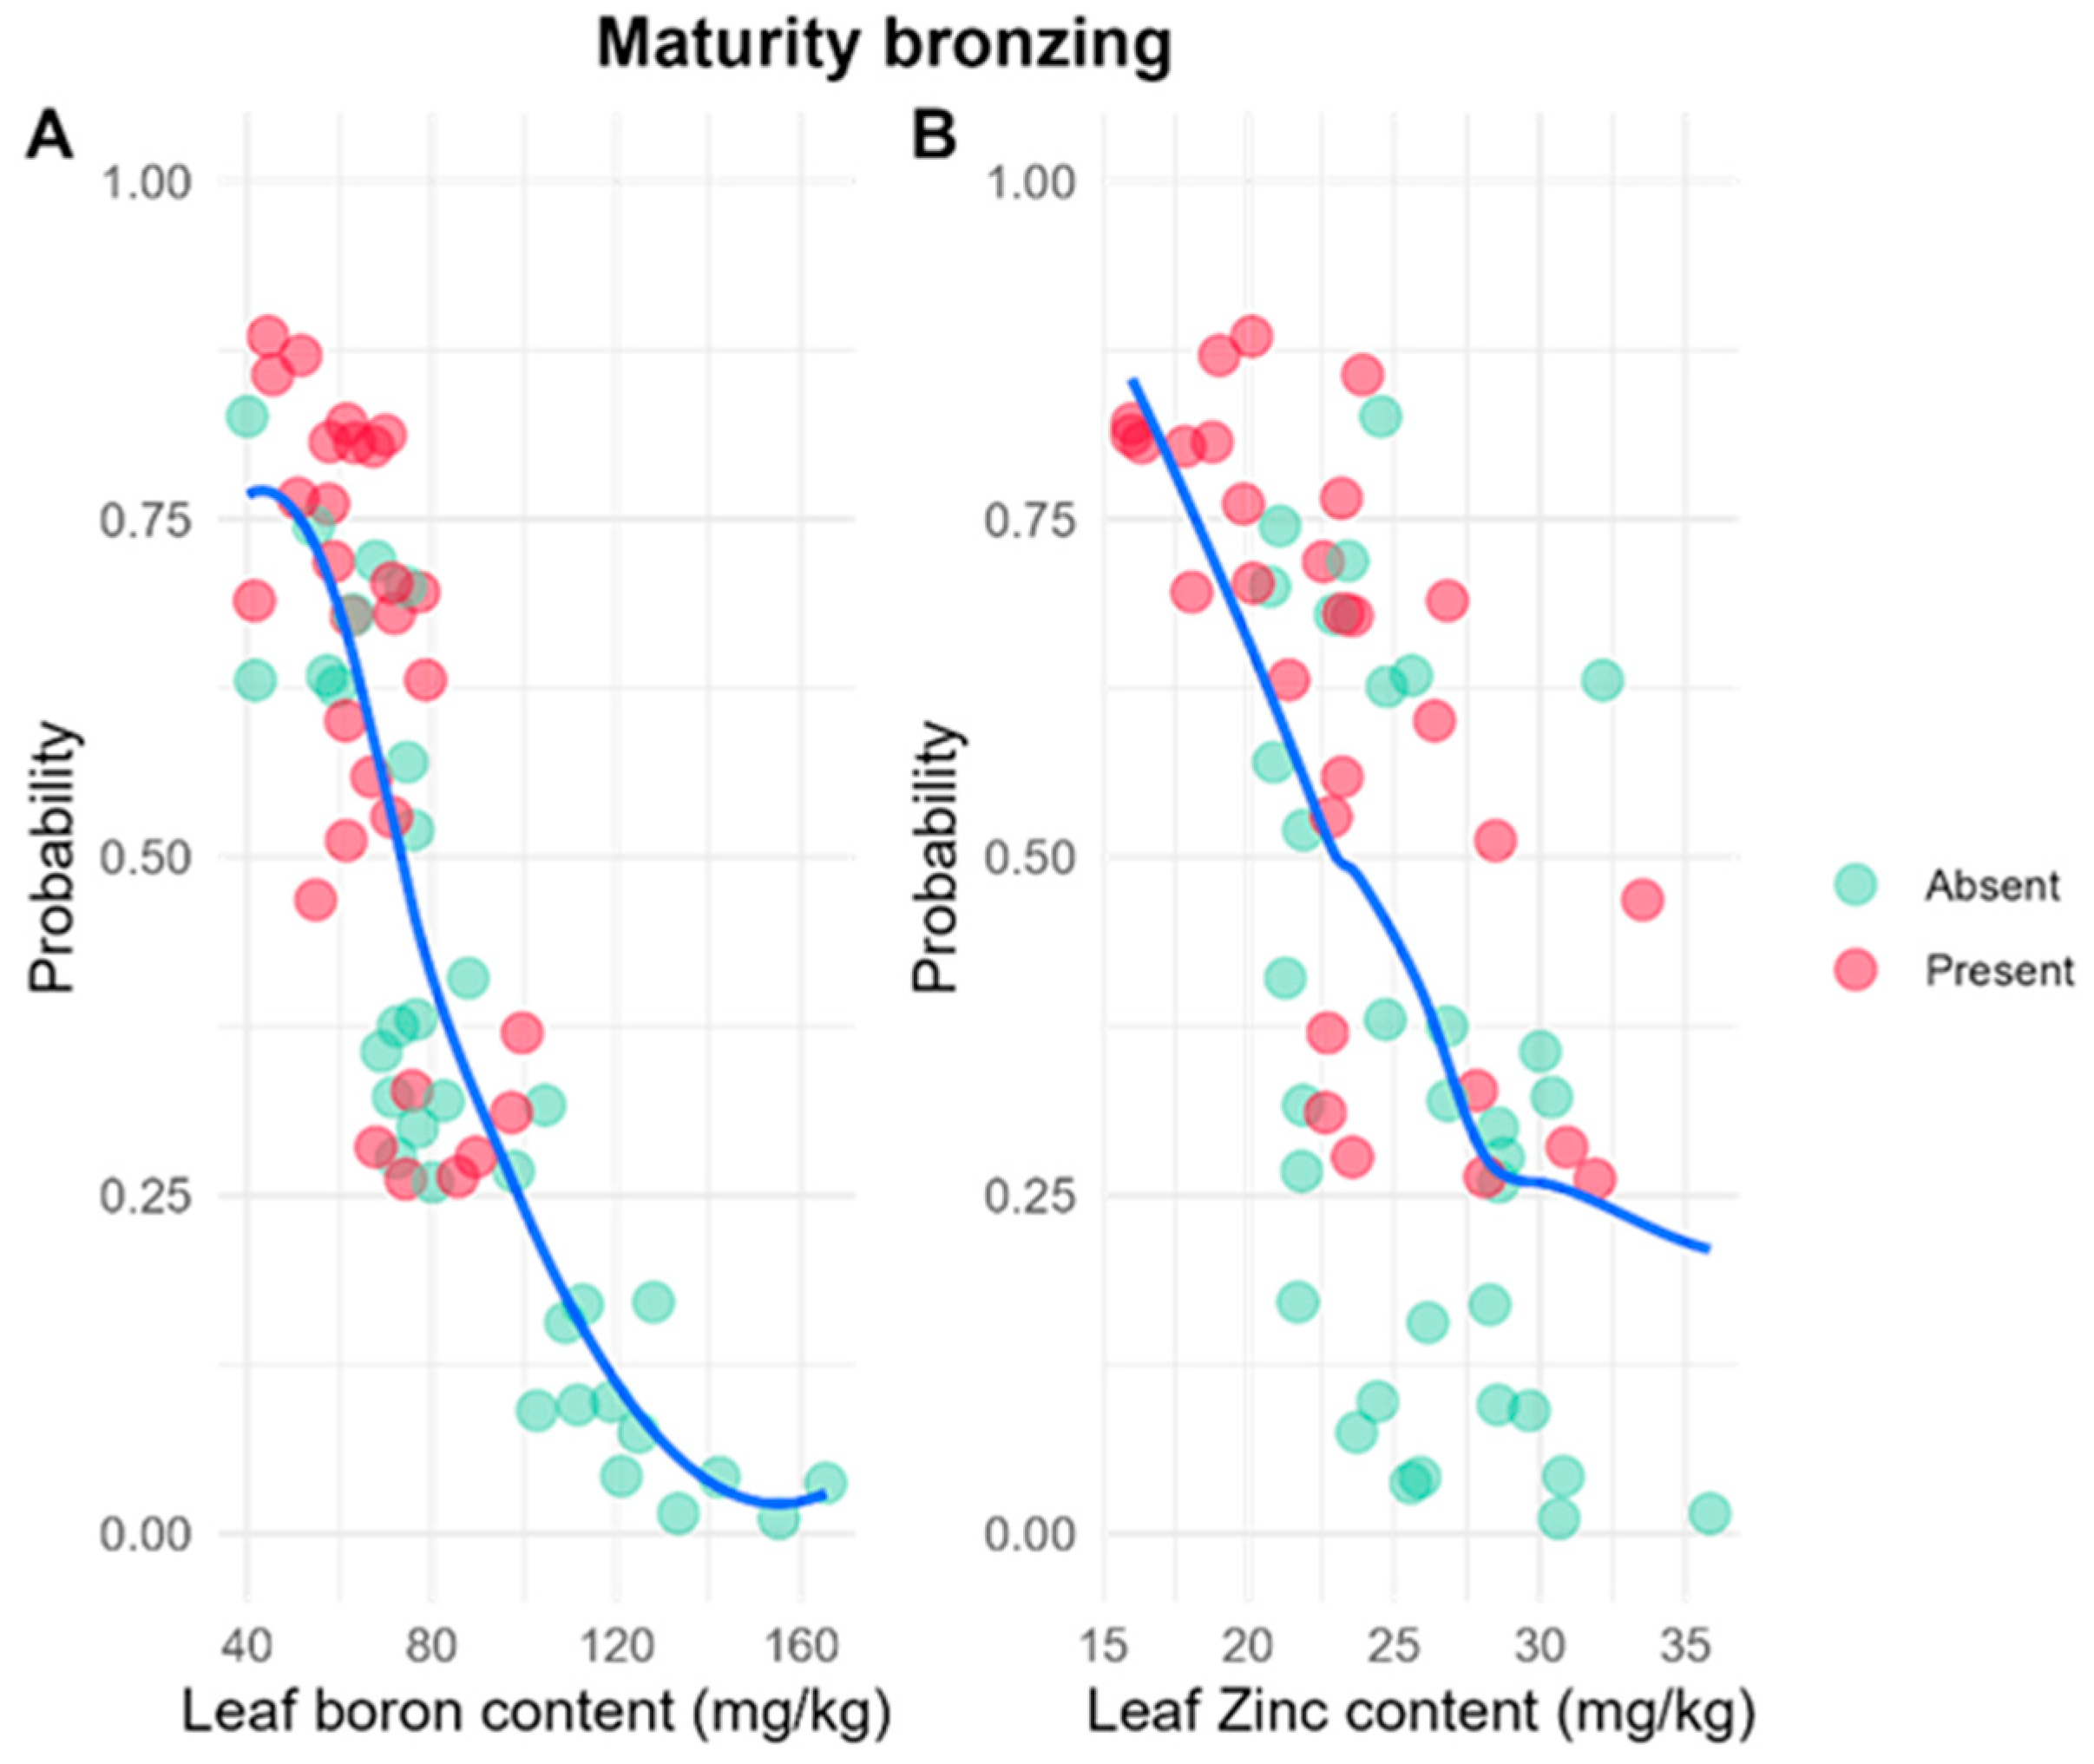
Figure 5.
Estimated probability of the P/A of MB in banana (Musa AAA) bunches, as a function of the concentration of Ca (A) and Mg (B) in the foliar tissue.
Figure 5.
Estimated probability of the P/A of MB in banana (Musa AAA) bunches, as a function of the concentration of Ca (A) and Mg (B) in the foliar tissue.
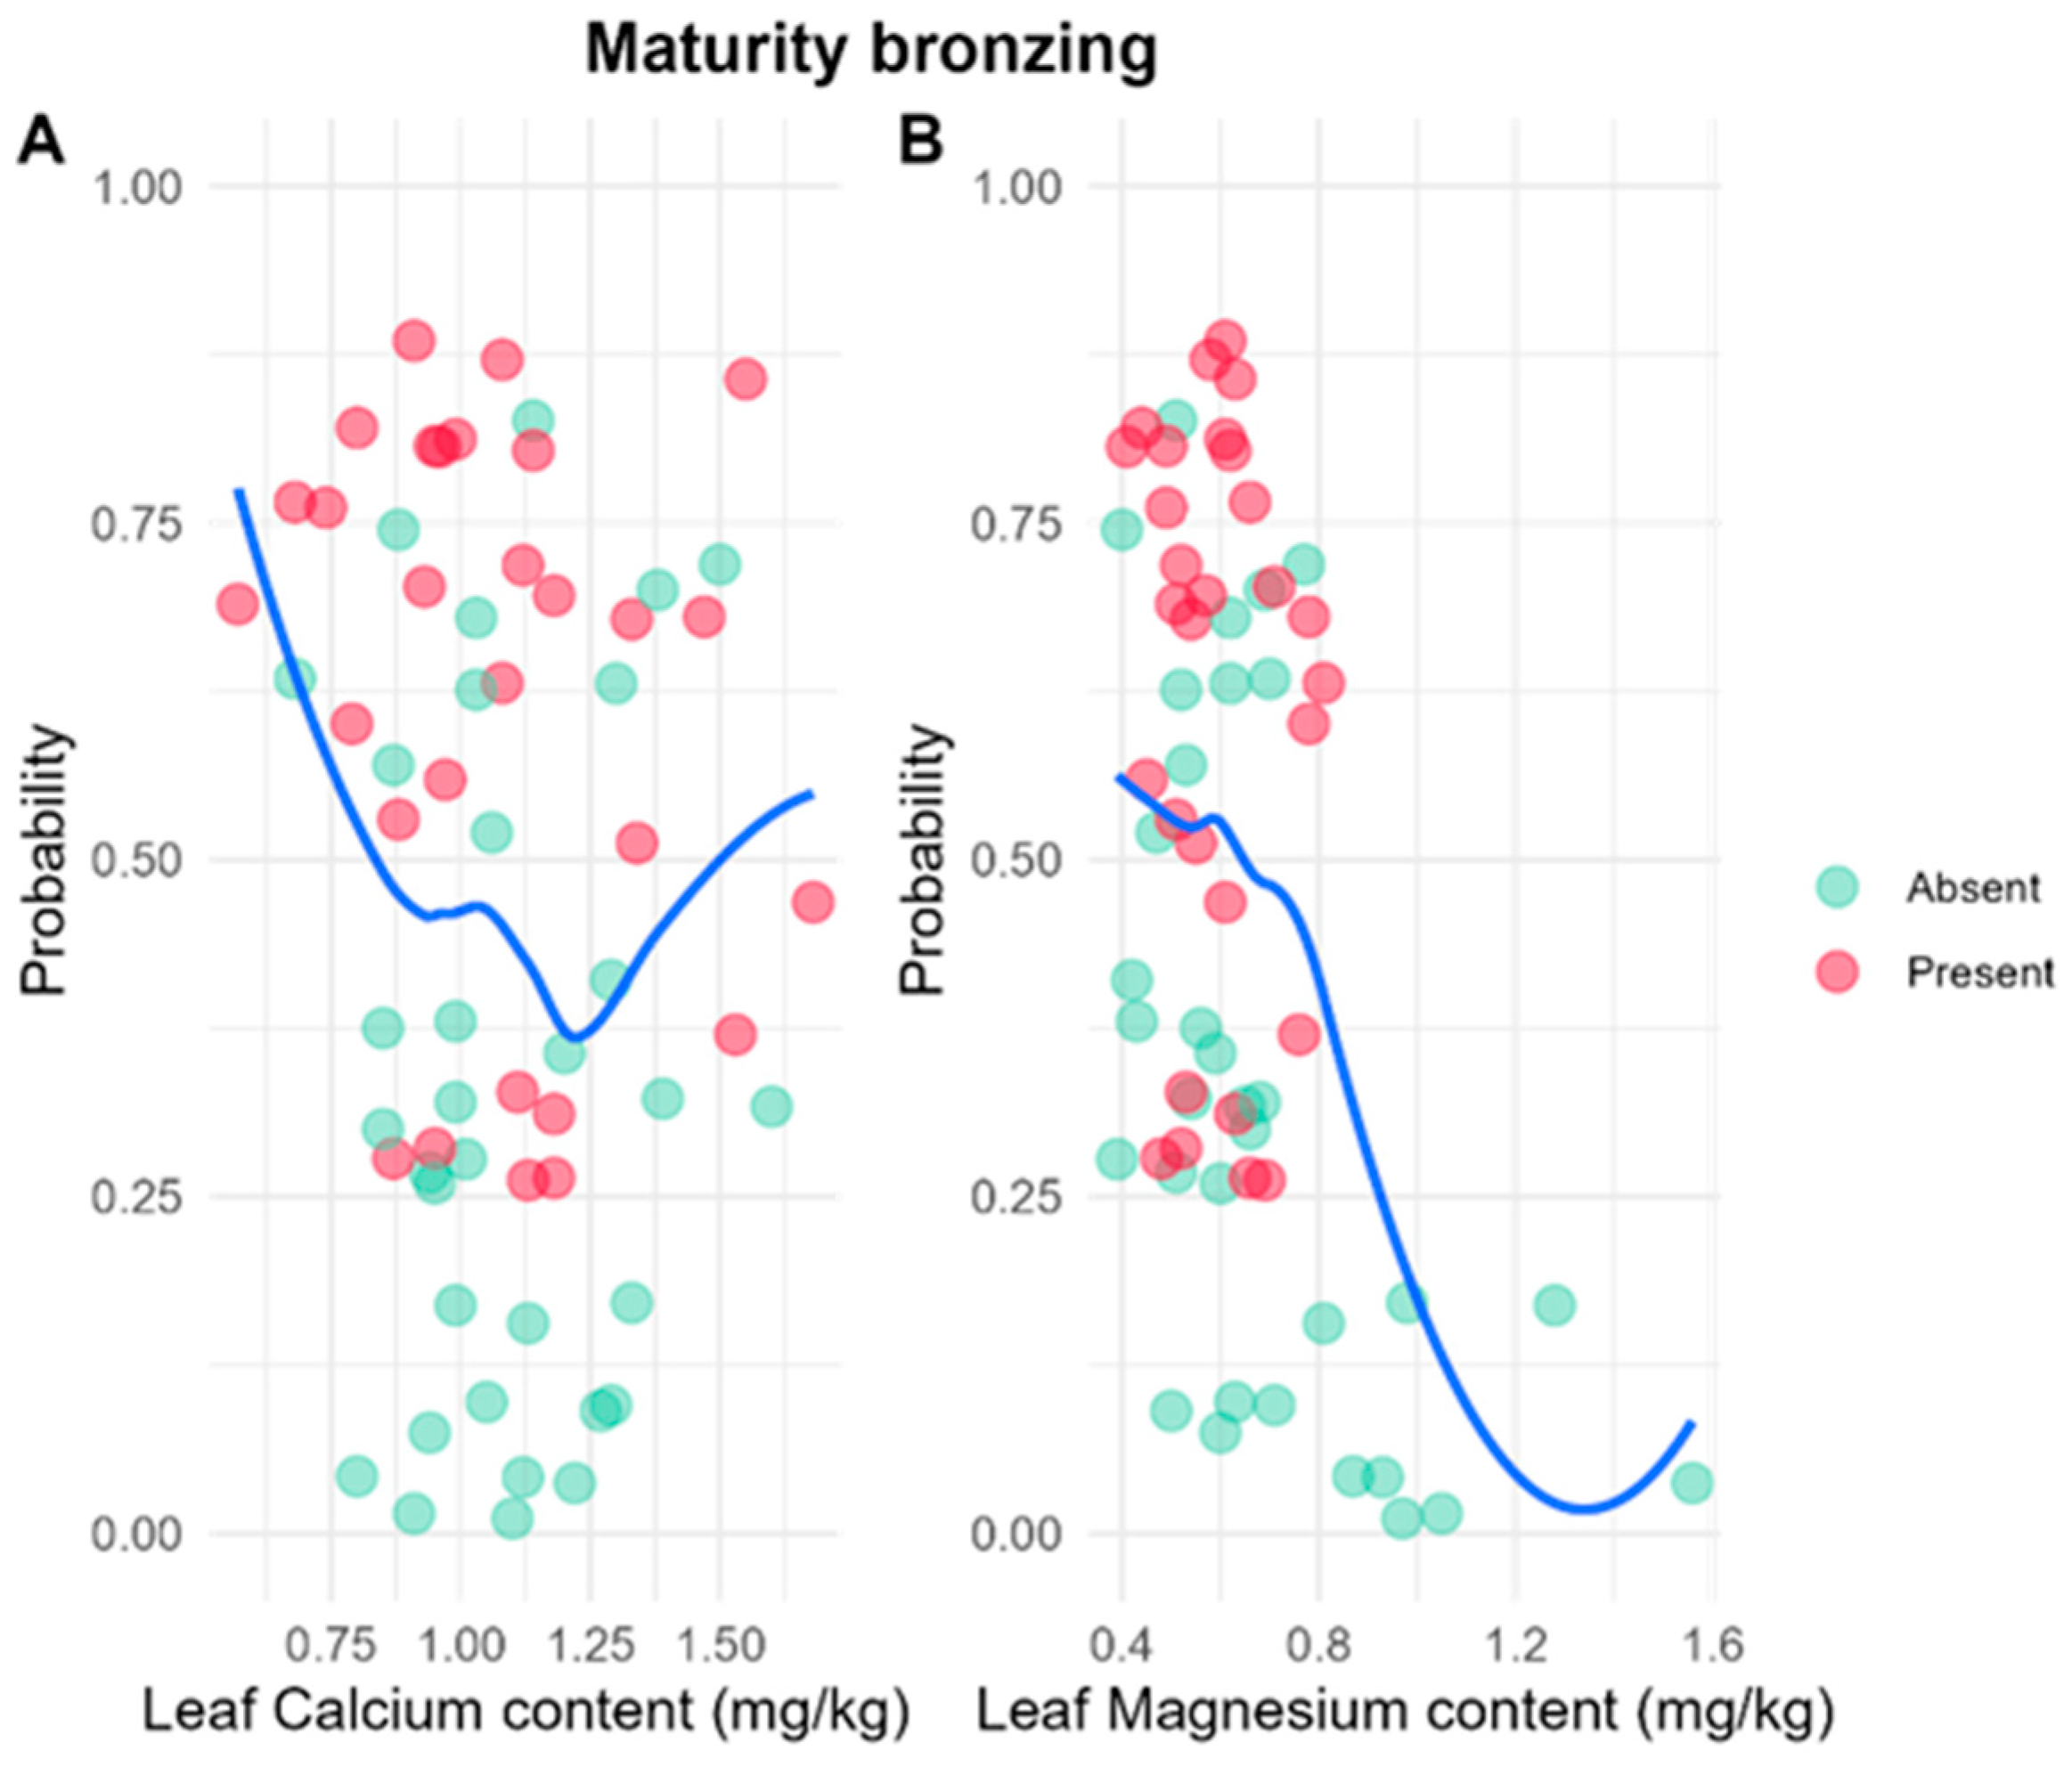

Table 1.
Description of soil physical and chemical properties on the California (C-loam class) and San Bartolo (SB-clay class) farms dedicated to banana production for export.
Table 1.
Description of soil physical and chemical properties on the California (C-loam class) and San Bartolo (SB-clay class) farms dedicated to banana production for export.
| Properties | C | SB | Properties | SB | C |
|---|---|---|---|---|---|
| A % | 44.20 | 17.30 | Na ppm | 1.73 | 2.17 |
| Ar % | 22.20 | 50.40 | CEC meq/100g | 12.17 | 33.39 |
| pH | 6.01 | 5.03 | Cu mg/kg | 0.31 | 0.02 |
| MO % | 1.48 | 1.88 | Fe mg/kg | 0.17 | 0.08 |
| Ca ppm | 10.35 | 27.51 | Mn mg/kg | 0.36 | 0.63 |
| Mg ppm | 1.54 | 5.45 | Zn mg/kg | 0.04 | 0.04 |
| K ppm | 0.28 | 0.43 | B mg/kg | 0.43 | 0.36 |
Table 2.
Distribution of the average, standard deviation (in parentheses), number of observations (n) for each farm with regard to the P/A of MB in banana bunches (Musa AAA).
Table 2.
Distribution of the average, standard deviation (in parentheses), number of observations (n) for each farm with regard to the P/A of MB in banana bunches (Musa AAA).
| Responses | California | San Bartolo | ||
|---|---|---|---|---|
| Absent (n=219) | Present (n=114) | Absent (n=180) | Present (n=112) | |
| H | 304.7(30.4) | 278.2(23.2) | 354.9(31.8) | 323.7(32.7) |
| P50 | 77.0(5.5) | 69.8(5.6) | 76.0 (6.2) | 67.6(5.9) |
| SA50 | 474.7(68.6) | 381.0(62.6) | 462.8(72.3) | 366.1(62.8) |
| LA50 | 21.2(4.2) | 15.6(3.7) | 20.5(4.4) | 14.7(3.6) |
| WB | 25.7(3.9) | 24.1(3.0) | 24.6(2.4) | 23.6(2.4) |
Table 3.
Average weight of the fruits affected by MB in each parcel of the California and San Bartolo farms.
Table 3.
Average weight of the fruits affected by MB in each parcel of the California and San Bartolo farms.
| Farm (Parcel) | Average (kg) | Farm Average |
|---|---|---|
| California-1 (C1) | 44.20 | 17.30 |
| California-2 (C2) | 22.20 | 50.40 |
| San Bartolo-1 (SB1) | 6.01 | 5.03 |
| San Bartolo-2 (SB2) | 1.48 | 1.88 |
Table 4.
Average, standard deviation (in parentheses), and number of observations (n) for the nutritional contents in the foliar tissue of banana bunches (Musa AAA) featuring the P/A of MB on each studied farm.
Table 4.
Average, standard deviation (in parentheses), and number of observations (n) for the nutritional contents in the foliar tissue of banana bunches (Musa AAA) featuring the P/A of MB on each studied farm.
| Responses | California | San Bartolo | ||
|---|---|---|---|---|
| Absent (n=17) | Present (n=15) | Absent (n=16) | Present (n=14) | |
| Ca | 1.1(0.2) | 1.0(0.3) | 1.1(0.2) | 1.1(0.3) |
| Mg | 0.6(0.3) | 0.6(0.1) | 0.7(0.2) | 0.6(0.1) |
| Zn | 26.1(4.1) | 24.6(5.3) | 26.0(3.6) | 21.5(3.4) |
| B | 94.0(34.9) | 66.1(11.4) | 89.2(29.4) | 67.5(17.7) |
Table 5.
Results of adjusting the logistic regression model using morphometric (H, P50) and production (WB) variables for each farm.
Table 5.
Results of adjusting the logistic regression model using morphometric (H, P50) and production (WB) variables for each farm.
| Farm | Coefficient | Estimate | Standard Error | Z-Value | Pr(>|z|) | |
|---|---|---|---|---|---|---|
| California | Intercept | 9.261 | 1.3630 | 6.793 | 1.10e-11 | |
| BW | 0.157 | 0.049 | 3.086 | 2.03e-3 | ||
| H*P50 | -6.48e-4 | 8.19e-5 | -7.914 | 2.48e-15 | ||
| San Bartolo | Intercept | 5.376 | 1.465 | 3.670 | 2.42e-4 | |
| BW | 0.148 | 0.070 | 2.117 | 0.034 | ||
| H*P50 | -3.82e-4 | 5.01e-5 | -7.638 | 2.21e-14 | ||
Table 6.
Results of adjusting the multiple logistic regression model for the concentration of Ca, Mg, Zn, and B in banana (Musa AAA) foliar tissue.
Table 6.
Results of adjusting the multiple logistic regression model for the concentration of Ca, Mg, Zn, and B in banana (Musa AAA) foliar tissue.
| Coefficient | Estimate | Standard Error | Z-Value | Pr(>|z|) |
|---|---|---|---|---|
| Intercept | 5.963 | 2.299 | 2.594 | 9.48e-3 |
| Ca | 0.568 | 1.257 | 0.452 | 0.651 |
| Mg | 1.474 | 2.271 | 0.649 | 0.516 |
| Zn | -0.156 | 0.074 | -2.096 | 3.61e-2 |
| B | -0.050 | 0.017 | -2.860 | 4.23e-3 |
Table 7.
Climatic conditions (precipitation, and temperature) on the California (Zona Bananera, Magdalena) and San Bartolo (Chigorodó, Antioquia) during 2018 and 2019.
Table 7.
Climatic conditions (precipitation, and temperature) on the California (Zona Bananera, Magdalena) and San Bartolo (Chigorodó, Antioquia) during 2018 and 2019.
| Year | Period | Farm | Precipitation (mm) | Temperature (°C) |
|---|---|---|---|---|
| 2018 | Nov-May | California | 98.5 (60.0–117.0) | 31.2 (30.5–32.0) |
| San Bartolo | 2.5 (0.0–162.5) | 27.8 (21.4–34.7) | ||
| Jun-Oct | California | 1.5 (1.0–2.0) | 31.0 (30.9–32.0) | |
| San Bartolo | 37.9 (0.0–148.6) | 24.0 (27.5–29.2) | ||
| 2019 | Nov-May | California | 33.5 (19.0–192.3) | 33.6 (32.2–34.6) |
| San Bartolo | 144.4 (0.0–193.6) | 27.0 (21.9–31.7) | ||
| Jun-Oct | California | 132.3 (11.6–229.7) | 33.5 (33.2–33.9) | |
| San Bartolo | 188.3 (0.0 – 296.0) | 26.0 (21.1–30.5) |
Disclaimer/Publisher’s Note: The statements, opinions and data contained in all publications are solely those of the individual author(s) and contributor(s) and not of MDPI and/or the editor(s). MDPI and/or the editor(s) disclaim responsibility for any injury to people or property resulting from any ideas, methods, instructions or products referred to in the content. |
© 2025 by the authors. Licensee MDPI, Basel, Switzerland. This article is an open access article distributed under the terms and conditions of the Creative Commons Attribution (CC BY) license (http://creativecommons.org/licenses/by/4.0/).
Copyright: This open access article is published under a Creative Commons CC BY 4.0 license, which permit the free download, distribution, and reuse, provided that the author and preprint are cited in any reuse.


