
Submitted:
21 July 2025
Posted:
22 July 2025
You are already at the latest version
Abstract
Optimizing nutrient formulations is crucial to enhancing the biomass and C-PC productivity of Spirulina sp., a promising cyanobacterium widely used in food, pharmaceutical, and biotechnological applications. This study aimed to identify key macronutrient drivers that influence biomass growth and C-PC productivity through cultivation media optimization. A two-level full factorial design was used to evaluate eight modified Zarrouk-based formulations compared to the standard medium. Among them, formulation F2 (16 g/L NaHCO₃, 5 g/L NaNO₃, 0.25 g/L K₂HPO₄) significantly improved biomass performance, with a 10.05% increase in specific growth rate, 37.25% higher dry biomass, and 37.5% greater daily productivity than the control. Meanwhile, formulation F3 (16 g/L NaHCO₃, 5 g/L NaNO₃, 1 g/L K₂HPO₄) achieved the highest C-PC content, doubling both PCL and PCD levels, and increasing purity index by 40.23% relative to the control. These findings reveal that nitrate and phosphate availability are critical nutrient drivers for enhancing Spirulina sp. productivity, offering a cost-effective strategy for maximizing both biomass yield and C-PC quality in commercial-scale cultivation.
Keywords:
microalgae
; media formulation
; nutrient modification
; pigment enhancement
1. Introduction
The increasing global demand for natural, sustainable, and bioactive compounds has significantly advanced the commercial interest in microalgae-based bioproducts. Among various microalgal species, Spirulina sp. (also referred to as Arthrospira) has emerged as a leading candidate due to its high protein content, rapid growth rate, photosynthetic efficiency, and capacity to produce valuable secondary metabolites such as pigments, vitamins, and polyunsaturated fatty acids [1,2]. Its biomass contains approximately 60–70% protein by dry weight, alongside essential amino acids, minerals, and functional pigments, which have enabled its widespread application in functional food, nutraceutical, and cosmetic industries [2,3].
One of the most prominent pigments derived from Spirulina is C-phycocyanin (C-PC), a water-soluble blue phycobiliprotein belonging to the phycobilisome complex, which plays a central role in light-harvesting during photosynthesis [4,5]. Beyond its physiological role, C-PC exhibits significant antioxidant, anti-inflammatory, immunomodulatory, and anticancer properties, making it a highly sought-after compound in pharmaceutical, food coloring, and biomedical applications [6,7]. Despite its commercial potential, large-scale production of C-PC remains limited by low pigment yields and high production costs [8,9]. Since C-PC is intracellularly accumulated, enhancing its yield requires not only improving pigment biosynthesis but also increasing overall biomass productivity. Consequently, cultivation strategies that support both high cell density and C-PC accumulation are essential for improving production efficiency [4,9,10].
Nutrient composition is one of the most influential factors affecting microalgal growth and metabolite biosynthesis [11,12]. While several standard media such as Zarrouk and BG-11 have been widely used for cultivating Spirulina, these formulations were primarily designed to support general growth and may not be optimized for targeted metabolite production [13,14,15]. In particular, the availability and balance of macronutrients—including carbon (C), nitrogen (N), and phosphorus (P)—are known to significantly influence both biomass formation and secondary metabolite accumulation in microalgae [16]. Carbon functions as the foundational element for all organic molecules and serves as the main energy source driving photosynthesis and biosynthetic pathways related to pigment production, including C-PC [16,17]. Nitrogen plays a central role in protein biosynthesis and is directly involved in the formation of amino acids and phycobiliproteins such as C-PC [9,18]. Phosphorus, on the other hand, is essential for the synthesis of ATP, which supports a wide range of cellular metabolic processes, including those involved in pigment biosynthesis [19,20]. By adjusting the C:N:P ratios in the growth medium, metabolites productivity can be significantly enhanced without the need for complex or expensive technologies.
Although the roles of individual nutrients in enhancing pigment production have been studied, the combined effects of multiple nutrients on both biomass and C-PC productivity are less well understood [9,12,17,18]. Addressing this gap, the present study investigates the influence of nutrient composition—specifically C, N, and P—on the growth and C-PC production of Spirulina sp. Using a factorial experimental design, eight media formulations were developed by modifying the concentrations of key macronutrients, with Zarrouk medium serving as the control. This study aims to identify key nutrient drivers that enhance both biomass accumulation and C-PC yield, thereby contributing to the development of more efficient and economically viable Spirulina sp. cultivation systems.
2. Results
2.1. The Effect of Nutrient Modification on the Growth and Biomass Production of Spirulina
2.1.1. Growth Dynamics of Spirulina sp. Under Varying Nutrient Modifications
Optical density (OD) measurements were conducted to assess the growth dynamics of Spirulina sp. and the influence of nutrient modifications in the cultivation medium. OD was recorded daily at a wavelength of 680 nm over a 14-day cultivation period. The findings revealed distinct growth patterns across different modified media and the control, as illustrated in Figure 1.
Figure 1.
Growth pattern of Spirulina sp. under varying nutrient modification. *C: control, F1-F8: Formulation 1-8.Figure 1 demonstrates that each nutrient formulation exerted a unique influence on the growth trajectory and proliferation rate of Spirulina sp. In the control treatment, the exponential phase commenced on day 3 and persisted until day 13, after which the culture transitioned into the stationary phase. A comparable trend was observed in treatments F3 and F6. Conversely, treatments F1, F7, and F8 exhibited markedly lower growth rates than the control, suggesting that an imbalance in nutrient composition hindered microalgal proliferation.
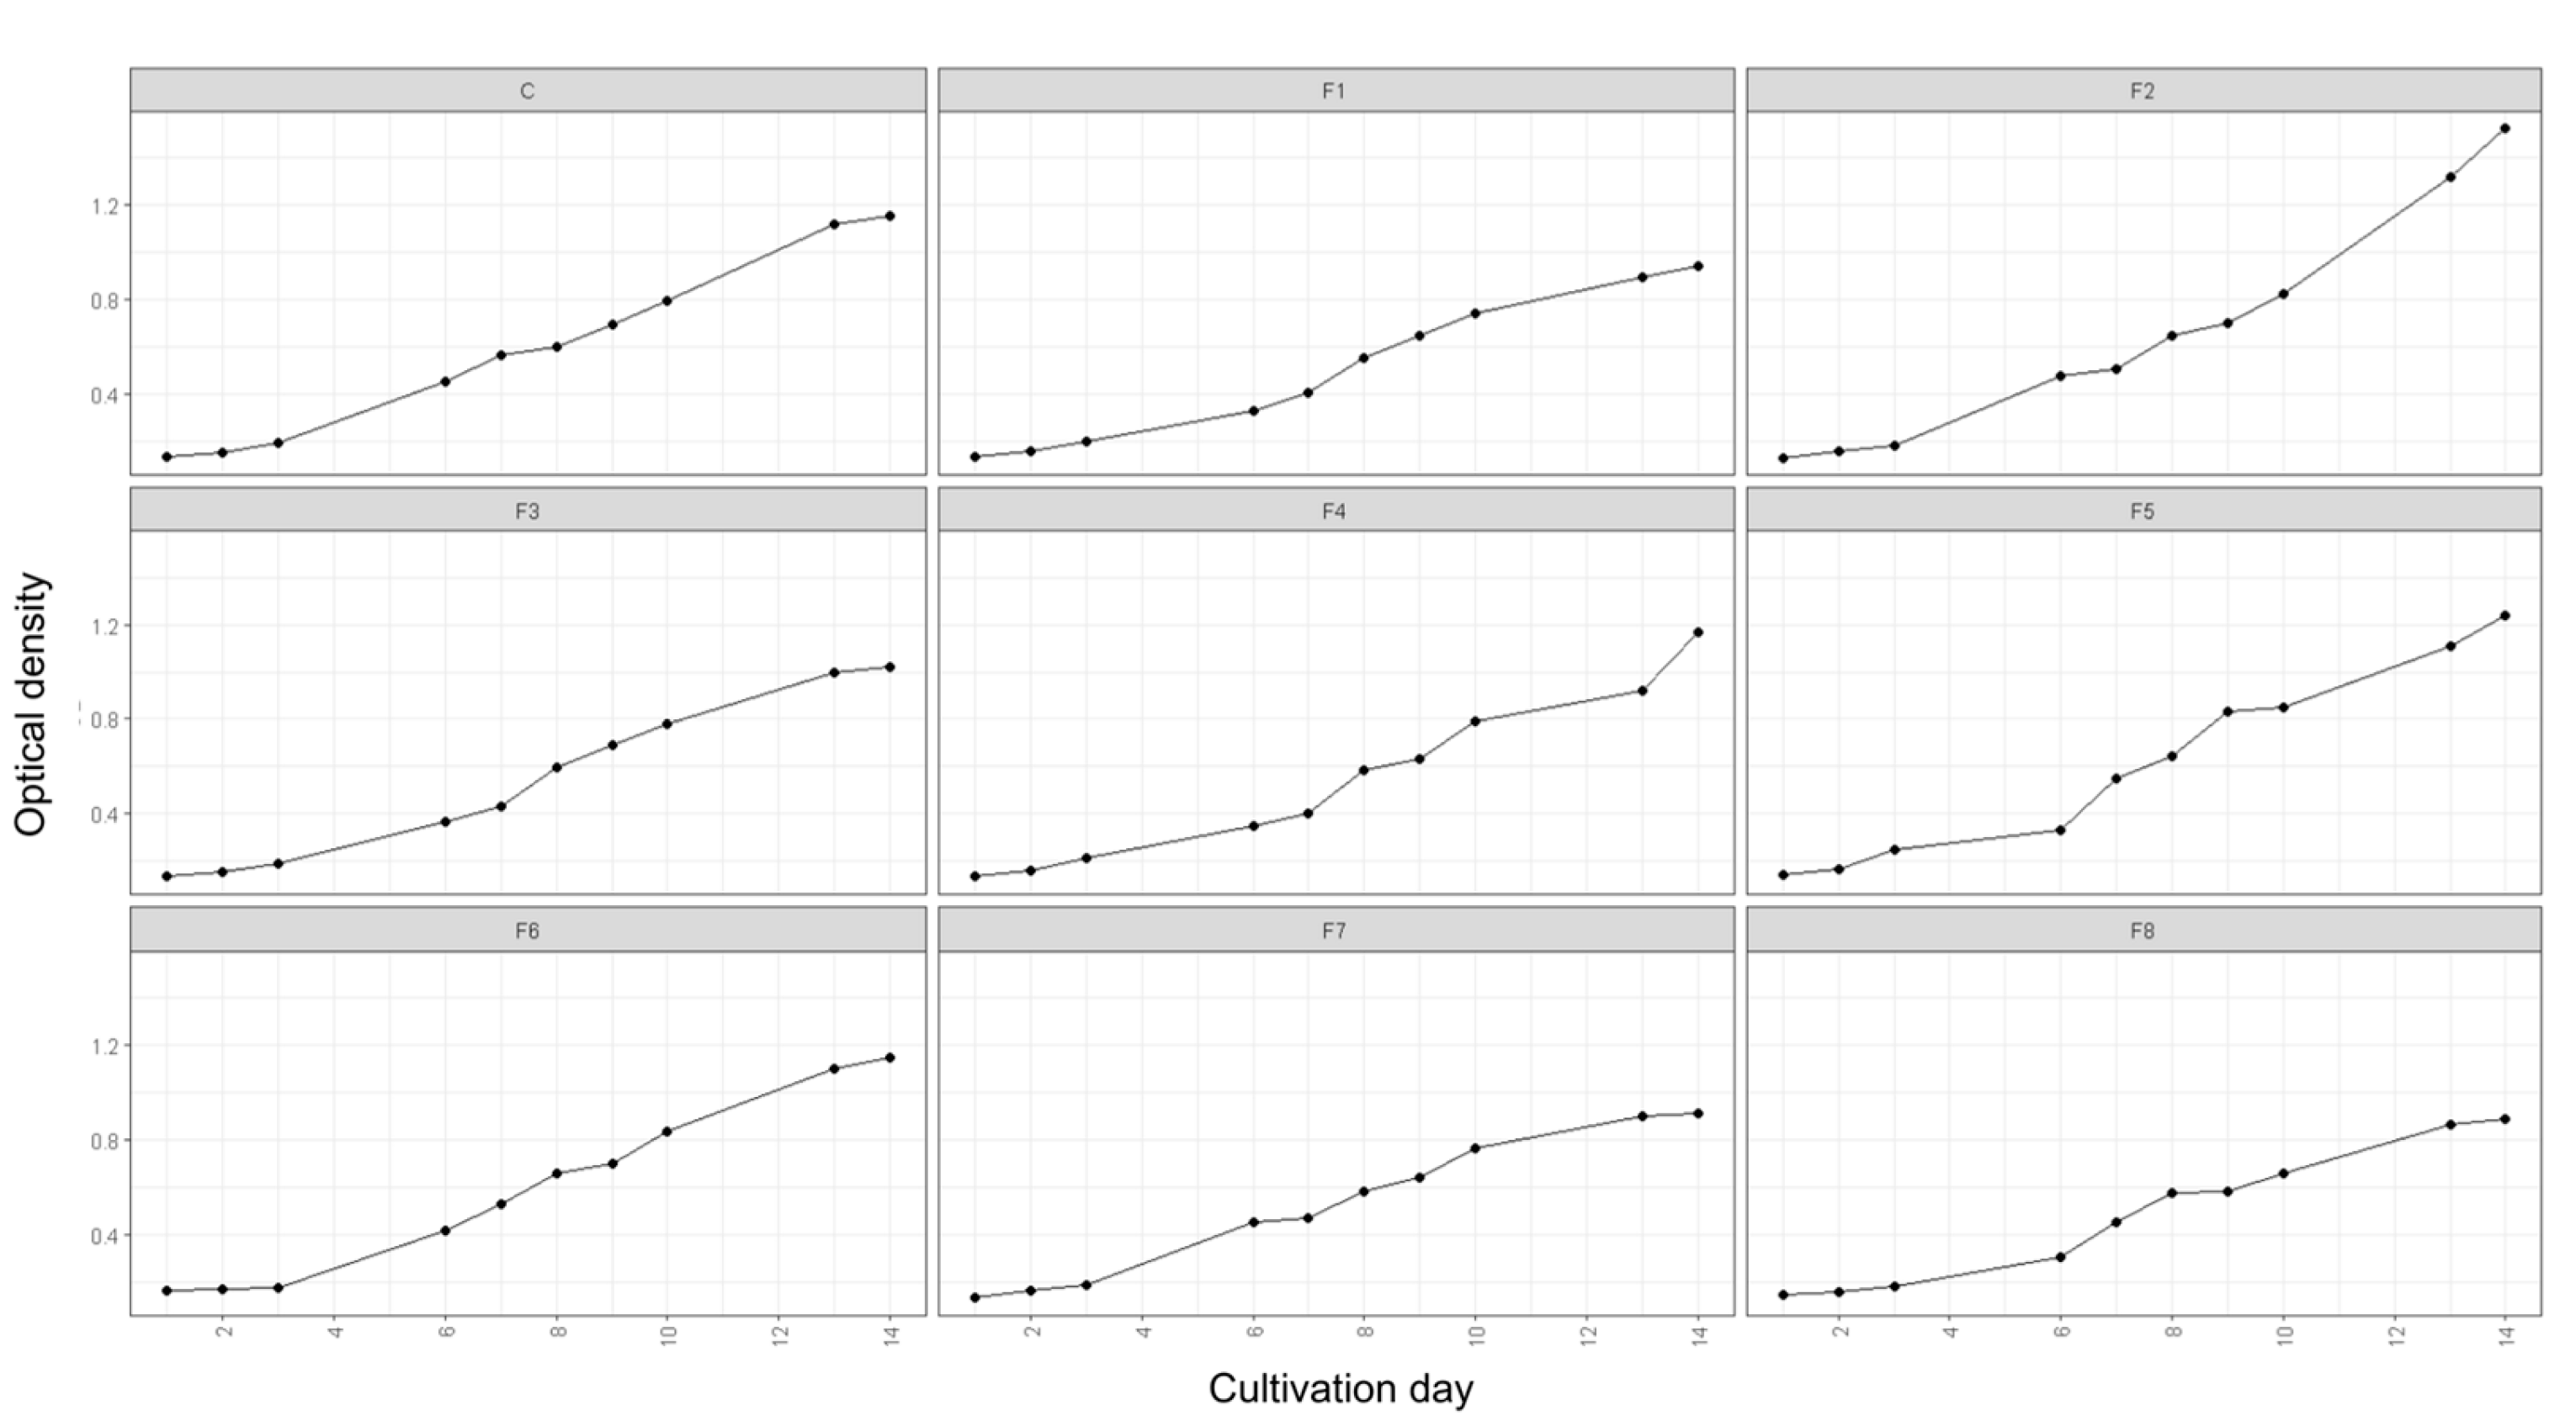
Among all treatment variations, F2 exhibited the most favorable results, achieving the highest OD of 1.528 on day 14. Similarly, the specific growth rate (µ) recorded in F2 was the highest among all formulations, showing a 10.05% increase compared to the control (Table 1). This indicates that F2 significantly accelerated growth, suggesting that its nutrient composition was optimal in supporting an extended exponential growth phase relative to the control.
2.1.2. The Effect of Nutrient Modification on Spirulina Growth
The influence of nutrient modifications on the growth dynamics of Spirulina sp. was assessed using a main effect plot, which visualizes the individual contributions of carbon, nitrogen, and phosphorus concentrations to biomass accumulation, as indicated by OD measurements (Figure 2). OD was monitored on days 3, 6, 8, 10, 13, and 14 to capture the temporal growth response across different cultivation phases. In parallel, statistical evaluation using analysis of variance (ANOVA) was conducted to determine the significance of each factor and their interactions, as presented in Table 2.
An increase in carbon concentration from 8 g/L to 16 g/L NaHCO₃ consistently enhanced OD throughout the cultivation period. During the early phase (days 3–6), the OD increase was moderate, indicating a transition from the lag to the exponential phase. However, from day 8 onwards, OD values rose markedly with increasing carbon availability. This trend is statistically supported by ANOVA results, which revealed a significant effect of carbon on day 8 (p-value = 3.15 × 10⁻²), highlighting its critical role as a primary energy and carbon skeleton source during the exponential growth phase.
Similarly, nitrogen concentration exhibited a strong influence on growth kinetics. Increasing NaNO₃ levels from 1.5 g/L to 5 g/L led to a pronounced rise in OD after day 6, aligning with the onset of exponential growth and the heightened demand for nitrogen for protein synthesis. Notably, while high nitrogen levels appeared to mildly suppress growth during the early phase (day 3), this effect was statistically insignificant (p-value > 0.05). In contrast, the stimulatory effect of nitrogen during the exponential phase was statistically significant (p-value = 2.51 × 10⁻²), suggesting that nitrogen enrichment becomes a growth-limiting factor only when demand escalates during active cell division.
In contrast, the effect of phosphorus supplementation (ranging from 0.25 g/L to 1 g/L K₂HPO₄) showed no consistent pattern. A slight positive effect was observed during the early phase (day 3), yet increased phosphorus concentrations were associated with decreased OD during mid-to-late cultivation. However, these trends were not statistically significant (p-value > 0.05), indicating that phosphorus may not be a major limiting factor under the tested conditions.
Beyond individual nutrient effects, interaction effects were also found to be statistically significant during the exponential growth phase on day 8. Specifically, the interaction between carbon and nitrogen (p-value = 3.15 × 10⁻²) and the interaction between nitrogen and phosphorus (p-value = 1.52 × 10⁻²) both exerted significant influence on biomass accumulation (Table 2). Figure 3 illustrates these interactions. In the carbon–nitrogen interaction, OD remained largely unchanged under high nitrogen conditions (5 g/L), regardless of carbon concentration, suggesting carbon supplementation had limited effect when nitrogen was abundant. Conversely, under low nitrogen conditions (1.5 g/L), increased carbon significantly enhanced OD, indicating carbon becomes a limiting factor only when nitrogen is suboptimal.
The nitrogen–phosphorus interaction revealed more complex behavior. At low phosphorus levels (0.25 g/L), increasing nitrogen availability supported higher OD, suggesting a cooperative effect. However, under high phosphorus conditions (1 g/L), further nitrogen enrichment reduced OD, possibly due to nutrient imbalance or osmotic stress. This suggests that while nitrogen plays a critical role in biomass productivity, its optimal effect is context-dependent, especially in relation to phosphorus availability [21].
2.1.3. The Effect of Nutrient Modification on Biomass Production
The total dry biomass at the end of the cultivation period and the daily biomass productivity were evaluated to assess the impact of nutrient modification on the biomass production of Spirulina sp. As shown in Figure 4, significant variations in biomass yield were observed across the modified media formulations (F1–F8) compared to the control medium. Among these, F2 exhibited the highest performance, achieving a dry biomass concentration of 0.8292 g/L—representing a 37.5% increase over the control (0.6028 g/L)—along with the highest daily productivity of 0.0408 g/L/day, compared to 0.0298 g/L/day in the control. These results suggest that F2 provided a more balanced and optimal nutrient profile to support Spirulina’s metabolic activities, particularly those related to photosynthesis and the synthesis of primary metabolites essential for biomass formation.
F2 contained 16 g/L of NaHCO₃, a carbon source concentration nearly equivalent to that of the control (16.8 g/L), ensuring sufficient carbon availability to support photosynthetic processes. Additionally, the significant increase in nitrogen supply—through 5 g/L of NaNO₃ compared to 1.5 g/L in the control—offered ample nitrogen to sustain the biosynthesis of proteins, enzymes, and other nitrogenous metabolites. Although the phosphorus concentration in F2 (0.25 g/L K₂HPO₄) was lower than in the control (0.5 g/L), the optimized carbon and nitrogen availability compensated for this, allowing the cells to maintain nutrient balance, enhance metabolic efficiency, and sustain robust growth.
In contrast, F7 and F8 produced the lowest biomass yields, with dry weights of 0.4368 g/L and 0.4300 g/L, and daily productivities of 0.0228 and 0.0218 g/L/day, respectively. These results reflect a clear nutrient imbalance, particularly with regard to carbon availability, which appeared to be the primary limiting factor in these treatments. Both formulations contained only 8 g/L of NaHCO₃—substantially lower than the control (16.8 g/L) and F2 (16 g/L)—thereby significantly limiting the carbon supply required for photosynthesis and primary metabolite production. While the nitrogen content in F7 (5 g/L NaNO₃) was identical to that in F2, the carbon deficiency could not be compensated, resulting in suppressed growth and reduced biomass productivity. Moreover, the elevated phosphorus concentration (1 g/L K₂HPO₄) in F7 and F8, in the absence of adequate carbon, may have disrupted the cellular nutrient balance and further impaired the metabolic efficiency of Spirulina sp.. Consequently, both formulations led to significantly lower biomass production compared to both the control and F2.
2.1.4. The Effect of Nutrient Modification on C-PC Production
C-PC content in Spirulina sp. biomass was quantified using spectrophotometric analysis, following the method proposed by Bennett and Bogorad (1978) which allows measurement of C-PC both in the crude extract (phycocyanin content in liquid, PCL) and in dried biomass (phycocyanin content in dried biomass, PCD) [22].
As presented in Figure 5, PCL, PCD, and PI were evaluated across different nutrient modification treatments. The results revealed that F3 and F2 significantly enhanced both the quantity and quality of C-PC compared to the control, while F4 and F5 exhibited similar levels to the control. F3 demonstrated the highest C-PC yield, with 0.6200 mg/mL PCL and 0.3100 mg/mg PCD. Likewise, F2 resulted in PCL and PCD values of 0.5526 mg/mL and 0.2763 mg/mg, respectively. These values markedly exceeded the control, which yielded only 0.3469 mg/mL PCL and 0.1734 mg/mg PCD. In contrast, F4 and F5—which contained the same nitrogen concentration as the control (1.5 g/L NaNO₃)—produced lower C-PC levels, ranging from 0.3307 to 0.3537 mg/mL PCL and 0.1653 to 0.1768 mg/mg PCD, highlighting nitrogen availability as a primary limiting factor for C-PC biosynthesis. Furthermore, a clear positive correlation was observed between high PCL and PCD values and increased PI. F3, which showed the highest C-PC concentration, also recorded the highest PI at 0.4936—a 40.23% improvement over the control. Conversely, F7 and F8, which showed the lowest PCL and PCD values, also had the lowest PI values, at 0.1426 and 0.1166, respectively.
To further examine the contribution of individual nutrient components—including carbon (NaHCO₃), nitrogen (NaNO₃), and phosphorus (K₂HPO₄)—and their interactions, statistical analyses were conducted. These included main effect plots (Figure 6), interaction plots (Figure 7), and ANOVA (Table 3).
Increasing the carbon concentration from 8 g/L to 16 g/L had a statistically significant positive effect on both the quantity (PCL and PCD) and quality (PI) of C-PC. The upward trend observed in the main effect plot (Figure 6) indicates that carbon, as a primary energy source, plays a key role in supporting the metabolic pathways involved in C-PC biosynthesis. Higher carbon availability is known to enhance pigment synthesis by stimulating both primary and secondary metabolic activity [23,24]. These findings are supported by ANOVA results (Table 3), where carbon showed a highly significant effect (p-value = 9.57 × 10⁻⁹). Similarly, increasing the nitrogen concentration from 1.5 g/L to 5 g/L NaNO₃ also significantly boosted C-PC production, as shown by the ascending trend in the main effect plot. ANOVA analysis confirmed the significant influence of nitrogen (p-value = 2.60 × 10⁻⁹), reinforcing its central role in protein biosynthesis, including phycobiliproteins such as C-PC.
On the other hand, increasing the phosphorus concentration from 0.25 g/L to 1 g/L showed a negative trend across PCL, PCD, and PI, as indicated by the downward-sloping curve in the main effect plot. Although F3—containing 1 g/L K₂HPO₄—produced the highest C-PC content, the main effect plot reflects the overall trend across all treatments. These findings suggest that elevated phosphorus concentrations may inhibit C-PC biosynthesis unless accompanied by optimized carbon and nitrogen levels, as in F3. This inverse relationship was statistically significant, with ANOVA indicating a strong negative effect of phosphorus on C-PC production (p = 2.79 × 10⁻⁷).
The interaction plots (Figure 7) provide additional insight into the synergistic or antagonistic relationships among nutrients. The carbon–nitrogen interaction demonstrated a clear synergistic effect. At high nitrogen levels (5 g/L), increasing carbon concentration substantially improved PCL, PCD, and PI (black line). However, under low nitrogen conditions (1.5 g/L), carbon enrichment had minimal effect (flat red line). This interaction was statistically significant, with a p-value of 3.99 × 10⁻⁶ (Table 3), indicating that simultaneous optimization of carbon and nitrogen concentrations is critical for maximizing C-PC synthesis in Spirulina sp.
The interaction between carbon and phosphorus showed a similar trend. When phosphorus levels were high (1 g/L), increasing carbon led to significantly higher C-PC production (black line with sharp upward slope), indicating a synergistic effect. In contrast, under low phosphorus conditions (0.25 g/L), the response to carbon enrichment was minimal (flat red line). Notably, increasing phosphorus levels under low carbon conditions led to a sharp decline in C-PC levels, as evidenced by the steep downward slope of the red line. These patterns indicate that carbon and phosphorus interact in a concentration-dependent manner, and their interaction was highly significant (p-value = 1.95 × 10⁻⁸, Table 3).
Lastly, the nitrogen–phosphorus interaction revealed a more complex pattern. Enhanced C-PC production was observed with nitrogen enrichment under low phosphorus conditions, but increasing phosphorus consistently decreased both the quantity and quality of C-PC, regardless of nitrogen level. This interaction was statistically significant (p-value = 1.47 × 10⁻²), indicating that phosphorus excess acts as a suppressive factor in C-PC biosynthesis. These findings suggest that 0.25 g/L K₂HPO₄ is sufficient to meet the phosphorus requirement for pigment production in Spirulina sp., while higher levels may induce oxidative stress or metabolic imbalance, leading to pigment degradation [25].
3. Discussion
The findings of this study demonstrate that nutrient composition—particularly the availability of inorganic carbon, nitrogen, and phosphorus—plays a critical role in influencing both biomass productivity and C-PC biosynthesis in Spirulina sp. Among the eight tested media formulations, F2 and F3 exhibited superior performance compared to the control (standard Zarrouk medium), in terms of cell growth, dry biomass accumulation, and C-PC production. Specifically, F2 consisting of 16 g/L NaHCO₃, 5 g/L NaNO₃, and 0.25 g/L K₂HPO₄, enhanced the specific growth rate (µ) by 10.05%, dry biomass by 37.25%, and daily biomass productivity by 37.5% relative to the control. This improvement is attributed to the synergistic effect of high concentrations of carbon and nitrogen, which together create a nutrient-rich environment that accelerates cellular proliferation.
Inorganic carbon derived from NaHCO₃ serves as the primary substrate in the Calvin cycle, where carbon dioxide is fixed by the enzyme RuBisCo into 3-phosphoglycerate (3-PGA), which is subsequently converted into glyceraldehyde-3-phosphate (GAP). GAP then enters key metabolic pathways such as glycolysis and the TCA cycle, generating essential precursors like acetyl-CoA and α-ketoglutarate, which are substrates for the biosynthesis of aminolevulinic acid (ALA)—the initial precursor in the tetrapyrrole biosynthetic pathway [23,26]. This pathway is essential for the synthesis of phycocyanobilin (PCB), the chromophore that imparts optical and bioactive properties to C-PC [24].
Concurrently, nitrogen supplied through NaNO₃ is indispensable for protein biosynthesis, including that of the C-PC apoprotein, as well as for the formation of ALA via both the C5 (glutamate-based) and C4 (glycine and succinyl-CoA) pathways. ALA is further metabolized into uroporphyrinogen III, which subsequently gives rise to heme and, eventually, PCB via the sequential actions of heme oxygenase and PcyA enzymes [27]. The conjugation of PCB with the apoprotein results in the functional holoprotein C-PC, which is structurally integrated into the phycobilisome, the primary light-harvesting antenna complex in cyanobacteria and microalgae [9,26].
While F2 was optimal for biomass production, F3 (1 g/L K₂HPO₄, 5 g/L NaNO₃, and 16 g/L NaHCO₃) yielded the highest C-PC content, achieving a C-PC concentration (PCL) of 0.6200 mg/mL and a C-PC content per dry biomass (PCD) of 0.3100 mg/mg—nearly double the values recorded in the control medium (PCL = 0.3469 mg/mL; PCD = 0.1734 mg/mg). These results suggest that elevated phosphate concentrations, when accompanied by sufficient levels of nitrogen and carbon, can effectively enhance C-PC biosynthesis. Phosphate plays a key role in cellular energy metabolism, particularly in the regeneration of ATP and NADPH, which are required in reductive biosynthesis and secondary metabolite production such as pigment formation [19,28]
Furthermore, sufficient phosphate levels may enhance enzyme activities throughout the biosynthetic cascade, from ALA and porphyrin synthesis to apoprotein translation. Phosphate is also indirectly involved in protein biosynthesis regulation by modulating translational pathways and stabilizing RNA structures [19,29]. In F3, the increased ATP and NADPH availability may have supported efficient mRNA translation of the C-PC apoprotein and post-translational modifications essential for pigment–protein complex formation. Nevertheless, excess phosphate in the absence of adequate macronutrients may lead to metabolic imbalances, phosphate accumulation, and oxidative stress [29]. Therefore, the optimal performance of F3 confirms that elevated phosphate levels are only beneficial for C-PC biosynthesis when adequate nitrogen and carbon are concurrently available to support the complete biosynthetic machinery.
Interestingly, despite having a lower phosphate concentration (0.25 g/L), F2 also exhibited a significant increase in C-PC production (PCL = 0.5526 mg/mL; PCD = 0.2763 mg/mg). This suggests that adequate availability of carbon and nitrogen alone may still drive efficient pigment production, even under moderate phosphate conditions. In contrast, formulations F4 and F5, which had variable phosphate levels but reduced nitrogen concentrations (3 g/L and 1.5 g/L NaNO₃, respectively), did not show notable improvements in pigment synthesis, indicating that nitrogen was the primary limiting factor in C-PC biosynthesis under these conditions. Statistical analysis (ANOVA) further confirmed that the interactive effects of carbon, nitrogen, and phosphate were significant (p < 0.05) in influencing C-PC production. This reinforces the notion that nutrient balance, rather than individual nutrient concentration, is crucial for optimal pigment biosynthesis.
Notably, both F2 and F3 demonstrated that reducing micronutrient concentrations by up to 50% compared to standard Zarrouk medium did not inhibit growth or pigment production. This highlights the high metabolic flexibility and adaptability of Spirulina sp. when major macronutrients are adequately supplied. Such nutrient efficiency is advantageous for large-scale cultivation, as it can reduce production costs without compromising performance—an observation also reported by Zuorro et al. (2019) in Oscillatoria sp. [30].
The findings of this study confirms that integrated optimization of carbon, nitrogen, and phosphate levels substantially enhances C-PC productivity and quality. Formulations F2 and F3 offer sustainable and economically viable strategies for cultivating Spirulina sp., applicable to biomass and high-value pigment production. These findings open avenues for designing media tailored to the specific metabolic needs of cyanobacteria, with promising applications in functional food, cosmetics, and industrial biotechnology.
4. Materials and Methods
4.1. Experimental Design
This study employed a 2-level full factorial experimental design using the FrF2 package in R to investigate the effects of carbon, nitrogen, and phosphorus sources on the growth rate, biomass productivity, and C-PC production of Spirulina sp. The tested variables included concentrations of NaHCO₃, NaNO₃, and KH₂PO₄ at two levels: 8 and 16 g/L, 1.5 and 3.5 g/L, and 0.25 and 1 g/L, respectively. Eight experimental runs were conducted based on the matrix shown in Table 4.1 over a 14-day cultivation period. The response variables measured at the end of cultivation included OD, dried biomass, and both the quantity and quality of C-PC produced. A standard Zarrouk medium served as the control (Table 4).
Experimental results were visually analyzed using main effect and interaction plots generated via the FrF2 and ggplot packages, to observe trends in the individual and interactive effects of the variables on the responses. In addition, Analysis of Variance (ANOVA) was conducted to assess the statistical significance of each factor and their interactions at a 95% confidence level [31,32].
4.2. Culture and Cultivation Condition
The microalgae used in this study was fresh Spirulina sp. obtained from Balai Perikanan Budidaya Air Payau (BPBAP) Situbondo, East Java. The culture was transferred into sterilized Zarrouk medium and cultivated at 25°C under fluorescent light. During the experimental cultivation, microalgal cultures were grown in eight different nutrient compositions (F1–F8) as detailed in Table 5. Micronutrient and trace element concentrations were reduced to 50% of those in the standard Zarrouk formulation [30,33]. The NaCl concentration remained the same as in the standard medium—1 g/L—as this salinity level is optimal for the growth of Spirulina sp. [34].

Table 5.
Nutrient composition of the growth medium for Spirulina sp.
| Component | Zarrouk (g/L) |
F1 (g/L) |
F2 (g/L) |
F3 (g/L) |
F4 (g/L) |
F5 (g/L) |
F6 (g/L) |
F7 (g/L) |
F8 (g/L) |
|---|---|---|---|---|---|---|---|---|---|
|
NaHCO3 NaNO3 K2HPO4 |
16.8 | 8 | 16 | 16 | 16 | 16 | 8 | 8 | 8 |
| 1.5 | 1.5 | 5 | 5 | 1.5 | 1.5 | 5 | 5 | 1.5 | |
| 0.5 | 0.25 | 0.25 | 1 | 0.25 | 1 | 0.25 | 1 | 1 | |
| NaCl CaCl2.2H2O FeSO4.7H2O Na2EDTA K2SO4 MgSO4.7H2O |
1 | 1 | 1 | 1 | 1 | 1 | 1 | 1 | 1 |
| 0.04 | 0.02 | 0.02 | 0.02 | 0.02 | 0.02 | 0.02 | 0.02 | 0.02 | |
| 0.01 | 0.005 | 0.005 | 0.005 | 0.005 | 0.005 | 0.005 | 0.005 | 0.005 | |
| 0.08 | 0.04 | 0.04 | 0.04 | 0.04 | 0.04 | 0.04 | 0.04 | 0.04 | |
| 1 | 0.5 | 0.5 | 0.5 | 0.5 | 0.5 | 0.5 | 0.5 | 0.5 | |
| 0.2 | 0.1 | 0.1 | 0.1 | 0.1 | 0.1 | 0.1 | 0.1 | 0.1 | |
| Trace element | 1 mL | 0.5 mL | 0.5 mL | 0.5 mL | 0.5 mL | 0.5 mL | 0.5 mL | 0.5 mL | 0.5 mL |
Cultures were grown in 500 mL photobioreactors containing 250 mL of sterilized nutrient medium. Cultivation was carried out over 14 days at 25°C under continuous illumination of 5000 lux with a 12:12 light-dark photoperiod. OD at 680 nm was measured daily to monitor growth. The specific growth rate (μ) was calculated using the following equation [31,35]:
4.3. Dried Biomass and Prodoductivity Analysis
Spirulina sp. biomass was separated from the culture medium through filtration, washed with distilled water to remove surface-bound inorganic compounds, and then dried at 60°C until a constant weight was achieved. The dried biomass and productivity were determined using the following equations [35,36]:
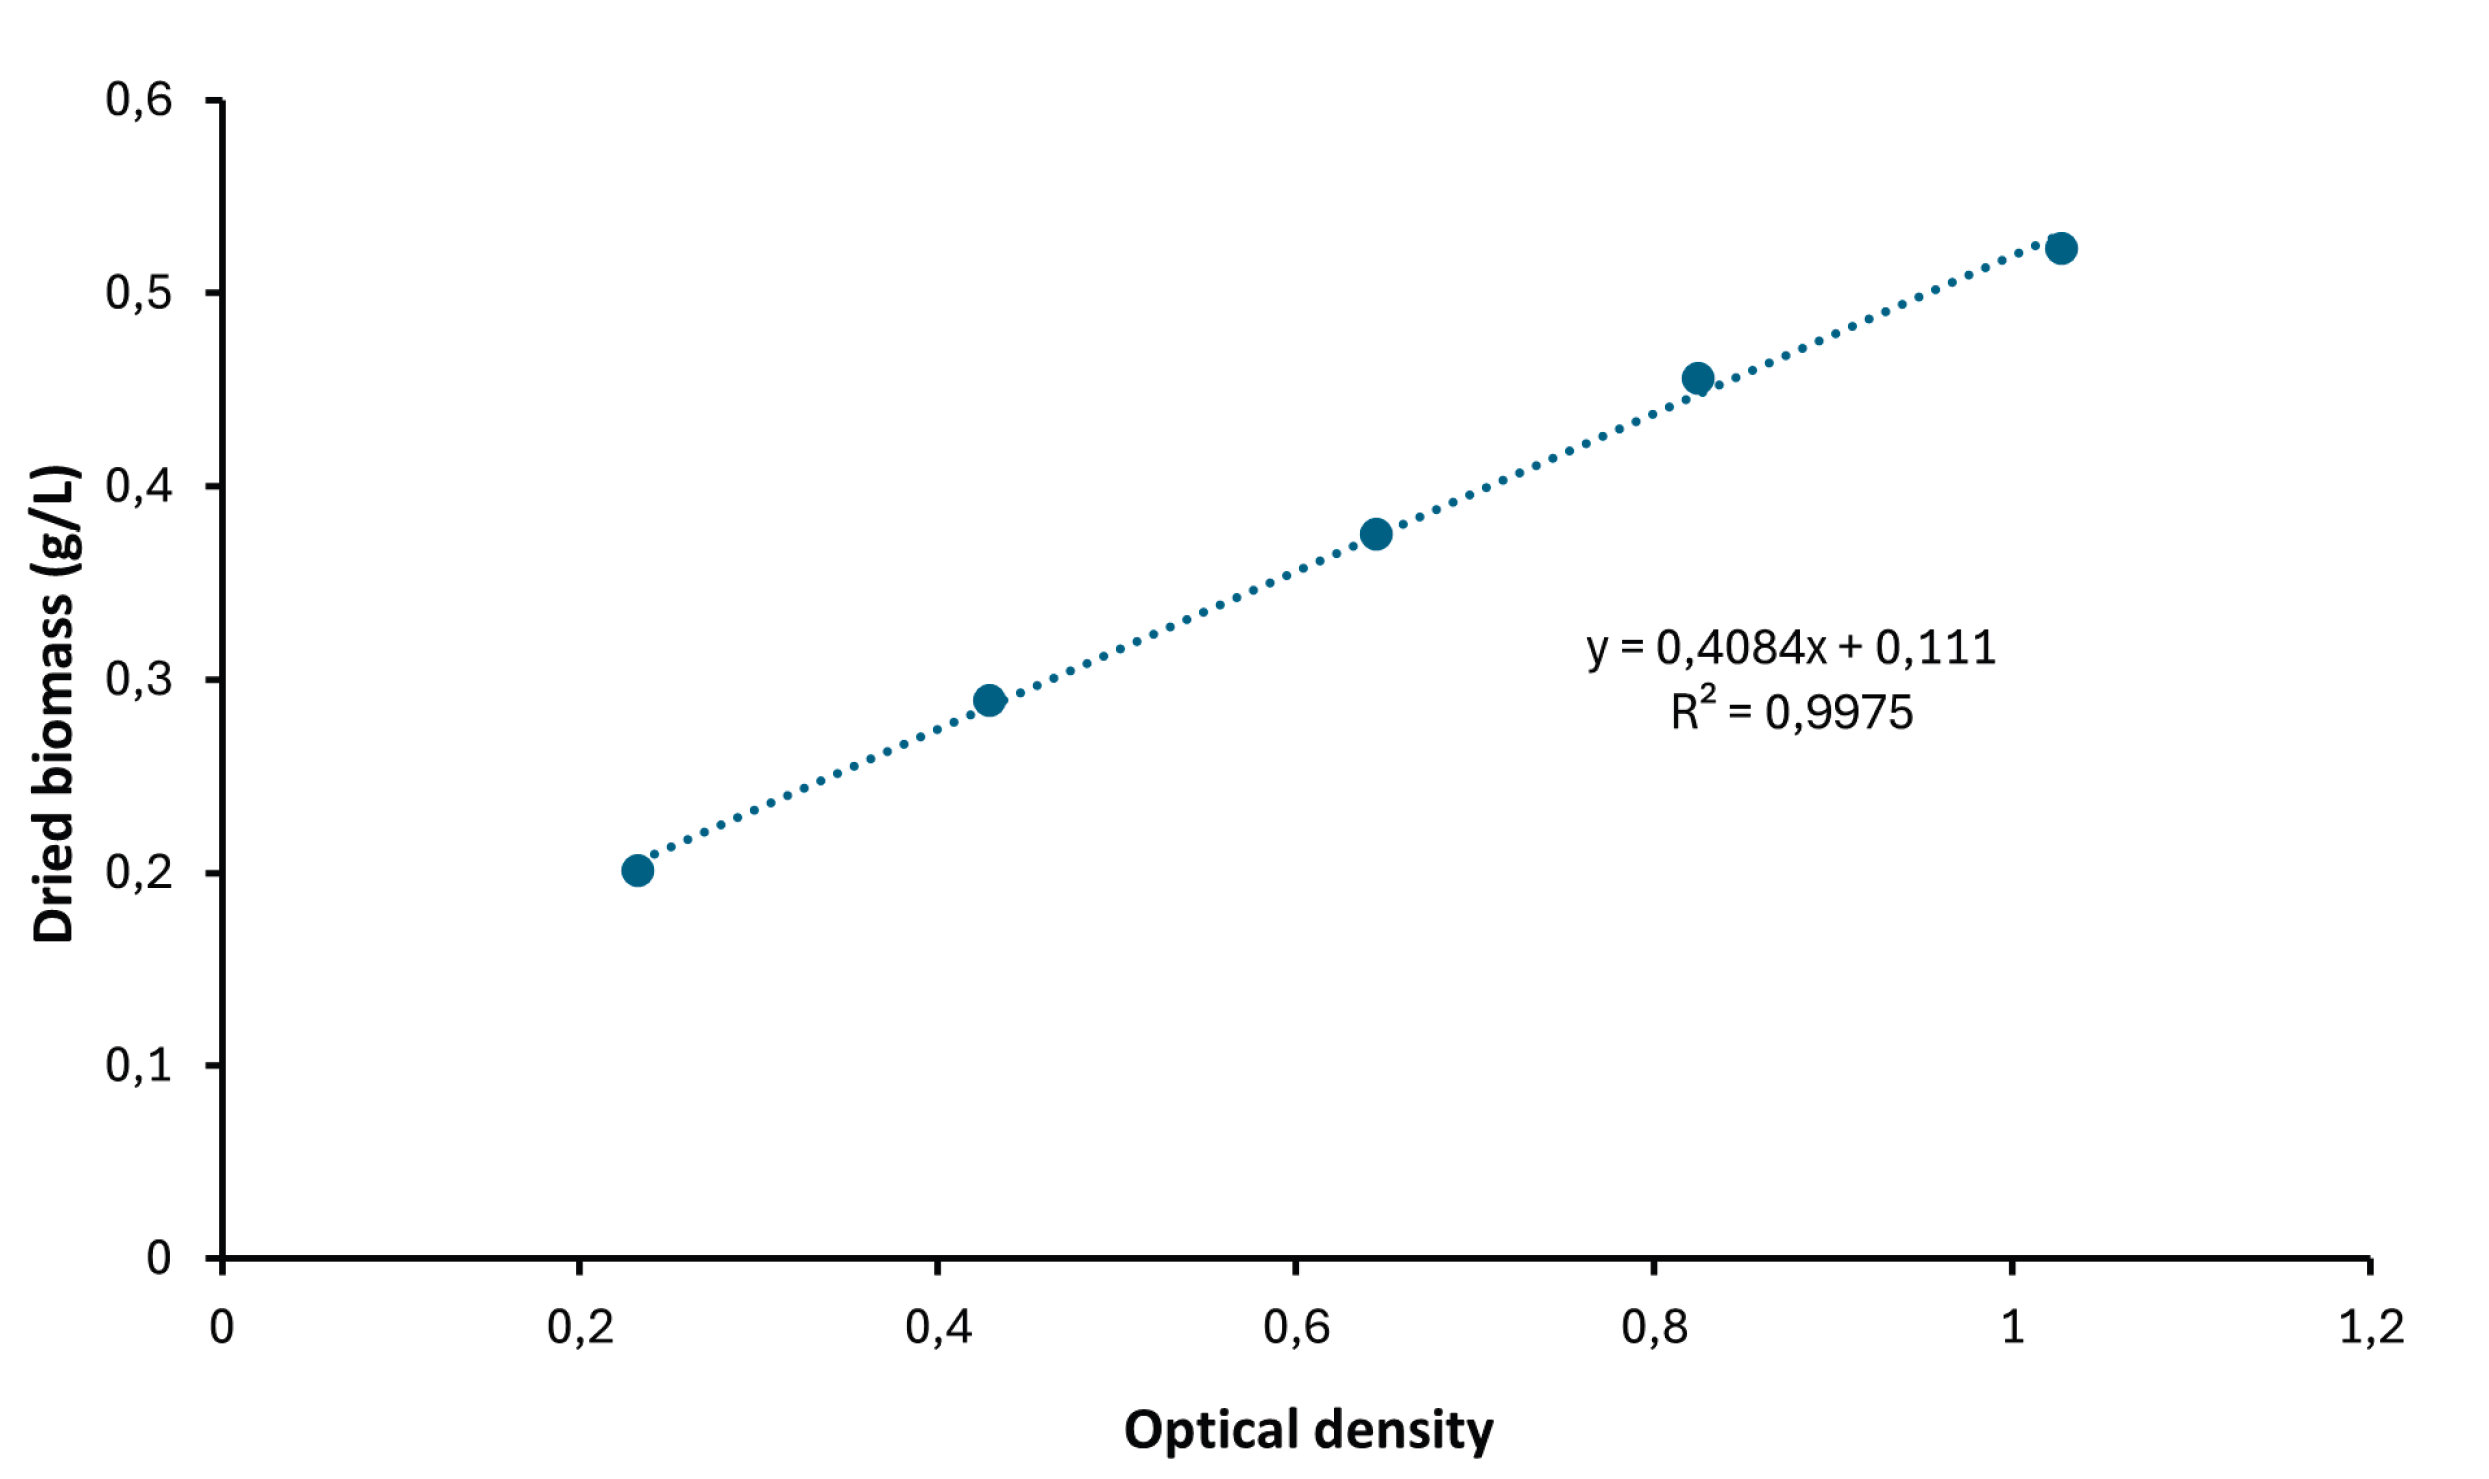
Daily biomass values were estimated using a regression equation derived from the calibration curve of optical density versus dried weight biomass (see Appendix A).
4.4. C-Phycocyanin (C-PC) Content Analysis
C-PC content was analyzed spectrophotometrically, following the method described by Bennett & Bogorad (1978) [22]. Extraction was performed using a freeze-thaw technique involving cycles of freezing and thawing dry Spirulina biomass. Specifically, 100 mg of dry biomass was suspended in 10 mL of 0.2 M phosphate buffer at pH 7. The sample was homogenized and stored at –4°C for 24 hours, then held at room temperature for 20 minutes. This cycle was repeated twice to maximize extraction efficiency. The suspension was then centrifuged, and the blue-colored supernatant was collected for analysis [37,38].
Absorbance measurements were taken using a UV-Vis spectrophotometer at 615 nm, 652 nm, and 280 nm. The C-PC content in the liquid extract (PCL), C-PC content in the dried biomass (PCD), and purity index (PI) were calculated using the following equations [22]:
5. Conclusions
This study demonstrated that targeted modification of nutrient composition in the cultivation medium significantly enhances both biomass accumulation and C-PC production in Spirulina sp. The optimized medium F2, composed of 16 g/L NaHCO₃, 5 g/L NaNO₃, and 0.25 g/L K₂HPO₄, yielded the highest biomass productivity, with improvements of 37.25% in dry biomass concentration and 37.5% in daily productivity relative to the standard Zarrouk medium. Conversely, medium F3, formulated with the same bicarbonate and nitrate concentrations but with a higher phosphate level (1 g/L K₂HPO₄), proved superior in enhancing C-PC yield and purity. F3 achieved a 40.23% increase in PI and nearly doubled both PCL and PCD compared to the control. Compared to previous studies, these formulations provided higher C-PC yields per biomass unit, offering a strategic basis for tailored cultivation in microalgal bioproduct development.
Author Contributions
Conceptualization, I.N., T.S., K.M. and A.H.; methodology, I.N.; Formal analysis, I.N. and A.H.; Investigation, I.N. and L.A.; Data curation, I.N.; writing—original draft preparation, I.N.; writing—review and editing, I.N., L.A., A.H. T.S. and K.M; visualization, I.N.; supervision, T.S. and K.M; funding acquisition, K.M. All authors have read and agreed to the published version of the manuscript.
Funding
This research was funded by Japan International Cooperation Agency (JICA) and the Japan Science and Technology Agency (JST) under the Science and Technology Research Partnership for Sustainable Development (SATREPS) program, grant number JPMJSA2204.
Institutional Review Board Statement
Not applicable.
Informed Consent Statement
Not applicable.
Data Availability Statement
Data is contained within the article.
Acknowledgments
The authors gratefully acknowledge the Central Laboratory and the Center for Biotechnology and Bioinformatics Research, Universitas Padjadjaran, for their valuable support and provision of research facilities essential to this study.
Conflicts of Interest
The authors declare no conflict of interest.
Abbreviations
The following abbreviations are used in this manuscript:
| 3-PGA | 3-phosphoglicerate |
| ALA | aminolevulinic acid |
| ANOVA | Analysis of Variance |
| BBM | Bold Basal Medium |
| BG-11 | Blue Green-11 |
| C | Control |
| CA | Carbonic anhydrase |
| C-PC | C-Phycocyanin |
| F1-F8 | Formulations 1-8 |
| GAP | glyceraldehide-3-phosphate |
| OD | Optical density |
| PCB | Phycocyanobilin |
| PCD | Phycocyanin content in dried biomass |
| PCL | Phycocyanin content in liquid |
| PI | Purity index |
| RuBisCo | Ribulose-1,5-bisphosphate carboxylase/oxygenase |
Appendix A
Table A1.
Calibration curve data of optical density versus dry biomass of Spirulina sp.
| OD | Dried biomass (g/L) | |
| Simplo | 1.000 | 0.572 |
| 0.817 | 0.492 | |
| 0.621 | 0.390 | |
| 0.418 | 0.336 | |
| 0.223 | 0.234 | |
| Duplo | 1.055 | 0.474 |
| 0.831 | 0.420 | |
| 0.668 | 0.360 | |
| 0.439 | 0.242 | |
| 0.242 | 0.168 | |
| Average | 1.027 | 0.523 |
| 0.824 | 0.456 | |
| 0.644 | 0.375 | |
| 0.428 | 0.289 | |
| 0.232 | 0.201 |
Figure A1.
Calibration curve of optical density versus dried biomass of Spirulina sp.
References
- El-Shall NA, Jiang S, Farag MR, Azzam M, Al-Abdullatif AA, Alhotan R, et al. 2023. Potential of Spirulina platensis as a feed supplement for poultry to enhance growth performance and immune modulation. Front Immunol.
- Fais G, Manca A, Bolognesi F, Borselli M, Concas A, Busutti M, et al. 2022. Wide Range Applications of Spirulina: From Earth to Space Missions. Mar Drugs.
- Calella P, Cerullo G, Di Dio M, Liguori F, Di Onofrio V, Gallè F, et al. 2022. Antioxidant, anti-inflammatory and immunomodulatory effects of spirulina in exercise and sport: A systematic review. Front Nutr.
- Fernandes R, Campos J, Serra M, Fidalgo J, Almeida H, Casas A, et al. 2023. Exploring the Benefits of Phycocyanin: From Spirulina Cultivation to Its Widespread Applications. Pharmaceuticals.
- Ashaolu TJ, Samborska K, Lee CC, Tomas M, Capanoglu E, Tarhan Ö, et al. 2021. Phycocyanin, a super functional ingredient from algae; properties, purification characterization, and applications. Int J Biol Macromol, 2331.
- Pinto LFR, Ferreira GF, Beatriz FP, Cabral FA, Filho RM. 2022. Lipid and phycocyanin extractions from Spirulina and economic assessment. Journal of Supercritical Fluids.
- Nikolova K, Petkova N, Mihaylova D, Gentscheva G, Gavrailov G, Pehlivanov I, et al. 2024. Extraction of Phycocyanin and Chlorophyll from Spirulina by “Green Methods”. Separations 2024, Vol. 11, Page 57.
- Gorgich M, Passos MLC, Mata TM, Martins AA, Saraiva MLMFS, Caetano NS. 2020. Enhancing extraction and purification of phycocyanin from Arthrospira sp. with lower energy consumption. Energy Reports.
- Kaewdam S, Jaturonglumlert S, Varith J, Nitatwichit C, Narkprasom K. 2019. Kinetic Models for Phycocyanin Production by Fed-Batch Cultivation of the Spirulina plantesis. International Journal of GEOMATE.
- Pez Jaeschke D, Rocha Teixeira I, Damasceno Ferreira Marczak L, Domeneghini Mercali G. 2021. Phycocyanin from Spirulina: A review of extraction methods and stability. Food Research International.
- Hsieh-Lo M, Castillo G, Ochoa-Becerra MA, Mojica L. 2019. Phycocyanin and phycoerythrin: Strategies to improve production yield and chemical stability. Algal Res.
- Freire Balseca DA, Castro Reyes KS, Maldonado Rodríguez ME. 2024. Optimization of an Alternative Culture Medium for Phycocyanin Production from Arthrospira platensis under Laboratory Conditions. Microorganisms.
- Yu Y, Hou X, Yu Q, Huo Y, Wang K, Wen X, et al. 2023. A novel two-stage culture strategy to enhance the C-phycocyanin productivity and purity of Arthrospira platensis. LWT.
- Manirafasha E, Murwanashyaka T, Ndikubwimana T, Rashid Ahmed N, Liu J, Lu Y, et al. 2018. Enhancement of cell growth and phycocyanin production in Arthrospira (Spirulina) platensis by metabolic stress and nitrate fed-batch. Bioresour Technol.
- Nur MMA, Garcia GM, Boelen P, Buma AGJ. 2019. Enhancement of C-phycocyanin productivity by Arthrospira platensis when growing on palm oil mill effluent in a two-stage semi-continuous cultivation mode. J Appl Phycol, 2867.
- Chen, G. 2023. Metabolites of microalgae. Algal Biotechnology.
- Magwell PFR, Djoudjeu KT, Minyaka E, Tavea MF, Fotsop OW, Tagnikeu RF, et al. 2023. Sodium Bicarbonate (NaHCO3) Increases Growth, Protein and Photosynthetic Pigments Production and Alters Carbohydrate Production of Spirulina platensis. Curr Microbiol.
- El-Sheekh MM, Hassan LHS, Morsi HH. 2021. Growth enhancement of spirulina platensis through optimization of media and nitrogen sources. Egyptian Journal of Botany.
- Bossa R, Di Colandrea M, Salbitani G, Carfagna S. 2024. Phosphorous Utilization in Microalgae: Physiological Aspects and Applied Implications. Plants.
- Su, Y. 2021. Revisiting carbon, nitrogen, and phosphorus metabolisms in microalgae for wastewater treatment. Science of the Total Environment.
- Qian W, Yang Y, Chou S, Ge S, Li P, Wang X, et al. 2023. Effect of N/P ratio on attached microalgae growth and the differentiated metabolism along the depth of biofilm. Environ Res, 7428.
- Bennett A, Bogorad L. 1978. Complementary Chromatic Adaptation in a Filamentous Blue-green Alga. J Cell Biol.
- Li P, Hu Z, Yin Q, Song C. 2023. Improving the growth of Spirulina in CO2 absorption and microalgae conversion (CAMC) system through mixotrophic cultivation: Reveal of metabolomics. Science of the Total Environment.
- Rockwell NC, Martin SS, Lagarias JC. 2023. Elucidating the origins of phycocyanobilin biosynthesis and phycobiliproteins. Proc Natl Acad Sci U S A.
- Wu H, Zhang W, Huang X, Gu P, Li Q, Luo X, et al. 2023. Phosphorus conditions change the cellular responses of Microcystis aeruginosa to perfluorooctanoic acid. Science of The Total Environment, 6707.
- Yu F, Wang Z, Zhang Z, Zhou J, Li J, Chen J, et al. 2024. Biosynthesis, acquisition, regulation, and upcycling of heme: recent advances. Crit Rev Biotechnol.
- El-Sheekh MM, Hassan LHS, Morsi HH. 2021. Growth enhancement of spirulina platensis through optimization of media and nitrogen sources. Egyptian Journal of Botany.
- Su, Y. 2021. Revisiting carbon, nitrogen, and phosphorus metabolisms in microalgae for wastewater treatment. Science of the Total Environment, 4590. [Google Scholar]
- Solovchenko A, Gorelova O, Karpova O, Selyakh I, Semenova L, Chivkunova O, et al. 2020. Phosphorus Feast and Famine in Cyanobacteria: Is Luxury Uptake of the Nutrient Just a Consequence of Acclimation to Its Shortage? Cells.
- Zuorro A, Leal-Jerez AG, Morales-Rivas LK, Mogollón-Londoño SO, Sanchez-Galvis EM, García-Martínez JB, et al. 2021. Enhancement of Phycobiliprotein Accumulation in Thermotolerant Oscillatoria sp. Through Media Optimization. ACS Omega, 1053.
- Nurrusyda FS, Subroto T, Hardianto A, Sumeru HA, Ishmayana S, Pratomo U, et al. 2024. Analyzing the Impact of Physicochemical Factors on Chlorella vulgaris Growth Through Design of Experiment (DoE) for Carbon Capture System. Mol Biotechnol.
- Barton EE, Lloyd BP, Spriggs AD, Gast DL. 2018. Visual Analysis of Graphic Data. Single Case Research Methodology.
- Cunningham BR, John SG. 2017. The effect of iron limitation on cyanobacteria major nutrient and trace element stoichiometry. Limnol Oceanogr.
- Abd El-Monem AM, Gharieb MM, Doman KM. 2021. Chemical Constituents of Zarrouk’s Medium Affect Growth, Pigments and Metabolites Productions of Spirulina platensis. Egyptian Journal of Botany.
- Zhu CJ, Lee YK. 1997. Determination of biomass dry weight of marine microalgae. J Appl Phycol.
- Devi AC, Tavanandi HA, Govindaraju K, Raghavarao KSMS. 2020. An effective method for extraction of high purity phycocyanins (C-PC and A-PC) from dry biomass of Arthrospira maxima. J Appl Phycol, 1151.
- Chen CY, Kao PC, Tsai CJ, Lee DJ, Chang JS. 2013. Engineering strategies for simultaneous enhancement of C-phycocyanin production and CO2 fixation with Spirulina platensis. Bioresour Technol.
- Patel A, Mishra S, Pawar R, Ghosh PK. 2005. Purification and characterization of C-Phycocyanin from cyanobacterial species of marine and freshwater habitat. Protein Expr Purif.
Figure 2.
Main effects of carbon, nitrogen, and phosphorus sources on Spirulina sp. optical density.
Figure 2.
Main effects of carbon, nitrogen, and phosphorus sources on Spirulina sp. optical density.
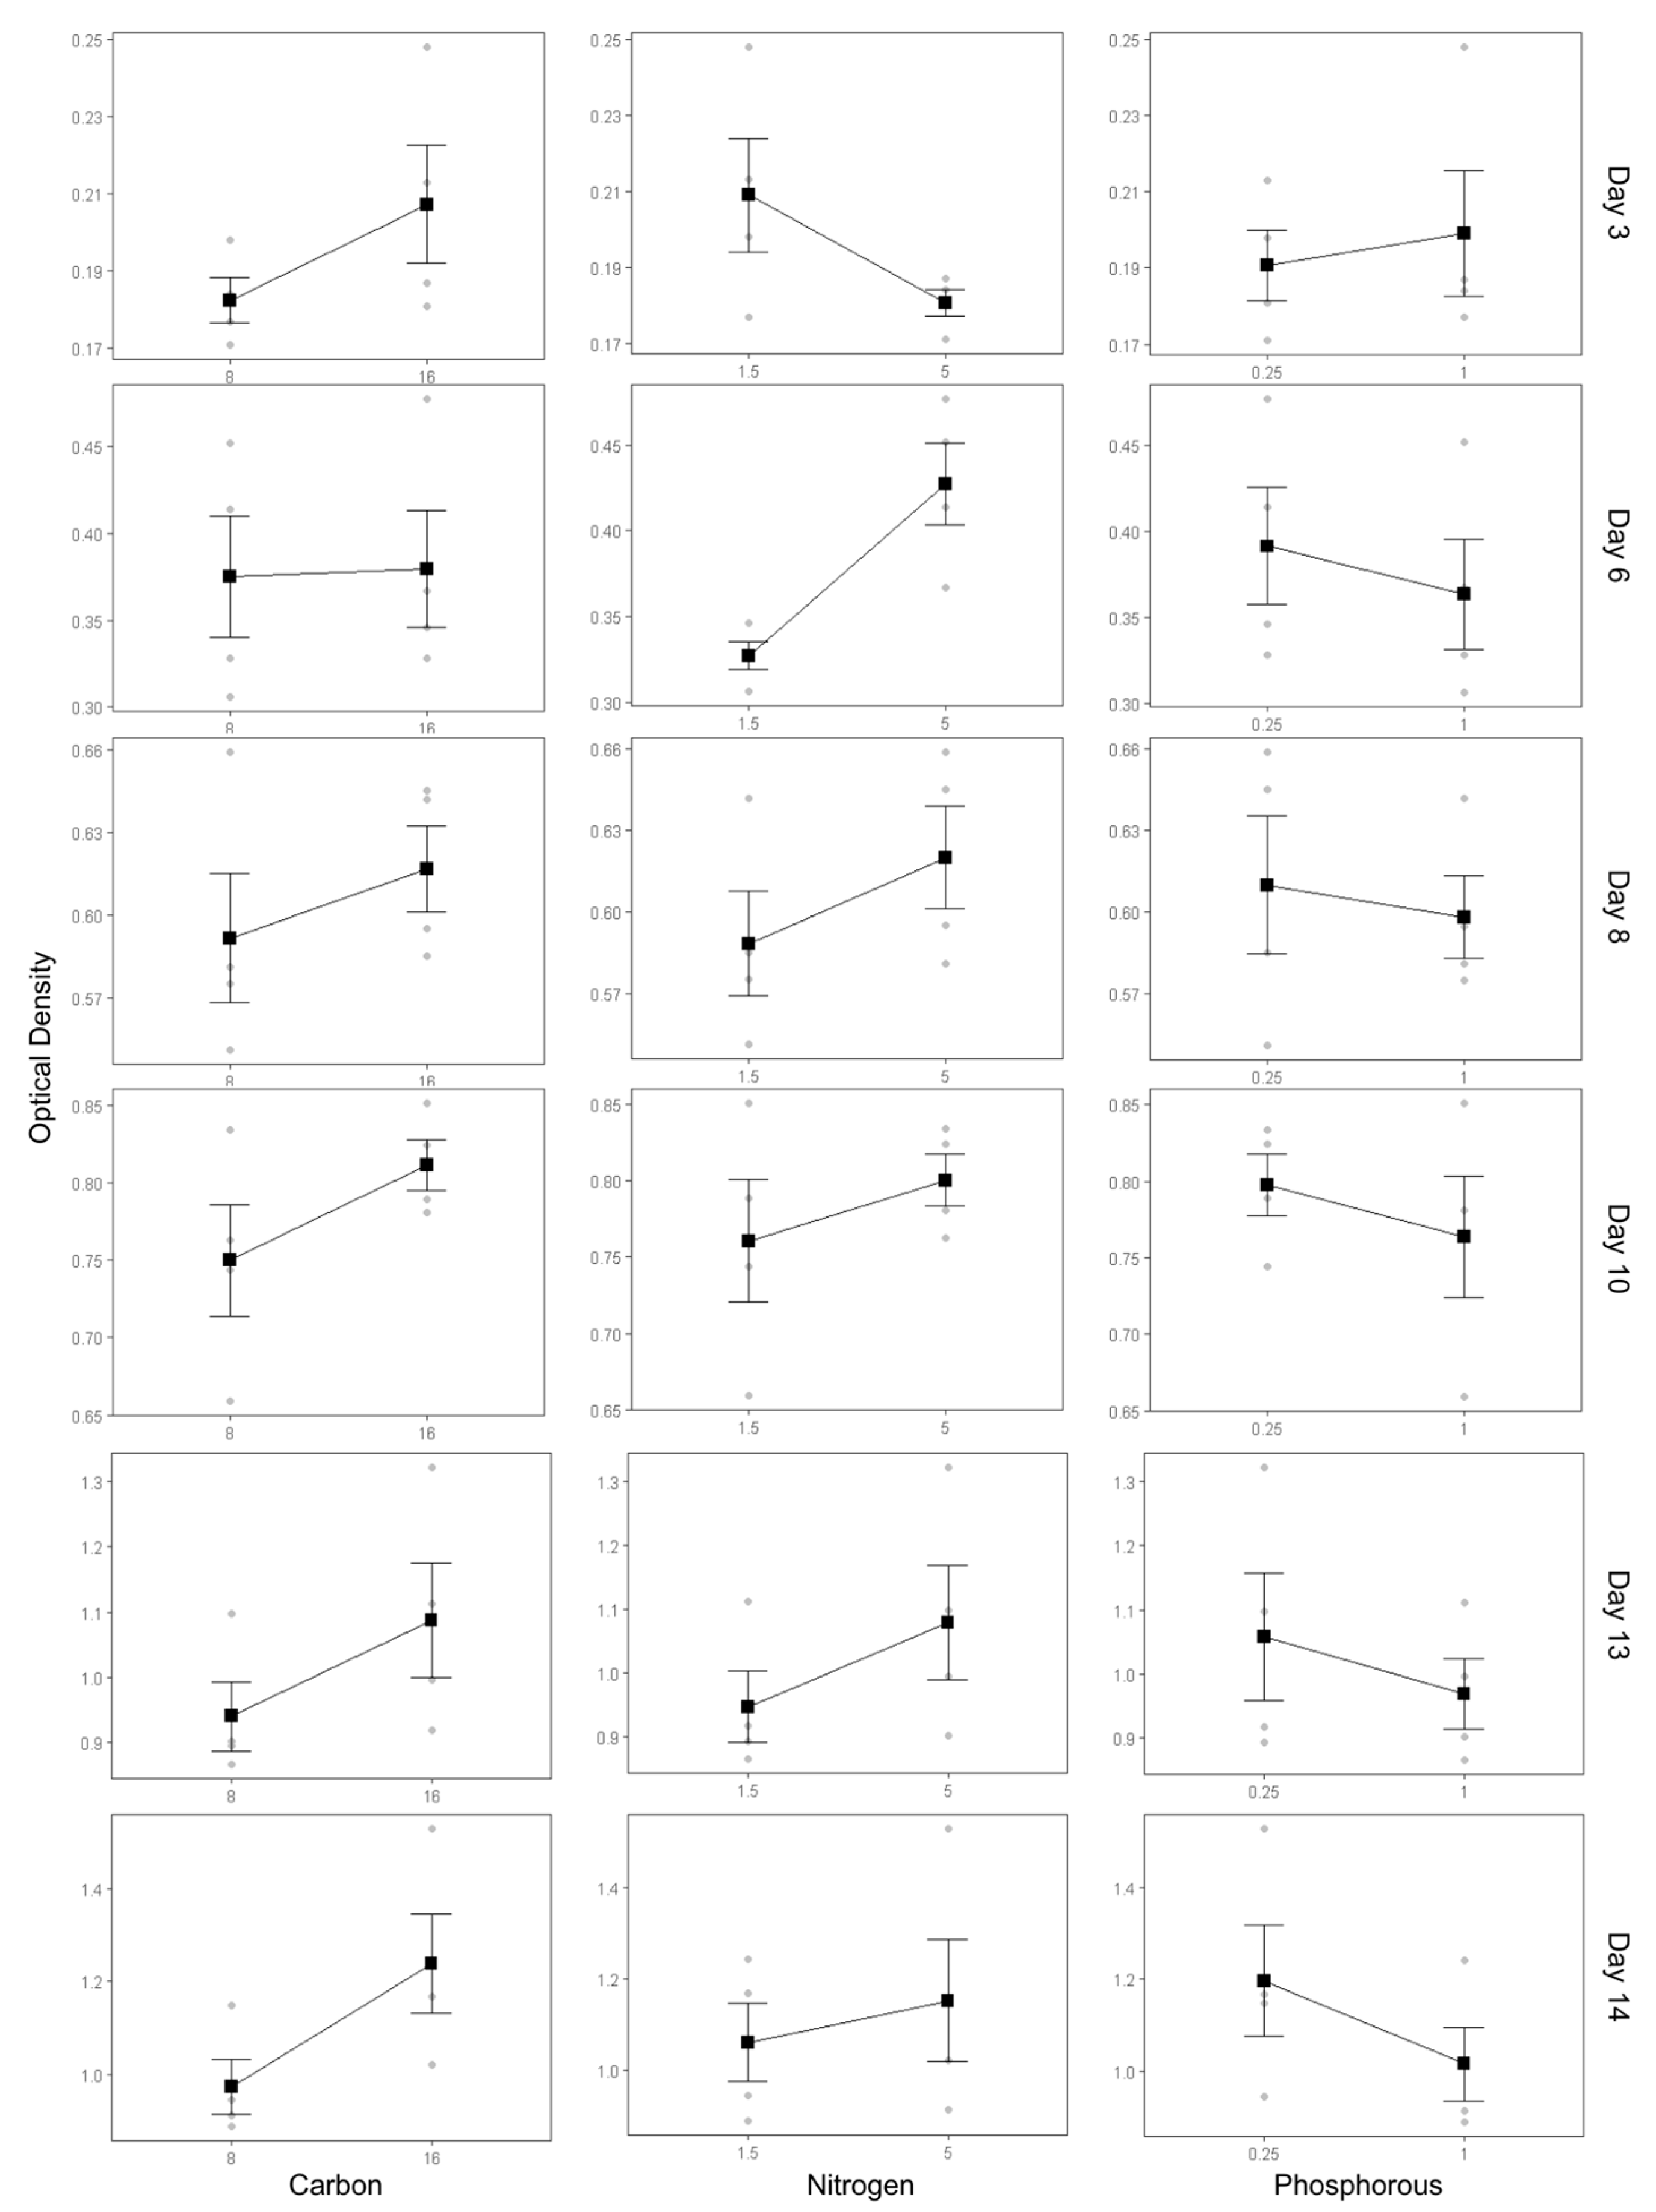
Figure 3.
Interaction plots of nutrient effects on the optical density of Spirulina sp.
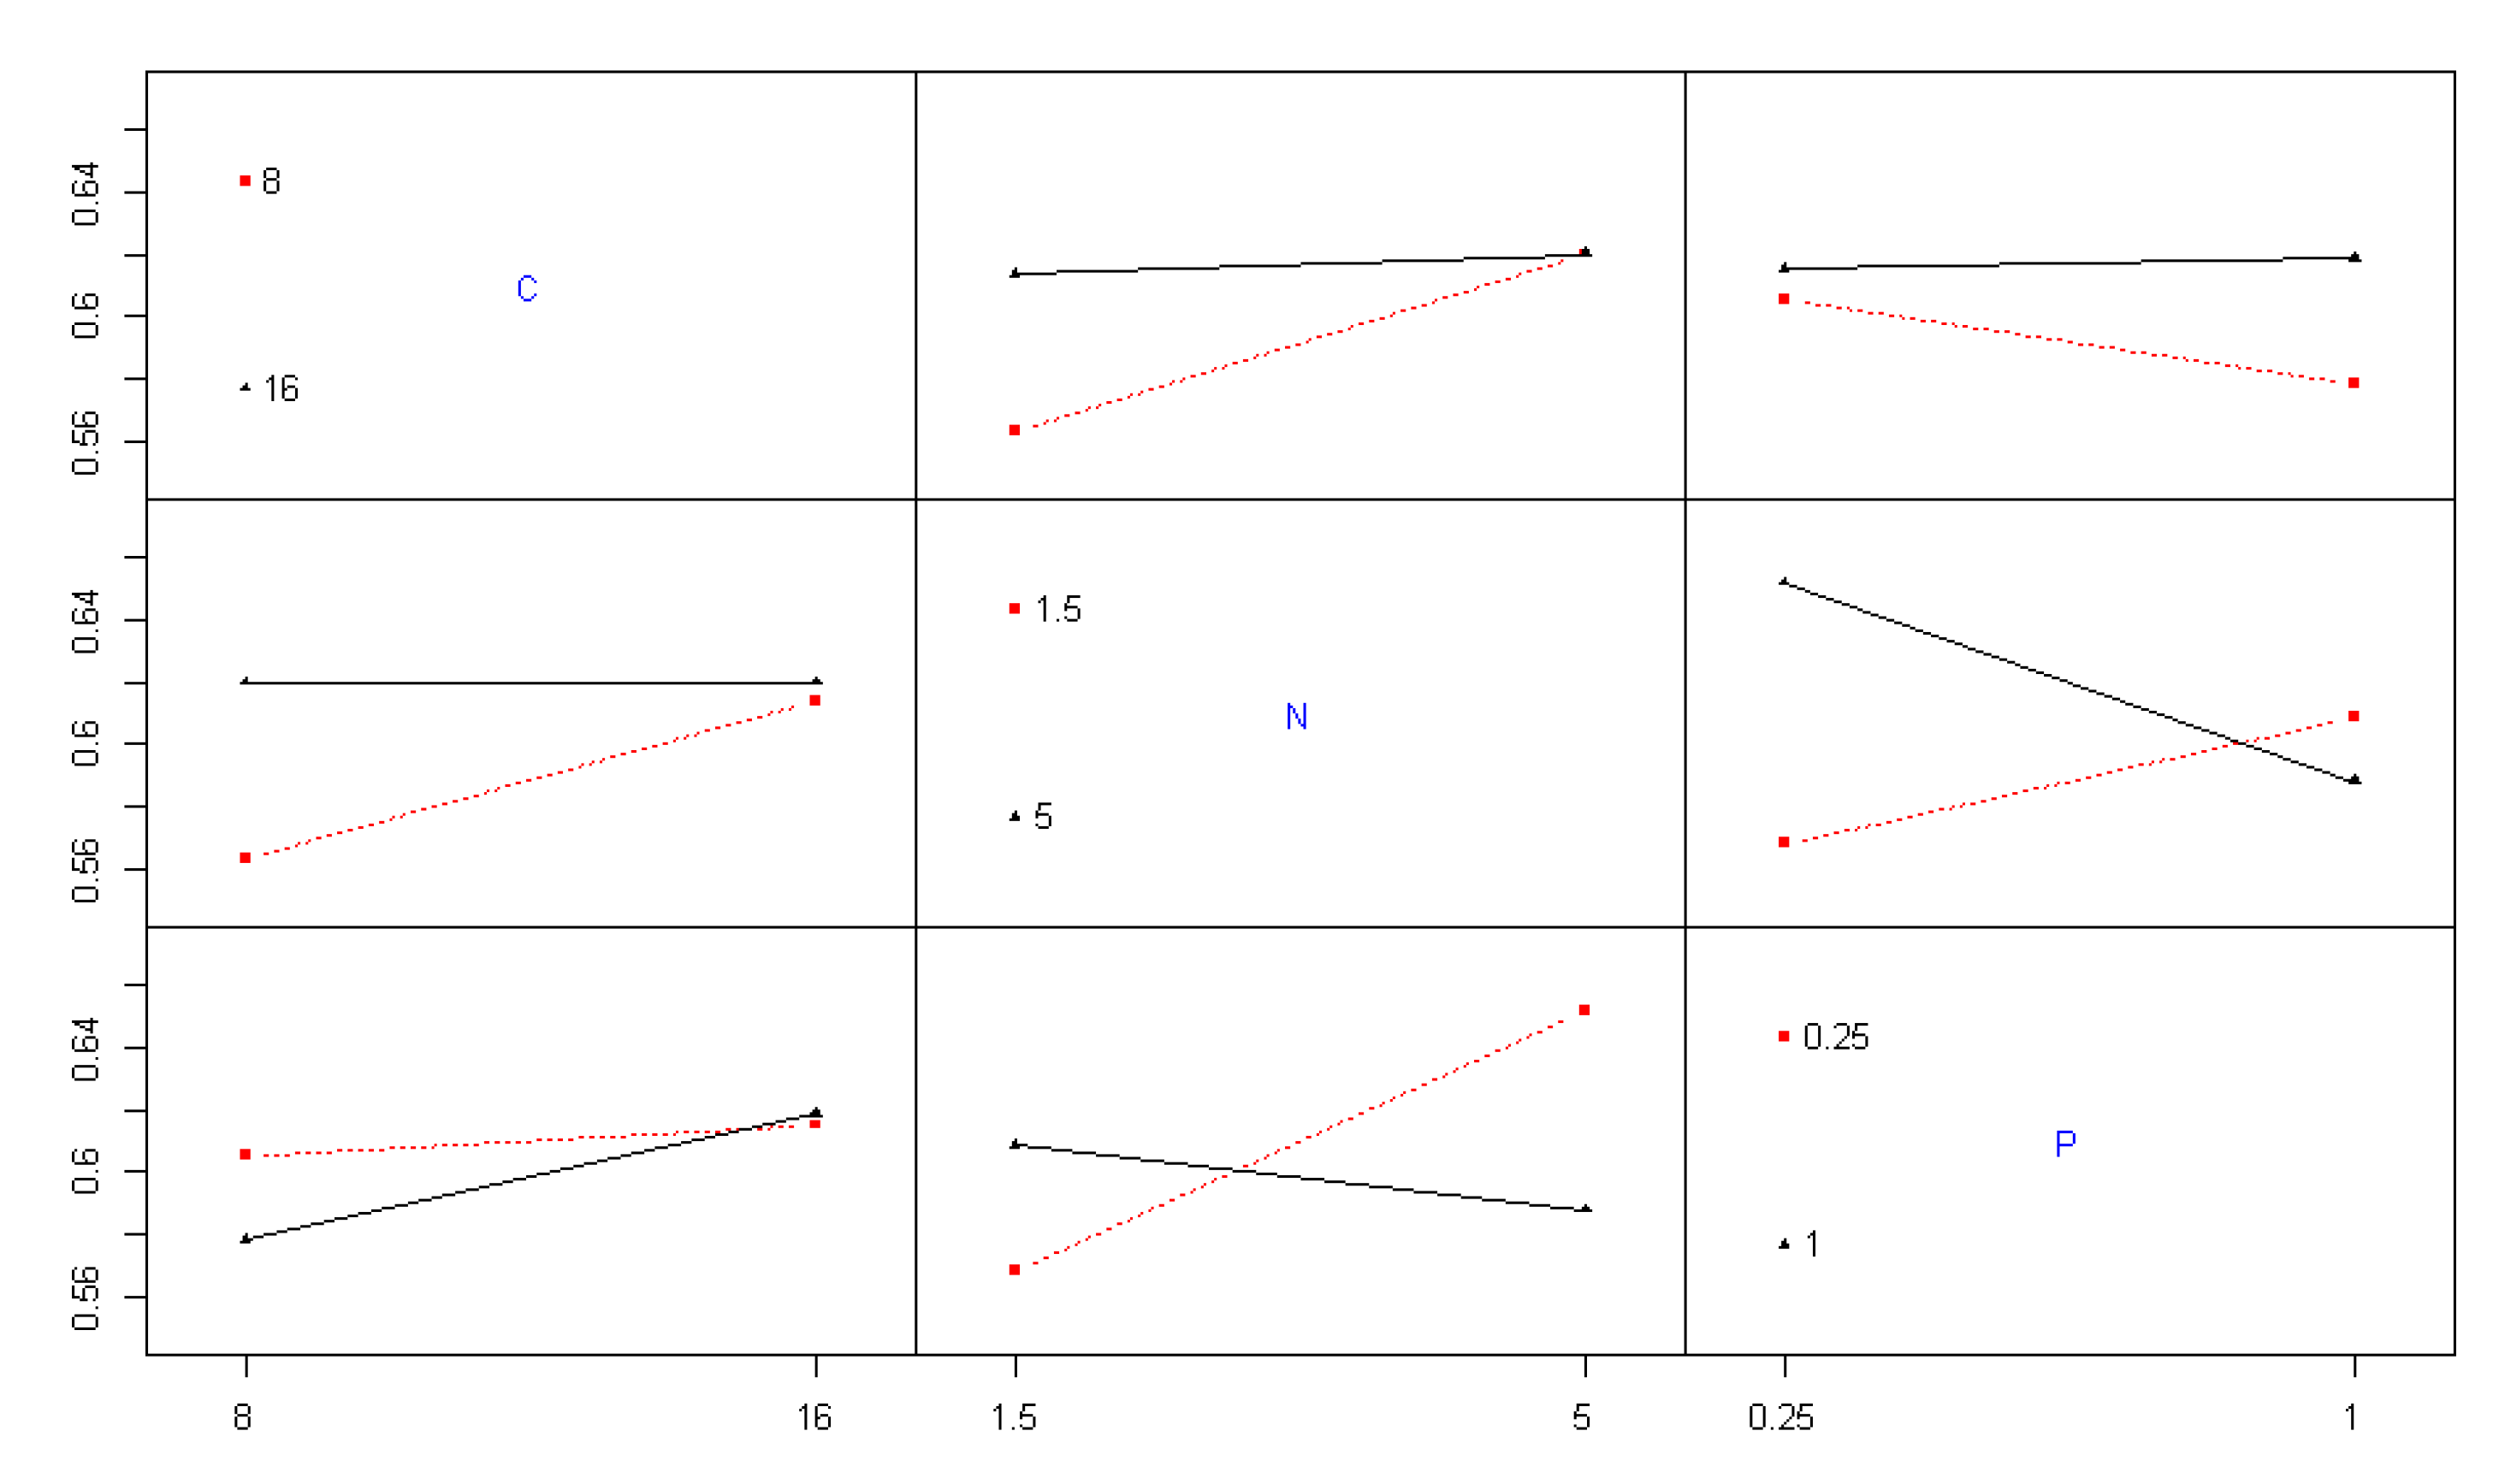
Figure 4.
Dried biomass yield and productivity across different nutrient modification treatments (C: control; F1–F8: formulations 1–8).
Figure 4.
Dried biomass yield and productivity across different nutrient modification treatments (C: control; F1–F8: formulations 1–8).
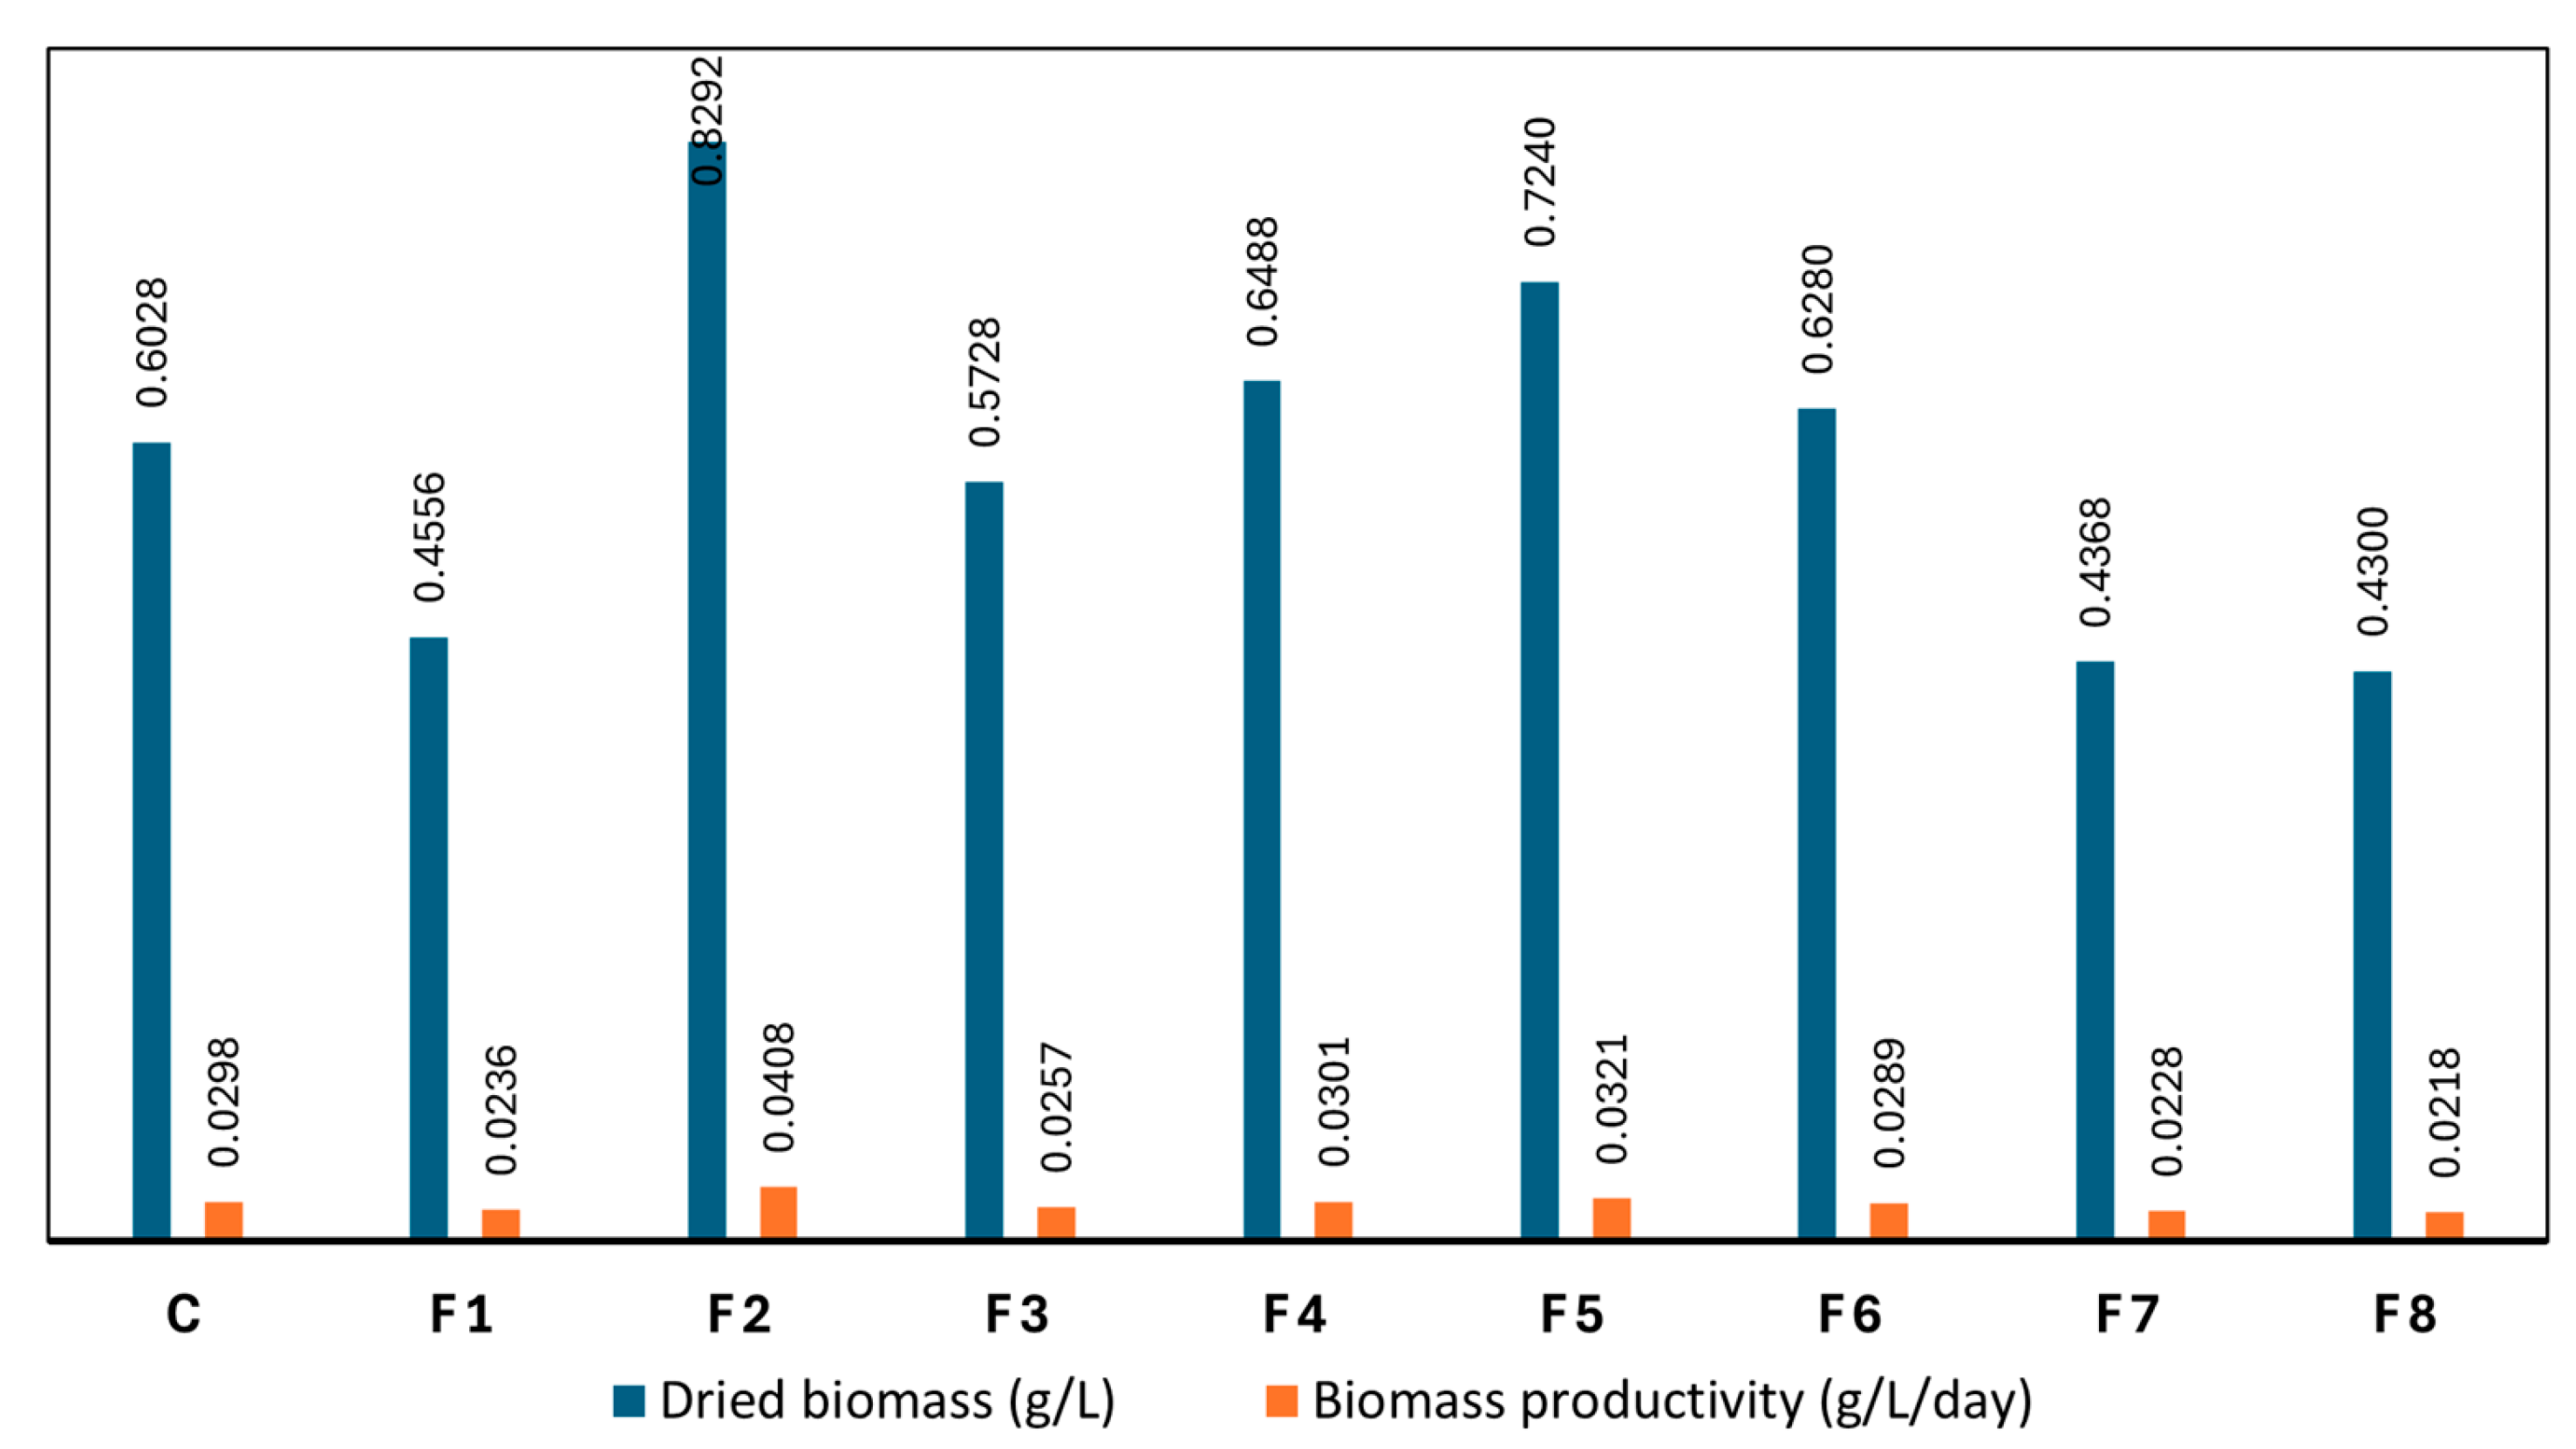
Figure 5.
C-PC content under different nutrient modification treatments (C: control; F1–F8: formulations 1–8; PCL: phycocyanin content in liquid, mg/mL; PCD: phycocyanin content in dried biomass, mg/mg; and PI: purity index).
Figure 5.
C-PC content under different nutrient modification treatments (C: control; F1–F8: formulations 1–8; PCL: phycocyanin content in liquid, mg/mL; PCD: phycocyanin content in dried biomass, mg/mg; and PI: purity index).
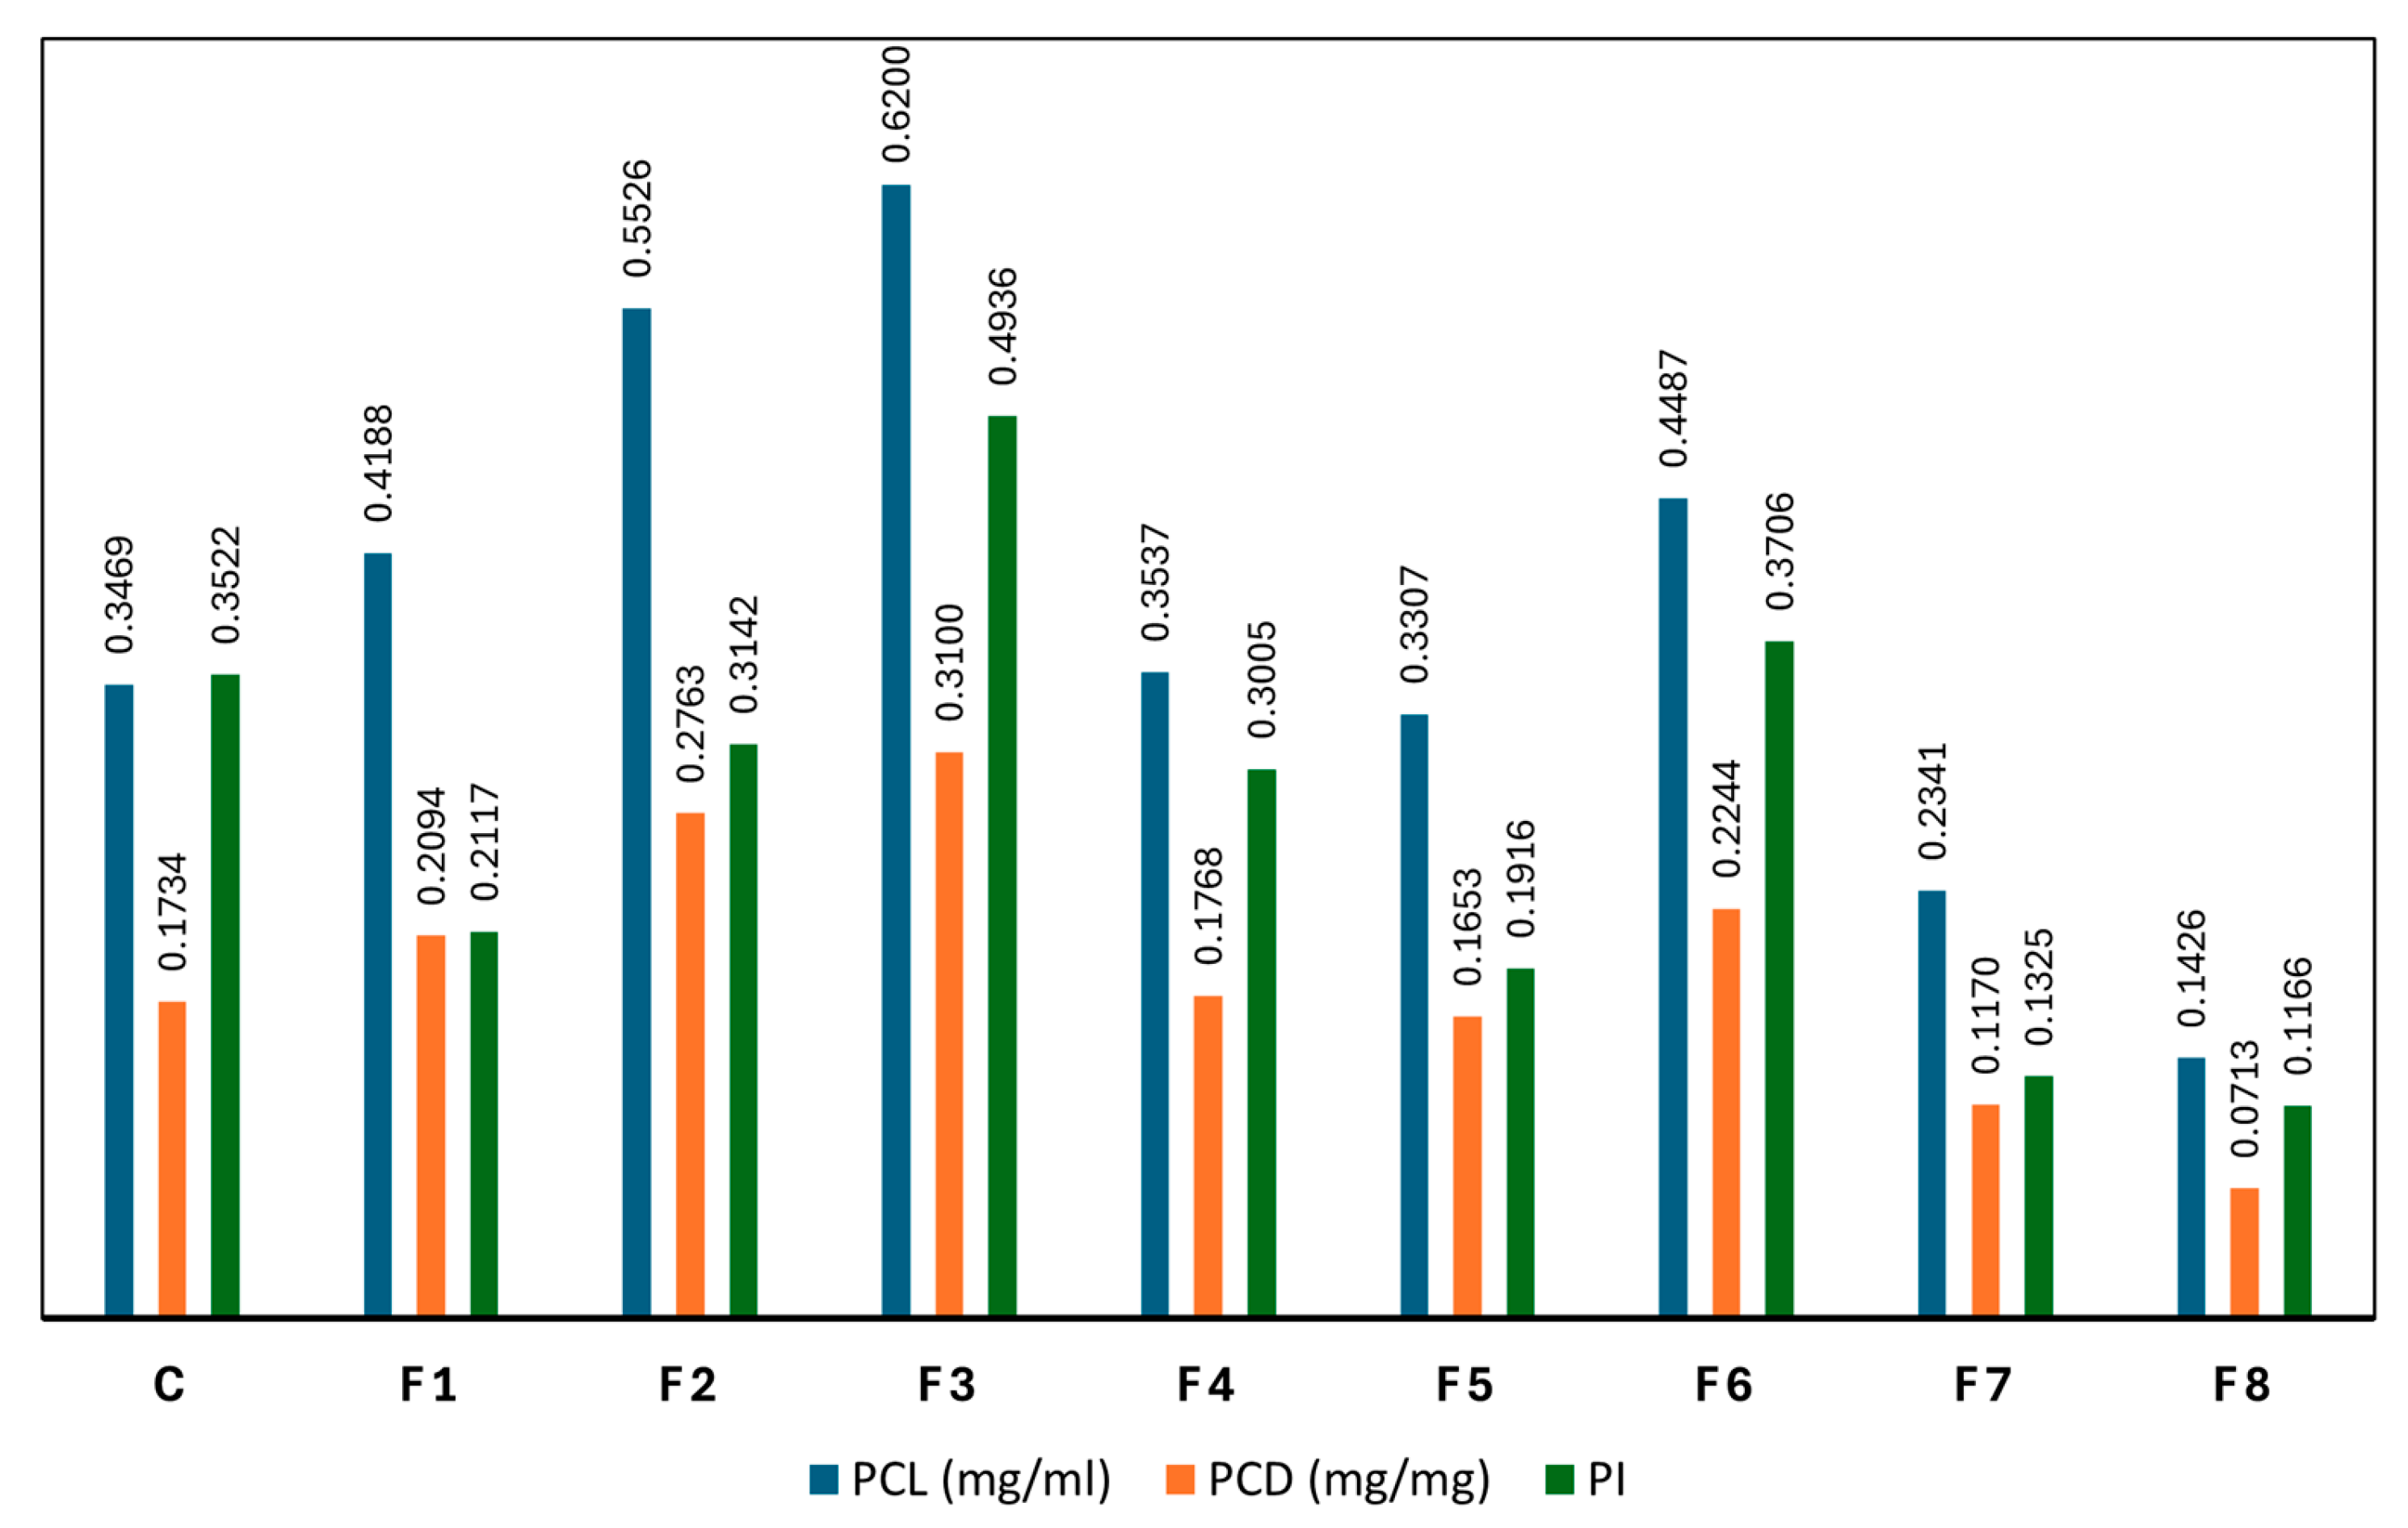
Figure 6.
Main effects of carbon, nitrogen, and phosphorus sources on PCL (phycocyanin content in liquid), PCD (phycocyanin content in dried biomass), and PI (purity index).
Figure 6.
Main effects of carbon, nitrogen, and phosphorus sources on PCL (phycocyanin content in liquid), PCD (phycocyanin content in dried biomass), and PI (purity index).
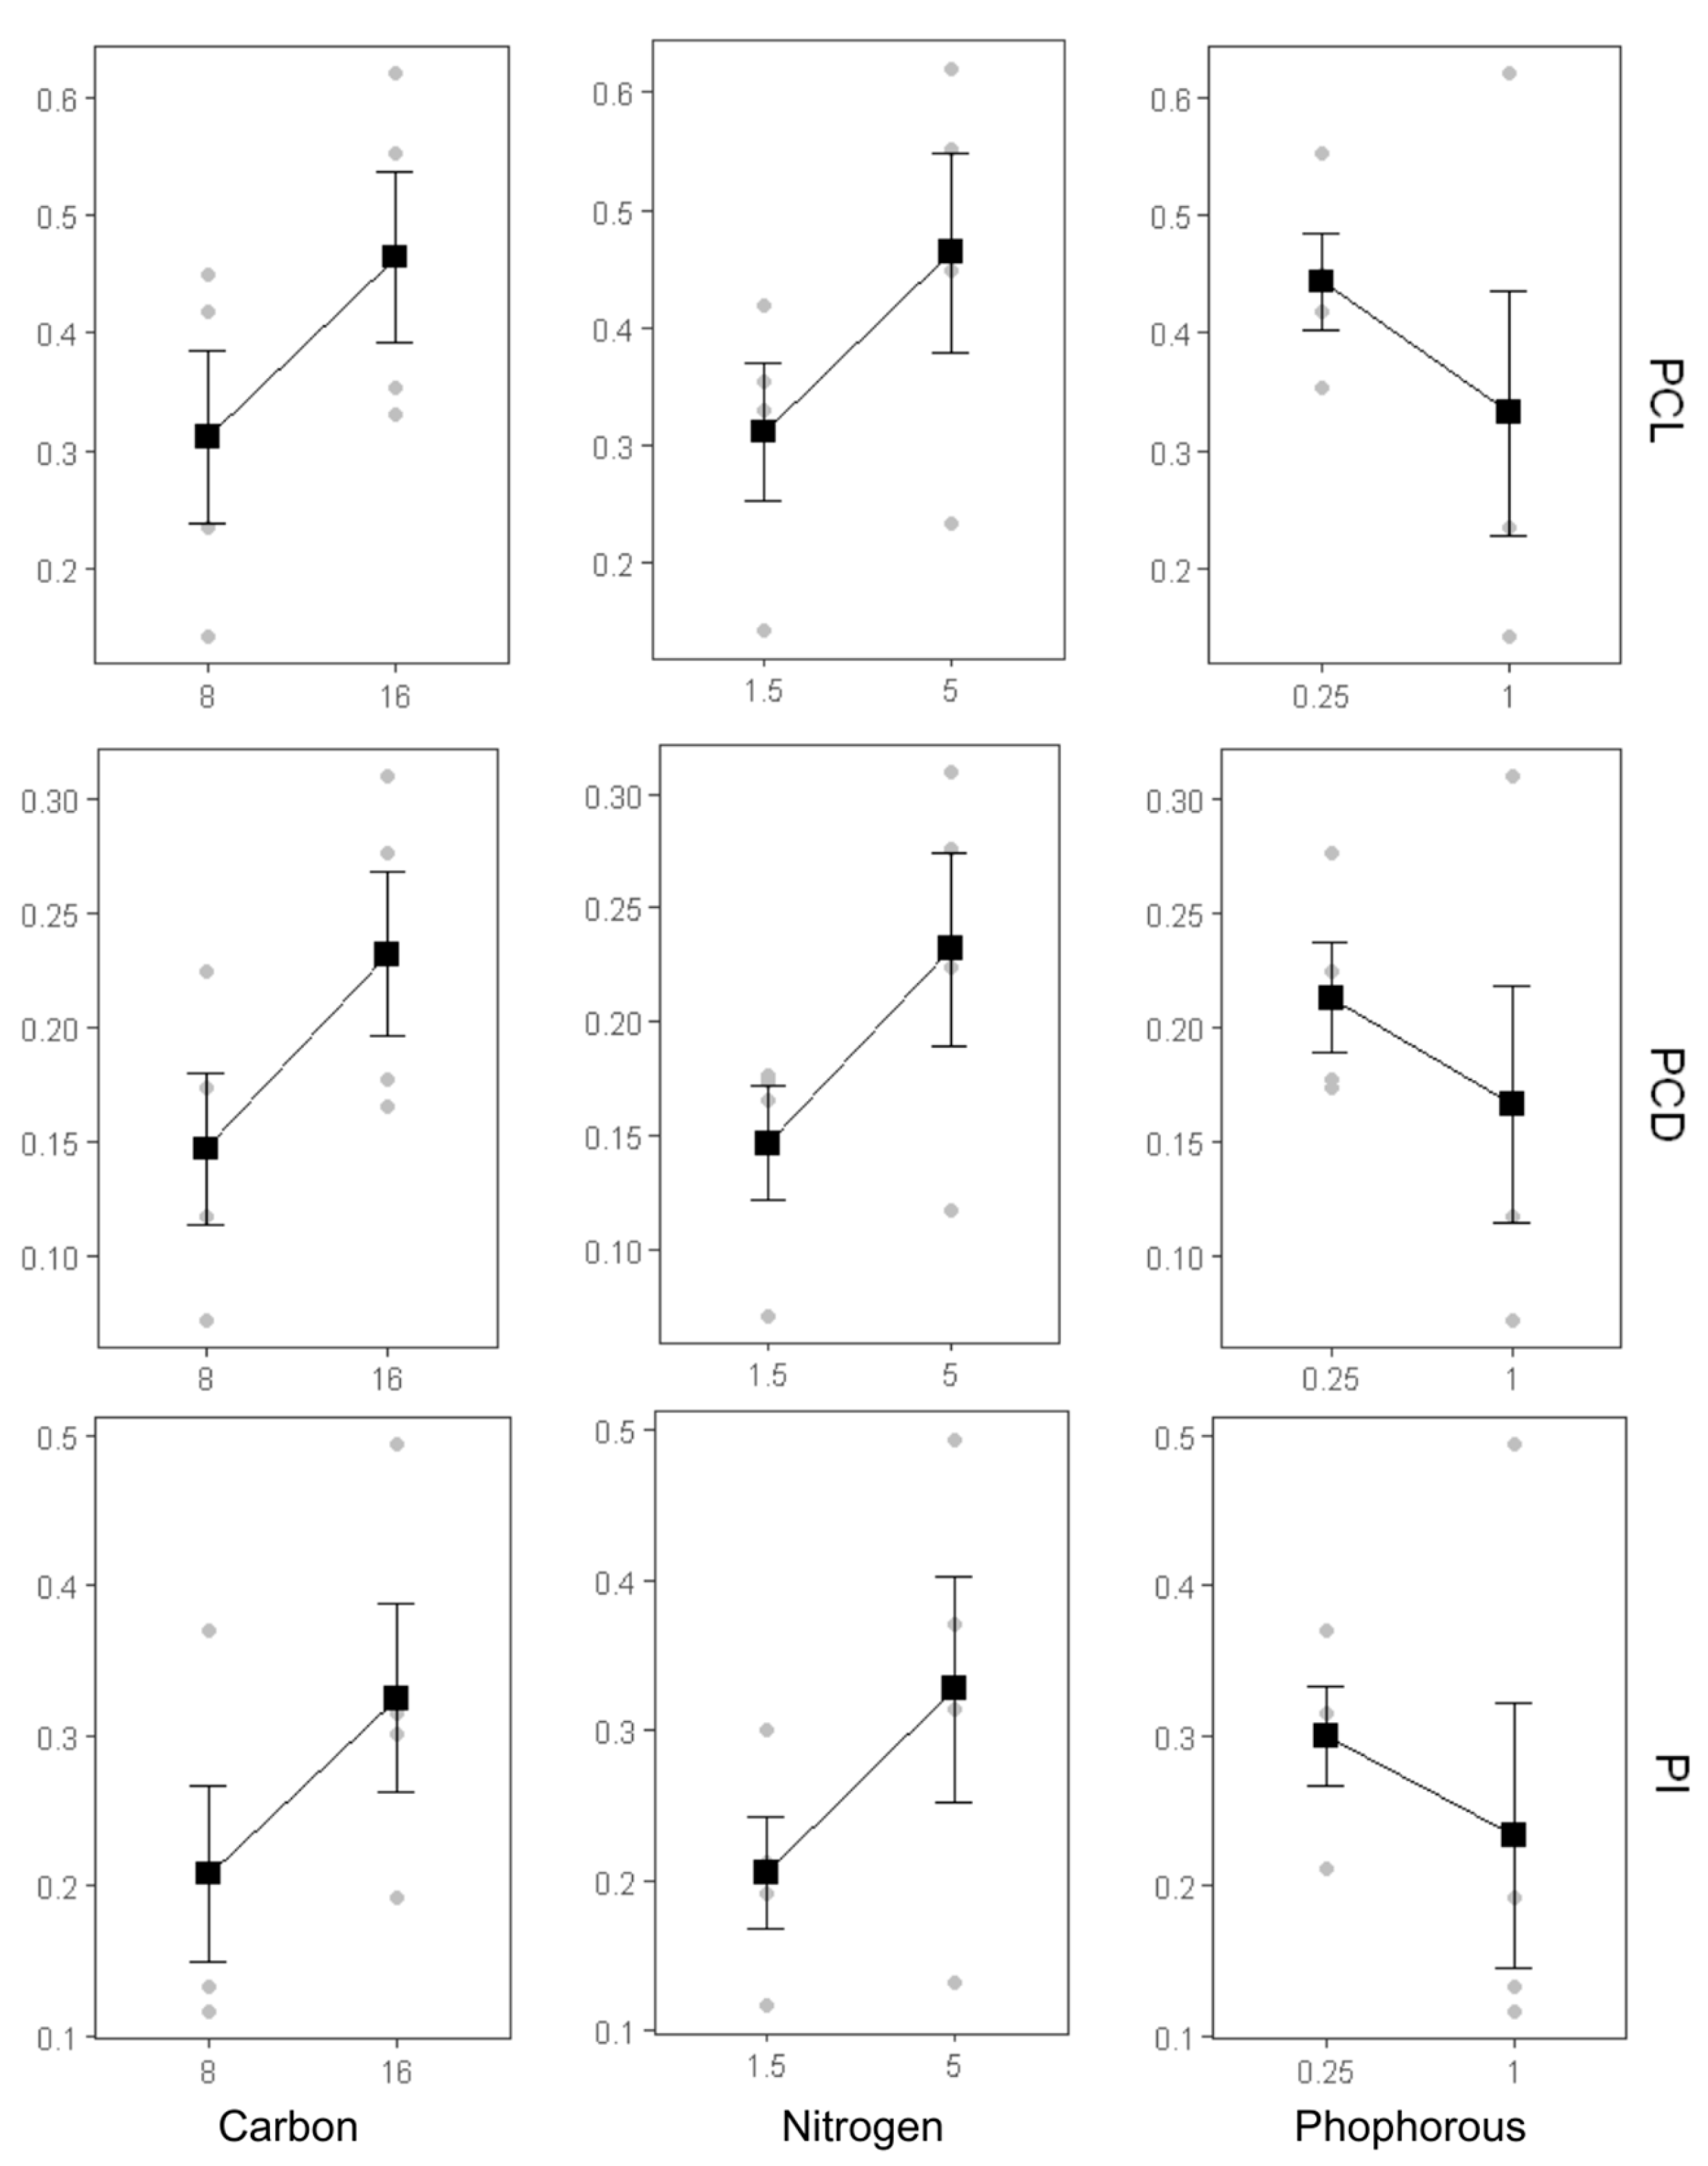
Figure 7.
Interaction plots of nutrient effects on the C-PC quantity and quality of Spirulina sp.
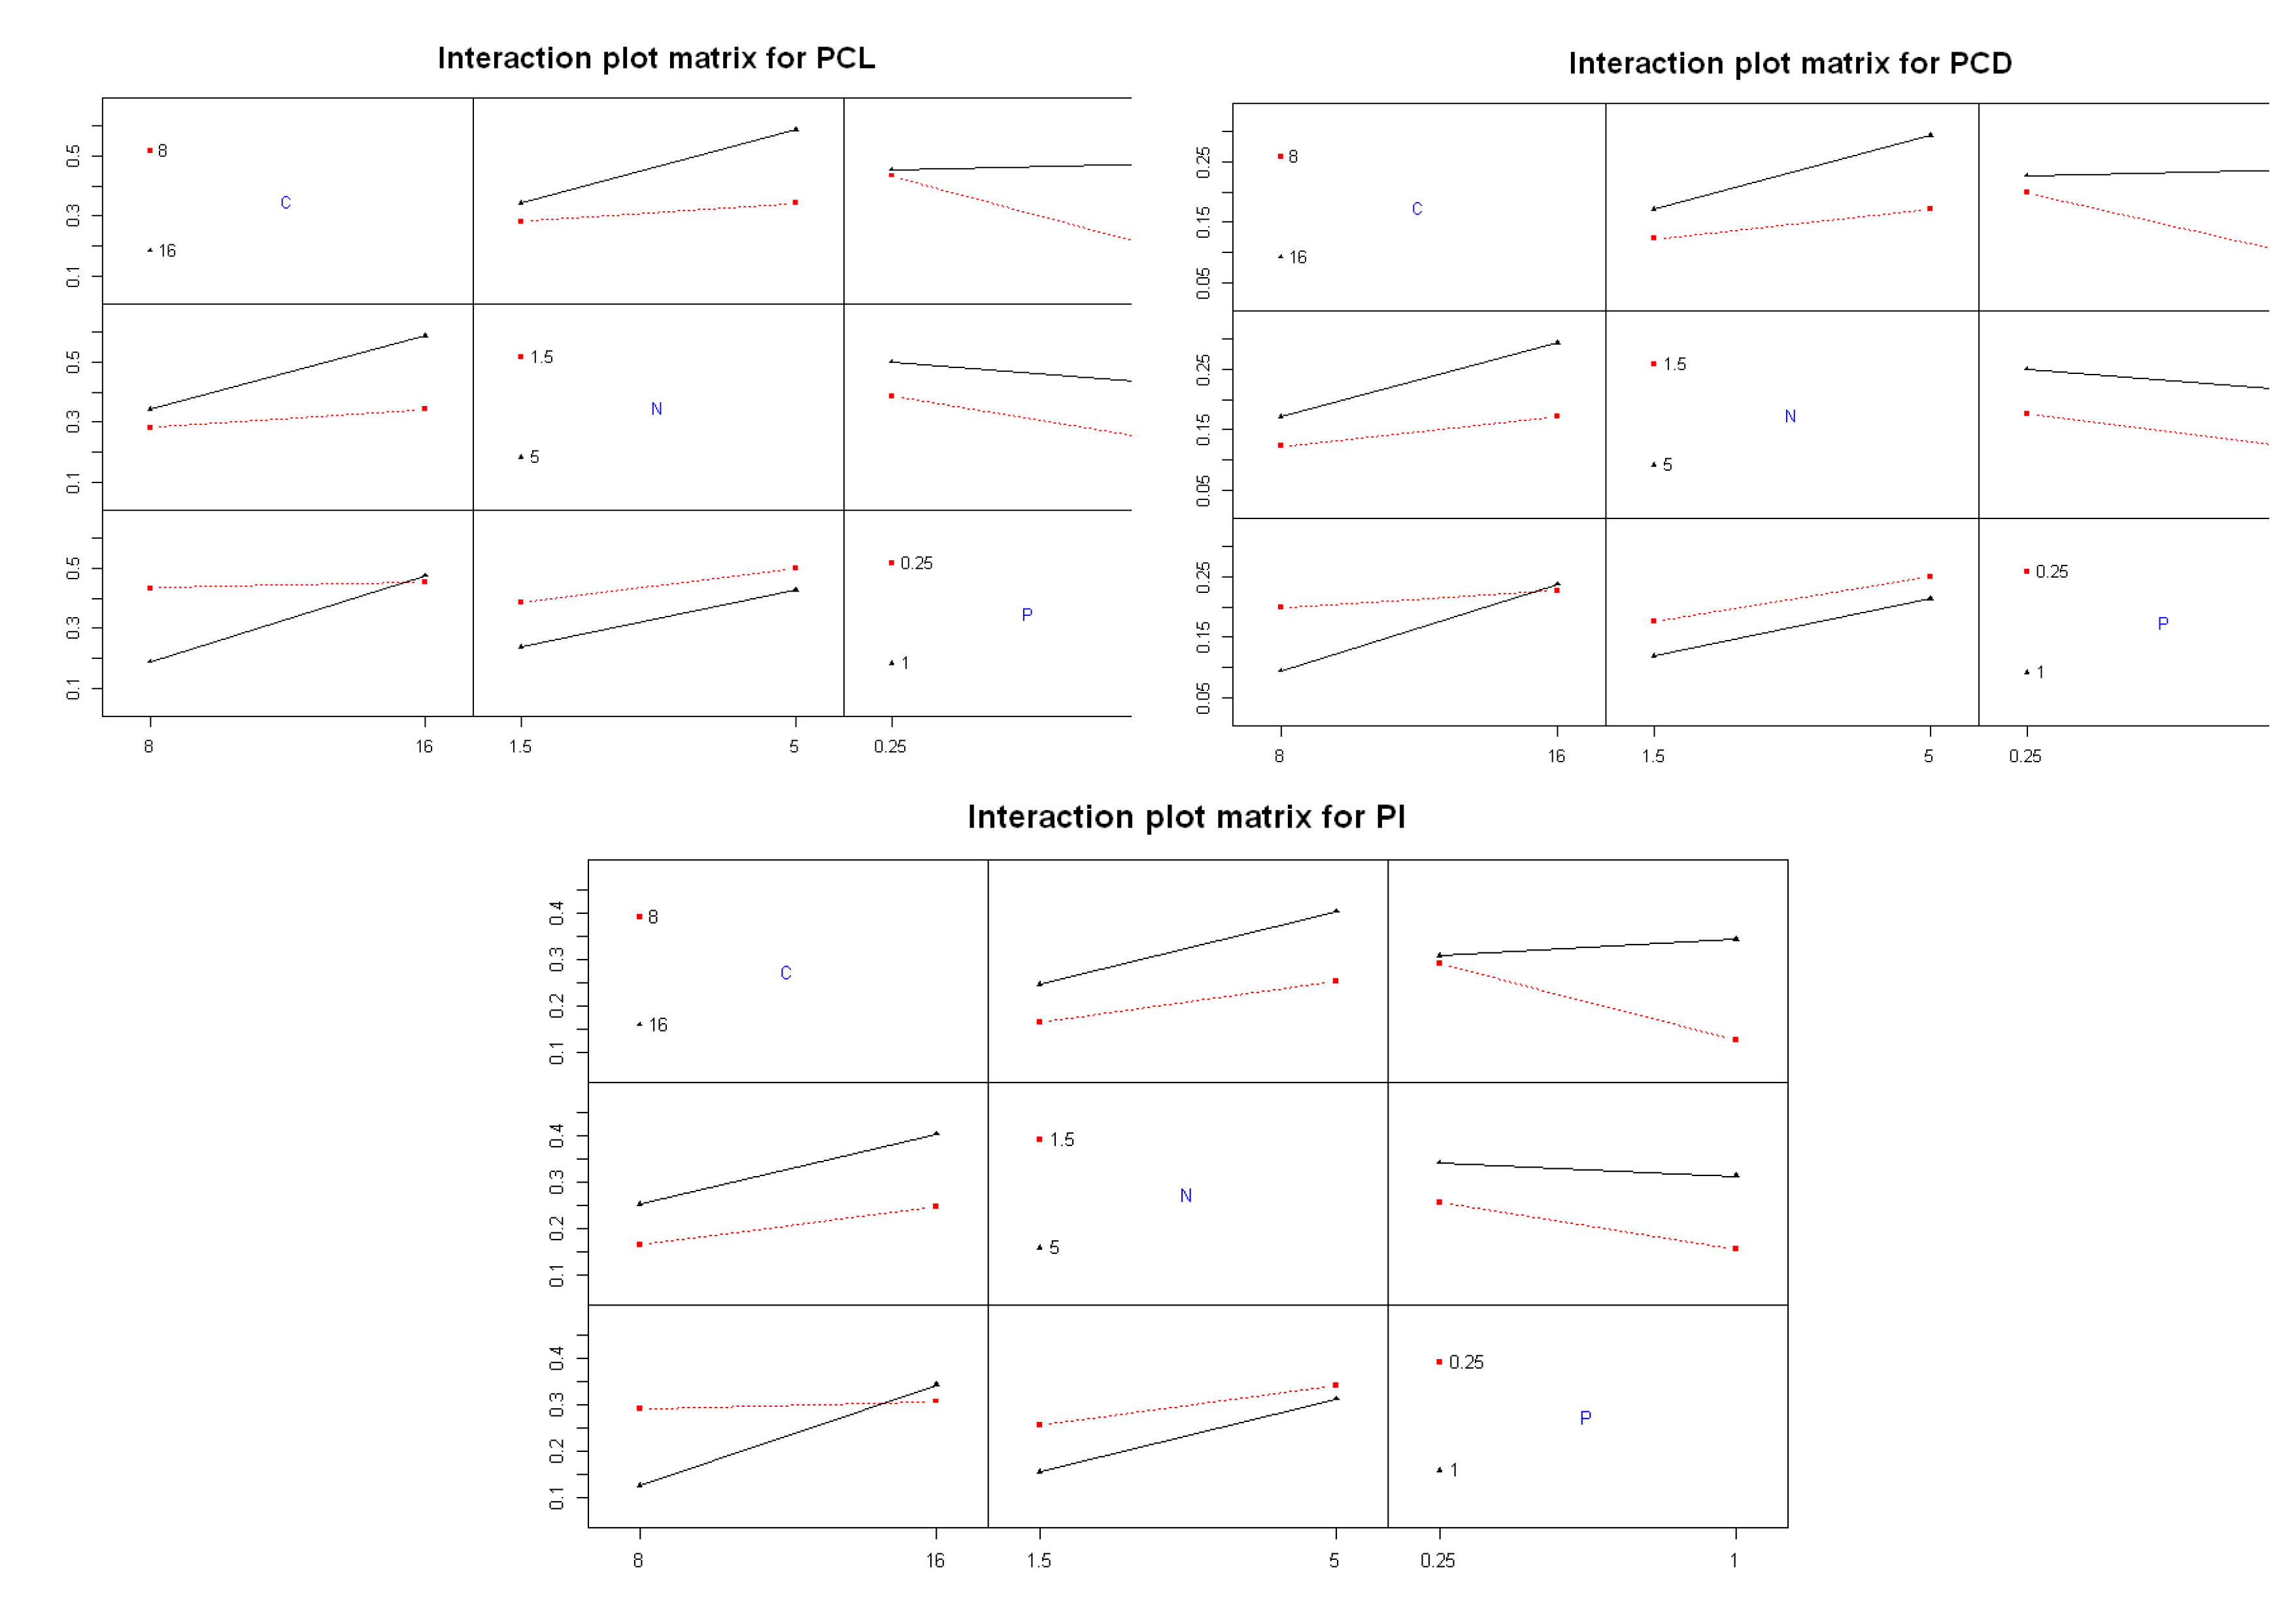
Table 1.
Specific growth rate and maximum OD of Spirulina sp. under different nutrient modification.
Table 1.
Specific growth rate and maximum OD of Spirulina sp. under different nutrient modification.
| Formulation | µ specific | OD max |
| Control | 0.1762 | 1.154 |
| F1 | 0.1507 | 0.944 |
| F2 | 0.1939 | 1.528 |
| F3 | 0.1673 | 1.020 |
| F4 | 0.1547 | 1.168 |
| F5 | 0.1667 | 1.242 |
| F6 | 0.1860 | 1.148 |
| F7 | 0.1455 | 0.912 |
| F8 | 0.1466 | 0.888 |
Table 2.
ANOVA summary of nutrient effects on the optical density of Spirulina sp.
| p-value | ||||||
| Day 3 | Day 6 | Day 8 | Day 10 | Day 13 | Day 14 | |
| Carbon | 3.61 × 10⁻¹ | 9.25 × 10⁻¹ | 3.15 × 10⁻²* | 2.88 × 10⁻¹ | 3.43 × 10⁻¹ | 2.30 × 10⁻¹ |
| Nitrogen | 3.24 × 10⁻¹ | 2.30 × 10⁻¹ | 2.51 × 10⁻²* | 4.09 × 10⁻¹ | 3.74 × 10⁻¹ | 5.30 × 10⁻¹ |
| Phosphorous | 6.93 × 10⁻¹ | 5.96 × 10⁻¹ | 6.75 × 10⁻² | 4.55 × 10⁻¹ | 4.96 × 10⁻¹ | 3.22 × 10⁻¹ |
| Carbon: Nitrogen |
4.53 × 10⁻¹ | 7.53 × 10⁻¹ | 3.15 × 10⁻²* | 3.05 × 10⁻¹ | 9.14 × 10⁻¹ | 8.60 × 10⁻¹ |
| Carbon: Phosphorous | 5.79 × 10⁻¹ | 5.17 × 10⁻¹ | 5.21 × 10⁻² | 3.80 × 10⁻¹ | 8.37 × 10⁻¹ | 7.84 × 10⁻¹ |
| Nitrogen: Phosphorous | 9.50 × 10⁻¹ | 8.68 × 10⁻¹ | 1.52 × 10⁻²* | 5.84 × 10⁻¹ | 3.01 × 10⁻¹ | 3.09 × 10⁻¹ |
* Significance (p-value < 0.05).
Table 3.
ANOVA summary of nutrient effects on the C-PC production (PCL&PCD) of Spirulina sp.
| Df | Sum Sq | Mean Sq | F value | p-value | ||
| Carbon | 2 | 363.0 | 181.5 | 61.02 | 9.57 × 10⁻⁹ | *** |
| Nitrogen | 1 | 348.5 | 348.5 | 117.17 | 2.60 × 10⁻⁹ | *** |
| Phosphorous | 1 | 186.9 | 186.9 | 62.85 | 2.79 × 10⁻⁷ | *** |
| Carbon: Nitrogen |
1 | 126.2 | 126.2 | 42.44 | 3.99 × 10⁻⁶ | *** |
| Carbon: Phosphorous | 1 | 268.6 | 268.6 | 90.31 | 1.95 × 10⁻⁸ | *** |
| Nitrogen: Phosphorous | 1 | 21.6 | 21.6 | 7.28 | 1.47 × 10⁻² | * |
| Carbon: Nitrogen: Phosphorous |
1 | 0.8 | 0.8 | 0.26 | 6.15 × 10⁻¹ | |
| Residuals | 18 | 53.3 | 3.0 |
* Significance (p-value < 0.05).
Table 4.
2-level full factorial experimental design.
| No. | NaHCO3 | NaNO3 | K2HPO4 |
| 1 | 8 | 1,5 | 0.25 |
| 2 | 16 | 5 | 0.25 |
| 3 | 16 | 5 | 1 |
| 4 | 16 | 1,5 | 0.25 |
| 5 | 16 | 1,5 | 1 |
| 6 | 8 | 5 | 0.25 |
| 7 | 8 | 5 | 1 |
| 8 | 8 | 1,5 | 1 |
Disclaimer/Publisher’s Note: The statements, opinions and data contained in all publications are solely those of the individual author(s) and contributor(s) and not of MDPI and/or the editor(s). MDPI and/or the editor(s) disclaim responsibility for any injury to people or property resulting from any ideas, methods, instructions or products referred to in the content. |
© 2025 by the authors. Licensee MDPI, Basel, Switzerland. This article is an open access article distributed under the terms and conditions of the Creative Commons Attribution (CC BY) license (http://creativecommons.org/licenses/by/4.0/).
Copyright: This open access article is published under a Creative Commons CC BY 4.0 license, which permit the free download, distribution, and reuse, provided that the author and preprint are cited in any reuse.


