Submitted:
20 July 2025
Posted:
21 July 2025
Read the latest preprint version here
Abstract
Background: Invasive fungal infections (IFIs) represent a pressing global health threat, particularly for immunocompromised individuals, yet the development of antifungal drugs continues to lag behind antibacterial therapeutics. In this study, we present a data-driven machine learning framework to predict antifungal compound activity, leveraging cheminformatics and supervised learning. Method: A curated dataset of 3,748 positive (antifungal) and 4,096 negative (non-antifungal) compounds was constructed using ChEMBL, ChemDiv, and HMDB. Chemical class assignment via NPClassifier and Tanimoto similarity filtering ensured non-overlapping, structurally meaningful training data. We extracted 217 molecular descriptors per compound and evaluated physicochemical differences between positive and negative sets, confirming statistically significant divergence in Lipinski parameters (p < 0.001). Results: Feature selection using model-specific importance metrics identified key descriptors such as molecular weight, van der Waals surface area, and nitrogen group counts. Multiple supervised learning models were trained—Random Forest (RF), Extreme Gradient Boosting (XGBoost), Support Vector Machines (SVMs with RBF, polynomial, and sigmoid kernels), and Multi-Layer Perceptron (MLP)—and evaluated using five-fold cross-validation. RF and MLP achieved the highest AUCs of 0.996, with SVM-RBF and XGBoost performing comparably well. To assess generalizability, we introduced chemical class-based cross-validation, wherein compounds were partitioned by their chemical class to reduce information leakage. Despite a slight drop in metrics compared to random splits, all models retained balanced accuracies above 0.91. These results demonstrate the promise of integrating molecular informatics with machine learning for antifungal drug discovery and highlight the importance of rigorous validation strategies aligned with chemical diversity.
Keywords:
antifungal drug prediction
; chemical class cross validation
; fungal treatment
; drug discovery
1. Introduction
Invasive fungal infections (IFI) pose a severe and growing global health concern, predominantly in immunocompromised populations such as individuals undergoing chemotherapy, organ transplantation, or living with HIV/AIDS. Over 90% of the estimated annual IFI-related fatalities worldwide are attributed to fungi from genera such as Candida, Aspergillus, Cryptococcus, and others [1,2]. Recent updated estimates indicate an annual incidence of 6.5 million invasive fungal infections, resulting in 3.8 million deaths, with approximately 2.5 million (68%; range 35–90) directly attributable to these infections [3].
Although the clinical significance of fungal infections continues to grow, the development of antifungal therapeutics is lagging behind antibacterial drug discovery. Developing antifungal drugs is challenging due to the eukaryotic nature of fungi, leading to limited therapeutic targets and significant risks of host toxicity [4,5]. Compounding these difficulties is the emergence of multidrug-resistant fungal strains such as Candida auris, which underscores the urgent need for antifungal compounds with novel mechanisms of action [6].
To address these urgent challenges, computational and data-driven strategies have garnered significant attention as complementary tools in the early stages of drug discovery. Among them, machine learning (ML) approaches have demonstrated substantial promise by enabling predictive modeling of compound bioactivity based on structural and physicochemical features [7,8]. These models facilitate the rapid and cost-effective screening of large chemical libraries, prioritize candidate molecules for synthesis or biological evaluation, and elucidate molecular features associated with antifungal efficacy or toxicity. In particular, ML methods such as Random Forests (RF), Support Vector Machines (SVM), Neural Networks (NN), and ensemble algorithms have been successfully applied in domains such as antibacterial drug discovery [9], kinase inhibitor prediction [10], and molecular property estimation [11], suggesting strong potential for antifungal applications.
However, the application of ML to antifungal drug discovery remains relatively underexplored. This gap is partly attributable to the lack of comprehensive, well-annotated datasets that capture the chemical and biological diversity of both positive (antifungal) and non-antifungal (negative) compounds. Additionally, many existing studies utilize random data partitioning strategies that risk information leakage through structural similarities shared across training and test sets. Such overlap can lead to overestimated model performance and poor generalizability when applied to novel chemical scaffolds [12,13]. Addressing these limitations requires the adoption of more biologically relevant evaluation protocols, such as chemical class-based cross-validation, which more accurately reflect real-world challenges in virtual screening and lead optimization.
In this context, there is a compelling need for robust and generalizable ML frameworks that integrate high-quality chemical data with stringent validation strategies. By focusing on antifungal compound prediction, such frameworks can play a vital role in accelerating the discovery of new therapeutic candidates, guiding experimental design, and ultimately contributing to global efforts in mitigating the burden of fungal diseases. Considering these challenges, there is a growing need for robust, interpretable, and generalizable ML frameworks that leverage high-quality data and incorporate biologically meaningful validation strategies. Such frameworks have the potential to not only improve antifungal compound screening pipelines but also contribute to the broader effort of combating the global burden of fungal infections.
2. Materials and Methods
To create machine learning models and achieve the study goals, we collected compounds with antifungal activities and non-antifungal compounds.
2.1. Dataset Preparation
For the study, we collected 16,824 antifungal compounds (positive) from ChemDiv database [14]. For the construction of the negative dataset, we collected 12,112 compounds from the Human Metabolome Database (HMDB, https://www.hmdb.ca) [15]. Human metabolites were included as the negative set in our classification framework. Although some human metabolites are known to exhibit antifungal activity, often through indirect mechanisms such as immune modulation or membrane disruption, they are structurally and chemically distinct from the antifungal compounds in the positive set. This distinction ensures that the classifier can learn chemical features specifically associated with antifungal drug-like activity, rather than confounding effects from endogenous bioactive molecules.
To remove the duplicates from the positive and negative dataset, we performed all vs all chemical similarity using the Tanimoto coefficient [16]. Chemical compounds with the Tanimoto coefficient of less than 0.3 were considered distinct [17]. After removing similar compounds from the total positive set, we were left with 3,748 smiles. For the negative set, our goal was to avoid including compounds that were either too similar or too dissimilar to the positive compounds. Therefore, we selected negative compounds with Tanimoto similarity to the positive set in the range of [0.55, 0.9). This resulted in a total of 4,096 compounds in the negative set. The similarity range for the negative set was carefully chosen to avoid bias in model training. Specifically, it prevents the model from trivially separating classes based on structural dissimilarity, which could lead to artificially inflated performance metrics.
2.2. Compositional Analysis
An initial classification of 7,844 compounds comprising 3,748 positive and 4,096 negative samples into seven major chemical classes was performed using a Deep Neural Network based method called NPClassifier [18]. In the initial run, NPClassifier could not assign class labels to all compounds. For those unclassified compounds, we assigned chemical classes based on Tanimoto similarity to representative compounds from the seven predefined classes: alkaloids, shikimates and phenylpropanoids, polyketides, amino acids and peptides, terpenoids, fatty acids, and carbohydrates.
2.3. Calculation of Physicochemical Properties
To understand if there were any differences between positive and negative datasets based on the physicochemical properties, we calculated Lipinski properties using RdKit release 2025.03.3 [19]. The student t-test [20] was performed to show the difference between the antifungal (positive) and negative classes in the dataset. Apart from the Lipinski properties, we also calculated 217 RdKit descriptors. Molecular descriptors represent one-, two-, and three-dimensional properties of chemical compounds in numerical form, effectively serving as a conceptual projection of a molecule’s structural and physicochemical characteristics. One-dimensional (1D) descriptors capture bulk properties such as molecular weight, molar refractivity, permeability, and solubility. Two-dimensional (2D) descriptors, derived from a molecule’s topological structure, include fragment-based features that estimate physicochemical properties such as LogP, LogD, and Topological Polar Surface Area (TPSA). In this study, both 1D and 2D molecular descriptors were utilized for modeling and analysis.
2.4. Use of Non-Parametric Methods for Antifungal Compound Identification
To evaluate whether non-parametric methods could effectively distinguish antifungal compounds from non-antifungal ones, we applied dimensionality reduction techniques including Principal Component Analysis (PCA) [21,22], t-distributed Stochastic Neighbor Embedding (t-SNE) [23], and Uniform Manifold Approximation and Projection (UMAP) [24] to the full set of 217 RdKit molecular descriptors. The high-dimensional descriptor space was projected into a two-dimensional space, and each compound was visualized as a point in scatter plots. These visualizations allowed us to assess whether antifungal (positive) and non-antifungal (negative) compounds formed separable clusters based on their descriptor profiles.
2.5. Machine Learning
2.5.1. Hyperparameter Tuning
The hyperparameter tuning was conducted to optimize the performance of all the classifiers including the Random Forest (RF), gradient boosting tree (XGBoost) and support vector machine (SVM). In case of RF, the hyperparameter search focused on the number of trees (n_estimators, 50, 100, 200 and 300), maximum tree depth (max_depth; None, 10, 20, 30 and 40), minimum number of samples required to split a node (min_samples_split; 2, 5 and 10), minimum number of samples required at a leaf node (min_samples_leaf; 1, 2 and 4), and the number of features considered at each split (max_features; 'sqrt', 'log2' and None). We tested parameters with and without bootstrap.
Similarly, for the XGBoost algorithm, hyperparameter optimization was performed with the same values of estimators (n_estimators) and the max_depth parameter values of 3, 6, 10 and 15. Apart from the number of estimators, XGBoost uses other parameters such as learning rate (learning_rate; 0.01, 0.1 and 0.2), subsample ratio of the training instances (subsample; 0.6, 0.8 and 1.0), fraction of features used per tree (colsample_bytree; 0.6, 0.8 and 1.0), and the minimum loss reduction required to make a further partition on a leaf node (gamma; 0, 0.1 and 0.2). A systematic grid search strategy combined with 5-fold cross-validation was employed for both RF and XGBoost models. This approach allowed for parallel evaluation of multiple hyperparameter combinations, with model accuracy used as the selection criterion to identify the optimal configuration.
Hyperparameter tuning for each Support Vector Machine (SVM) kernel was carried out independently. For all SVM kernels, three regularization parameter values (C) were evaluated: 0.1, 1, and 10. In addition, coef0 values of 0.0 and 1.0 were tested, polynomial degrees of 2, 3, and 4 were explored, and the gamma parameter was tested using both "scale" and "auto" settings for the polynomial and sigmoid kernels, respectively.
2.5.2. Feature Selection
Following hyperparameter optimization, we aimed to identify the most informative features contributing to model performance. To this end, we assessed feature importance across all 217 molecular descriptors using the mean decrease in accuracy as the primary criterion. Feature selection was conducted independently for each model—Random Forest (RF), XGBoost, and Support Vector Machine (SVM). For RF and XGBoost, we utilized the built-in feature_importances_ attribute, calculated using ensembles of 300 trees. In the case of SVM, which lacks intrinsic feature importance metrics, we employed permutation_importance from the sklearn.inspection module. This method was applied across all SVM kernels (radial basis function, polynomial, and sigmoid), with 30 permutations used to ensure robustness and reduce variance in the importance of rankings. All models were evaluated using the best-performing hyperparameters determined in the prior optimization step. No feature selection was performed for the neural network (NN) since NNs are known to perform better with large data sets.
2.5.3. Neural Network
Along with the classical machine learning models, we wanted to use neural network (NN) in the binary classification of antifungal (positive) and non-antifungal (negative) compounds. Neural networks are computational models inspired by the structure and functioning of the human brain. They learn to recognize patterns in data by iteratively updating internal parameters namely weights and biases during the training process, in this study we chose a multi-layer perceptron (MLP). The MLP was implemented using PyTorch to classify compounds based on 217 molecular descriptors. The NN architecture consisted of two hidden layers with 32 and 16 nodes, respectively, each followed by ReLU activation and output layer comprising a single neuron with a sigmoid activation function to produce binary predictions. The model was trained using the Adam optimizer with a learning rate of 0.001, binary cross-entropy loss (BCEloss) for 50 epochs and batch size of 32. We employed a five-fold cross validation strategy to ensure no overfitting.
2.5.4. Model Training and Validation
After feature selection and parameter optimization, we trained the machine learning models. We employed a standard 80-20% data split with 5-fold cross-validation, where 20% of the data is designated for validating each fold in all the models including RF, XGBoost, SVM, and NN. Class stratification was performed during the cross validation to ensure that the ratio of positive and negative classes was the same across different folds. The performances of the classification models were evaluated using accuracy, recall, specificity, precision, F1 score, Matthew’s correlation coefficient (MCC), and area under the ROC curve (AUC).
2.5.5. Chemical Class Based Cross Validation
Since random cross validation can have overlap of chemical information between the training and testing instances across different folds. Thus, we wanted to explore a more robust cross validation strategy of chemical class-based cross validation. For chemical class-based cross-validation, we grouped the less-populated classes—polyketides, amino acids and peptides, terpenoids, fatty acids, and carbohydrates—into a single 'Other' class, as these collectively accounted for only 982 compounds. This grouping ensured a more balanced class distribution during model evaluation.
3. Results
3.1. Compositional Analysis
To understand the types of compounds, present in our datasets, we performed compositional analysis using NPclassifer. The analysis revealed that there were seven classes of compounds present in our dataset including alkaloids, shikimates and phenylpropanoids, polyketides, amino acids and peptides, terpenoids, fatty acids, and carbohydrates. The analysis revealed that the negative class had “shikimates and phenylpropanoids” and “alkaloids” were the biggest classes with 1695 (41.4%) and 1521 (37.1%) compounds, respectively. On the other hand, in positive antifungal class 90.9% compounds from “alkaloids” (Figure 1).
As cumulative class in both positive and negative sets, alkaloids make 62.8% of the data and “shikimates and phenylpropanoids” and “other” class correspond to 24.69% and 12.5% of the total data, respectively. The presence of the alkaloids class as the majority class in the positive class is also supported by literatures [25,26,27].
3.2. Calculation of Physicochemical Properties
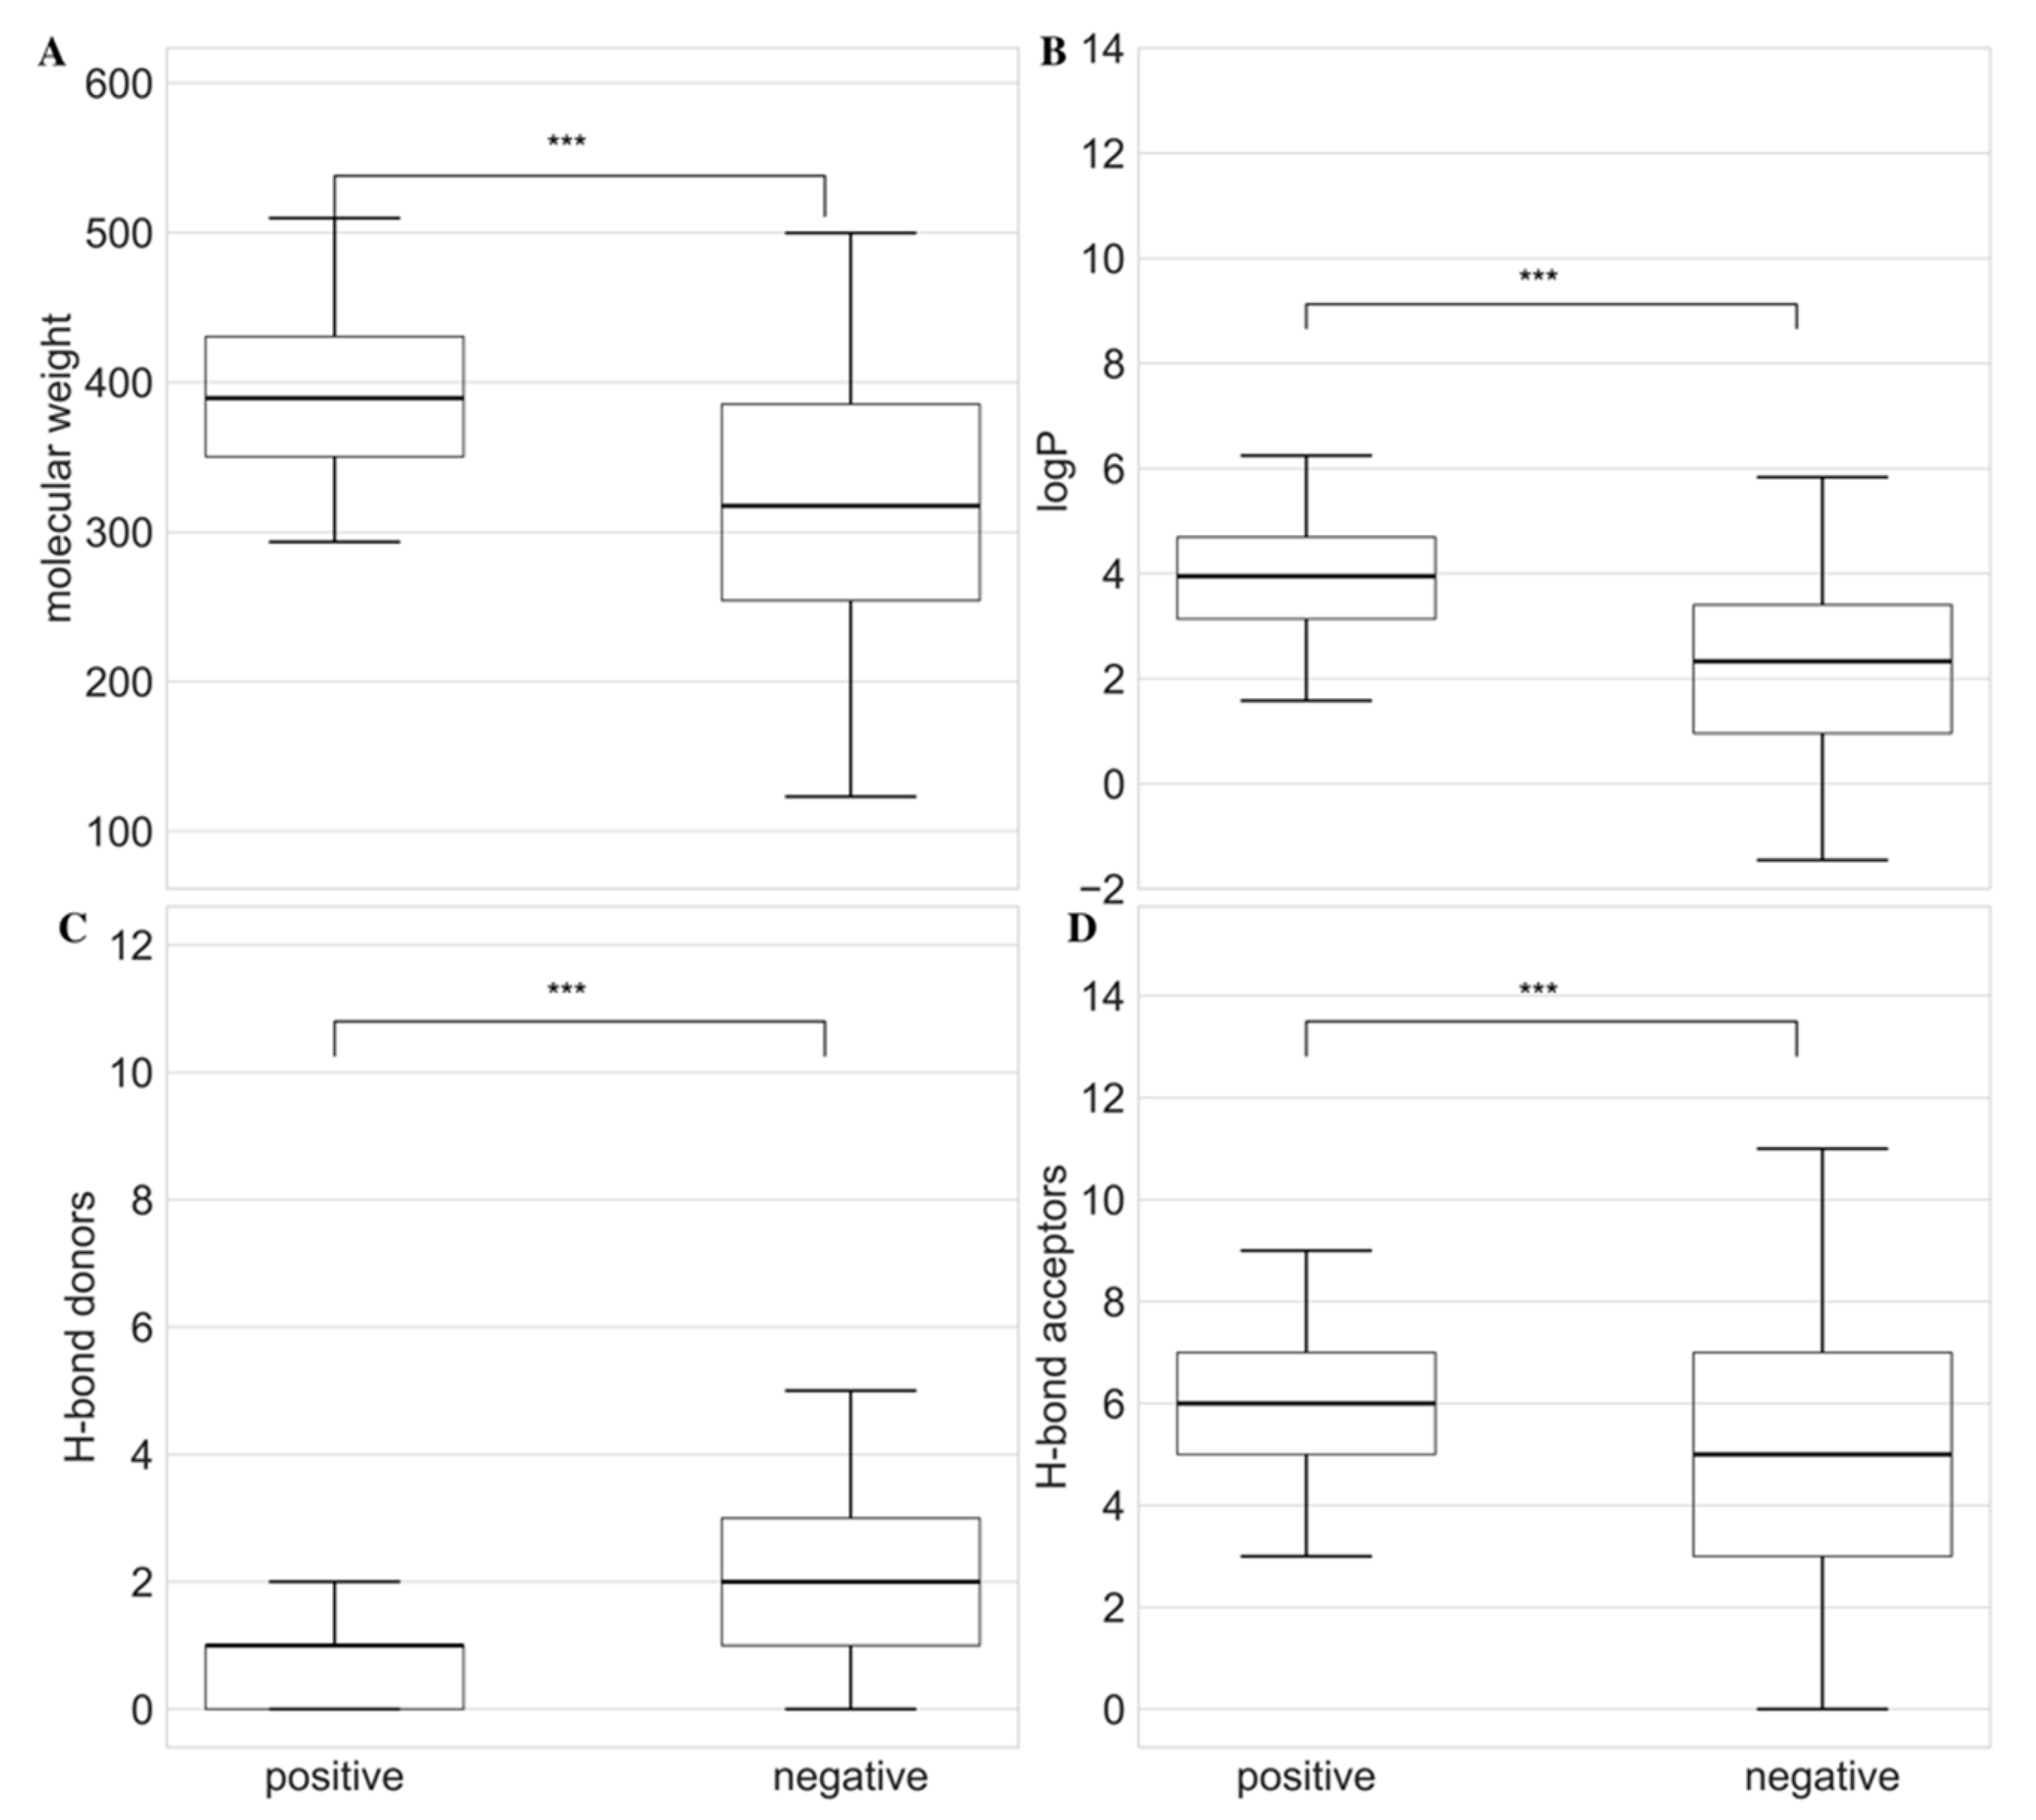
After understanding the chemical class distribution of compounds in the dataset, we wanted to understand the differences in the physicochemical properties of the compounds in positive and negative sets. For this analysis, we calculated molecular weight, LogP, hydrogen bond donor (HBD), and acceptor (HBA). As shown in Figure 2, positive compounds exhibited significantly higher values of molecular weight with median weights of 389.42 Da and 317.43 Da, respectively. In the case of LogP, positive compounds had a median value of 3.94 and negative compounds showed a value of 2.33. The HBD and HBA for positive and negative compounds were 1, 2, and 6, 5, respectively. All the Lipinski properties were significantly different between positive and negative sets with a p-value of 0.001. These findings indicate that the positive antifungal compounds tend to exhibit stronger drug-like properties as defined by Lipinski's rule of five.
Figure 2.
Comparison of Lipinski physicochemical properties between positive and negative antifungal compounds. The box plots represent the distribution of (A) molecular weight (Da), (B) logP, (C) number of hydrogen bond donors (HBD) and (D) number of hydrogen bond acceptors (HBA). The *** at the top of bars represent the significance level with p-value < 0.001. Within each bar, the horizontal solid lines represent median values of respective Lipinski property.
3.3. Use of Non-Parametric Methods for Antifungal Compound Identification
To evaluate the variance between antifungal and non-antifungal compounds, Principal Component Analysis (PCA) was conducted using RDKit descriptors as input features. In the resulting principal component plot, the two axes correspond to the first and second principal components (PC-1 and PC-2), which are linear combinations of the original descriptors. PC-1 captures the maximum variance in the dataset, while PC-2 captures the next highest variance and is orthogonal to PC-1.
When PCA was applied to molecular fingerprints, antifungal (positive) compounds appeared to cluster primarily in the lower half of the plot, while non-antifungal (negative) compounds were also concentrated in a similar region, suggesting limited separability. The proportion of total variance explained by PC-1 and PC-2 was 15.1% and 10.9%, respectively (Figure 3), indicating that a large portion of the variance remains unaccounted for in the two-dimensional projection. These results suggest that PCA alone may not be sufficient for robust classification, and therefore, additional machine learning models were evaluated in subsequent analyses.
In parallel, we also applied non-parametric dimensionality reduction techniques including t-distributed Stochastic Neighbor Embedding (t-SNE) and Uniform Manifold Approximation and Projection (UMAP) (Figure 4). However, neither method produced a clear separation between antifungal and non-antifungal compounds, further indicating that these unsupervised approaches may be insufficient to distinguish between the two classes based on the available descriptor space.
3.4. Machine Learning
3.4.1. Feature Selection
To find the important features out of 217 descriptors representing chemical and physical properties of the molecules in our dataset, we extracted the best 30 features for RF, XGBoost and SVM with three kernels including rbf, polynomial, and sigmoid. Out of 30 different features, RF and XGBoost identified 15 common features. Out of these 15 features, two features were structural group counts including number of tertiary nitrogen (fr_NH0) and number of aromatic nitrogen (fr_Ar_N); five were structural/volume descriptors consisting of approximate van der Waals surface area of atoms (SMR_VSA3, SMR_VSA7), van der Waals surface area of atoms contribution to logP (SlogP_VSA6), and VSA_EState3, VSA_EState6 as sum of electronic state indices over atoms with van der Waals surface area in specific bins. The rest of the features included four basic molecular properties including exact and average molecular weight (ExactMolWt, and MolWt); molecular weight by the heavy atoms (HeavyAtomMolWt) and approximate surface area of the molecule (LabuteASA); one topological connectivity descriptor describing the zero-order valence connectivity index (Chi0v); charge properties of MinPartialCharge and NumHDonors and ring descriptor of number of aromatic rings (NumAromaticRings).
SVM based feature extraction revealed that only fr_ArN: aromatic nitrogen atoms were the only feature common between rbf and sigmoid kernel. There were five descriptors common between rbf and polynomial kernel-based feature selection. These features included three connectivity indexes (Chi3x), where n is either n or v for normalized and weighted. The other two features were the number of aliphatic rings, high partial charges represented as NumAliphaticRings and BCUT2D_CHGHI. At the end, there were six features common between polynomial and sigmoid kernel-based models. These features were three Fragment-based structural descriptors (fr_aryl_methyl, fr_Ar_NH and fr_Nhpyrrole), Ring-based structural descriptor (NumAromaticHeterocycles), topological descriptor (EState_VSA4) and fingerprint density descriptor (FpDensityMorgan3). The distribution of features across different kernels is shown by the Venn diagram in Supplementary Figure S1. The detailed list of the all the top 30 descriptors collected from all the machine learning models are present in Supplementary Table S1.
3.4.2. Model Training and Validation
Random Split Cross Validation
After identifying the optimal features and hyperparameters, model training was conducted. To ensure robust performance evaluation, 5-fold cross-validation was performed. In case of the RF, we achieved a mean balanced accuracy, precision, recall, F1 and MCC of 0.972 ± 0.002, 0.963 ± 0.002, 0.979 ± 0.003, 0.971 ± 0.002 and 0.944 ± 0.004, respectively. We were able to achieve mean AUC of 0.996 in the RF based binary classification with random split five-fold cross validation. In the XGBoost, we achieved performance values of 0.973 ± 0.003, 0.964 ± 0.003, 0.979 ± 0.006, 0.971 ± 0.002 and 0.945 ± 0.006 for balanced accuracy, precision, recall, F1 and MCC, respectively. The XGBoost model returned mean AUC value of 0.995 (Figure 5).
Apart from the tree-based methods, SVM based polynomial model returned a mean balanced accuracy of 0.942 ± 0.006 and mean AUC value of 0.980 ± 0.003. Model with the RBF kernel returned a mean balanced accuracy and AUC of 0.955 ± 0.003 and 0.986 ± 0.002, respectively. In contrast to the other kernels, the sigmoid kernel-based model returned a mean balanced accuracy and AUC of 0.902 ± 0.007 and 0.940 ± 0.006, respectively (Figure 6).
In case of the NN, the mean balanced accuracy, precision, recall, F1 and MCC of 0.977 ± 0.004, 0.976 ± 0.005, 0.977 ± 0.006, 0.976 ± 0.004 and 0.954 ± 0.008. The model returned a mean AUC value of 0.993 ± 0.001 (Figure 7).
The detailed results for all the five folds when training RF, XGBoost, SVM and NN are mentioned in Table 1.
The result showed that the NN achieved the highest overall performance with a balanced accuracy of 0.977 and AUC of 0.996, closely followed by Random Forest and XGBoost models. While SVM with polynomial and RBF kernels showed strong performance, the sigmoid kernel underperformed by ~7% in terms of balanced accuracy. These results highlight the robustness of tree-based and neural network models in accurately distinguishing antifungal compounds from non-antifungal compounds based on top 30 molecular descriptors collected during the feature selection step as motioned in Methods section 2.5.2. The detailed account of performance metrics of individual fold for each of the six machine learning models are present in Supplementary Table S2.
Chemical Class Based Cross Validation
Since the random split cross validation can have overlap of chemical information between training and testing data. Thus, to ensure that machine learning methods make accurate predictions on even on the chemical class unseen during the training, we performed chemical class based cross validation. The RF and XGBoost both the models returned mean balanced accuracies of 0.933. The class-wise AUC values for RF and XGBoost were (0.97, 0.969), (0.989, 0.994) and (0.998, 0.997) for alkaloids, shikimates and phenylpropanoids and other class, respectively (Figure 8).
The Support Vector Machine (SVM) models employing radial basis function (RBF), polynomial, and sigmoid kernels achieved mean balanced accuracies of 0.911, 0.880, and 0.881, respectively, under chemical class-based cross-validation. The class-wise AUC values for the RBF, polynomial, and sigmoid kernels were as follows: for the alkaloids class — 0.944, 0.900, and 0.920; for the shikimates and phenylpropanoids class — 0.978, 0.965, and 0.957; and for the combined 'Other' class — 0.995, 0.957, and 0.977, respectively (Figure 9).
In comparison, the neural network (NN) model achieved a mean balanced accuracy of 0.932, with class-specific AUC values of 0.959 (alkaloids), 0.995 (shikimates and phenylpropanoids), and 0.990 ('Other') (Figure 10).
Although performance metrics were modestly reduced compared to random split validation, the consistently high balanced accuracies with all models showing balanced accuracies >0.88 and strong class-wise AUCs demonstrate that chemical class-based cross-validation remains a reliable strategy. These findings underscore the model’s ability to generalize and correctly identify antifungal activity, even in structurally diverse chemical classes not seen during training. (Table 2).
4. Discussion
This study demonstrates the effectiveness of data-driven machine learning models in predicting antifungal drug activity using molecular descriptors. By leveraging curated datasets of positive (antifungal) and negative (non-antifungal) compounds and a rigorous cheminformatics pipeline, we systematically evaluated a diverse suite of supervised learning models, including RF, XGBoost, SVM, and Multi-Layer Perceptron (MLP) NN. Our integrative approach encompassed molecular feature extraction, physicochemical profiling, dimensionality reduction, model training, hyperparameter optimization, and evaluation under both random and chemically informed cross-validation strategies.
Our initial compositional analysis using NPClassifier and Tanimoto similarity-based assignment revealed that alkaloids dominated the antifungal (positive) class (90.9%), while shikimates and phenylpropanoids (41.4%) and alkaloids (37.1%) were prevalent in the non-antifungal (negative) set. This asymmetry in class distribution is consistent with prior literature identifying alkaloids as rich sources of bioactivity, including antifungal properties [25,26,27]. The alkaloid class is the most prevalent among antifungal compounds due to a combination of structural, physicochemical, and biological properties that make alkaloids particularly well-suited for disrupting fungal physiology [28]. Since alkaloids are large and structurally diverse nitrogen containing hetero cycles, they form variety of interactions with the cellular membrane and fungal enzymes [29,30]. Alkaloids are known to inhibit ergosterol biosynthesis, a key component in the fungal membrane synthesis [31]. On the other hand, shikimates and phenylpropanoids are common primary or secondary metabolites found in plants and humans. In humans, these compounds are play physicochemical roles but do not show direct antifungal activities [32]. These compounds often possess aromatic rings and phenolic hydroxyls, which are excellent for antioxidant or hormonal functions, but they lack the amphipathic or cationic structures typical of antifungal agents [33].
Further physicochemical analysis showed that positive compounds had significantly higher molecular weight, LogP, HBD and HBA than the negative compounds, with p-values < 0.001, reinforcing the hypothesis that chemical properties distinguish antifungal molecules. Since there was inherent difference in the physicochemical properties of positive and negative compounds, we wanted to see if we can use non-parametric methods instead of the machine learning models to distinguish between the two classes. We used dimensionality reduction techniques such as PCA, t-SNE and UMAP. The PCA explained ~26% of the total variance with some mild clustering, t-SNE and UMAP failed to reveal distinct separations between positive and negative classes. These results underscore the complex and overlapping descriptor space and suggest that non-parametric projection alone is insufficient for robust discrimination, thus justifying the use of supervised machine learning model(s).
Our machine learning pipeline, trained on selected descriptors, delivered high predictive performance across all models. Under random split 5-fold cross-validation, RF and MLP achieved AUC values of 0.996, while XGBoost and SVM (RBF) also showed strong performance with AUCs of 0.995 and 0.986, respectively. SVM with polynomial kernel achieved comparable results with AUC of 0.98, while the sigmoid kernel underperformed (AUC = 0.94), likely due to suboptimal class boundaries in high-dimensional feature space. MLP demonstrated robust learning from molecular descriptors, with balanced accuracy and MCC of 0.977 and 0.954, respectively, highlighting its potential in compound classification tasks.
To ensure model generalizability and reduce potential overfitting, we adopted a chemical class-based cross-validation strategy as a more stringent and biologically relevant method. In this approach, compound folds were stratified by chemical class (e.g., alkaloids, shikimates and phenylpropanoids, other), preventing structural overlap between training and test sets. As expected, performance metrics declined slightly across models; for example, RF and XGBoost AUCs decreased to 0.97 and 0.969 for alkaloids, and to 0.989 and 0.994 for shikimates and phenylpropanoids. However, mean balanced accuracies remained >0.88 across all models, reaffirming the models’ ability to generalize across chemically distinct compounds. These results underscore a critical limitation of random cross-validation, which may yield over-optimistic performance due to chemical redundancy across folds. This concern is echoed in prior studies, including Sheridan (2013) and Wallach & Heifets (2018), who advocate for scaffold- or class-based partitioning in cheminformatics to mitigate data leakage and ensure reliable estimates of generalization [12,34].
Ultimately, our findings reinforce the value of integrating cheminformatics with machine learning for antifungal drug discovery and emphasize the importance of validation frameworks that align with biological and chemical diversity. By incorporating class-based cross-validation, we demonstrate that predictive models remain robust even under chemically disjoint test conditions—an essential requirement for real-world application in virtual screening and lead prioritization.
5. Conclusions
In this study, we present a comprehensive machine learning framework for predicting antifungal compound activity using cheminformatics-derived molecular descriptors. By integrating curated datasets, advanced feature selection, and rigorous model training across Random Forest, XGBoost, Support Vector Machines, and neural networks, we demonstrate high predictive performance with balanced accuracies and AUCs exceeding 0.91 across all models.
Crucially, we highlight the limitations of conventional random cross-validation and introduce chemical class-based cross-validation as a more realistic and biologically meaningful strategy. Despite a modest decline in performance metrics under this more stringent framework, the models maintained strong generalizability, underscoring their robustness in identifying antifungal candidates across structurally diverse chemical classes.
Together, our findings reinforce the potential of machine learning to accelerate antifungal drug discovery and provide a reproducible and interpretable pipeline for future virtual screening efforts. This work lays the foundation for developing predictive models capable of identifying novel antifungal agents from large, heterogeneous compound libraries, ultimately aiding in the fight against invasive fungal infections.
Supplementary Materials
The following supporting information can be downloaded at: Preprints.org
Author Contributions
M.P. and G.S. conceptualized the work, participated in design of the study; M.P. and G.S. performed data curation, cleaning and statistical data analysis; K.M., M.P. and A.M. developed machine learning based classification models; M.P created chemical class based cross validation machine learning models; K.M., M.P., A.M. and G.S. drafted the initial version of the manuscript; G.S. prepared the final version of the manuscript.
Funding
This research received no external funding.
Institutional Review Board Statement
Not applicable.
Informed Consent Statement
Not applicable.
Data Availability Statement
All the data and codes used to curate and analyze data is present in https://github.com/Kosutav1997/AntifungalML last accessed on July 18, 2025.
Acknowledgements
We would like to acknowledge Louisiana State University high performance computing facility to HPC access.
Conflicts of Interest
The authors declare no conflicts of interest.
Abbreviations
| RF | Random Forest |
| SVM | Support Vector Machine |
| XGBoost | Extreme gradient boosting tree |
| NN | Neural Network |
| PCA | Principal Component Analysis |
| t-SNE | t-Distributed Stochastic Neighbor Embedding |
| UMAP | Uniform Manifold Approximation and Projection |
| MCC | Matthew’s Correlation Coefficient |
| AUC | Area under the ROC curve |
References
- Bongomin, F.; et al. Global and Multi-National Prevalence of Fungal Diseases-Estimate Precision. J Fungi (Basel) 2017, 3. [Google Scholar] [CrossRef] [PubMed]
- Brown, G.D.; et al. Hidden killers: human fungal infections . Sci Transl Med 2012, 4, 165rv13. [Google Scholar] [CrossRef] [PubMed]
- Organization, W.H. WHO fungal priority pathogens list to guide research, development and public health action. 2022: World Health Organization.
- Perfect, J.R. ; The antifungal pipeline: a reality check . Nat Rev Drug Discov 2017, 16, 603–616. [Google Scholar] [CrossRef] [PubMed]
- Cowen, L.E.; et al. Harnessing Hsp90 function as a powerful, broadly effective therapeutic strategy for fungal infectious disease . Proc Natl Acad Sci U S A 2009, 106, 2818–23. [Google Scholar] [CrossRef]
- Satoh, K.; et al. Candida auris sp. nov., a novel ascomycetous yeast isolated from the external ear canal of an inpatient in a Japanese hospital. Microbiol Immunol 2009, 53, 41–4. [Google Scholar] [CrossRef]
- Vamathevan, J.; et al. Applications of machine learning in drug discovery and development . Nat Rev Drug Discov 2019, 18, 463–477. [Google Scholar] [CrossRef]
- Chen, H.; et al. The rise of deep learning in drug discovery . Drug Discov Today 2018, 23, 1241–1250. [Google Scholar] [CrossRef]
- Rifaioglu, A.S.; et al. Recent applications of deep learning and machine intelligence on in silico drug discovery: methods, tools and databases . Brief Bioinform 2019, 20, 1878–1912. [Google Scholar] [CrossRef]
- Tran, T.P.; et al. Prediction of kinase inhibitor response using activity profiling, in vitro screening, and elastic net regression . BMC Syst Biol 2014, 8, 74. [Google Scholar] [CrossRef]
- Wu, Z.; et al. MoleculeNet: a benchmark for molecular machine learning . Chem Sci 2018, 9, 513–530. [Google Scholar] [CrossRef]
- Sheridan, R.P. ; Time-split cross-validation as a method for estimating the goodness of prospective prediction . J Chem Inf Model 2013, 53, 783–90. [Google Scholar] [CrossRef] [PubMed]
- Wallach, I. and A. Heifets, Most Ligand-Based Classification Benchmarks Reward Memorization Rather than Generalization. . J Chem Inf Model 2018, 58, 916–932. [Google Scholar] [CrossRef] [PubMed]
- Campoy, S. and J.L. Adrio, Antifungals . Biochem Pharmacol 2017, 133, 86–96. [Google Scholar] [CrossRef]
- Wishart, D.S.; et al. HMDB 5.0: the Human Metabolome Database for 2022. . Nucleic Acids Res 2022, 50, D622–D631. [Google Scholar] [CrossRef]
- Chung, N.C.; et al. Jaccard/Tanimoto similarity test and estimation methods for biological presence-absence data . BMC Bioinformatics 2019, 20 (Suppl. S15), 644. [Google Scholar] [CrossRef]
- Kuwahara, H. and X. Gao, Analysis of the effects of related fingerprints on molecular similarity using an eigenvalue entropy approach. . J Cheminform 2021, 13, 27. [Google Scholar] [CrossRef]
- Kim, H.W.; et al. NPClassifier: A Deep Neural Network-Based Structural Classification Tool for Natural Products . J Nat Prod 2021, 84, 2795–2807. [Google Scholar] [CrossRef]
- Bento, A.P.; et al. An open source chemical structure curation pipeline using RDKit . J Cheminform 2020, 12, 51. [Google Scholar] [CrossRef]
- Mishra, P.; et al. Application of Student's t-test, Analysis of Variance, and Covariance . Ann Card Anaesth 2019, 22, 407–411. [Google Scholar] [CrossRef]
- Groth, D.; et al. Principal components analysis . Methods Mol Biol 2013, 930, 527–47. [Google Scholar]
- Jolliffe, I.T. and J. Cadima, Principal component analysis: A review and recent developments. . Philos Trans A Math Phys Eng Sci 2016, 374, 20150202. [Google Scholar]
- Cieslak, M.C.; et al. t-Distributed Stochastic Neighbor Embedding (t-SNE): A tool for eco-physiological transcriptomic analysis . Mar Genomics 2020, 51, 100723. [Google Scholar] [CrossRef] [PubMed]
- Armstrong, G.; et al. Uniform Manifold Approximation and Projection (UMAP) Reveals Composite Patterns and Resolves Visualization Artifacts in Microbiome Data . mSystems 2021, 6, e0069121. [Google Scholar] [CrossRef]
- Khan, H. ; M.S. Mubarak, and S. Amin, Antifungal Potential of Alkaloids As An Emerging Therapeutic Target. Curr Drug Targets 2017, 18, 1825–1835. [Google Scholar] [CrossRef] [PubMed]
- Thawabteh, A.M.; et al. Antibacterial Activity and Antifungal Activity of Monomeric Alkaloids. Toxins (Basel) 2024, 16. [Google Scholar] [CrossRef] [PubMed]
- Wang, H.; et al. In vivo and in vitro antifungal activities of five alkaloid compounds isolated from Picrasma quassioides (D. Don) Benn against plant pathogenic fungi. Pestic Biochem Physiol 2022, 188, 105246. [Google Scholar] [CrossRef]
- Cushnie, T.P.B. Cushnie, and A.J. Lamb, Alkaloids: an overview of their antibacterial, antibiotic-enhancing and antivirulence activities. Int J Antimicrob Agents 2014, 44, 377–86. [Google Scholar] [CrossRef]
- Aniszewski, T. ; Alkaloids: Chemistry, biology, ecology, and applications. 2015: Elsevier.
- Kittakoop, P.C. Mahidol, and S. Ruchirawat, Alkaloids as important scaffolds in therapeutic drugs for the treatments of cancer, tuberculosis, and smoking cessation. Curr Top Med Chem 2014, 14, 239–52. [Google Scholar] [CrossRef]
- Upadhyay, S.; et al. Subcellular Compartmentalization and Trafficking of the Biosynthetic Machinery for Fungal Melanin . Cell Rep 2016, 14, 2511–8. [Google Scholar] [CrossRef]
- Herrmann, K.M. and L.M. Weaver, THE SHIKIMATE PATHWAY . Annu Rev Plant Physiol Plant Mol Biol 1999, 50, 473–503. [Google Scholar] [CrossRef]
- Dixon, R.A. and N.L. Paiva, Stress-Induced Phenylpropanoid Metabolism . Plant Cell 1995, 7, 1085–1097. [Google Scholar] [CrossRef]
- Lazaridis, T. and G. Hummer, Classical Molecular Dynamics with Mobile Protons . J Chem Inf Model 2017, 57, 2833–2845. [Google Scholar] [CrossRef]
Figure 1.
Percentage distribution of the compounds in natural compound classes of terpenoids, shikimates and phenylpropanoids, polyketides, fatty acids, carbohydrates, amino acids and peptides and alkaloids. In the figure antifungal compounds are represented in light green and non-antifungal compounds shown in light blue color. Percentage on top of each bar represent the proportion of compounds in each natural compound class.
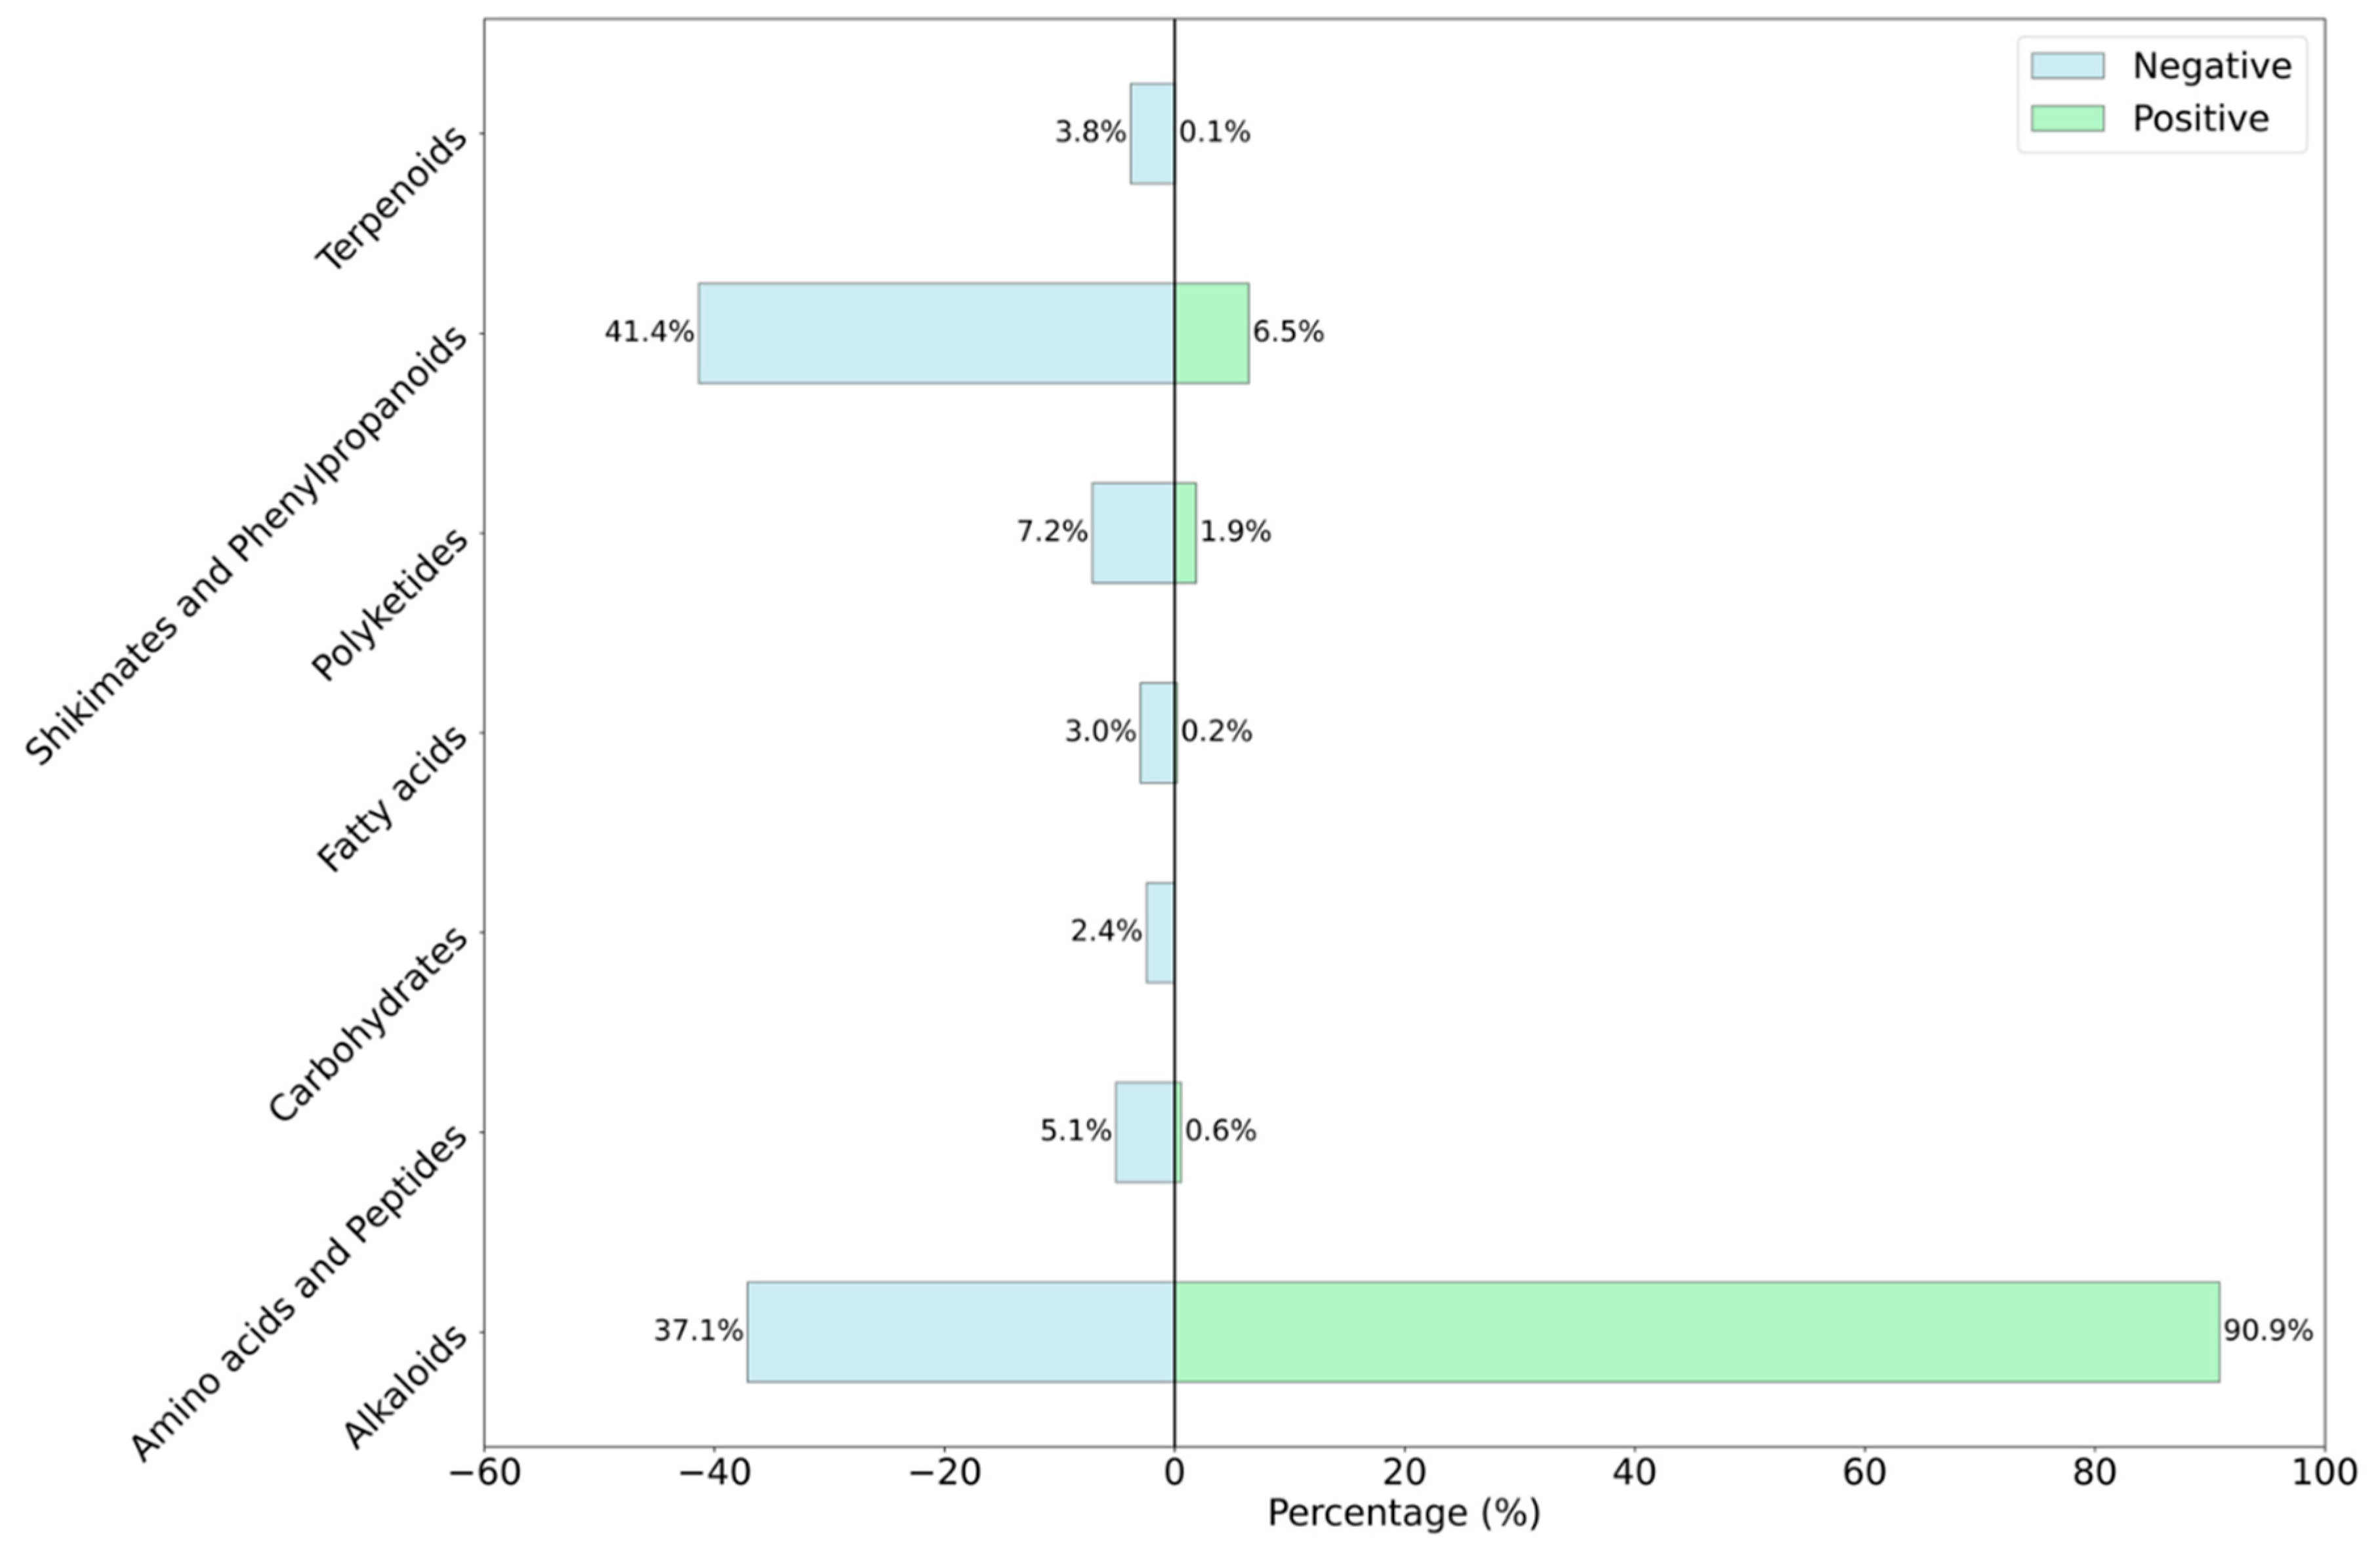
Figure 3.
The two-dimensional principal component plot calculated from the 217 RdKit descriptors for positive and negative compounds. The Orange solid circles indicate the positive compounds, and light blue solid squares represent negative compounds. The number in bracket on axes represent the variance explained by the corresponding principal component.
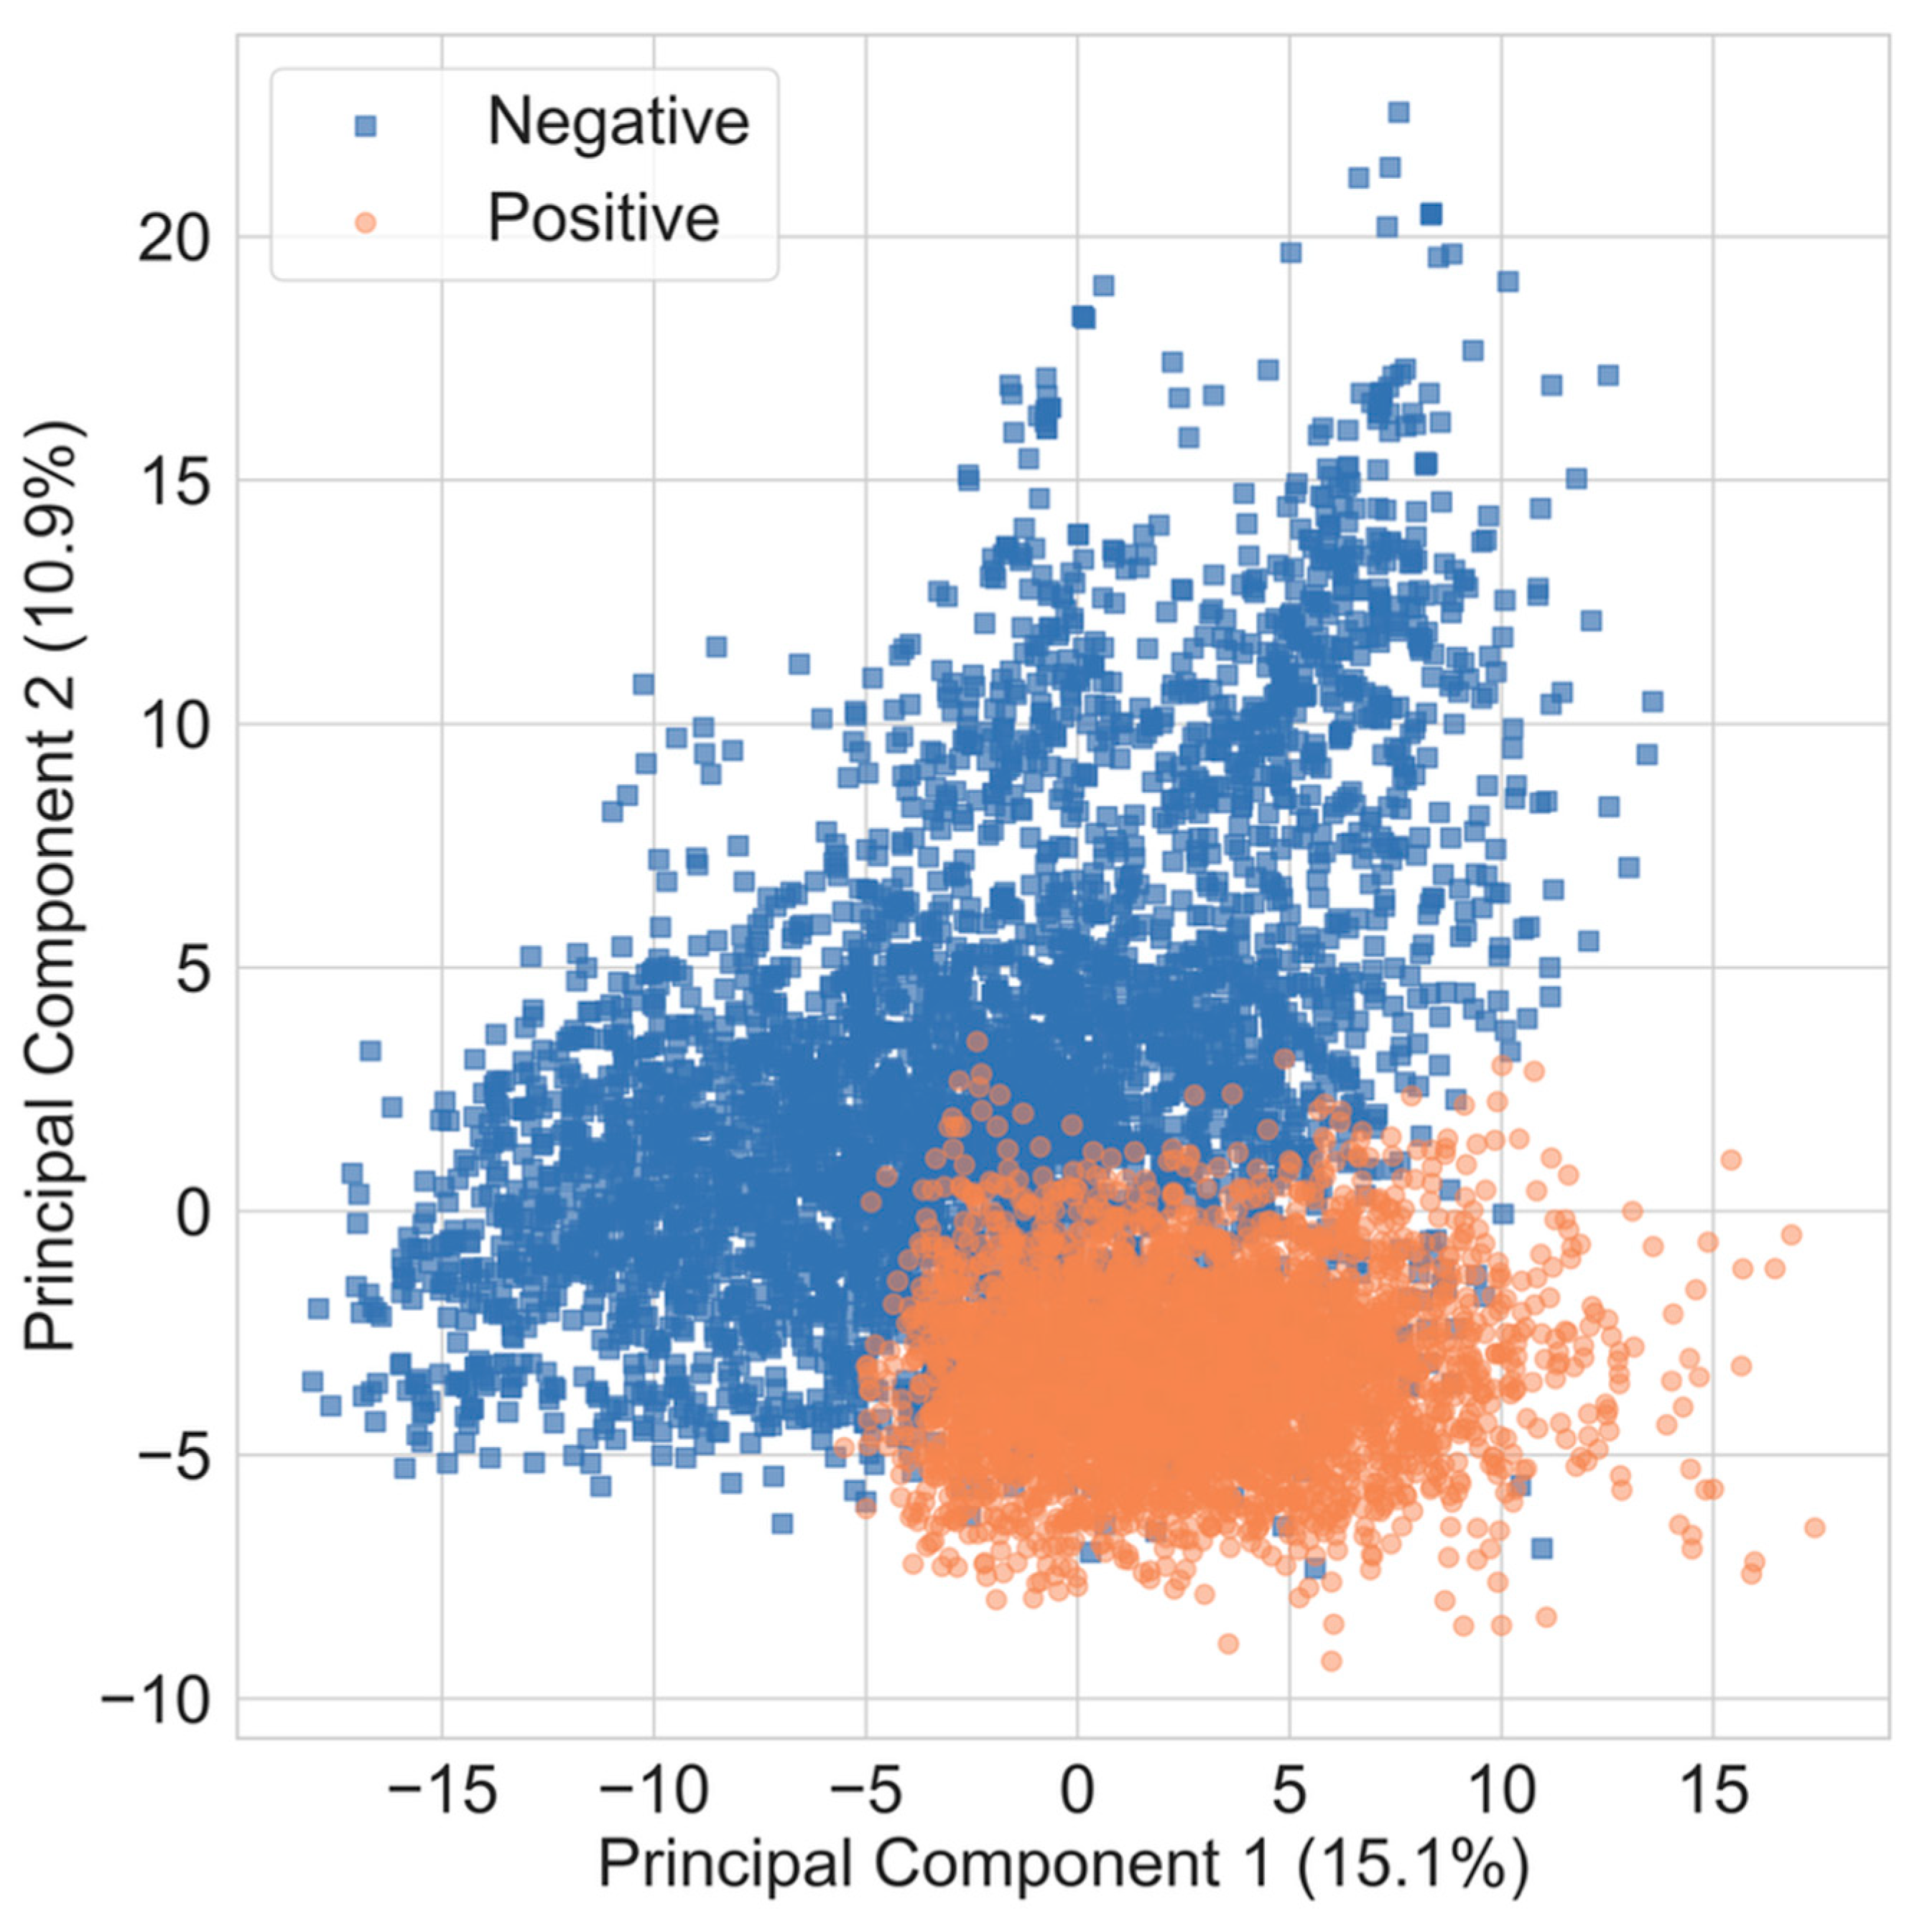
Figure 4.
t-SNE and UMAP visualizations of positive and negative compounds calculated using 217 RdKit descriptors. Each point corresponds to a compound, colored by activity class (yellow: positive, blue: negative). Both (A) t-SNE (left) and (B) UMAP (right) showed overlap without any clear separation between positive and negative classes.
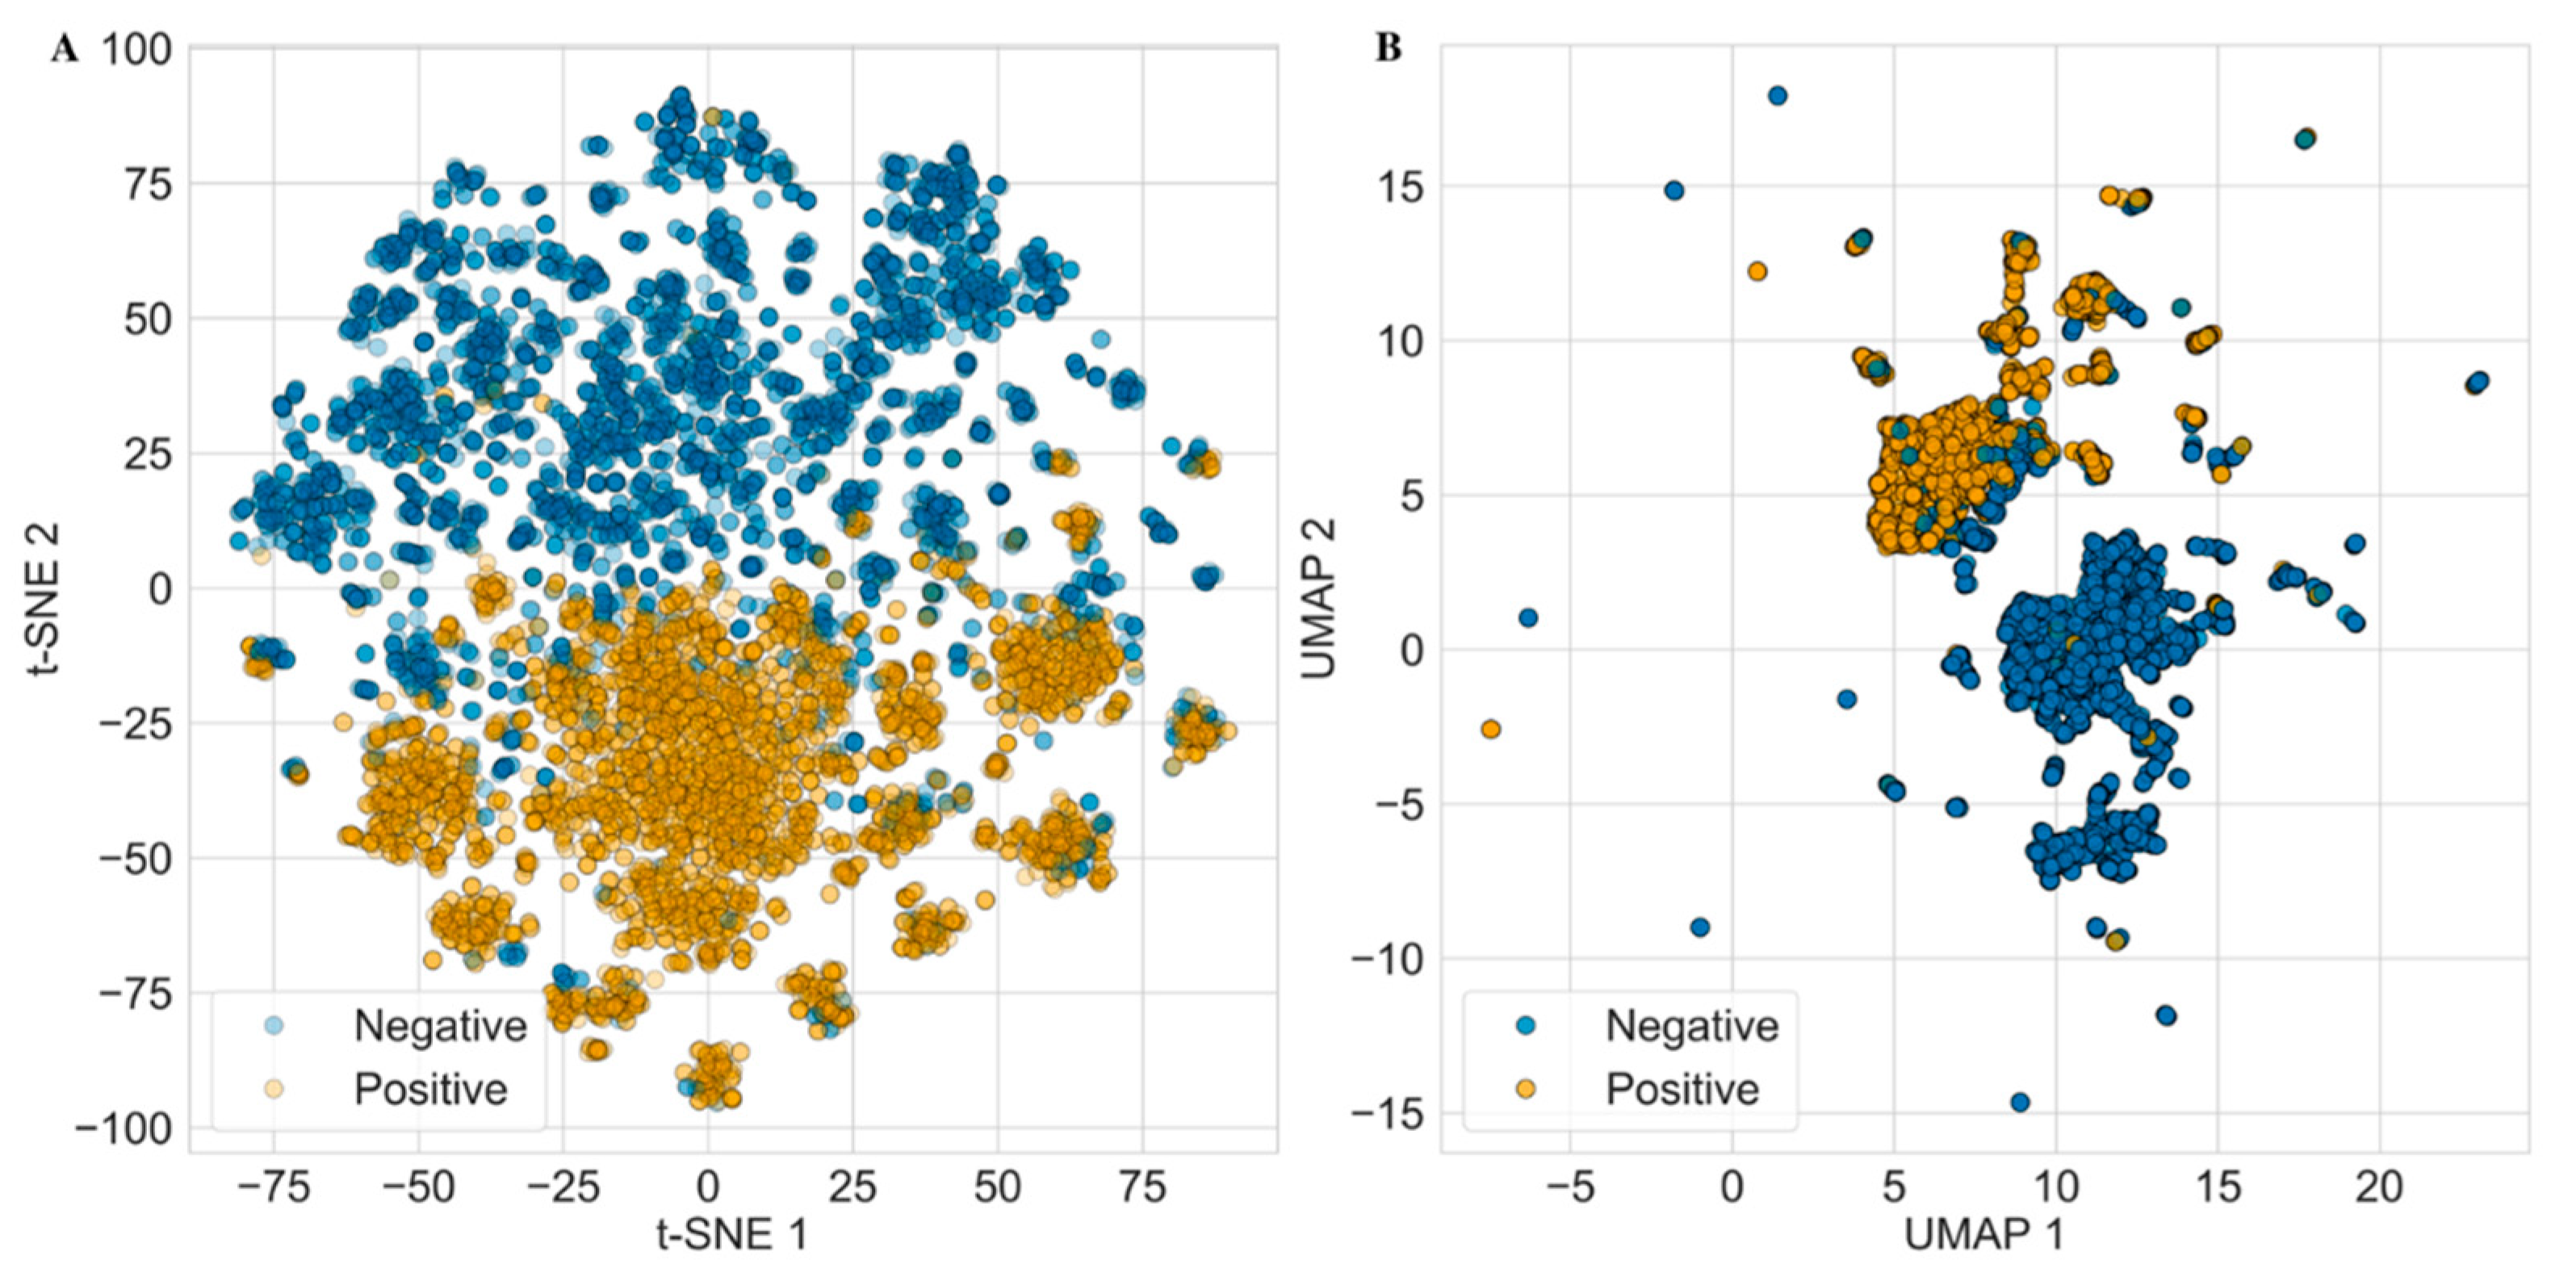
Figure 5.
Area under the ROC curve (AUC) plot for the random split of 5-fold cross validation. Each fold is represented as dashed line. The solid blue line represents the mean AUC value across all the folds. (A) AUC plot for the RF based five-fold cross validation and (B) AUC plot for the XGBoost five-fold cross validation.
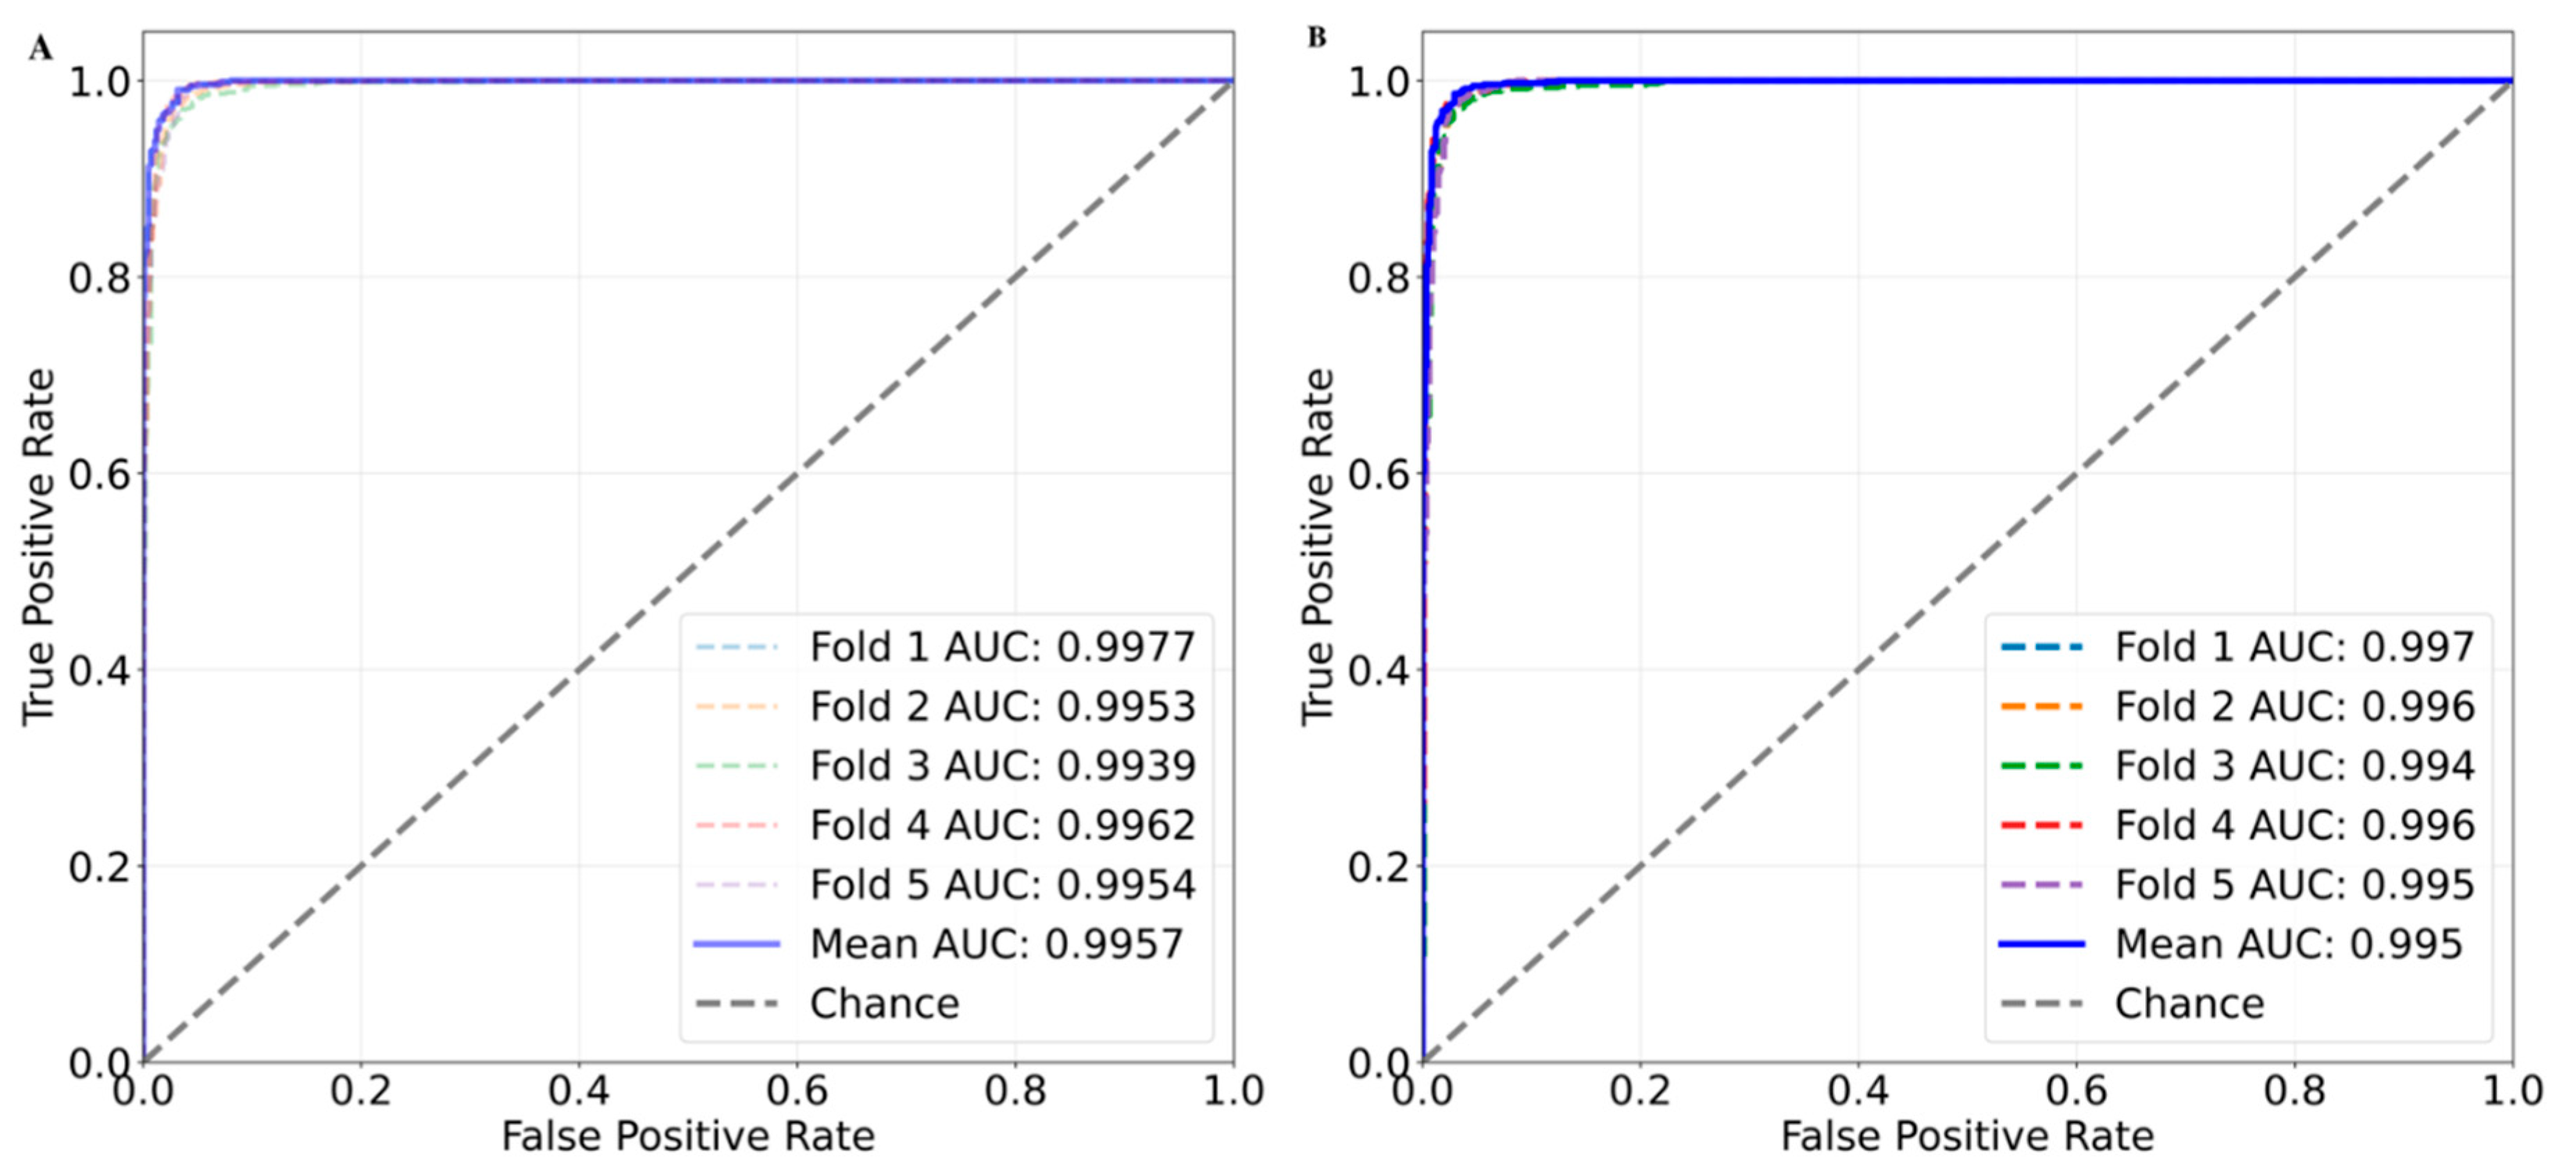
Figure 6.
Area under the ROC curve (AUC) plot for the random split of 5-fold cross validation. Each fold is represented as dashed line. The solid blue line represents the mean AUC value across all the folds. (A) AUC plot for the SVM-RBF based five-fold cross validation, (B) AUC for SVM-Polynomial based five-fold cross validation and (C) AUC for SVM-Sigmoid based five-fold cross validation.
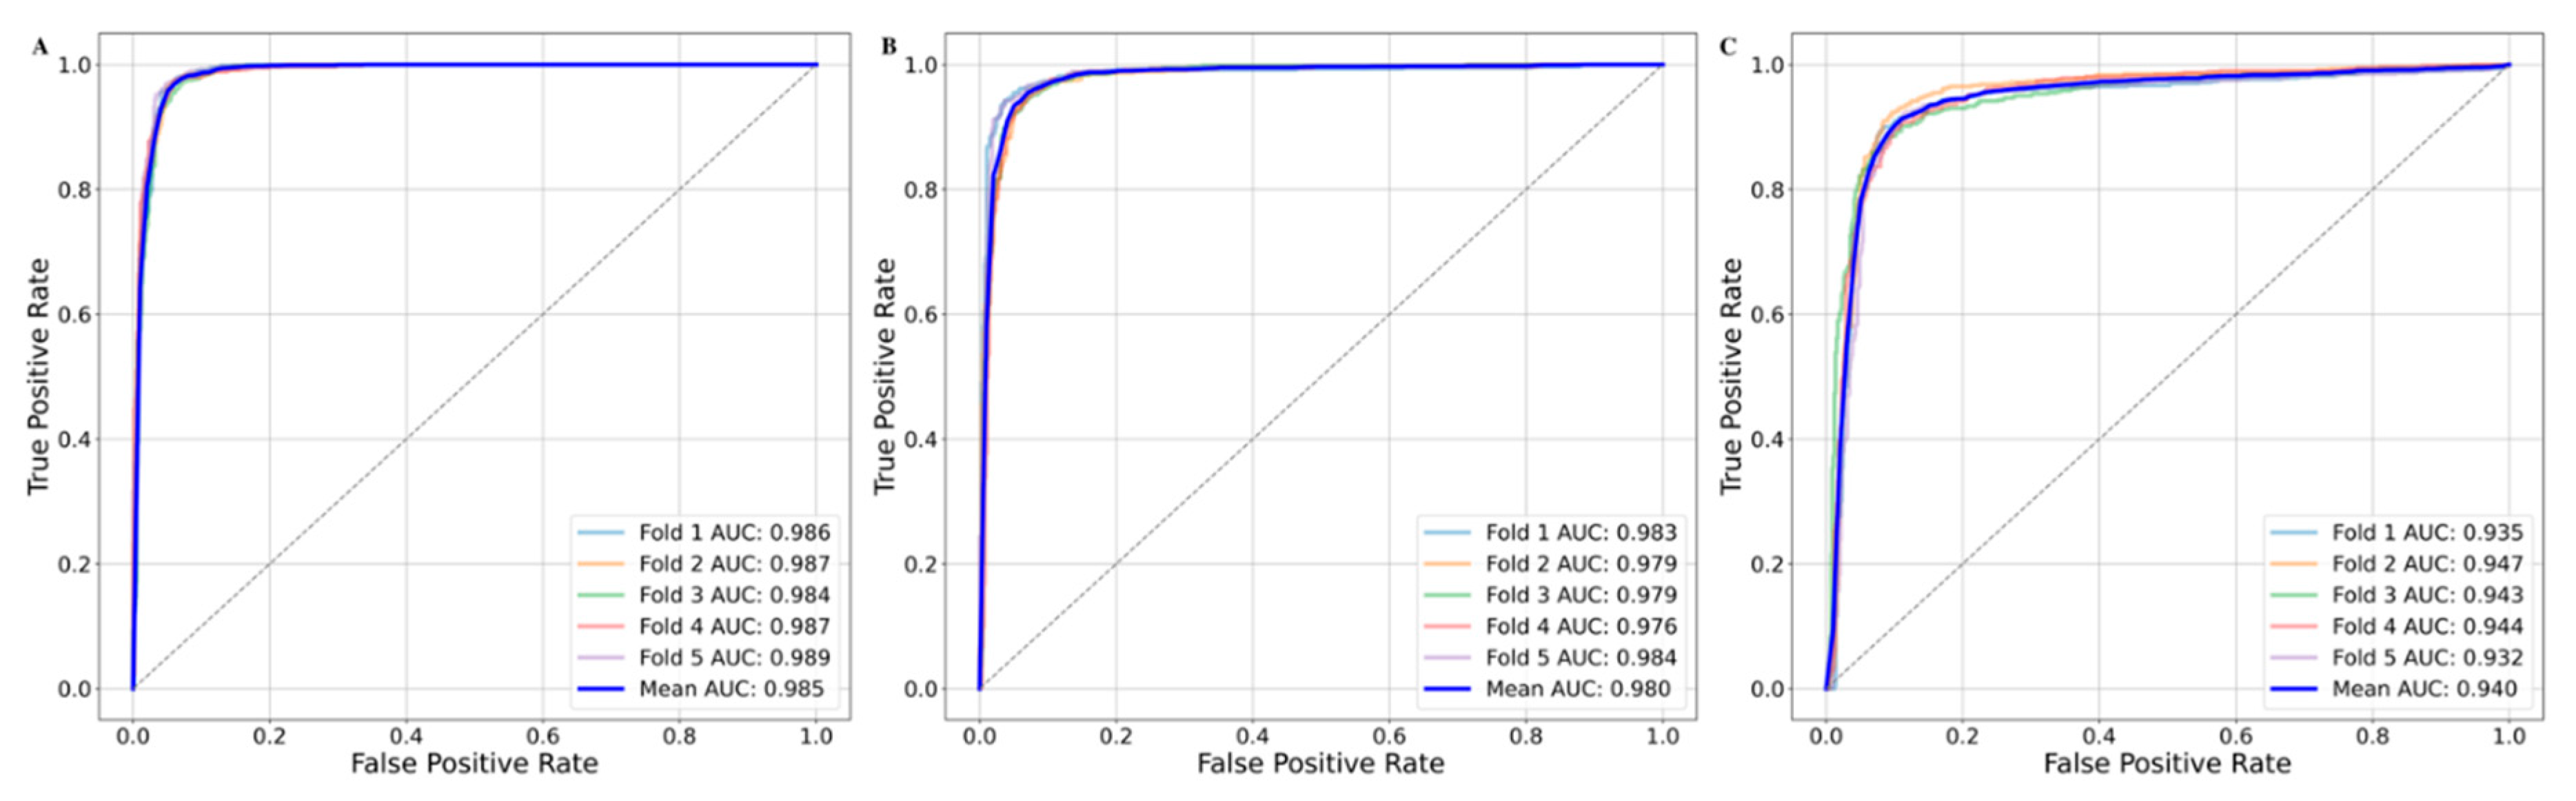
Figure 7.
Area under the ROC curve (AUC) plot for the random split of 5-fold cross validation using neural network. Each fold is represented as dashed line. The solid blue line represents the mean AUC value across all the folds.
Figure 7.
Area under the ROC curve (AUC) plot for the random split of 5-fold cross validation using neural network. Each fold is represented as dashed line. The solid blue line represents the mean AUC value across all the folds.
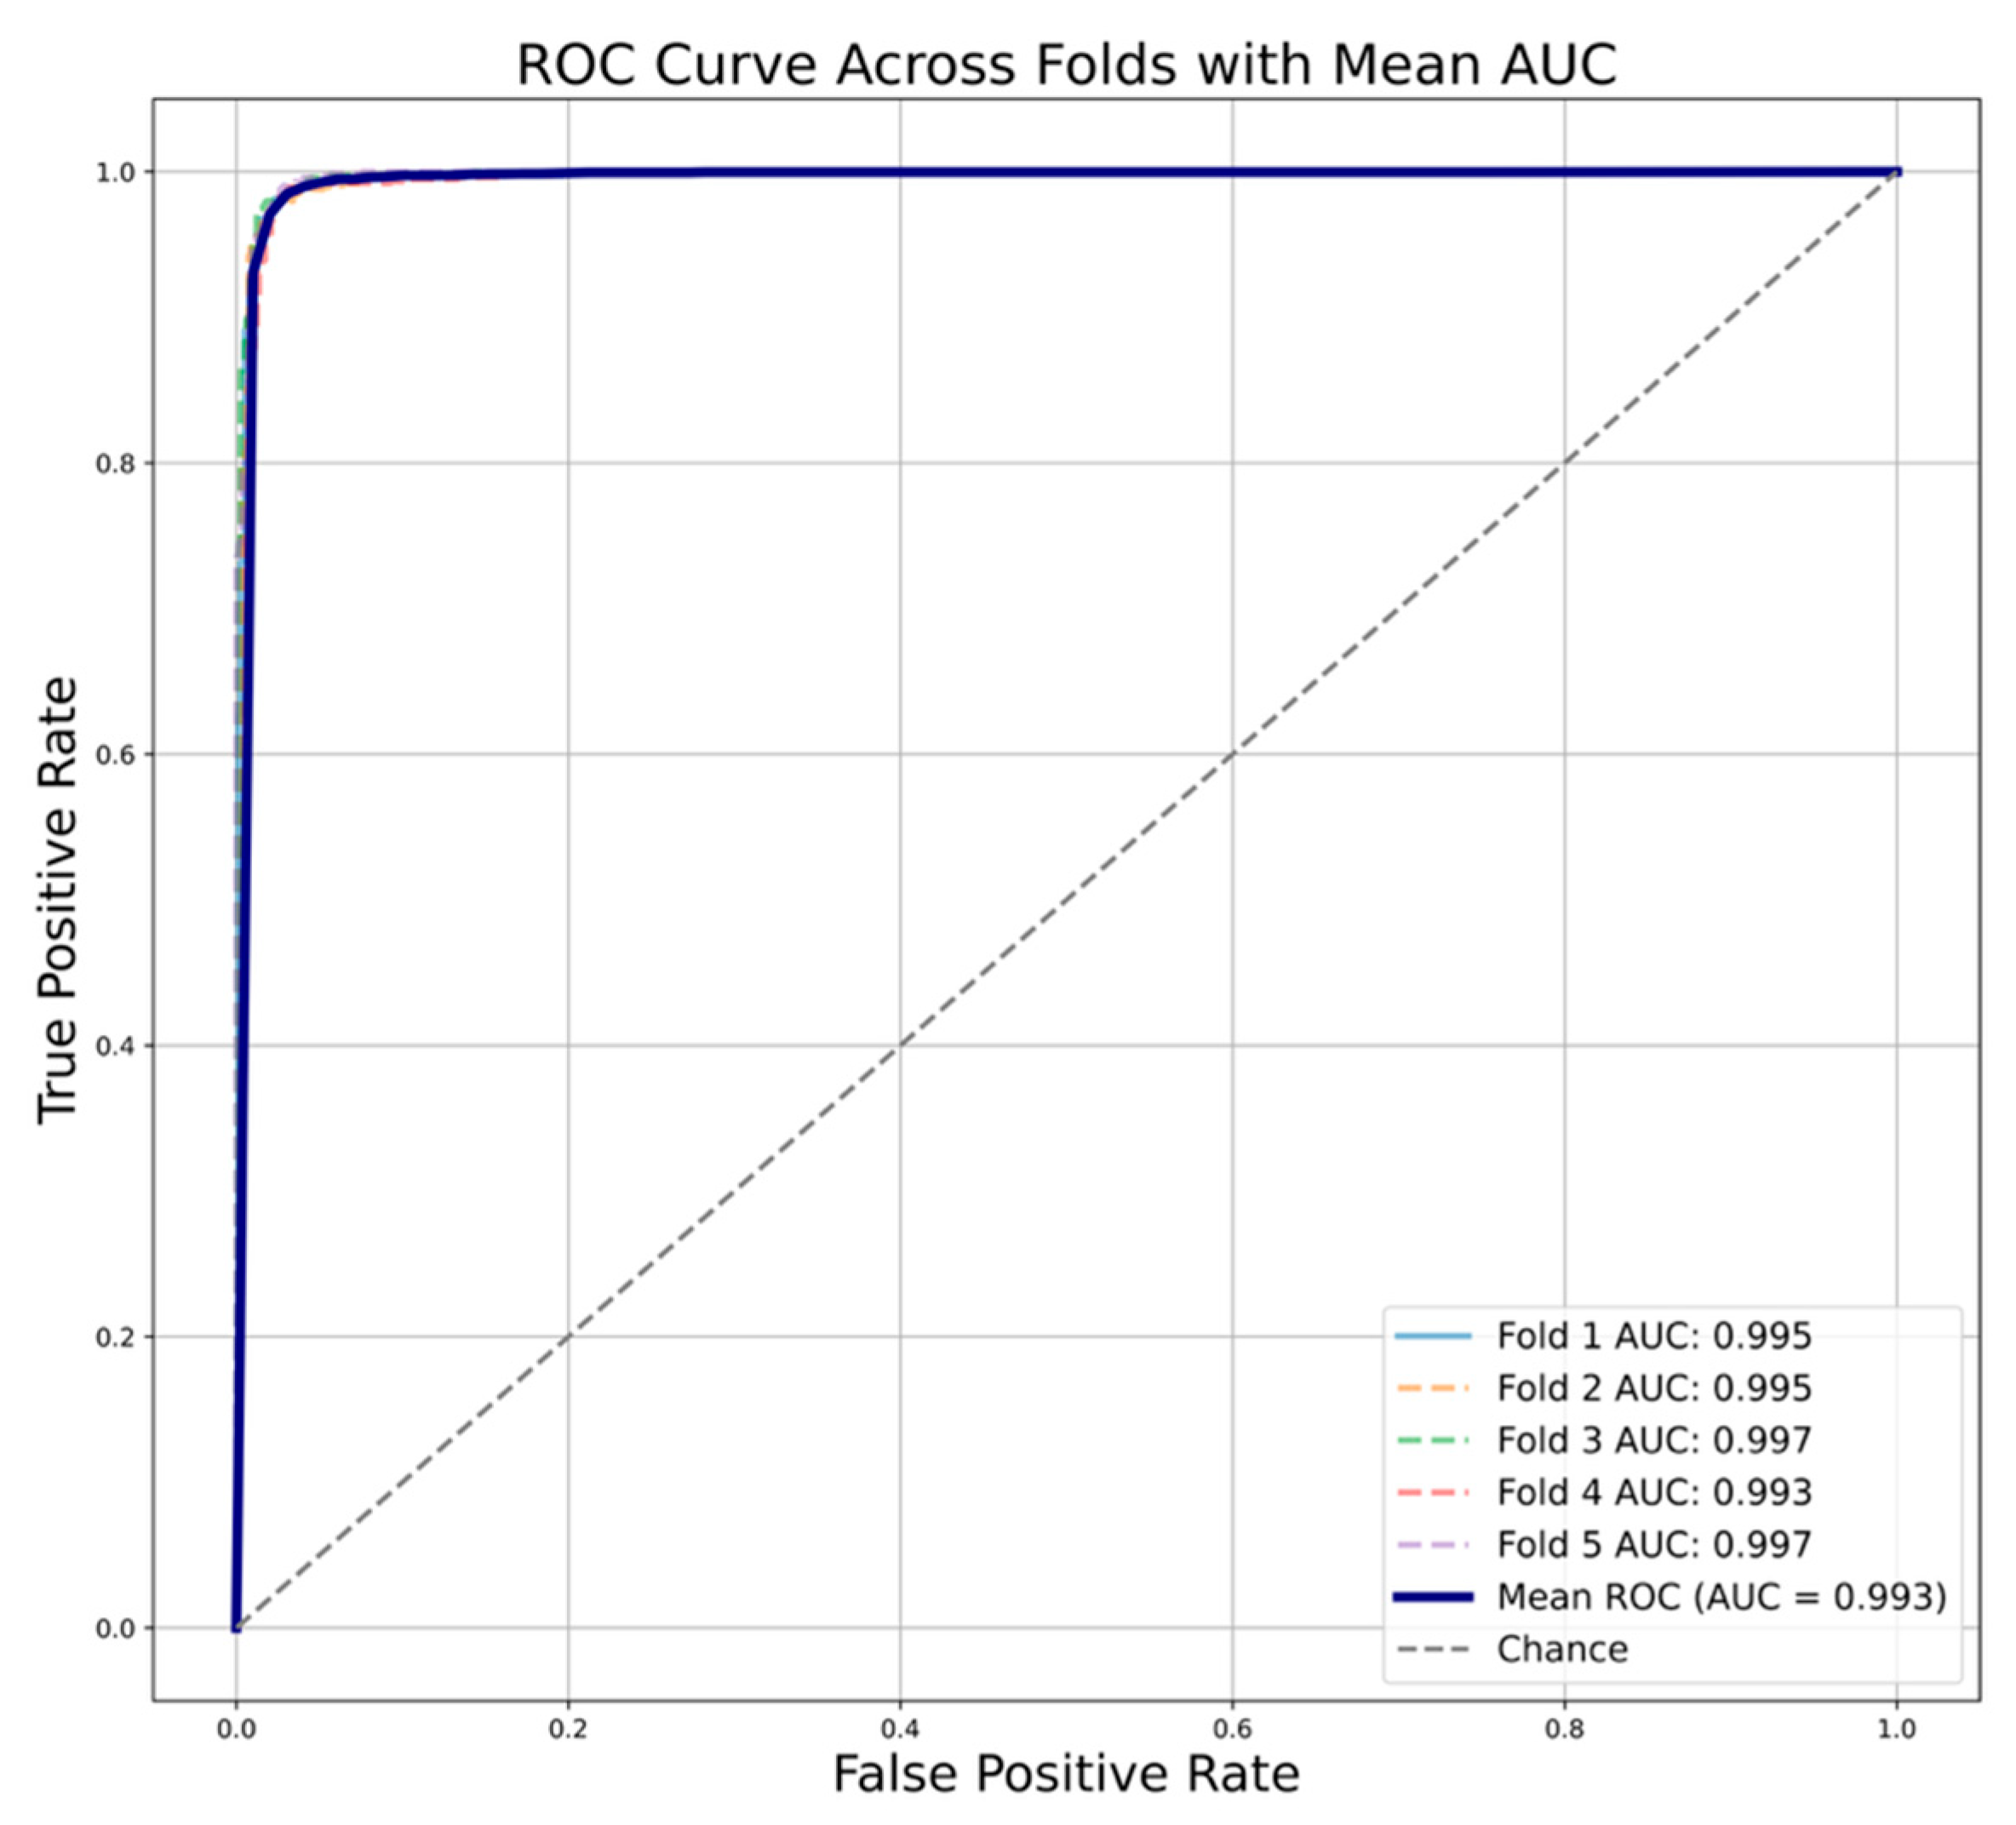
Figure 8.
Area under the ROC curve (AUC) plot for the chemical class-based cross validation. Each fold is represented as colored dashed curved line. Alkaloid is in blue, the shikimates and phenylpropanoids is in orange and other class is represented in green. (A) AUC plot for the RF and (B) AUC plot for the XGBoost. The grey line passing from origin represents the random choice line.
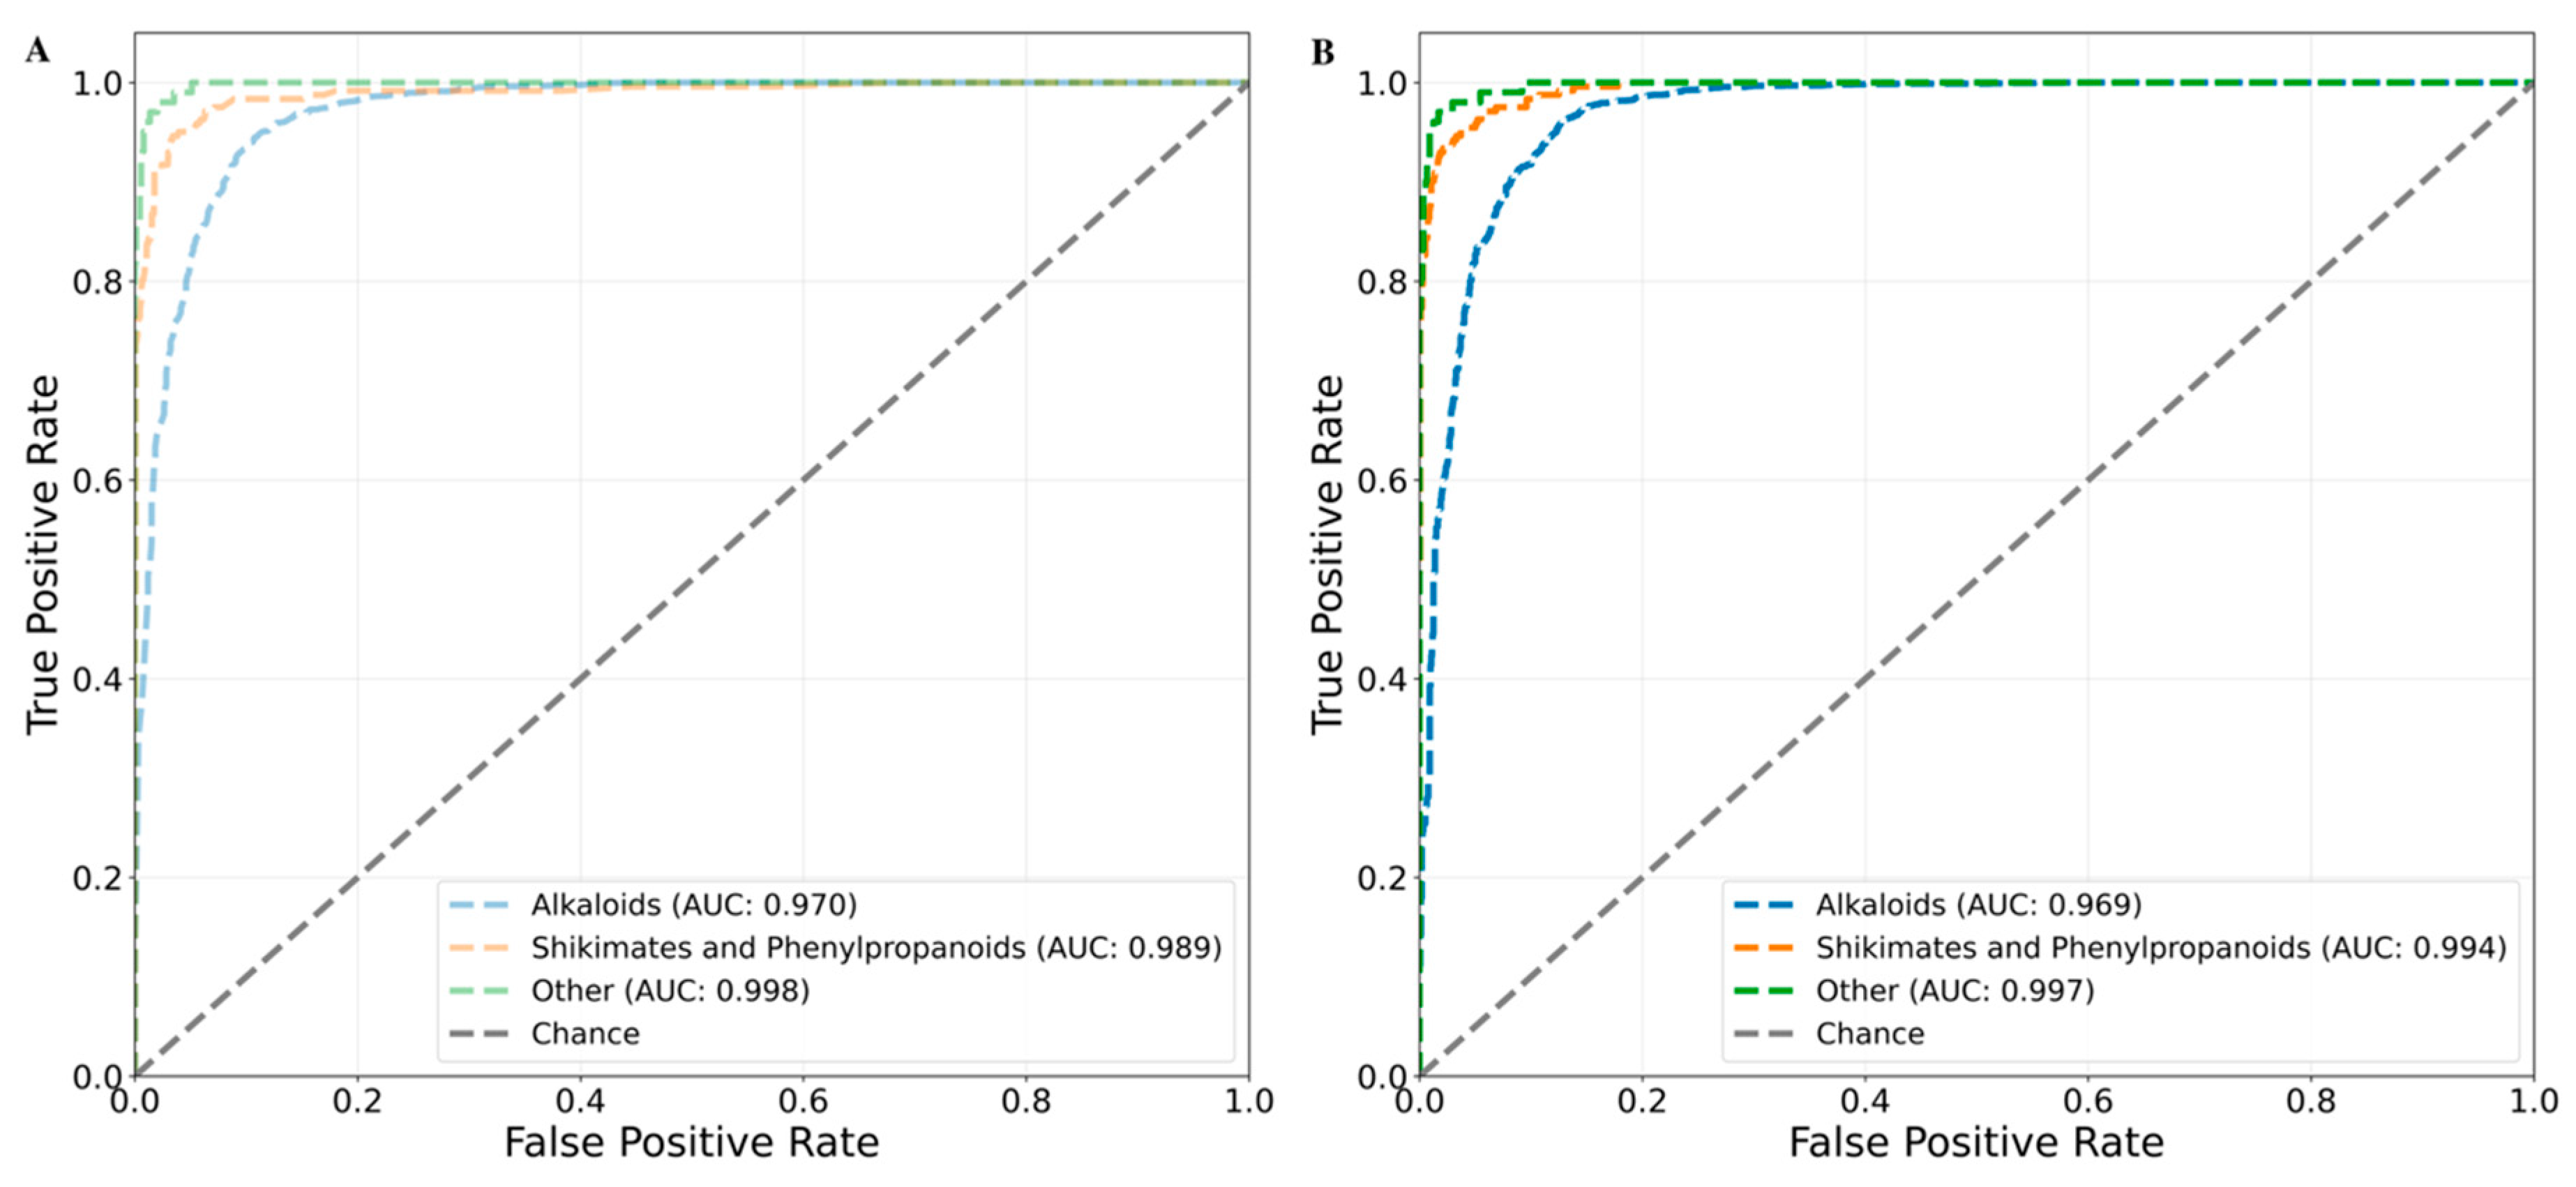
Figure 9.
Area under the ROC curve (AUC) plot for the chemical class based cross validation. Each fold is represented as colored dashed curved line. Alkaloid is in blue, the shikimates and phenylpropanoids is in orange and other class is represented in green. (A) AUC plot for the SVM-RBF, (B) AUC for SVM-Polynomial and (C) AUC for SVM-Sigmoid and the grey line passing from origin represents the random choice line.
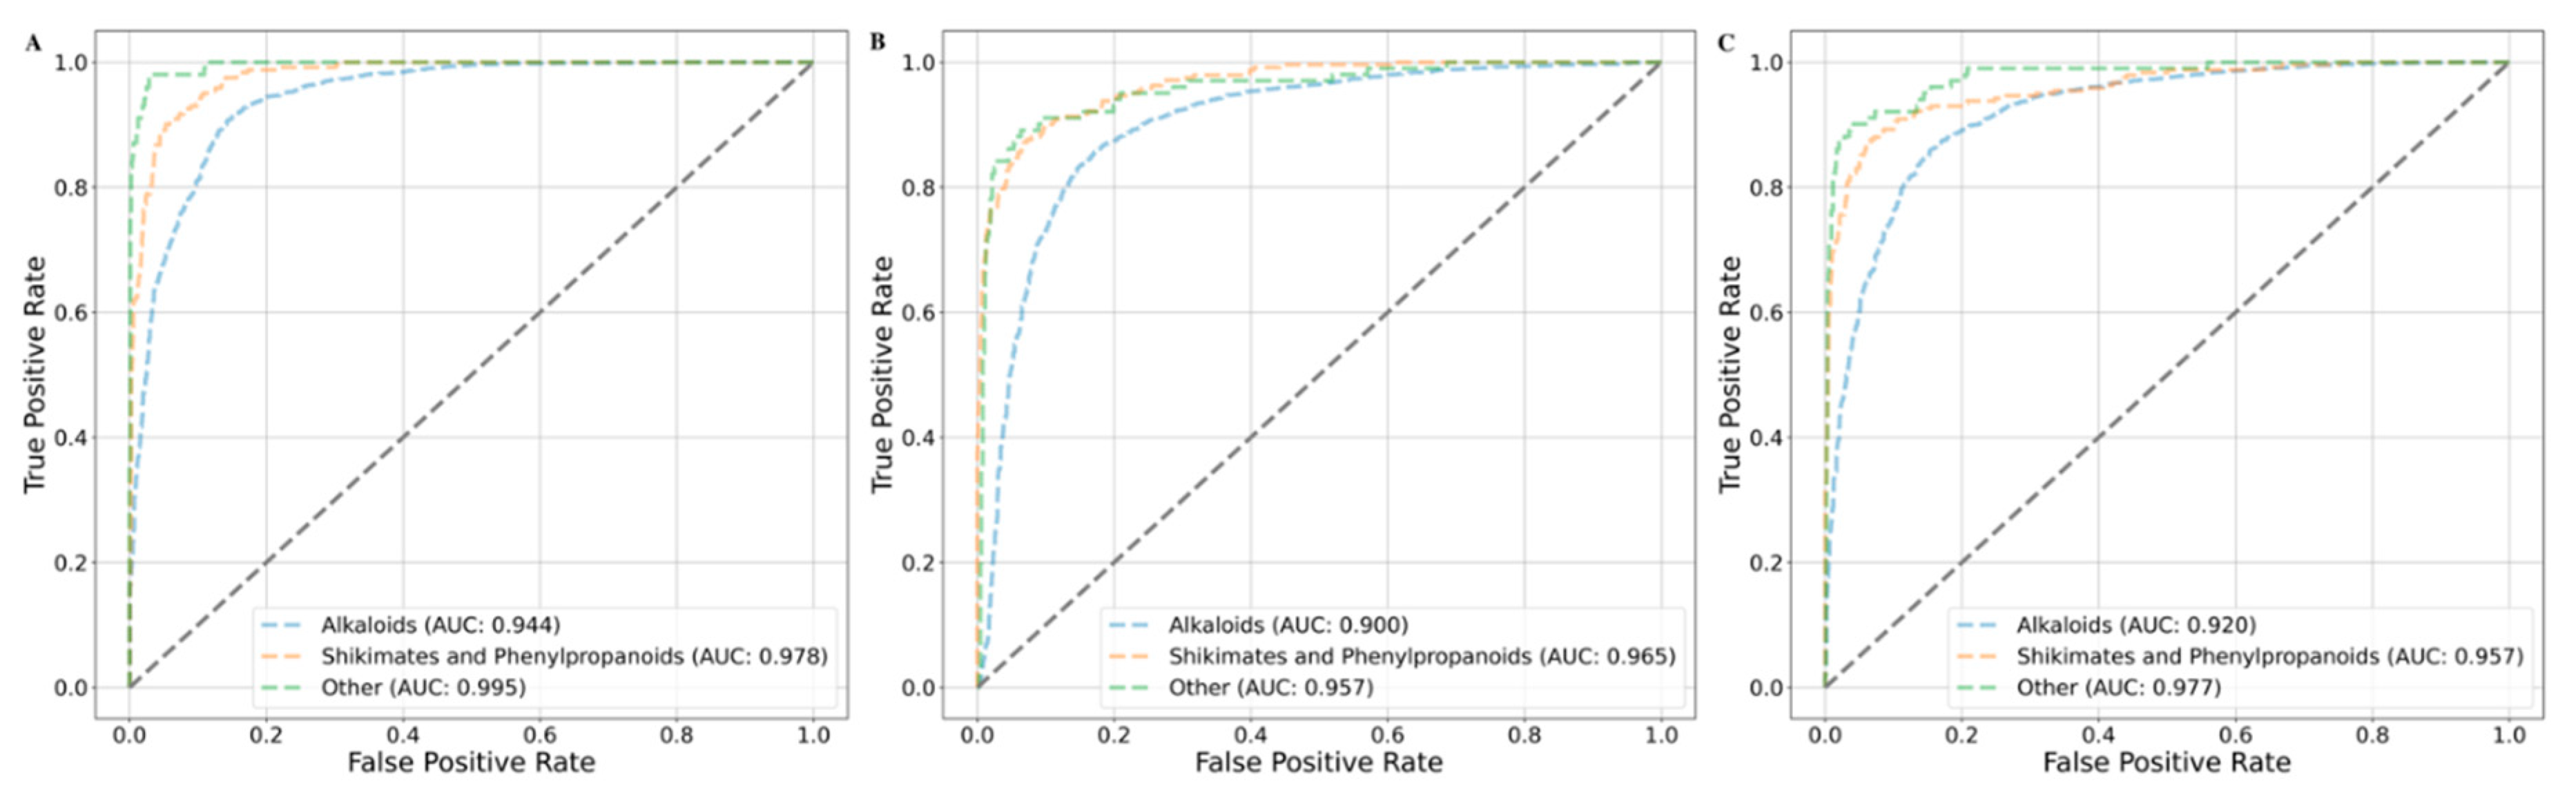
Figure 10.
Area under the ROC curve (AUC) plot for the class-based cross validation using neural network. Each fold is represented as colored dashed curved line. Alkaloid is in blue, the shikimates and phenylpropanoids is in orange and other class is represented in green.
Figure 10.
Area under the ROC curve (AUC) plot for the class-based cross validation using neural network. Each fold is represented as colored dashed curved line. Alkaloid is in blue, the shikimates and phenylpropanoids is in orange and other class is represented in green.
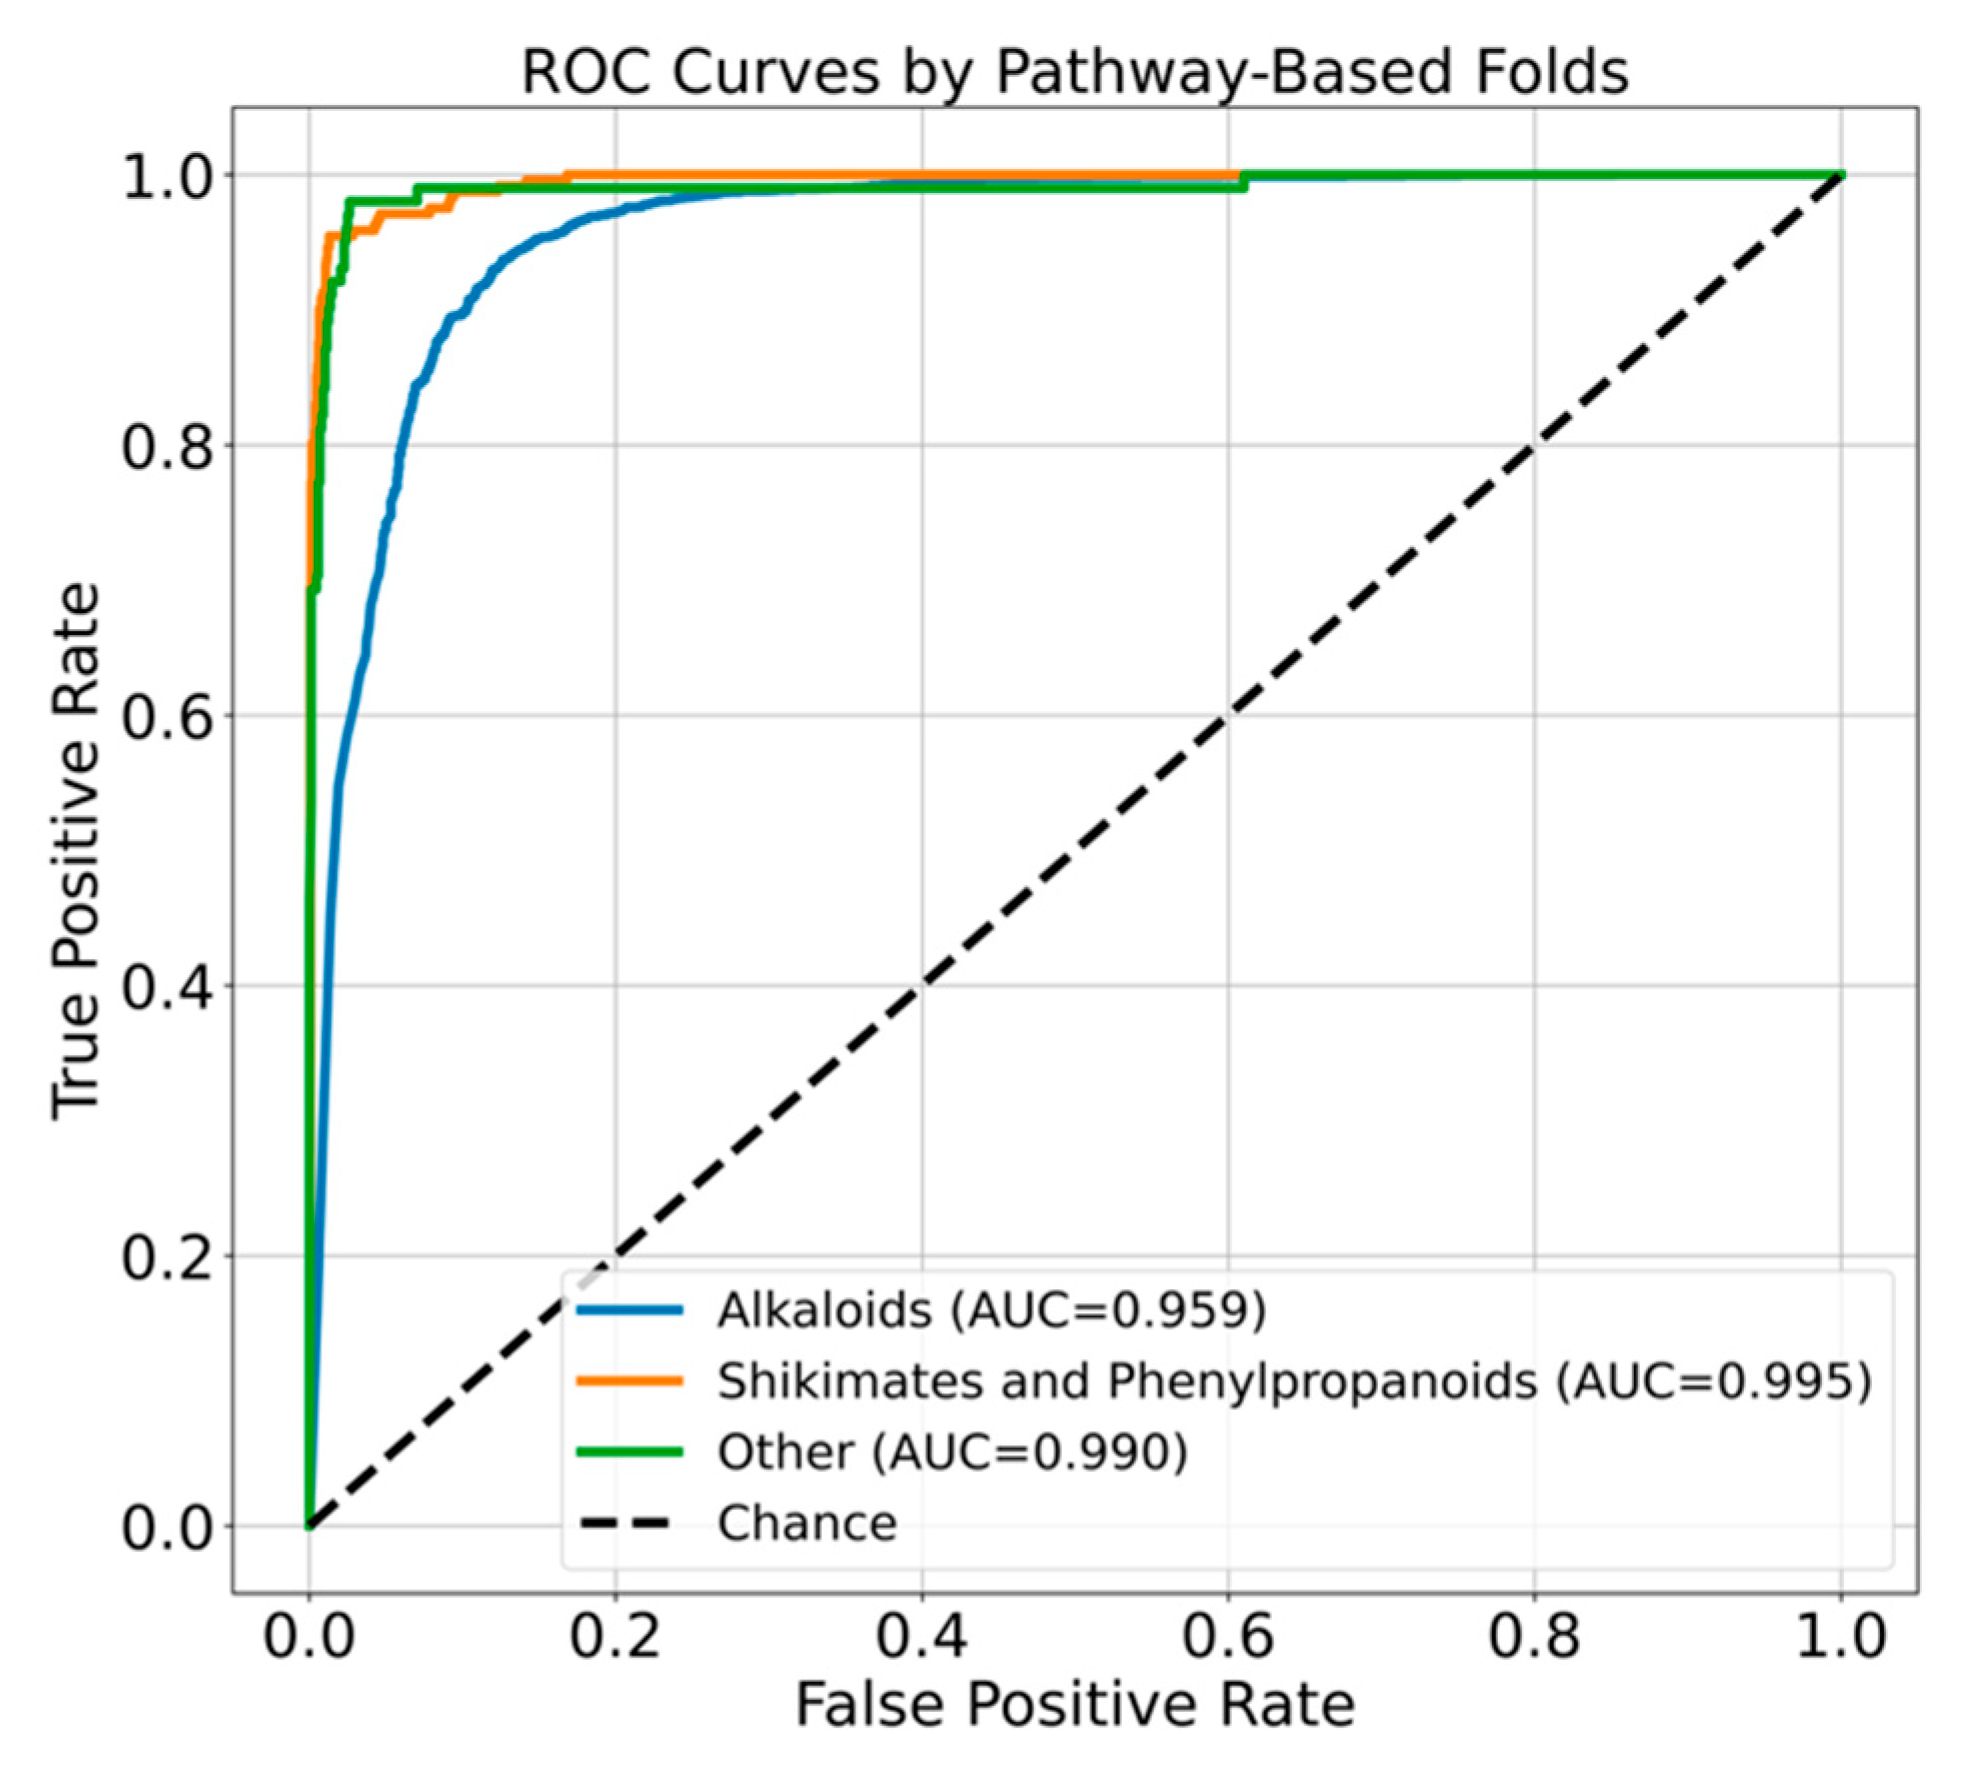

Table 1.
Mean performance comparison of supervised machine learning models for antifungal compound classification. The table summarizes the predictive performance of six models: Random Forest, XGBoost, Support Vector Machine (SVM) with polynomial, radial basis function (RBF), and sigmoid kernels, and a Multi-Layer Perceptron (Neural Network). Each model was trained using optimized hyperparameters and evaluated using standard classification metrics: balanced accuracy, precision, recall, F1-score, MCC, and AUC. Results are reported as the mean ± standard deviation over five folds.
| Models | Balanced Accuracy | Precision | Recall | F1 | MCC | AUC |
|---|---|---|---|---|---|---|
| Random Forest | 0.972±0.002 | 0.963±0.003 | 0.979±0.003 | 0.971±0.002 | 0.944±0.004 | 0.996±0.001 |
| XGBoost | 0.973±0.003 | 0.964±0.003 | 0.979±0.006 | 0.971±0.002 | 0.945±0.006 | 0.995±0.001 |
| SVM Polynomial | 0.942±0.006 | 0.938±0.012 | 0.942±0.008 | 0.940±0.007 | 0.885±0.013 | 0.980±0.003 |
| SVM RBF | 0.955±0.003 | 0.936±0.008 | 0.971±0.004 | 0.953±0.003 | 0.909±0.006 | 0.986±0.002 |
| SVM Sigmoid | 0.901±0.007 | 0.897±0.008 | 0.897±0.011 | 0.897±0.007 | 0.803±0.013 | 0.940±0.006 |
| Neural Network | 0.977±0.004 | 0.976±0.005 | 0.977±0.006 | 0.976±0.004 | 0.954±0.008 | 0.996±0.001 |
Table 2.
Mean performance comparison of six machine learning models for antifungal compound classification based on chemical class based cross validation. Results are reported as the mean ± standard deviation over five folds.
Table 2.
Mean performance comparison of six machine learning models for antifungal compound classification based on chemical class based cross validation. Results are reported as the mean ± standard deviation over five folds.
| Models | Balanced Accuracy | Precision | Recall | F1 | MCC | AUC |
|---|---|---|---|---|---|---|
| Random Forest | 0.933 | 0.923 | 0.923 | 0.922 | 0.878 | 0.986 |
| XGBoost | 0.933 | 0.933 | 0.919 | 0.926 | 0.883 | 0.986 |
| SVM Polynomial | 0.880 | 0.708 | 0.861 | 0.764 | 0.669 | 0.941 |
| SVM RBF | 0.911 | 0.819 | 0.882 | 0.841 | 0.759 | 0.972 |
| SVM Sigmoid | 0.881 | 0.838 | 0.848 | 0.843 | 0.754 | 0.951 |
| Neural Network | 0.932 | 0.928 | 0.935 | 0.914 | 0.862 | 0.981 |
Disclaimer/Publisher’s Note: The statements, opinions and data contained in all publications are solely those of the individual author(s) and contributor(s) and not of MDPI and/or the editor(s). MDPI and/or the editor(s) disclaim responsibility for any injury to people or property resulting from any ideas, methods, instructions or products referred to in the content. |
© 2025 by the authors. Licensee MDPI, Basel, Switzerland. This article is an open access article distributed under the terms and conditions of the Creative Commons Attribution (CC BY) license (http://creativecommons.org/licenses/by/4.0/).
Copyright: This open access article is published under a Creative Commons CC BY 4.0 license, which permit the free download, distribution, and reuse, provided that the author and preprint are cited in any reuse.


