
Submitted:
19 July 2025
Posted:
21 July 2025
You are already at the latest version
Abstract
Background and Aims: Intrahepatic cholangiocarcinoma (iCCA) is the second most common type of primary liver tumor. Due to its aggressive nature and resistance to conventional treatments, there is a pressing need to develop novel and more effective therapies for this deadly malignancy. Methods: Here, we explored the therapeutic potential of the DNA minor groove binders Trabectedin (TRB) and Lurbinectedin (LUR) for the treatment of iCCA using cell lines, spheroids, cancer-associated fibroblasts (CAFs), patient-derived tumor organoids (PDOs), and the chicken corioallantoic membrane (CAM) in vivo model. Results: TRB and, more substantially, LUR, significantly inhibited cell growth in iCCA cell lines, spheroids, CAFs, and patient PDOs at very low nanomolar concentrations. Specifically, the two drugs significantly reduced proliferation, triggered apoptosis, and caused DNA damage in iCCA cells. At the metabolic level, TRB and LUR decreased mitochondrial respiration and glycolysis. At the molecular level, the two compounds effectively downregulated the mTORC1 and Hippo/YAP pathways and suppressed the expression of YAP1, c-Myc, E2F1, BRD4, TEAD4, and CD7 proto-oncogenes. Furthermore, LUR significantly restrained the in vivo growth of iCCA cells in the CAM model. Conclusions: Our data indicate that TRB and LUR possess strong antiproliferative and pro-apoptotic activities and could represent promising therapeutic agents for the treatment of iCCA.
Keywords:
intrahepatic cholangiocarcinoma
; trabectedin
; lurbinectedin
; innovative therapies
Lay Summary
- Chemo-immunotherapy is becoming the standard of care for unresectable aggressive intrahepatic cholangiocarcinoma (iCCA).
- This study underscores the potential use of Trabectedin and Lurbinectedin in inhibiting the growth of iCCA cells.
- These two drugs exert their antitumor effect by binding the DNA minor groove inducing cytotoxicity and impacting DNA repair
- Trabectedin and Lurbinectedin have strong impact on the tumor microenvironment (TME) components hindering their ability to promote tumor growth and progression.
Introduction
Intrahepatic cholangiocarcinoma (iCCA) is the second most common primary liver cancer, arising from the epithelial cells of the intrahepatic bile ducts and accounting for approximately 15% to 20% of all liver malignancies [1,2]. In the past 40 years, iCCA diagnoses in the United States have increased by 128%. Despite this ongoing rise in morbidity and mortality, the disease remains challenging to detect and manage due to the lack of specific symptoms, its intrinsic aggressiveness, and the limited therapeutic options available [3].
The primary risk factors associated with the development of iCCA include primary sclerosing cholangitis, fibro-polycystic liver disease, chronic infections with hepatitis B and C viruses, hepatobiliary flukes, hepatolithiasis, and metabolic dysfunction-associated steatotic liver disease (MASLD). However, in many cases, iCCA occurs without any identifiable risk factors [4]. Surgical resection is considered the only potentially curative treatment for this condition. Unfortunately, only 20% to 30% of patients are eligible for surgery because symptoms often do not appear in the early stages of the disease. Consequently, most patients are diagnosed at an advanced stage, where the 5-year survival rate is usually between 5% and 10% [5]. For patients with unresectable tumors or those with distant metastasis, the primary treatment consists of a combination of cisplatin and gemcitabine chemotherapy. Second-line treatment options include 5-Fluorouracil (5-FU) and oxaliplatin or irinotecan [6,7]. Despite these treatments, the high heterogeneity of iCCA often results in poor outcomes, with an objective response rate of approximately 5% and a median overall survival of just 6.2 months [8].
There is a growing trend toward combining systemic therapy, locoregional therapies, and molecular approaches [9]. Chemo-immunotherapy is becoming the first-line standard of care for unresectable iCCA, supported by the results of phase III TOPAZ-1 and KEYNOTE-966 trials [10,11]. Additionally, the U.S. Food and Drug Administration (FDA) and the European Medicines Agency (EMA) have recently approved personalized therapies targeting alterations in fibroblast growth factor receptor (FGFR) and isocitrate dehydrogenase (IDH). These alterations occur in approximately 15% to 20% of iCCA cases [12,13,14,15]. Unfortunately, the benefits of these therapeutic approaches remain unsatisfactory, either due to their applicability to limited patient cohorts or because the emergence of resistance mechanisms undermines long-term survival.
Recent studies have concentrated on synthesizing new compounds or screening bioactive components from natural products to create innovative treatments for unresectable tumors. In our pursuit of new approaches for treating iCCA, we began investigating the anticancer drugs Trabectedin (Yondelis, ET-743) and Lurbinectedin (Zepzelca) [16,17]. Trabectedin (TRB) is a natural compound derived from the Caribbean sea squirt, Ecteinascidia turbinata. It belongs to the marine-based tetrahydroisoquinoline family of antitumor agents and is now produced entirely through synthetic methods. This drug acts as a powerful alkylator by interacting with the minor groove of DNA, leading to cytotoxic effects and impacting DNA repair pathways [18]. Lurbinectedin (LUR) is a synthetic alkaloid analogue of TRB. It has a more favorable toxicity profile and improved pharmacokinetics compared to TRB [19]. At the molecular level, both drugs bind to the minor groove of DNA. This binding stops transcription and causes a delayed transition through the S phase of the cell cycle. Eventually, this leads to cell cycle arrest in the G2-M phase and cell death through apoptosis [20,21]. This specific activity in the G2 phase is unique, especially compared to other alkylating agents that usually act during the S phase. Furthermore, LUR specifically targets GC-rich sequences within the promoters of certain genes, leading to the degradation of elongating RNA polymerase II through the ubiquitin-proteasome machinery. As a result, single-strand and double-strand DNA breaks arise, contributing to cell death [21,22,23]. Recent studies have shown that these compounds form adducts by binding to guanine in the minor groove of DNA, resulting in a bend toward the major groove [24]. The generated adducts help displace oncogenic transcription factors from their target promoters, negatively affecting oncogenic pathways [25,26].
TRB is used as a second-line treatment in the clinical setting for advanced soft tissue sarcoma, particularly liposarcoma and leiomyosarcoma, as well as for relapsed platinum-sensitive ovarian cancer when combined with pegylated liposomal doxorubicin [27,28,29,30]. LUR is indicated for the treatment of adults with metastatic small cell lung cancer (SCLC) who experience disease progression on or after platinum-based chemotherapy. Clinical trials have shown a response rate of 37% to 67%, with myelosuppression being the main side effect. In addition to myelosuppression, both drugs share common primary toxicities, including a transient increase in hepatic transaminases, nausea, vomiting, and fatigue [17,31]. Furthermore, both TRB and LUR are primarily metabolized by Cytochrome P450 3A4 (CYP3A4), meaning that inducers or inhibitors of this enzyme could impact their clearance rates [32].
Notably, both TRB and LUR not only affect cancer cells but also have a significant impact on the tumor microenvironment (TME). This includes immune cells such as monocytes, macrophages, and tumor-associated macrophages (TAMs), as well as the blood vessels within the tumor. These compounds work by blocking various inflammatory mediators, reducing monocyte adhesion, and influencing the expression of genes involved in the organization of the actin cytoskeleton. Additionally, they hinder the production of angiogenic factors that are essential for tumor growth and progression [33]. This ability to modulate the immune response could be beneficial when combined with other immunostimulatory approaches, such as checkpoint blockade immunotherapies [34]. Due to their effectiveness in targeting both cancer cells and the TME, multiple clinical trials have been conducted to evaluate the efficacy and safety of these drugs, either alone or in combination with other treatments. These trials involve various solid malignancies (NCT02454972, NCT05126433, NCT02210364, NCT00147212, NCT00050427).
In this study, we conducted a comprehensive investigation into the effectiveness and mechanisms of action of TRB and LUR in various in vitro models of iCCA. Our findings indicate that these two drugs show promise as therapeutic candidates for treating this aggressive type of cancer.
Materials and Methods
Cell Lines and Reagents
The HUCCT1, KKU156, KKU213, CCLP1, KKU055, and SG231 human iCCA cell lines, purchased from the Japanese Collection of Research Bioresources (JCRB; Ibaraki, Osaka, Japan) or the American Type Culture Collection (ATCC; Manassas, VA, USA), were used for the experiments. CCLP-1, KKU055, KKU156, KKU213, and SG231 cells were grown in Dulbecco’s modified Eagle medium (Gibco, Grand Island, NY, USA), whereas HuCCT1 cells were grown in RPMI 1640 medium (Gibco). All media were supplemented with 5% fetal bovine serum (Gibco), 100 mg/mL streptomycin, and 100 U/mL penicillin, 10 mM HEPES, 2 mM L-glutamine, and 1 mM sodium pyruvate (Anprotec, Milpitas, CA, USA). Cells were cultured at 37°C in a 5% CO2 humidified atmosphere, and mycoplasma-free status for all cell lines was recurrently tested using the PCR Mycoplasma Test Kit I (PK-CA91-1096, PromoCell, Heidelberg, Germany). Cell line authentication was performed by Cell Lines Service (Eppelheim, Germany). The drugs Trabectedin (HY-50936, MedChemExpress, Junction, NJ, USA) and Lurbinectedin (HY-16293, MedChemExpress) were used in the experiments. Stock solutions (1 and 10 mM) were prepared in dimethylsulfoxide (DMSO), and aliquots were stored at −20 °C.
Viability, Proliferation, Apoptosis, and DNA Damage Assays
iCCA cells were seeded in 96-well plates at a density of 1.0 × 10⁴ cells per well and exposed to various concentrations of TRB and LUR for 48 h. Cells treated with the solvent (DMSO) and wells containing only culture medium were used as negative and background controls, respectively. Concerning the MTT assay, following treatment, 10 μL of 5 mg/mL methyl-thiazolyl-diphenyltetrazolium bromide (MTT) solution was added per 96 well and incubated at 37◦C and under 5% CO2 for 2 h. The medium was completely removed, and 100 μL of 100% (v/v) DMSO was added per well to dissolve the formazan crystals, and the absorbances were measured at 570 and 630 nm using the FLUORstar Omega multiplate reader and MARS data analysis software (BMG Labtech, Ortenberg, Germany). The average absorbance of the DMSO-treated cells was established as 100% cell viability. IC50 values and standard deviations were calculated using the GraphPad Prism software (GraphPad Software Inc., San Diego, CA, USA). Cell proliferation was assessed at the 48-h time point using the BrdU Cell Proliferation Assay Kit (Cell Signaling Technology, Danvers, MA, USA). Briefly, cells were incubated with 1x bromodeoxyuridine (BrdU) for 2 h and fixed for 30 min at room temperature. Subsequently, the fixing solution was discarded, and cells were incubated with the anti-BrdU mouse antibody (# 5292; Cell Signaling Technology) for 1 h at room temperature. After washing, cells were stained with the HRP-conjugated anti-mouse secondary antibody for 30 min at room temperature. After incubation with the TMB substrate solution for an additional 30 min at room temperature, the stop solution was added, and the absorbance was measured at 450 nm. Apoptosis was determined in the iCCA cell lines using the Cell Death Detection ELISA Plus Kit (Roche Molecular Biochemicals, Indianapolis, IN, USA), following the manufacturer’s protocol. To assess the extent of DNA damage, the DNA damage Assay Kit (Abcam, Cambridge, United Kingdom) was applied following the manufacturer’s instructions. Cell line experiments were repeated at least three times in triplicate.
Flow Cytometry Assay
Flow cytometry analysis was performed after treating iCCA cells with TRB or LUR. Briefly, cells were seeded in 6-well plates at a density of 2.5 × 10⁵ cells per well, and then cultured in the presence of TRB or LUR at 1 nM concentration. After 24 hours, cells and media were recovered, pelleted, and washed with PBS before staining with live/dead cell marker 7-aminoactinomicyn-D (7AAD, BD Biosciences, San Jose, CA, USA) and further resuspension in 1x Annexin V binding buffer containing Annexin V (Annexin V-PE Apoptosis Detection Kit; BD Biosciences). For cell cycle analysis, cells were recovered, washed with PBS, and the pellet solubilized in 70% ethanol and stored at -20 °C overnight. The samples were then stained with 7AAD and incubated for 15 min at room temperature before acquisition. iCCA cells were analyzed using a flow cytometer FACS CANTO II (BD Biosciences) and approximately 30,000 events for each sample were acquired, and data were analyzed using the Diva 6.2 software (BD Biosciences) and the ModFIT LT 6.0 software (Verity Software House). Data from three independent experiments were then plotted using GraphPad Prism 8.4 software, and values are presented as mean ± standard deviation (SD) of the percentage.
Spheroid Generation and Assessment of Cell Viability
To establish three-dimensional (3D) cultures enriched in cholangiocarcinoma stem-like cells, cells were cultured for seven days under non-adherent conditions in poly-2-hydroxyethyl methacrylate (poly-HEMA)-coated dishes (Sigma Aldrich, St. Louis, USA) using serum-free DMEM/F12 medium. The medium was supplemented with 1x B27 supplement (without vitamin A) (Life Technologies, Carlsbad, USA), 20 ng/mL epidermal growth factor (EGF), and 20 ng/mL basic fibroblast growth factor (bFGF) (R&D Systems, Minneapolis, USA), as previously described [35,36]. 3D cultures were dissociated and seeded in 96-well plates for 24 hours before treatment with TRB and LUR, at varying concentrations, as detailed in the results section, for an additional 48 hours. Images were captured in bright field at 10× magnification. Then, we proceeded to remove the medium, and cells were stained with a 0.5% Crystal Violet solution in 20% methanol for 10 minutes. After staining, the cells were washed with phosphate-buffered saline (PBS) and solubilized using 100 μl/well of dimethyl sulfoxide (DMSO). The absorbance at 595 nm was measured using a HiPo Biosan microplate reader (Bio Class, Pistoia, IT).
Ethical Approval for Human Tissue Specimens
The use of human tissue specimens to generate organoids and isolate cancer-associated fibroblasts was approved by the Local Ethical Committee of the Istituto Tumori “Giovanni Paolo II” (Bari, Italy; protocol number: 145) and the Regional Ethics Committee for Clinical Trials of Tuscany, Area Vasta Centro Section (Florence, Italy; Authorization number: CEAVC 23673). The study was conducted in accordance with the guidelines of the Declaration of Helsinki. All patients involved provided informed consent.
Patient-Derived Organoids (PDOs)
PDO cultures were generated following established protocols. Briefly, iCCA tumor specimens (~1 cm³) were obtained from surgical resections at the Careggi University Hospital (Florence, Italy) and the Istituto Tumori “Giovanni Paolo II” (Bari, Italy). Samples were transported on ice and processed within 20 minutes of collection. Tumor tissues were finely minced and incubated with a digestion solution at 37°C for 2 to 5 hours (or overnight) depending on the extent of liver fibrosis. Following digestion, cell clusters were embedded in Matrigel® Growth Factor Reduced (GFR) (Corning, Glendale, USA). After polymerization of the Matrigel, a specific isolation medium was added and maintained until the first passage. Tumor organoids were visually assessed for growth after 2 to 3 weeks. The isolation medium was then replaced with an expansion medium for long-term culture [37]. Cell viability in PDOs was assessed using the MTT assay. Briefly, 1.0 × 10⁴ cells per well were seeded in 96-well plates within 7 μl Matrigel® droplets, incubated for seven days, and treated for 72 hours with TRB and LUR. MTT solution was added at a final concentration of 500 μg/ml, and cells were incubated for 2 to 3 hours at 37°C. After removing the medium, 20 μl of 2% SDS solution in water was added to solubilize the Matrigel. After 2 hours at 37°C, 100 μl of DMSO was added to dissolve the reduced MTT. Absorbance was measured at 568 nm using a HiPo Biosan microplate reader. Untreated organoids were considered 100% viable [38,39].
Isolation and Treatment of Human Cancer-Associated Fibroblasts (hCAFs)
hCAFs were isolated from iCCA tissues as previously reported [40]. Enzymatic and mechanical digestion of iCCA tissue fragments was carried out in HBSS solution with 50-200 U/mL collagenase type IV (Thermo Fisher Scientific, Waltham, MA, USA), 3 mM CaCl2 and 1x Antibiotic-Antimycotic (Thermo Fisher Scientific) at 37 °C in gentle rotation for 2 h or more as required. The obtained cell population was collected and washed three times with HBSS by centrifugation. Subsequently, the cell suspension was divided into two parts, one part to obtain organoids and the second for CAFs. As for the culture of hCAFs, after tissue digestion and cell pellet washing were completed, the recovered cell suspension was cultured in IMDM (Iscove’s Modified Dulbecco’s Medium) complete with 20% fetal bovine serum (FBS, Thermo Fisher Scientific) and Antibiotic-Antimycotic. Cultures of iCCA hCAFs were treated with vehicle and increasing concentrations of Trabectedin and Lurbinectedin. The viability of iCCA hCAF was determined with the CyQUANT™ XTT Cell Viability kit (Thermo Fisher Scientific) at three experimental time points (24, 48, 72h). Data are expressed as mean ± SD of three independent experiments.
RNA Extraction and Quantitative Real-Time Reverse Transcriptase-Polymerase Chain Reaction (qRT-PCR)
Total mRNA from iCCA cell lines was extracted using the Quick RNA Miniprep kit (Zymo Research, Irvine, CA, USA). Subsequently, mRNA expression of the genes of interest was assessed by quantitative real-time polymerase chain reaction (qRT-PCR) using the validated Gene Expression Assays for human YAP1 (Hs00902712_g1), c-Myc (Hs00153408_m1), E2F1 (Hs00153451_m1), BRD4 (Hs04188087_m1), CDK7 (Hs00361486_m1), TEAD4 (Hs01125032_m1), CTGF (Hs01026927_g1), CYR61 (Hs00155479_m1), TFAM (Hs00273372_s1), NRF1 (Hs00602161_m1), LDHA (Hs01378790_g1), and PGAM1 (Hs01652468_g1) genes (Thermo Fisher Scientific). PCR reactions were conducted using 100 ng of cDNA of the collected samples, with an ABI Prism 7000 Sequence Detection System with TaqMan Universal PCR Master Mix (Applied Biosystems). Cycling conditions were as follows: denaturation at 95 °C for 10 min, 40 cycles at 95 °C for 15 s, and then extension at 60 °C for 1 min. Quantitative values were calculated using the PE Biosystems Analysis software and expressed as N target (NT). NT = 2−ΔCt, where each sample’s ΔCt value was calculated by subtracting the average Ct value of the target gene from the average Ct value of the β-Actin gene (4333762T; Thermo Fisher Scientific).
Protein Extraction and Western Blot Analysis
Cells were homogenized in M-PER Mammalian Protein Extraction Reagent (Thermo Fisher Scientific) containing the Complete Protease Inhibitor Cocktail (Roche Molecular Biochemicals, Indianapolis, IN, USA). Protein concentrations were determined with the Bio-Rad Protein Assay Kit (Bio-Rad, Hercules, CA, USA) using bovine serum albumin as standard. For Western blot analysis, aliquots of 40 μg were denatured by boiling in Tris-MOPS-SDS Running Buffer, separated by SurePAGE (Genscript, Piscataway, NJ, USA), and transferred onto nitrocellulose membranes (Bio-Rad) by electroblotting in Towbin buffer (25 mM Tris, 195 mM glycine, and 20% methanol). Membranes were blocked in Pierce Protein-free Tween 20 Blocking Buffer (Thermo Fisher Scientific) for 1 h and probed with the following specific antibodies from Cell Signaling Technology: anti-phospho-4EBP1Thr37/46(# 2855), phospho-RPS6Ser235/236(# 4858), AKT (# 4691), phospho-AKTSer473(# 4060), ERK1/2 (# 4695), phospho-ERK1/2Thr202/Tyr204(# 4370), YAP/TAZ (# 93622), H2A.X (# 7631), phospho-H2A.XSer139(# 9718), phospho-KAP-1Ser824(# 90893), cleaved Caspase 3 (# 9661), cleaved PARP (# 5625), and β-Actin (# 4970). Each primary antibody was followed by incubation for 30 min with horseradish peroxidase secondary antibody (Jackson ImmunoResearch Laboratories, Inc., West Grove, PA, USA), diluted 1:5000. Equal protein loading was assessed with reversible Ponceau S staining (Thermo Fisher Scientific) and anti-β-Actin antibody. Proteins were revealed with the Clarity Western ECL Substrate (Bio-Rad).
Seahorse Mitochondrial Respiration and Glycolysis Analyses
Seahorse assays on adherent cell lines were performed according to the manufacturer’s instructions. KKU055 and HuCCT1 (1.0 × 10⁴) cells per well were seeded into a Seahorse XFp Cell Culture 8 well Miniplate and cultured overnight at 37 °C and 5 % CO2 for 24 h in standard culture medium. Two wells with medium only served as background correction. Experiments were conducted using three technical replicates per group. The next day, cells were treated with TRB (5 nM) and LUR (0.7 nM) or matched DMSO concentration in triplicates and incubated for 24 h at 37°C and 5% CO2. One Seahorse XFp sensor cartridge per cell culture plate was hydrated with Seahorse XF Calibrant overnight at 37°C in a CO2-free incubator. On the day of assay, the cells were washed and equilibrated with assay medium (Seahorse XF DMEM Medium pH 7.4, 10 mM glucose, 1 mM sodium pyruvate, and 2 mM L-glutamine) for 1 h at 37°C in a CO2-free incubator and transferred to the Seahorse XF HS Mini Analyzer (Agilent Technologies, Waldbronn, Germany). Injection ports were loaded either with i) 1.5 μM oligomycin (1.5 µM final), FCCP (KKU055, 1 µM final; HuCCT1, 2 µM final) and rotenone/antimycin A (Rot/AA, 0.5 µM final) for the Mitochondria Stress Test or with ii) Rot/AA (0.5 µM final) and 2-deoxy-D-glucose (2-DG; 50 mM final; Sigma-Aldrich) for the Glycolytic Rate Assay. Lastly, Hoechst 33342 (2 µg/µl final; Thermo Fisher Scientific) nuclei staining was injected per well and incubated for 10 min before fluorometric measurement (excitation, 355-20 nm; emission, 460 nm) using the FluoroStar Omega plate reader (BMG Labtech, Ortenberg, Germany). Data were analyzed using the WAVE Pro 10.1.0.1 software (Agilent Technologies). The values were background corrected, normalized to the mean fluorescence intensity (MFI) per well, and a normalization scale factor of 10,000 was applied. Data from three replicates of two independent experiments were used to perform statistical analysis using the GraphPad Prism software.
Transmission Electron Microscopy Analysis
KKU055 cells were resuspended in Cytoblock Reagent (Epredia, Dreieich, Germany) and then surrounded by 4 % low-melting agarose. For the embedding process (post-fixation with osmium tetroxide, dehydration, infiltration with EPON) the LYNX microscopy tissue processor (Reichert-Jung, Wetzlar, Germany) was used. Semi-thin-sections (0.75µm), for the selection of relevant areas and ultra-thin sections (80nm) were cut by using the Reichert Ultracut S Microtome (Leica-Reichert, Wetzlar, Germany). First, the grids were contrasted with aqueous 2%-uranyl-acetate, followed by 2%-lead-citrate solution for 10 minutes, each. Electron-microscopic analysis was performed using the LEO 912AB transmission electron microscope (Zeiss, Oberkochen, Germany).
Chicken Chorioallantoic Membrane (CAM) Assay and Immunohistochemical Staining
Fertilized, specific pathogen-free (SPF) chicken eggs (VALO Biomedia, Osterholz-Scharmbeck, Germany) were kept at 37°C and 80% constant humidity. On day 8, a window of 1.5–2.0 cm diameter was cut in the shell at the more rounded pole of the egg and sealed with tape (Durapore silk tape, 3M). The next day, 2.0× 10⁶ human tumor cells per pellet were embedded in growth factor-reduced Matrigel (Corning, Wiesbaden, Germany) serving as matrix and were transplanted onto the CAM. The window was sealed again, and the eggs were incubated for 5 days. Tumor growth was monitored over time using a light microscope (×10, SU 1071 Traveler). Tumors were sampled with the surrounding CAM on day 5, fixed in 4% formaldehyde, paraffin-embedded, and cut into 3–5 μm sections for immunohistochemical studies. Antigen retrieval was achieved in 10 mM sodium citrate buffer (pH 6.0) by placing in a microwave on high for 10 min, followed by a 20 min cool down at room temperature. After a blocking step with the 5% goat serum and Avidin-Biotin blocking kit (Vector Laboratories, Burlingame, CA, USA), the slides were incubated with primary antibodies overnight at 4°C. The anti-MTC02 (# MA5-12017; 1:500; Thermo Fisher Scientific) and the anti-Ki-67 antibodies (# IHC-00375; 1:1000; Thermo Fisher Scientific) were applied. Subsequently, slides were subjected to 3% hydrogen peroxide for 10 min to quench endogenous peroxidase activity. Next, the biotin-conjugated secondary antibody was applied at a 1:500 dilution for 30 min at room temperature, and the reaction was revealed with the Vectastain® ABC-Elite Peroxidase Kit (# PK-6100; Vector Laboratories), using the ImmPACT NovaRed Substrate Peroxidase (# SK-4805; Vector Laboratories) as the chromogen. Slides were counterstained with Mayer’s hematoxylin.
Statistical Analysis
GraphPad Prism version 10.2.1 software and IBM SPSS version 26 software (IBM Corp., Armonk, NY, USA) evaluated statistical significance. For IC50 calculation, data were transformed to log2, normalized, and non-linear regression (log)inhibitor vs. response–variable slope (four parameters) was performed. Tukey’s multiple comparison test was applied for multiple comparisons. Two-tailed values of * p < 0.5, ** p < 0.1, *** p < 0.01, and **** p < 0.001 were considered significant. Lowercase letters denoted statistical significance, as stated in the associated figure legends. All data are expressed as the mean ± SD.
Results
Trabectedin and Lurbinectedin Restrain Cell Growth and Trigger DNA Damage in iCCA Cell Lines
To determine the cytotoxic potential of TRB and LUR in iCCA, the two DNA minor groove binders were administered to six human iCCA cell lines (HUCCT1, CCLP1, KKU213, KKU156, KKU055, and SG231). The cell lines were treated with concentrations between 0 and 100 nM of TRB and LUR, and colorimetric MTT assays were performed 48 h after drug administration. Both drugs profoundly reduced tumor cell viability in the six cell lines tested in a dose-dependent manner (Figure 1A and B). Notably, a significant anti-growth effect of the two compounds was observed at low nanomolar concentrations in all tested cell lines, with LUR demonstrating the lowest IC50 values across all lines.
To further elucidate the mechanisms of action of the two drugs in iCCA cells, the six cell lines were subjected to proliferation and apoptosis assays. As concerns cell proliferation, incubation with TRB and LUR at increasing concentrations (1 and 5 nM) significantly reduced BrdU incorporation in the six cell lines, often with a more pronounced constraining effect induced by LUR, in a dose-dependent manner (Figure 2A-F). Regarding apoptosis, TRB and LUR induced robust apoptotic cell death in the six cell lines, with a slightly higher cell death in most LUR-treated cells (Supplementary Figure 1A-F). Similarly, TRB and LUR were effective in reducing the growth of tumour spheres (SPH) generated from HUCCT1 and KKU213 cell lines in a dose-dependent manner. In particular, HUCCT1 and KKU213 spheroids showed a dramatic reduction of viability already with the lowest concentration of LUR used, whereas increasing doses of TRB induced a dose-response curve in terms of cell viability in both iCCA cell spheroids (Figure 3A,B, Supplementary Figure 2A-D). Equivalent results were obtained in SPH from CCLP1 and SG231 cells (not shown). As we previously demonstrated, SPH exhibit a significant increase in stemness-related features compared to monolayer cultures of the parental cells [35,36].
To further substantiate our findings, HUCCT1, KKU156, and KKU213 cell lines were treated with TRB and LUR at 1 nM concentration, and flow cytometry analysis was performed 24 h after starting drug exposure. First, we examined the apoptosis induced by the two compounds on the three cell lines, which was measured using Annexin V-PE and 7-AAD. Treatment with the two drugs resulted in a substantial increase in cell apoptosis compared to the vehicle (Figure 4A,B, and Supplementary Figure 3A,B, and 4A,B). Next, to further investigate the inhibition of cell proliferation, cell cycle analysis was performed to evaluate the effects of TRB and LUR on cell cycle phase distribution (Figure 4C and Supplementary Figure 3C and 4C) in HUCCT1, KKU156, and KKU213 cell lines. In these cells, treatment with 1 nM TRB and LUR compared to vehicle affected predominantly the S/G2 transition of the cell cycle with an evident accumulation in the S phase. In addition, we evaluated the DNA damage in the three cell lines by assessing the formation of apurinic/apyrimidinic (AP) sites, one of the major types of DNA lesions. We discovered that the administration of 1 nM and 5 nM TRB and LUR resulted in a significantly higher number of AP sites in all cell lines tested, in a dose-dependent manner, with no overt differences between the two drugs (Supplementary Figure 5).
Overall, the data indicate that TRB and LUR effectively inhibit the growth of iCCA cell lines by limiting proliferation, inducing apoptosis, and causing DNA damage.
Signaling Pathways Affected by Trabectedin and Lurbinectedin in Intrahepatic Cholangiocarcinoma Cell Lines
Next, we aimed to identify the oncogenic cascades modulated by Trabectedin and Lurbinectedin in iCCA cells. Therefore, protein and mRNA extracted from HUCCT1, SG231, CCLP1, and KKU055 cell lines treated with DMSO, TRB 1 nM, and LUR 1 nM were subjected to Western blot (Figure 5A-C) and quantitative real-time RT-PCR (Supplementary Figures 6 and 7) analyses. Western blotting revealed that TRB and LUR triggered the downregulation of the mammalian target of rapamycin complex 1 (mTORC1) pathway, as assessed by the decrease of its surrogate markers activated/phosphorylated (p)RPS6, and inactivated/phosphorylated (p)4EBP1, whereas the mammalian target of rapamycin complex 2 (mTORC2; as defined by the levels of activated/phosphorylated AKT) was not consistently reduced. In addition, the Hippo effector YAP was downregulated in the cell lines treated with TRB and LUR, whereas the two drugs did not affect the levels of the YAP paralog TAZ. In line with the downregulation of YAP protein, the levels of YAP1 and its specific target genes, CTGF and CYR61, significantly decreased following treatment with TRB and LUR in both the KKU055 and HUCCT1 cell lines. No significant differences were observed between the effects of the two drugs on the levels of these genes (Supplementary Figure 6). In contrast, the two drugs did not influence the ERK/MAPK pathway (Figure 5A). As expected, the DNA damage markers, including total and activated/phosphorylated histone H2A.X, as well as activated/phosphorylated KAP-1, were commonly induced in the four cell lines following TRB and LUR administration, in keeping with the drugs’ role as damaging agents. In addition, the drug treatment remarkably increased the levels of apoptosis markers, cleaved caspase 3 and cleaved PARP, in comparison to the low or absent levels of these proteins in DMSO-treated cells (Figure 5B). LUR has been shown to inhibit the expression of oncogenic transcription factors in melanoma cells [41]. Therefore, we investigated the effects of TRB and LUR on the mRNA levels of c-Myc, E2F1, TEAD4, BRD4, and CDK7 transcription factors, which are either critical in cholangiocarcinogenesis or were downregulated in the referenced study, in KKU055 and HUCCT1 cells. Both drugs decreased the overall levels of these transcription factors, with LUR treatment inducing the most pronounced downregulation in c-Myc, E2F1, BRD4, and CDK7 genes (Supplementary Figure 7).
Altogether, the present data indicate that TRB and LUR affect various pathways and oncogenic transcription factors in iCCA cells.
Trabectedin and Lurbinectedin Decrease Mitochondrial Respiration and Glycolysis in iCCA Cells
To evaluate whether TRB and LUR affect iCCA metabolism, we assessed their influence on mitochondrial respiration and glycolysis of KKU055 and HUCCT1 cells. To determine the mitochondrial respiratory capacity, the oxygen consumption rate was quantified (Figure 6). In KKU055 cells, LUR significantly reduced the cell line’s mitochondrial respiration parameters (basal and maximal respiration, spare respiratory capacity, ATP production, and proton leak (Figure 6C,D). No effects by TRB on mitochondrial respiration were observed at 1 nM concentration (not shown). A similar trend to that observed for LUR was detected when Trabectedin was administered at 5 nM concentration, although the data did not reach statistical significance (Figure 6A,B). Similar results were obtained in HUCCT1 cells (not shown).
As concerns glycolysis, both drugs affected this metabolic pathway in KKU055 cells (Figure 7). Once again, LUR administration significantly decreased most parameters (basal and compensatory glycolysis, and basal proton efflux rate) (Figure 7C,D), whereas TRB reached statistical significance only in terms of compensatory glycolysis at 5 nM concentration (Figure 7A,B). Similar data were obtained in HUCCT1 cells (not shown).
To investigate further the molecular mechanisms by which TRB and LUR influence mitochondrial respiration and glycolysis, we evaluated the expression levels of key regulators involved in these metabolic processes in KKU055 and HUCCT1 cells. We focused on some regulators that are governed by the transcription factors E2F1 and c-Myc, which we found to be downregulated by TRB and LUR. Our results indicated that TFAM and NRF1 (involved in mitochondrial biogenesis), as well as LDHA and PGAM1 (involved in glycolysis), were all downregulated in both KKU055 and HUCCT1 cell lines, particularly in the cells treated with LUR (Supplementary Figure 8).
Overall, the data suggest that LUR and, to a lesser extent, TRB reduce mitochondrial respiration and glycolysis of iCCA cells.
Effects of Trabectedin and Lurbinectedin on the Subcellular Structure of Intrahepatic Cholangiocarcinoma Cells
Next, the ultrastructural morphology of iCCA cells from KKU055 treated with TRB and LUR was analyzed using transmission electron microscopy. Various parameters were examined to assess changes in cell morphology, including cell size and shape, the status of the nucleus (heterochromatin and euchromatin), and the state of the mitochondria (size, shape, matrix density, and cristae structure). After treatment with the drugs, several notable changes were observed. Membrane blebbing and the presence of apoptotic bodies indicated the onset of apoptosis. Additionally, many cells appeared rounded, making it challenging to distinguish between heterochromatin and euchromatin. Also, the mitochondria exhibited significant alterations, such as a less electron-dense matrix and irregularities in the cristae structure. Some mitochondria showed a rounded shape and pronounced swelling. Furthermore, vacuole formation was observed, along with partial rupture of the cell membrane. These findings were consistent following exposure to either TRB or LUR (Figure 8).
Trabectedin and Lurbinectedin Hamper Intrahepatic Cholangiocarcinoma Organoid Growth
Organoids are three-dimensional miniature structures derived from stem cells that recapitulate the cellular heterogeneity, structure, and functions of human organs, often serving as a drug testing model [38,39]. A total of six organoids derived from intrahepatic cholangiocarcinoma (iCCA) tumor specimens, referred to as PDO1, PDO2, PDO3, PDO4, PDO22, and PDO28 were obtained from tumor resections performed at the Careggi University Hospital (Florence, Italy), and the Istituto Tumori “Giovanni Paolo II” (Bari, Italy). After treating these organoids with TRB and LUR for 72-120 hours, we observed a significant decrease in organoid survival and notable morphological changes as the drug concentrations increased (Figure 9). Overall, at the same drug concentration, the anti-growth effect induced by LUR was more pronounced than that of TRB across the organoids tested.
Trabectedin and Lurbinectedin Hinder Cancer-Associated Fibroblast Growth In Vitro
Accumulating evidence from other tumor types suggests that TRB and LUR play a role in regulating the tumor microenvironment [22,23,33,34,42]. Therefore, we investigated the effects of these two compounds on the growth of human primary cultures of cancer-associated fibroblasts (hCAFs) isolated from patients with iCCA (Figure 10). Specifically, we conducted drug treatments at increasing concentrations and assessed cell viability at three different time points: 24, 48, and 72 hours. Notably, we observed a dose- and time-dependent decrease in hCAF viability for both drug treatments, with the lowest cell viability recorded following treatment with LUR (Figure 10). Thus, TRB and LUR may also exhibit anti-oncogenic properties by suppressing the growth of hCAFs.
Lurbinectedin Reduces iCCA Growth In Vivo
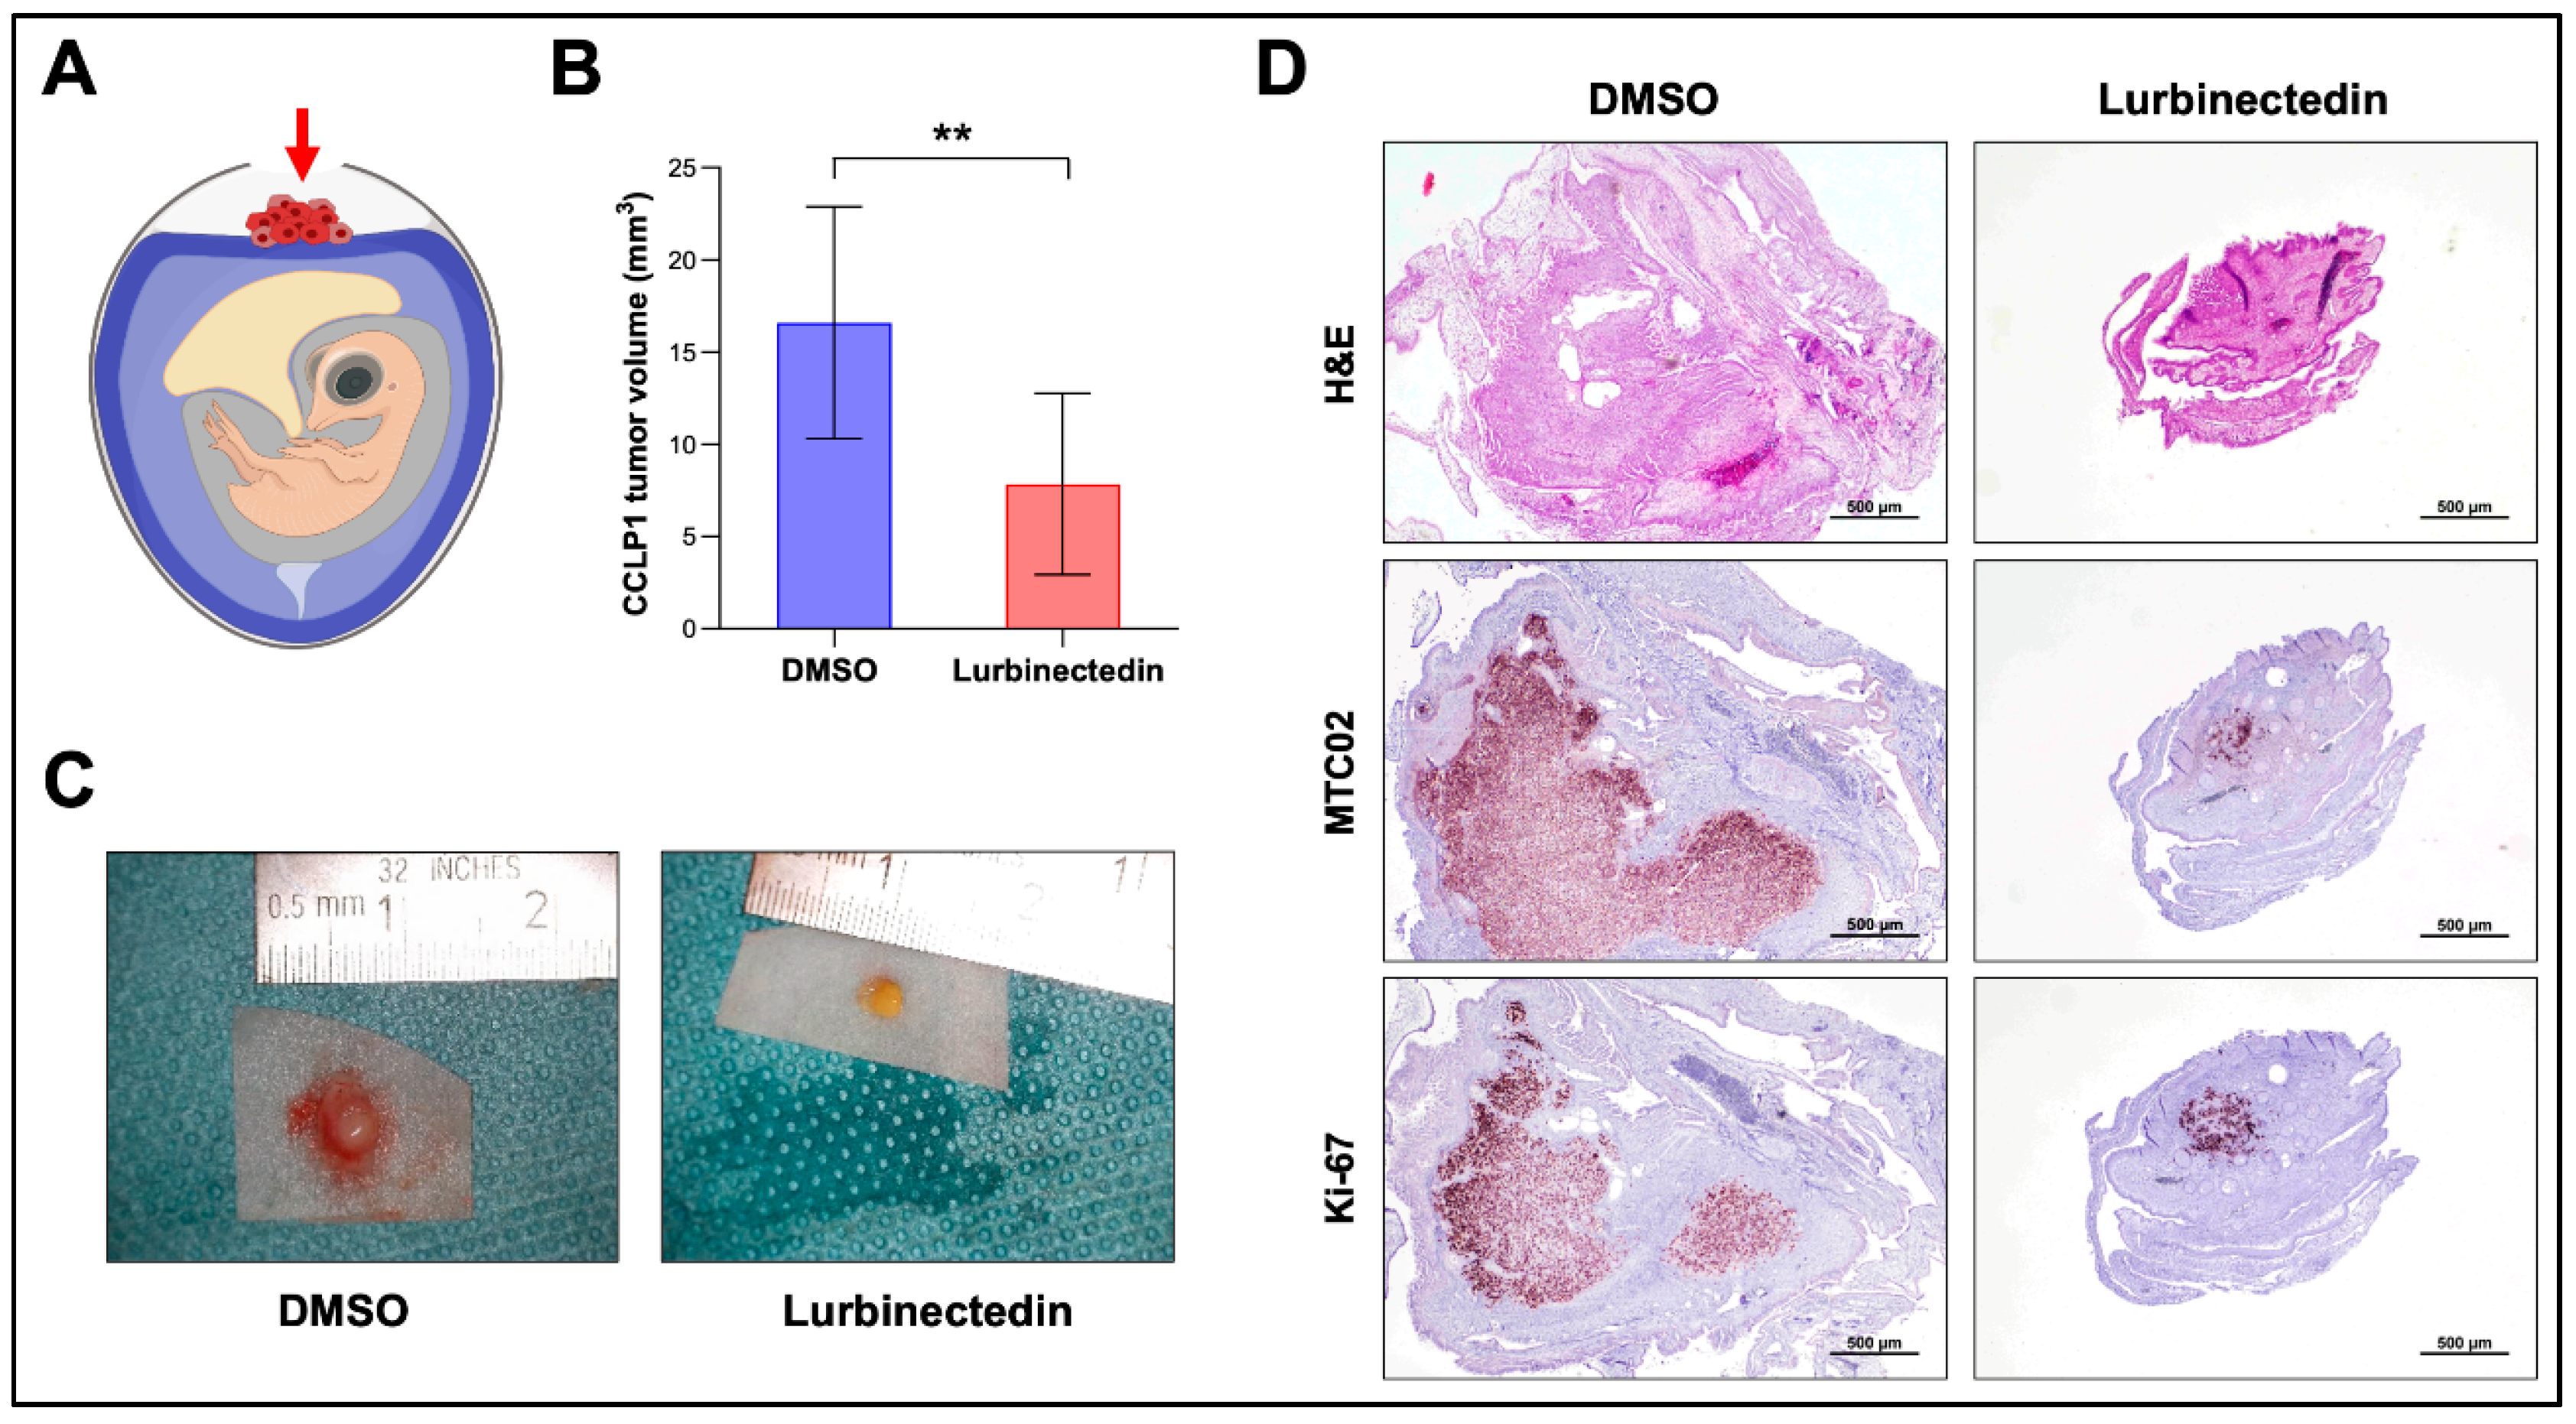
Finally, we assessed the impact of LUR on the growth of intrahepatic cholangiocarcinoma (iCCA) in vivo using the chick chorioallantoic membrane (CAM) assay (Figure 11). For this experiment, we selected CCLP1 cells, as they proliferate well in the CAM environment. These cells were transplanted onto the CAM, treated with LUR at a concentration of 40 nM, and cultured in ovo for 5 days (Figure 11A). In line with the in vitro data, tumors that developed from LUR-treated cell samples (n=14) were significantly smaller than those treated with DMSO (n=11), measuring 16.6±6.7 mm³ vs. 7.9±4.2 mm³, respectively (P < 0.001) (Figure 11B,C). The smaller tumor size in specimens treated with LUR was confirmed through immunohistochemistry using the anti-MTC02 antibody, which recognizes an antigen specifically associated with mitochondria in human cells (Figure 11D) [42].
Discussion
Intrahepatic cholangiocarcinoma (iCCA) is a highly malignant tumor of the biliary tree. It is marked by a rising incidence and is often diagnosed late due to the absence of specific symptoms. iCCA is known for its clinical aggressiveness, resistance to treatment, and high mortality rate. As a result, it represents a significant health concern worldwide, and considerable efforts should be directed toward developing innovative and effective therapies for this devastating tumor type [1,2,3,4,5].
In this study, we investigated the effects of Trabectedin (TRB) and Lurbinectedin (LUR) on the growth of iCCA cells. Both TRB and LUR are promising antineoplastic agents known for their favorable toxicity profiles and unique mechanisms of action. These drugs create adducts in the minor groove of DNA, leading to single-strand and double-strand breaks. This process initiates a cascade of events that ultimately results in cell cycle arrest and apoptosis [16,17,18]. Moreover, TRB and LUR mediate the displacement of oncogenic transcription factors from their target promoters, thereby affecting oncogenic signalling addiction [25,26,41]. In clinical settings, TRB is used as a second-line treatment for liposarcoma, leiomyosarcoma, and relapsed platinum-sensitive ovarian cancer, while LUR is administered for metastatic small-cell lung cancer, whereas LUR is administered against metastatic small-cell lung cancer [27,28,29,30].
Regarding iCCA, only one study has examined the effects of TRB, which was found to inhibit genes and microRNAs related to several cellular processes, including protein modification, migration, motility, and apoptosis, in a patient-derived xenograft and associated cell line [44]. Additionally, there have been no prior investigations into LUR in this type of tumor. Here, we conducted a thorough investigation into the anti-growth effects of TRB and LUR, using both in vitro and in vivo models of biliary tract cancer. Our findings reveal that administering TRB and LUR significantly inhibits the growth of human iCCA cell lines, spheroids, patient-derived organoids, and cancer-associated fibroblasts, as well as in the chicken chorioallantoic membrane (CAM) model. Notably, we observed that the restraint of tumor cell growth and the inhibition of human cancer-associated fibroblasts (hCAFs) occurred at low nanomolar concentrations of both drugs, highlighting their effectiveness in the tested models. These results indicate that TRB and LUR effectively target both cancer cells and the tumor microenvironment (TME) in iCCA. Supporting this observation, previous studies have shown that TRB and LUR possess the unique ability to simultaneously kill cancer cells while affecting several aspects of the TME across various cancer types. The drugs achieve this objective by inducing selective apoptosis of monocytes and macrophages and by inhibiting the transcription of multiple inflammatory mediators, which ultimately helps alleviate the immunosuppressive environment [33,42]. Further studies are needed to address the effects of TRB and LUR on the immune milieu of biliary tract tumors. Our investigation also included tumor organoids derived from several patients with iCCA. We found that LUR achieved significant growth inhibition at a lower dosage compared to TRB in these models, highlighting the potential of both drugs against this aggressive disease. At the molecular level, the observed reduction in iCCA cell proliferation, the induction of DNA damage, and the increased apoptosis were associated with the downregulation of the mTORC1 and YAP pathways, which are crucial in cholangiocarcinogenesis [44]. Additionally, both drugs, particularly LUR, significantly lowered the expression of proto-oncogenes such as YAP1, TEAD4, E2F1, c-Myc, BRD4, and CDK7 in iCCA cells, aligning with their inhibitory effects on oncogenic transcription factors [44].
In the context of cellular metabolism, treatment with LUR resulted in a significant decrease in mitochondrial respiration and glycolysis in iCCA cell lines. This pattern was also observed with TRB, although to a lesser extent. Ongoing studies in our laboratory aim to identify the specific targets of TRB and LUR in iCCA growth and metabolism.
While these promising findings open new paths for improved treatments for iCCA patients, future research should focus on confirming the in vivo effectiveness of TRB and LUR against this malignancy before proceeding to clinical trials. Additionally, since single treatments with either TRB or LUR might be insufficient to halt iCCA progression, it will be critical to evaluate the combination of these drugs with other treatment options.
Supplementary Materials
The following supporting information can be downloaded at website of this paper posted on Preprints.org.
Author Contributions
SMS and DFC designed research and supervised the experimental work; EG, IG, MP, AC, GG, TB, EP, SM and HS performed all experiments; FM, GLG, ME and CR collected and provided human samples, cell lines, organoids and CAFs; EG, IG, MP, AC, GG, EP, SM, DFC and SMS analyzed the data and interpreted the results; EG, GLG, CR, DFC and SMS wrote the manuscript; EG, IG, AC, GLG, ME, CR, MM, DFC and SMS revised the manuscript. GLG and CR received and provided funding. All authors reviewed and approved the manuscript before submission.
Funding
This work was supported by grants from the Italian Association Against Cancer (AIRC) grant number IG 24815 to GLG and IG 23117 to CR. The funders had no role in study design, data collection and analysis, publication decisions, or manuscript preparation.
Institutional Review Board Statement
The use of human tissue specimens to generate organoids and isolate cancer-associated fibroblasts was approved by the Local Ethical Committee of the Istituto Tumori “Giovanni Paolo II” (Bari, Italy; protocol number: 145) and the Regional Ethics Committee for Clinical Trials of Tuscany, Area Vasta Centro Section (Florence, Italy; Authorization number: CEAVC 23673). The study was conducted in accordance with the guidelines of the Declaration of Helsinki.
Informed Consent Statement
All patients involved provided informed consent.
Data Availability Statement
All data generated or analyzed during this study are included in this published article (and its supplementary information files).
Conflicts of Interest
The authors declare that there is no conflict of interest regarding the publication of this article.
Abbreviations
CAF, cancer-associated fibroblast; CAM, chorioallantoic membrane; iCCA, intrahepatic cholangiocarcinoma; LUR, lurbinectedin; PDO, patient-derived organoid; TRB, trabectedin
References
- Kelley, R.K.; Bridgewater, J.; Gores, G.J.; et al. Systemic therapies for intrahepatic cholangiocarcinoma. J Hepatol. 2020, 72, 353–363. [Google Scholar] [CrossRef] [PubMed]
- Banales, J.M.; Marin, J.J.G.; Lamarca, A.; et al. Cholangiocarcinoma 2020: the next horizon in mechanisms and management. Nat Rev Gastroenterol Hepatol. 2020, 17, 557–588. [Google Scholar] [CrossRef] [PubMed]
- Saha, S.K.; Zhu, A.X.; Fuchs, C.S.; et al. Forty-Year Trends in Cholangiocarcinoma Incidence in the U.S.: Intrahepatic Disease on the Rise. Oncologist. 2016, 21. [Google Scholar] [CrossRef] [PubMed]
- Clements, O.; Eliahoo, J.; Kim, J.U.; et al. Risk factors for intrahepatic and extrahepatic cholangiocarcinoma: A systematic review and meta-analysis. J Hepatol. 2019, 72, 95–103. [Google Scholar] [CrossRef] [PubMed]
- Sirica, A.E.; Gores, G.J.; Groopman, J.D.; et al. Intrahepatic Cholangiocarcinoma: Continuing Challenges and Translational Advances. Hepatology. 2019. [CrossRef] [PubMed]
- Ali, I.; Lone, M.N.; Alothman, Z.A.; et al. Insights into the pharmacology of new heterocycles embedded with oxopyrrolidine rings: DNA binding, molecular docking, and anticancer studies. J Mol Liq. 2017, 234. [Google Scholar] [CrossRef]
- Lamarca, A.; Edeline, J.; Goyal, L. How I treat biliary tract cancer. ESMO Open. 2022. [CrossRef] [PubMed]
- Høgdall, D.; Lewinska, M.; Andersen, J.B. Desmoplastic Tumor Microenvironment and Immunotherapy in Cholangiocarcinoma. Trends in Cancer. 2018, 4, 239–255. [Google Scholar] [CrossRef] [PubMed]
- Moris, D.; Palta, M.; Kim, C.; et al. Advances in the treatment of intrahepatic cholangiocarcinoma: An overview of the current and future therapeutic landscape for clinicians. CA Cancer J Clin. 2023, 73. [Google Scholar] [CrossRef] [PubMed]
- Burris, H.A., III; Okusaka, T.; Vogel, A.; et al. Durvalumab plus gemcitabine and cisplatin in advanced biliary tract cancer (TOPAZ-1): patient-reported outcomes from a randomised, double-blind, placebo-controlled, phase 3 trial. Lancet Oncol. 2024, 25, 626–635. [Google Scholar] [CrossRef] [PubMed]
- Kelley, R.K.; Ueno, M.; Yoo, C.; et al. Pembrolizumab in combination with gemcitabine and cisplatin compared with gemcitabine and cisplatin alone for patients with advanced biliary tract cancer (KEYNOTE-966): a randomised, double-blind, placebo-controlled, phase 3 trial. Lancet. 2023, 401. [Google Scholar] [CrossRef] [PubMed]
- Abou-Alfa, G.K.; Sahai, V.; Hollebecque, A.; et al. Pemigatinib for previously treated, locally advanced or metastatic cholangiocarcinoma: a multicentre, open-label, phase 2 study. Lancet Oncol. 2020, 21, 671–684. [Google Scholar] [CrossRef] [PubMed]
- Makawita, S.; K Abou-Alfa, G.; Roychowdhury, S.; et al. Infigratinib in patients with advanced cholangiocarcinoma with FGFR2 gene fusions/translocations: the PROOF 301 trial. Futur Oncol. 2020, 16, 2375–2384. [Google Scholar] [CrossRef] [PubMed]
- Goyal, L.; Meric-Bernstam, F.; Hollebecque, A.; et al. Futibatinib for FGFR2 -Rearranged Intrahepatic Cholangiocarcinoma. N Engl J Med. 2023, 388, 228–239. [Google Scholar] [CrossRef] [PubMed]
- Abou-Alfa, G.K.; Macarulla, T.; Javle, M.M.; et al. Ivosidenib in IDH1-mutant, chemotherapy-refractory cholangiocarcinoma (ClarIDHy): a multicentre, randomised, double-blind, placebo-controlled, phase 3 study. Lancet Oncol. 2020, 21, 796–807. [Google Scholar] [CrossRef] [PubMed]
- Dincalci, M.; Zambelli, A. Trabectedin for the treatment of breast cancer. Expert Opin Investig Drugs. 2016, 25. [Google Scholar] [CrossRef] [PubMed]
- Trigo, J.; Subbiah, V.; Besse, B.; et al. Lurbinectedin as second-line treatment for patients with small-cell lung cancer: a single-arm, open-label, phase 2 basket trial. Lancet Oncol. 2020, 21. [Google Scholar] [CrossRef] [PubMed]
- Erba, E.; Bergamaschi, D.; Bassano, L.; et al. Ecteinascidin-743 (ET-743), a natural marine compound, with a unique mechanism of action. Eur J Cancer. 2001, 37. [Google Scholar] [CrossRef] [PubMed]
- Leal, J.F.M.; Martínez-Díez, M.; García-Hernández, V.; et al. PM01183, a new DNA minor groove covalent binder with potent in vitro and in vivo anti-tumour activity. Br J Pharmacol. 2010, 161. [Google Scholar] [CrossRef] [PubMed]
- Yokoi, E.; Mabuchi, S.; Shimura, K.; et al. Lurbinectedin (PM01183), a selective inhibitor of active transcription, effectively eliminates both cancer cells and cancer stem cells in preclinical models of uterine cervical cancer. Invest New Drugs. 2019, 37. [Google Scholar] [CrossRef] [PubMed]
- Gedminas, J.M.; Kaufman, R.; Boguslawski, E.A.; et al. Lurbinectedin Inhibits the EWS–WT1 Transcription Factor in Desmoplastic Small Round Cell Tumor. Mol Cancer Ther. 2022, 21. [Google Scholar] [CrossRef] [PubMed]
- Povo-Retana, A.; Mojena, M.; Stremtan, A.B.; et al. Specific effects of Trabectedin and Lurbinectedin on human macrophage function and fate—novel insights. Cancers (Basel). 2020, 12. [Google Scholar] [CrossRef] [PubMed]
- Nuñez, G.S.; Robles, C.M.G.; Giraudon, C.; et al. Lurbinectedin specifically triggers the degradation of phosphorylated RNA polymerase II and the formation of DNA breaks in cancer cells. Mol Cancer Ther. 2016, 15. [Google Scholar]
- D’Incalci, M.; Galmarini, C.M. A Review of Trabectedin (ET-743): A unique mechanism of action. Mol. Cancer Ther. 2010. [CrossRef] [PubMed]
- Di Giandomenico, S.; Frapolli, R.; Bello, E.; et al. Mode of action of Trabectedin in myxoid liposarcomas. Oncogene. 2013, 33. [Google Scholar] [CrossRef] [PubMed]
- Minuzzo, M.; Marchini, S.; Broggini, M.; et al. Interference of transcriptional activation by the antineoplastic drug ecteinascidin-743. Proc Natl Acad Sci U S A. 2000, 97. [Google Scholar] [CrossRef] [PubMed]
- Grosso, F.; Jones, R.L.; Demetri, G.D.; et al. Efficacy of Trabectedin (ecteinascidin-743) in advanced pretreated myxoid liposarcomas: a retrospective study. Lancet Oncol. 2007, 8. [Google Scholar] [CrossRef] [PubMed]
- Colombo, N.; Hardy-Bessard, A.C.; Ferrandina, G.; et al. Experience with Trabectedin + pegylated liposomal doxorubicin for recurrent platinum-sensitive ovarian cancer unsuited to platinum rechallenge. Expert Rev. Anticancer Ther. 2016. [CrossRef] [PubMed]
- Grignani, G.; D’Ambrosio, L.; Pignochino, Y.; et al. Trabectedin and olaparib in patients with advanced and non-resectable bone and soft-tissue sarcomas (TOMAS): an open-label, phase 1b study from the Italian Sarcoma Group. Lancet Oncol. 2018, 19. [Google Scholar] [CrossRef] [PubMed]
- Andreeva-Gateva, P.; Chakar, S. The place of Trabectedin in the treatment of soft tissue sarcoma: an umbrella review of the level one evidence. Expert Opin. Orphan Drugs. 2019. [CrossRef]
- Farago, A.F.; Drapkin, B.J.; Lopez-Vilarino De Ramos, J.A.; et al. ATLANTIS: A Phase III study of Lurbinectedin/doxorubicin versus topotecan or cyclophosphamide/doxorubicin/vincristine in patients with small-cell lung cancer who have failed one prior platinum-containing line. Futur Oncol. 2019, 15. [Google Scholar] [CrossRef] [PubMed]
- Chuk, M.K.; Balis, F.M.; Fox, E. Trabectedin. Oncologist. 2009, 14, 794–799. [Google Scholar] [CrossRef] [PubMed]
- Allavena, P.; Belgiovine, C.; Digifico, E.; et al. Effects of the Anti-Tumor Agents Trabectedin and Lurbinectedin on Immune Cells of the Tumor Microenvironment. Front. Oncol. 2022. [CrossRef] [PubMed]
- Povo-Retana, A.; Fariñas, M.; Landauro-Vera, R.; et al. Immunometabolic actions of Trabectedin and Lurbinectedin on human macrophages: relevance for their anti-tumor activity. Front Immunol. 2023, 14. [Google Scholar] [CrossRef] [PubMed]
- Raggi, C.; Correnti, M.; Sica, A.; et al. Cholangiocarcinoma stem-like subset shapes tumor-initiating niche by educating associated macrophages. J Hepatol. 2017, 66, 102–115. [Google Scholar] [CrossRef] [PubMed]
- Raggi, C.; Taddei, M.L.; Sacco, E.; et al. Mitochondrial oxidative metabolism contributes to a cancer stem cell phenotype in cholangiocarcinoma. J Hepatol. 2021, 74, 1373–1385. [Google Scholar] [CrossRef] [PubMed]
- Broutier, L.; Mastrogiovanni, G.; Verstegen, M.M.; et al. Human primary liver cancer-derived organoid cultures for disease modeling and drug screening. Nat Med. 2017, 23, 1424–1435. [Google Scholar] [CrossRef] [PubMed]
- Grabinger, T.; Luks, L.; Kostadinova, F.; et al. Ex vivo culture of intestinal crypt organoids as a model system for assessing cell death induction in intestinal epithelial cells and enteropathy. Cell Death Dis. 2014, 5, e1228. [Google Scholar] [CrossRef] [PubMed]
- Verstegen, M.M.A.; Coppes, R.P.; Beghin, A.; et al. Clinical applications of human organoids. Nat Med. 2025, 31, 409–421. [Google Scholar] [CrossRef] [PubMed]
- Mancarella, S.; Gigante, I.; Pizzuto, E.; et al. Targeting cancer-associated fibroblasts/tumor cells cross-talk inhibits intrahepatic cholangiocarcinoma progression via cell-cycle arrest. J Exp Clin Cancer Res. 2024, 43, 286. [Google Scholar] [CrossRef] [PubMed]
- Cigrang, M.; Obid, J.; Nogaret, M.; et al. Pan-inhibition of super-enhancer-driven oncogenic transcription by next-generation synthetic ecteinascidins yields potent anti-cancer activity. Nat Commun. 2025, 16, 512. [Google Scholar] [CrossRef] [PubMed]
- Pacifico, F.; Mellone, S.; D’Incalci, M.; et al. Trabectedin suppresses escape from therapy-induced senescence in tumor cells by interfering with glutamine metabolism. Biochem Pharmacol. 2022, 202, 115159. [Google Scholar] [CrossRef] [PubMed]
- Zhang, S.; Song, X.; Cao, D.; et al. Pan-mTOR inhibitor MLN0128 is effective against intrahepatic cholangiocarcinoma in mice. J Hepatol. 2017, 67, 1194–1203. [Google Scholar] [CrossRef] [PubMed]
Figure 1.
Effect of Trabectedin and Lurbinectedin, on the viability of intrahepatic cholangiocarcinoma cell lines. Cell viability of six (CCLP1, HUCCT1, KKU055, KKU156, KKUM213, and SG231) human iCCA cell lines exposed to Trabectedin (A) and Lurbinectedin (B) as assessed by MTT assay. Data from three independent triplicated experiments are represented as the percentage of DMSO-treated cells ± SD. A summary of the IC50 of the drug in the six cell lines is depicted next to the graph.
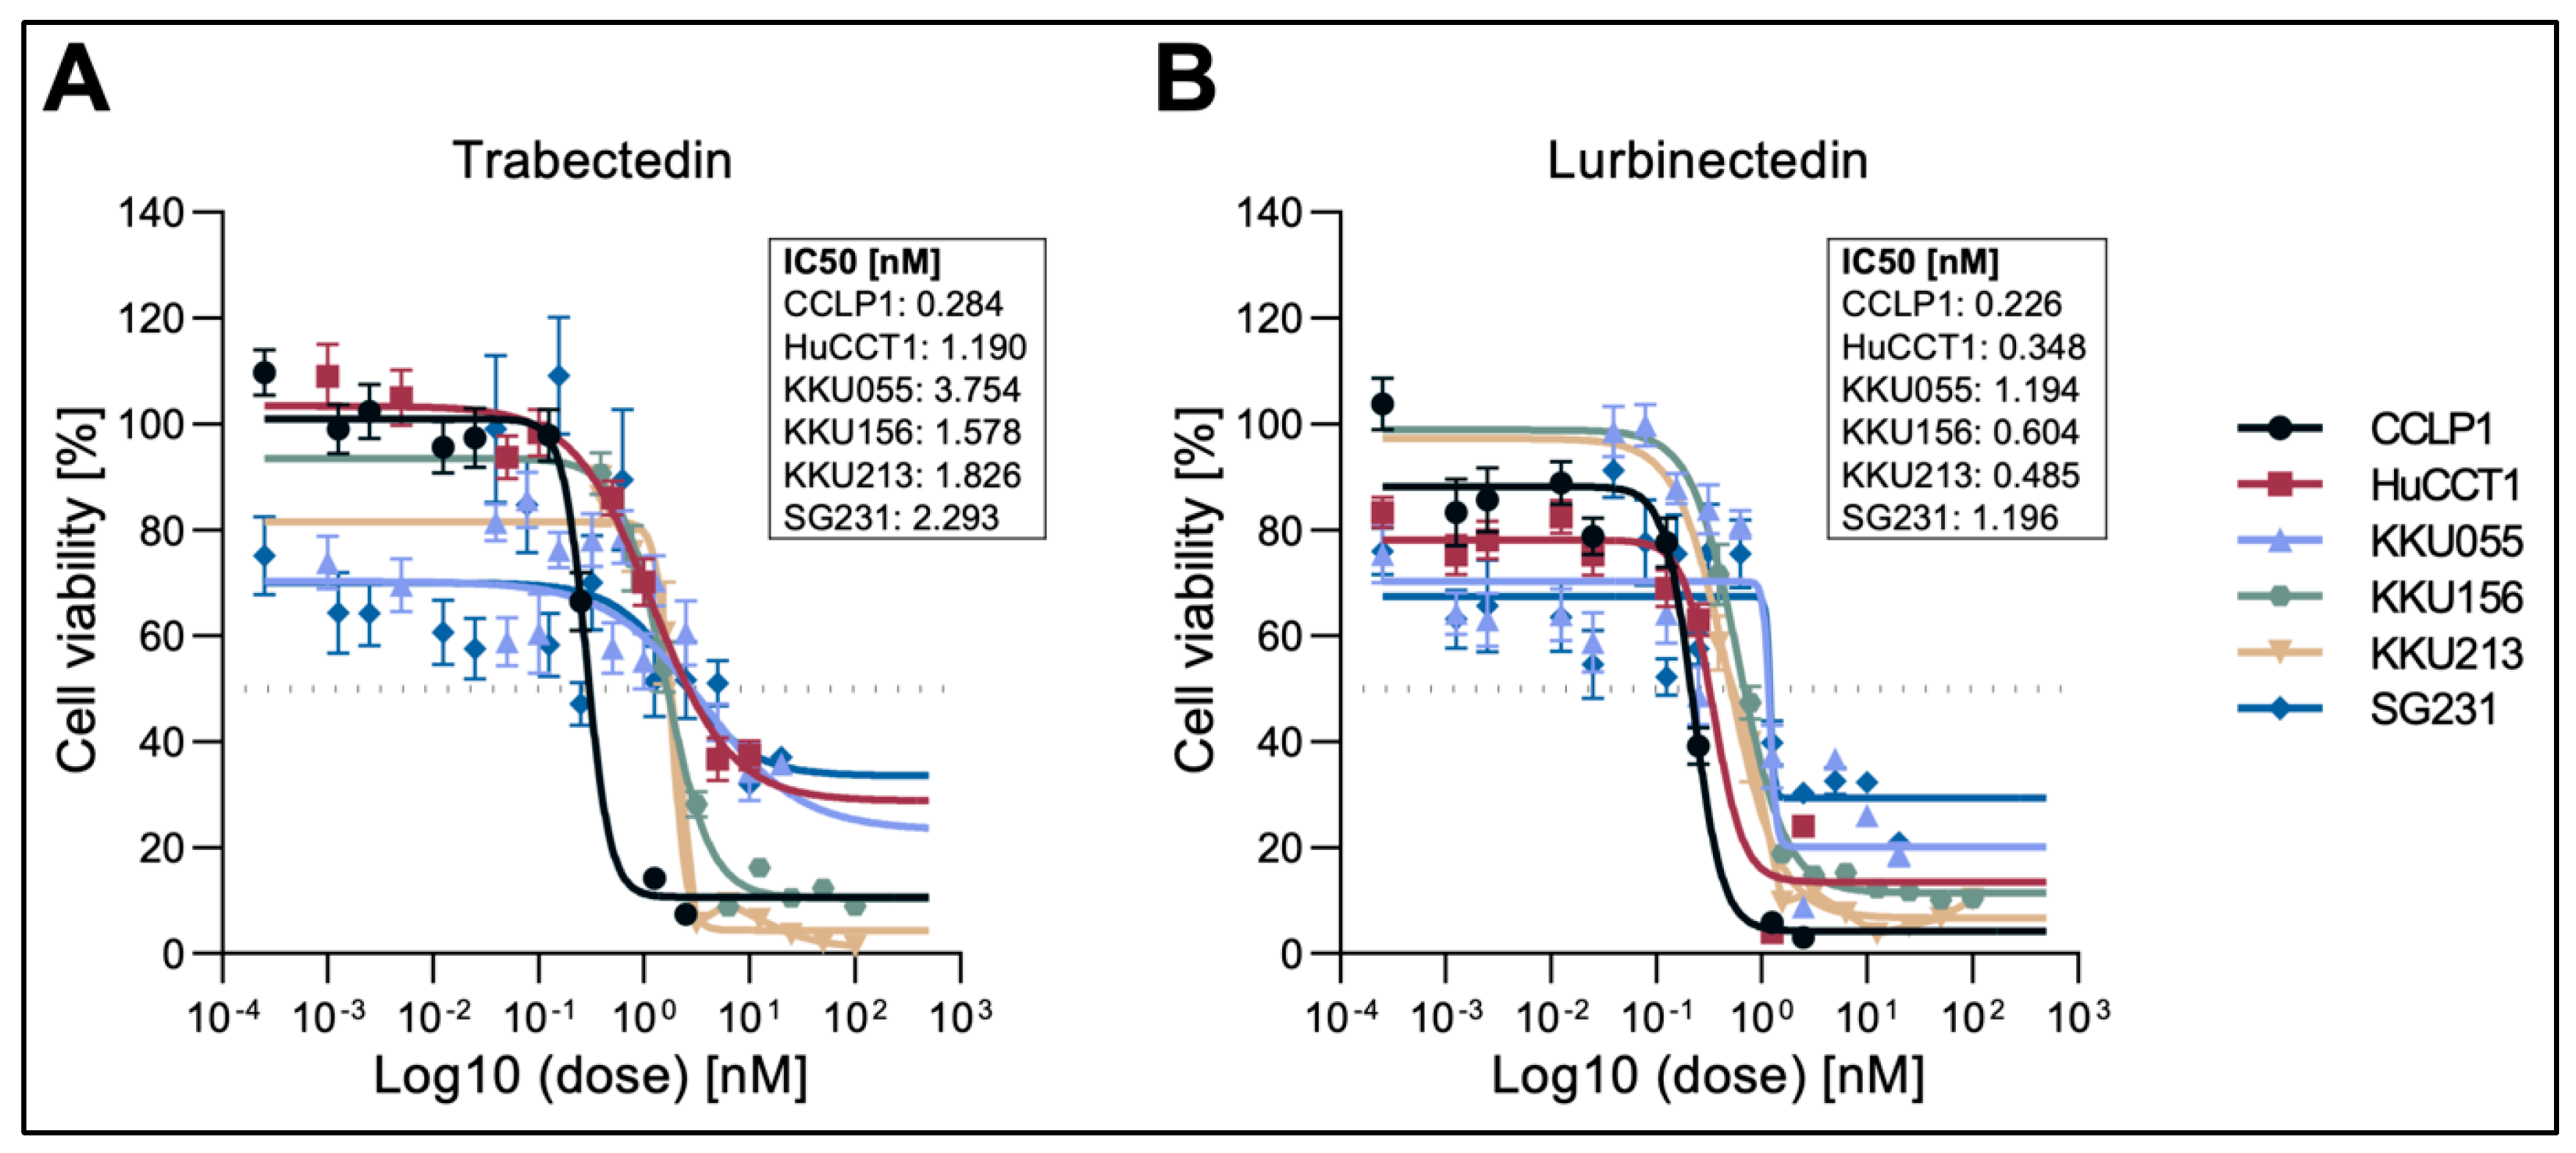
Figure 2.
Effects of Trabectedin and Lurbinectedin on the proliferation of intrahepatic cholangiocarcinoma cell line monolayer cultures indicated by BrdU incorporation. BrdU incorporation assay was conducted on HUCCT1, CCLP1, KKU55, KKU156, KKU213, and SG231 cells treated for 48 h with Trabectedin and Lurbinectedin at 1 nM and 5 nM concentrations. Cells treated with solvent (DMSO) served as controls. Results are expressed as mean ± SD of three independent experiments in triplicate. For statistical analysis, Tukey’s multiple comparisons test was performed; at least p < 0.001; a, vs. DMSO; b, vs. 1 nm TRB; c, vs. 5 nM TRB; d, vs. 1 nM LUR. Abbreviations: LUR, lurbinectedin; TRB, trabectedin.
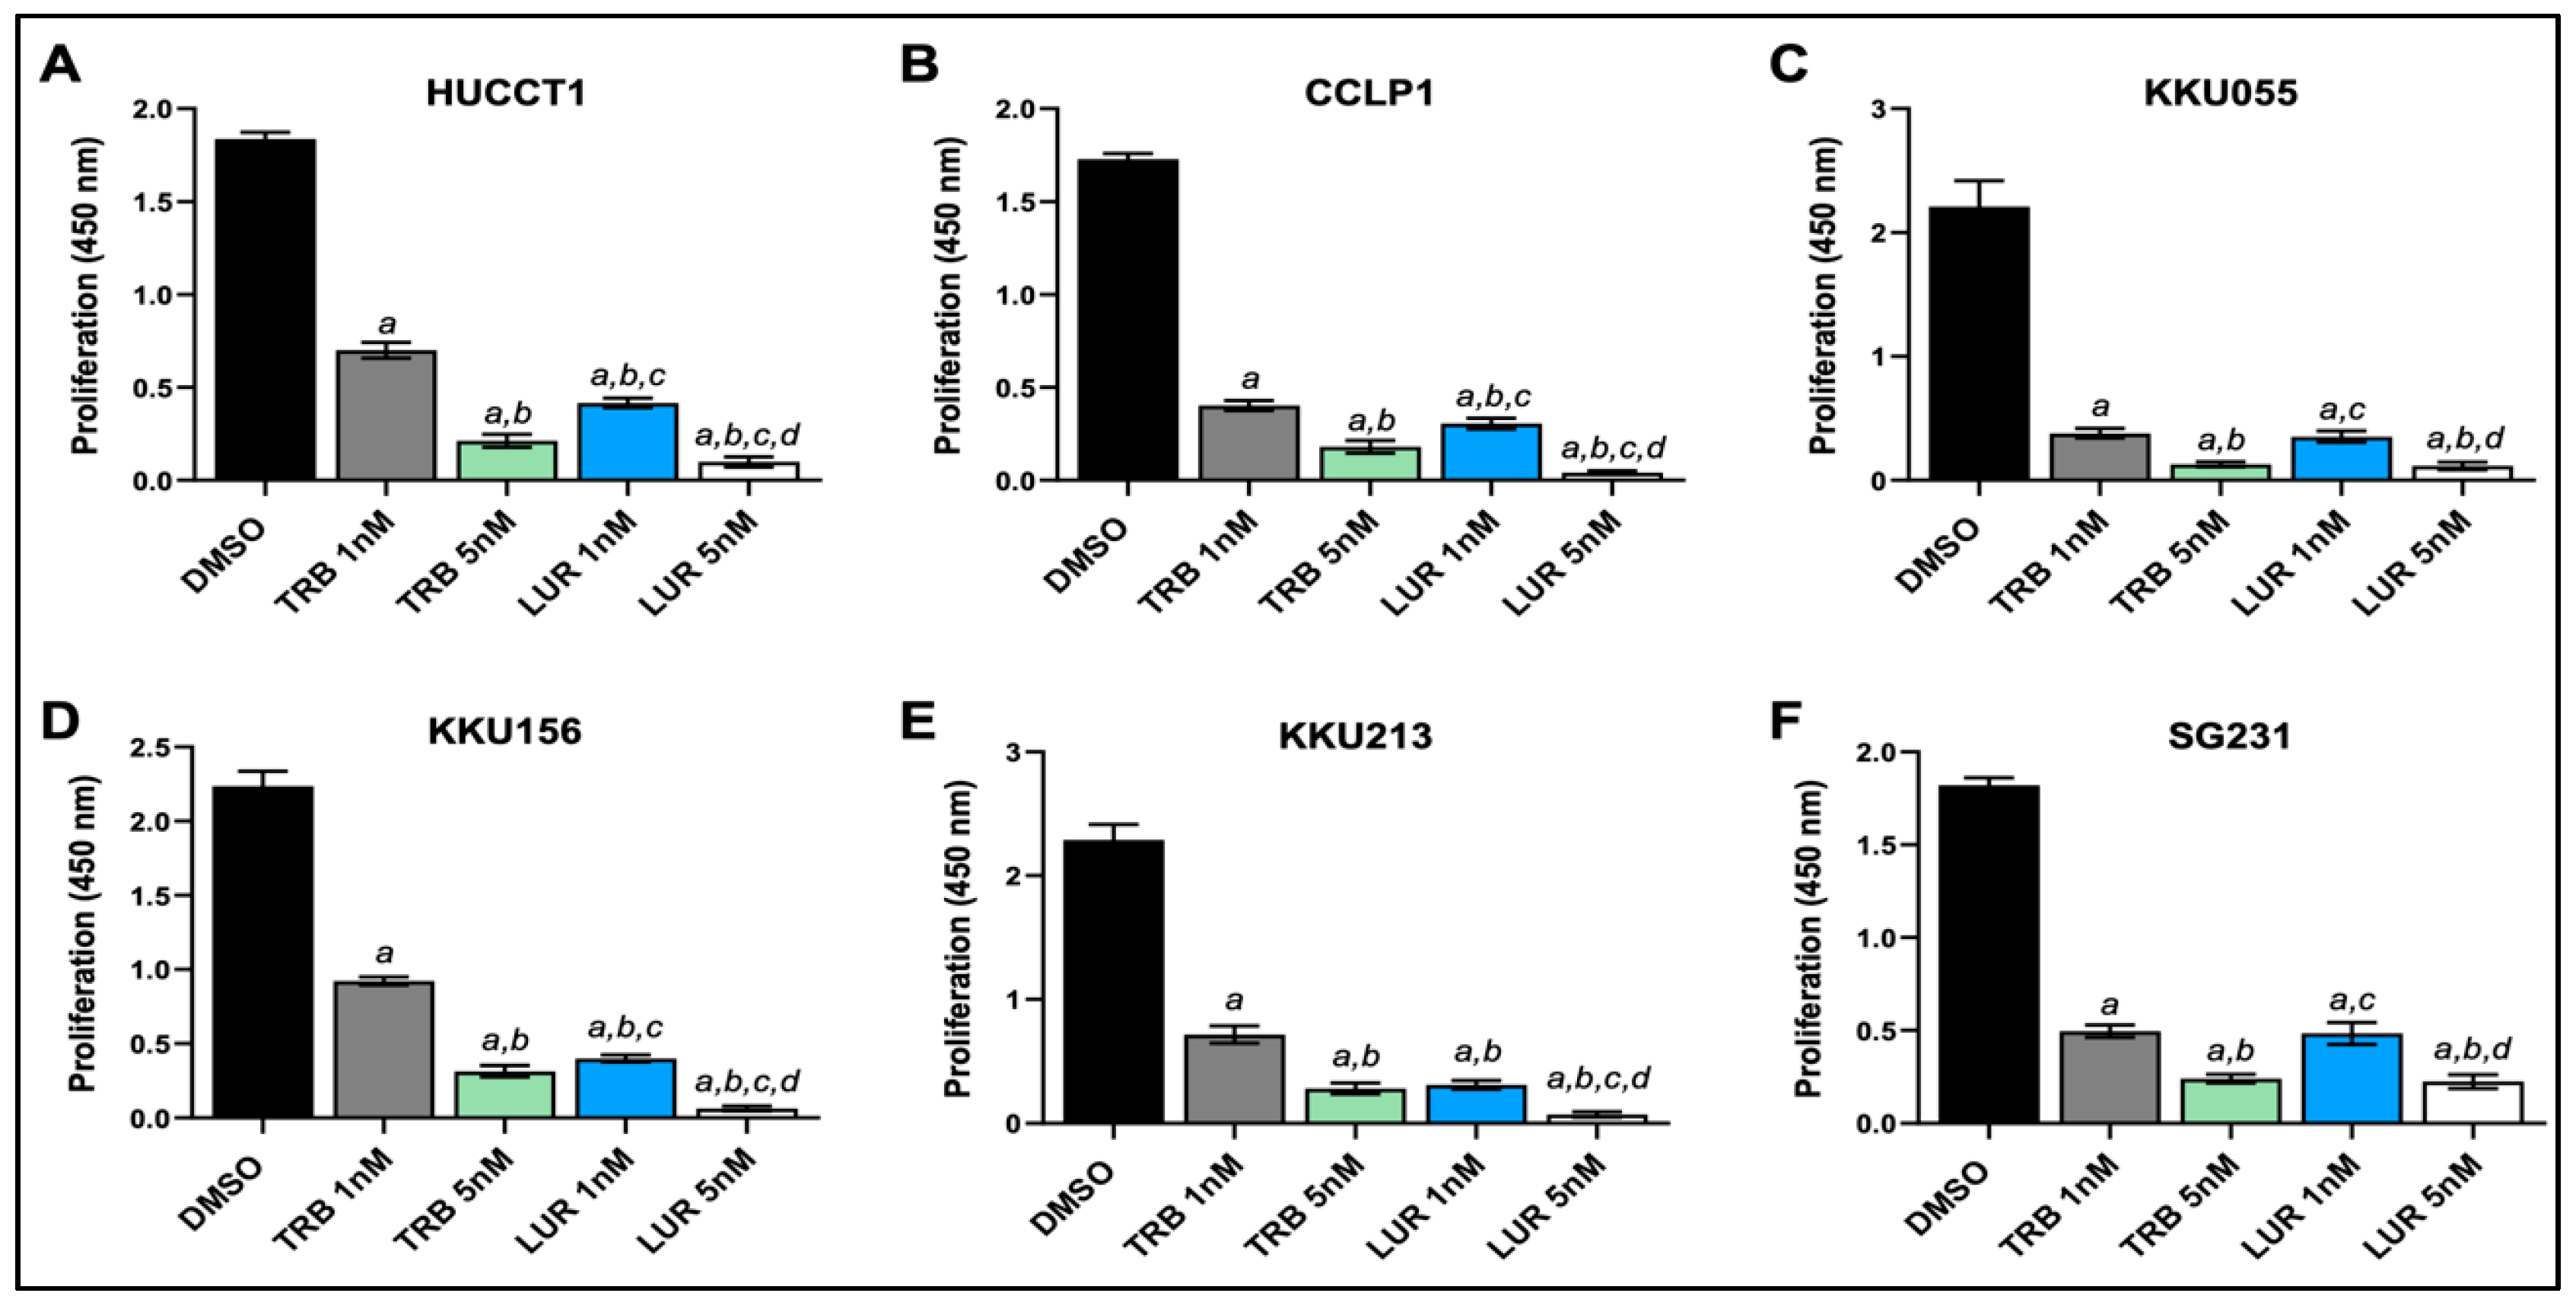
Figure 3.
Trabectedin and Lurbinectedin restrain the growth of HUCCT1 and KKU213 intrahepatic cholangiocarcinoma cells grown as 3D cultures (spheroids, SPH). HUCCT1- and KKU213-derived SPH were treated with DMSO (vehicle) and increasing concentrations of Trabectedin and Lurbinectedin (0.25-2 nM). Note the decrease in size and number of spheroids following the treatment with Trabectedin (A) and Lurbinectedin, as assessed by the optical microscope. Original magnification: 10X; scale bar: 100µm.
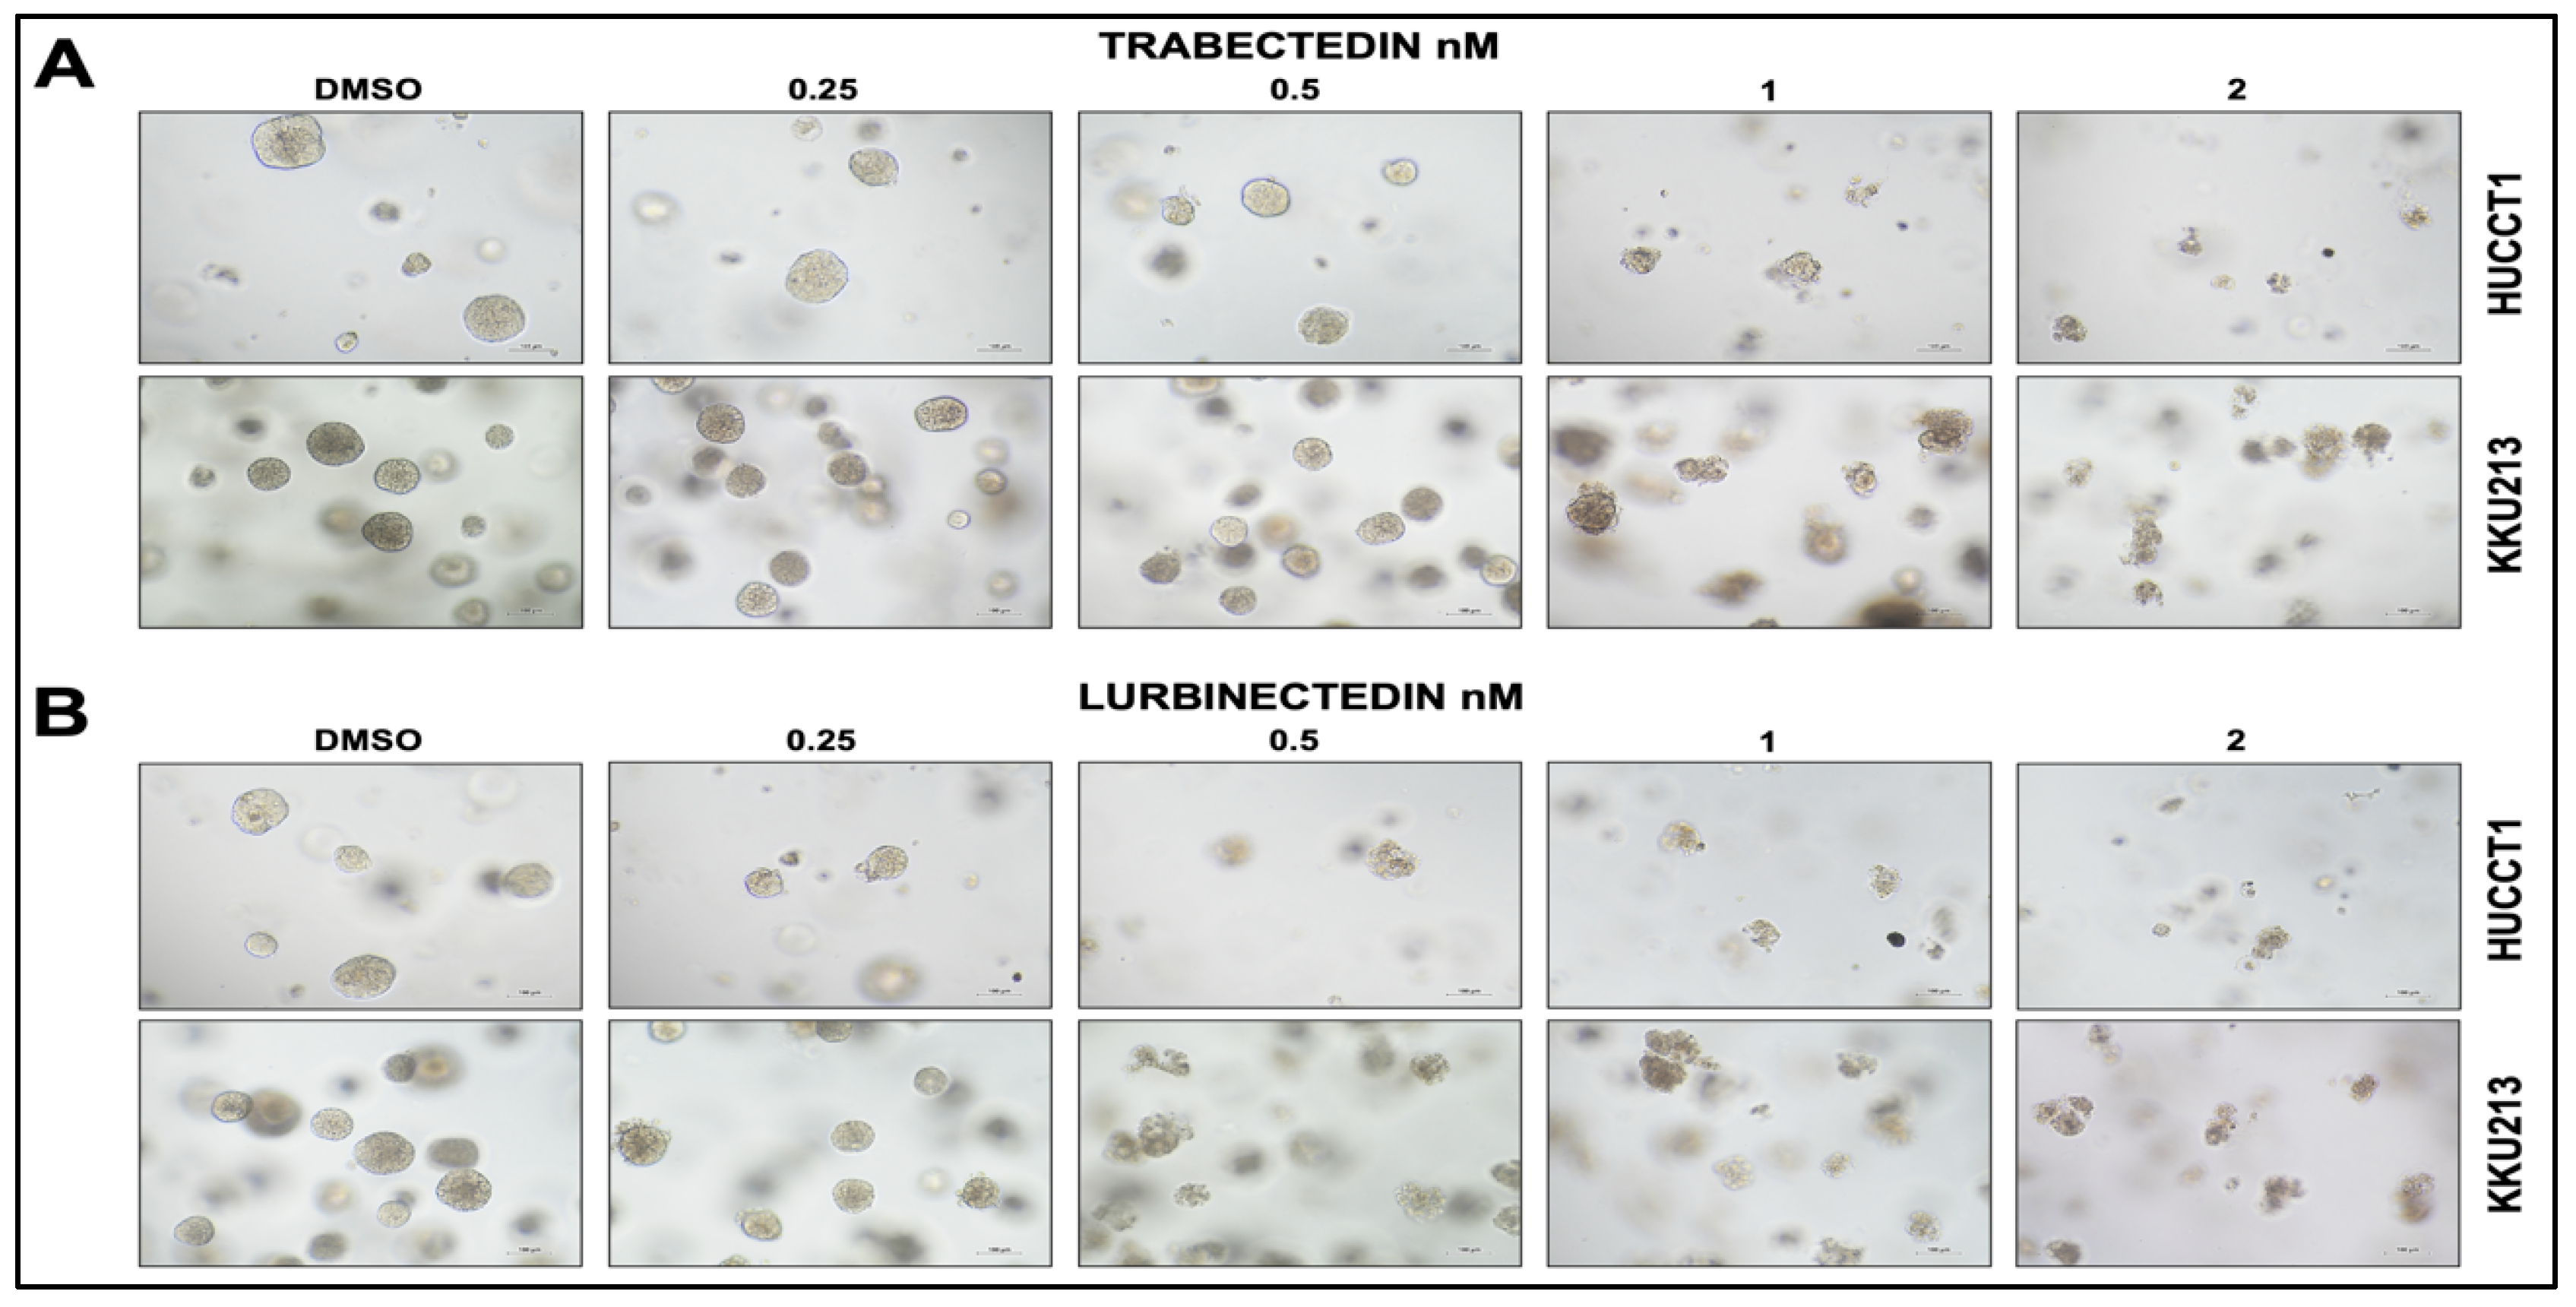
Figure 4.
Effect of Lurbinectedin and Trabectedin on the apoptosis and cell cycle of intrahepatic cholangiocarcinoma cell lines, as assessed by flow cytometry analysis. (A,B) Dot spot graph of the apoptotic analysis representative of three independent experiments. Apoptotic analysis with Annexin V-PE and 7-AAD staining of HUCCT1 iCCA cells treated with Trabectedin and Lurbinectedin at 1 nM concentration for 24 hours. Data as the percentage of total apoptotic cells, are presented as mean ± SD, and the significance level of ANOVA is reported (***, p < 0.001) according to Tukey’s multiple comparisons test. Lowercase letters are used to denote statistical significance (a, vs Vehicle; b, vs Trabectedin 1 nM). (C) Left: Representative images of cell cycle distribution of iCCA cells that were cultured in complete medium and treated with vehicle or 1 nM Lurbinectedin or 1 nM Trabectedin for 24 hours. Right: Quantification of the cell cycle phases from three independent experiments. Data are presented as mean ± SD and were analyzed using Tukey’s multiple comparisons test (* p < 0.01, *** p < 0.001, **** p < 0.0001). Abbreviations: TRB, trabectedin; LUR, lurbidectedin.
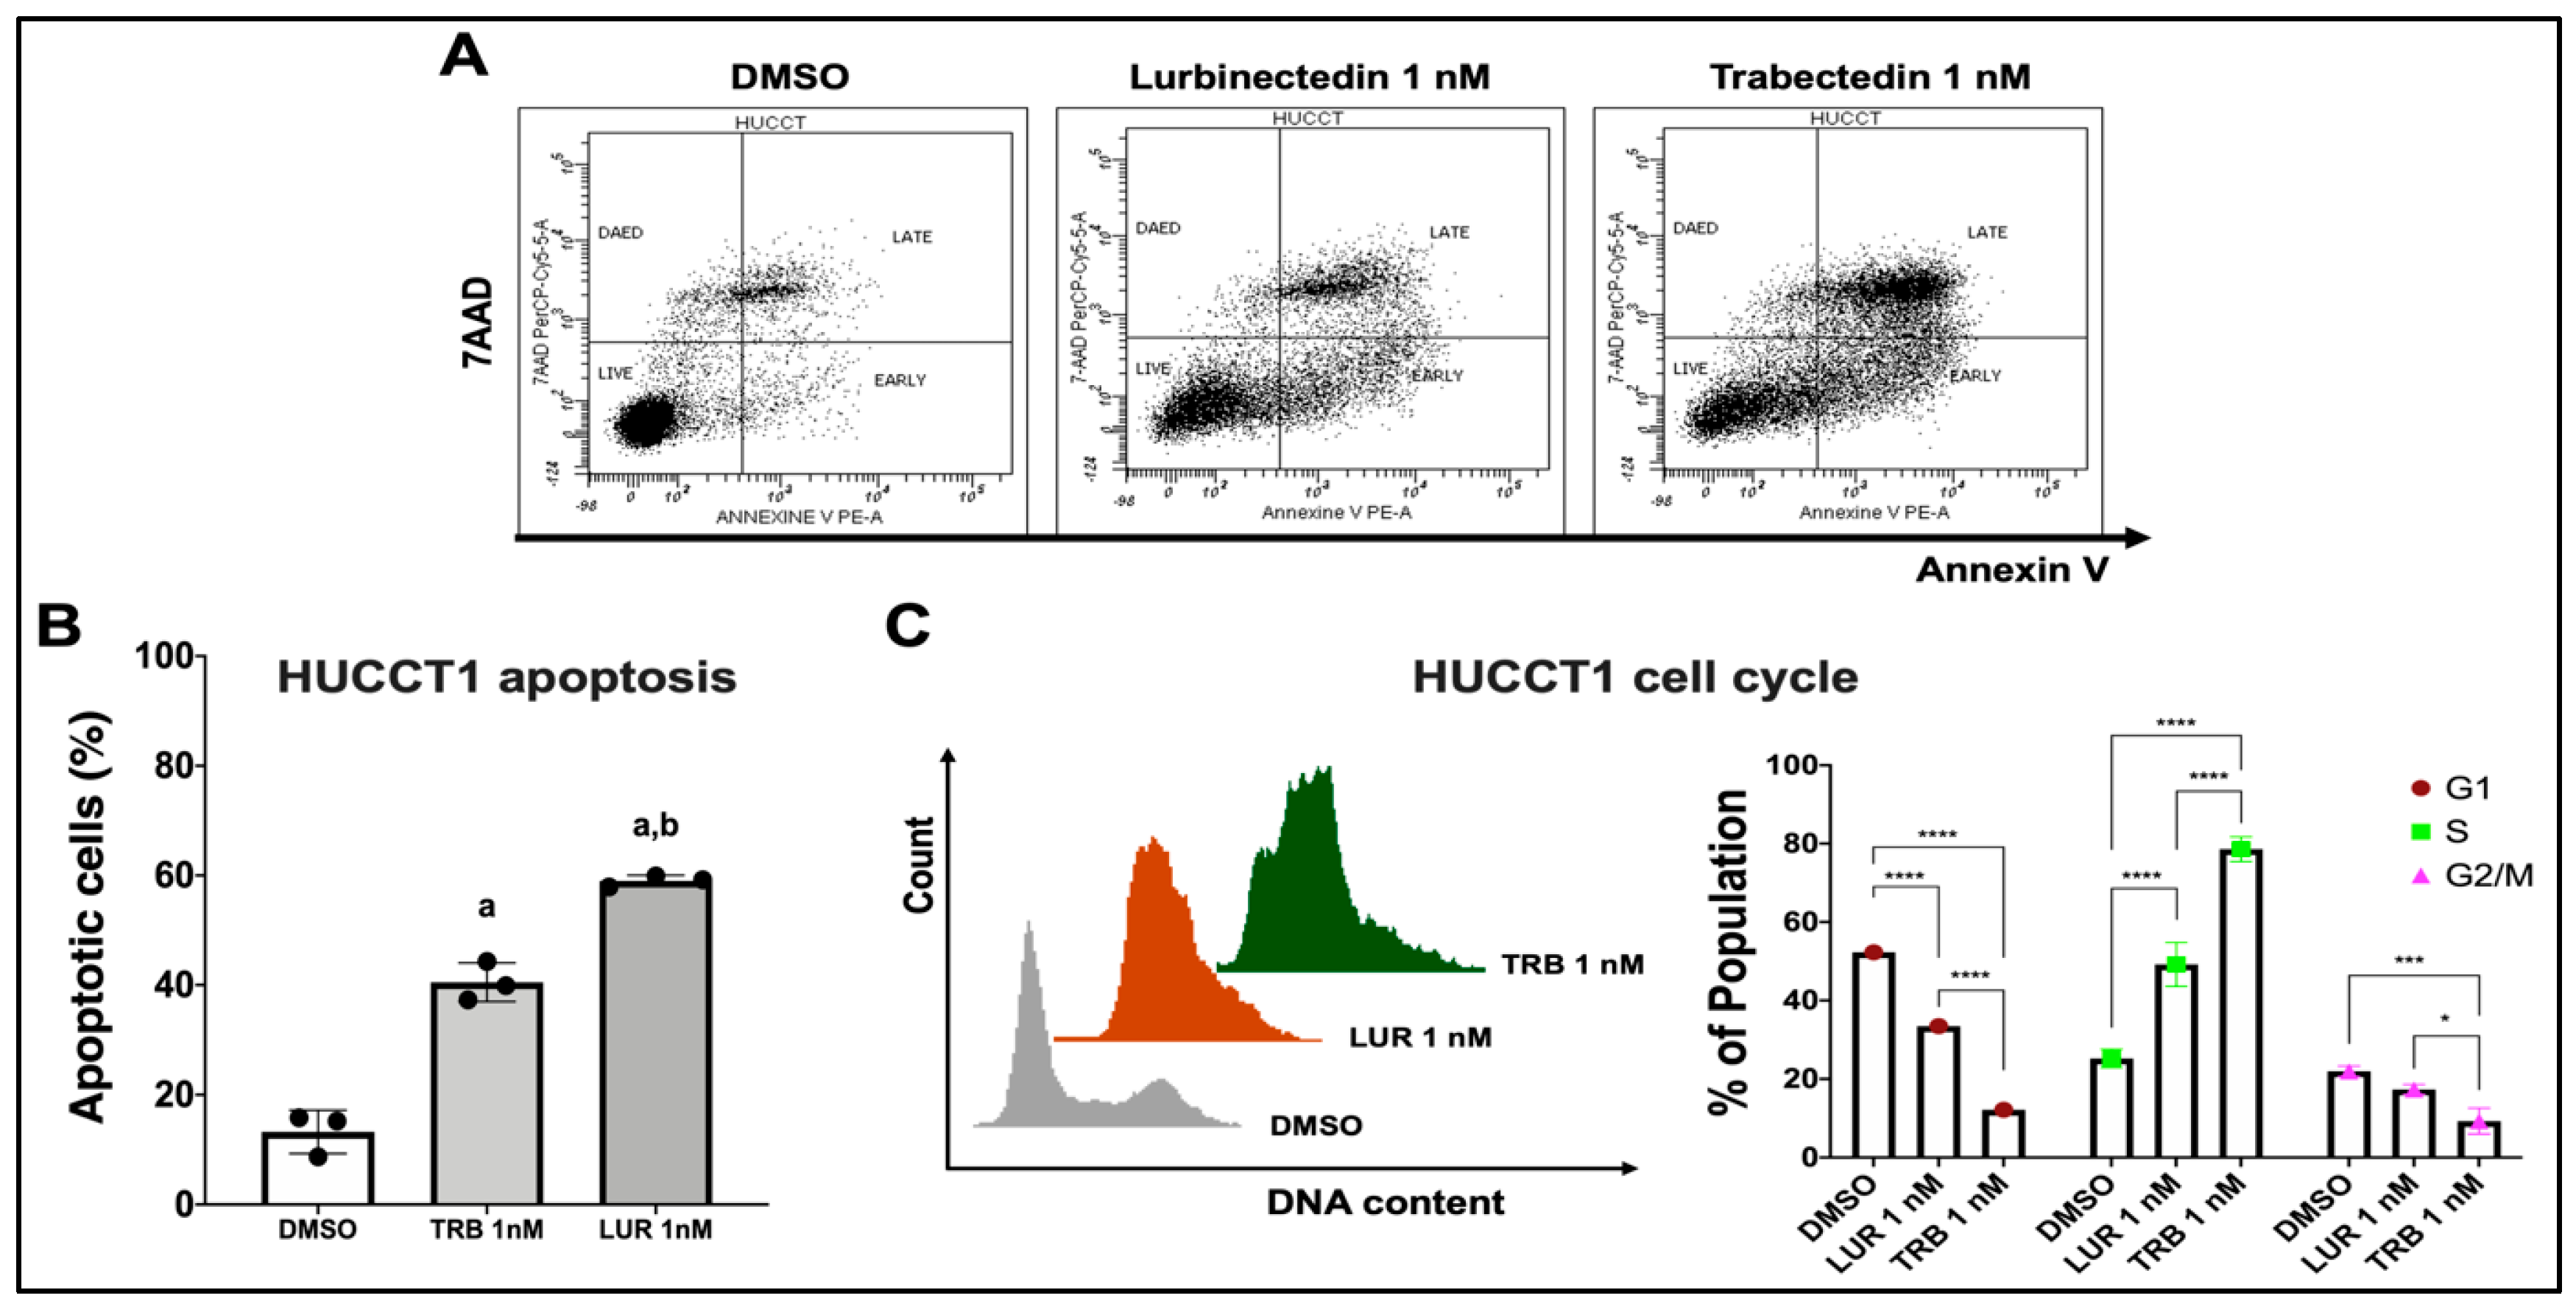
Figure 5.
Effects of Trabectedin and Lurbinectedin in intrahepatic cholangiocarcinoma cell lines on the levels of elements of oncogenic cascades, DNA damage response, and apoptosis pathways. Western blot analysis was applied to assess the levels of several effectors of oncogenic cascades (A) and DNA damage response and apoptosis pathways (B) in HUCCT1, SG231, CCLP1, and KKU055 intrahepatic cholangiocarcinoma cell lines exposed to Trabectedin and Lurbinectedin at 1 nM concentration. Cells were treated for 48 h, and Western blot analysis was conducted at this time point. (C) Loading order of the samples loaded. Ponceau S Red staining of the membranes and β-Actin were used as a loading control. Abbreviations: M, protein marker; TRB, trabectedin; LUR, lurbinectedin.
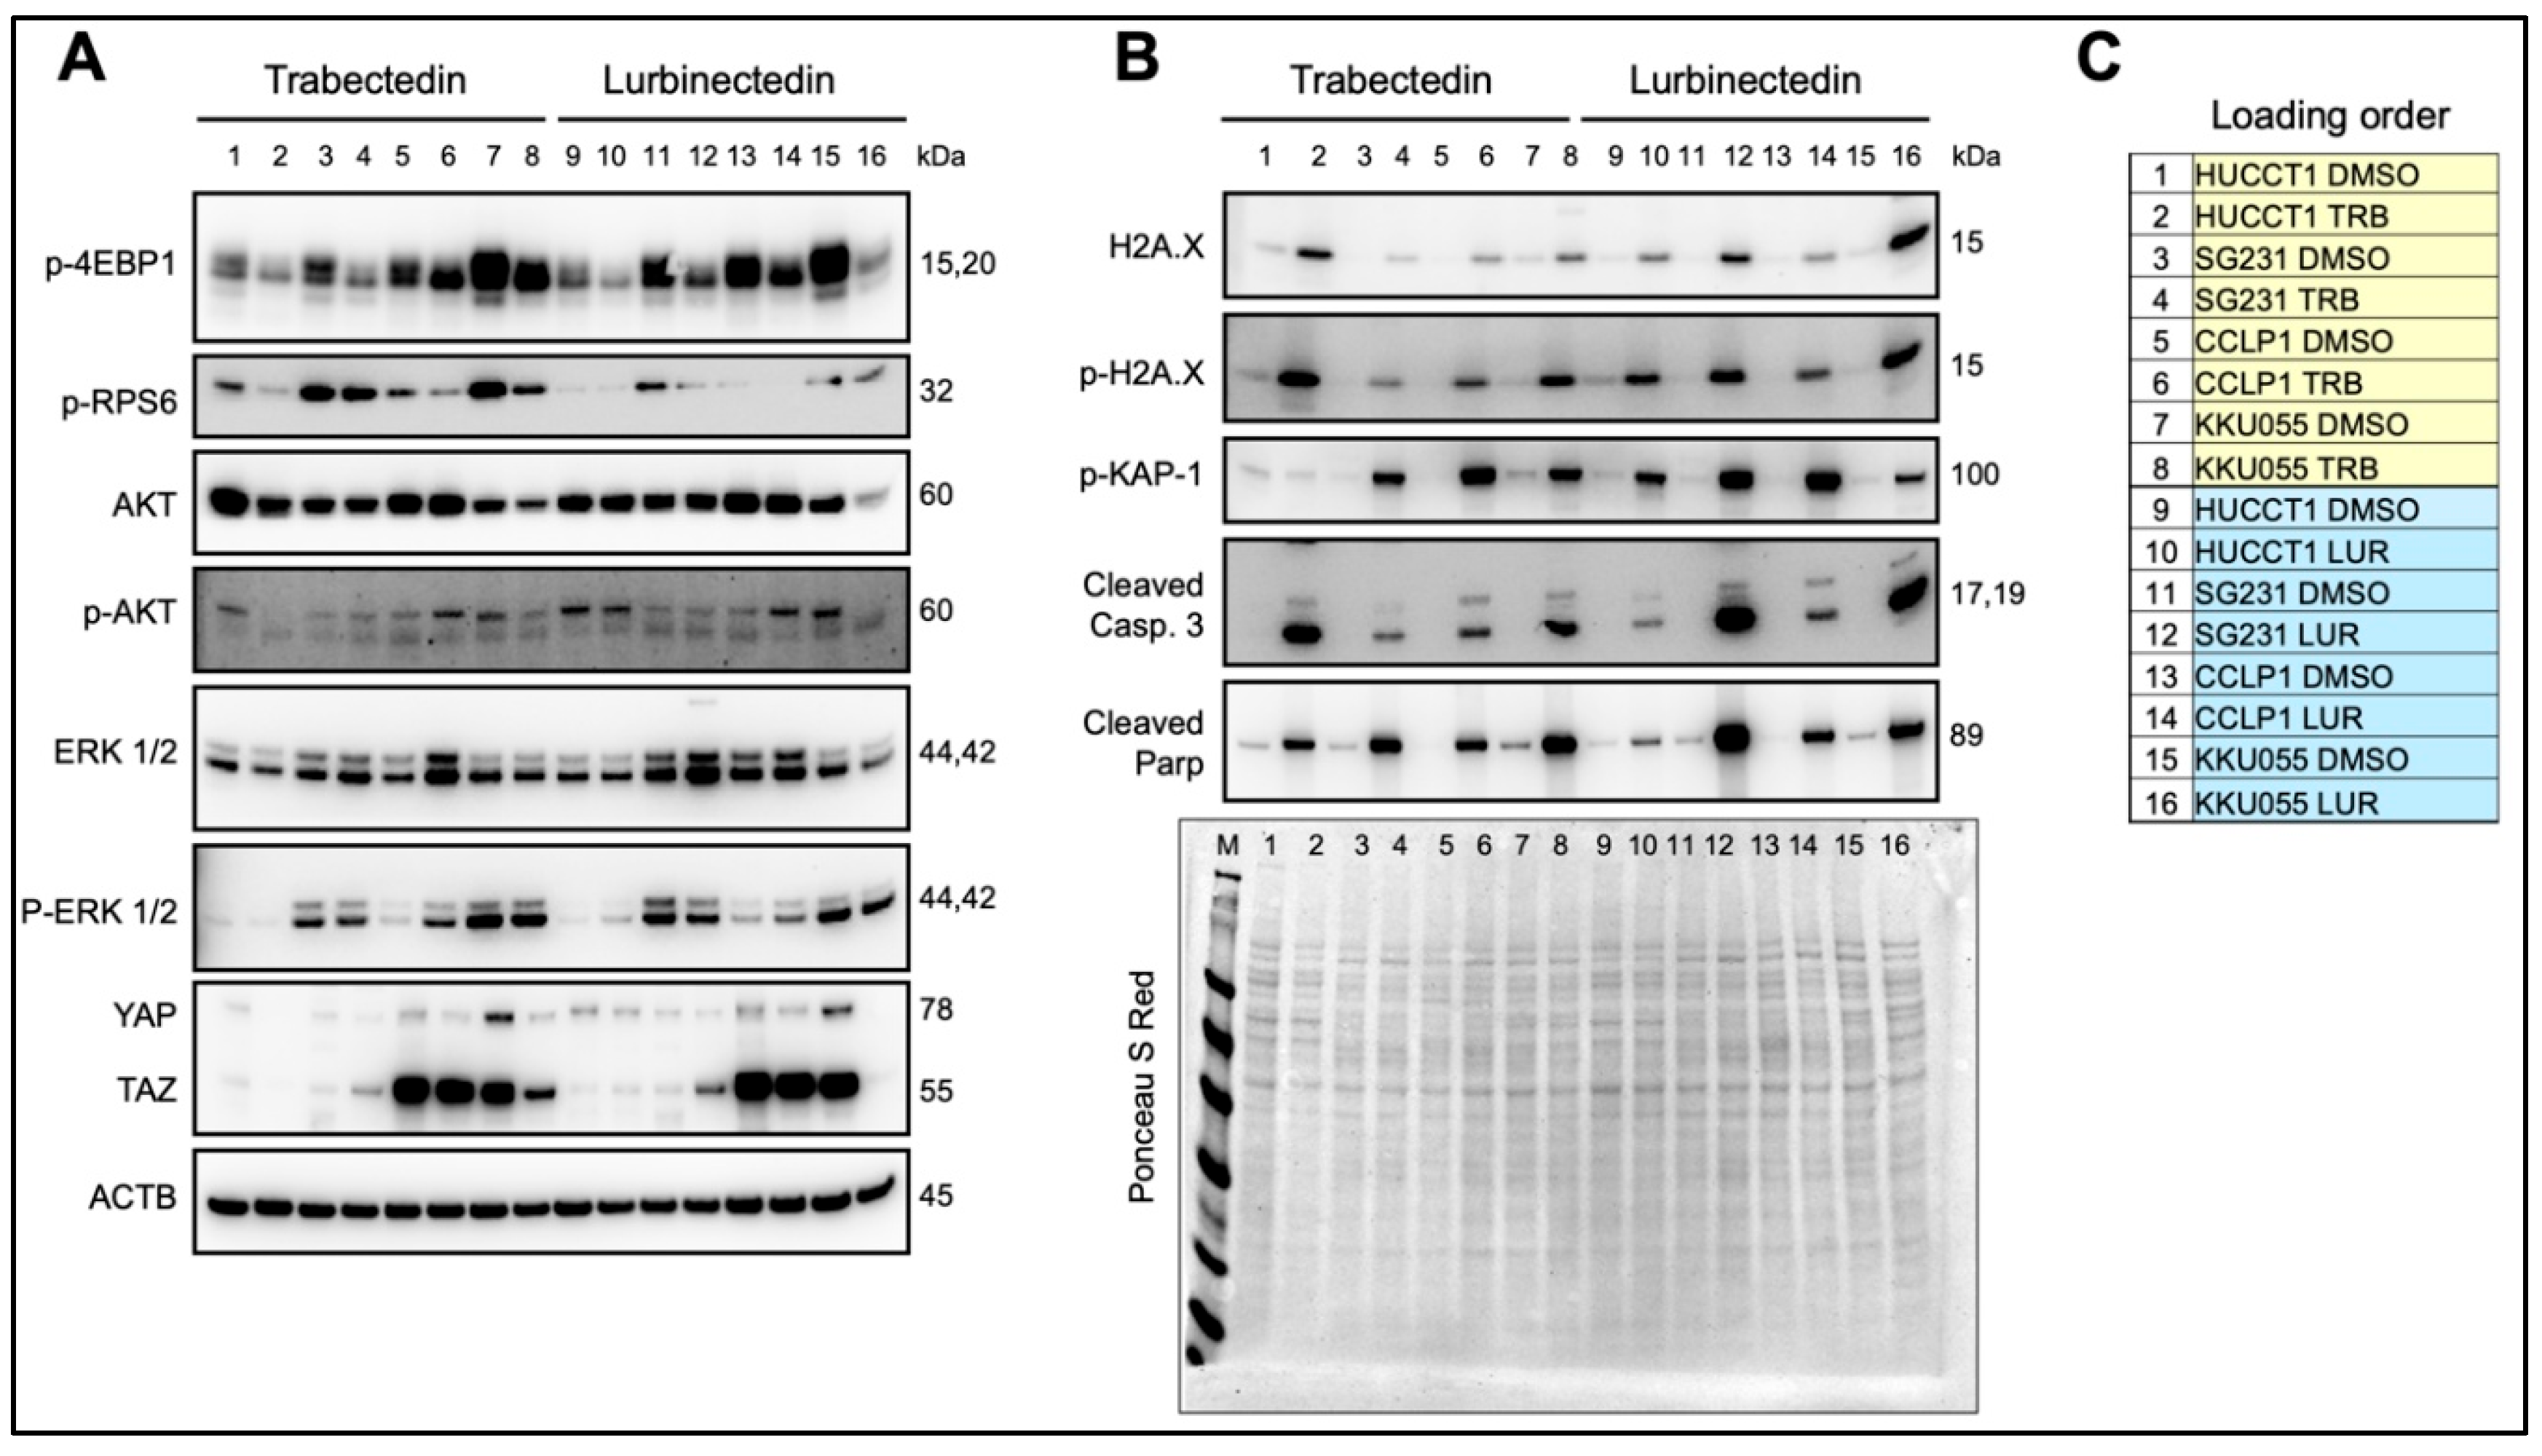
Figure 6.
Effect of Trabectedin and Lurbinectedin on the mitochondrial respiration of human intrahepatic cholangiocarcinoma cells. For the Seahorse XF Mito Stress Test, KKU055 cells were treated with 5 nM Trabectedin, 1 nM Lurbinectedin, or matched DMSO concentration for 24 h. The Seahorse Mito Stress Test profile of normalized oxygen consumption rate (OCR) in trabectedin-treated (A,B) and lurbinectedin-treated (C,D) KKU055 cells is shown. All OCR levels were background corrected and normalized to nuclei fluorescent staining. The mean ± SD of two independent experiments (with technical triplicates) is shown. Dotted lines indicate the time-point of compound injection. FCCP, carbonyl cyanide-p-trifluoromethoxyphenylhydrazone; Rot, Rotenone; AA, antimycin A.
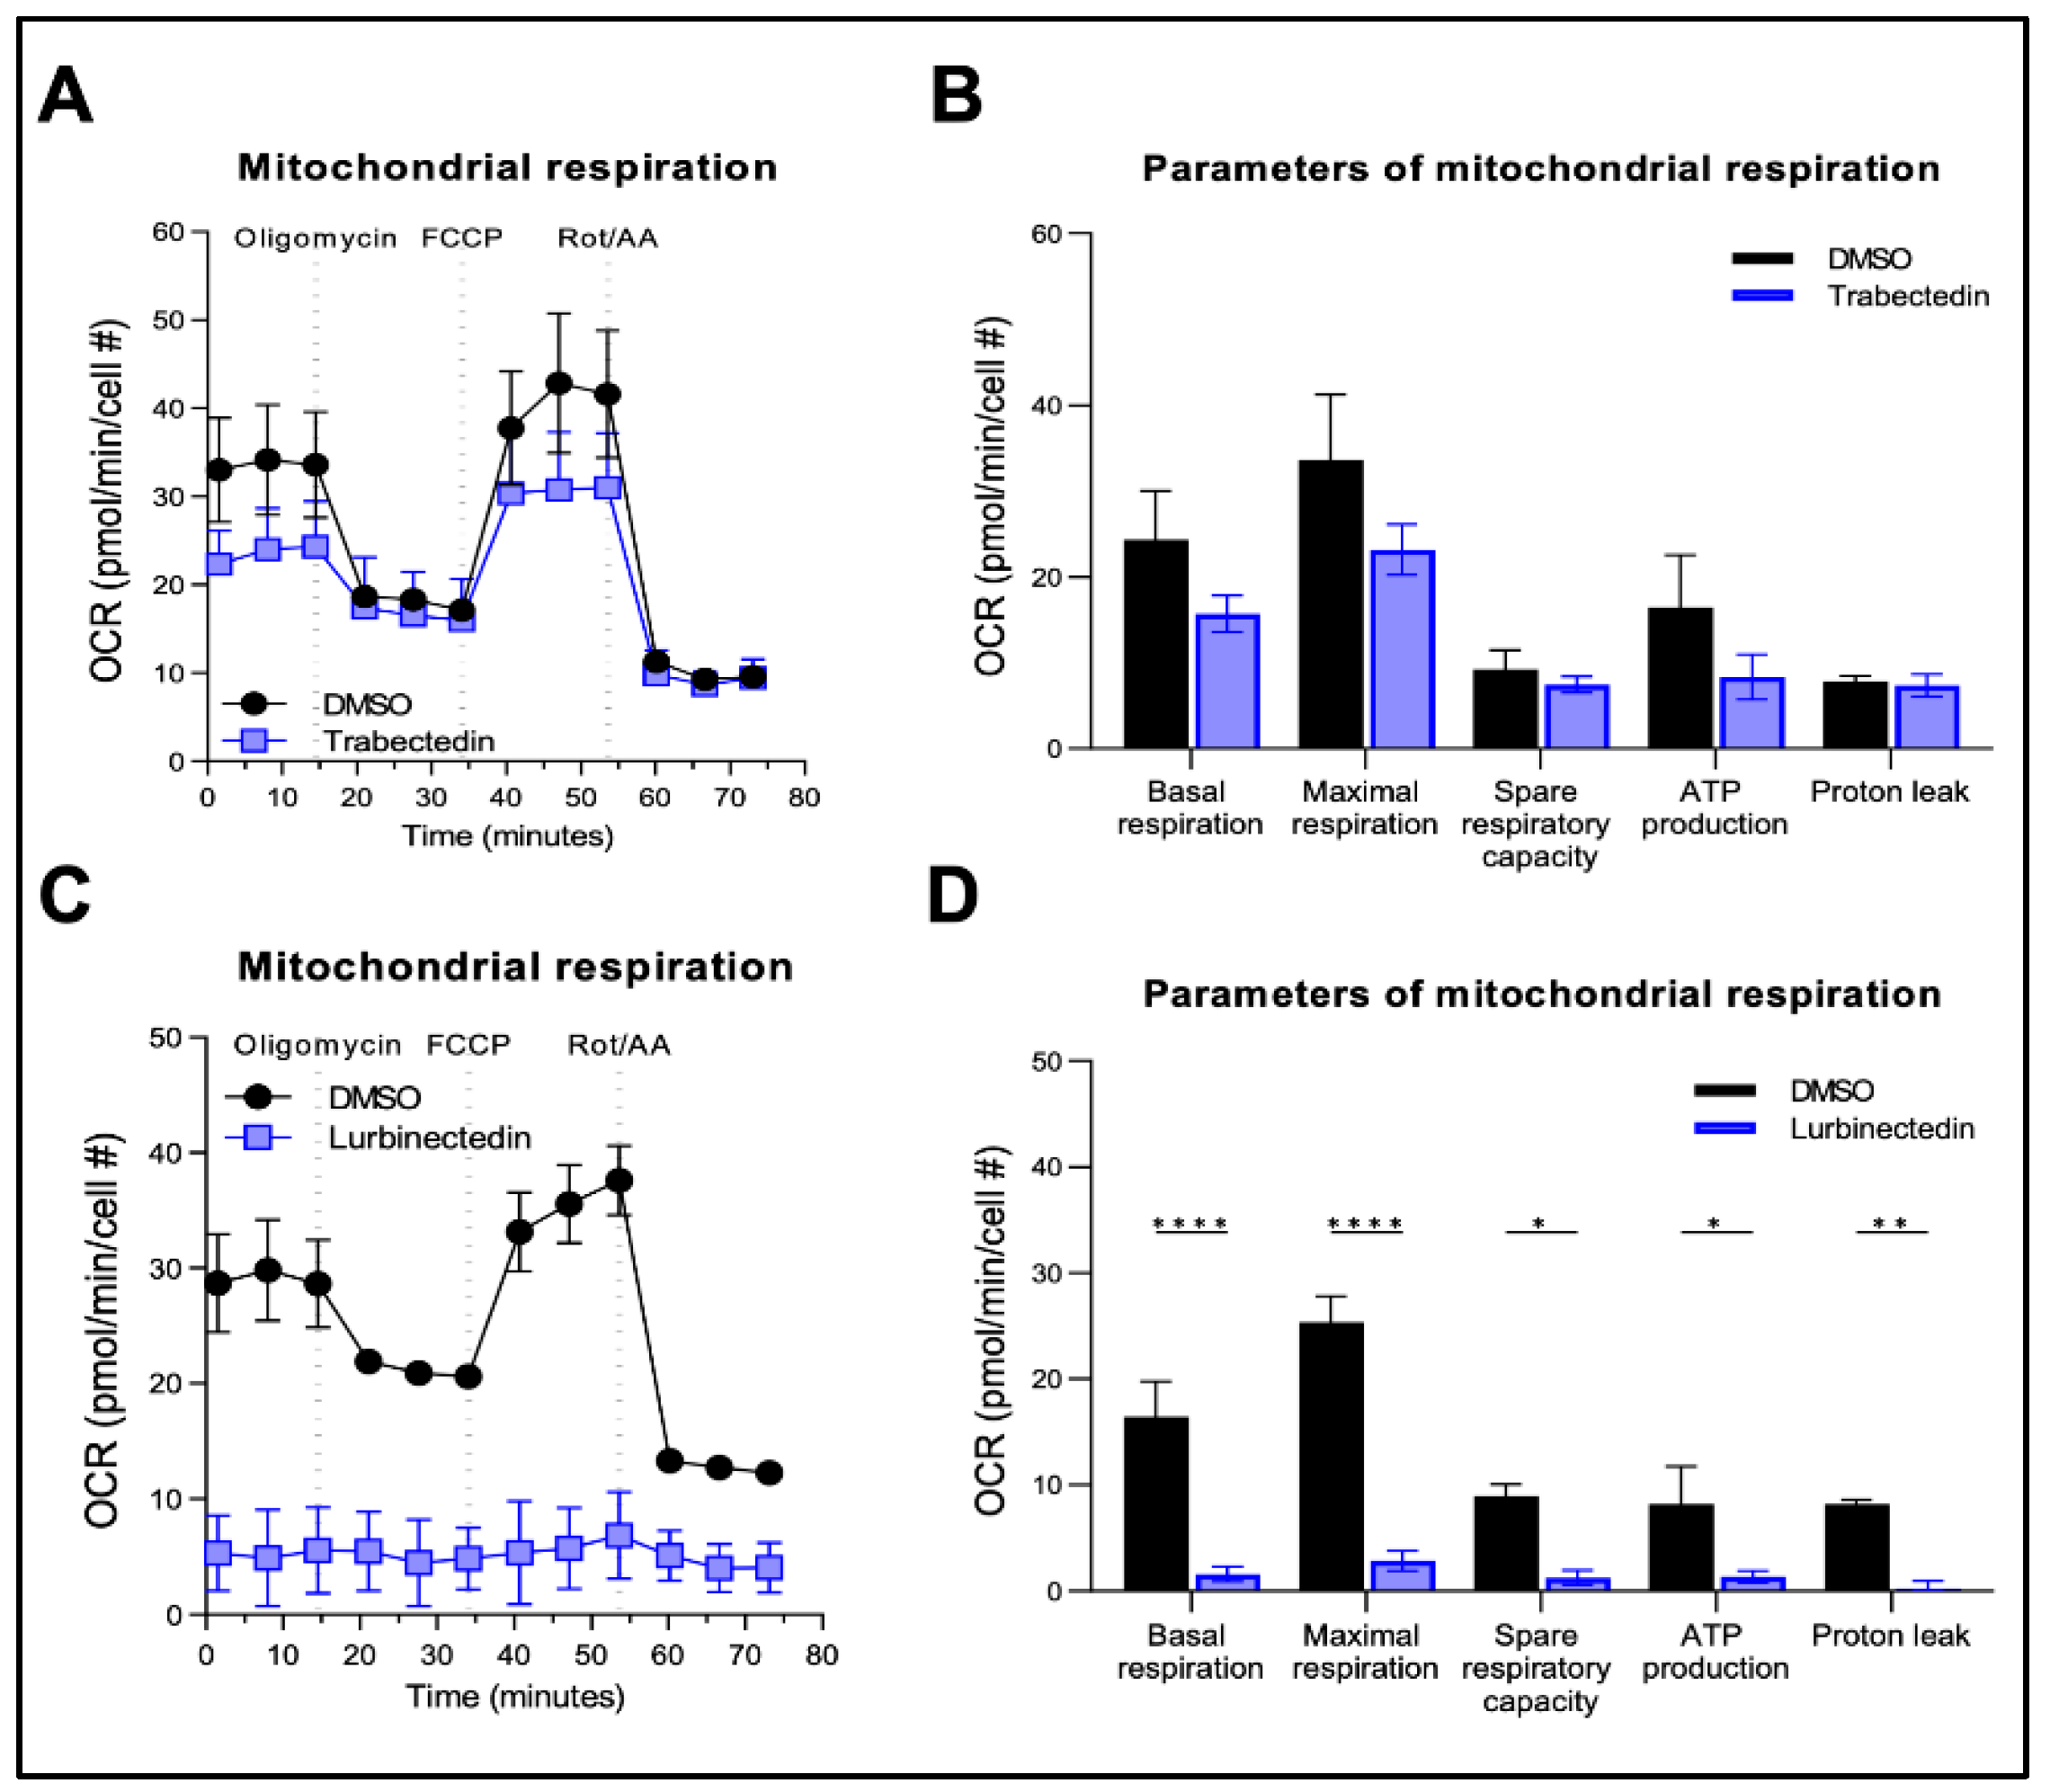
Figure 7.
Effect of Trabectedin and Lurbinectedin on glycolysis of human intrahepatic cholangiocarcinoma cells. For the Seahorse XF Glycolytic Rate Assay, KKU055 cells were treated with 5 nM Trabectedin (A,B), 1 nM Lurbinectedin (C,D), or matched DMSO concentration for 24 h. Extracellular acidification rates (ECAR) and oxidative stress rates (OCR) were measured in the Seahorse XF HS mini analyzer and converted to proton efflux rate (PER) using the WAVE Pro software. The first three measurements show basal respiration, followed by injection of Rot/AA and 2-DG after the third and sixth measurement, respectively. The data are expressed as mean ± SD of two independent experiments in triplicate. Right: Measures of basal and compensatory glycolysis calculated from the OCR traces (mean ± SD of two independent experiments; ****p < 0.001, Tukey’s multiple comparisons test). Dotted lines indicate the time-point of compound injection. Rot, Rotenone; AA, antimycin A; 2-DG, 2-deoxy-D-glucose.
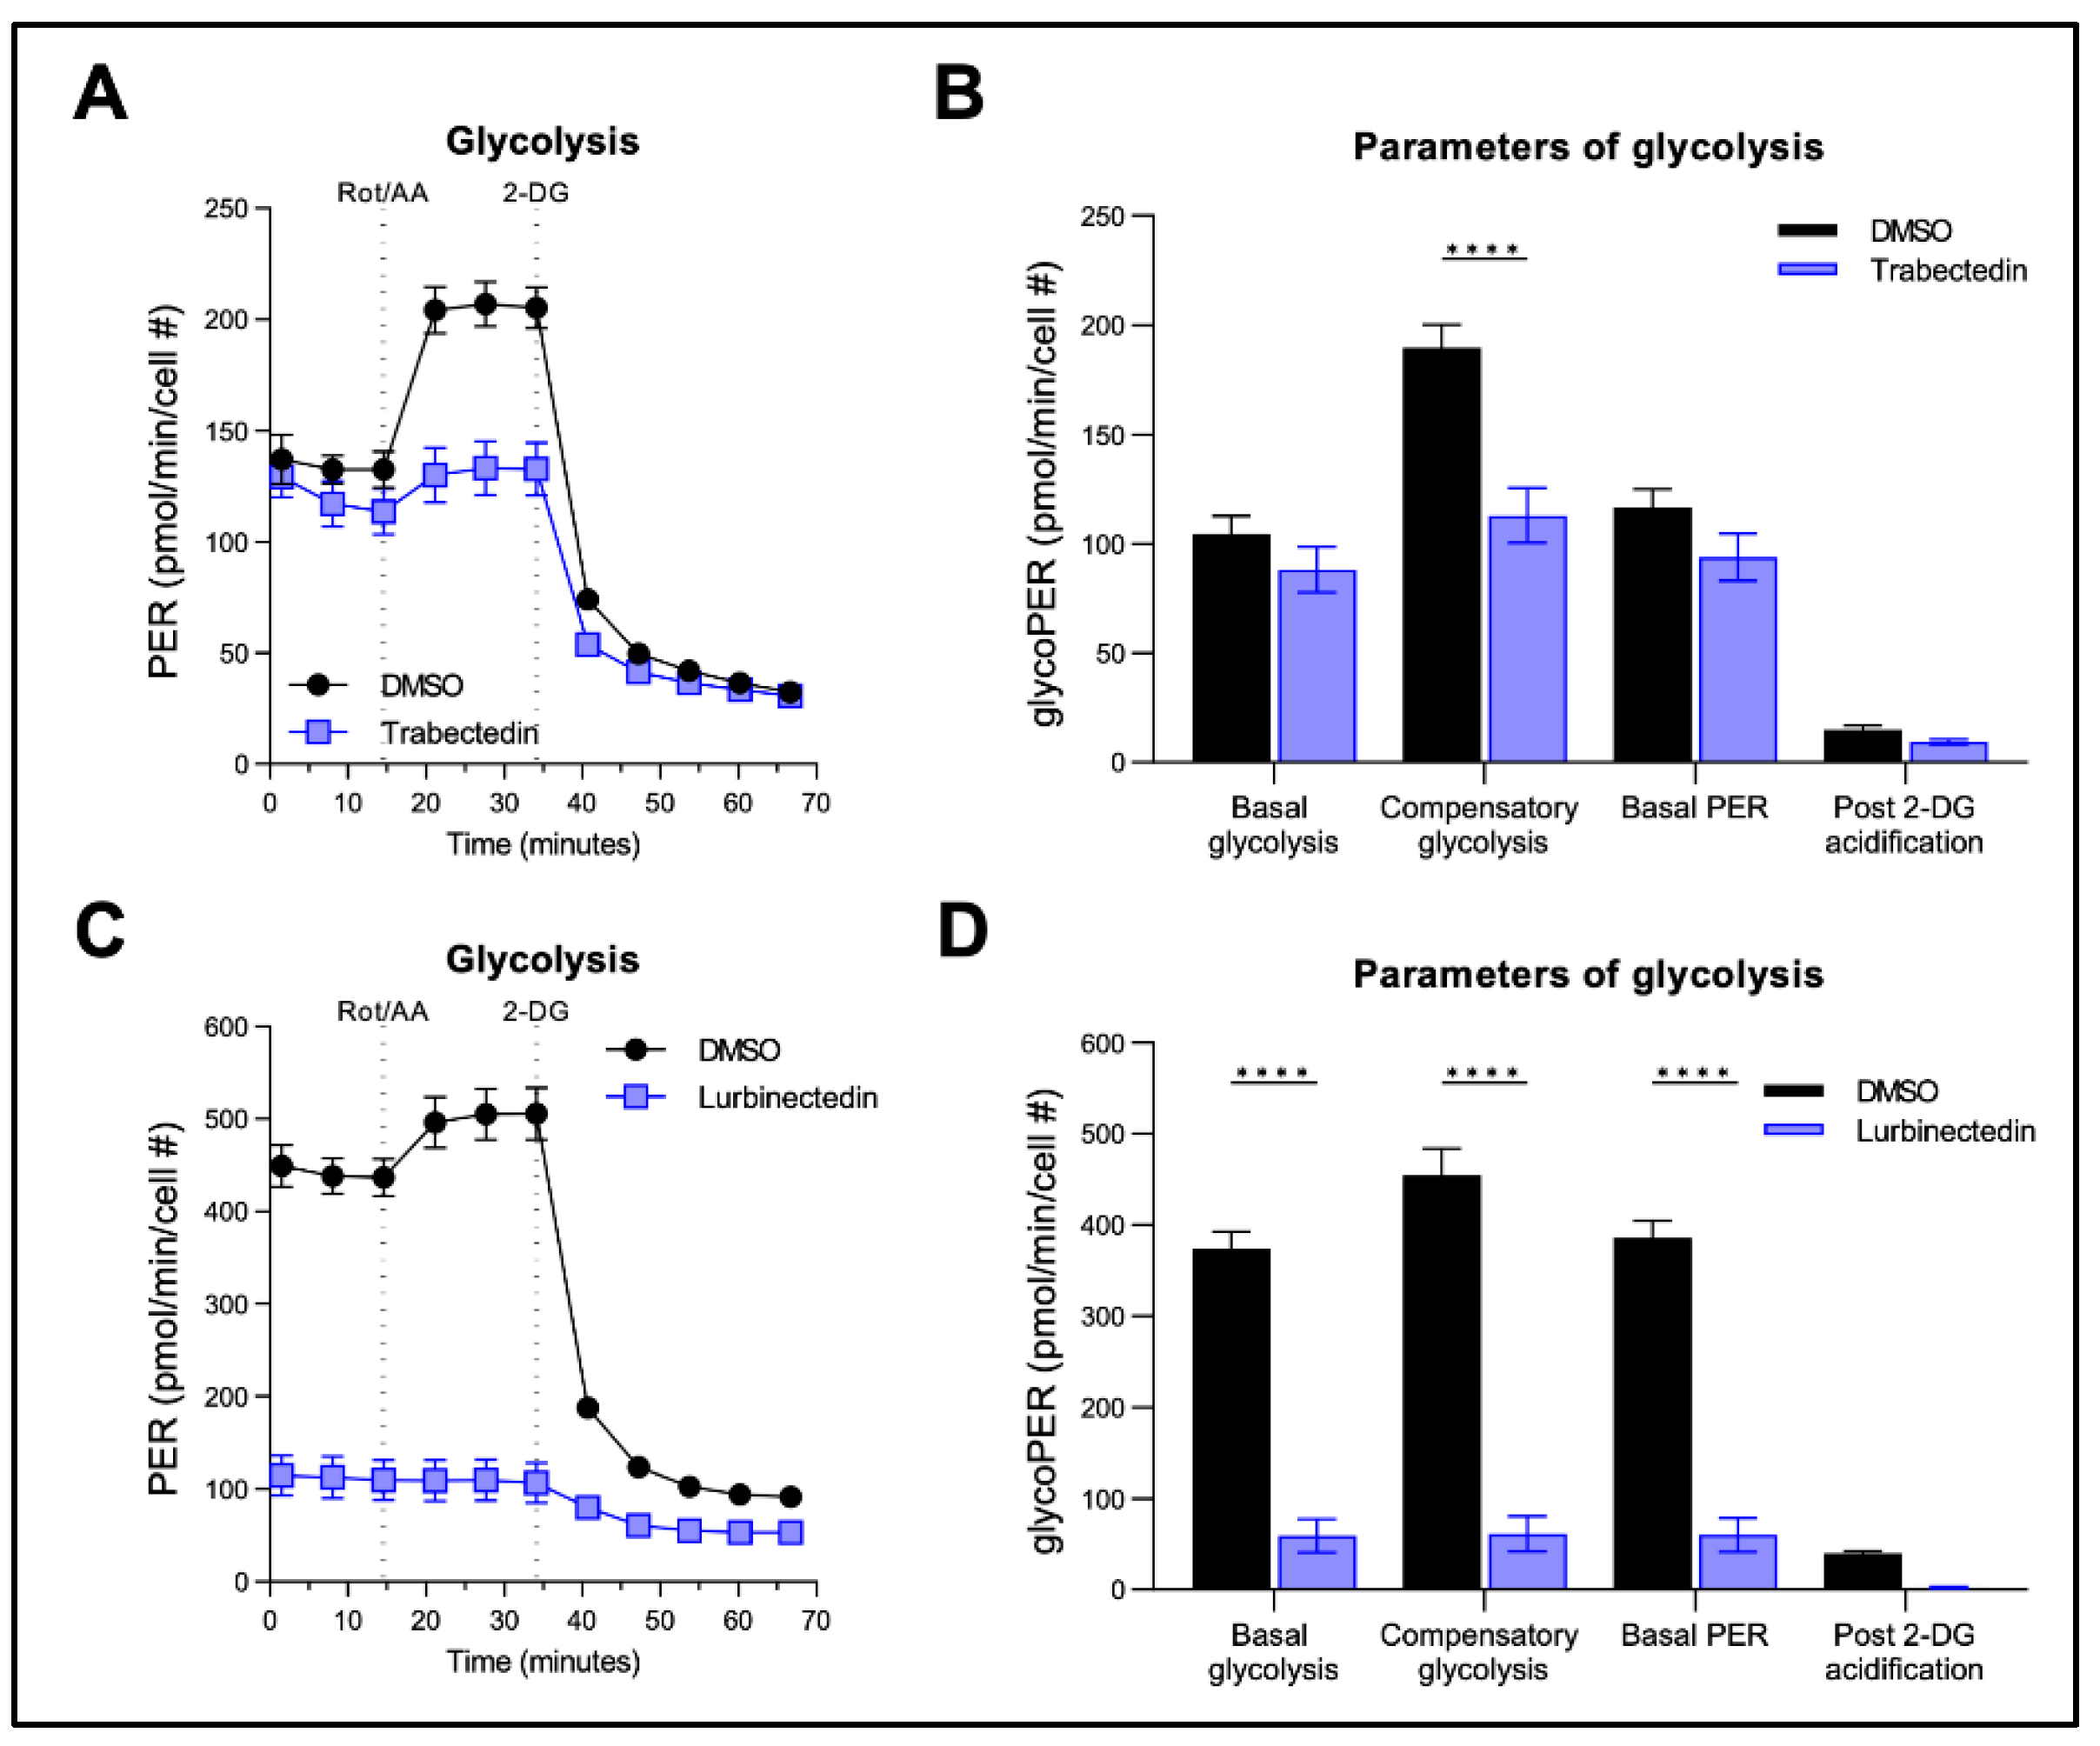
Figure 8.
Trabectedin and Lurbinectedin severely alter the ultrastructural morphology of intrahepatic cholangiocarcinoma cells. Representative results for the analysis of cell morphology via transmission electron microscopy. KKU055 cells were treated with Trabectedin or Lurbinectedin 1nM and compared to a DMSO control. (A) DMSO control, whole cell. (B) Trabectedin-treated, whole cell. (C) DMSO control, mitochondria. (D) Trabectedin-treated-mitochondria. The orange arrow indicates mitochondria, whereas the blue arrow shows the fine line separating two cells. Hollow spaces are highlighted with a green arrow. Marked with a pink arrow are mitochondria in the Trabectedin-treated cells, which appear swollen. The yellow arrow indicates irregularities in cristae and the density of mitochondrial matrix. The brown arrow highlights black dots, suggesting possible calcium aggregation. (E) DMSO control, whole cell. (F) Lurbinectedin-treated, whole cell. (G) DMSO control, mitochondria. (H) LUR, mitochondria. The orange arrow indicates mitochondria, while the green arrow highlights hollow spaces, which are strikingly enlarged in the Lurbinectedin-treated cell. The loss of membrane integrity and the leakage of cell contents in the Lurbinectedin-treated cell are marked with purple arrows. Highlighted with pink arrows are mitochondria, which are swollen. Exemplary representative images (A), (B), (E), and (F) are shown at 5.000x magnification. Scale bar = 5 µm. Exemplary representative images (C), (D), (G), and (H) are shown at 40.000x magnification. Scale bar = 1 µm.
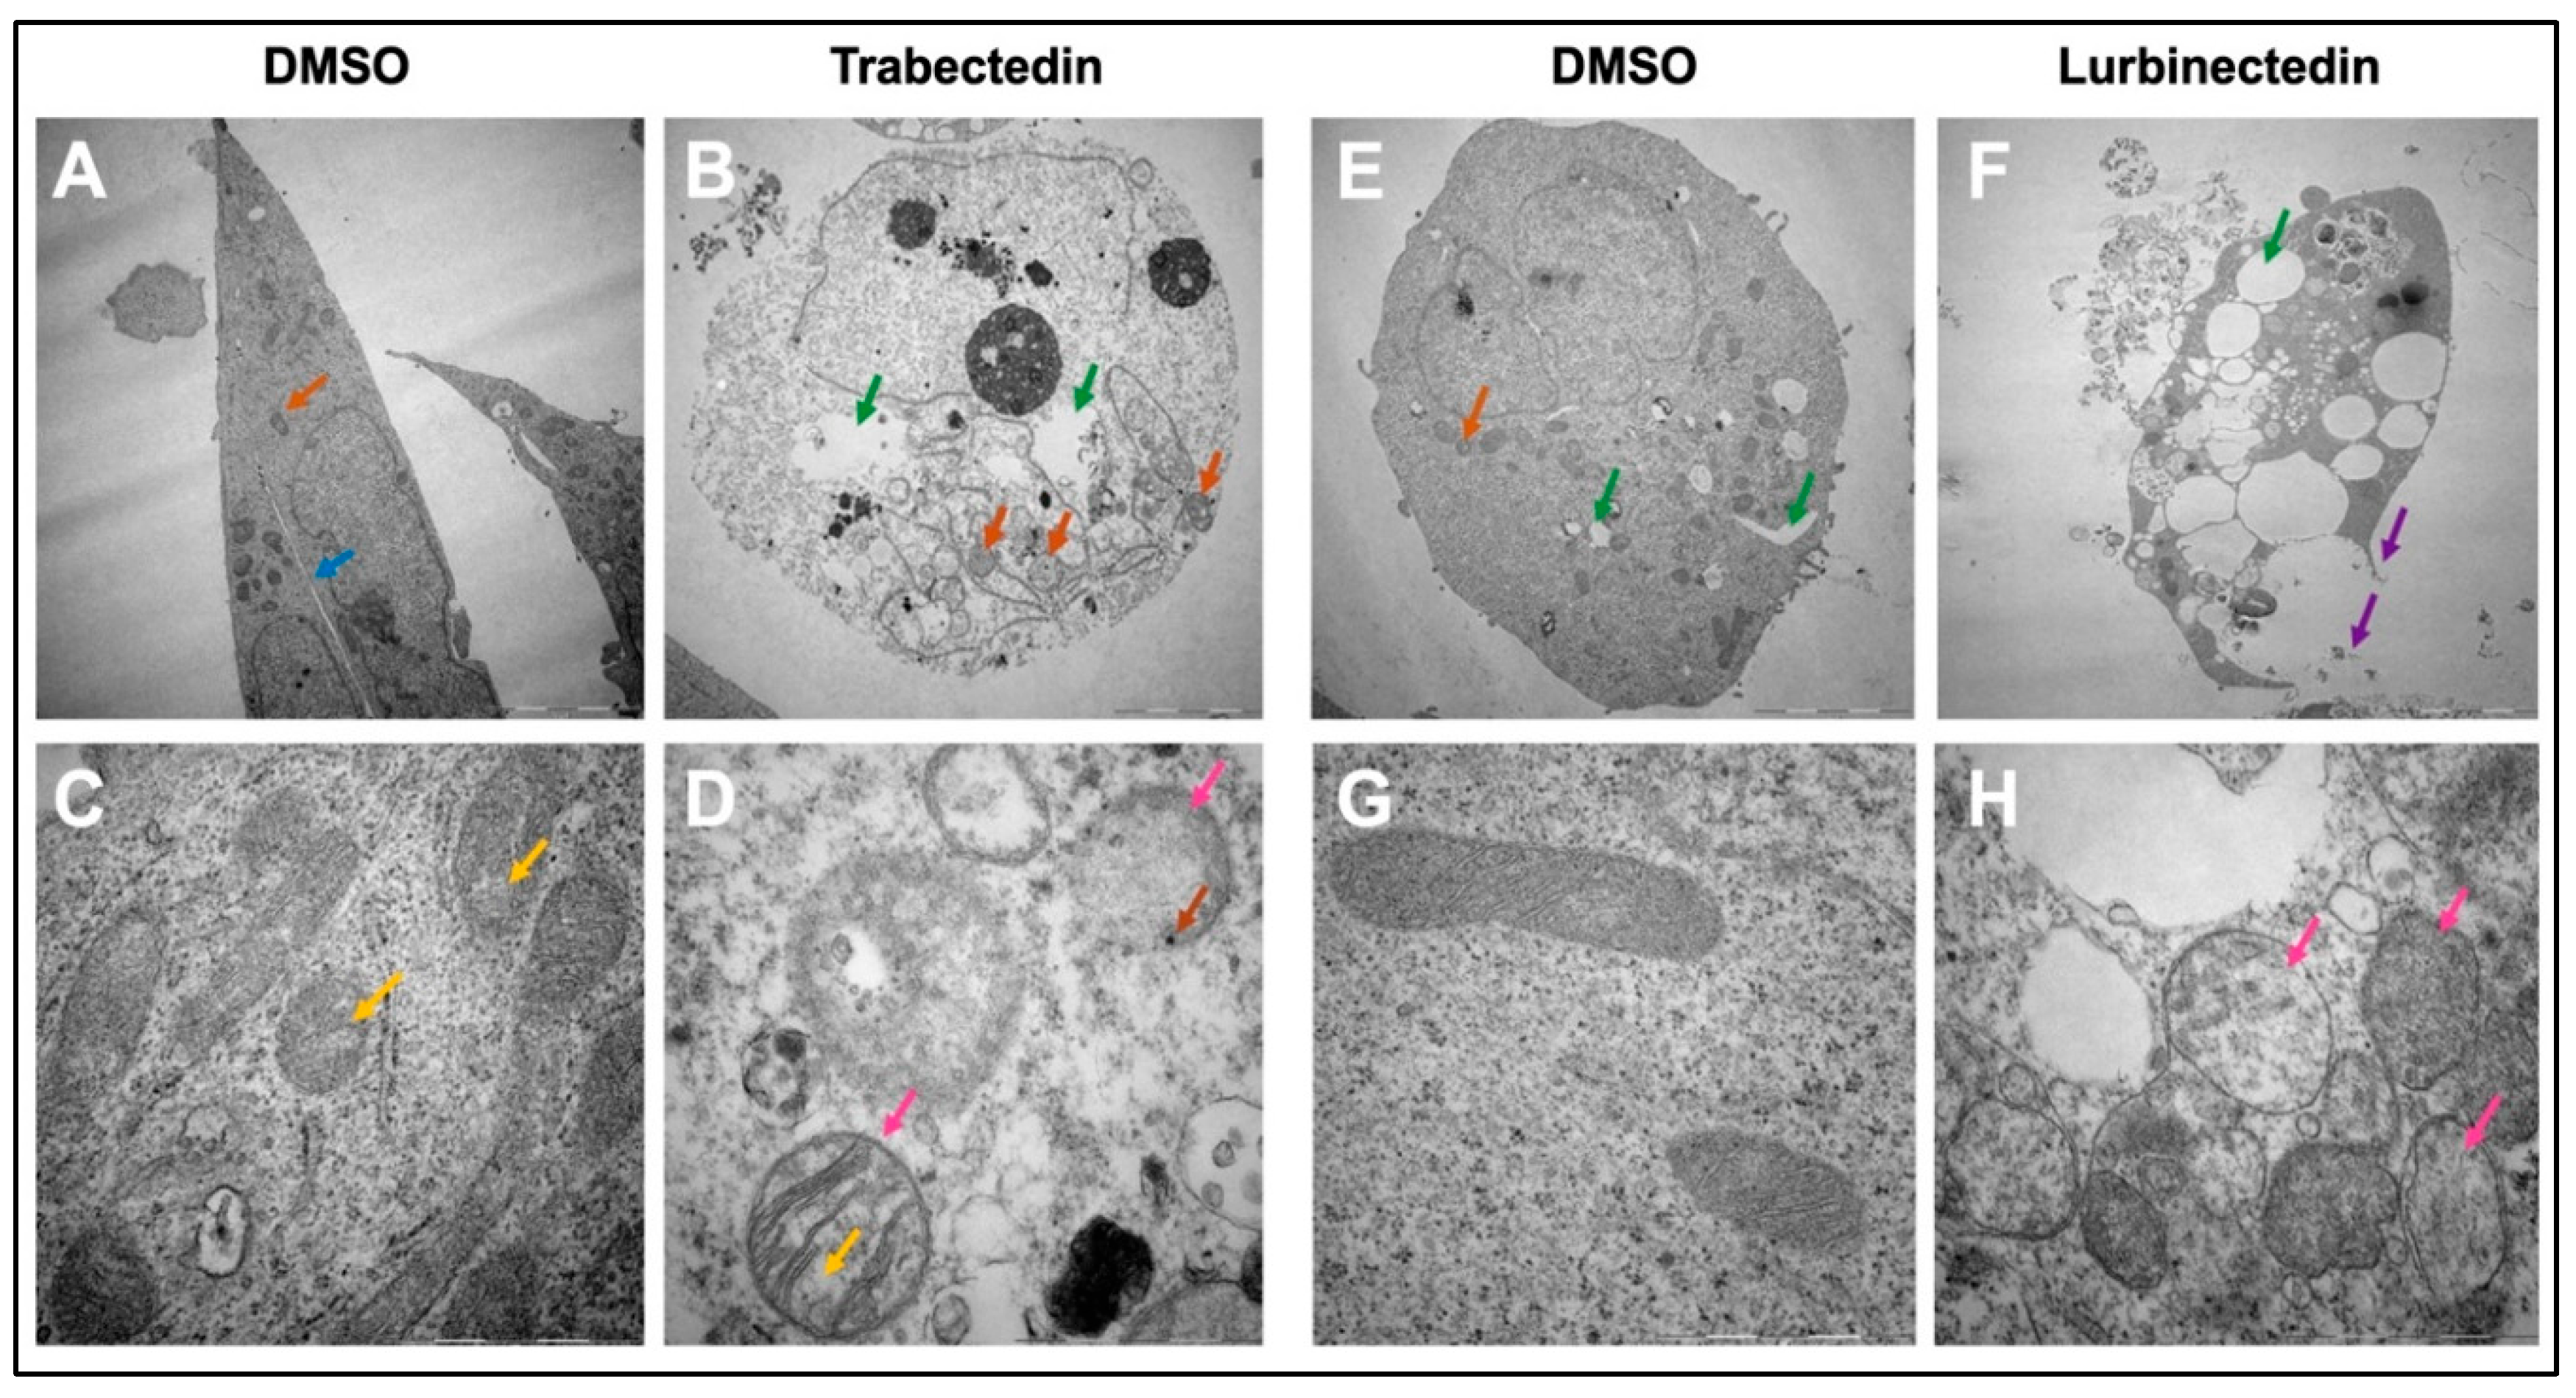
Figure 9.
Effects of Trabectedin and Lurbinectedin on the viability and growth of patients’ derived intrahepatic cholangiocarcinoma organoids. (A) Cell viability assay (MTT) of PDO1, PDO2, and PDO3 patient’s derived organoids (PDOs) treated for 5 days with increasing concentrations of Trabectedin and Lurbinectedin (0.125, 0.25, 0.5, 1, and 2 nM). Organoids treated with solvent (DMSO) served as controls. Results are expressed as mean ± SD of three independent experiments in triplicate. For statistical analysis, Tukey’s multiple comparisons test was performed; at least p < 0.001; a, vs. DMSO, b, vs. 0.125 nm TRB/LUR; c, vs. 0.25 nM TRB/LUR; d, vs. 0.5 nM TRB/LUR; e, vs. 1 nM TRB/LUR. Abbreviations: LUR, lurbinectedin; TRB, trabectedin. (B,C) Microscopic images demonstrate that treatment with Trabectedin and Lurbinectedin resulted in a reduction of the compact, well-organized structure of the organoids, evidenced by the loss of the typical cystic shape associated with cholangiocarcinoma organoids. The PDO22 (upper panels) and PDO28 (lower panels) are shown. Representative brightfield (BF) images (10× magnification) of PDOs are reported.
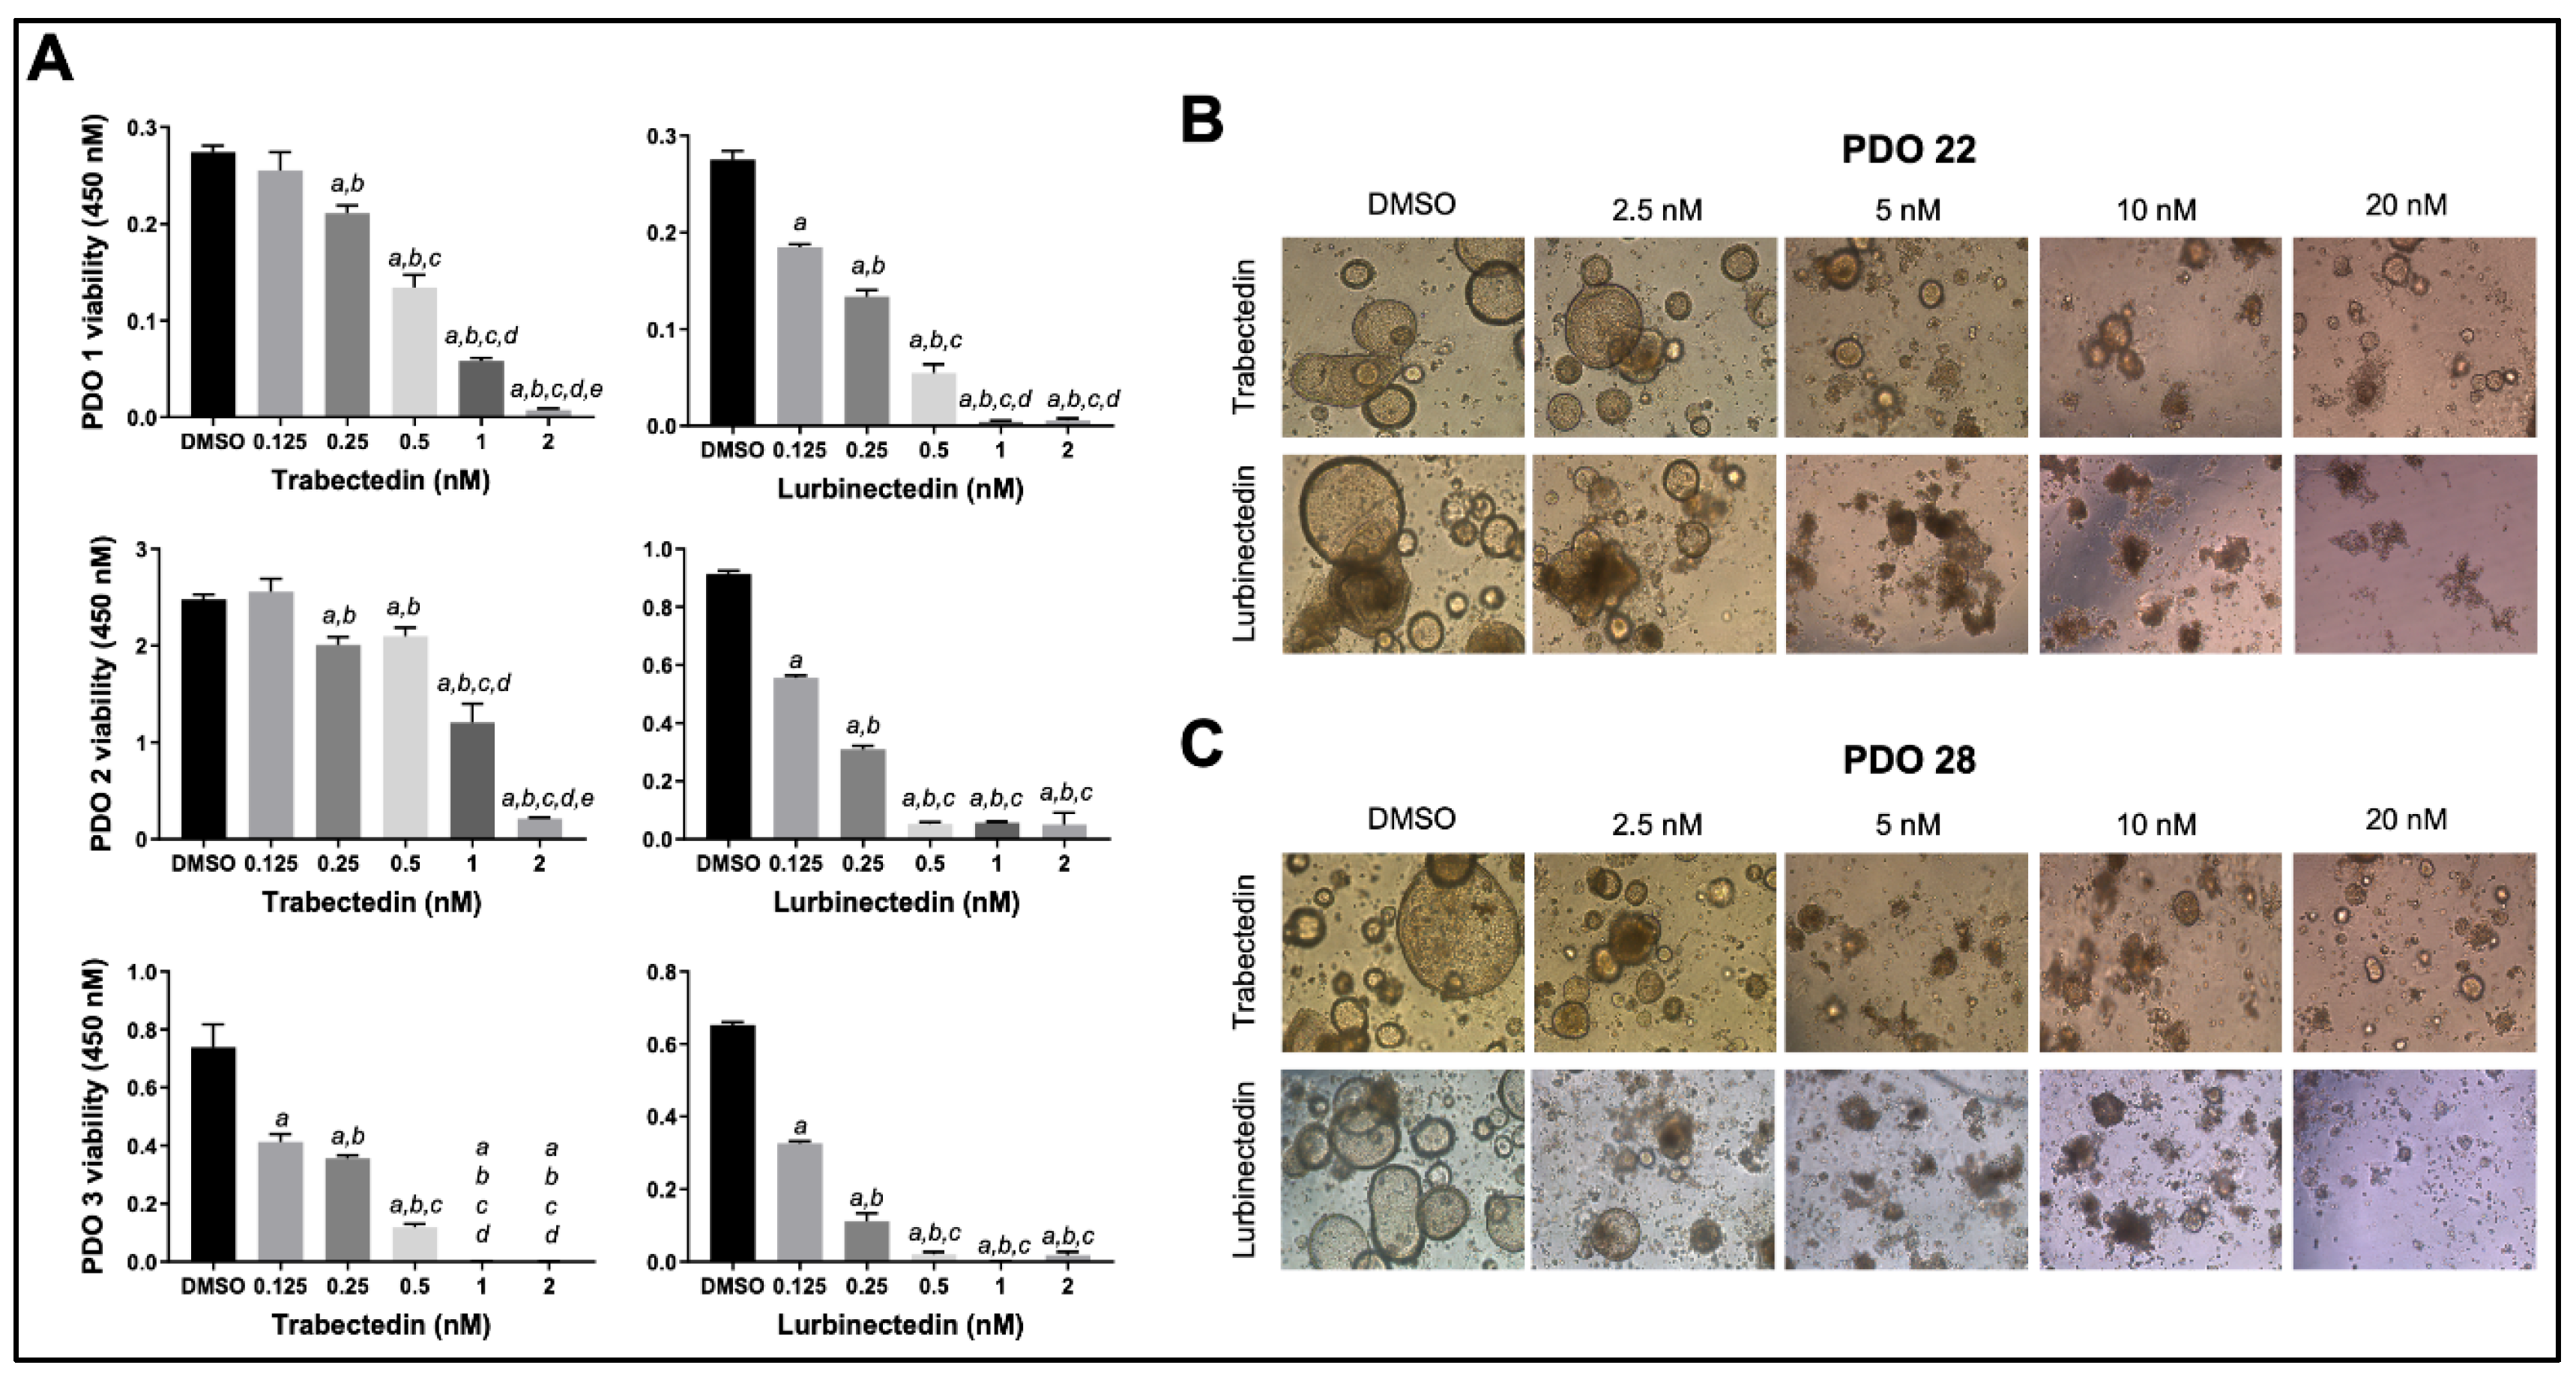
Figure 10.
Trabectedin and Lurbinectedin restrain the growth of intrahepatic cholangiocarcinoma human cancer-associated fibroblasts (hCAFs). Decrease of iCCA hCAF viability following Trabectedin (A) or Lurbinectedin (B) administration. The effect of increasing Trabectedin and Lurbinectedin concentrations (ranging from 0,5 to 2 nM) on the viability of iCCA hCAFs, grown for 24, 48, and 72 h in culture medium supplemented with 10% FBS is shown. Experiments were conducted twice in triplicate. At least p < 0.001 calculated with One-way ANOVA test; a, vs. DMSO; b, vs. 0.5 nM TRB/LUR; c, vs. 1 nM TRB/LUR. Original magnification: 10x; scale bar: 100 µm.
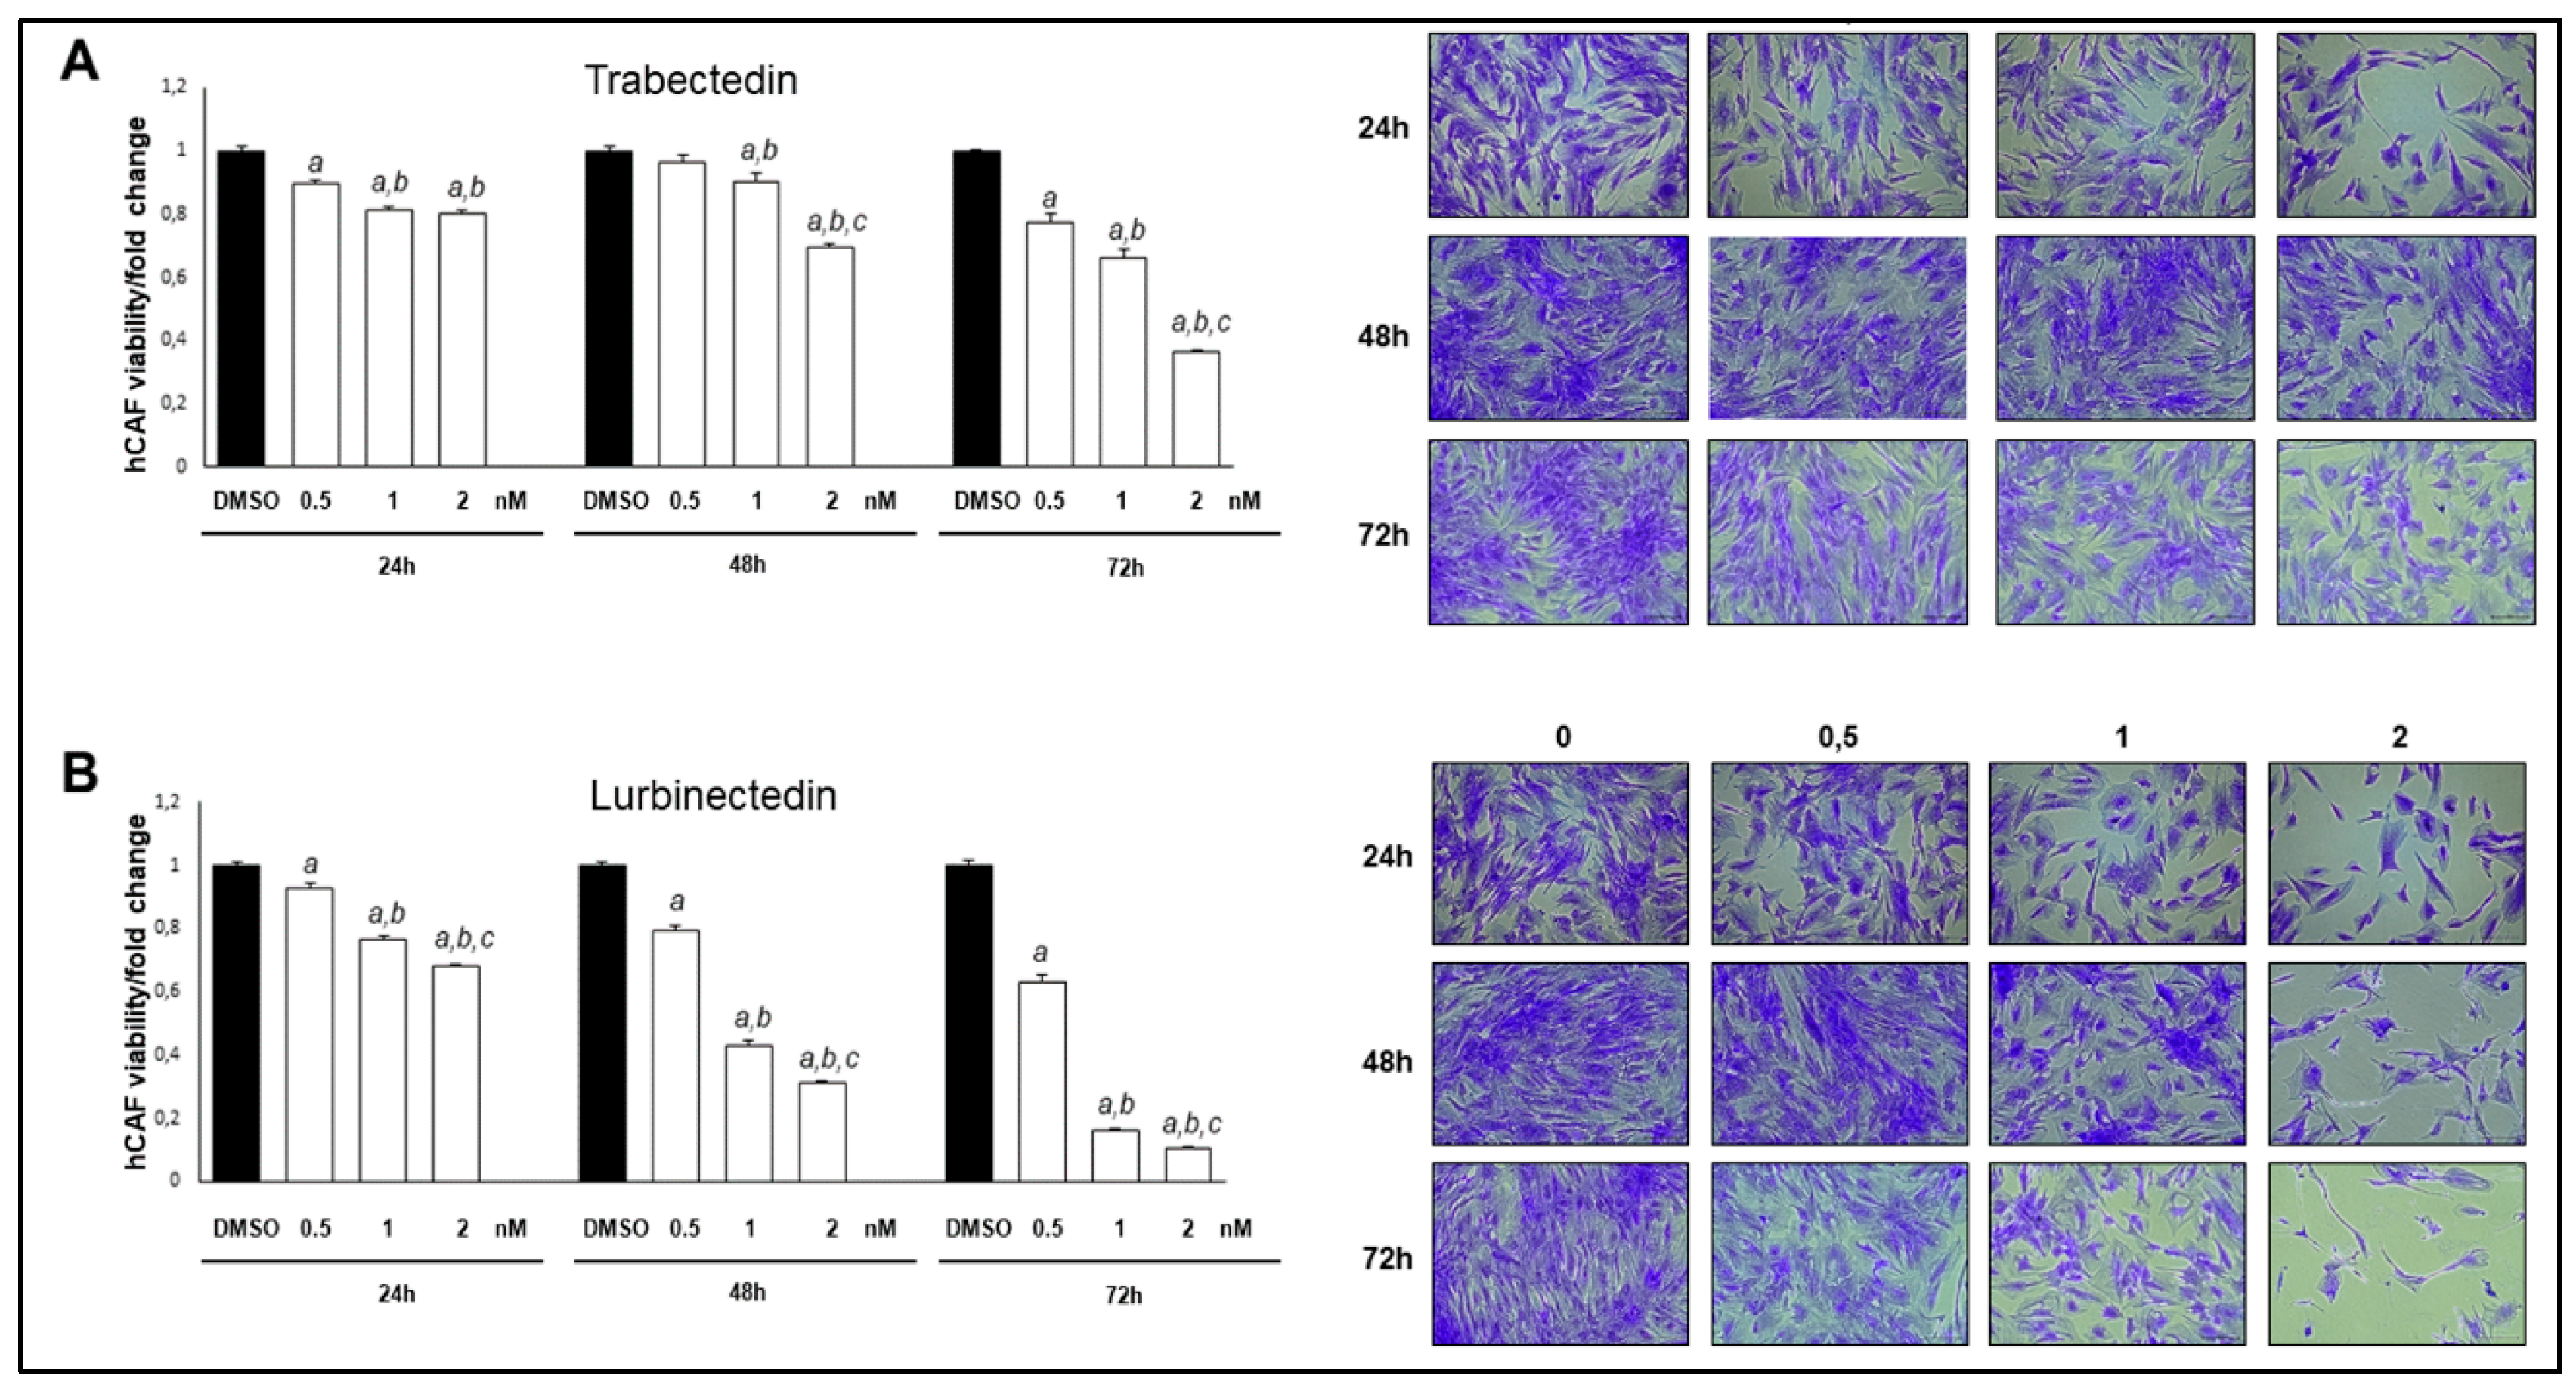
Figure 11.
Lurbinectedin reduces growth of CCLP1 intrahepatic cholangiocarcinoma cells in the chicken corioallantoic membrane (CAM) in vivo model. (A) CAM assay scheme. The implanted tumor cells are indicated by a red arrow. Tumors were treated either with DMSO or 40 nM Lurbinectedin. (B) Mean tumor volumes. DMSO (n=11) and Lurbinectedin-treated (n=14). Student’s t test: *p < 0.01, **p < 0.001. (C) Representative ex ovo macroscopic images of xenograft tumors treated with DMSO or with Lurbinectedin. (D) Representative images of H&E, MTC09, and Ki-67 stained paraffin sections of CAM tumors. Original magnification: 20x; scale bar: 500 µm. Abbreviation: H&E, hematoxylin and eosin staining.
Disclaimer/Publisher’s Note: The statements, opinions and data contained in all publications are solely those of the individual author(s) and contributor(s) and not of MDPI and/or the editor(s). MDPI and/or the editor(s) disclaim responsibility for any injury to people or property resulting from any ideas, methods, instructions or products referred to in the content. |
© 2025 by the authors. Licensee MDPI, Basel, Switzerland. This article is an open access article distributed under the terms and conditions of the Creative Commons Attribution (CC BY) license (http://creativecommons.org/licenses/by/4.0/).
Copyright: This open access article is published under a Creative Commons CC BY 4.0 license, which permit the free download, distribution, and reuse, provided that the author and preprint are cited in any reuse.


