Submitted:
18 July 2025
Posted:
21 July 2025
You are already at the latest version
Abstract
Propofol is well-known for its inhibitory effects in the central nervous system (CNS) as an intravenous anesthetic. Less is known about propofol's impact on microglial activity. Studies have suggested a link to the endocannabinoid system (ECS). Propofol has been shown to indirectly modulate cannabinoid type 1 (CB1R) and type 2 (CB2R) receptors on microglia, with CB2R playing a key role in regulating anti-inflammatory immune responses. The objective of this study was to evaluate potential anti-inflammatory effects of propofol on microglia and to determine whether any observed effects are associated with the ECS. To investigate this, we treated LPS-stimulated SIMA9 microglial cells with propofol, both in the presence and absence of antagonists for CB2R and CB1R, and assessed the cell viability and the production of the cytokines TNF and IL-6. The results demonstrated that cell viability was stable at propofol concentrations of 20, 40, and 80 µM. Production of TNF and IL-6 was reduced significantly upon propofol treatment. This effect of cytokine production did not change following administration of CB1R and/or CB2R antagonists. In conclusion, the results demonstrated that propofol exhibits anti-inflammatory effects, which do not appear to be mediated through ECS activation.
Keywords:
inflammation
; microglia
; endocannabinoid system
; propofol
1. Introduction
Microglia typically originate from erythromyeloid progenitors found in the yolk sac during early embryogenesis and migrate to the central nervous system (CNS) occurs early in fetal development [1]. Under normal conditions, in a state of homeostasis, the microglial population is long-lived and sustained through slow, localized proliferation without external input. However, in disease states, microglia can rapidly proliferate clonally [2]. Furthermore, as the primary producers of proinflammatory cytokines, microglia are pivotal mediators of neuroinflammation and have the ability to induce or modulate a wide range of cellular responses [3]. Following a pathological condition, the polarization of microglia to either a pro-inflammatory (M1) or anti-inflammatory (M2) state can significantly influence the outcome [4]. The excessive activation of M1 microglia during a pathological condition contributes to creating an overly inflammatory environment in the affected brain region, resulting in neuronal injury and neurodegeneration [5,6,7,8]. Therefore, regulating microglial activation is crucial for reducing inflammation during CNS medical conditions [6,7].
The endocannabinoid system (ECS) is integral to the development of the nervous system, ensuring proper neural formation and function. In the mature nervous system, the ECS regulates neuronal activity and network function [9]. The ECS comprises endogenous cannabinoids, cannabinoid receptors, and the enzymes responsible for the synthesis and degradation of endocannabinoids. Endogenous cannabinoids (eCBs) are signaling lipids that activate cannabinoid specific receptors. Among the agonists, 2-arachidonoyl glycerol (2-AG) and anandamide (AEA [N-arachidonoyl ethanolamine]) are the most well-characterized eCBs. Endocannabinoid signaling is often terminated by hydrolyzing the arachidonic group from either glycerol (2-AG) or ethanolamine (AEA). In the CNS, 2-AG is predominantly hydrolyzed by enzymes such as monoacylglycerol lipase (MAGL) or alpha/beta-hydrolase domain containing 6 (ABDH6) [10]. Conversely, fatty acid amide hydrolase (FAAH) primarily degrades AEA, effectively terminating its activity [11]. In terms of receptors, cannabinoid type 1 receptor (CB1R) and cannabinoid type 2 receptor (CB2R) are the cannabinoid receptors [9]. Both receptors are G protein–coupled receptors (GPCRs) that primarily couple with inhibitory G proteins. The expression of CB1R on oligodendrocytes, oligodendrocyte precursors, and microglia is significantly lower, and their physiological roles are still being elucidated. CB2R are mainly found in cells of immune origin, including microglia, though they may also be present in neurons, especially under pathological conditions. Activation of the CB2R in microglia typically leads to anti-inflammatory effects [12]. It has been documented that CB2R activation in microglial cells results in the upregulation of M2 markers, effectively suppressing the expression of proinflammatory cytokines such as IL-1β, IL-6, and iNOS, while concurrently upregulating anti-inflammatory cytokines, such as IL-10 [12]. Furthermore, inhibiting eCB-degrading enzymes can enhance eCB signaling by elevating the levels of endogenous ligands, further contributing to reducing inflammation [12]. This anti-inflammatory effect is achieved by downregulating proinflammatory cytokines, such as TNF, and upregulating anti-inflammatory cytokines, like IL-10 [12]. Nonetheless, the impact of this inhibition on microglial polarization remains uncertain [12].
Propofol (2,6-diisopropylphenol) is an intravenous anesthetic widely used in clinical practice, known to have anti-inflammatory properties in CNS pathological conditions via modulating the activation of microglia [8,13]. Propofol exerts protective and anti-inflammatory effects in CNS pathological conditions through a variety of mechanisms of action, such as maintaining mitochondrial function, reducing oxidative stress, decreasing excitotoxicity, preventing calcium overload, modulating programmed cell death, and promoting neurological recovery [14]. In a study intended to describe the activity of propofol, they determined that propofol acts as a competitive inhibitor of the anandamide-degrading enzyme, FAAH, which correlates with the observed increase in brain anandamide levels [15]. Additionally, they showed that propofol administration caused a variable increase in brain 2-AG content [15]. This is consistent with data indicating that 2-AG is a substrate for FAAH in vitro, although other brain processes, such as the enzyme MAGL, also inactivate 2-AG [15]. The unchanged metabolism of 2-AG in FAAH knockout mice suggests that propofol may inhibit MAGL or another metabolic pathway, leading to the observed increase in 2-AG levels [15].
While propofol has been well-documented for protective and anti-inflammatory effects in various CNS pathological conditions, there remains a significant gap in research regarding its impact on microglial activity through the ECS. Specifically, no studies have yet explored how propofol might modulate the endocannabinoid signaling pathways to exert its anti-inflammatory effects in microglial cells. Our hypothesis was that propofol primarily modulates microglia by activating the CB2R. To validate this hypothesis, we treated LPS-stimulated SIM-A9 (microglial) cells with antagonists for both CB2R (AM630) and CB1R (AM281) to observe the changes in microglial viability and production of the cytokines TNF and IL-6 when the cells were treated with and without propofol.
2. Results
2.1. Viability
A cell viability assay was first conducted on microglial cells exposed to increasing concentrations of propofol. The findings revealed no significant effect on microglia viability at propofol concentrations ranging up to 40 μM; however, a pronounced decline in cellular viability was observed at higher concentrations, 80 μM, 160 μM and 320 μM (Figure 1a). Microglial viability was also assessed following treatment with propofol (0-320 μM) along with LPS challenge. A substantial and significant decrease in cellular viability was observed at higher concentrations of 160 μM and 320 μM propofol combined with LPS (Figure 1b). When CB1R was blocked using AM281, the results demonstrated a slight, statistically insignificant increase in microglial viability at propofol concentrations of 20 μM and 40 μM (Figure 1c). However, a pronounced and significant decline in microglial viability was observed at higher concentrations of 160 μM and 320 μM (Figure 1c). Similar results were observed when CB2R was blocked with its antagonist AM630 (Figure 1d). No difference was observed when both receptors were blocked concurrently (Figure 1e).
2.2. TNF Release
ELISA assays were conducted to evaluate the effect of propofol on TNF release in SIM-A9 microglial cells under various treatment conditions. Initially, cells were treated with four graded concentrations of propofol to assess its isolated impact on TNF production. The results demonstrated that propofol alone did not induce TNF release at any tested concentration, confirming that it does not intrinsically trigger proinflammatory cytokine production (data not shown). To determine whether propofol modulates TNF production under inflammatory conditions, microglia were co-treated with LPS and increasing concentrations of propofol. LPS alone induced robust TNF release, whereas the addition of propofol significantly reduced TNF levels across all concentrations (Figure 2a). Next, the role of cannabinoid receptors in this anti-inflammatory effect was investigated. When CB1R was blocked using AM281, the suppressive effect of propofol on LPS-induced TNF production persisted, with significantly reduced TNF levels observed at all propofol concentrations (Figure 2b). Similarly, blocking CB2R with AM630 did not abolish propofol’s effect; TNF production remained markedly lower in propofol-treated cells compared to those treated with LPS alone (Figure 2c). To examine whether simultaneous blockade of both CB1R and CB2R influences propofol's efficacy, microglia were treated with LPS, AM281, AM630, and propofol. Even under these conditions, propofol led to a significant reduction in TNF levels across all tested concentrations (Figure 2d).
2.3. IL-6 Release
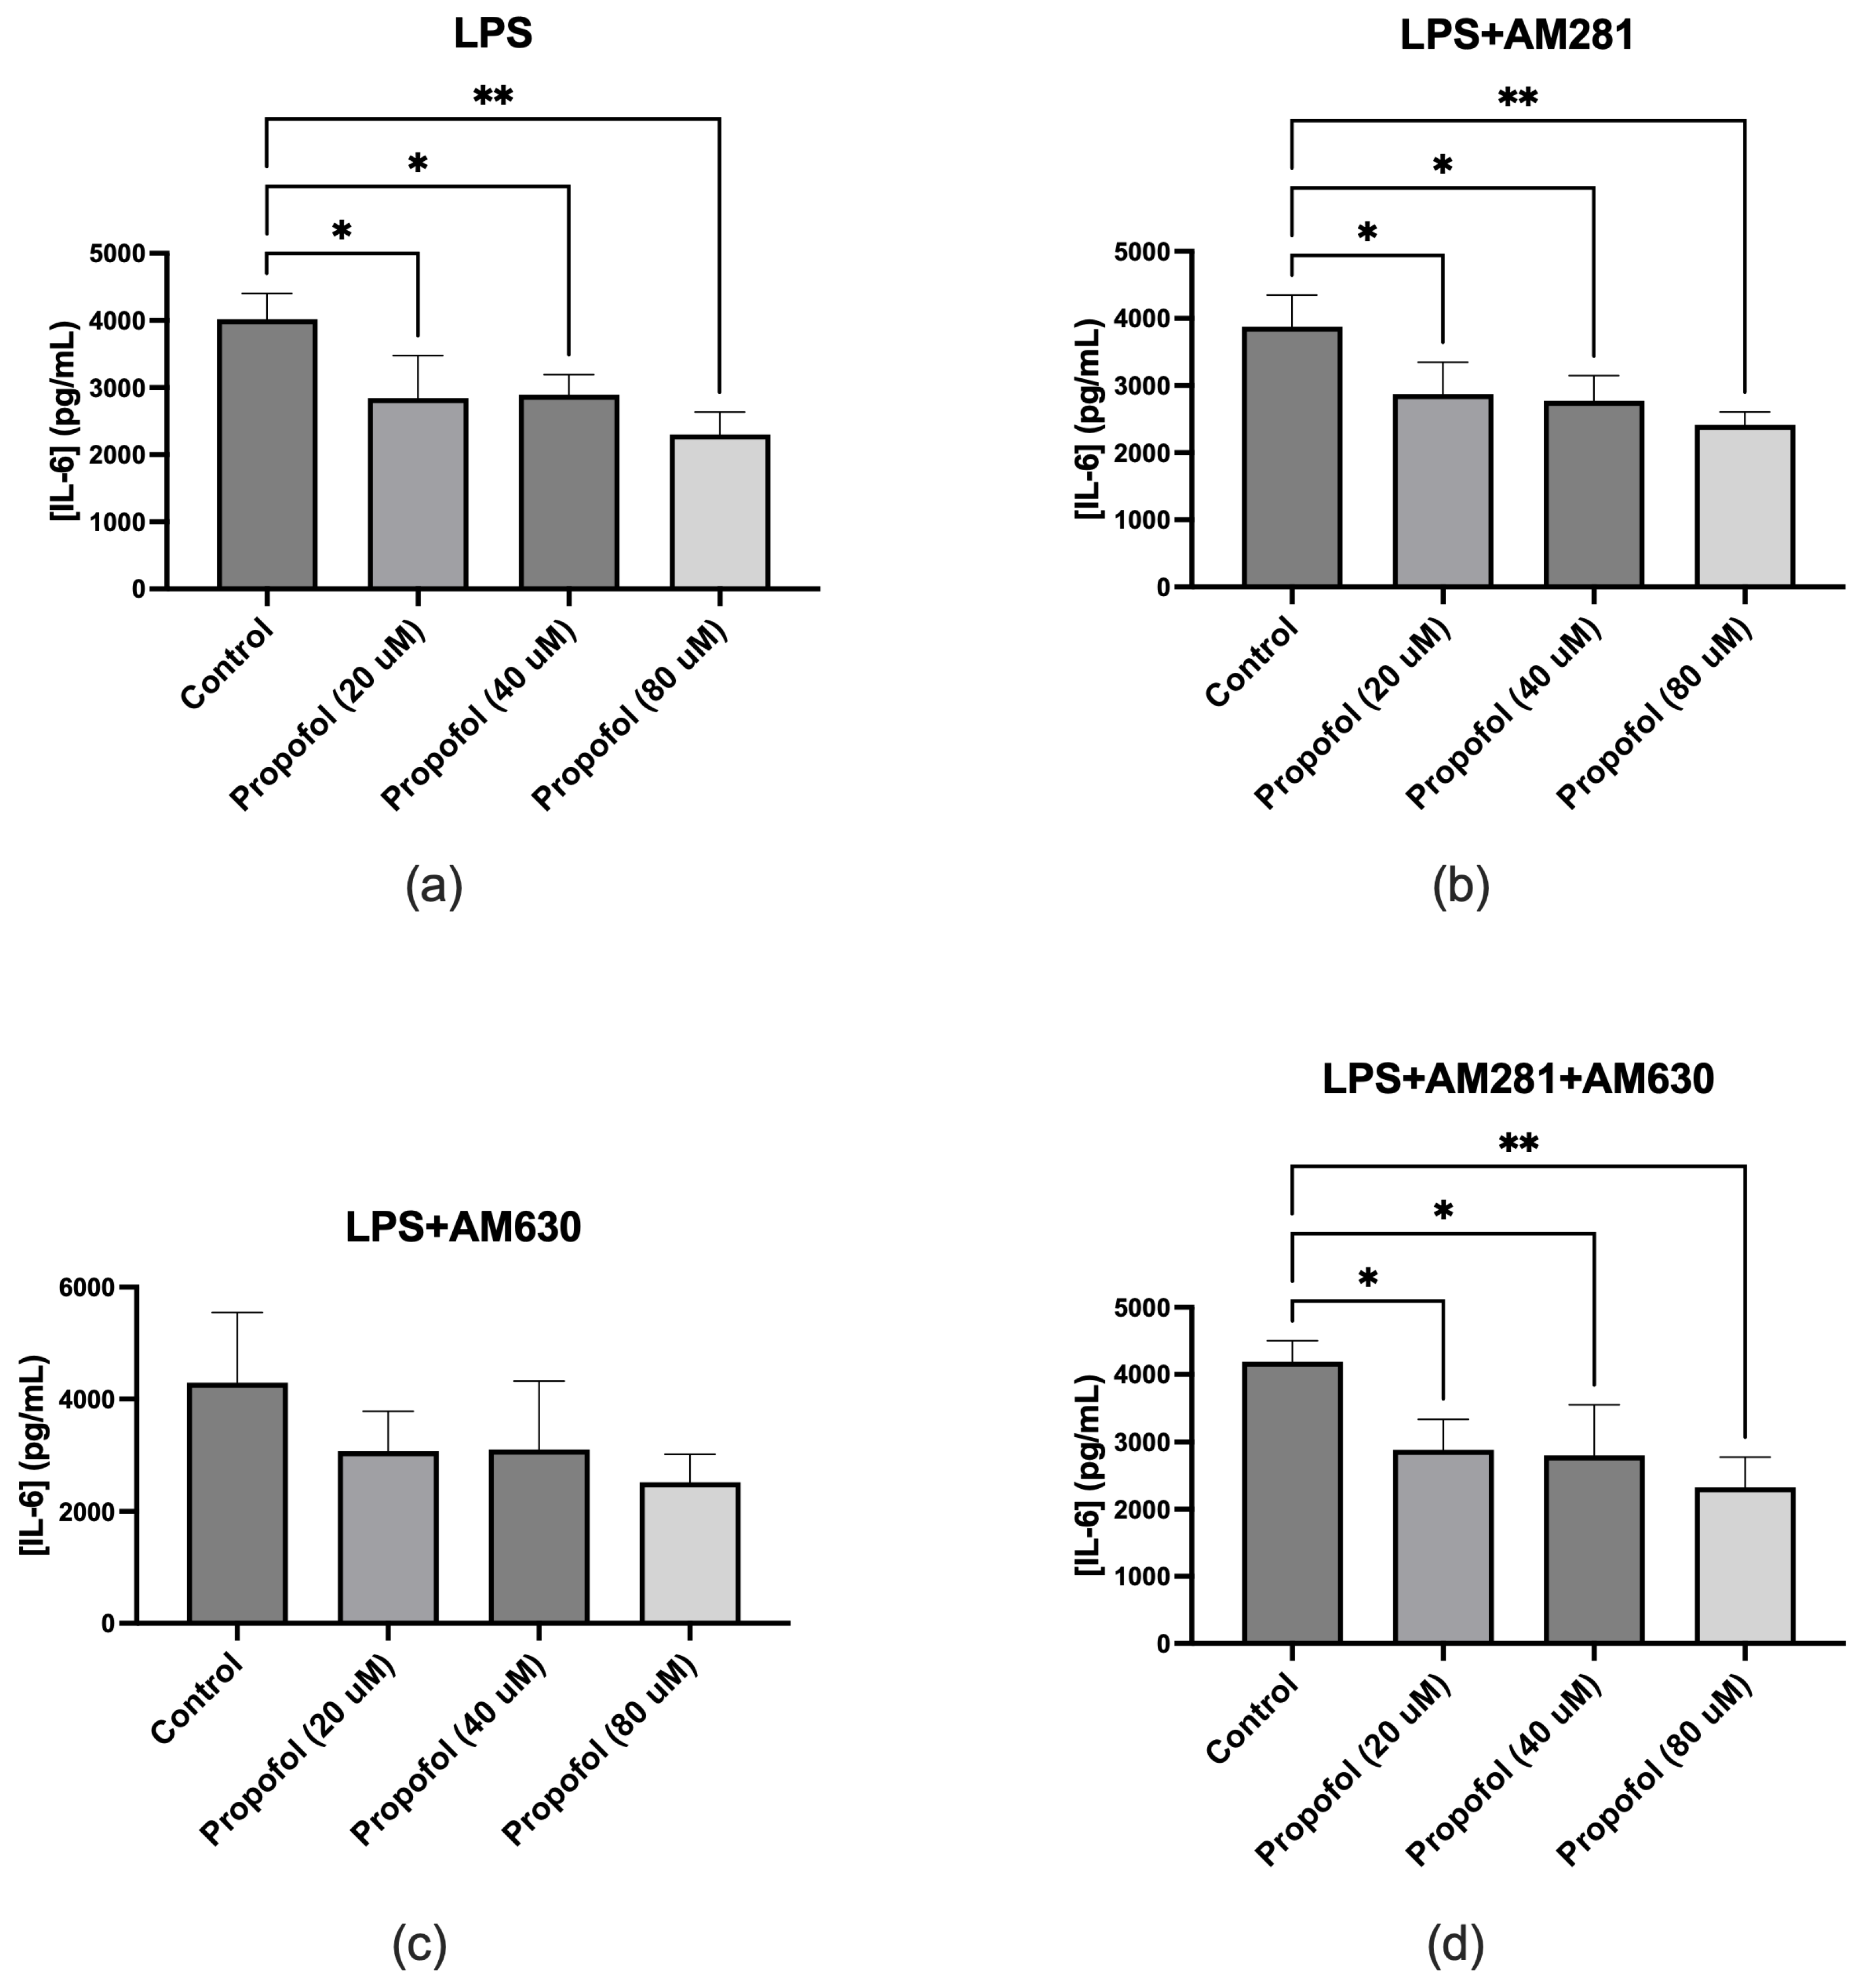
ELISA assays were conducted to evaluate the effect of propofol on IL-6 production in SIM-A9 microglial cells under various treatment conditions. To assess the independent impact of propofol, microglia were treated with four increasing concentrations of propofol without any additional stimuli. The results demonstrated that propofol alone did not induce IL-6 release at any tested concentration, confirming that it does not intrinsically trigger proinflammatory cytokine production (data not shown). To examine the anti-inflammatory potential of propofol under inflammatory conditions, microglia were co-treated with LPS and varying concentrations of propofol. LPS stimulation significantly increased IL-6 release, whereas co-treatment with propofol led to a significant reduction in IL-6 levels across all concentrations tested (Figure 3a). The role of cannabinoid receptors in this response was then investigated. In the presence of the CB1R antagonist AM281, propofol continued to significantly reduce IL-6 production, indicating that CB1R does not mediate this effect (Figure 3b). When CB2R was inhibited using AM630, a reduction in IL-6 release was still observed with propofol treatment; however, this decrease did not reach statistical significance (Figure 3c). Furthermore, when both CB1R and CB2R were concurrently blocked using AM281 and AM630, propofol still elicited a significant decrease in IL-6 levels across all tested concentrations (Figure 3d).
3. Discussion
The results of cell viability demonstrate that propofol is safe in concentrations up to 80 μM. This is consistent with previous studieswhere propofol did not significantly impact BV-2 microglial cell viability at concentrations ranging from 1 to 100 μM. However, at 300 μM, cell viability decreased by approximately 81%, indicating cytotoxicity at this high dose [16].
The TNF ELISA results revealed that propofol significantly reduces TNF production in SIM-A9 microglial cells under inflammatory conditions induced by LPS. This anti-inflammatory effect persisted even when CB1R or CB2R were blocked individually or together, indicating that propofol’s suppression of TNF is not mediated by ECS activation. This suggests that propofol may exert its modulatory effects through alternative signaling pathways independent of cannabinoid receptor activation. Furthermore, the IL-6 ELISA results demonstrated that propofol significantly attenuates IL-6 release. This anti-inflammatory effect remained evident even with CB1R blockade. A decrease in IL-6 release was also observed with CB2R blockade, although it was not statistically significant, suggesting that propofol’s ability to reduce IL-6 release may be partially mediated through CB2R. However, when both CB1R and CB2R were blocked simultaneously, propofol still significantly reduced IL-6 production, reinforcing that its anti-inflammatory action may involve alternative signaling pathways. These findings support the view that propofol modulates inflammatory cytokine release through complex, possibly multifaceted regulatory systems beyond cannabinoid receptor activation. The anti-inflammatory effects of propofol through modulation of other cytokine pathways have been confirmed by multiple studies. In a study, propofol demonstrated significant anti-inflammatory effects in both in vitro and in vivo models of ischemia/reperfusion (I/R) injury [17]. Specifically, propofol treatment led to a marked reduction in the production of the proinflammatory cytokine IL-1β and a simultaneous increase in the anti-inflammatory cytokine IL-10. These changes were observed in hypoxia/reoxygenation-injured microglial cells and were associated with decreased microglial activation. The findings suggest that propofol modulates the inflammatory response by downregulating IL-1β and upregulating IL-10, thereby contributing to its neuroprotective effects. In another study, propofol was shown to reduce oxidative stress in CoCl₂-induced hypoxic BV2 microglial cells by significantly decreasing reactive oxygen species (ROS) production [18]. CoCl₂ exposure led to elevated ROS levels and reduced antioxidant activity, including diminished superoxide dismutase (SOD) activity and total antioxidant capacity (T-AOC). Propofol treatment reversed these effects by restoring SOD and T-AOC levels, thereby inhibiting ROS overproduction and subsequent inflammatory responses. This antioxidative action was associated with suppression of nuclear factor kappa B (NF-κB) activation and prevention of Hypoxia inducible factor-1α (HIF-1α) stabilization, ultimately reducing proinflammatory signaling. Additionally, propofol improved mitochondrial membrane potential, further supporting its protective role against oxidative damage in microglial cells. Furthermore, in one study, propofol significantly reduced nitric oxide (NO) production in LPS-activated BV2 microglial cells, highlighting its anti-inflammatory potential [19]. The study demonstrated that propofol significantly reduces nitric oxide (NO) production in LPS-activated BV2 microglial cells. LPS stimulation alone caused a 5-fold increase in NO levels compared to the control. However, treatment with propofol at concentrations ranging from 12.5 to 100 μM inhibited this response in a dose-dependent manner. At the highest concentration (100 μM), propofol reduced NO production by approximately 46% during LPS challenge. These effects were consistent at both the transcriptional (iNOS mRNA) and translational levels.
As the anti-inflammatory effects of propofol through modulation of the ECS had not yet been investigated, this study is the first to examine whether propofol’s anti-inflammatory effects may be mediated via the ECS. The ECS is essential for managing microglial activity during neuroinflammation [20]. Under inflammatory conditions, microglia generally adopt a pro-inflammatory M1 state, releasing cytokines such as IL-1β, TNFα, and IL-6. Activating the ECS, especially via CB2R, mitigates this effect by encouraging a transition to the anti-inflammatory M2 state. This transition results in higher levels of anti-inflammatory markers like IL-10 and Arg-1. However, the findings of this study indicate that the anti-inflammatory effects of propofol, particularly its ability to suppress TNF and IL-6 production in microglial cells, are not solely dependent on CB1R or CB2R activation. While CB2R may play a partial role in mediating IL-6 reduction, the continued effectiveness of propofol in reducing both cytokines even when both cannabinoid receptors are blocked strongly suggests the involvement of alternative receptor-independent pathways in its anti-inflammatory mechanism.
This study has a few limitations that should be considered. First, the microglial cells used were obtained from female mice. Since research increasingly shows that immune responses, particularly within the central nervous system, can differ based on sex, it is possible that microglia from male mice might display varying activation patterns, cytokine release, or sensitivity to propofol and cannabinoid receptor antagonists. Future research should investigate whether these sex-related differences affect propofol's anti-inflammatory effects via the ECS. Second, only a single concentration (1 μM) of the cannabinoid receptor antagonists AM281 and AM630 was tested in this study. While this dosage was informed by previous studies, relying on one concentration restricts the ability to evaluate dose-dependent effects or explore whether higher or lower doses might produce different results. Future experiments using a broader range of antagonist concentrations could better elucidate receptor involvement and potential competitive binding. Finally, this study was conducted exclusively in vitro and has not yet been translated into human models. Although in vitro systems are valuable for exploring cellular mechanisms, they do not fully replicate the complex interactions of a living organism. Therefore, caution must be taken when generalizing these results to human physiology. Future studies involving human-derived microglia or clinical trials will be necessary to validate the relevance of these findings in the context of human neuroinflammation and anesthetic care. These limitations highlight important areas for future investigation that could improve the applicability and robustness of the findings.
4. Materials and Methods
4.1. Cell Culture and Maintenance
SIM-A9 female mouse microglia cells (ATCC, Cat# CRL-3265, Manassas, VA, USA) were removed from -80°C storage. A T25 tissue culture flask was prepared with 10 mL of pre-warmed complete growth medium (e.g., DMEM/F-12 supplemented with 10% fetal bovine serum and 1% penicillin-streptomycin) and placed in a humidified incubator at 37°C with 5% CO₂ to equilibrate. The frozen cell vial was rapidly thawed in a 37°C water bath, then transferred into the T25 flask containing pre-warmed medium. Cells were incubated for 24 hours after which the medium was replaced with fresh complete medium. Once cells reached approximately 80–90% confluence, the supernatant was transferred to a 50 mL conical tube, and 0.25% trypsin-EDTA was added to the flask. The flask was returned to the 37°C, 5% CO₂ incubator for 15 minutes to facilitate cell detachment. Any remaining attached cells were dislodged by gentle tapping and rinsing with fresh medium; the resulting cell suspension was combined with the previously collected supernatant and centrifuged at 1000 rpm, 4°C for 5 minutes. Cells were subsequently passaged in a 1:4 ratio until Passage 7 (P7).
4.2. Drug Preparations
Propofol (Thermo Scientific, Cat# L06841.14, Waltham, MA, USA) was prepared at final concentrations of 0, 20, 40, 80, 160, and 320 µM in serum-free medium (SFM). Lipopolysaccharide (LPS; Sigma-Aldrich, Cat# L2630, St. Louis, MO, USA) was used at 100 ng/mL, while the CB1R antagonist AM281 (Tocris Bioscience, Cat# 1115, Bristol, UK) and CB2R antagonist AM630 (Tocris Bioscience, Cat# 1120, Bristol, UK) were each used at 1 µM. All drug stocks were made in 100% DMSO; when diluted for final use, none of the treatment wells exceeded 0.5% DMSO. Control wells received only SFM, and vehicle-control wells received 0.5% DMSO (in SFM) without any active drug. Drug-treatment wells were prepared by mixing the appropriate volumes of each working solution in SFM just prior to application to cells, ensuring that the total DMSO concentration did not exceed 0.5%.
4.3. Plating, Treatment, and Sample Collection
Cells at Passage 7 were harvested for plating into 96-well plates. The supernatant was transferred to a 50 mL tube and the cell layer was incubated with 0.25% trypsin-EDTA at 37°C, 5% CO₂ for 15 minutes. After cell detachment, the suspension was again collected in the 50 mL tube and centrifuged at 1000 rpm, 4°C for 5 minutes. The pellet was resuspended in 1 mL of complete medium. A 1:50 dilution was prepared by adding 10 µL of the resuspended cells to 490 µL of complete medium; 10 µL of this diluted suspension was mixed with 10 µL of trypan blue or ink solution, and 10 µL of the mixture was transferred to a counting chamber. Cells were seeded in three 96-well plates (n=3) at a density of ~10,000 cells/well. Cells were then plated (150 µL/well) and incubated for 48 hours at 37°C, 5% CO₂ to allow attachment and recovery. After 48 hours, media from each well was aspirated and replaced with 150 µL of the respective treatment solutions. All treatments were performed in duplicate and the plates were incubated for another 24 hours. The plates were then centrifuged at 1000 rpm, 4°C for 5 minutes, and 100 µL of supernatant from each well was collected and stored at -80°C for subsequent TNF and IL-6 ELISA assays.
4.4. Viability Assay
Following supernatant collection, 10 µL of CCK-8 reagent (APExBIO, Cat# CK04, Boston, MA, USA) was added to each well and the plates incubated for 2 hours at 37°C with 5% CO₂. The absorbance of the formazan product in the centrifuged wells was measured at 450 nm using a microplate reader. Finally, the viability test results were calculated using the following formula:
As: Absorbance of treated wells.
Ab: Absorbance of blank wells.
Ac: Absorbance of control wells (SFM).
4.5. TNF and IL-6 ELISAs
TNF and IL-6 levels were measured using commercial ELISA kits (Thermo Fisher Scientific, Cat# 88-7324 for TNF and Cat# 88-7064 for IL-6, Waltham, MA, USA) according to the manufacturer’s protocols. Each supernatant sample was thawed, added to the ELISA plate, and processed through the blocking, washing, and detection steps as specified. Absorbance readings of each well were used to determine cytokine concentrations by comparison to standard curves generated using known concentrations of TNF and IL-6.
4.6. Statistical Methods
All statistical analyses were performed using GraphPad Prism (GraphPad Software, San Diego, CA, USA; version 10.4.2). Data were first assessed for distribution using tests for normality and lognormality, with the Shapiro-Wilk test applied for assessing normality. For comparisons between groups, an ordinary one-way analysis of variance (ANOVA) was conducted, followed by Dunnett's multiple comparisons test. A P-value of less than 0.05 was considered statistically significant.
5. Conclusions
In conclusion, this study demonstrates propofol’s notable anti-inflammatory effects on microglial cells, as evidenced by its ability to reduce TNF and IL-6 production. The observation that these effects occur independently of CB1R and CB2R activation suggests the involvement of alternative, non-cannabinoid mechanisms. While the findings contribute to our understanding of propofol’s broader immunomodulatory properties, further research is required to identify the specific pathways involved and to evaluate its therapeutic potential in clinical conditions such as stroke. Additionally, factors such as sex differences, a range of antagonist concentrations, and the use of human models should be considered in future studies to enhance the validity and applicability of the results.
Abbreviations
| 2-AG | Agonists, 2-Arachidonoyl Glycerol |
| AEA | Anandamide |
| CB1R | Cannabinoid type 1 receptor |
| CB2R | Cannabinoid type 2 receptor |
| CNS | Central Nervous System |
| DAMPs | Damage-Associated Molecular Patterns |
| eCBs | Endogenous Cannabinoids |
| ECS | Endocannabinoid System |
| FAAH | Fatty Acid Amide Hydrolase |
| GPCRs | G Protein–Coupled Receptors |
| IL-6 | Interleukin-6 |
| IL-10 | Interleukin 10 |
| I/R Injury | Ischemia/Reperfusion (I/R) Injury |
| LPS | Lipopolysaccharide |
| MAGL | Monoacylglycerol Lipase |
| NO | Nitric Oxide |
| ROS | reactive oxygen species |
| SFM | Serum-Free Medium |
| SOD | Superoxide Dismutase |
| T-AOC | Total Antioxidant Capacity |
| TNF | Tumor Necrosis Factor |
References
- Ginhoux, F.; Greter, M.; Leboeuf, M.; Nandi, S.; See, P.; Gokhan, S.; Mehler, M.F.; Conway, S.J.; Ng, L.G.; Stanley, E.R.; et al. Fate Mapping Analysis Reveals That Adult Microglia Derive from Primitive Macrophages. Science 2010, 330, 841–845. [Google Scholar] [CrossRef] [PubMed]
- Borst, K.; Dumas, A.A.; Prinz, M. Microglia: Immune and Non-Immune Functions. Immunity 2021, 54, 2194–2208. [Google Scholar] [CrossRef] [PubMed]
- Colonna, M.; Butovsky, O. Microglia Function in the Central Nervous System During Health and Neurodegeneration. Annual Review of Immunology 2017, 35, 441–468. [Google Scholar] [CrossRef] [PubMed]
- Dong, R.; Huang, R.; Wang, J.; Liu, H.; Xu, Z. Effects of Microglial Activation and Polarization on Brain Injury After Stroke. Front. Neurol. 2021, 12. [Google Scholar] [CrossRef] [PubMed]
- Xu, L.; He, D.; Bai, Y. Microglia-Mediated Inflammation and Neurodegenerative Disease. Mol Neurobiol 2016, 53, 6709–6715. [Google Scholar] [CrossRef] [PubMed]
- Yenari, M.A.; Xu, L.; Tang, X.N.; Qiao, Y.; Giffard, R.G. Microglia Potentiate Damage to Blood-Brain Barrier Constituents: Improvement by Minocycline in Vivo and in Vitro. Stroke 2006, 37, 1087–1093. [Google Scholar] [CrossRef] [PubMed]
- Cherry, J.D.; Olschowka, J.A.; O’Banion, M.K. Neuroinflammation and M2 Microglia: The Good, the Bad, and the Inflamed. Journal of Neuroinflammation 2014, 11, 98. [Google Scholar] [CrossRef] [PubMed]
- Yu, H.; Wang, X.; Kang, F.; Chen, Z.; Meng, Y.; Dai, M. Propofol Attenuates Inflammatory Damage on Neurons Following Cerebral Infarction by Inhibiting Excessive Activation of Microglia. International Journal of Molecular Medicine 2019, 43, 452–460. [Google Scholar] [CrossRef] [PubMed]
- Lu, H.-C.; Mackie, K. Review of the Endocannabinoid System. Biological Psychiatry: Cognitive Neuroscience and Neuroimaging 2021, 6, 607–615. [Google Scholar] [CrossRef] [PubMed]
- Blankman, J.L.; Simon, G.M.; Cravatt, B.F. A Comprehensive Profile of Brain Enzymes That Hydrolyze the Endocannabinoid 2-Arachidonoylglycerol. Chemistry & Biology 2007, 14, 1347–1356. [Google Scholar] [CrossRef] [PubMed]
- Cravatt, B.F.; Demarest, K.; Patricelli, M.P.; Bracey, M.H.; Giang, D.K.; Martin, B.R.; Lichtman, A.H. Supersensitivity to Anandamide and Enhanced Endogenous Cannabinoid Signaling in Mice Lacking Fatty Acid Amide Hydrolase. Proc Natl Acad Sci U S A 2001, 98, 9371–9376. [Google Scholar] [CrossRef] [PubMed]
- Tanaka, M.; Sackett, S.; Zhang, Y. Endocannabinoid Modulation of Microglial Phenotypes in Neuropathology. Frontiers in Neurology 2020, 11, 87. [Google Scholar] [CrossRef] [PubMed]
- Peng, M.; Ye, J.-S.; Wang, Y.-L.; Chen, C.; Wang, C.-Y. Posttreatment with Propofol Attenuates Lipopolysaccharide-Induced up-Regulation of Inflammatory Molecules in Primary Microglia. Inflamm. Res. 2014, 63, 411–418. [Google Scholar] [CrossRef] [PubMed]
- Zheng, H.; Xiao, X.; Han, Y.; Wang, P.; Zang, L.; Wang, L.; Zhao, Y.; Shi, P.; Yang, P.; Guo, C.; et al. Research Progress of Propofol in Alleviating Cerebral Ischemia/Reperfusion Injury. Pharmacol. Rep 2024. [Google Scholar] [CrossRef] [PubMed]
- Patel, S.; Wohlfeil, E.R.; Rademacher, D.J.; Carrier, E.J.; Perry, L.J.; Kundu, A.; Falck, J.R.; Nithipatikom, K.; Campbell, W.B.; Hillard, C.J. The General Anesthetic Propofol Increases Brain N-Arachidonylethanolamine (Anandamide) Content and Inhibits Fatty Acid Amide Hydrolase. British Journal of Pharmacology 2003, 139, 1005–1013. [Google Scholar] [CrossRef] [PubMed]
- Gui, B.; Su, M.; Chen, J.; Jin, L.; Wan, R.; Qian, Y. Neuroprotective Effects of Pretreatment with Propofol in LPS-Induced BV-2 Microglia Cells: Role of TLR4 and GSK-3β. Inflammation 2012, 35, 1632–1640. [Google Scholar] [CrossRef] [PubMed]
- Zhang, T.; Wang, Y.; Xia, Q.; Tu, Z.; Sun, J.; Jing, Q.; Chen, P.; Zhao, X. Propofol Mediated Protection of the Brain From Ischemia/Reperfusion Injury Through the Regulation of Microglial Connexin 43. Front. Cell Dev. Biol. 2021, 9. [Google Scholar] [CrossRef] [PubMed]
- Peng, X.; Li, C.; Yu, W.; Liu, S.; Cong, Y.; Fan, G.; Qi, S. Propofol Attenuates Hypoxia-Induced Inflammation in BV2 Microglia by Inhibiting Oxidative Stress and NF-κB/Hif-1α Signaling. Biomed Res Int 2020, 2020, 8978704. [Google Scholar] [CrossRef] [PubMed]
- Zheng, X.; Huang, H.; Liu, J.; Li, M.; Liu, M.; Luo, T. Propofol Attenuates Inflammatory Response in LPS-Activated Microglia by Regulating the miR-155/SOCS1 Pathway. Inflammation 2018, 41, 11–19. [Google Scholar] [CrossRef] [PubMed]
- Young, A.P.; Denovan-Wright, E.M. The Dynamic Role of Microglia and the Endocannabinoid System in Neuroinflammation. Front. Pharmacol. 2022, 12. [Google Scholar] [CrossRef] [PubMed]
Figure 1.
Effect of propofol on microglial cell viability under various experimental conditions. (a) Microglial cells treated with increasing concentrations of propofol (20–320 μM) in the absence of LPS exhibited a significant reduction in viability at 80 μM, 160 μM, and 320 μM. (b) Co-treatment with LPS and propofol revealed a marked decline in cell viability at 160 μM and 320 μM. (c) In the presence of the CB1 receptor antagonist AM281, LPS, and propofol, a significant reduction in viability was observed at 160 μM and 320 μM. (d) In the presence of the CB2 receptor antagonist AM630, LPS, and propofol, the greatest reduction in viability occurred at 160 μM and 320 μM. (e) Combined treatment with LPS, AM281, AM630, and propofol also resulted in significantly decreased viability at 160 μM and 320 μM. Data are represented as mean ± SD (n=3). *p≤0.05, **p≤0.01, ***p≤0.001, ****p≤0.0001.
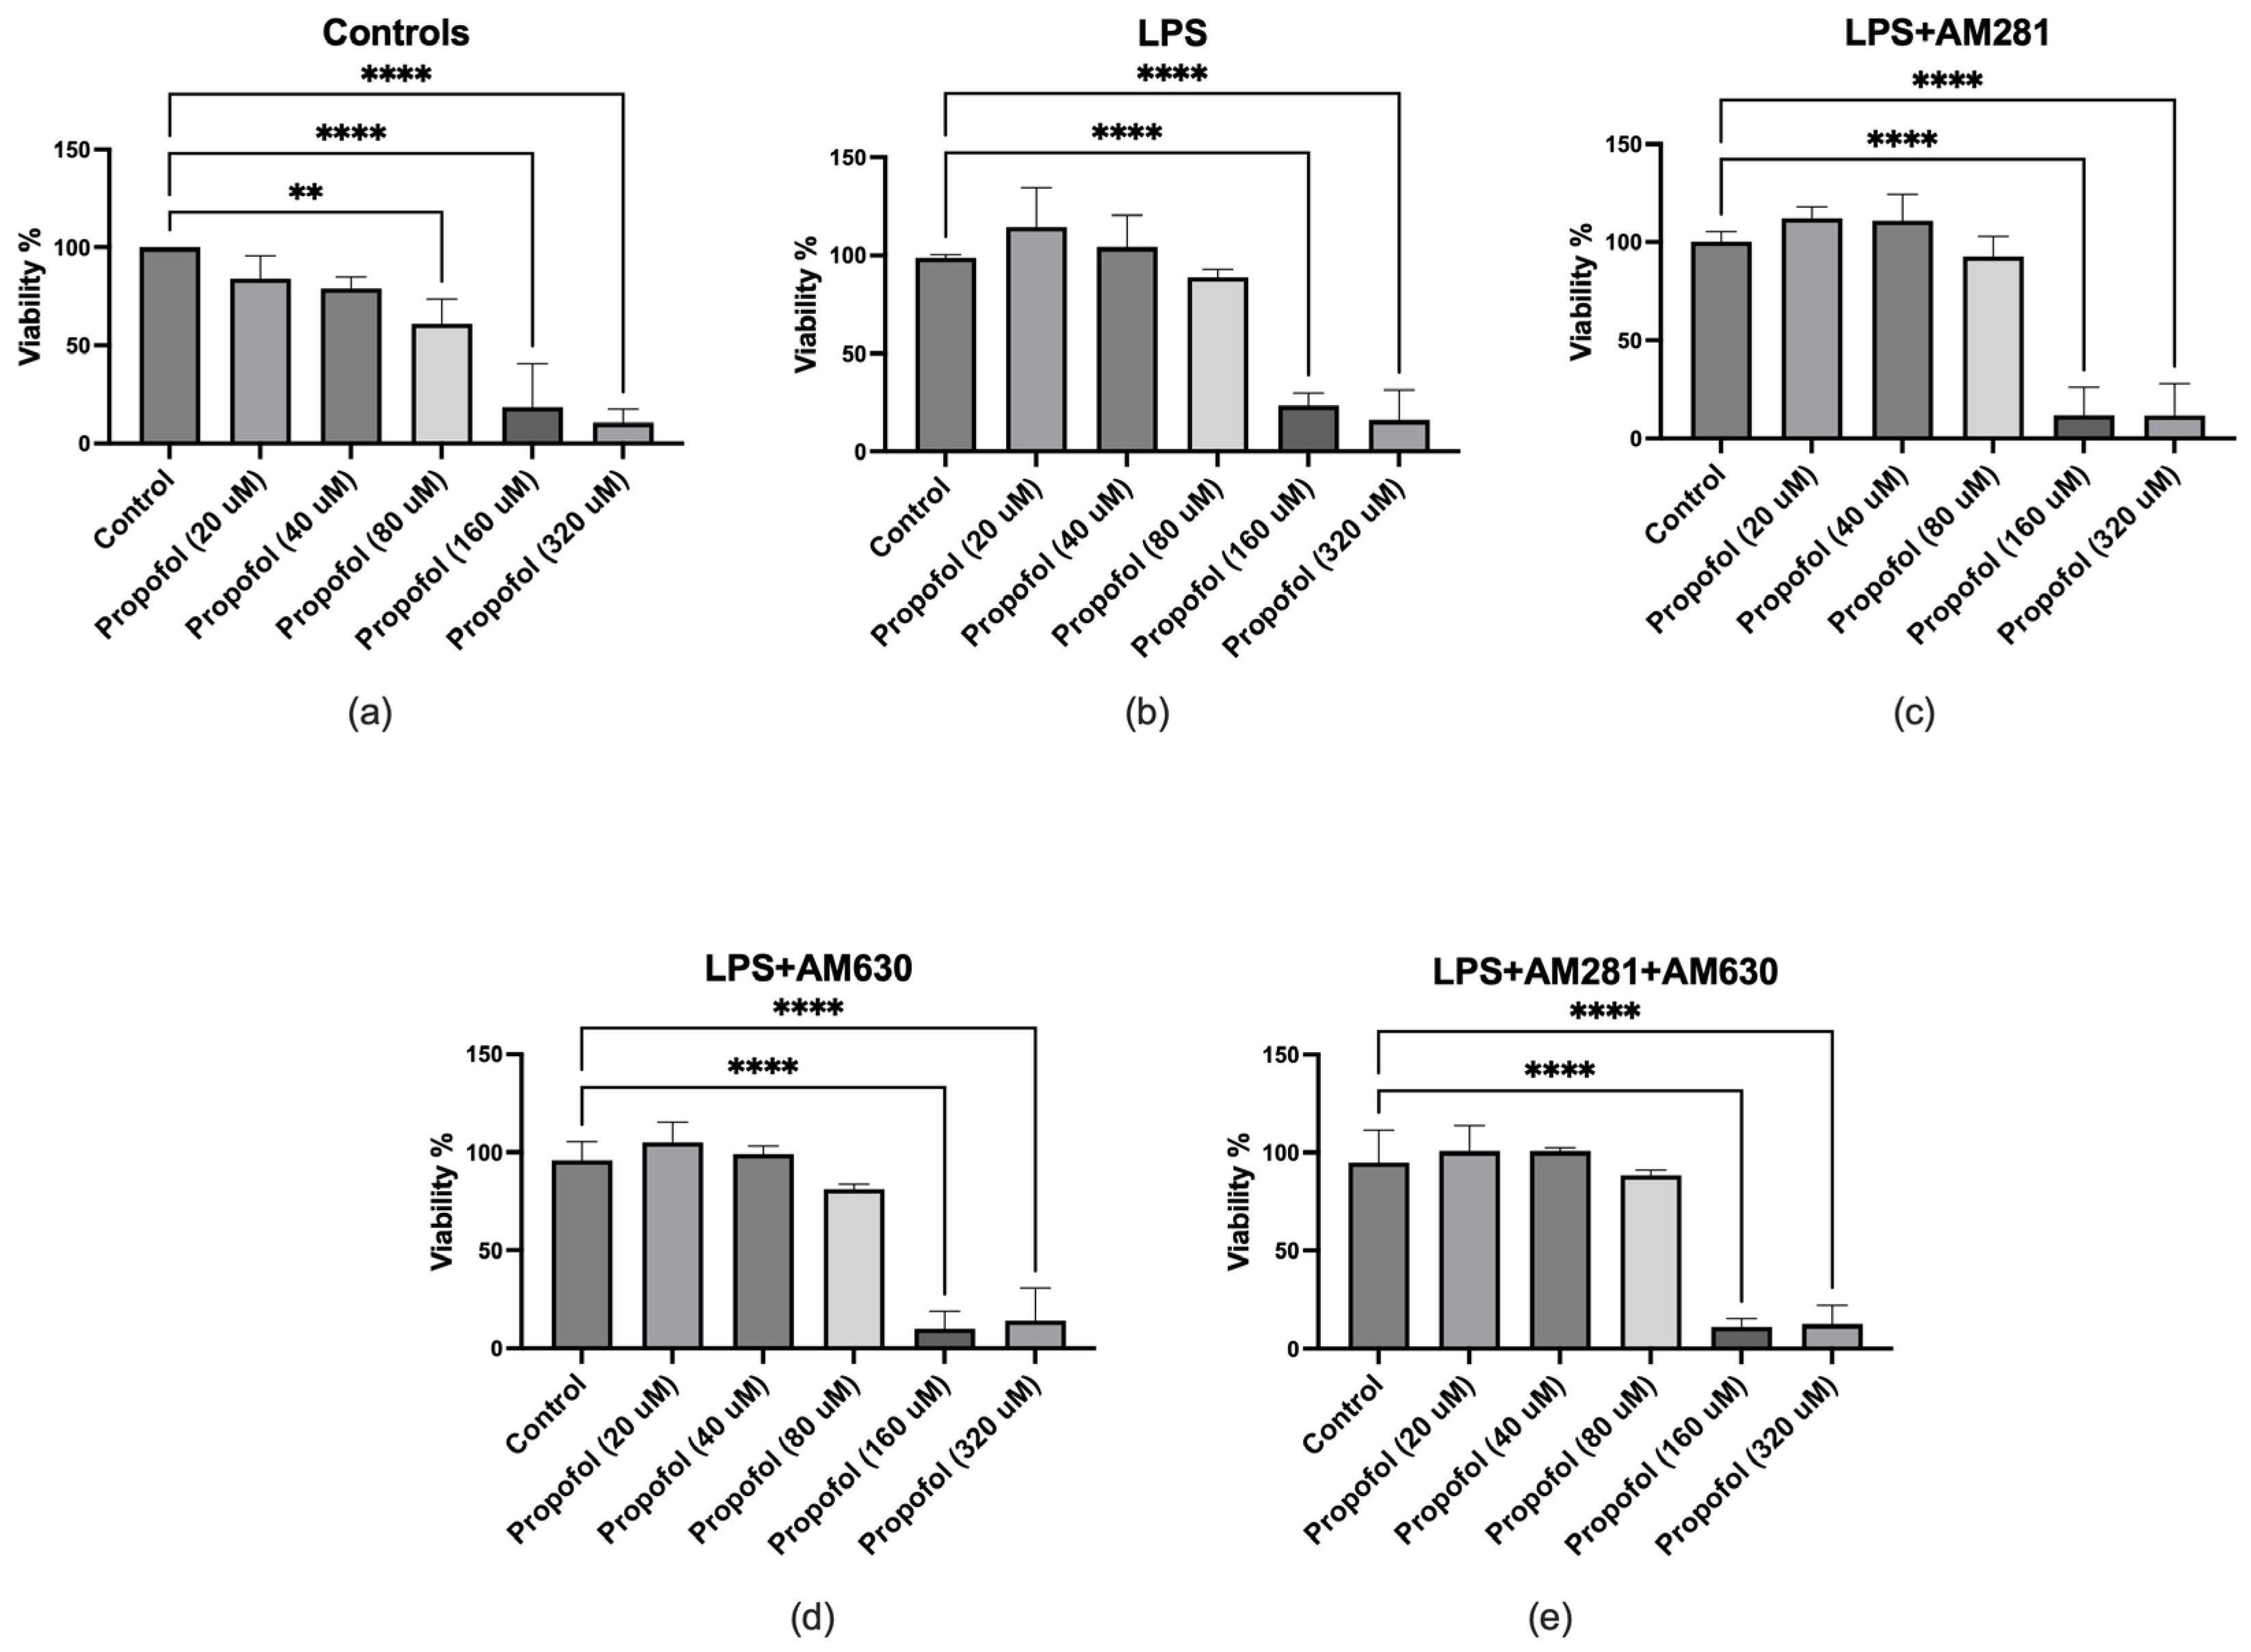
Figure 2.
Effect of propofol on TNF production in microglial cells under various treatment conditions measured by ELISA. (a) Co-treatment with LPS and various concentrations of propofol resulted in a significant reduction in TNF release at all tested doses compared to LPS alone. (b) In the presence of the CB1 receptor antagonist AM281, LPS, and propofol, TNF levels were significantly decreased at all propofol concentrations. (c) Treatment with LPS, the CB2 receptor antagonist AM630, and propofol also resulted in a marked reduction in TNF production across all concentrations. (d) Combined exposure to LPS, AM281, AM630, and propofol led to a significant reduction in TNF levels at all propofol concentrations. Data are represented as mean ± SD (n=3). *p≤0.05, **p≤0.01, ***p≤0.001, ****p≤0.0001.
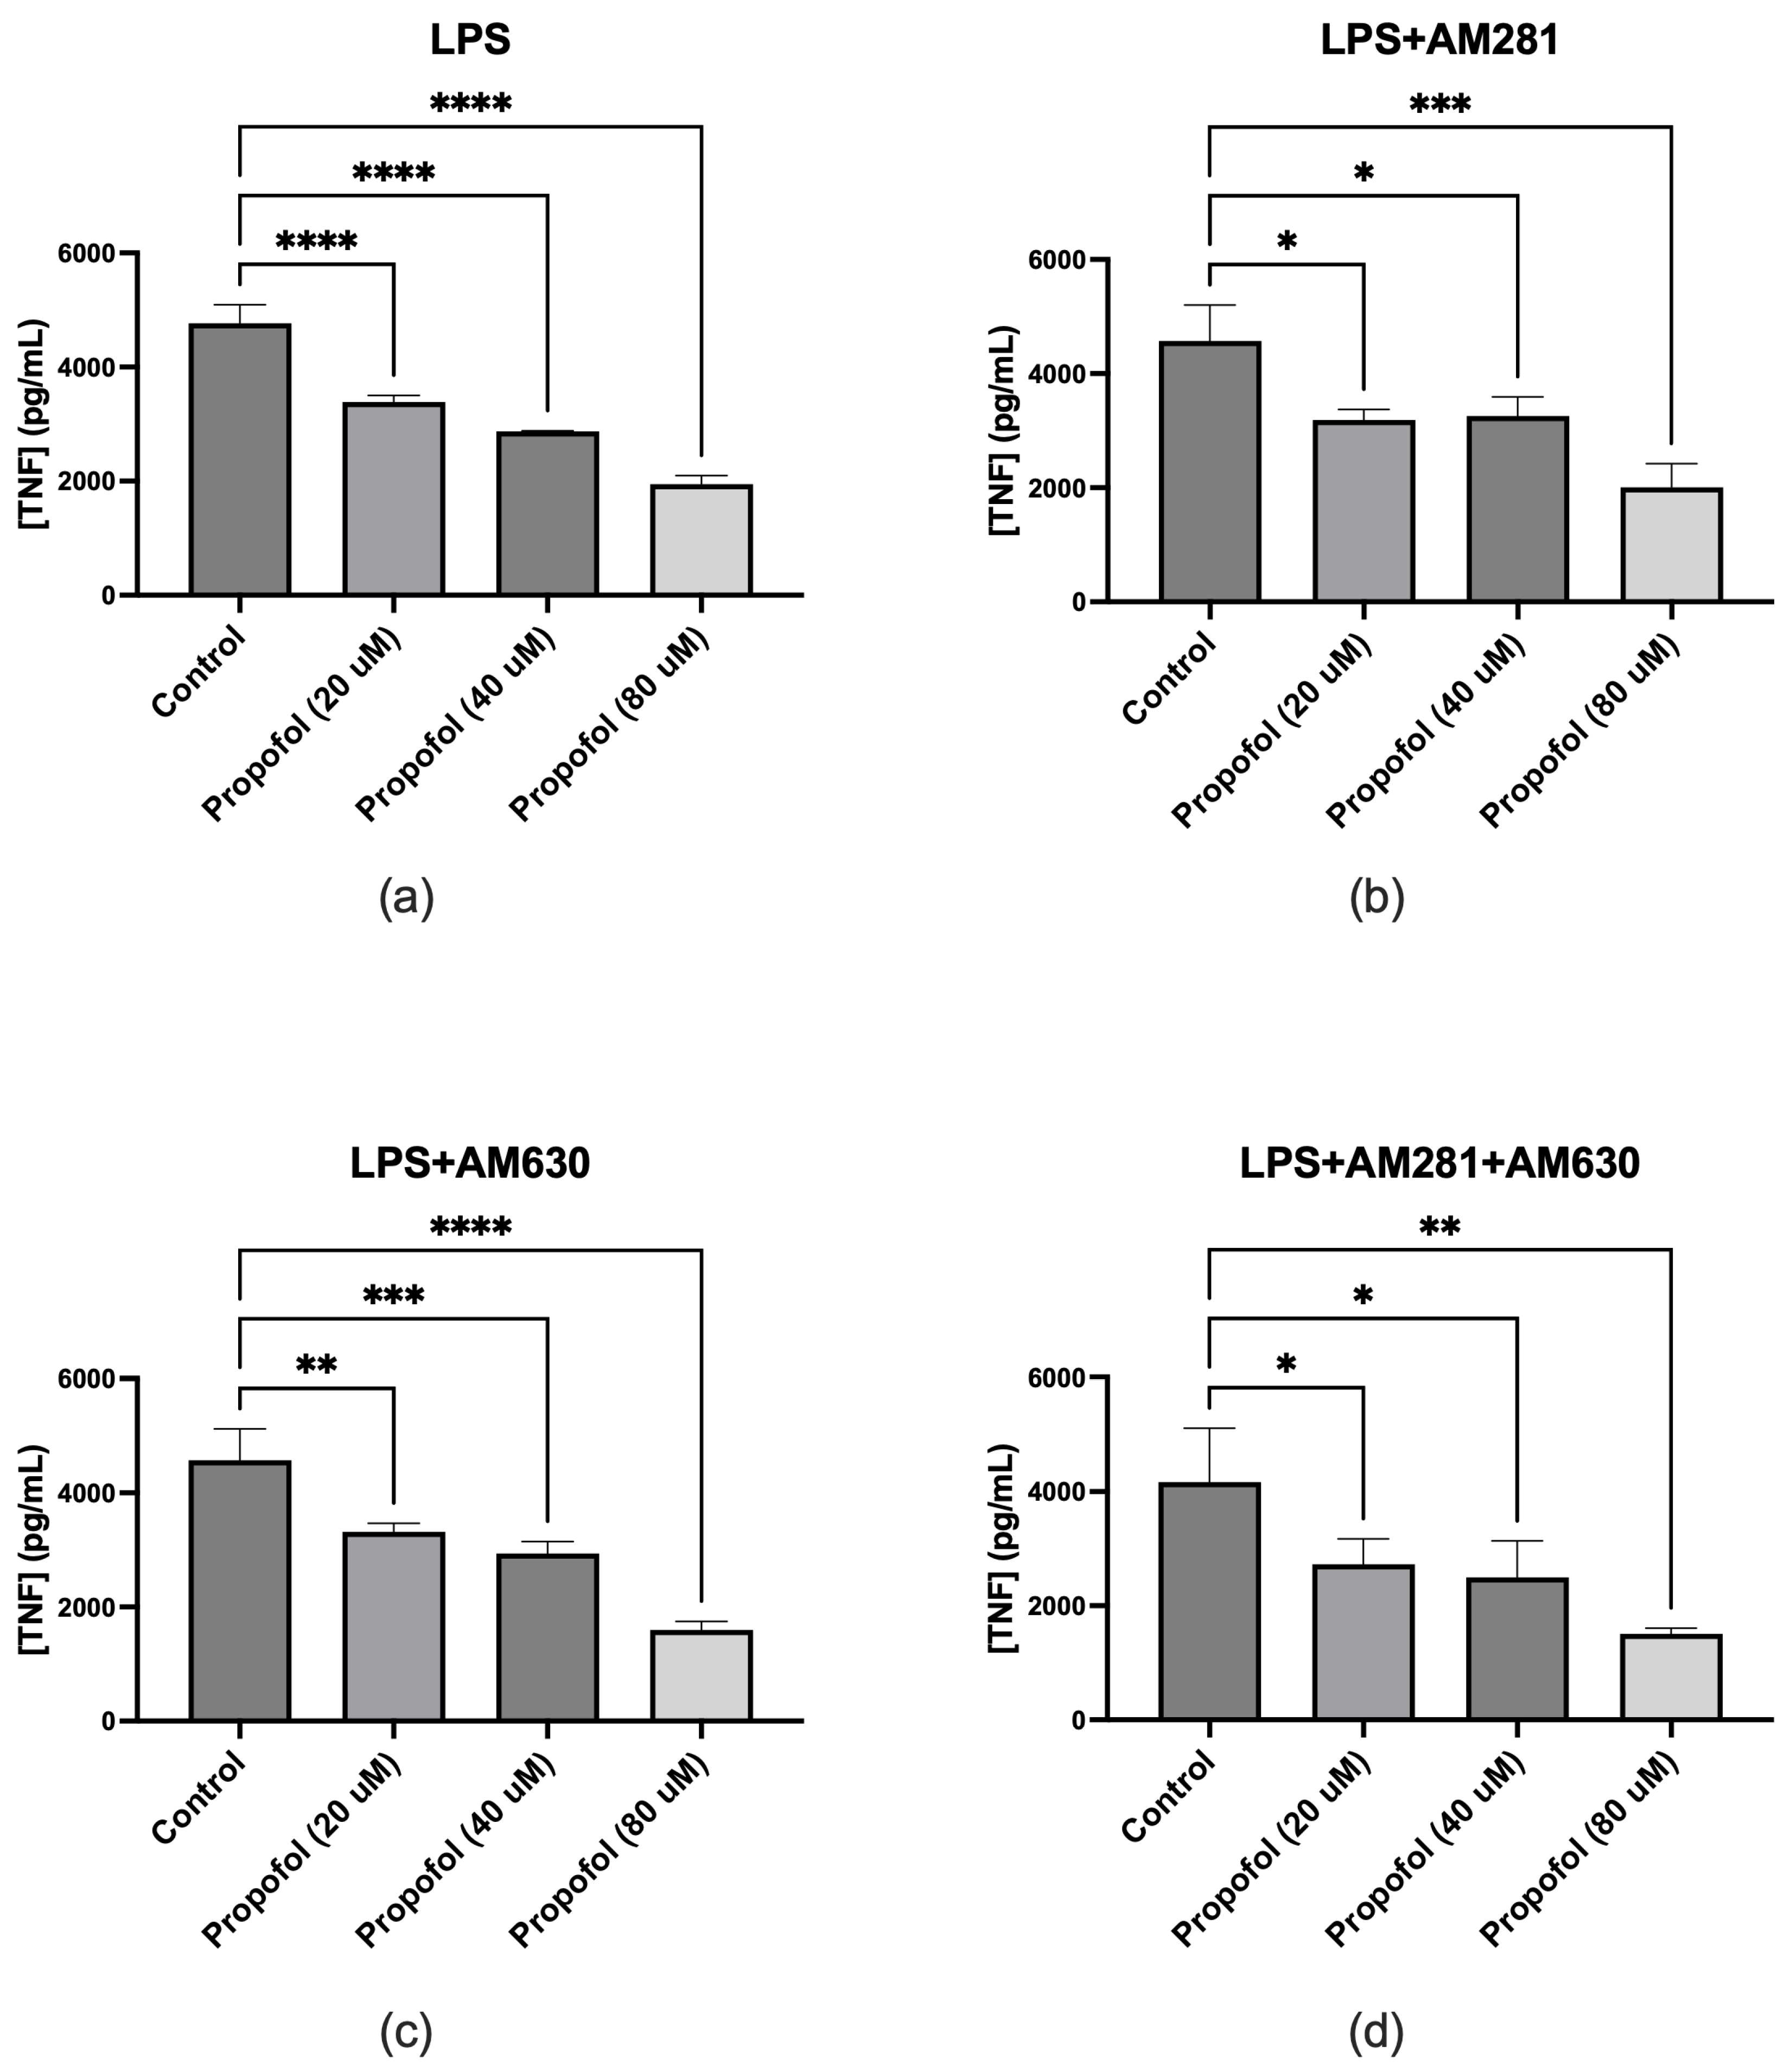
Figure 3.
Effect of propofol on IL-6 production in microglial cells under various experimental conditions. (a) Co-treatment with LPS and increasing concentrations of propofol resulted in a dose-dependent reduction in IL-6 release. (b) In the presence of the CB1 receptor antagonist AM281 and LPS, propofol significantly reduced IL-6 levels at all tested concentrations compared to treatment without propofol. (c) Treatment with LPS and the CB2 receptor antagonist AM630 resulted in only a modest, statistically non-significant reduction in IL-6 release with increasing concentrations of propofol. (d) Combined exposure to LPS, AM281, AM630, and propofol significantly reduced IL-6 levels across all concentrations compared to the non-propofol-treated group. Data are represented as mean ± SD (n=3). *p≤0.05, **p≤0.01, ***p≤0.001, ****p≤0.0001.
Disclaimer/Publisher’s Note: The statements, opinions and data contained in all publications are solely those of the individual author(s) and contributor(s) and not of MDPI and/or the editor(s). MDPI and/or the editor(s) disclaim responsibility for any injury to people or property resulting from any ideas, methods, instructions or products referred to in the content. |
© 2025 by the authors. Licensee MDPI, Basel, Switzerland. This article is an open access article distributed under the terms and conditions of the Creative Commons Attribution (CC BY) license (https://creativecommons.org/licenses/by/4.0/).
Copyright: This open access article is published under a Creative Commons CC BY 4.0 license, which permit the free download, distribution, and reuse, provided that the author and preprint are cited in any reuse.


