Submitted:
18 July 2025
Posted:
21 July 2025
You are already at the latest version
Abstract
Background/Objectives: IBDs are chronic relapsing inflammatory intestinal disorders whose precise etiology is still only poorly defined: critical for their pathogenesis is the CCL20/CCR6 axis, whose modulation by small molecules may represent an innovative therapeutic approach. The aim of the present work is to test the potential efficacy of two molecules, MR120, a small selective CCR6 antagonist, active in TNBS- and chronic DSS-induced murine models of intestinal inflammation, and its derivative MR452, a well-tolerated agent endowed with improved anti-chemotactic in vitro properties, in the adoptive transfer colitis model. To the best of our knowledge, this is the first attempt of using adoptive transfer colitis to test modulators of the CCL20/CCR6 axis. Methods and Results: The induction of colitis in immunocompromised mice receiving CD4⁺CD25⁻ T cells i.p. resulted in a moderate inflammation and was met with limited protective responses following daily subcutaneous administration of MR120 or MR452 for 8 weeks. Both compounds significantly reduced colonic myeloperoxidase activity, MR452 also lowered CCL20 levels in the gut, but they failed to prevent the increase in disease activity index, colon wall thickening, and macroscopic inflammation score. Conclusions: Our findings suggest that the pharmacological targeting of the CCL20/CCR6 axis in the adoptive transfer model has only a modest effect in ameliorating the IBD-like phenotype driven by the altered balance between Treg and Th17. The CCL20/CCR6 inhibitors MR120 and MR452 appear more clearly involved in the control of Th1 and Th2 adaptive immune responses, as it results from the beneficial effects displayed by MR120 against subacute TNBS- and chronic DSS-induced colitis.
Keywords:
CCL20/CCR6
; intestinal inflammation
; adoptive transfer colitis
; CCR6 antagonist
1. Introduction
IBDs are a complex of chronic relapsing inflammatory disorders of the intestine whose incidence and prevalence are increasing steadily all over the world and whose impact on everyday life is dramatic [1]. The pharmacological therapy nowadays available consists mainly of traditional drugs (aminosalicylates, corticosteroids, immunosuppressive agents) and monoclonal antibodies. However, the tolerability and efficacy of current drugs is limited and a substantial number of IBD patients fail to respond or to fully remit, while respondents can lose response over time [2]. Therefore, having drugs able to maintain high efficacy and limited side effects in all patients is an important unmet need.
Although the precise aetiology of IBD is still only poorly defined, a central role in its pathogenesis is played by the dysregulation of the gut barrier function and by the continuous recruitment of leukocytes from the circulation to inflamed tissues [3]. This is proved by the therapeutic efficacy of strategies interfering with gut homing of effector leukocytes, as in the case of anti-human α4β7 vedolizumab [4]. Crucial for IBD development is also the disrupted balance between CD4+Th17 (pro-inflammatory) and Treg (regulatory) cell populations, witnessed by the elevated IL-17 blood levels and intestinal infiltration of Th17 cells in IBD patients [5,6]. To this process, the interaction of CCL20 (CC chemokine ligand 20) with its sole receptor CCR6 could play a relevant contribution. CCL20, expressed constitutively by lymphoid tissues and epithelial cells, is released by a variety of other immune and non-immune cells in inflammatory conditions [7] and promotes the migration of CCR6-expressing leukocytes, CD4+ (including Treg and Th17 cells) and CD8+ T cells, B cells, dendritic and antigen-presenting cells, and activated neutrophils [7]. The participation of the CCL20/CCR6 axis to IBD pathogenesis is supported by various observations: the altered expression of both CCR6 and its partner chemokine in the colonic mucosa and serum of IBD patients [8,9] and the identification of their coding genes as susceptibility genes for IBD [10]; the ability of the anti-CCL20 neutralizing antibody to protect against TNBS-induced colitis, preventing neutrophils and T cells infiltration in the colon [11]; the lower severity of DSS-induced colitis in CCR6-knockout mice [12]; the interference played by CCL20 signaling in human Treg differentiation, promoting instead Th17 lineage [13]. Overall, these data highly suggest that the CCL20/CCR6 axis is directly involved in IBD pathogenesis and its modulation by small molecules may represent an innovative and useful therapeutic approach for IBD patients.
Moving from these grounds, our group has recently developed compound MR120 (Figure 1), a small and selective CCR6 antagonist whose anti-inflammatory efficacy has been proved by us in three different models of intestinal inflammation: subacute TNBS-induced colitis, considered a preclinical model of Crohn’s disease [14], zymosan-induced peritonitis, reproducing acute inflammation associated with strong native immune responses [14], and chronic DSS-induced colitis, a model able to more closely mimic the typically alternating phases of remission and exacerbation of human IBD [15]. The efficacy of MR120 as CCR6 antagonist able to mitigate the inflammatory cells recruitment was confirmed also by Yoo et al. in a model of murine acute ischemic kidney injury [16]. In general, the ability of this small molecule to prevent the inflammatory responses and the local and systemic neutrophils infiltration clearly supported the modulation of CCL20/CCR6 axis as an advantageous strategy to limit intestinal and gut-derived systemic inflammation. In a following study, centered on the optimization of MR120, we designed and synthesized a focused collection of derivatives, among which MR452 emerged as a well-tolerated anti-chemotactic agent against the in vitro CCL20-induced migration of human peripheral blood mononuclear cells (Figure 1) [17].
Building on these premises, the present study aims at evaluating the suitability of T cell transfer-induced chronic colitis [18] to further support the potential protective action of MR120 and MR452 in a purportedly more relevant animal model. This protocol, firstly conceived by Powrie [19] and based on naïve CD4+ T cell transfer to syngeneic immunodeficient, SCID or Rag1-/-, mice, has become a predictive model of chronic colitis ensuing from the perturbation of intestinal immune homeostasis, considered similar to CD in terms of histopathology and gene expression patterns [20]. It could therefore represent an appropriate tool to study the involvement of CCL20/CCR6 axis in the onset or perpetuation of intestinal inflammation as a consequence of the unbalance between CD4+ Treg and Th17 lymphocytes [21].
2. Results
2.1. Effects on Inflammatory Responses
Intraperitoneal infusion of CD4+CD25- T lymphocytes slowly worsened the clinical conditions of vehicle-treated C.B.-17 SCID mice, as demonstrated by the increasing DAI score over the weeks (C), while no changes were detected in immunocompromised mice that were i.p. infused with pure naïve CD4+ T cells (S). Vehicle-treated colitic mice (C) showed a marked deterioration of the health status from the fifth week until the end of the experimental protocol (*P<0.05 vs S). The treatments with MR120 and MR452 were not able to improve the general health status of mice, showing DAI curves comparable to those of (C) group (Figure 2).
The development of adoptive transfer colitis did not lead to colon shortening or relevant splenomegaly (Figure 3a and Figure 3b), but augmented significantly colon thickness and caused a remarkable increase of the macroscopic score in all inflamed experimental groups (*P<0.05 vs S) (Figure 3c and Figure 3d). The administration of MR120 and MR452 to colitic mice was not able to reduce the local and systemic inflammatory parameters, but both colon thickening and the severity of lesions were comparable with those of vehicle-treated mice (C), as reported in Figure 3c and Figure 3d.
As regards colonic MPO activity, it resulted markedly higher in vehicle-treated colitic mice C compared to S mice (*P<0.05 vs S) and both treatments were able to reduce neutrophils oxidative activity (#P<0.05 vs C) (Figure 4).
2.2. Effects on T Lymphocytes
The flow cytometry analysis performed on the spleen and mesenteric lymph nodes (MLNs) revealed the absence of T lymphocytes in the spleen (data not shown) and the increase of T lymphocytes in the mesenteric lymph nodes of colitic mice (C). The increase in T lymphocytes percentage during the inflammatory process was particularly marked in vehicle- and MR120-treated mice compared to sham mice (*P<0.05 vs S) (Figure 5). A small but not significative reduction of T lymphocytes in MR452-treated mice compared to vehicle-treated mice was seen. Within CD3+ lymphocytes, CD3+CD4+ cells represented the predominant subpopulation, showing comparable percentages in all the experimental groups (Table 1).
2.3. Effects on Inflammatory Cytokines
In vehicle-treated colitic mice, the production of inflammatory cytokines in the colon was slightly increased with respect to sham mice, especially in the case of CCL20 (*P<0.05 vs S), while IL-1β and IL-6 levels did not markedly increase, possibly due to the slow onset of inflammation (Figure 6). As regards the effects of the small molecules, only the treatment with MR452 was able to significantly diminish the levels of CCL20 (#P<0.05 vs C) (Figure 6a), while no changes were produced by either compound on IL-1β or IL-6 colonic release (Figure 6b and Figure 6c).
As regards the determination of mRNA levels of inflammatory cytokines in the colon, the gene transcription for CCL20 and IL-17 was comparable in all the experimental groups (Figure 7a and Figure 7b), although a small, non-significant increase of IL-17 mRNA levels could be detected in C mice with respect to S ones (P=0.054), a trend counteracted by MR120 and MR452 (Figure 7b). As regards INF-γ, gene transcription was moderately increased in colitic mice but the small molecules did not show a marked decrease of mRNA levels of the cytokine with respect to C mice (Figure 7c). Only a small but non-significant reduction of INF-γ in MR452-treated mice compared to C mice was seen.
3. Discussion
The current work aims at applying the T cell transfer-induced chronic colitis to investigate the potential protective action against intestinal inflammation of the benzofuran derivatives MR120 and MR452, molecules functioning through the modulation of the CCL20/CCR6 axis. In particular, through distinct acute and chronic models of experimental colitis, MR120 has progressively unfolded as a compound capable of preventing the flogistic responses and the local and systemic neutrophils infiltration underscoring gut inflammation. Additionally, the efficacy of this compound has been emphasized by Yoo et al. in a model of murine acute ischemic kidney injury [16], further supporting its potential in immune-related inflammation. The favorable results obtained by MR120 boosted the design and synthesis of a focused collection of novel analogues. Among these, MR452 emerged as the best candidate, demonstrating high tolerability in PBMCs and exhibiting enhanced in vitro anti-chemotactic activity [17].
In the present study, we evaluated MR120 and MR452 in a direct comparative analysis using T cell adoptive transfer colitis, a relevant model of intestinal inflammation that, to our knowledge, has never been previously applied to investigate modulators of the CCL20/CCR6 axis [22]. The T cell transfer model is based on the altered homeostasis between Treg and Th17 lymphocytes, two CD4+ cell subtypes both expressing CCR6 and whose balance is finely regulated by the CCL20/CCR6 axis under physiological circumstances [7]. In IBDs, it is assumed that there is a disproportion of Treg/Th17 cells in favor of the latter and that the increased production of CCL20 in the intestinal mucosa, documented in IBD patients, contributes via CCR6 to the migration of Th17 lymphocytes towards the intestinal lamina propria, thereby promoting their pro-inflammatory activity and the onset of the inflammatory disorder [23]. In IBDs, this axis is thus reckoned as active partner in the inflammatory process, and an in vivo model mimicking the unbalance between Treg and Th17 lymphocytes could represent a useful tool to explore the consequence of its pharmacologic manipulation.
The intraperitoneal infusion of CD4+CD25- cells to immunocompromised mice evoked only a moderate colitis over the 8 weeks of the investigation: a gradual worsening of the clinical conditions, characterized by a slow increase in DAI score and splenomegaly, was detected in comparison with sham mice, which received CD4+ cells in toto. Consistent with the fact that the inflammatory process, induced by the T cell transfer in the colitis model, specifically affects the intestinal district, thickening of the wall, enhanced oxidative activity of neutrophils and increased mucosal damage in the colon were observed. As regards lymphocyte responses, despite an almost complete absence of T lymphocytes in the spleen, a significant rise in the number of T lymphocytes, mainly represented by CD3+CD4+ cells, was registered in MLNs of colitic mice, suggesting the contribution of these cells, lacking Treg type, in triggering intestinal inflammation. Indeed, along with the mucosal lesions, a moderate increment of mature CCL20 levels and the augmented transcription of INF-γ gene were revealed in the colonic tissue, confirming the typical features of T cell adoptive transfer colitis [24,25].
In this in vivo model, the administration of MR120, at the same dose that was effective against subacute TNBS- and chronic DSS-induced colitis (1 mg/Kg), and of its analogue MR452 showed a weak local protective effect, mitigating the oxidative action of neutrophils in the colon, feebly reducing IL-17 mRNA levels, and, only in the case of MR452, counteracting the increase of CCL20 production. Neither of the two small molecules exhibited systemic beneficial effects, nor was any disruption observed in the recruitment of CD3+CD4+ lymphocytes to the mesenteric lymph nodes. These results seem to indicate that the interference with the CCL20/CCR6 axis by MR120 and MR452 has very limited effects in hindering the gut homing of effector leukocytes and in relieving their inflammatory role in this model of chronic colitis dependent on Treg/Th17 dysregulation.
Interesting reports from the literature showed that the administration of CCR6(-/-) Th17 cells into SCID mice led to more aggressive inflammation with respect to the infusion of wild-type cells [26]; similarly, the transfer of adoptive T cells from CCR6(-/-) mice showed to evoke a stronger colitis [24]. The results collected in our experimental conditions suggest that the interference with the CCL20/CCR6 axis, achieved not through CCR6 gene deletion but via pharmacological modulation, does not appear to exacerbate the colitis induced by Treg/Th17 imbalance, while a modest anti-inflammatory effect was observed, however not comparable with the beneficial effect previously shown by MR120 on DSS- and TNBS-induced colitis models. This limited efficacy may reflect the slow and progressive nature of the adoptive transfer model, in which colitis typically develops over 4–6 weeks and is primarily driven by T cell–mediated immune dysregulation. In this context, the timing of intervention is likely critical: if the compound is administered too early, before robust CCL20/CCR6 activity is established, or too late, when inflammation is already entrenched, its therapeutic potential may be impaired. While our use of a preventive treatment might seem optimal for demonstrating anti-IBD drug efficacy, as supported by Lindebo Holme et al. [27], other studies suggest that later interventions can be more advantageous [28]. Furthermore, the lack of epithelial injury and chronic inflammatory remodeling may underestimate the compounds therapeutic potential. In contrast, the TNBS- and DSS-induced colitis models - which feature rapid onset, epithelial injury, and early chemokine-driven immune cell recruitment – appear more responsive to CCR6-targeted intervention. These findings highlight the importance of disease evolution, immune context, and treatment timing in the preclinical evaluation of immune-modulatory compounds targeting CCL20/CCR6 axis, and raise concerns about the sensitivity and appropriateness of the T cell transfer model for identifying drug candidates acting through this pathway.
In conclusion, on the basis of the positive previous results achieved by MR120 against subacute TNBS- and chronic DSS-induced colitis [14,15], it is rational to hypotesize that the pharmacological regulation of CCL20/CCR6 pathway appears more clearly involved in the control of Th1 and Th2 adaptive immune responses than in restoring the altered Treg/Th17 homeostasis implicated in intestinal inflammation, in which case only a very mild intervention could be evidenced.
4. Materials and Methods
4.1. Animals
Male Balb/c (6-8 weeks old, weighing 25-30g) and C.B-17 SCID (6 weeks old, weighing 18-25g) mice (Charles River Laboratories, Calco, Italy), were housed five per cage and maintained under standard conditions at our animal facility (Balb/c mice) or bred under SPF conditions in a ventilated cabinet (C.B-17 SCID mice) (12:12 h light–dark cycle, water and food ad libitum, 22-24°C). All appropriate measures were taken to minimize pain or discomfort of animals. All the experimental procedures (induction of colitis, daily monitoring of the disease) and euthanasia by CO2 inhalation were performed between 9 a.m. and 2 p.m.. All animal experiments were carried out according to the guidelines for the use and care of laboratory animals and they were authorized by the local Animal Care Committee “Organismo Preposto al Benessere degli Animali” and by Italian Ministry of Health “Ministero della Salute” (Authorization n.853/2021).
4.2. Development of Colitis
To induce colitis, pure naïve CD4+CD25- T cells were adoptively transferred from healthy syngeneic Balb/c mice to C.B.-17 SCID recipients. CD4+CD25- T cells were negatively selected from splenocytes and inguinal lymph nodes of Balb/c mice through CD4+CD25+ regulatory T cell isolation kit (MACS Milteny Biotec, CA95602, USA). The purity of the cells was checked by flow cytometry before reconstitution (>98% of the CD4+ cells were CD25-). The recipients were reconstituted by intraperitoneal (i.p.) infusion of 106 cells in 300 μl sterile PBS 100mM and immediately moved from the SPF ventilated cabinet to a normal housing environment and non-autoclaved food. C.B.-17 SCID mice i.p. infused with 300 μl sterile PBS, containing 106 CD4+ T cells, represented sham mice.
4.3. Experimental Design
As showed by Figure 8, pharmacological treatments started 7 days after i.p. infusion of CD4+ T cells and were applied twice daily, 8h apart, by subcutaneous (s.c.) administration of the vehicle or the drugs for the following 8 weeks until suppression by means of CO2 inhalation.
Mice were assigned through block randomization to the sham group (S; n=6), s.c. treated with 10 mL/kg vehicle (DMSO 1% in saline solution), or to the following experimental groups of colitic mice: control (C) (vehicle, 10 mL/kg; n=8), MR120 1 mg/kg (n=8), or MR452 1mg/kg (n=8).
The dosage of MR120 was chosen on the basis of Allodi et al. 2023 [15]; a similar dosage was applied for its derivative MR452. The study was performed using experimental blocks composed of 8 mice that were randomly assigned to S, C, MR120 and MR452 groups of treatments, each one encompassing 2 animals.
4.4. Evaluation of Inflammatory Responses
Body weight, stools consistency and rectal bleeding were examined and registered weekly throughout the experimentation by unaware observers, in order to assess the Disease Activity Index (DAI). Immediately after suppression, the macroscopic damage of colonic mucosa was assessed as macroscopic score after visual inspection. Colon, lungs, spleen and mesenteric lymph nodes were collected for subsequent microscopic, biochemical or flow cytometry analyses.
4.4.1. Disease Activity Index (DAI)
DAI, expressing the severity of the disease, is calculated as the total score resulting from body weight loss, rectal bleeding and stool consistency according to Cooper’s modified method [29] (maximal value=9).
The scores were quantified as follows:
- ○
- Stool consistency: 0 (normal), 1 (soft), 2 (liquid);
- ○
- Rectal bleeding: 0 (no bleeding), 1 (light bleeding), 2 (heavy bleeding);
- ○
- Body weight loss: 0 (<5%), 1 (5–10%), 2 (10–15%), 3 (15–20%), 4 (20–25%), 5 (>25%).
4.4.2. Colon Length and Thickness
To evaluate the deposition of fibrotic material induced by the inflammatory state, colon length and weight were measured, and the thickness was estimated by calculating the ratio weight (mg)/length(cm) (Bischoff et al., 2009 [30].
4.4.3. Macroscopic Score
The colon was explanted, opened longitudinally, flushed with saline solution and macroscopic score was immediately evaluated through inspection of the mucosa, performed by two investigators unaware of the treatments applied. Macroscopic score was determined according to previously published criteria [31], as the sum of scores (max=14) attributed as follows: presence of strictures and hypertrophic zones (0, absent; 1, 1 stricture; 2, 2 strictures; 3, more than 2 strictures); mucus (0, absent; 1, present); adhesion areas between the colon and other intra-abdominal organs (0, absent; 1, 1 adhesion area; 2, 2 adhesion areas; 3, more than 2 adhesion areas); intraluminal hemorrhage (0, absent; 1, present); erythema (0, absent; 1, presence of a crimsoned area <1cm2; 2, presence of a crimsoned area >1 cm2); ulcerations and necrotic areas (0, absent; 1, presence of a necrotic area <0.5 cm2; 2, presence of a necrotic area ≥0.5 cm2 and <1 cm2; 3, presence of a necrotic area ≥1 cm2 and <1.5 cm2; 4, presence of a necrotic area ≥1.5 cm2).
4.4.4. Spleen/Body Weight Ratio
Spleen/body weight ratio was determined as a marker of systemic inflammation. Following suppression, the spleen was weighed and the weight was normalized with respect to animal body weight (BW): the ratio was expressed as spleen(mg)*1000/BW(g).
4.4.5. Colon and Lung MPO Activity
MPO activity, marker of tissue granulocytic infiltration, was determined according to Ivey’s modified method in colon and lungs [32]. After being weighed, each colonic or lung sample was homogenized in ice-cold 0.02 M sodium phosphate buffer (pH 4.7), containing 0.015 M Na2EDTA and 1% Halt Protease Inhibitor Cocktail (ThermoFisher Scientific), and centrifuged for 20 min at 12500 RCF at 4°C. Pellets were re-homogenized in 4 volumes of ice-cold 0.2 M sodium phosphate buffer (pH 5.4) containing 0.5% hexadecylthrimethyl-ammonium bromide (HTAB) and 1% Halt Protease Inhibitor Cocktail (ThermoFisher Scientific). Samples were then subjected to 3 cycles of freezing and thawing and centrifuged for 30 min at 15500 RCF at 4°C. 50 µL of the supernatant was then allowed to react with 950 µL of 0.2 M sodium phosphate buffer, containing 1.6 mM tetramethylbenzidine, 0.3mM H2O2, 12% dimethyl formamide, 40% Dulbecco’s phosphate buffered saline (PBS). Each assay was performed in duplicate and the rate of change in absorbance was measured spectrophotometrically at 690 nm (TECAN Sunrise™ powered by Magellan™ data analysis software, Mannedorf, Switzerland). 1 unit of MPO was defined as the quantity of enzyme degrading 1 μmol of peroxide per minute at 25°C. Data were normalized with edema values and expressed as U/g of dry weight tissue.
4.4.6. Flow Cytometry Assays
Isolation of Splenocytes
After suppression, the spleen was removed, mechanically dispersed through a 100 μm cell-strainer, and washed with PBS containing 0.6 mM EDTA (PBS-EDTA). The cellular suspension was then centrifuged at 1500 RCF for 10 minutes at 4°C, the pellet re-suspended in PBS-EDTA, incubated with 2 mL of NH4Cl lysis buffer (0.15 M NH4Cl, 1mM KHCO3, 0.1 mM EDTA in distilled water) for 5 minutes, in the dark, to provoke erythrocytes lysis and centrifuged at 1500 RCF for 10 minutes at 4°C. Then, pellets were washed with PBS-EDTA and re-suspended in 5 mL cell staining buffer (PBS containing 0.5% fetal calf serum (FCS) and 0.1% sodium azide). Finally, the cellular suspension was stained with fluorescent antibodies [33].
Isolation of Mesenteric Lymph Nodes (MLN)
After suppression, harvesting of the whole MLN chain located in the mesentery of proximal colon was performed. The explanted tissue was rinsed with PBS, vascular and adipose tissues were removed to isolate MLN, mechanically dispersed through a 100 μm cell-strainer and washed with Hank’s Balanced Salt Solution (HBSS) containing 5% FCS. The obtained suspension was centrifuged at 1500 RCF for 10 minutes at 4°C, the pellet was washed with HBSS containing 5% FCS and re-suspended in 3 mL cell staining buffer. Finally, the cellular suspension was stained with fluorescent antibodies.
Immunofluorescent Staining
Prior to staining with antibodies, 200 µL of cellular suspension was incubated with IgG1-Fc (1µg/106 cells) for 10 minutes in the dark at 4°C to block non-specific binding sites for antibodies. The following antibodies were used for fluorescent staining: phycoerythrin-cyanine 5 (PE-Cy5) conjugated anti-mouse CD3ε (0.25 µg/106 cells, catalog number 15-0031, lot number B226301), fluorescein isothiocyanate (FITC) anti-mouse CD4 (0.25 µg/106 cells, catalog number 100406, lot number B210488). Cells were incubated with antibodies for 1 hour in the dark at 4°C, washed with PBS to remove excessive antibody and suspended in cell staining buffer to perform flow cytometry analysis. The viability of the cellular suspension was determined through propidium iodide (PI) staining, a membrane impermeable fluorescent dye, excluded by viable cells, that emits red fluorescence by binding to DNA, thus resulting as a suitable marker for dead cells. Cells were incubated with PI 10 µg/mL for 1 minute in the dark, at room temperature, and immediately subjected to flow cytometry analysis. Only PI-ve cells were included in the analysis.
Samples were analysed using InCyte™ software (Merck Millipore, Darmstadt, Germany). Cell populations were defined as follows: lymphocytes gated in the Forward Scatter (FSC)-Side Scatter (SSC) plot (FSC low: SSC low); T lymphocytes (CD3+ lymphocytes); CD4+ T lymphocytes (CD3+CD4+ lymphocytes). Percentages of CD4+ T lymphocytes with respect to CD3+ lymphocytes were calculated.
4.4.7. Analysis of inflammatory cytokines
ELISA Assays
After homogenization in PBS containing proteases inhibitors cocktail 10μL/mL and EDTA 5mM, colonic tissue was frozen-thawed for 10 minutes in liquid nitrogen and 15 minutes in 37°C water bath for 2 cycles and the samples were then centrifuged at 5000 rpm for 5 min at 4°C. The supernatant, containing the inflammatory cytokines CCL20, IL-6 and IL-1β, was assayed by means of available commercial ELISA kits [CCL20: Mouse MIP-3a ELISA Kit (Wuhan Fine Biotech Co., Ltd.; Wuhan, Cina); IL-6: Mouse IL-6 ELISA Kit (RayBiotech, Peachtree Corners, GA, US); IL-1β: Mouse Interleukin 1β ELISA Kit (Cusabio, Houston, TX, USA)]. The absorbance was measured spectrophotometrically at 450nm and expressed as ng/g of proteins present in each sample. The protein concentration of each sample was determined through the bicinchoninic acid (BCA) protein assay kit (ThermoFisher Scientific Inc., Waltham, MA, USA). Briefly, 15μL of supernatant were made to react with 200μL of BCA mix reagent and, after an incubation of 30 min, the absorbance was determined spectrophotometrically at 550nm.
Reverse Transcription Polymerase Chain Reaction (RT-PCR)
Total RNA was extracted from murine colons using Qiagen RNeasy Protect Mini Kit (Qiagen, Hilden, DE) and quantified using a NanoQuant PlateTM in an Infinite M Nano Machine (TECAN, Männedorf, CH). 1μg of RNA was reverse transcribed into complementary DNA (cDNA) and amplified using OneStep RT-PCR kit (Qiagen, Hilden, DE), according to the manufacturer’s protocol. The following primers were used:
- ○
-
HPRT:TCAGTCAACGGGGGACATAAA (sense)GGGGCTGTACTGCTTAACCAG (antisense)
- ○
-
CCL20:TCTTGACTCTTAGGCTGAGG (sense)CAGAAGCAGCAAGCAACTAC (antisense)
- ○
-
IL-17:CCCTGGACTCTCCACCGCAA (sense)TCCCTCCGCATTGACACAGC (antisense)
- ○
-
INF-γ:TGAACGCTACACACTGCATCTTGG (sense)
- CGACTCCTTTTCCGCTTCCTGAG (antisense)
All constructs were amplified applying the thermal cycler conditions suggested by QIAGEN OneStep RT-PCR Handbook (Qiagen, Hilden, DE). PCR products were separated on 2% agarose gels and acquired with ChemiDoc Imaging System following RedSafe staining and analyzed by Image Lab software, version 5.0. Finally, mRNA levels were normalized with respect to the levels of hypoxanthine phosphoribosyl-transferase (HPRT) mRNA used as internal control.
4.5. Statistics
All data were presented as mean±SEM. Comparison among experimental groups was made using analysis of variance (one-way or two-way ANOVA) followed by Bonferroni’s post-test, when P<0.05, chosen as level of statistical significance, was achieved. Non-parametric Kruskal-Wallis analysis, followed by Dunn’s post-test, was applied for statistical comparison of macroscopic score. All analyses were performed using Prism 9 software (GraphPad Software Inc. San Diego, CA, USA).
Author Contributions
Conceptualization, S.B. and M.R.; methodology, S.B., M.A., L.F.; formal analysis, S.B., M.A.; investigation, M.A, L.F., C.G., MGM, FB; resources, M.R., V.B.; writing—original draft preparation, S.B., M.A., M.R.; writing—review and editing, S.B., M.R., M.A., C.G., L.F., E.B., V.B., M.G.M., F.B.; supervision, S.B., M.R.; funding acquisition, S.B., M.R. All authors have read and agreed to the published version of the manuscript.
Funding
This research was funded by European Crohn’s and Colitis Organisation, ECCO grant 2020 awarded to S.B.
Institutional Review Board Statement
The animal study protocol was approved by the local Animal Care Committee “Organismo Preposto al Benessere degli Animali” and by Italian Ministry of Health “Ministero della Salute” (Authorization n.853/2021).
Data Availability Statement
The data are available upon request.
Acknowledgments
The authors wish to thank Dr. Giuseppe Domenichini for his skillful technical assistance.
Conflicts of Interest
The authors declare no conflicts of interest.
Abbreviations
The following abbreviations are used in this manuscript:
| IBDs | Inflammatory Bowel Diseases |
| CCL20 | CC chemokine ligand 20 |
| CCR6 | C-C chemokine receptor type 6 |
| TNBS | 2,4,6-trinitrobenzene sulfonic acid |
| DAI | Disease Activity Index |
| DSS | Dextran Sulfate Sodium |
| CD | Crohn’s Disease |
| UC | Ulcerative Colitis |
| S | Sham mice |
| C | Control mice |
| BW | Body Weight |
| MPO | Myeloperoxidase |
| i.p. | intraperitoneal |
| MLN | Mesenteric Lymph Nodes |
| SPF | Specific Pathogen Free |
| PBS | Phosphate Buffered Saline |
| s.c. | subcutaneous |
| DMSO | dimethyl sulfoxide |
| RCF | Relative Centrifugal Force |
| HTAB | hexadecylthrimethyl-ammonium bromide |
| FCS | Fetal Calf Serum |
| FITC | fluorescein isothiocyanate |
| PI | propidium iodide |
| FSC | forward scatter |
| SSC | side scatter |
| ELISA | enzyme-linked immunosorbent assay |
| BCA | bicinchoninic acid |
| RT-PCR | Reverse Transcription Polymerase Chain Reaction |
| SEM | standard error of the mean |
References
- Hracs, L.; Windsor, C.D.; Gorospe, J.; Cummings, M.; Coward, S.; Buie, M.J.; et al. Global evolution of inflammatory bowel disease across epidemiologic stages. Nature 2025, 642: 458-466. [CrossRef]
- Li, Y.; Chen, J.; Bolinger, A.A.; Chen, H.; Liu, Z.; Cong, Y.; et al. Target-based small molecule drug discovery towards novel therapeutics for inflammatory bowel diseases. Inflamm Bowel Dis 2021, 27: S38-S62. [CrossRef]
- Abraham, C.; Cho, J.H. Inflammatory Bowel Disease. N Engl J Med 2009, 361: 2066-78. [CrossRef]
- Sandborn, W.J.; Feagan, B.G.; Rutgeerts, P.; Hanauer, S.; Colombel, J.F.; Sands, B.E.; et al. Vedolizumab as induction and maintenance therapy for Crohn’s disease. N Engl J Med 2013, 369: 711-21. [CrossRef]
- Fujino, S.; Andoh, A.; Bamba, S.; Ogawa, A.; Hata, K., Araki, T.; et al. Increased expression of interleukin 17 in inflammatory bowel disease. Gut 2003, 52: 65-70. [CrossRef]
- Eastaff-Leung, N.; Mabarrack, N.; Barbour, A.; Cummins, A.; Barry, S. Foxp3+ regulatory T cells, Th17 effector cells, and cytokine environment in inflammatory bowel disease. J Clin Immunol 2010, 30: 80-9. [CrossRef]
- Lee, A.Y.S.; Eri, R.; Lyons, A.B.; Grimm, M.C.; Korner, H. CC chemokine ligand 20 and its cognate receptor CCR6 in mucosal T cell immunology and inflammatory bowel disease: odd couple or axis of evil? Front Immunol 2013, 4: 194. [CrossRef]
- Skovdahl, H.K.; Granlund, A.B.; Ostvik, A.E.; Bruland, T.; Bakke, I.; Torp, S.H.; et al. Expression of CCL20 and its corresponding receptor CCR6 is enhanced in active Inflammatory Bowel Disease, and TLR3 mediates CCL20 expression in colonic epithelial cells. PLoS ONE 2015, 10(11): e0141710. [CrossRef]
- Skovdahl, H.K.; Dams, J.K.; van Beelen Granlund, A.; Ostvik, A.E.; Doseth, B.; Bruland, T.; et al. C-C motif ligand 20 (CCL20) and C-C motif chemokine receptor 6 (CCR6) in human peripheral blood mononuclear cells: dysregulated in ulcerative colitis and a potential role for CCL20 in IL-1β release. Int J Mol Sci 2018, 19: 3257. [CrossRef]
- Liu, J.Z.; van Sommeren, S.; Huang, H.; Ng, S.C.; Alberts, R.; Takahashi, A.; et al. Association analyses identify 38 susceptibility loci for inflammatory bowel disease and highlight shared genetic risk across populations. Nat Genet 2015, 47: 979-86. [CrossRef]
- Katchar, K.; Kelly, C.P.; Keates, S.; O’Brien, M.J.; Keates, A.C. MIP-3alpha neutralizing monoclonal antibody protects against TNBS-induced colonic injury and inflammation in mice. Am J Physiol Gastrointest Liver Physiol 2007, 292: G1263-71. [CrossRef]
- Varona, R.; Cadenas, V.; Flores, J.; Martinez-A, C.; Marquez, G. CCR6 has a non-redundant role in the development of inflammatory bowel disease. Eur J Immunol 2003, 33: 2937-46. [CrossRef]
- Kulkarni, N.; Meitei, H.T.; Sonar, S.A.; Sharma, P.K.; Mujeeb, V.R.; Srivastava, S.; et al. CCR6 signaling inhibits suppressor function of induced-Treg during gut inflammation. J Autoimmun 2018, 88: 121-30. [CrossRef]
- Martina, M.G.; Giorgio, C.; Allodi, M.; Palese, S.; Barocelli, E.; Ballabeni, V.; et al. Discovery of small-molecules targeting the CCL20/CCR6 axis as first-in-class inhibitors for inflammatory bowel diseases. Eur J Med Chem 2022, 5; 243: 114703. [CrossRef]
- Allodi, M.; Giorgio, C.; Incerti, M.; Corradi, D.; Flammini, L.; Ballabeni, V.; et al. Probing the effects of MR120 in preclinical chronic colitis: A first-in-class anti-IBD agent targeting the CCL20/CCR6 axis. Eur J Pharmacol 2023, 175613. [CrossRef]
- Yoo, K.D.; Yu, M.Y.; Kim, K.H.; Lee, S.; Park, E.; Kang, S.; et al. Role of the CCL20/CCR6 axis in tubular epithelial cell injury: kidney-specific translational insights from acute kidney injury to chronic kidney disease. FASEB J 2024, 38: e23407. [CrossRef]
- Barbieri, F.; Martina, M.G.; Giorgio, C.; Chiara, M.L.; Allodi, M.; Durante, J.; et al. Benzofuran-2-carboxamide derivatives as immunomodulatory agents blocking the CCL20-infuced chemotaxis and colon cancer growth. ChemMedChem 2024, 19: e202400389. [CrossRef]
- Kjellev, S.; Lundsgaard, D.; Poulsen, S.S.; Markholst, H. Reconstitution of scid mice with CD4+CD25- T cells leads to rapid colitis: an improved model for pharmacologic testing. Int Immunopharmacol 2006, 6: 1341-54. [CrossRef]
- Powrie, F.; Leach, M.W.; Mauze, S.; Caddle, L.B.; Coffman, R.L. Phenotypically distinct subsets of CD4+ T cells induce or protect from chronic intestinal inflammation in C. B-17 scid mice. Int Immunol 1993, 5: 1461-71. [CrossRef]
- te Velde, A.A.; de Kort, F.; Sterrenburg, E.; Pronk, I.; ten Kate, F.J.W.; Hommes, D.W.; et al. Comparative analysis of colonic gene expression of three experimental colitis models mimicking inflammatory bowel disease. Inflamm Bowel Dis 2007, 13: 325-30. [CrossRef]
- Kiesler, P.; Fuss, I.J.; Strober, W. Experimental Models of Inflammatory Bowel Diseases. Cell Mol Gastroenterol Hepatol 2015, 1: 154-70. [CrossRef]
- Valatas, V.; Bamias, G.; Kolios, G. Experimental colitis models: insights into the pathogenesis of inflammatory bowel disease and translational issues. Eur J Pharmacol 2015, 759: 253-64. [CrossRef]
- Comerford, I.; Bunting, M.; Fenix, K.; Haylock-Jacobs, S.; Litchfield, W.; Harata-Lee, Y. et al. An immune paradox: how can the same chemokine axis regulate both immune tolerance and activation? CCR6/CCL20: a chemokine axis balancing immunological tolerance and inflammation in autoimmune disease, Bioessay 2010, 32, 1067–1076. [CrossRef]
- Kitamura, K.; Farber, J.M.; Kelsall, B.L. CCR6 marks regulatory T cells as a colon-tropic, IL-10-producing phenotype. J Immunol 2010, 185: 3295-3304. [CrossRef]
- Ostanin, D.V.; Bao, J.; Koboziev, I.; Gray, L.; Robinson-Jackson, S.A.; Kosloski-Davidson M.; et al. T cell transfer model of chronic colitis: concepts, considerations, and tricks of the trade. Am J Physiol Gastrointest Liver Physiol 2009, 296: G135-G416. [CrossRef]
- Wang, C.; Kang, S.G.; Lee, J.; Sun, Z.; Kim, C.H. The roles of CCR6 in migration of Th17 cells and regulation of effector T-cell balance in the gut. Mucosal Immunol 2009, 2: 173-83. [CrossRef]
- Lindebo Holm, T.; Poulsen, S.S.; Markholst, H.; Reedtz-Runge, S. Pharmacological evaluation of the SCID T cell transfer model of colitis: as a model of Crohn’s disease. Int J Inflamm 2012, 2012: 412178. [CrossRef]
- Scott, F.L.; Clemons, B.; Brooks, J.; Brahmachary, E.; Powell, R.; Dedman, H.; et al. Ozanimod (RCP1063) is a potent sphingosine-1-phosphate receptor-1 (S1P1) and receptor-5 (S1P5) agonist with autoimmune disease-modifying activity. Br J Pharmacol 2016, 173: 1778-92. [CrossRef]
- Cooper, H.S.; Murthy, S.N.; Shah, R.S.; Sedergran, D.J. Clinico-pathological study of dextran sulfate sodium experimental murine colitis. Lab Invest 1993, 69, 238–49.
- Bischoff, S.C.; Mailer, R.; Pabst, O.; Weier, G.; Sedlik, W.; Li, Z.; et al. Role of serotonin in intestinal inflammation: knock out of serotonin reuptake transporter exacerbates 2,4,6-trinitrobenzene sulfonic acid colitis in mice. Am J Physiol Gastrointest Liver Physiol 2009, 296: G685-G695. [CrossRef]
- Giorgio, C.; Allodi, M.; Palese, S.; Grandi, A.; Tognolini, M.; Castelli, R.; et al. UniPR1331: Small Eph/Ephrin Antagonist Beneficial in Intestinal Inflammation by Interfering with Type-B Signaling. Pharmaceuticals 2021; 14(6), 502. [CrossRef]
- Ivey, C.L.; Williams, F.M.; Collins, P.D.; Jose, P.J.; Williams, T.J. Neutrophil chemoattractants generated in two phases during reperfusion of ischemic myocardium in the rabbit. Evidence for a role for C5a and interleukin-8. J Clin Invest 1995, 95, 2720-8. [CrossRef]
- Kruisbeek, A.M. Isolation of mouse mononuclear cells. Curr Protoc Immunol 2001, 39, 3.1.1–3.1.5. [CrossRef]
Figure 1.
Compound MR120 and its optimized derivative MR452. Migration index = ratio between n. migrated cells with vehicle or compound and n. CCL20-migrated cells with vehicle or compound; Relative migration index = ratio between n. CCL20-migrated cells with compound and n. CCL20-migrated cells with vehicle.
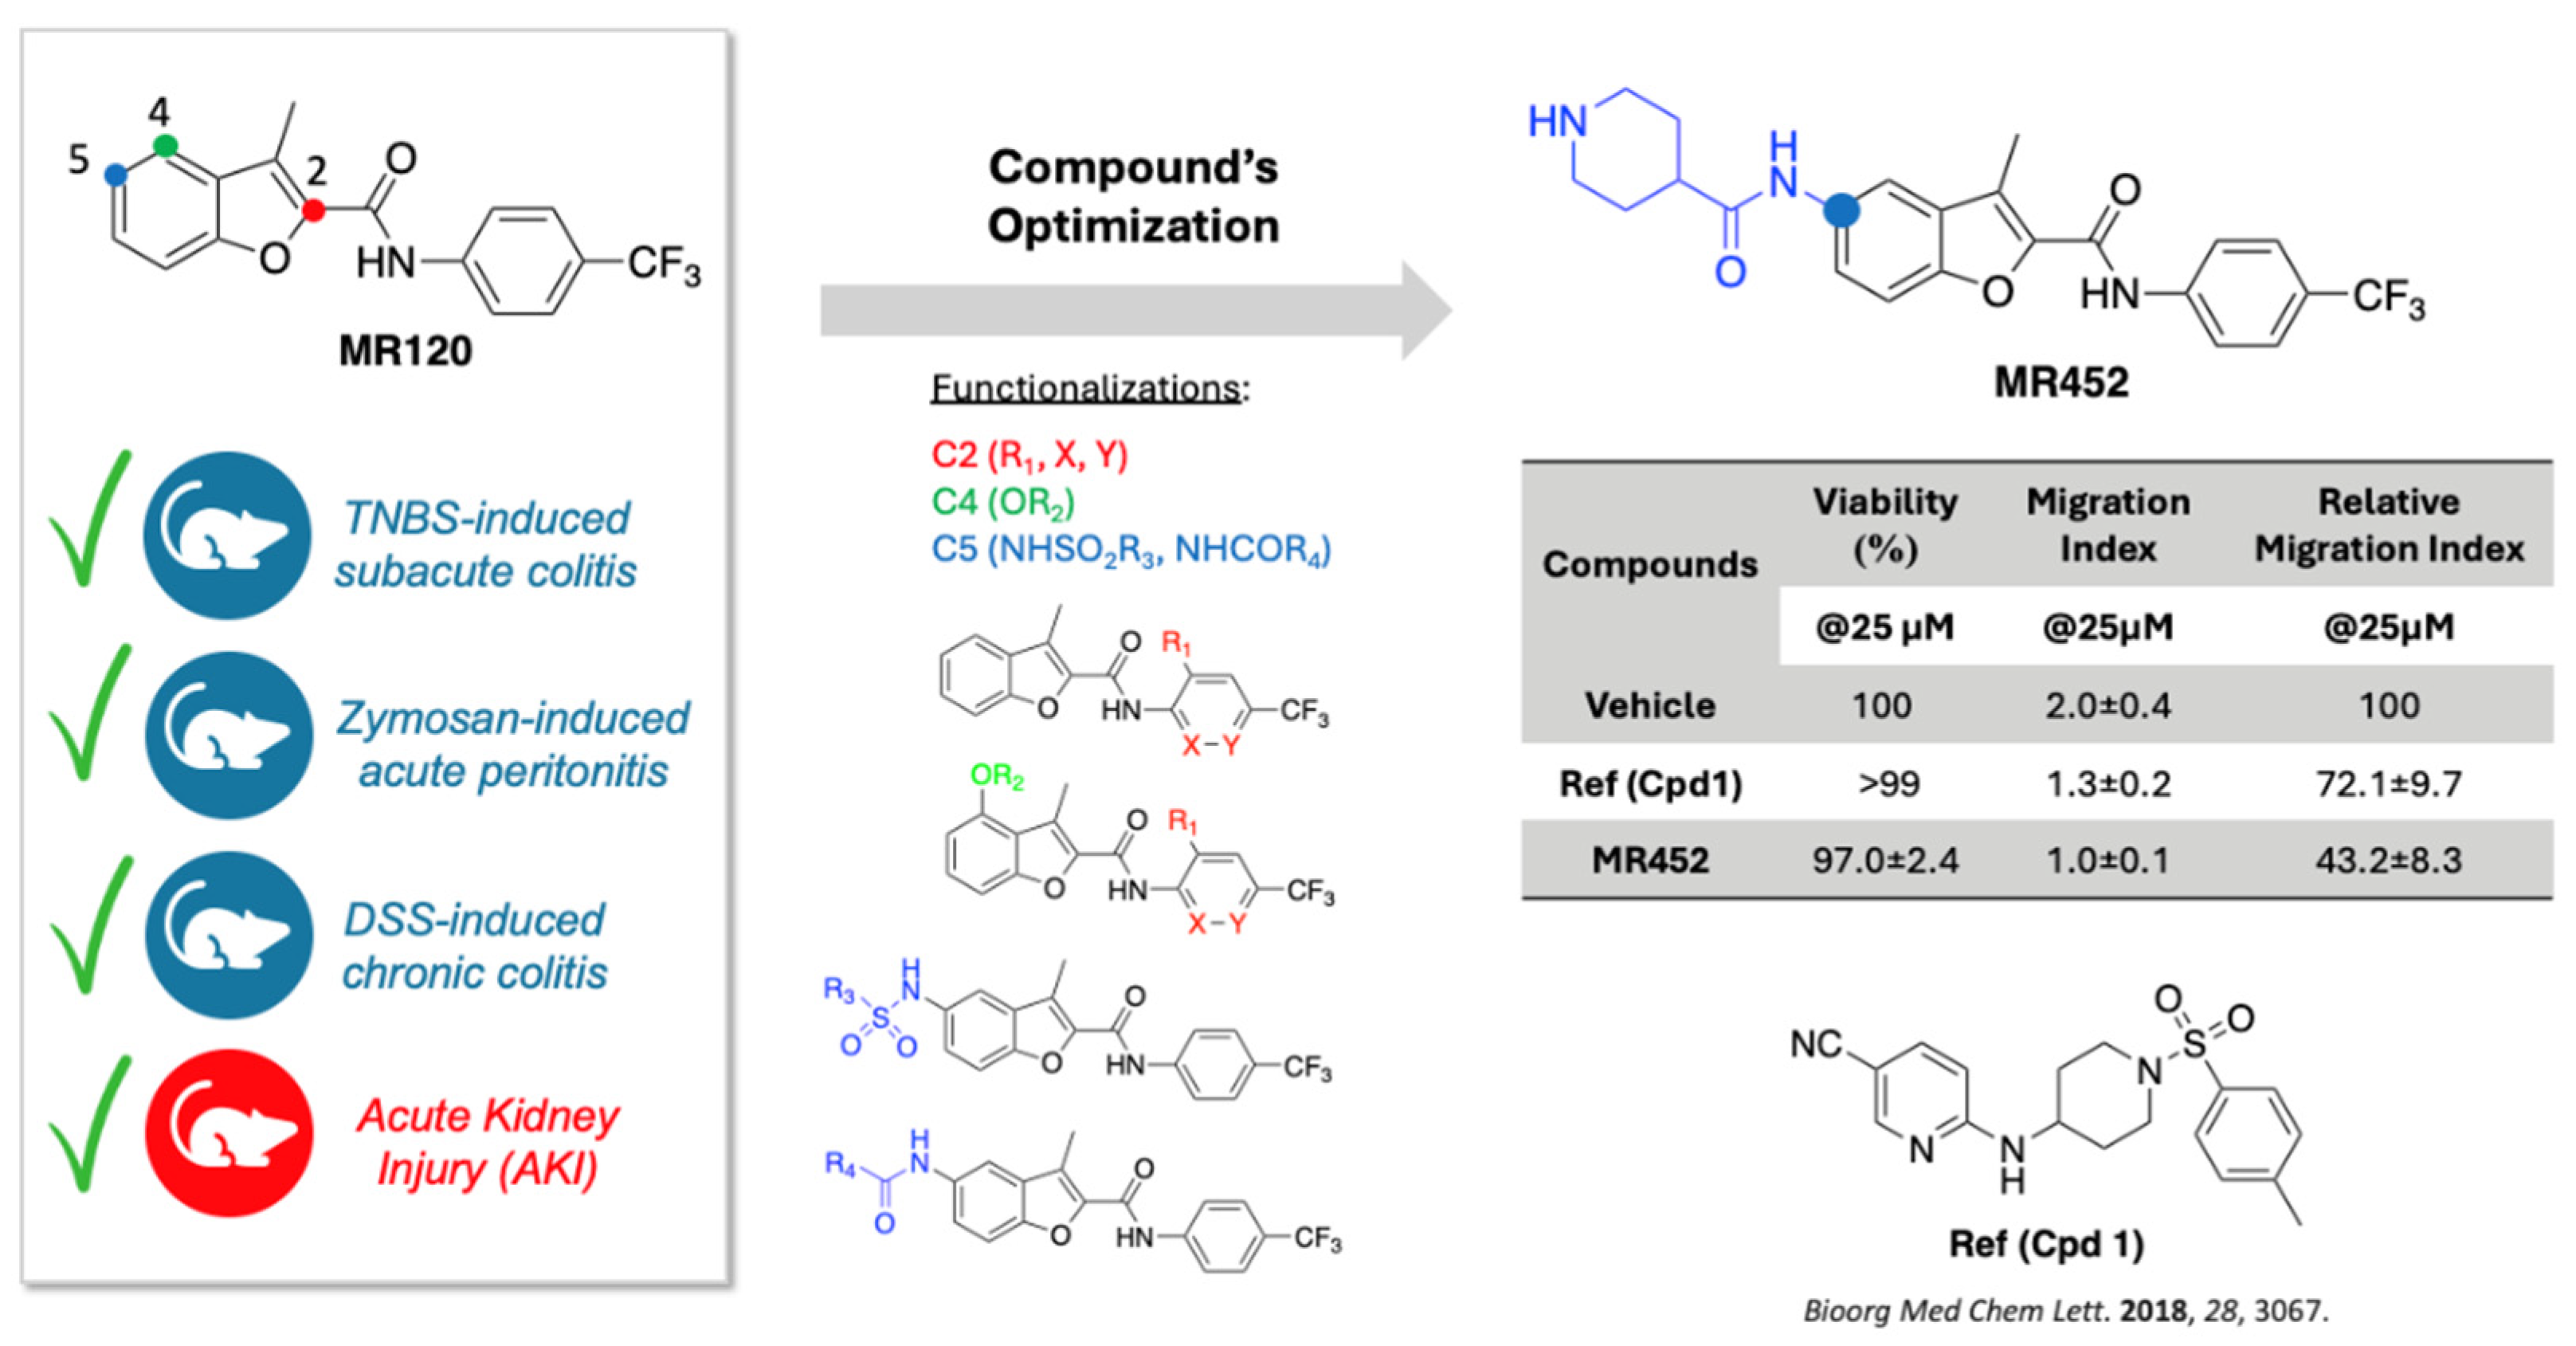
Figure 2.
Curves representing the Disease Activity Index (DAI) score, assessed during adoptive transfer colitis in vehicle-treated S mice (●) and colitic mice administered with vehicle (C ■), MR120 1mg/kg (▲) or MR452 1mg/kg (▼) (n=6-8 independent values per group). *P<0.05 vs. S mice, two-way ANOVA followed by Tukey’s post-test.
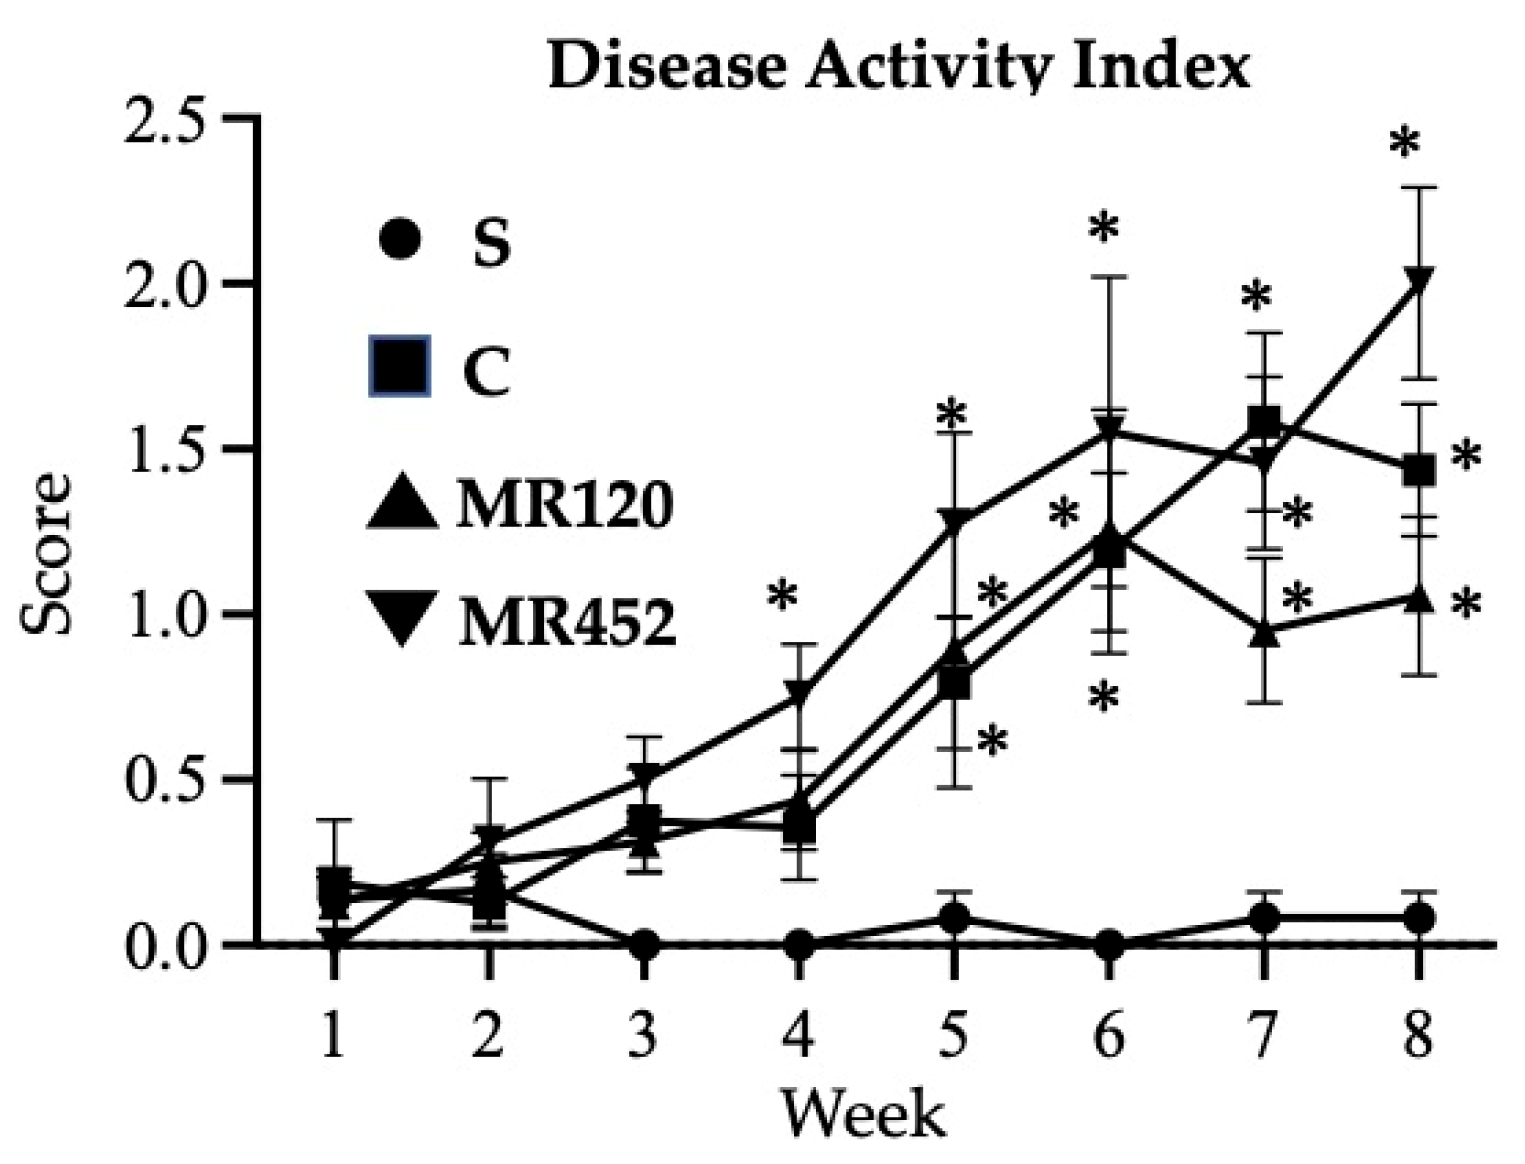
Figure 3.
Effects of MR120 and MR452 on colon length (a), spleen/body weight (BW) ratio (b), colon thickness (c) and macroscopic score (d) assessed in vehicle-treated S mice and in CD4+CD25- T cell transferred mice administered with vehicle (C), MR120 1mg/kg or MR452 1mg/kg (n=6-8 independent values per group). *P<0.05 vs. S mice, one-way ANOVA followed by Bonferroni’s post-test; Kruskal-Wallis followed by Dunn’s post-test (for macroscopic score).
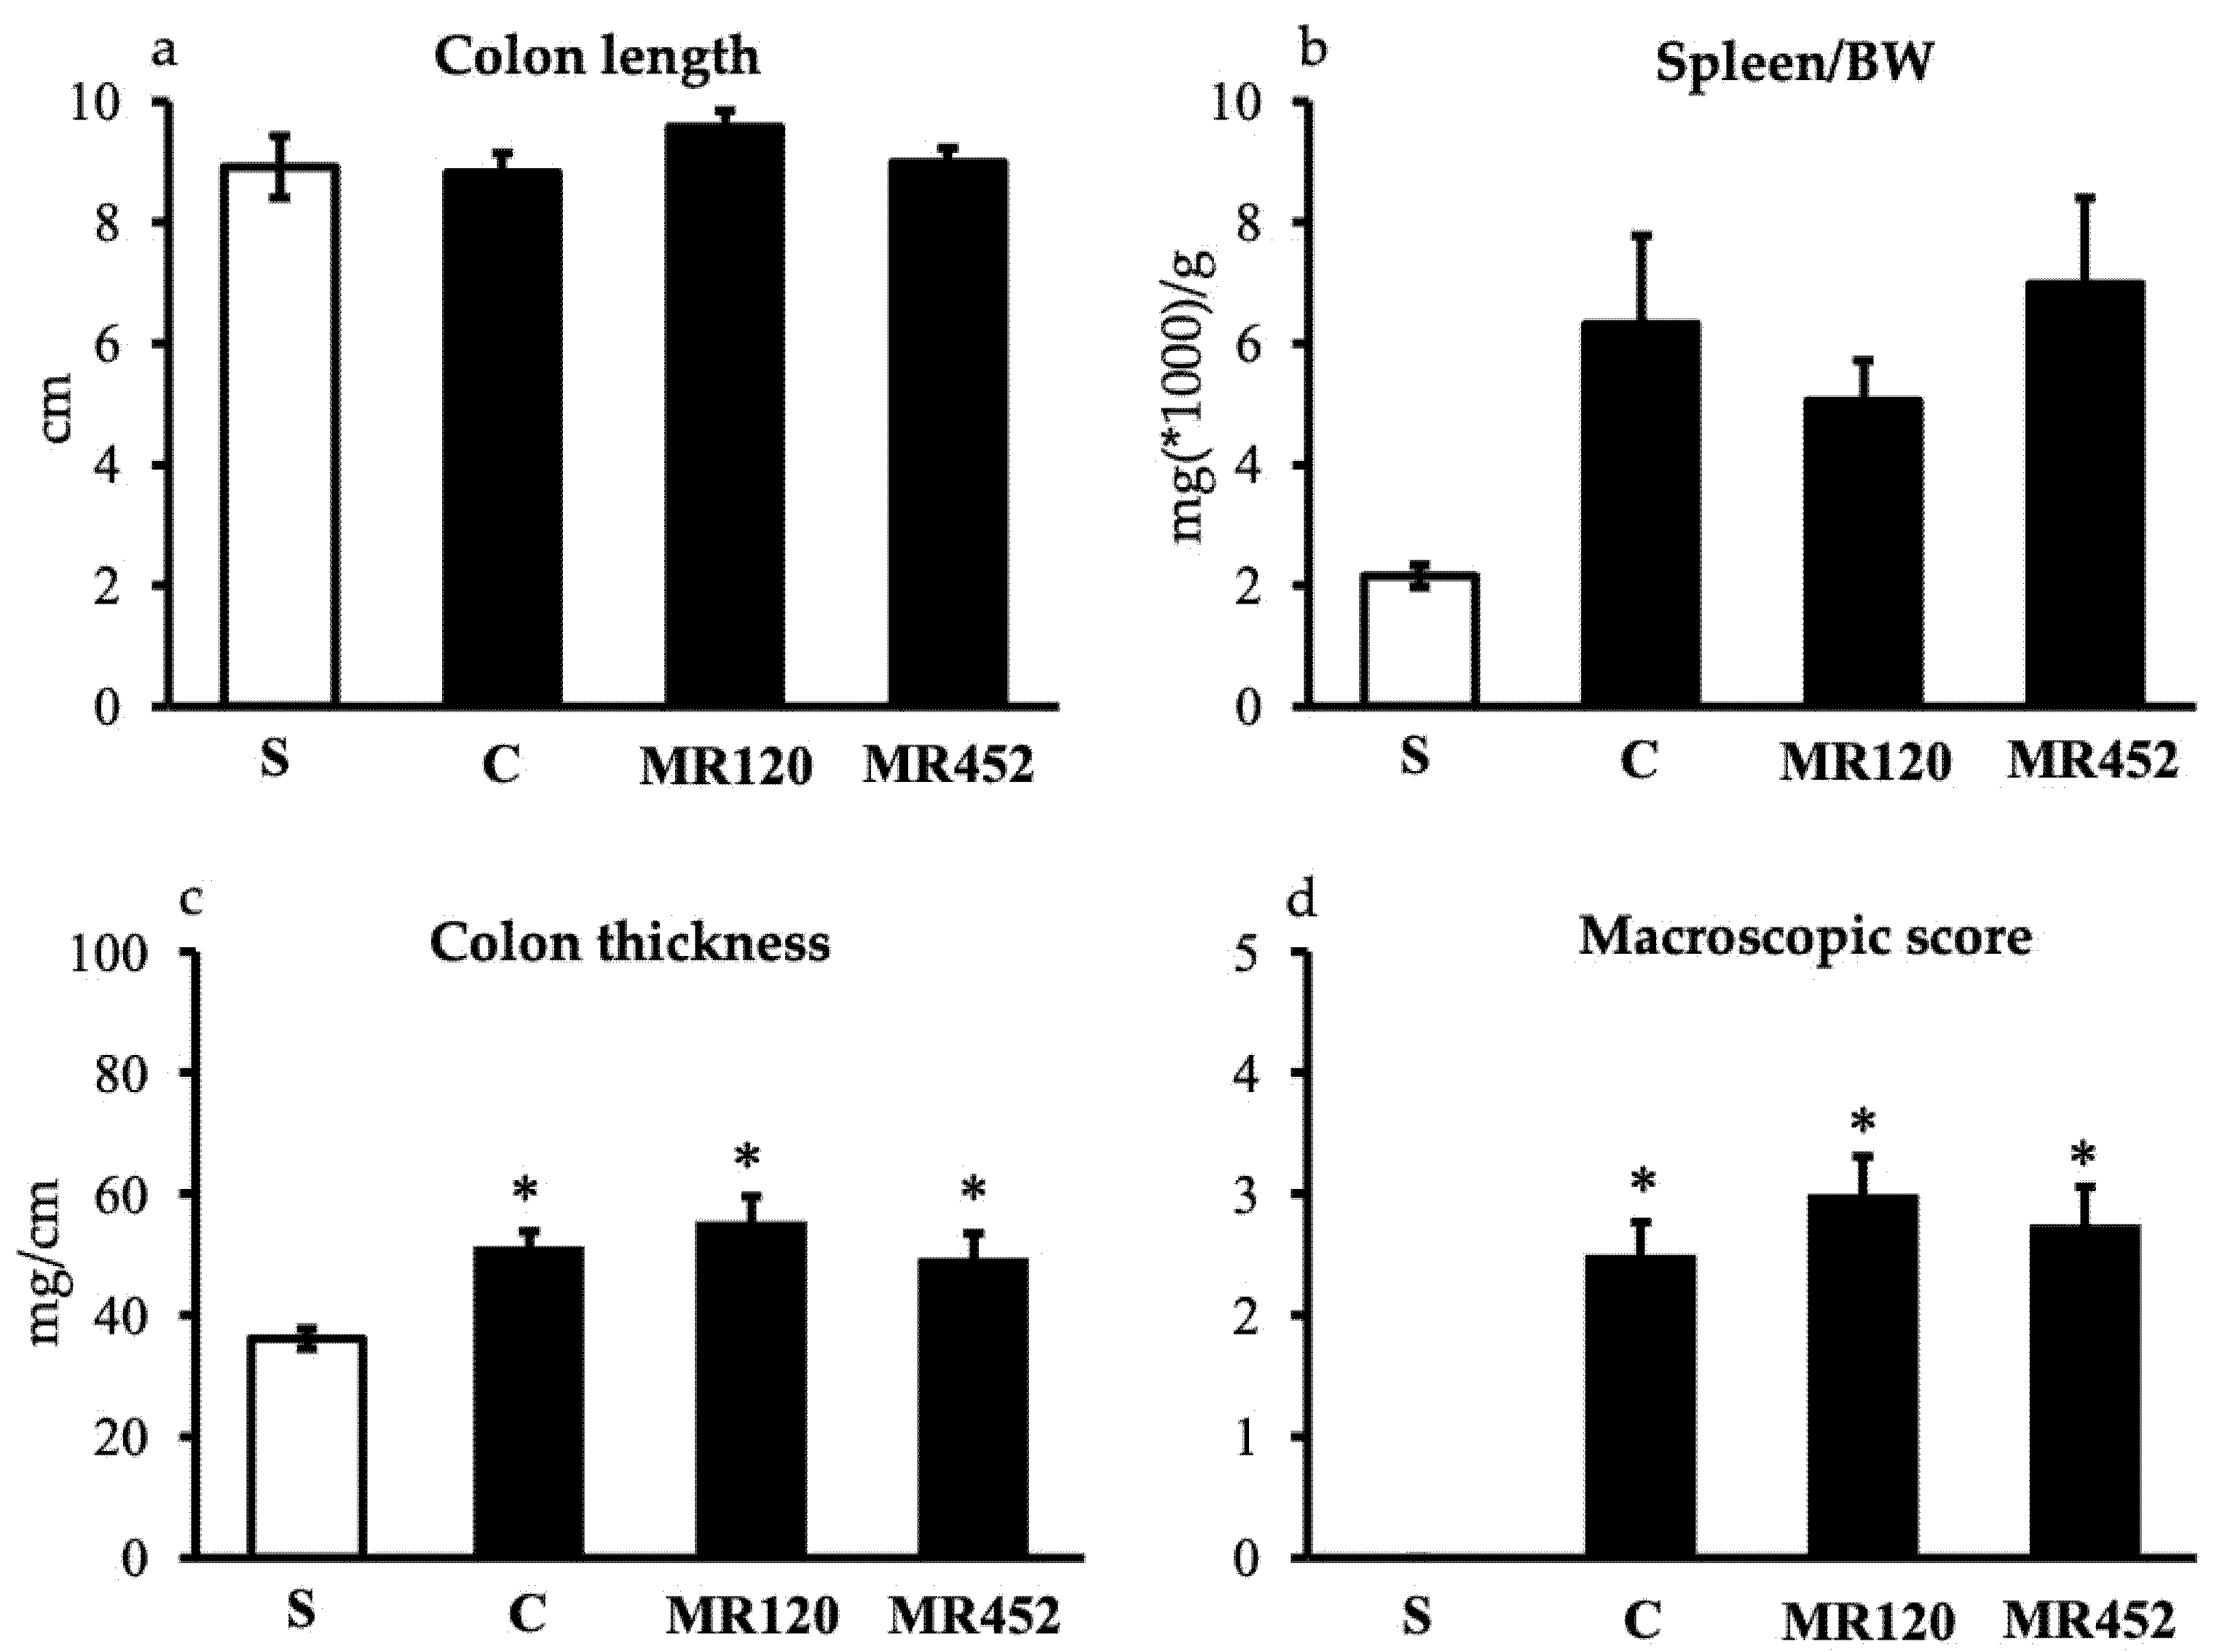
Figure 4.
Effects of MR120 and MR452 on colonic MPO activity (U/g dry colon) assessed in vehicle-treated S mice and in CD4+CD25- T cell transferred mice administered with vehicle (C), MR120 1mg/kg or MR452 1mg/kg (n=6-8 independent values per group). *P<0.05 vs. S mice, #P<0.05 vs. C mice, one-way ANOVA followed by Bonferroni’s post-test.
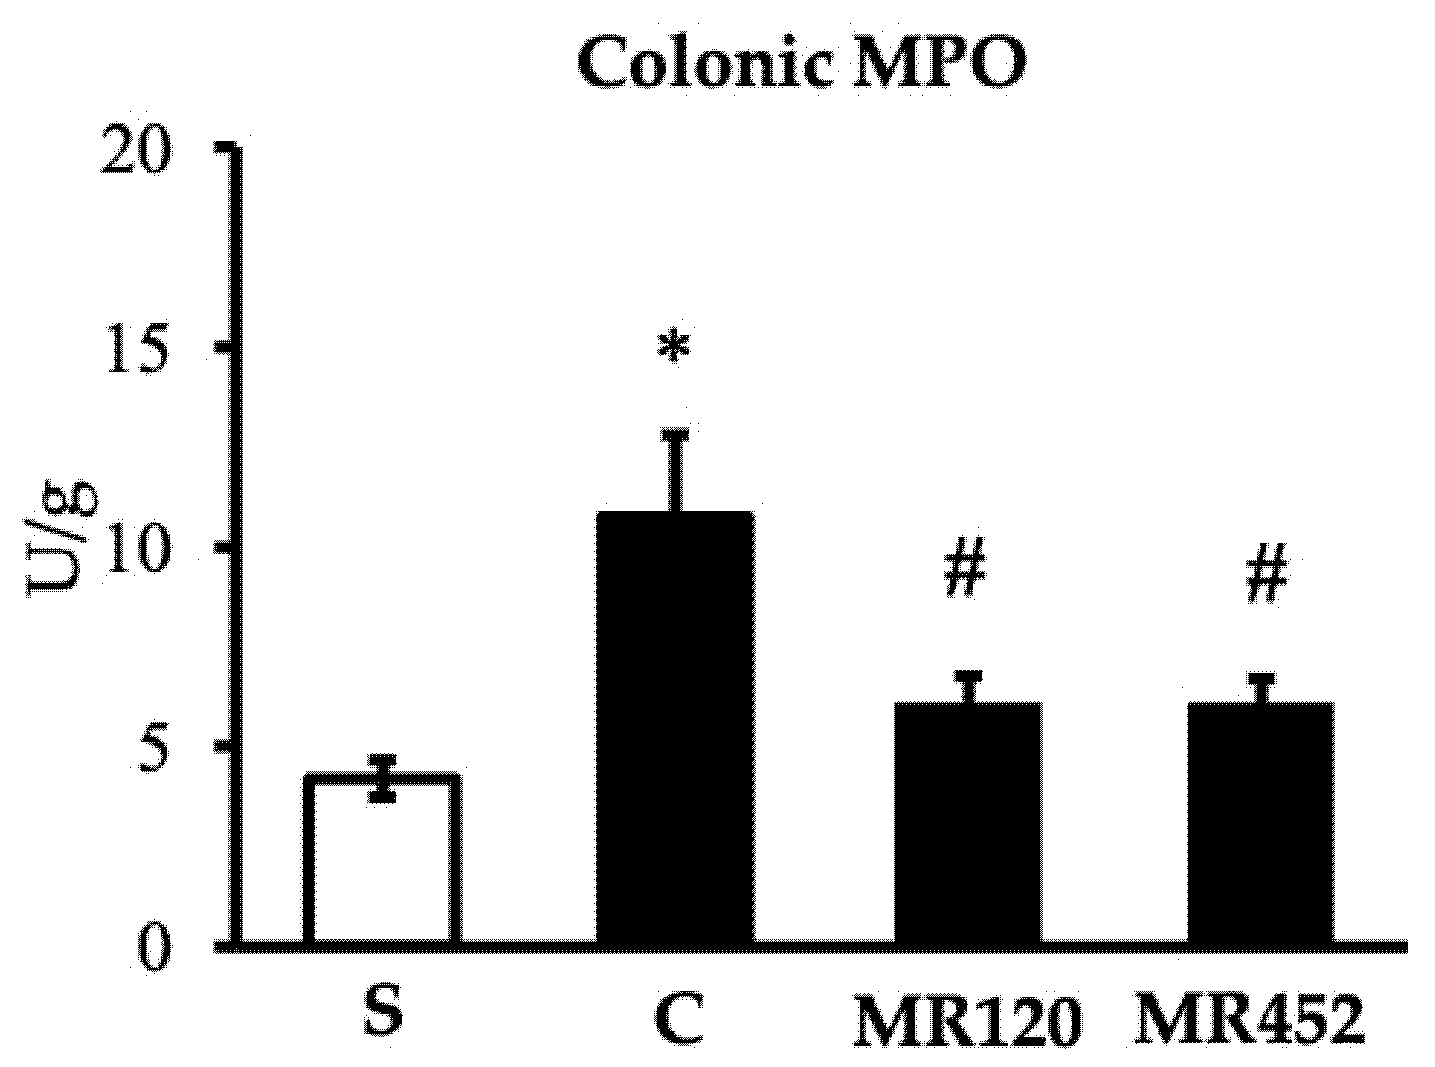
Figure 5.
Effects of MR120 and MR452 on T lymphocytes of mesenteric lymph nodes in vehicle-treated normal mice (S) and colitic mice administered with vehicle (C), MR120 1 mg/Kg or MR452 1 mg/Kg (n=5-8 independent values per group). *P<0.05 vs S; one-way ANOVA + Bonferroni’s post-test.
Figure 5.
Effects of MR120 and MR452 on T lymphocytes of mesenteric lymph nodes in vehicle-treated normal mice (S) and colitic mice administered with vehicle (C), MR120 1 mg/Kg or MR452 1 mg/Kg (n=5-8 independent values per group). *P<0.05 vs S; one-way ANOVA + Bonferroni’s post-test.
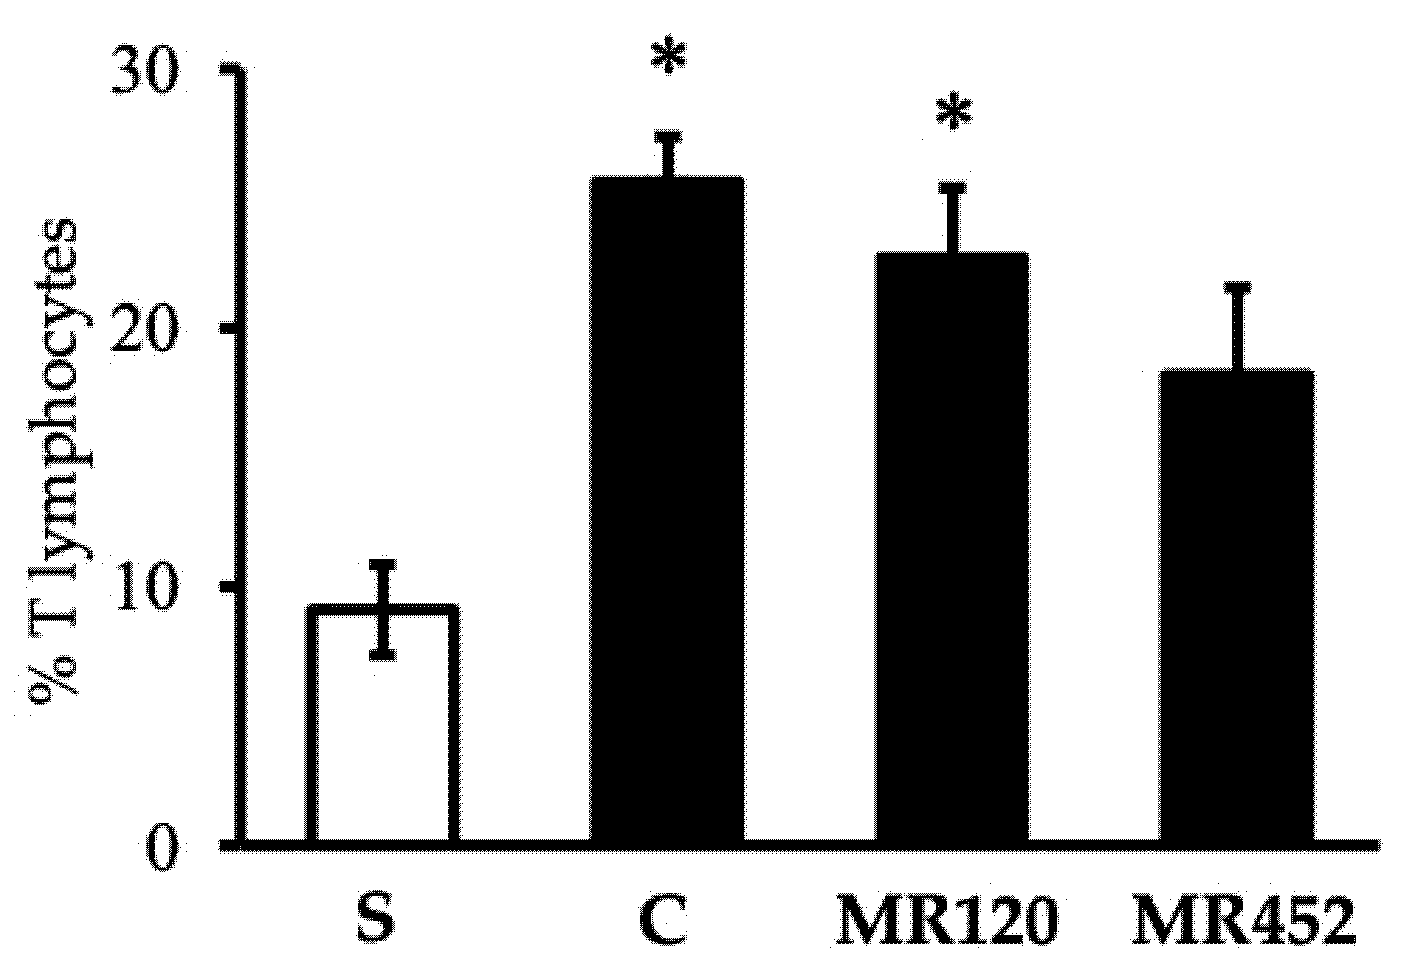
Figure 6.
Histograms representing colonic CCL20 (a), IL-1β (b), and IL-6 (c) levels in vehicle-treated normal mice (S) and colitic mice administered with vehicle (C), MR120 1 mg/kg or MR452 1 mg/kg (n=4-7 independent values per group). *P<0.05 vs S; #P<0.05 vs C, one-way ANOVA + Bonferroni’s post-test.
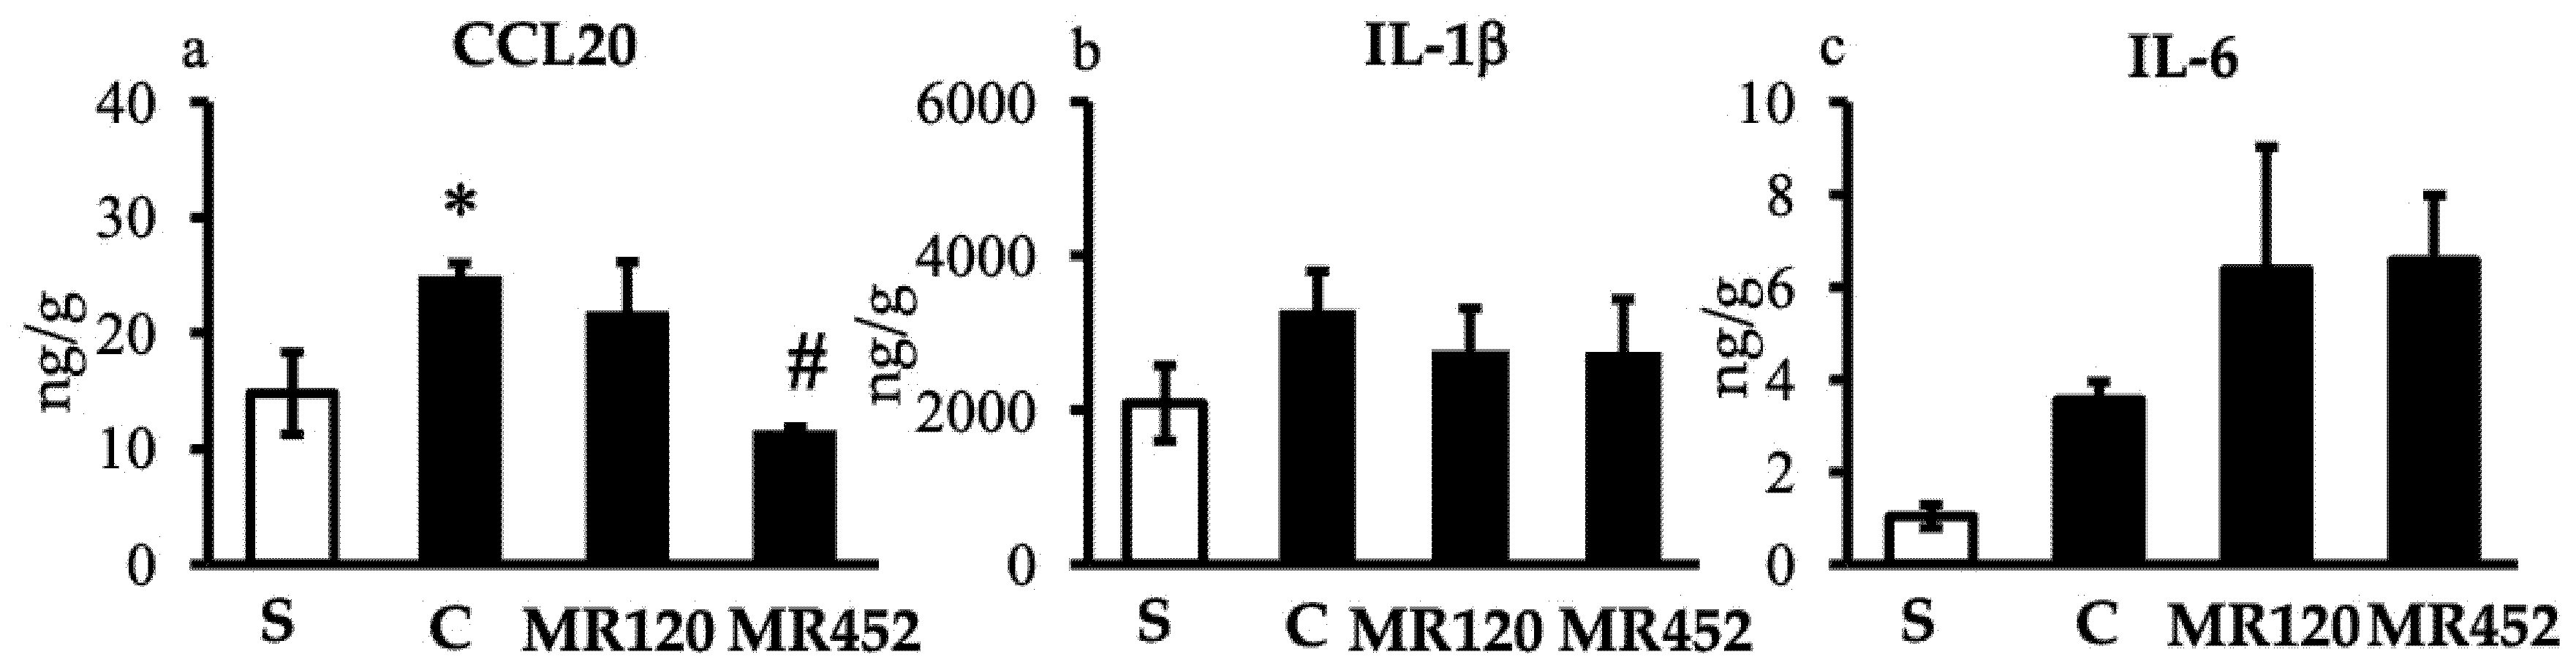
Figure 7.
Histograms representing the quantification of colonic mRNA levels of CCL20 (a), IL-17 (b), and IFN-γ (c) in vehicle-treated normal mice (S) and colitic mice administered with vehicle (C), MR120 1 mg/kg or MR452 1 mg/kg (n=4-6 independent values per group). *P<0.05 vs S, one-way ANOVA + Bonferroni’s post-test.
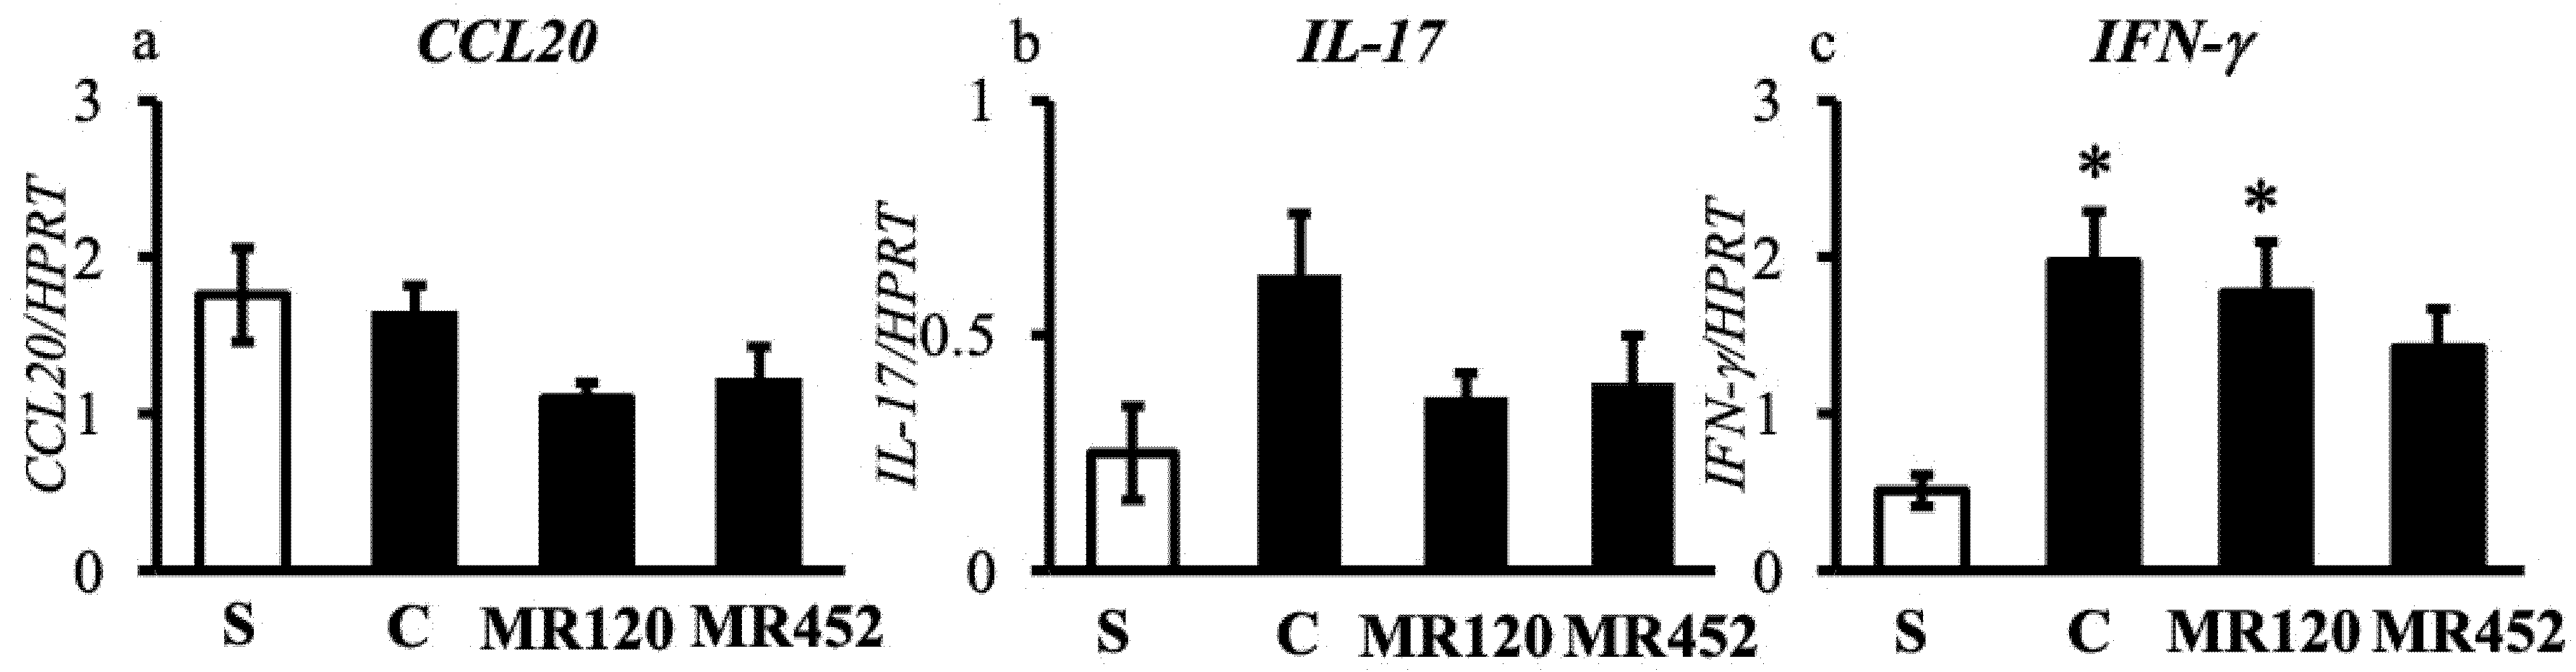
Figure 8.
Experimental design for adoptive T cell transfer colitis and pharmacological treatments.


Table 1.
Percentage of CD4+ T lymphocytes in MLNs obtained from vehicle-treated normal mice (S) and colitic mice administered with vehicle (C), MR120 1 mg/kg or MR452 1 mg/kg (n=5-8 independent values per group).
Table 1.
Percentage of CD4+ T lymphocytes in MLNs obtained from vehicle-treated normal mice (S) and colitic mice administered with vehicle (C), MR120 1 mg/kg or MR452 1 mg/kg (n=5-8 independent values per group).
| S | C | MR120 | MR452 | |
|---|---|---|---|---|
| %CD4+ T lymphocytes | 80.5±3.4 | 87.4±2.1 | 87.5±2.8 | 77.5±3.4 |
Disclaimer/Publisher’s Note: The statements, opinions and data contained in all publications are solely those of the individual author(s) and contributor(s) and not of MDPI and/or the editor(s). MDPI and/or the editor(s) disclaim responsibility for any injury to people or property resulting from any ideas, methods, instructions or products referred to in the content. |
© 2025 by the authors. Licensee MDPI, Basel, Switzerland. This article is an open access article distributed under the terms and conditions of the Creative Commons Attribution (CC BY) license (https://creativecommons.org/licenses/by/4.0/).
Copyright: This open access article is published under a Creative Commons CC BY 4.0 license, which permit the free download, distribution, and reuse, provided that the author and preprint are cited in any reuse.


