Submitted:
18 July 2025
Posted:
18 July 2025
You are already at the latest version
Abstract
Thyroid disease is a significant medical condition affecting approximately 20 million Americans. The thyroid gland regulates metabolism through hormones such as triiodothyronine (T3) and thyroxine (T4), with disorders that typically manifest as hypothyroidism or hyperthyroidism. This study evaluates the performance of various machine learning models in predicting and diagnosing thyroid disease, including logistic regression, decision trees, random forest, XGBoost, support vector machines, neural networks, bagging and stackingmethods. The bagging model that used three decision trees achieved the highest F1 score of 0.9766, outperforming both Random Forest and XGBoost. Furthermore, experiments on class balancing through undersampling and regrouping significantly improved model performance, particularly for stacking models with XGBoost, which attained an F1 Score of 0.9944.
Keywords:
disease prediction
; machine learning
; ensemble learning
; data imbalance
1. Introduction
Approximately 20 million Americans are affected by some form of thyroid disease according to American Thyroid Association. Women are five to eight times more likely than men to develop thyroid problems, with one in eight women experiencing a thyroid disorder at some point in their lifetime. Thyroid disease is a health condition that impairs the thyroid gland’s ability to function properly. Located in the neck, this gland produces and releases thyroid hormones, which are vital for regulating metabolism and development. These hormones have widespread effects on numerous organs. The thyroid gland generates and secretes triiodothyronine (T3) and thyroxine (T4) [1]. Thyroid disease primarily manifests in two forms based on the thyroid hormone level: hypothyroidism (underactive thyroid) and hyperthyroidism (overactive thyroid). Hypothyroidism results in insufficient hormone production by the thyroid gland. In contrast, hyperthyroidism happens when the thyroid gland produces an excessive amount of hormones [2].
Predicting thyroid disease is crucial for early intervention and prevention. Early prediction can lead to timely treatment, improving patient outcomes and reducing the risk of complications. Research indicates that thyroid disease is strongly associated with factors such as age, gender, smoking, family history, and several other variables. Manji et al. [3] found that thyroid disease phenotype shows strong correlations with age at diagnosis, disease severity, goiter, ophthalmopathy, smoking, and family history, suggesting interactions between genetic and environmental or internal factors.genetic and environmental or internal factors. Strieder et al. [4] noted that the occurrence of both Hashimoto’s thyroiditis and Graves’ disease within a single family suggests a common genetic basis for autoimmune thyroid diseases. The use of estrogen is linked to a reduced risk of developing hyperthyroidism, while pregnancy is associated with an increased risk.
In addition to clinical studies, machine learning methods also play an important role in thyroid disease prediction. These advanced techniques can analyze vast amounts of data to identify patterns and risk factors, leading to more accurate and early diagnoses, ultimately enhancing prevention and treatment strategies. Chaubey et al. [5] compared the performance of logistic regression, decision trees, and k-nearest neighbor (kNN) algorithms for thyroid disease prediction. Their study achieved an increase in precision to 96. 875%. Tyagi et al. [6] proposed using support vector machines (SVM), k-nearest neighbors (k-NN), and decision trees to predict the estimated risk of a patient developing thyroid disease. Their SVM models achieved an accuracy of 99.63%. Aversano et al. [7] aims to predict the Levothyroxine Sodium (LT4) treatment trend for patients suffering from hypothyroidism. They compared 10 different machine learning classifiers, getting an 84% accuracy with the Extra-Tree Classifier.
Logistic regression, random forest, and XGBoost classifiers are considered baseline models for thyroid disease prediction, with logistic regression achieving the highest precision of 98.148% [8]. In contrast, Raisinghani et al. [9] evaluated multiple machine learning models for thyroid disease prediction and found that decision trees were the most effective, attaining an accuracy of 99.46%, which contradicts the performance claims made by the dataset source. Artificial Neural Networks also show competitive performance in predicting thyroid disease, resulting in an accuracy of 97.5%[10].
One of the key challenges in disease prediction lies in addressing class imbalance within medical datasets. Imbalanced data can significantly hinder model performance, as predictive algorithms may become biased toward the majority class, overlooking minority cases that are often of critical clinical importance. Traditional methods to mitigate this issue include over-sampling and under-sampling, which modify the class distribution to improve learning outcomes. Over-sampling techniques, such as random duplication of minority class instances, may lead to overfitting by adding no new information [11]. Conversely, under-sampling methods reduce the majority class size to restore class balance, typically through random instance removal [12]. While under-sampling helps mitigate bias, it risks discarding valuable information.
A second major challenge in thyroid disease prediction is the lack of clear clinical boundaries between diagnostic classes. In real-world datasets, the healthy class often dominates, and certain conditions—such as hyperthyroidism and concurrent non-thyroidal illness—may exhibit overlapping clinical features. This ambiguity can make it difficult for models to distinguish between classes accurately and generalize effectively to real clinical scenarios.
Another significant challenge for advancing thyroid disease prediction lies in selecting appropriate ensemble learning strategies. Pan et al. [13] proposed a Random Forest-based ensemble method that demonstrated strong capabilities, finalizing predictions based on majority voting across subset classifiers. Their model outperformed traditional single classifiers such as support vector machines (SVM), neural networks, and standalone Random Forests. Mahajan et al. [14] reviewed extensive literature from 2016 to 2023, concluding that although stacking was the least commonly used ensemble method, it consistently yielded the highest accuracy. Similarly, Yadav et al. [15] reported that bagging methods achieved 100% accuracy, surpassing individual algorithms. Most recently, Obaido et al. [16] demonstrated that stacking ensembles outperformed individual models in thyroid disease prediction. In this paper, we present three key contributions:
- We address the class imbalance challenge by exclusively applying under-sampling in combination with k-fold cross-validation. This approach preserves as much informative content as possible while promoting robust and unbiased model evaluation.
- This study proposes a revised class grouping to reduce imbalance and better reflect clinical realities. By merging related classes and evaluating models under both original and modified structures, we improve the robustness and applicability of thyroid disease prediction.
- Our study conducts a comparative analysis of different models, demonstrating that ensemble techniques significantly improve predictive accuracy and handle data complexity more effectively, achieving up to 99.44% accuracy.
This study investigates the application of various machine-learning techniques to detect thyroid disease using real medical data from Australia. We begin by reviewing existing literature to highlight both traditional and recent advancements in thyroid disease detection. A detailed theoretical framework of the statistical models and methodologies employed in this research is also presented. To evaluate the performance of these models, we conduct three experiments using different data mining techniques and assess their results across four key metrics: Accuracy, Precision, Recall, and F1 score. These findings are systematically compared, analyzed, and discussed to uncover potential patterns underlying the complex statistics. Finally, we propose directions for future research based on our experimental outcomes and conclude by summarizing the study’s most significant findings.
2. Background
2.1. Models
2.1.1. Random Forest
The random forest (RF) was first proposed by Leo Breiman [17]. It is a decision tree-based ensemble learning algorithm that is suitable for classification and regression problems, and its regression model is used in research on thyroid disease detection [18]. The key idea of RF is to average the predictions of several randomized decision trees by combining bagging with a random subspace method [19]. With bagging, the variance of the final prediction is obtained by averaging the noisy but relatively unbiased decision tree-base models. Each decision tree is built from a bootstrap sample from the original dataset, which ends with more diversity and higher accuracy. For our demand sensing research, the RF regression model is used. This method is effective in handling complex patterns in medical data, making it suitable for classification problems such as thyroid disease diagnosis.
2.1.2. XGBoost
Extreme Gradient Boosting (XGBoost) is a highly efficient and scalable machine learning algorithm that extends the gradient boosting framework. It was initially developed as a research project by Chen and Guestrin [20]. This approach yields a powerful model known for its robustness and high predictive accuracy, making XGBoost a popular choice in disease prediction and diagnosis.
XGBoost builds an ensemble of decision trees, where each tree is trained to correct the errors of its predecessors by focusing on residual errors. The objective function in XGBoost combines the training loss function with a regularization term:
where represents the loss function, such as mean squared error for regression, and denotes the regularization term for the k-th tree.
2.1.3. Bagging
Bootstrap Aggregating, commonly known as Bagging, is a powerful ensemble learning technique designed to improve the accuracy and stability of machine learning models, particularly those prone to high variance [21]. The procedure begins with the original dataset, from which multiple bootstrap samples are generated by sampling with replacement. Each bootstrap sample is then used to train an independent model, typically of the same type. This process leads to a set of diverse models, each with its own perspective on the underlying data. Once all models are trained, their outputs are aggregated [22]. To visually clarify the steps involved in the bagging process, Figure 1 illustrates the generation of bootstrap samples, training of multiple models, and the aggregation of their predictions. In our study, decision trees, random forests, and XGBoost are selected as the classifiers for our bagging models due to their successful performance in handling diverse types of data.
arrows.meta, positioning
2.1.4. Stacking
Stacking is an ensemble technique where multiple base-level classifiers are combined with a meta-learner. In this approach, the original dataset is fed into various distinct models [23]. The meta-classifier is then used to assess both the input and the output of each model, along with their associated weights. This process allows for the selection of the top-performing models while discarding the less effective ones. Stacking works by integrating the predictions from several base classifiers, each trained with different learning methods on the same dataset. The model predictions are then combined with the inputs from subsequent layers to produce a new set of predictions [24]. Stacking is found to be very helpful in disease detection as stated in the research of Mahajan et al. [14] with even slightly better performance than other ensemble learning techniques like bagging or voting. In this paper, the model that delivers the best performance will be used as our meta-learner, and it will be combined with different weak learners to figure out the best way of stacking models for our thyroid data. Considering the great historical performance of random forest and extreme gradient boosting, these two models are chosen as great candidates as meta learners for our stacking models. To be specific, three stacking models are operated to evaluate the effect of stacking for thyroid disease prediction, which are stacking 3 random forests as base learners and one random forest as meta learner, 3 random forests as base learners, and one extreme gradient boosting as meta learner and 3 extreme gradient boosting as base learners and one extreme gradient boosting as meta learner.
2.2. 5-Fold Cross-Validation
K-fold cross-validation is a technique used to evaluate the performance of a machine learning model by dividing the dataset into k equal folds. In each iteration, one fold is used as the validation set, while the remaining k−1 folds are used for training the model. This process is repeated k times, with each fold serving as the validation set once. The results are then averaged to provide a more reliable estimate of the model’s performance. This method will help ensure that the model generalizes well to new, unseen data by reducing the risk of overfitting in our research. The dataset will be divided into 5 folds in this research in consideration of the balance of our limited calculating power and the brought benefit.
2.3. Evaluation Metrics
In this study, we employ four fundamental evaluation metrics—Accuracy, Precision, Recall, and F1 Score—to assess the performance of our model. These metrics provide a comprehensive understanding of the model’s effectiveness, particularly in classification tasks.
2.3.1. Accuracy
Accuracy is the proportion of correctly classified instances (both true positives and true negatives) out of the total number of instances. It reflects the overall correctness of the model’s predictions.
where:
- (True Positives) represents the number of positive instances correctly classified.
- (True Negatives) represents the number of negative instances correctly classified.
- (False Positives) represents the number of negative instances incorrectly classified as positive.
- (False Negatives) represents the number of positive instances incorrectly classified as negative.
To compute accuracy for a multiclass classification problem, use the following formula:
where:
- Number of Correct Predictions is the sum of true positives for all classes.
- Total Number of Predictions is the total number of instances in the dataset.
In terms of confusion matrix elements:
where represents the number of true positives for class i and N represents the total number of instances.
2.3.2. Precision
Precision, also known as Positive Predictive Value, is the ratio of true positive predictions to the total number of positive predictions made by the model. Precision indicates how many of the predicted positive instances are actually positive.
2.3.3. Weighted-Averaged Precision
In multiclass classification, precision can be aggregated across all classes using the following methods: calculate precision for each class, weight each class’s precision by the number of true instances of that class, and compute the weighted average:
where is the number of true instances for class .
2.3.4. Recall
Recall, also known as Sensitivity or True Positive Rate, is the ratio of true positive predictions to all actual positive instances. Recall measures the model’s ability to identify all relevant instances in the dataset.
2.3.5. Weighted-Average Recall
In multiclass classification, recall can be aggregated using the following methods: calculate recall for each class, weight each class’s recall by the number of true instances of that class, and compute the weighted average:
where is the number of true instances for class .
In medical diagnosis, recall (also known as sensitivity) measures the proportion of actual positive cases (e.g., patients with a disease) that are correctly identified by the model.
2.3.6. F1 Score
The F1 Score is the harmonic mean of Precision and Recall. It provides a single metric that balances both Precision and Recall, making it particularly useful when dealing with imbalanced datasets where the distribution of classes is not uniform.
2.3.7. Weighted-Average F1 Score
In multiclass classification, the F1 Score can be aggregated using the following methods: calculate the F1 Score for each class, weight each class’s F1 Score by the number of true instances of that class, and compute the weighted average:
where is the number of true instances for class .
2.4. Workflow
In medical diagnostics, missing a positive case (low Recall) can be more costly than allowing a few false positives (low Precision). Thus, We prioritize the F1 Score in this study because it effectively balances the recall and precision metrics, making it ideal for minimizing both false positives and false negatives.
Multiclass classification is essential for predicting conditions with more than two categories, such as thyroid disorders (e.g., hyperthyroidism, primary hypothyroidism, compensated hypothyroidism). The precision, recall and F1 score are all calculated by weighted averaging. We chose weighted averaging because our dataset has imbalanced classes. This method addresses the imbalance by giving more importance to larger classes. The performance on different types of thyroid disorders is crucial in medical diagnoses. This method reflects the real-world prevalence of each condition, providing a balanced and accurate assessment of model performance across all classes.
Overall, the dataset will be firstly divided into a training set and a test set at 70% and 30% ratio. The parameters of each model will be specified by employing 5-fold cross-validation on the training set. The specified model will then be trained on the training set and be evaluated on the test set by weighted average F1 score, with the obtained results as the final results for evaluation.
3. Experiments
3.1. Data Collection
We collected data from the UCI Machine Learning Repository Thyroid Disease Dataset, consisting of 9,172 observations and 31 attributes[8]. The attributes include basic demographic information such as age, sex, sick status, pregnancy status, and more. Additionally, the dataset includes several key hormones related to thyroid function: Thyroid-Stimulating Hormone(TSH), Triiodothyronine (T3), Thyroxin utilization rate (T4U), Total Thyroxin (TT4), Free Thyroxin Index (FTI) and Thyroxine-Binding Globulin (TBG).
- TSH (Thyroid-Stimulating Hormone): Produced by the pituitary gland, TSH stimulates the thyroid to produce the hormones T3 and T4.
- T3 (Triiodothyronine): One of the primary hormones produced by the thyroid gland, T3 plays a crucial role in the regulation of metabolism.
- TT4 (Total Thyroxine): This measures the total amount of thyroxine (T4) in the blood, including both free and protein-bound forms.
- T4U (Thyroxine-Binding Globulin Uptake): T4U evaluates the binding capacity of thyroid hormones by measuring how much TBG is available in the blood.
- FTI (Free Thyroxine Index): A calculated value that estimates the free (unbound) thyroxine (T4) level by combining the results of TT4 and T4U.
- TBG (Thyroxine-Binding Globulin): A protein that binds to thyroid hormones in the blood, playing a role in transporting them and regulating the amount of free hormones available for use.
3.2. Feature Selection
Feature selection plays a crucial role in improving the predictive performance of machine learning models for thyroid disease. While clinicians often rely on experience and clinical test results, diagnostic errors can occur. Selecting relevant features not only enhances model accuracy but also supports clinical decision-making.
In this study, we first removed non-informative columns such as ’referral source’ and ’patientID’, as they are unrelated to thyroid function and serve only administrative or identification purposes.
Next, we excluded the ’TBG measured’ and ’TBG’ columns due to a high proportion of missing values (8,823 instances), which would compromise model integrity. Similarly, we removed the ’TSH measured’, ’T3 measured’, ’TT4 measured’, ’T4U measured’, and ’FTI measured’ columns, as they merely indicate whether hormone values are available, rather than providing useful numerical inputs.
After the data cleaning process, the final dataset consisted of 5,229 instances and 22 features. The selected attributes used for model training and evaluation are summarized in Table 1.
Upon analyzing the data, we found a significant imbalance. To address this, we selected a subset of the data to achieve a statistically significant balance. For the target variable, we retained the following categories: -, A, F, I, G, and K, representing no condition, hyperthyroidism, primary hypothyroidism, compensated hypothyroidism, increased binding protein, and concurrent nonthyroidal illness, respectively. However, we excluded the ’increased binding protein’ category due to its overlap with other thyroid disorders, considering its medical implications. The complete list of categories with the corresponding definitions is listed in Table 2.
3.3. Results
We applied several machine learning algorithms—logistic regression, decision tree, random forest, XGBoost, support vector machines (SVM), neural networks, bagging, and stacking methods—to predict thyroid disease. We evaluated each model using four key metrics: accuracy, precision, recall, and F1 score. In our full dataset, the support of the healthy class - is over 10 times bigger than the support of the other classes, which is a very imbalanced data distribution. To further compromise the influence of the imbalanced data, similar experiments have been operated with different grouping rules: Comparison on imbalanced data
3.3.1. Comparison on Imbalanced Data
Imbalance data is one important topic that is to be discussed in this paper. In the experiments summarized in Table 3, the healthy class has over ten times more instances than any other class, resulting in a highly imbalanced distribution. The table presents model evaluations on the full dataset without applying any under-sampling techniques, providing an initial overview of each model’s performance across accuracy, precision, recall, and F1 score.
Overall, model performances were consistent across metrics. Prioritizing the F1 score, the bagging model with three decision trees achieved the best result, with an F1 score of 0.9766, slightly outperforming both Random Forest and XGBoost. Bagging also ranked highest across the remaining three metrics. In contrast, Logistic Regression performed the worst, with an F1 score of 0.9298, slightly below that of SVM. The two stacking models yielded F1 scores of 0.9694 and 0.9612, both lower than those of the bagging models.
3.3.2. Comparison on Balanced Data
To address the issue of class imbalance, we conducted additional experiments using a balanced dataset. Specifically, we randomly selected 400 samples from the "no condition" class to create a balanced class distribution. Table 4 shows the model performances after downsampling the "no condition" class from 4,165 to 400 instances. Contrary to expectations, not all models showed improved performance. Notably, significant gains in F1 score were observed for the stacking models using XGBoost as the meta-learner: the stacking model with 3 Random Forests and XGBoost (3rf+xgb) improved from 0.9694 to 0.9785, while the model with 3 XGBoost classifiers and XGBoost (3xgb+xgb) increased from 0.9612 to 0.9842.
In contrast, Logistic Regression, SVM, Neural Network, and bagging models experienced declines in F1 scores. The stacking model 3xgb+xgb emerged as the best-performing model with the highest F1 score of 0.9842, while Logistic Regression had the lowest performance, with an F1 score of 0.8700.
3.3.3. Comparison on Non-Thyroidal and Thyroidal Condition
To further address class imbalance, we explored an alternative grouping strategy by merging the ’-’ (no condition) and ’A’ (hyperthyroid) classes into a new category labeled non-thyroidal condition, consisting of 799 instances. Additionally, the healthy class was redefined to include both 400 randomly selected samples from the original healthy group and all instances from class K (concurrent non-thyroidal illness), forming a broader health category. The results of applying our models to this newly modified dataset are presented in Table 5, which reflects model performance under this revised class grouping scheme.
All models obtained great increases in F1 score from compared to Table 3 and Table 4, except for the logistics regression. It is interesting to find out that the logistics regression model is still the worst-performing model, despite the increase of the F1 score from 0.8700 to 0.8956. The best model is also still stacking 3xgb+xgb, with the F1 score increasing from 0.9842 to 0.9944. The increases are also observed on the other stacking models, obtaining the F1 score slightly above or below 0.99. The Decision tree model, the random forest, XGBoost, and the bagging also deliver quite good results, giving an F1 score around the level of 0.99.
Overall, we conclude the stacking 3xgb+xgb model is the best model with relatively good results in Table 3 and the highest F1 score in Table 4 and Table 5. The logistics regression model ends up with the worst-performing one, giving the lowest F1 score across all three tables. The decision tree model gives slightly worse results compared to the random forest model and the XGBoost model, even though the performance of the three models share a very similar trend. The bagging models give the best results on the imbalanced data and the stacking models give the best results on the balanced data and the balanced-regrouping data.
4. Discussions
Imbalanced data is a significant research topic in this study, as one class (the no-condition class -) represents over ten times more samples than the other classes. This imbalance often leads to skewed models that may favor the majority class at the expense of accurately predicting the minority classes. The impact of this imbalance can be seen in the performance of simpler models such as Logistic Regression and SVM, which struggled to maintain a balance between precision and recall, leading to lower F1 scores.
On the other hand, ensemble methods like bagging and boosting (as implemented in Random Forest and XGBoost) excelled in handling the imbalanced data, likely due to their ability to reduce variance and capture diverse decision boundaries through multiple learners. These methods seem to be better suited for datasets with class imbalances because they effectively aggregate multiple models’ predictions to form a more balanced and generalized decision boundary. The consistently high performance of the bagging models may also be attributed to the specific dataset and the nature of decision trees, which tend to work well on imbalanced datasets when combined in an ensemble structure.
The most notable improvements were observed in the stacking models using XGBoost as the meta-learner with the balanced data in Table 4. The improved performance of the stacking models implies that boosting-based stacking models might be particularly well-suited for balanced datasets, where the trade-offs between precision and recall can be more evenly distributed. Also, This implies that the stacking models can more efficiently learn from and generalize across all classes without the bias induced by a dominant class.
In contrast, the poorer performance of models like Logistic Regression, SVM, and bagging suggests that these methods may be better suited for imbalanced datasets, where their capacity to handle a dominant class allows them to achieve higher scores in certain metrics. However, once the bias towards the majority class is removed, these models seem to struggle to maintain their performance across all classes, possibly due to a lack of sophisticated mechanisms for learning complex relationships between classes in the balanced data.
The results from Table 5 suggest that re-grouping the non-thyroidal illness class with the no-condition class had a significant impact on model performance, particularly for models that rely on ensemble techniques. This re-grouping may have helped reduce the ambiguity between closely related classes, allowing the models to make more accurate distinctions between the redefined no-condition class and the thyroid disease classes. The increase in F1 scores across the board, especially for models like XGBoost, bagging, and stacking, indicates that these models are well-suited to handling this type of class restructuring.
Interestingly, while all ensemble models performed exceptionally well, the stacking models, particularly those with XGBoost as the meta-learner, consistently achieved the highest F1 scores. This further validates the effectiveness of stacking as a robust ensemble technique, especially when coupled with powerful learners like XGBoost. The ability of stacking models to combine the strengths of multiple base models seems to be particularly advantageous in this complex classification setting, as evidenced by the consistent improvement in performance across different class definitions.
5. Limitation and Future Development
While this study demonstrates the potential of the stacking models in predicting thyroid disease, several limitations must be acknowledged. Addressing these limitations can make this study more sound and reliable and lead to more interesting findings.
The data imbalance problem is a significant topic and is well taken of in this study, but our techniques for the data imbalance are limited to random undersampling. Even though random undersampling is already a very helpful technique for data imbalance in this study and has been well-acknowledged in Academia, it only gives a single picture of solving the data imbalance problem. By expanding the techniques to other techniques such as SMOTE oversampling, ADASYN oversampling, stacking ensemble resampling, etc. in future research, a more comprehensive picture can be shown and we could have more knowledge in understanding which kind of techniques work best for this research.
As medical data becomes increasingly complex, integrating advanced algorithms such as deep learning, reinforcement learning, and hybrid models will be essential for improving predictive accuracy and personalized medicine. These sophisticated models have the potential to analyze large, multidimensional datasets, uncovering intricate patterns that simpler methods may miss. In this study, we focused on a limited set of machine learning techniques; however, future work should expand the scope to include more advanced models like convolutional neural network (CNN), deep neural network (DNN), and transfer learning (TL). Exploring deep learning architectures and hybrid approaches could further enhance the system’s ability to deliver more precise and personalized predictions in thyroid disease diagnosis.
6. Conclusions
In conclusion, this study demonstrates the effectiveness of machine learning techniques in predicting thyroid disease, highlighting the potential of ensemble methods like bagging and stacking for addressing complex medical data challenges and imbalanced data issues. The results reveal that while traditional models such as Logistic Regression and SVM provide a baseline, advanced ensemble approaches, particularly stacking with XGBoost as the meta-learner, achieve superior performance, especially on balanced datasets. Furthermore, addressing data imbalance through undersampling and regrouping significantly enhanced model performance, underscoring the importance of data preprocessing in classification tasks. Despite these promising findings, the study also recognizes the limitations of the current approaches and the need for further exploration of advanced techniques, including deep learning and alternative resampling methods. As machine learning continues to evolve, its integration with medical diagnostics holds great promise for early intervention and improved patient outcomes in thyroid disease and beyond. Future research should aim to refine these models and explore their application to other healthcare datasets, ultimately advancing the capabilities of predictive medicine.
References
- Boelaert, K.; Franklyn, J. Thyroid hormone in health and disease. Journal of Endocrinology 2005, 187, 1–15. [Google Scholar] [CrossRef] [PubMed]
- Shankar, K.; Lakshmanaprabu, S.; Gupta, D.; Maseleno, A.; De Albuquerque, V.H.C. Optimal feature-based multi-kernel SVM approach for thyroid disease classification. The journal of supercomputing 2020, 76, 1128–1143. [Google Scholar] [CrossRef]
- Manji, N.; Carr-Smith, J.; Boelaert, K.; Allahabadia, A.; Armitage, M.; Chatterjee, V.; Lazarus, J.; Pearce, S.; Vaidya, B.; Gough, S.; et al. Influences of age, gender, smoking, and family history on autoimmune thyroid disease phenotype. The Journal of Clinical Endocrinology & Metabolism 2006, 91, 4873–4880. [Google Scholar] [CrossRef]
- Strieder, T.G.; Prummel, M.F.; Tijssen, J.G.; Endert, E.; Wiersinga, W.M. Risk factors for and prevalence of thyroid disorders in a cross-sectional study among healthy female relatives of patients with autoimmune thyroid disease. Clinical endocrinology 2003, 59, 396–401. [Google Scholar] [CrossRef] [PubMed]
- Chaubey, G.; Bisen, D.; Arjaria, S.; Yadav, V. Thyroid disease prediction using machine learning approaches. National Academy Science Letters 2021, 44, 233–238. [Google Scholar] [CrossRef]
- Tyagi, A.; Mehra, R.; Saxena, A. Interactive thyroid disease prediction system using machine learning technique. In Proceedings of the 2018 Fifth international conference on parallel, distributed and grid computing (PDGC). IEEE; 2018; pp. 689–693. [Google Scholar] [CrossRef]
- Aversano, L.; Bernardi, M.L.; Cimitile, M.; Iammarino, M.; Macchia, P.E.; Nettore, I.C.; Verdone, C. Thyroid disease treatment prediction with machine learning approaches. Procedia Computer Science 2021, 192, 1031–1040. [Google Scholar] [CrossRef]
- Quinlan, R. Thyroid Disease. UCI Machine Learning Repository, 1986. [CrossRef]
- Raisinghani, S.; Shamdasani, R.; Motwani, M.; Bahreja, A.; Raghavan Nair Lalitha, P. Thyroid Prediction Using Machine Learning Techniques. In Proceedings of the Advances in Computing and Data Sciences; Singh, M., Gupta, P., Tyagi, V., Flusser, J., Ören, T., Kashyap, R., Eds.; Singapore, 2019; pp. 140–150. [Google Scholar] [CrossRef]
- Tyagi, A.; Mehra, R.; Saxena, A. Interactive Thyroid Disease Prediction System Using Machine Learning Technique. In Proceedings of the 2018 Fifth International Conference on Parallel, Distributed and Grid Computing (PDGC); 2018; pp. 689–693. [Google Scholar] [CrossRef]
- Zheng, Z.; Cai, Y.; Li, Y. Oversampling method for imbalanced classification. Computing and Informatics 2015, 34, 1017–1037. [Google Scholar]
- Thabtah, F.; Hammoud, S.; Kamalov, F.; Gonsalves, A. Data imbalance in classification: Experimental evaluation. Information Sciences 2020, 513, 429–441. [Google Scholar] [CrossRef]
- Pan, Q.; Zhang, Y.; Zuo, M.; Xiang, L.; Chen, D. Improved Ensemble Classification Method of Thyroid Disease Based on Random Forest. In Proceedings of the 2016 8th International Conference on Information Technology in Medicine and Education (ITME); 2016; pp. 567–571. [Google Scholar] [CrossRef]
- Mahajan, P.; Uddin, S.; Hajati, F.; Moni, M.A. Ensemble learning for disease prediction: A review. In Proceedings of the Healthcare; MDPI, 2023; Vol. 11, p. 1808. [Google Scholar] [CrossRef]
- Yadav, D.C.; Pal, S. Prediction of thyroid disease using decision tree ensemble method. Human-Intelligent Systems Integration 2020, 2, 89–95. [Google Scholar] [CrossRef]
- Obaido, G.; Achilonu, O.; Ogbuokiri, B.; Amadi, C.S.; Habeebullahi, L.; Ohalloran, T.; Chukwu, C.W.; Mienye, E.; Aliyu, M.; Fasawe, O.; et al. An Improved Framework for Detecting Thyroid Disease Using Filter-Based Feature Selection and Stacking Ensemble. IEEE Access 2024. [Google Scholar] [CrossRef]
- Breiman, L. Random forests. Machine Learning 2001, 45, 5–32. [Google Scholar] [CrossRef]
- Biau, G.; Scornet, E. A random forest guided tour. Test 2016, 25, 197–227. [Google Scholar] [CrossRef]
- Dudek, G. A Comprehensive Study of Random Forest for Short-Term Load Forecasting. Energies 2022, 15, 7547. [Google Scholar] [CrossRef]
- Chen, T.; Guestrin, C. Xgboost: A scalable tree boosting system. In Proceedings of the Proceedings of the 22nd acm sigkdd international conference on knowledge discovery and data mining, 2016, pp. 785–794. [CrossRef]
- Breiman, L. Bagging predictors. Machine learning 1996, 24, 123–140. [Google Scholar] [CrossRef]
- Quinlan, J.R.; et al. Bagging, boosting, and C4. 5. In Proceedings of the Aaai/Iaai, vol. 1; 1996; pp. 725–730. [Google Scholar]
- Shorewala, V. Early detection of coronary heart disease using ensemble techniques. Informatics in Medicine Unlocked 2021, 26, 100655. [Google Scholar] [CrossRef]
- Singh, N.; Singh, P. A stacked generalization approach for diagnosis and prediction of type 2 diabetes mellitus. In Proceedings of the Computational Intelligence in Data Mining: Proceedings of the International Conference on ICCIDM 2018.; Springer, 2020; pp. 559–570. [Google Scholar] [CrossRef]
Figure 1.
Illustration of the Bagging process, showing the generation of bootstrap samples, training of individual models, and aggregation of predictions.
Figure 1.
Illustration of the Bagging process, showing the generation of bootstrap samples, training of individual models, and aggregation of predictions.
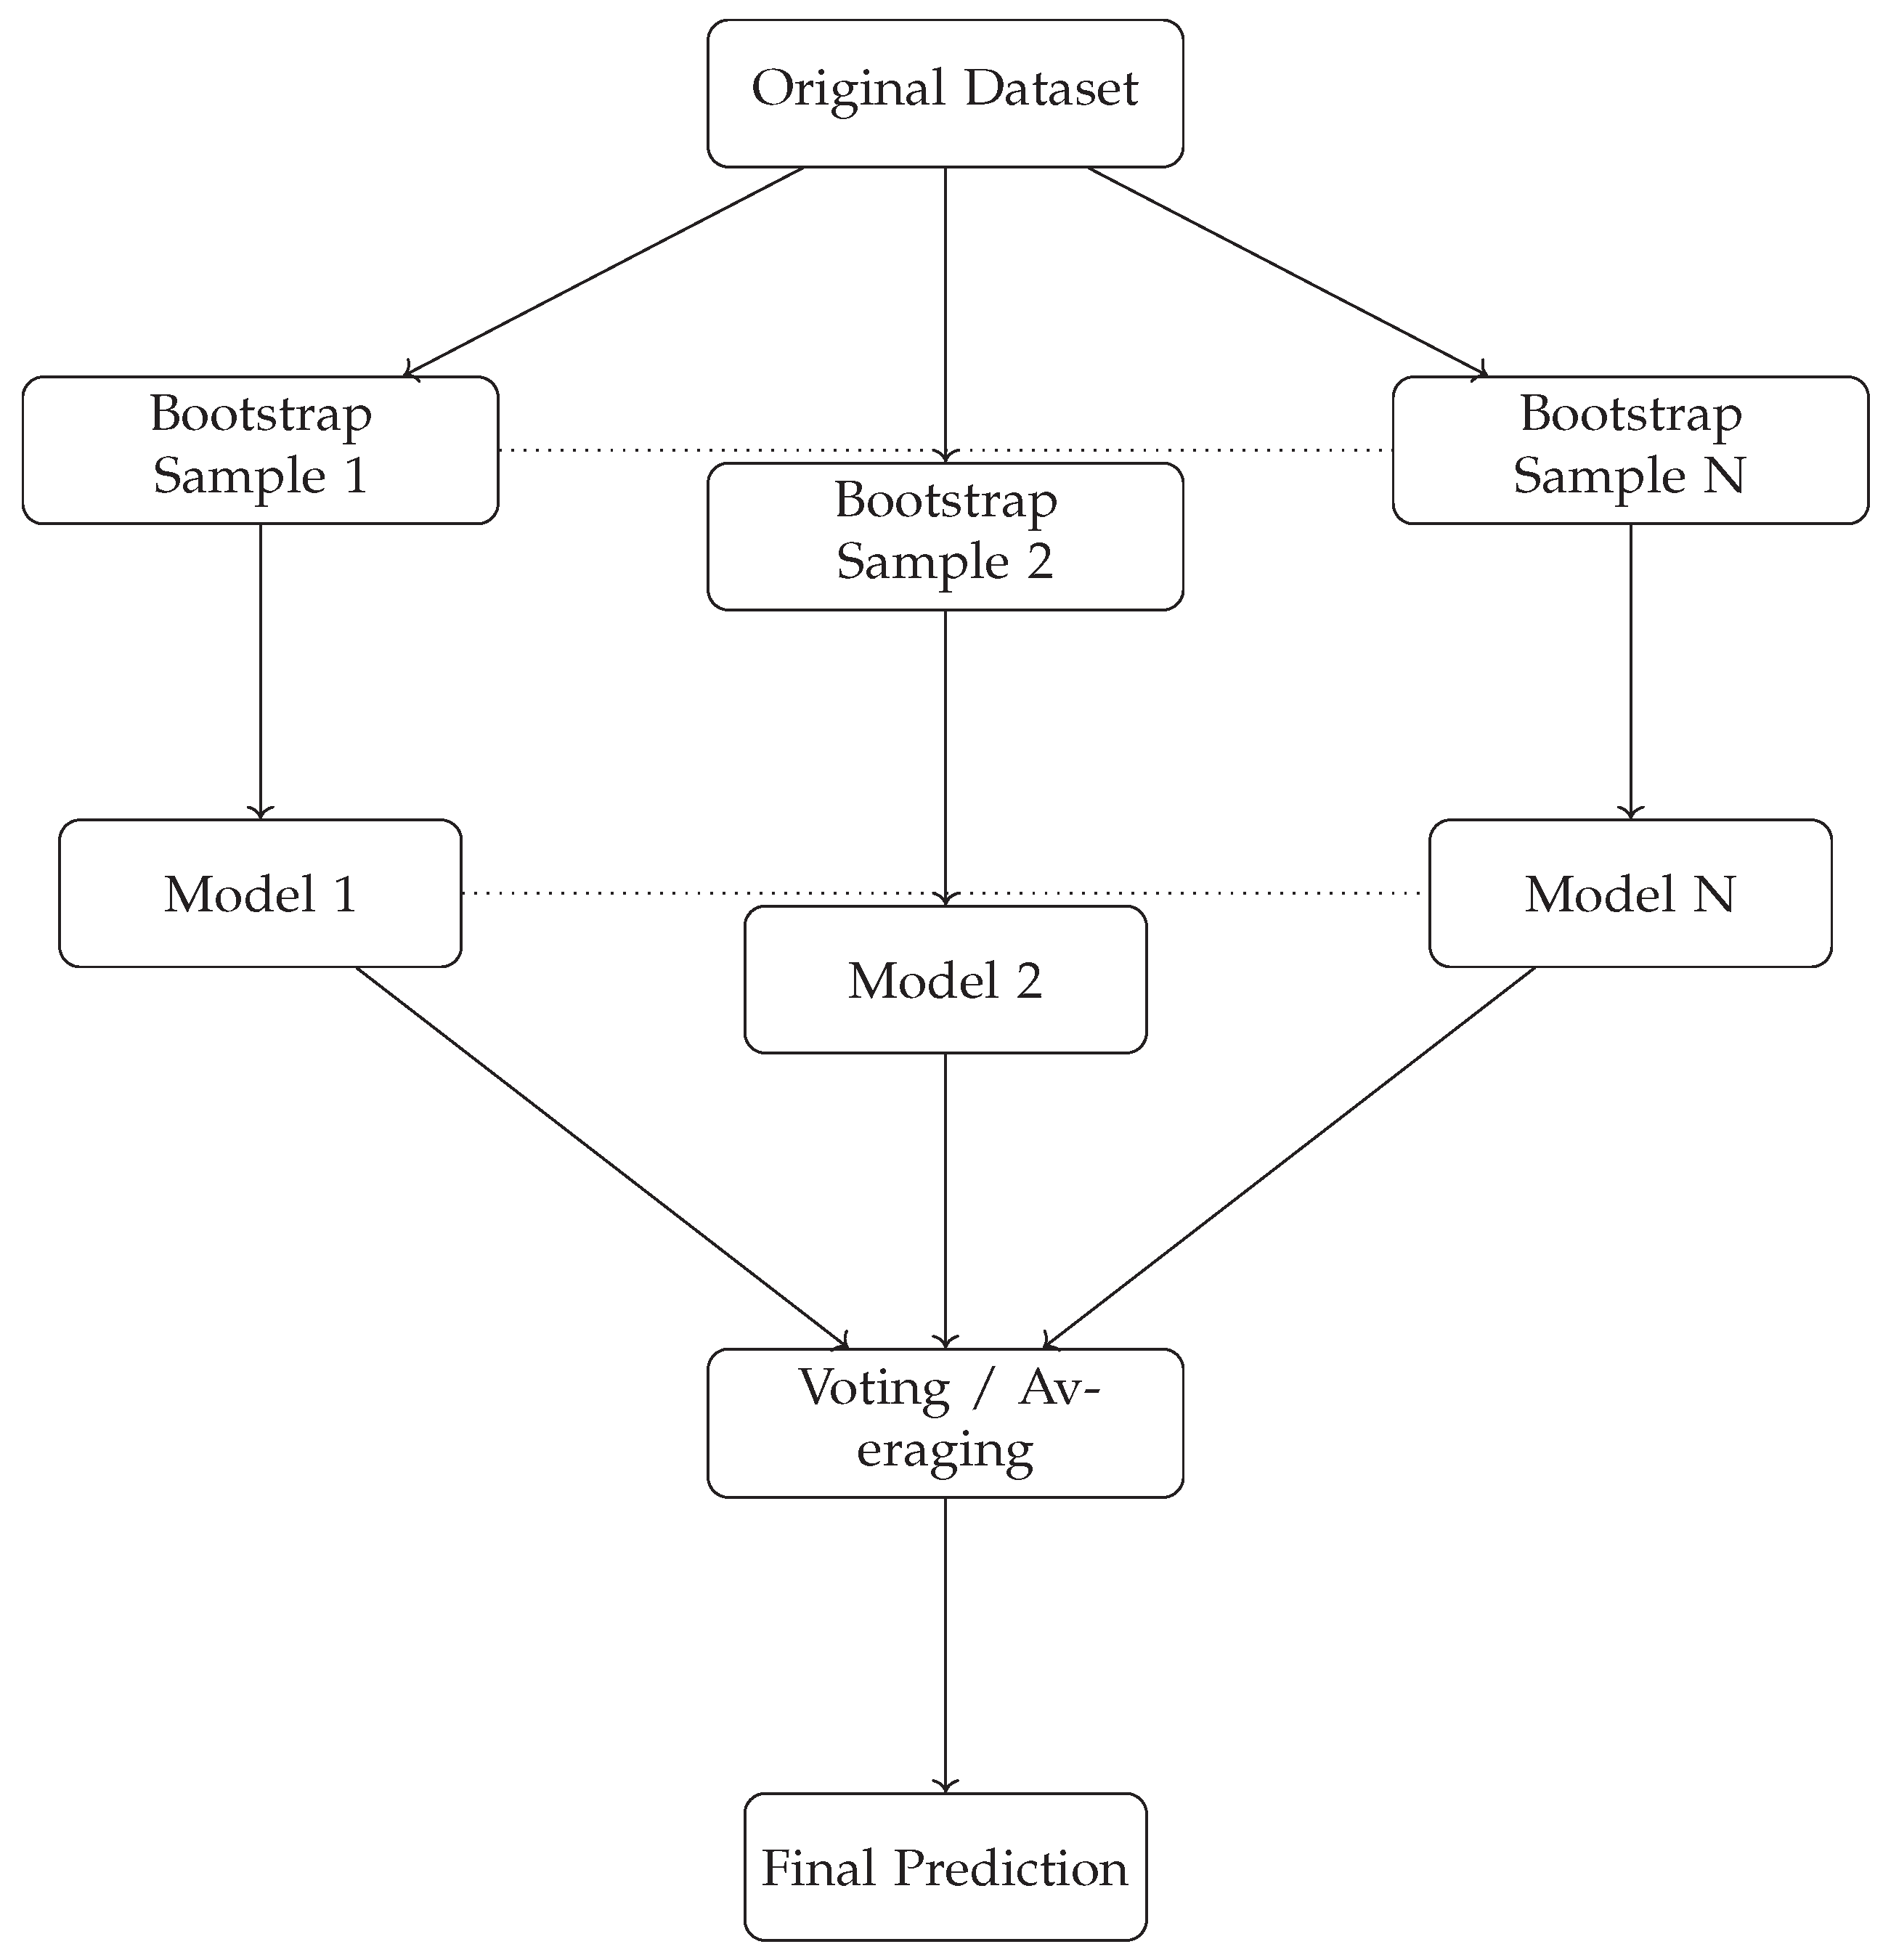

Table 1.
Selected Features
| Feature | Definition |
|---|---|
| age | The patient’s age |
| sex | Sex which the patient identifies with |
| on thyroxine | If the patient is currently taking thyroxine |
| query on thyroxine | If there is a question about the patient taking thyroxine |
| on antithyroid meds | If the patient is currently on antithyroid medications |
| sick | If the patient is currently unwell |
| pregnant | If the patient is pregnant |
| thyroid surgery | If the patient has had thyroid surgery in the past |
| I131 treatment | If the patient is receiving I131 treatment |
| query hypothyroid | If the patient thinks they have hypothyroidism |
| query hyperthyroid | If the patient thinks they have hyperthyroidism |
| lithium | If the patient is on lithium treatment |
| goitre | If the patient has an enlarged thyroid (goitre) |
| tumor | If the patient has a tumor |
| hypopituitary | If the patient has an underactive pituitary gland |
| psych | If the patient has a psychological condition |
| TSH | Thyroid-stimulating hormone level in the patient’s blood |
| T3 | Triiodothyronine (T3) level in the patient’s blood |
| TT4 | Total thyroxine (TT4) level in the patient’s blood |
| T4U | Thyroxine uptake (T4U) level in the patient’s blood |
| FTI | Free Thyroxine Index (FTI) level in the patient’s blood |
Table 2.
Selected Categories
| Category | Definition |
|---|---|
| - | No condition |
| A | Hyperthyroid |
| F | Primary hypothyroid |
| G | Compensated hypothyroid |
| K | Concurrent non-thyroidal illness |
Table 3.
Comparison on imbalanced data
| Algorithms | Accuracy | Precision | Recall | F1 score |
|---|---|---|---|---|
| Logistic Regression | 0.9290 | 0.9262 | 0.9290 | 0.9241 |
| Decision Tree | 0.9665 | 0.9674 | 0.9665 | 0.9665 |
| Random Forest | 0.9753 | 0.9770 | 0.9753 | 0.9740 |
| Xgboost | 0.9753 | 0.9767 | 0.9753 | 0.9756 |
| SVM | 0.9331 | 0.9329 | 0.9331 | 0.9298 |
| Artificial Neural Network | 0.9430 | 0.9429 | 0.9430 | 0.9427 |
| Bagging 3dt | 0.9761 | 0.9782 | 0.9761 | 0.9766 |
| Bagging 3rf | 0.9719 | 0.9739 | 0.9719 | 0.9724 |
| Bagging 3xgb | 0.9739 | 0.9759 | 0.9739 | 0.9744 |
| Stacking 3rf+rf | 0.9716 | 0.9728 | 0.9716 | 0.9719 |
| Stacking 3rf+xgb | 09689 | 0.9704 | 0.9689 | 0.9694 |
| Stacking 3xgb+xgb | 0.9603 | 0.9635 | 0.9603 | 0.9612 |
Table 4.
Comparison on balanced data
| Algorithms | Accuracy | Precision | Recall | F1 score |
|---|---|---|---|---|
| Logistic Regression | 0.8724 | 0.8781 | 0.8724 | 0.8700 |
| Decision Tree | 0.9695 | 0.9700 | 0.9695 | 0.9695 |
| Random Forest | 0.9763 | 0.9772 | 0.9763 | 0.9761 |
| Xgboost | 0.9729 | 0.9738 | 0.9729 | 0.9728 |
| SVM | 0.9063 | 0.9096 | 0.9063 | 0.9056 |
| Artificial Neural Network | 0.9199 | 0.9220 | 0.9199 | 0.9195 |
| Bagging 3dt | 0.9763 | 0.9769 | 0.9763 | 0.9762 |
| Bagging 3rf | 0.9661 | 0.9676 | 0.9661 | 0.9661 |
| Bagging 3xgb | 0.9650 | 0.9659 | 0.9650 | 0.9648 |
| Stacking 3rf+rf | 0.9763 | 0.9771 | 0.9763 | 0.9762 |
| Stacking 3rf+xgb | 0.9786 | 0.9792 | 0.9786 | 0.9785 |
| Stacking 3xgb+xgb | 0.9842 | 0.9851 | 0.9842 | 0.9842 |
Table 5.
Comparison on non-thyroidal and thyroidal condition
| Algorithms | Accuracy | Precision | Recall | F1 score |
|---|---|---|---|---|
| Logistic Regression | 0.9029 | 0.9030 | 0.9029 | 0.8956 |
| Decision Tree | 0.9921 | 0.9924 | 0.9921 | 0.9921 |
| Random Forest | 0.9921 | 0.9924 | 0.9921 | 0.9921 |
| Xgboost | 0.9921 | 0.9925 | 0.9921 | 0.9921 |
| SVM | 0.9402 | 0.9409 | 0.9402 | 0.9376 |
| Artificial Neural Network | 0.9560 | 0.9571 | 0.9560 | 0.9558 |
| Bagging 3dt | 0.9932 | 0.9936 | 0.9932 | 0.9932 |
| Bagging 3rf | 0.9887 | 0.9892 | 0.9887 | 0.9887 |
| Bagging 3xgb | 0.9910 | 0.9914 | 0.9910 | 0.9909 |
| Stacking 3rf+rf | 0.9887 | 0.9891 | 0.9887 | 0.9887 |
| Stacking 3rf+xgb | 0.9921 | 0.9931 | 0.9921 | 0.9923 |
| Stacking 3xgb+xgb | 0.9944 | 0.9949 | 0.9944 | 0.9944 |
Disclaimer/Publisher’s Note: The statements, opinions and data contained in all publications are solely those of the individual author(s) and contributor(s) and not of MDPI and/or the editor(s). MDPI and/or the editor(s) disclaim responsibility for any injury to people or property resulting from any ideas, methods, instructions or products referred to in the content. |
© 2025 by the authors. Licensee MDPI, Basel, Switzerland. This article is an open access article distributed under the terms and conditions of the Creative Commons Attribution (CC BY) license (http://creativecommons.org/licenses/by/4.0/).
Copyright: This open access article is published under a Creative Commons CC BY 4.0 license, which permit the free download, distribution, and reuse, provided that the author and preprint are cited in any reuse.


