Submitted:
11 July 2025
Posted:
21 July 2025
You are already at the latest version
Abstract
Objectives: This study aims to evaluate the effectiveness of health applications on the Google Play Store by analyzing app metadata using machine learning classification models. It investigates which application features—such as AI classification, app category, update status, and version—are associated with higher user ratings.Methods: A total of 305 health-related applications were selected from the Google Play Store using keyword filters for “Health & Fitness” and “Medical.” Key metadata were extracted and preprocessed, including Classification (AI vs. Non-AI), Category, Reviews, Developer Type, Version, Release Year, and Recent Update. To address class imbalance, the SMOTE technique was applied, and three machine learning models—Naïve Bayes, K-Nearest Neighbors (KNN), and Binomial Logistic Regression—were used to predict user ratings. Results: The KNN model achieved the most balanced performance with 75.89% accuracy, 82.22% precision, and an AUC of 0.849, while Logistic Regression produced the highest precision (100%) and overall accuracy (76.32%) but lower recall (52.63%). Logistic regression analysis also showed that apps categorized under Health & Fitness, those recently updated, and AI-based apps were more likely to receive high user ratings.Conclusion: Machine learning models, particularly KNN and Logistic Regression, can reliably predict app effectiveness based on metadata. Regular updates, AI integration, and fitness-focused design are key factors linked to higher user approval, providing useful insights for developers and digital health stakeholders. Future research should consider larger and more diverse datasets and explore additional features (e.g., user sentiment from reviews, app permissions) to further improve model performance.
Keywords:
health
; apps
; Google Play Store
; machine learning
1. Introduction
In today's digital age, the pervasive influence of technology on nearly every aspect of our lives is undeniable. From the way we communicate and work to how we entertain ourselves, technology has revolutionized human behavior in profound ways [5]. As technology continues to advance at a rapid pace, individuals are becoming more reliant on digital devices and the internet for various aspects of their lives [20]. It has profound influence of technology in domains such as healthcare, communication, and personal development [15]. Digital technology also revolutionized accessibility to mental health resources, providing avenues for support and intervention [16], social sphere at the present stage [17], and even integrating digitalization on mental health [4].
Progressing into the Age of Digitalization, there have been unprecedented transformations ongoing in the world and humankind, through the drastic development of algorithms and big data, artificial intelligence, global telecommunication and cyborgs. There has been progressive and extensive influence of digitalization in every aspect of daily living, including information processing, communication, infrastructure, logistics, finance and commerce, industry, economy, education, healthcare and entertainment [6]. Nowadays, Digital technologies are currently dramatically changing healthcare [9]. Due to this significant advancement in the modern world, all people now drastically switched to these platforms particularly on the impact of digitalization on the physical health and fitness [22]. Mobile health (mHealth) apps have gained significant popularity over the last few years due to their tremendous benefits, such as lowering health care costs and increasing patient awareness [1]. These applications offer the potential for dynamic engagement of patients and providers in health care and a new means of improving health outcomes [18]. The development of health and fitness applications allow users to conveniently monitor, manage, and improve their overall well-being through digital tools. These applications offer features such as workout tracking, calorie counting, sleep analysis, and personalized fitness plans, which empower individuals to take a more active role in their health. For instance, fitness apps provide various feature sets to assist individuals’ physical activity (e.g. running, cycling, working out, health planning and trackers) for both men and women allowing for an easy access of data and information. Fitness apps typically refer to third-party mobile applications with built-in GPS, social networking capabilities (e.g., users share their exercise records on Facebook or Twitter), and sensor technologies that can help users record physical and physiological data automatically and generate personalized training profiles and schedule [11].
This study investigates the effectiveness of Health applications from Google Play Store Metadata with the use of Machine Learning-Based Prediction model. It also provides a longitudinal study of Google Play app metadata which will give unique information that is not available through the standard approach of capturing a single app snapshot [13]. Using feature extraction from app analysis, it will be used to find whether an app is effective or not based on user ratings. A binomial logistic regression analysis was also conducted to further evaluate the predictive impact of various app features on user ratings.
2. Materials and Methods
2.1 Data Sourcing and Cleaning
This study is organized into five phases: data sourcing, data cleaning, oversampling technique, data visualization, and data modelling. The initial phase, application data were collected from the Google Play Store using the keywords “Health & Fitness” and “Medical” to filter relevant applications. Metadata including application name, developer name, number of reviews, user ratings, release year, recent update, application version, and classification (AI or non-AI) were extracted for each app. A total of 234 Health & Fitness applications and 206 Medical applications were initially retrieved. Of these, 11 Health & Fitness apps and 97 Medical apps were excluded due to missing or incomplete data. Further screening identified 9 Health & Fitness apps and 18 Medical apps as irrelevant to the study objectives. As a result, the final dataset comprised 214 Health & Fitness applications and 91 Medical applications, which were included in the subsequent analyses. After data sourcing, a basic data cleaning and data visualization is performed [Figure 1].
2.2. Data Visualization
During data visualization, several categorical variables were transformed into binary-coded formats to enable statistical and machine learning analysis. Developer type, Number of reviews, release year, recent update, application version classification (AI and Non-AI) and category (Health & Fitness, Medical) are coded with 2-3 binaries while variable User ratings are also coded (1=High, 2=Low).
2.3. Synthetic Minority Over-sampling Technique
Since datasets in this study are unbalanced and can lead to biased models that perform well on the majority class but poorly on the minority class. SMOTE (Synthetic Minority Over-sampling Technique) is a powerful technique to handle unbalanced datasets of this study that only consists of 305 collected applications in Google Play Store. It works by creating synthetic examples for the minority class by interpolating between existing minority instances. This helps in achieving a balanced class distribution without simply duplicating the minority instances.
2.4. Data Modelling (Machine Learning)
Data was analyzed using selected machine learning classification such as Naive Bayes Model, K-nearest neighbors Model and Binomial Logistic Regression Classification to compare model performance with highest accuracy percentage and other results. Model demonstrating the highest accuracy and most favorable outcomes will be retained for the experimental analysis. Descriptive statistics for the coded variables are presented first. RStudio v 4.5.1 software was used for data analysis.
2.4.1. Naive Bayes Classification
We want to predict the user rating R, which derives from categorical variable with two possible classes: (1=High Ratings, 2=Low Ratings). We use several observed features to make the prediction.
- Classification
- Category
- Developer and so on.
The general form of Bayes’ Theorem is represented below:
The denominator is the same for all classes, so for classification purposes, ignore it. Then Apply the Naive Assumption. Naive Bayes assumes that all features are conditionally independent given the class. This allows us to break down the joint probability. Formula below:
Substitute this into Bayes’ rule:
Then define the Classification rule. To make a prediction, we compare the probability score for each class , and choose the class with highest value. Formula below.
where:
- = The predicted class (user rating)
- = “Choose the class r that gives the maximum result
- = Possible class labels (1=High, 2=Low)
- = Prior probability of class r how common this rating is in your dataset
- = Conditional probability of feature given the class
- Multiply all the conditional probabilities from to
Compute scores for each class. To classify a new app, plug in observed feature values and compute the score for each rating class:
Do this for all , and select the class with the highest score, and that is the predicted user rating. Naive Bayesian model is easy to build, with no complicated iterative parameter estimation which makes it particularly useful for very large datasets. Despite its simplicity, the Naive Bayesian classifier often does surprisingly well and is widely used because it often outperforms more sophisticated classification methods [19].
2.4.2. K-nearest Neighbors Model (KNN)
K-nearest neighbors (KNN) are the distances between the test and input data are measured and sorted to find the k nearest neighbors. Then the majority voting is performed to determine the category of data by selecting the most common vote among the nearest neighbors [2]. The concept of K-nearest neighbors is illustrated in [Figure 2]. KNN classification is used to determine the average accuracy (predicted percentage) of a new data point (estimated rating level of health apps), which serves as an indicator of the effectiveness of using the applications. By using k-fold cross validation in this study, it provides a more reliable esti mate of a model’s performance by using the entire dataset for both training and validation (test set), reducing bias and variance associated with single train/test splits. The dataset is divided using 10-fold cross-validation, which involves splitting the data into 10 equal-sized subsets, each containing an equal number of samples [Figure 3]. In each iteration, one-fold is assigned as the test set while the remaining nine folds serve as the training set, and this process is repeated across all folds (blue segments in Figure 3). For each iteration with one test fold, the distance between each data point is calculated using Euclidean distance, as defined by the formula and illustrated in Figure 4.
Since there are multiple variables in this study, the formula becomes:
Distances are computed for all rows within each fold, and the process is repeated across all folds. After calculating the Euclidean distance for each row, the values are sorted in descending order to identify the k nearest neighbors. In this study, k is set to 3, selecting the three highest distances. A majority voting method is then applied by recording the ratings of these three neighbors and predicting the most frequent rating. This process is repeated for each row. The predicted ratings are then compared to the actual ratings; cases where the predicted and actual ratings match are considered correct. The overall accuracy is calculated by counting the number of correct predictions (i.e., matched predicted and actual ratings) and applying the standard accuracy formula below.
In this study, the total number of folds is set to 10. The same process is then repeated for all remaining folds, ensuring that the accuracy is recorded for each of the 10 folds. Once all accuracy values are obtained, their average is computed to determine the overall model accuracy.
Where:
- = sum of all 10 accuracies divided by 10 folds
- summation of accuracies from fold 1 to fold 10
- accuracy from the i-th fold
Furthermore, k in KNN is a critical hyperparameter that you adjust based on your dataset’s specific characteristics. The optimal value of k is essential for the accuracy of the algorithm’s predictions. A smaller k value can make the algorithm sensitive to noise and overly flexible, whereas larger k ran render it computationally intensive and can be prone to underfitting. An odd number of k is often chosen to avoid ties in classification.
2.4.3. Binomial Logistic Regression
A binomial logistic regression (often referred to simply as logistic regression), predicts the probability that an observation falls into one of two categories of a dichotomous dependent variable based on one or more independent variables that can be either continuous or categorical [12]. At the core of logistic regression is the logistic (or sigmoid) function, which maps any real valued input to a value between 0 and 1 which is interpreted as a probability. This allows the model to describe the relationship between the input features and the probability of the binary outcome [Figure 5].
Logistic regression is a type of generalized linear model (GLM) used for classification tasks, particularly when the response variable is binary. The goal is to model the probability that a given input belongs to a particular category. The output represents a probability, ranging between 0 and 1. It is represented as:
In logistic regression, the odds represent the ratio of the probability of success to the probability of failure. The odds ratio (OR) is a key concept that helps interpret logistic regression coefficients. It measures how the odds change with a one-unit increase in a predictor variable:
- An OR of 1 indicates equal probability of success and failure.
- An OR of 2 means success is twice as likely as failure.
- An OR of 0.5 implies failure is twice as likely as success.
Since the outcome is binary and follows a binomial distribution, logistic regression uses the logit function, which connects the linear model to the probability. The logistic regression model is represented in the formula below.
Where:
- = probability of the event
- = predictors (apps features)
- = model coefficients (estimates)
This ensures that the predicted probabilities stay within the (0, 1) interval and that the model is linear in the log-odds. Additionally, logistic regression estimates the model parameters using maximum likelihood estimation. This finds the coefficients that make observed outcomes most probable. Each coefficient in the logistic regression model represents the change in the log-odds of the outcome for one unit increase in the corresponding predictor assuming all other variables are held constant [8].
- If , an increase in increases the probability of success.
- If , an increase in decreases the probability of success.
3. Results
This section presents the results of the statistical analyses conducted to evaluate the effectiveness of health applications. It begins with descriptive statistics summarizing key features of the apps. Subsequently, the performance of each classification model—namely K-Nearest Neighbors, Naive Bayes, and Logistic Regression—is assessed using confusion matrices, ROC curves, and key performance metrics, including accuracy, precision, recall, F1 score, AUC and etc. In addition, logistic regression coefficients are examined to evaluate the predictive effectiveness of application features in relation to user ratings.
3.1. Distribution of Application Features
Distribution of the variables are presented in Table 1, revealed that the majority were AI-based (n= 328, 57.7%) and primarily categorized under Health & Fitness (n = 360, 63.4%). Some effective health & fitness applications filtered in this study are mostly developed by Leap Fitness Group. According to [7], AI algorithms can predictively project individual choices, preferences, geographic behaviors, and patterns by analyzing user data. This enables mobile apps to deliver truly personalized, tailored content, recommendations, and notifications, creating a more engaging and personalized user experience. Furthermore, [11] states that Fitness apps provide various feature sets to assist individuals’ physical activity (e.g., running, cycling, working out, and swimming). For example, data management feature set allows users to collect and manage their exerciser's data, such as recording their steps, running routes, calories burned, and heart rate. A considerable proportion of applications had low user reviews (n = 411, 72.4%), indicating limited user engagement or relatively new releases. In terms of effectiveness, applications were evenly distributed between those with high ratings (n = 284, 50%) and low ratings (n = 284, 50%), justifying the binary outcome modeling in subsequent machine learning analysis.
Furthermore, most apps were developed by small developers (n = 530, 93.3%), which may reflect the increasing participation of independent developers in the health app market. Recently updated apps comprised the majority (n = 480, 84.5%), showing that developers actively maintain and improve their applications. Regarding versioning, older versions were most common (n = 375, 66.0%), possibly due to compatibility or maintenance constraints. Almost half of the applications were released earlier (n = 276, 48.6%), indicating a longer presence on the market.

Table 1.
Distribution of Application Features.
| Variables | Frequency | Percentage | |
| Classification | AI | 328 | 57.7 |
| Non-AI | 240 | 42.2 | |
| Category | Health&Fitness | 360 | 63.4 |
| Medical | 208 | 36.6 | |
| Reviews | High | 42 | 7.4 |
| Medium | 115 | 20.2 | |
| Low | 411 | 72.4 | |
Table 1.
Continuation.
| Variables | Frequency | Percentage | |
| Ratings | High Ratings | 284 | 50 |
| Low Ratings | 284 | 50 | |
| Developer | Big Developer | 38 | 6.7 |
| Small Developer | 530 | 93.3 | |
| Recent Update | Old | 88 | 15.5 |
| Recent | 480 | 84.5 | |
| Version | High | 43 | 7.6 |
| Medium | 150 | 26.4 | |
| Old | 375 | 66.0 | |
| Release Year | Old | 276 | 48.6 |
| Mid | 197 | 34.7 | |
| Recent | 95 | 16.7 | |
3.2. Health Application Effectiveness
A Naive Bayes classifier was applied to evaluate the effectiveness of health applications based on user ratings. [Table 2]. The model achieved an overall accuracy of 57.06%, with a 95% confidence interval of [49.26%, 64.61%]. However, it did not significantly outperform the No Information Rate of 92.94% (p = 1.00), indicating that the model did not perform better than simply predicting the majority class. The agreement between predicted and actual outcomes was weak, with a Cohen’s Kappa of (κ=0.14) suggesting only slight reliability beyond chance.
The confusion matrix revealed that the model successfully identified all apps that were actually rated highly by users, resulting in a recall of 1.000 (100%). However, it also incorrectly classified 73 low-rated apps as highly rated, producing a low precision of 14.12% [Table 3]. In other words, while the model was sensitive to identifying effective apps, most of its predictions of “high rating” were incorrect. The combined effect of high recall and low precision led to an F1 score of 0.25, indicating a weak overall balance between correctly identifying and over-predicting highly rated apps. The model’s specificity was 53.80%, reflecting limited ability to correctly identify low-rated apps. The balanced accuracy, averaging performance across both classes, was 76.90%.
Crucially, McNemar’s Test was highly significant (p<.001), confirming that the model’s misclassifications were not random. Specifically, the model produced many more false positives (73) than false negatives (0), suggesting a strong bias toward predicting high ratings, even when apps were not actually rated highly. In summary, although the Naive Bayes model demonstrated perfect sensitivity in detecting highly rated apps, it’s very low precision and classification imbalance limits its practical usefulness. The tendency to over-predict effectiveness makes it unsuitable for applications where recommending low-quality health apps must be avoided.
Additionally, K-Nearest Neighbors (KNN) classification model was also employed to evaluate the effectiveness of health applications based on user ratings [Table 4]. The model achieved an overall accuracy of 75.89%, with a 95% confidence interval of [66.9%, 83.47%], significantly higher than the No Information Rate of 50% (p < .001). The Cohen’s Kappa coefficient (κ = 0.52) indicated a moderate agreement between predicted and actual class labels.
The confusion matrix showed that the model correctly classified 37 highly rated apps (true positives) and 48 lower-rated apps (true negatives), while misclassifying 19 high-rated apps (false negatives) and 8 lower-rated apps (false positives) [Table 5]. The model yielded a recall (sensitivity) of 66.07%, meaning it correctly identified two-thirds of truly effective apps. The precision (positive predictive value) was 82.22%, indicating that most apps predicted to be highly rated were indeed so. These values resulted in an F1 score of 0.7326, reflecting a strong balance between recall and precision. The specificity was 85.71%, and the negative predictive value was 71.64%, suggesting reliable identification of both effective and ineffective apps. The balanced accuracy was equal to overall accuracy (75.89%), reinforcing the model's robustness in handling the two classes.
Although McNemar’s Test approached significance (p = .0543), it did not reach the conventional alpha threshold (p < .05), indicating that the difference in misclassification between false positives and false negatives was not statistically significant. Therefore, the model does not exhibit a strong bias toward one type of misclassification over the other. These findings suggest that the KNN model can effectively classify health applications based on user ratings, offering both sensitivity in detecting highly rated apps and precision in ensuring that positive predictions made by the model are accurate.
Lastly, Binomial Logistic Regression was used to assess health app effectiveness based on user ratings, a binomial logistic regression model was applied [Table 6]. The model achieved an overall accuracy of 76.32%, with a 95% confidence interval of [67.44%, 83.78%], which was significantly greater than the No Information rate of 50% (p < .001). The Cohen’s Kappa coefficient (κ = 0.53) indicated a moderate agreement between predicted and actual classifications.
According to the confusion matrix, the model correctly identified 30 highly rated apps (true positives) and 57 low-rated apps (true negatives), while it missed 27 highly rated apps (false negatives) and made no false positive errors [Table 7]. This yielded a recall (sensitivity) of 52.63%, meaning the model identified just over half of the truly high-rated apps. However, the precision (positive predictive value) was perfect at 1.000, indicating that every app predicted to be highly rated was indeed correct. These values produced an F1 score of 0.6897, reflecting a solid balance between sensitivity and precision. The model also demonstrated perfect specificity (1.000) and a balanced accuracy of 76.32%, indicating equal strength in identifying both positive and negative classes.
However, McNemar’s Test was highly significant (p<.001), revealing a notable imbalance in classification errors. Specifically, the model showed a strong tendency toward false negative failing to detect many truly high-rated apps—while avoiding false positives entirely. This pattern suggests that the model was highly conservative in predicting high-rated apps, prioritizing precision over sensitivity. In summary, the binomial logistic regression model provided reliable and cautious predictions of app effectiveness. Its perfect precision makes it useful in contexts where false recommendations must be avoided, though its lower sensitivity indicates it may overlook some truly effective apps.
3.3. Performance Metric of the 3 Classification Models in Predicting Highly Effective Applications
Three machine learning models were evaluated in predicting whether health-related mobile applications were perceived by users as highly effective (positive class = 1) or not (class = 2) as shown in Table 8. The K-Nearest Neighbors (KNN) model performed best overall, with an accuracy of 75.89%, high precision (82.22%), and balanced sensitivity (66.07%) and specificity (85.71%). Its F1 Score was 73.26%, and the AUC of 0.849 indicated excellent discriminative ability. The Naïve Bayes model, while achieving perfect recall (100%) for identifying highly effective apps, had very low precision (14.12%), resulting in an F1 Score of 24.74%. This suggests that it overclassified apps as highly effective, yielding many false positives.
The Binomial Logistic Regression has the highest accuracy (76.32%) and precision (100%), but its recall was lower (52.63%), meaning nearly half of truly effective apps were missed. Its F1 Score was 68.97%. However, the AUC (0.355) based on probabilities was surprisingly low [Figure 6], indicating weak ranking ability across thresholds despite solid and positive classification at the default cutoff. Therefore, K-nearest Neighbors (KNN) Classification Model demonstrated the most reliable and balanced performance in identifying health apps rated highly (1) by users, making it the most suitable model for this classification task.
3.4. Predicting (1) High App Ratings on Health Application Features
A binomial logistic regression was conducted to assess whether specific application features significantly predicted the likelihood of receiving high user ratings. The model included seven predictors: Classification (AI vs. Non-AI), Category (Health & Fitness vs. Medical, Reviews (continuous), Developer Type, Recent Update (binary), Version, and Release Year. The overall model was statistically significant, χ² (7) = 65.09, p < .001, indicating that the set of predictors reliably distinguished between high- and low-rated applications. The model showed a reduction in deviance from 629.38 (null) to 564.29 (residual), with an Akaike Information Criterion (AIC) of 580.29, suggesting improved model fit. The Nagelkerke R² value was 0.176, indicating that approximately 17.6% of the variance in user ratings was explained by the predictors in Table 9.
Among the predictors in Table 10, Category emerged as a significant factor (β = 0.75, SE = 0.21, z = 3.48, p < .001), with apps in the Health & Fitness category being more than twice as likely to receive high ratings compared to those in the medical category (OR = 2.11). According to Shaw [21], many fitness apps have now perfectly marketed themselves to both serve as a resource to use for on-demand fitness content, as well as provide personalized service and include the same type of hands-on dedicated approach one would receive if working directly with a personal trainer or gym class.
Also, [14] cited some best and effective health and fitness applications to help you train at home, some are Centr, Nike Training Club, Fiit, Apple Fitness Plus, Sweat, Body Coach, Strava, Home Workout No equipment is among the best fitness applications. Furthermore, Recent Update was also a statistically significant predictor (β = 0.66, SE = 0.31, z = 2.14, p = .032), with recently updated apps being nearly twice as likely to receive high ratings (OR = 1.93). According to the survey of [3] for top 20 trending Health & Fitness apps on Google Play as of July 9, 2025, apps like HealthifyMe, Replika, Catzy, and others are currently trending—with user ratings ranging from 4.2 to 4.8 stars, indicating both active use and high satisfaction, This demonstrates that recently updated health apps on Google Play are indeed highly rated, reinforcing the trend that top-performing health apps combine frequent maintenance with strong user approval.
In Classification of (AI vs. Non-AI) it showed a marginally significant positive association (β = 0.39, SE = 0.21, z = 1.87, p = .062), indicating that AI-based apps were 1.47 times more likely to receive high ratings. A study of [13] analyzed reviews were largely positive with 6700 reviews (6700/7929, 84.50%) giving the app a 5-star rating and 2676 reviews (2676/7929, 33.75%) explicitly terming the app “helpful” or that it “helped.” Of 7929 reviews, 251 (3.17%) had a less than 3-star rating and were termed as negative reviews for AI health apps. Conversely, Version also approached statistical significance (β = 0.34, SE = 0.18, z = 1.95, p = .052), suggesting that newer app versions may be associated with higher ratings (OR = 1.41). For instance, the recently updated version of MyFitnessPal (Android build 25.26.0) released on July 2, 2025, hits a 4.7 ratings with over 2,751,560 downloads on google play store. According to Tim Holley [10], Chief Product Officer at MyFitnessPal, “The 2025 Winter Release underscores MyFitnessPal's commitment to supporting our members as they advance the way they approach nutrition and habit development”, she added on the post "Integrating tools like Voice Log and Weekly habits, gives members effective solutions to streamline tracking, while reinforcing the importance of progress over perfection in building lasting habits—because true success in nutrition comes from consistency, not perfection.".
In contrast, Reviews (β = -0.06, p = .748), Developer Type (β = 17.59, p = .981), and Release Year (β = 0.04, p = .803) were not statistically significant predictors of high ratings. Notably, the extremely large coefficient and standard error for Developer Type may indicate model instability or data sparsity in that category. Overall, the findings suggest that application category, recent updates, and possibly AI classification and versions are relevant features associated with higher user ratings.
4. Discussion
This study employed a novel combination of machine learning statistical techniques, including the Naïve Bayes Classifier, K-Nearest Neighbors (KNN), and Binomial Logistic Regression. This hybrid methodology enables the analysis and classification of Google Play Store metadata, offering a multidimensional perspective on the effectiveness of healthcare applications based on user ratings.
While this approach provides valuable insights, the researcher acknowledges several limitations that affect the comprehensiveness of the findings. One key limitation is the limited dataset diversity and size—the analysis included only 305 applications, which may not fully represent the wide range of health apps available on the Google Play Store. This constraint potentially limits the generalizability of the findings, especially given the rapid growth and diversity of mobile health applications.
Another challenge is class imbalance and the data cleaning process, which involved the exclusion of entries due to missing or irrelevant data—this may have introduced bias. To address data imbalance, the study employed the Synthetic Minority Oversampling Technique (SMOTE), which, while effective, can sometimes result in overfitting or generating less realistic representations.
Model performance is also a noted limitation. The models demonstrated moderate predictive performance, averaging around 75%. Notably, the Naïve Bayes classifier, despite achieving high recall, performed poorly overall, suggesting that the current set of features may not adequately capture the determinants of app effectiveness.
Binomial Logistic Regression was employed with proper diagnostic assumptions. Collinearity was assessed prior to model fitting, and the Variance Inflation Factor (VIF) value of 1.0 indicated no significant multicollinearity, confirming that each predictor contributed unique information. Similarly, the tolerance value of 0.9 further supported minimal redundancy, as values close to 1 suggesting low multicollinearity.
The analysis revealed that features such as number of reviews, developer type, and release year were not statistically significant predictors of app effectiveness. This suggests that other unmeasured factors—such as health outcomes, user engagement metrics, or app usability scores—may play a more critical role but were not captured in this study. A promising direction for future research for this study is utilizing a larger and more diverse datasets, coupled with advanced deep learning methodologies, to improve model accuracy and uncover additional predictors of healthcare app effectiveness.
5. Conclusions
This study successfully demonstrated the predictive capability of machine learning models in evaluating the effectiveness of health applications on the Google Play Store using metadata features such as Classification (AI vs. Non-AI), App Category, Developer Type, Version, Reviews, Release Year, and Recent Update. Among the three models tested—Naïve Bayes, K-Nearest Neighbors (KNN), and Binomial Logistic Regression—the KNN model emerged as the most balanced and robust performer with an overall accuracy of 75.89%, strong precision (82.22%), and reliable sensitivity (66.07%). It offered the highest AUC score (0.849), indicating excellent discriminative ability in distinguishing highly rated health apps from low-rated ones.
The Binomial Logistic Regression model provided the highest accuracy (76.32%) and perfect precision (100%), though its recall was modest (52.63%). This conservative model was highly effective in avoiding false positives, making it particularly useful in contexts where recommending only the best apps is crucial. The Naïve Bayes model, while achieving perfect recall (100%), suffered from very low precision (14.12%) and produced many false positives, limiting its utility in real-world applications. Furthermore, the logistic regression analysis identified several app features significantly associated with higher user ratings. Health & Fitness category apps, recent updates, and possibly AI-driven classification and app version were positively associated with high effectiveness ratings. These findings align with trends showing that frequently updated, AI-enabled, and fitness-focused applications tend to be more favorably received by users. On the other hand, the number of reviews, developer type, and release year were not statistically significant predictors of app effectiveness. Future studies should consider larger and more diverse datasets and explore additional features (e.g., user sentiment from reviews, app permissions) to further improve model performance.
Data Availability Statement
The data that support the findings of this study are confidential and are not publicly available due to privacy restrictions. Access to the dataset may be granted upon reasonable requests and with permission from the corresponding data owner.
Acknowledgments
The authors thank the reviewers for their comments which helped to improve the presentation of this manuscript
Conflicts of Interest
The author declares no conflict of interest associated in this study.
Abbreviations
The following abbreviations are used in this manuscript:
| KNN | K-nearest Neighbors |
| SMOTE | Synthetic Minority Oversampling Technique |
References
- Aljedaani, B., & Babar, M. A. (2021). Challenges with developing secure mobile health applications: Systematic review. JMIR Mhealth and Uhealth, 9(6), e15654. [CrossRef]
- Alshammari, A. F. (2024). Implementation of Classification using K-Nearest Neighbors (KNN) in Python. https://www.researchgate.net/publication/383264743_Implementation_of_Classification_using_K-Nearest_Neighbors_KNN_in_Python.
- Appbrains (2025). The top 20 are trending Health & Fitness Apps for Android right now. https://www.appbrain.com/apps/trending/health-and-fitness.
- Balcombe, L., & De Leo, D. (2021). Digital mental health challenges and the horizon ahead for solutions. JMIR Mental Health, 8(3), e26811. [CrossRef]
- Baxromovich, A. D. (2024). Impact of technology on physical activity. https://westerneuropeanstudies.com/index.php/4/article/view/707.
- Chan, K. T. (2022). Emergence of the ‘Digitalized Self’ in the age of digitalization. Computers in Human Behavior Reports, 6, 100191. [CrossRef]
- Feld, J. (2024). How AI Is Transforming Fitness Apps. https://www.healthandfitness.org/improve-your-club/how-ai-is-transforming-fitness-apps/.
- GeeksforGeeks (2025). Logistic Regression in R Programming. https://www.geeksforgeeks.org/r-language/logistic-regression-in-r-programming/.
- Glauner, P., Plugmann, P., & Lerzynski, G. (2021). Digitalization in healthcare. Springer. https://link.springer.com/book/10.1007/978-3-030-65896-0.
- Holley, T. (2025). MyFitnessPal Unveils Its 2025 Winter Release. https://www.prnewswire.com/news-releases/myfitnesspal-unveils-its-2025-winter-release-302385598.html.
- Hu, J., He, W., Zhang, J., & Song, J. (2023). Examining the impacts of fitness app features on user well-being. Information & Management, 60(5), 103796. [CrossRef]
- Lead Statistics (2018). Binomial Logistic Regression using SPSS Statistics. https://statistics.laerd.com/spss-tutorials/binomial-logistic-regression-using-spss-statistics.
- Maredia, R. (2020). Analysis of Google Play Store Data set and predict the popularity of an app. https://www.researchgate.net/publication/343769728_Analysis_of_Google_Play_Store_Data_set_and_predict_the_popularity_of_an_app_on_Google_Play_Store.
- Malik, T., Ambrose, A. J., & Sinha, C. (2022). Evaluating user feedback for an Artificial Intelligence–Enabled, Cognitive Behavioral Therapy–Based Mental Health app (WYSA): Qualitative Thematic analysis. JMIR Human Factors, 9(2), e35668. [CrossRef]
- McGuire, J. (2025). We've tested the best workout apps 2025 to help you train at home. https://www.tomsguide.com/best-picks/best-workout-apps.
- Noor, N. M., Chin, Y. W., & Yusoff, N. H. (2023). Unveiling the impact of technological progress on societal advancement: A scholarly analysis of family well-being through the lens of millennial women. International Journal of Academic Research in Business and Social Sciences, 13(7). [CrossRef]
- Raj, G., Sharma, A. K., & Arora, Y. (2024). Analyzing the effect of digital technology on mental health. In Advances in Web Technologies and Engineering (pp. 54–82). IGI Global. [CrossRef]
- Romanova, T. F., Klimuk, V. V., Andreeva, O. V., Sukhoveeva, A. A., & Otrishko, M. O. (2019). Digitalization as an urgent trend in the development of the social sphere. In Lecture Notes in Networks and Systems (pp. 931–939). [CrossRef]
- Sama, P. R., Eapen, Z. J., Weinfurt, K. P., Shah, B. R., & Schulman, K. A. (2014). An evaluation of mobile health application tools. JMIR Mhealth and Uhealth, 2(2), e19. [CrossRef]
- Saedsayad (2018). Naïve Bayesian. http://www.saedsayad.com/naive_bayesian.htm.
- Sandua, D. (2024). The double sides of technology: Internet addiction and its impact on today’s world. https://books.google.com.ph/books?hl=en&lr=&id=uS78EAAAQBAJ.
- Shaw, B. (2021). Why Fitness Apps Have Become So Popular. https://sustainhealth.fit/lifestyle/why-fitness-apps-have-become-so-popular/.
- Spijker, J. J. A., Barlın, H., Grad, D. A., Gu, Y., Klavina, A., Yaylagul, N. K., Kulla, G., Orhun, E., Ševčíková, A., Unim, B., & Tofan, C. M. (2024). The impact of digital technology on the physical health of older workers: Protocol for a scoping review (preprint). JMIR Publications. [CrossRef]
Figure 1.
Flowchart of the study’s methodology.
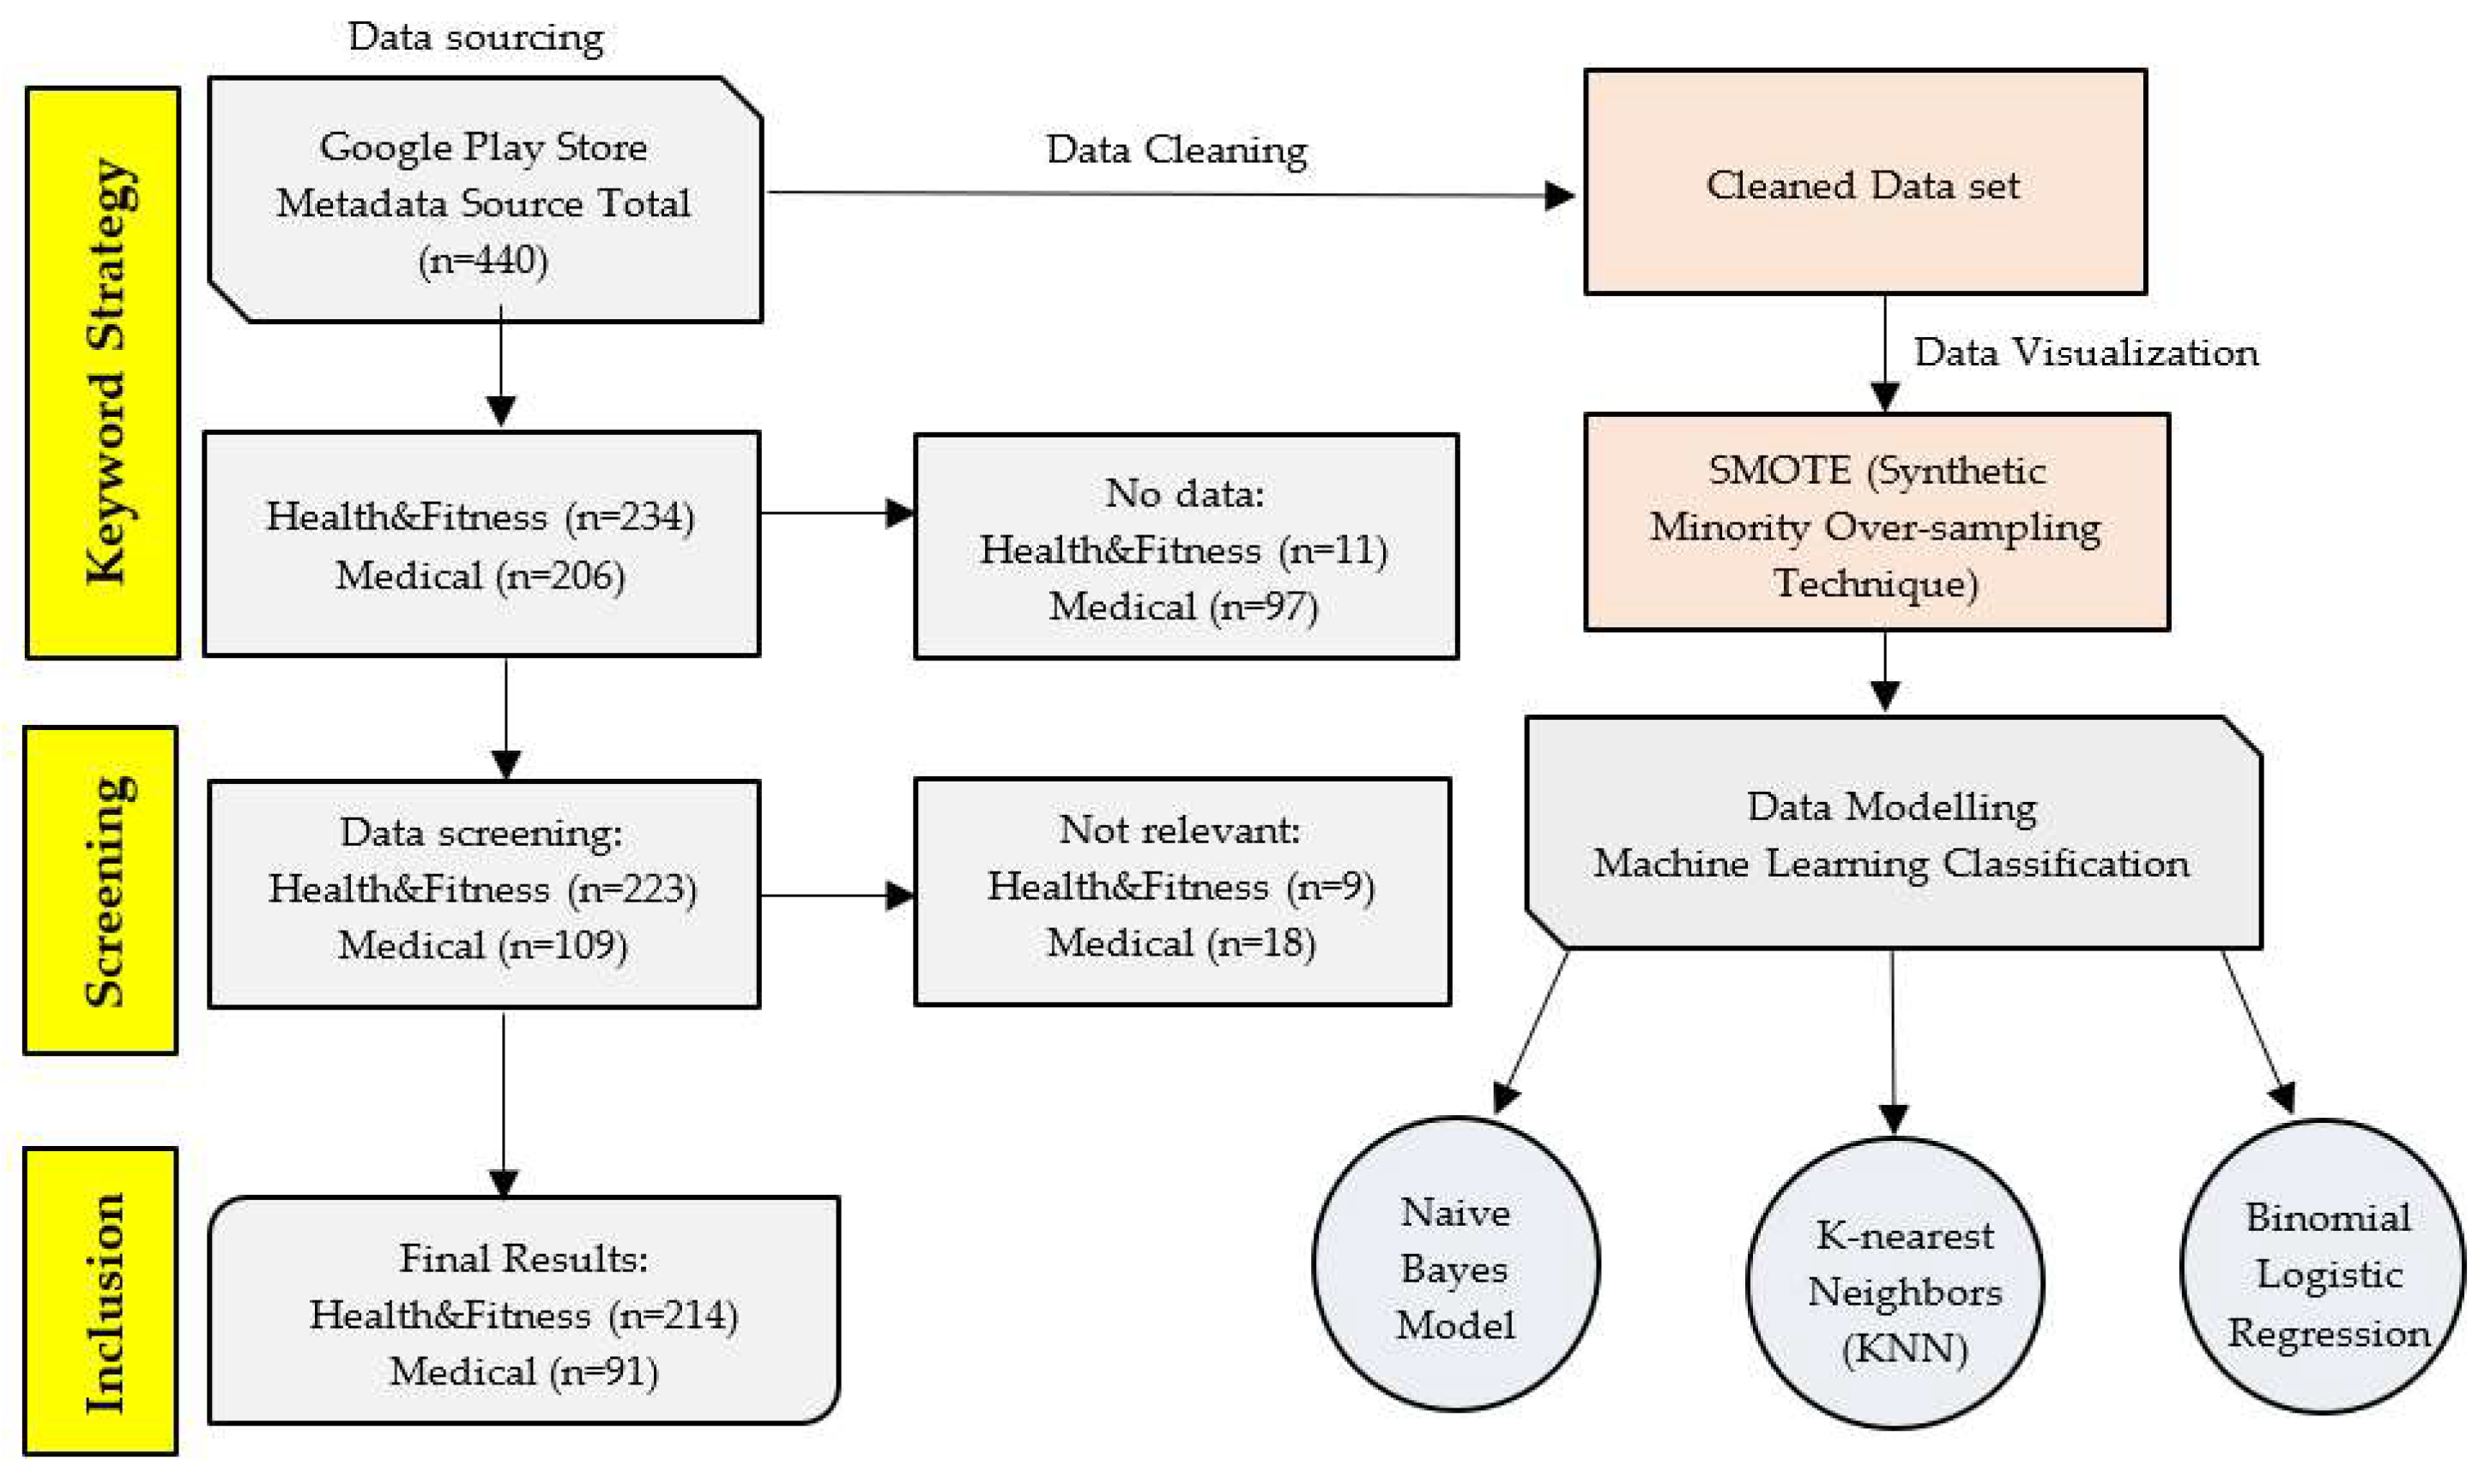
Figure 2.
Explanation of k-nearest neighbors.
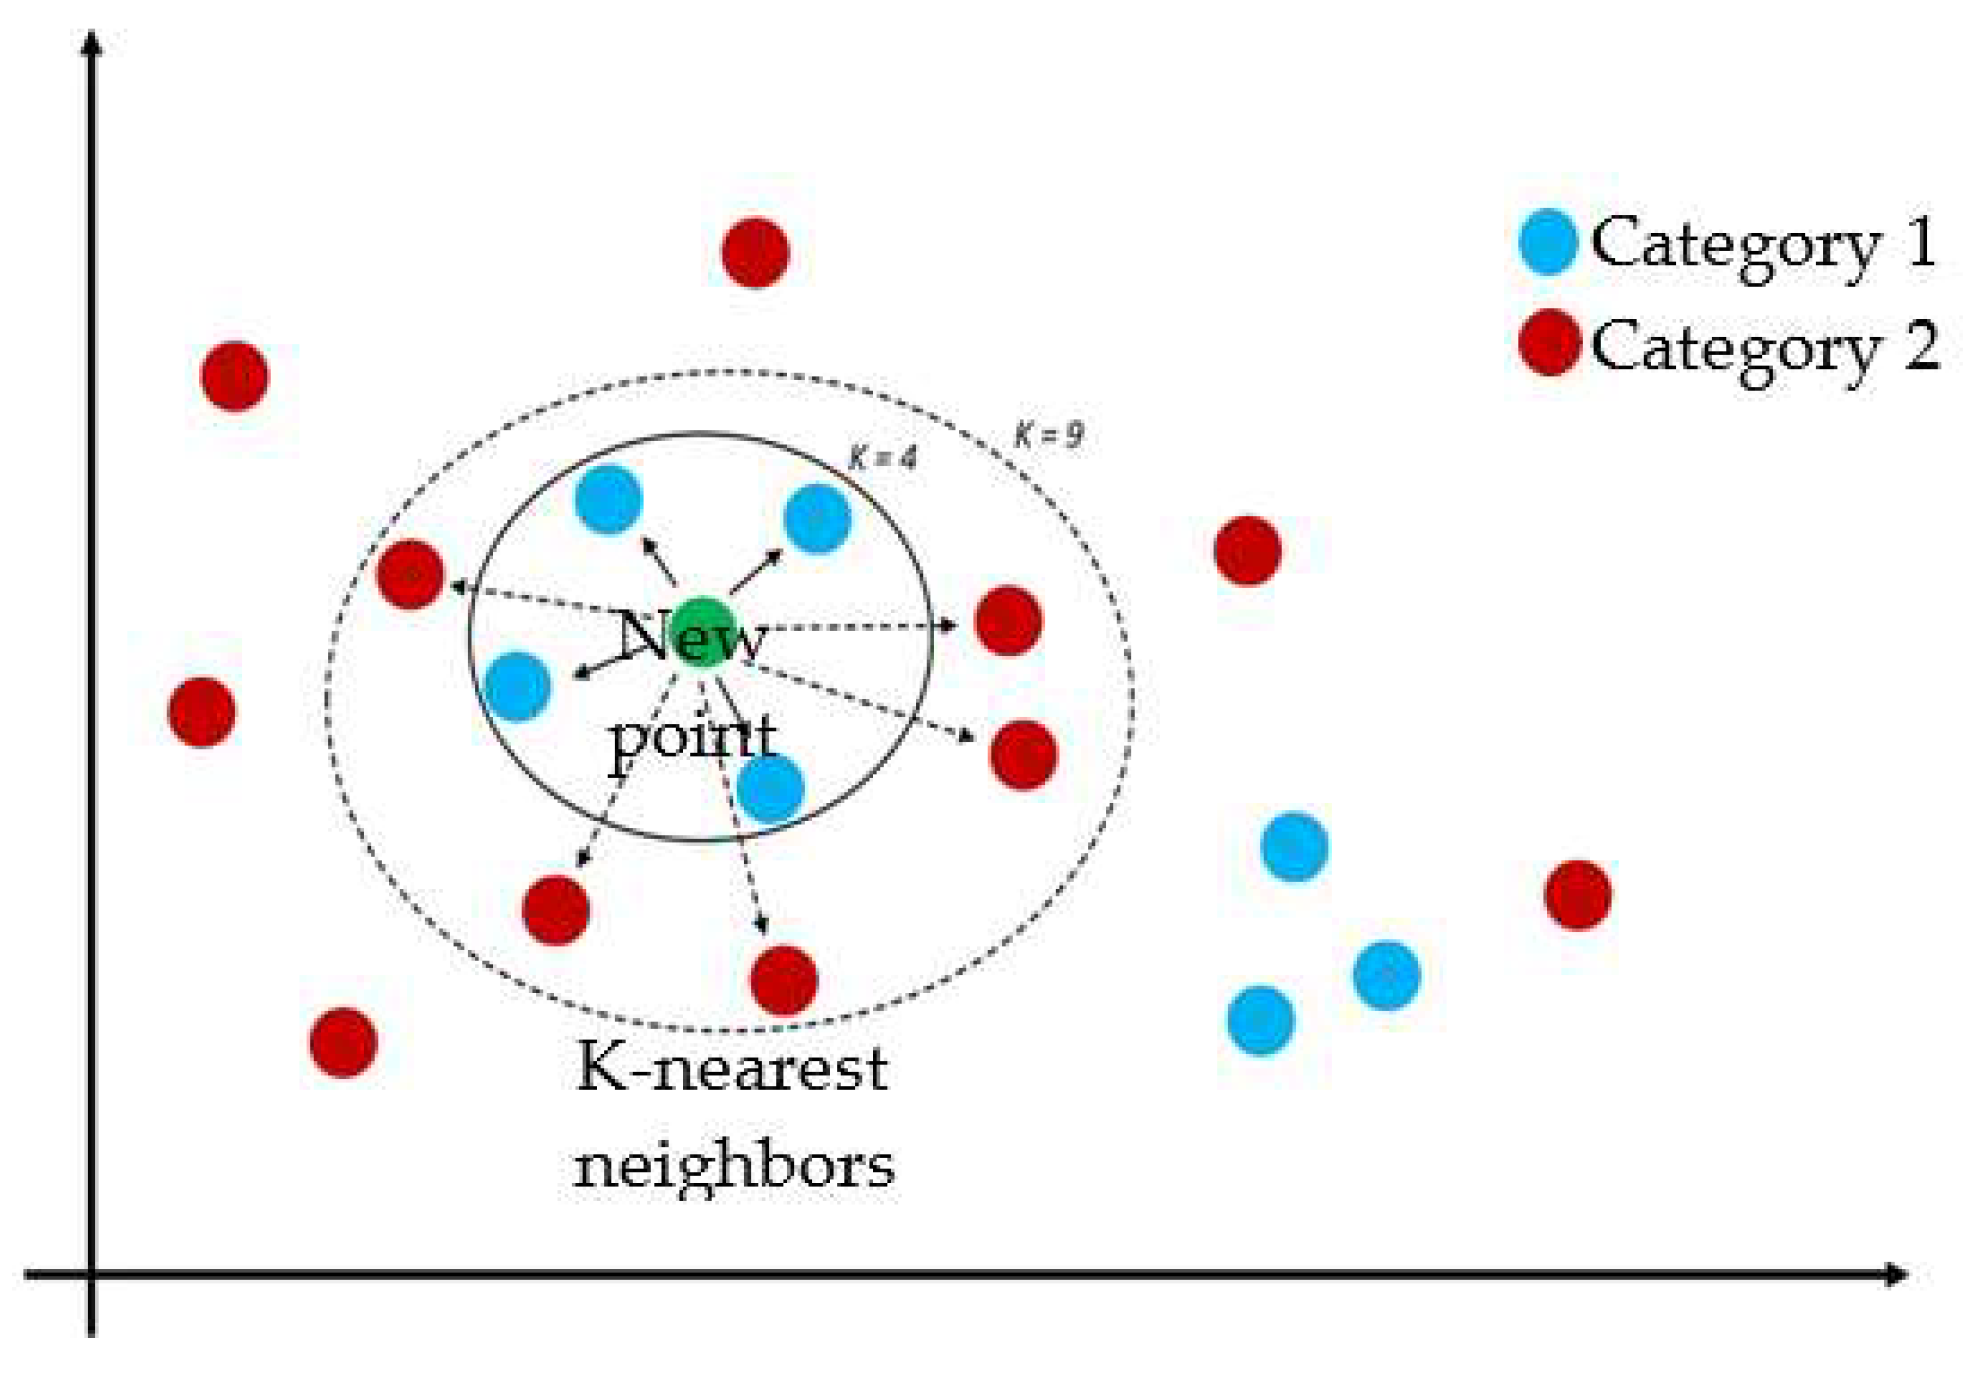
Figure 3.
K-fold cross validation.
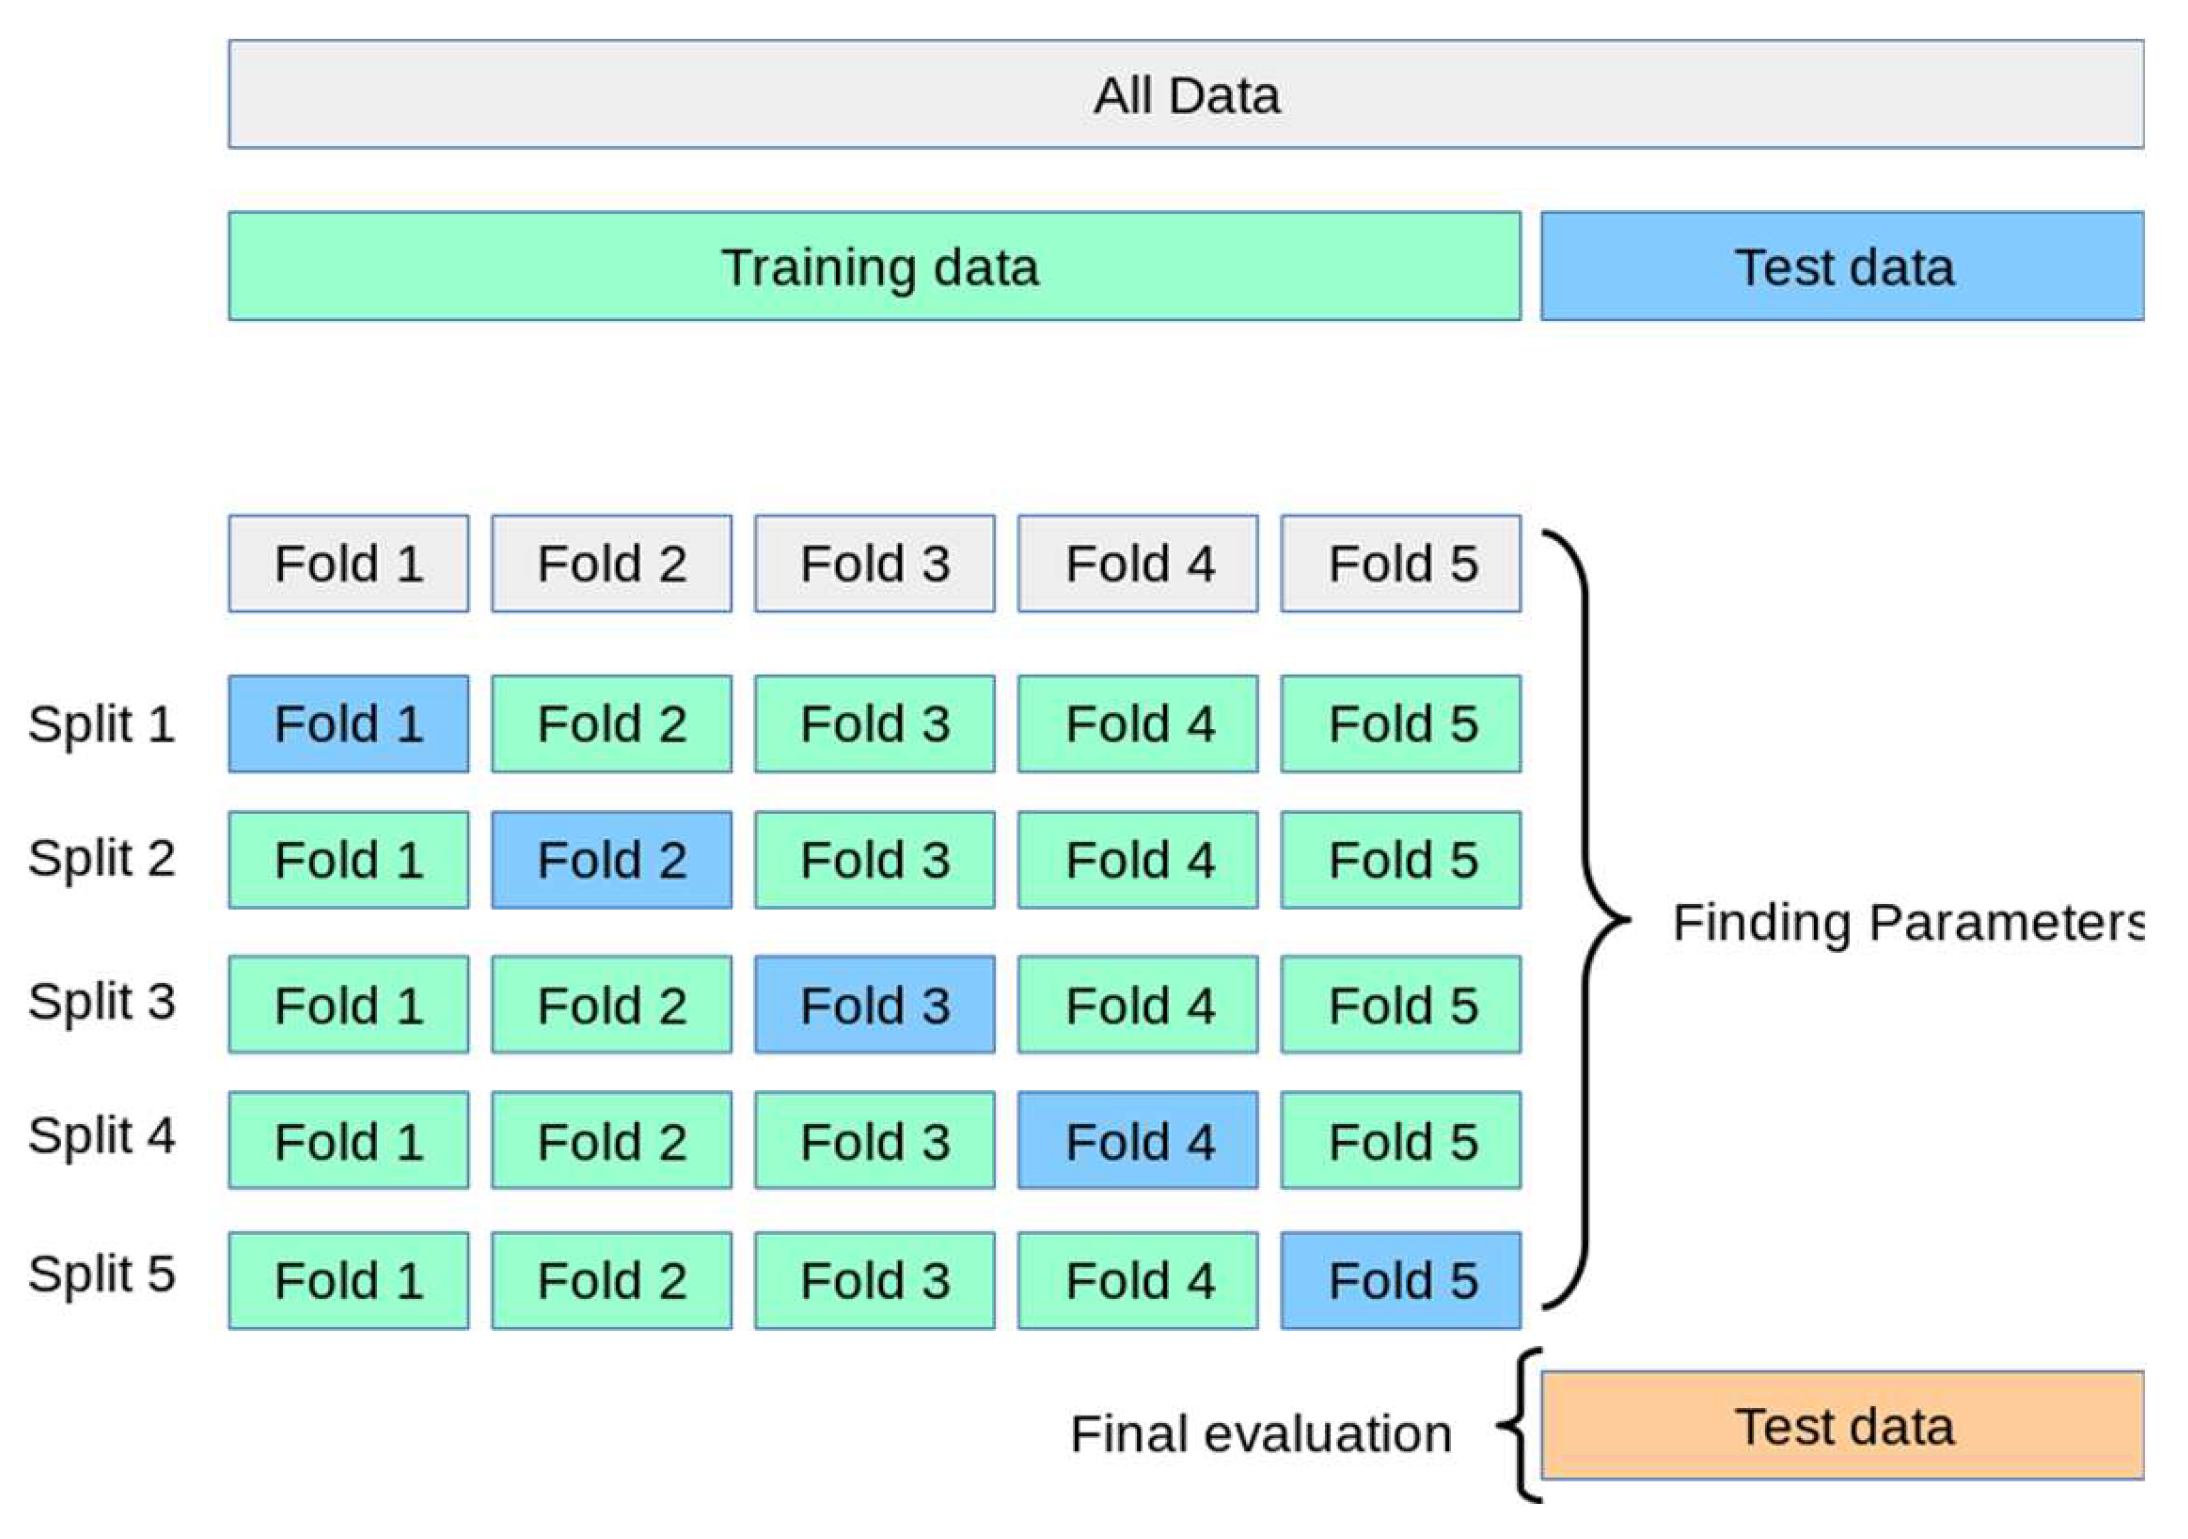
Figure 4.
Explanation of Euclidean Distance.
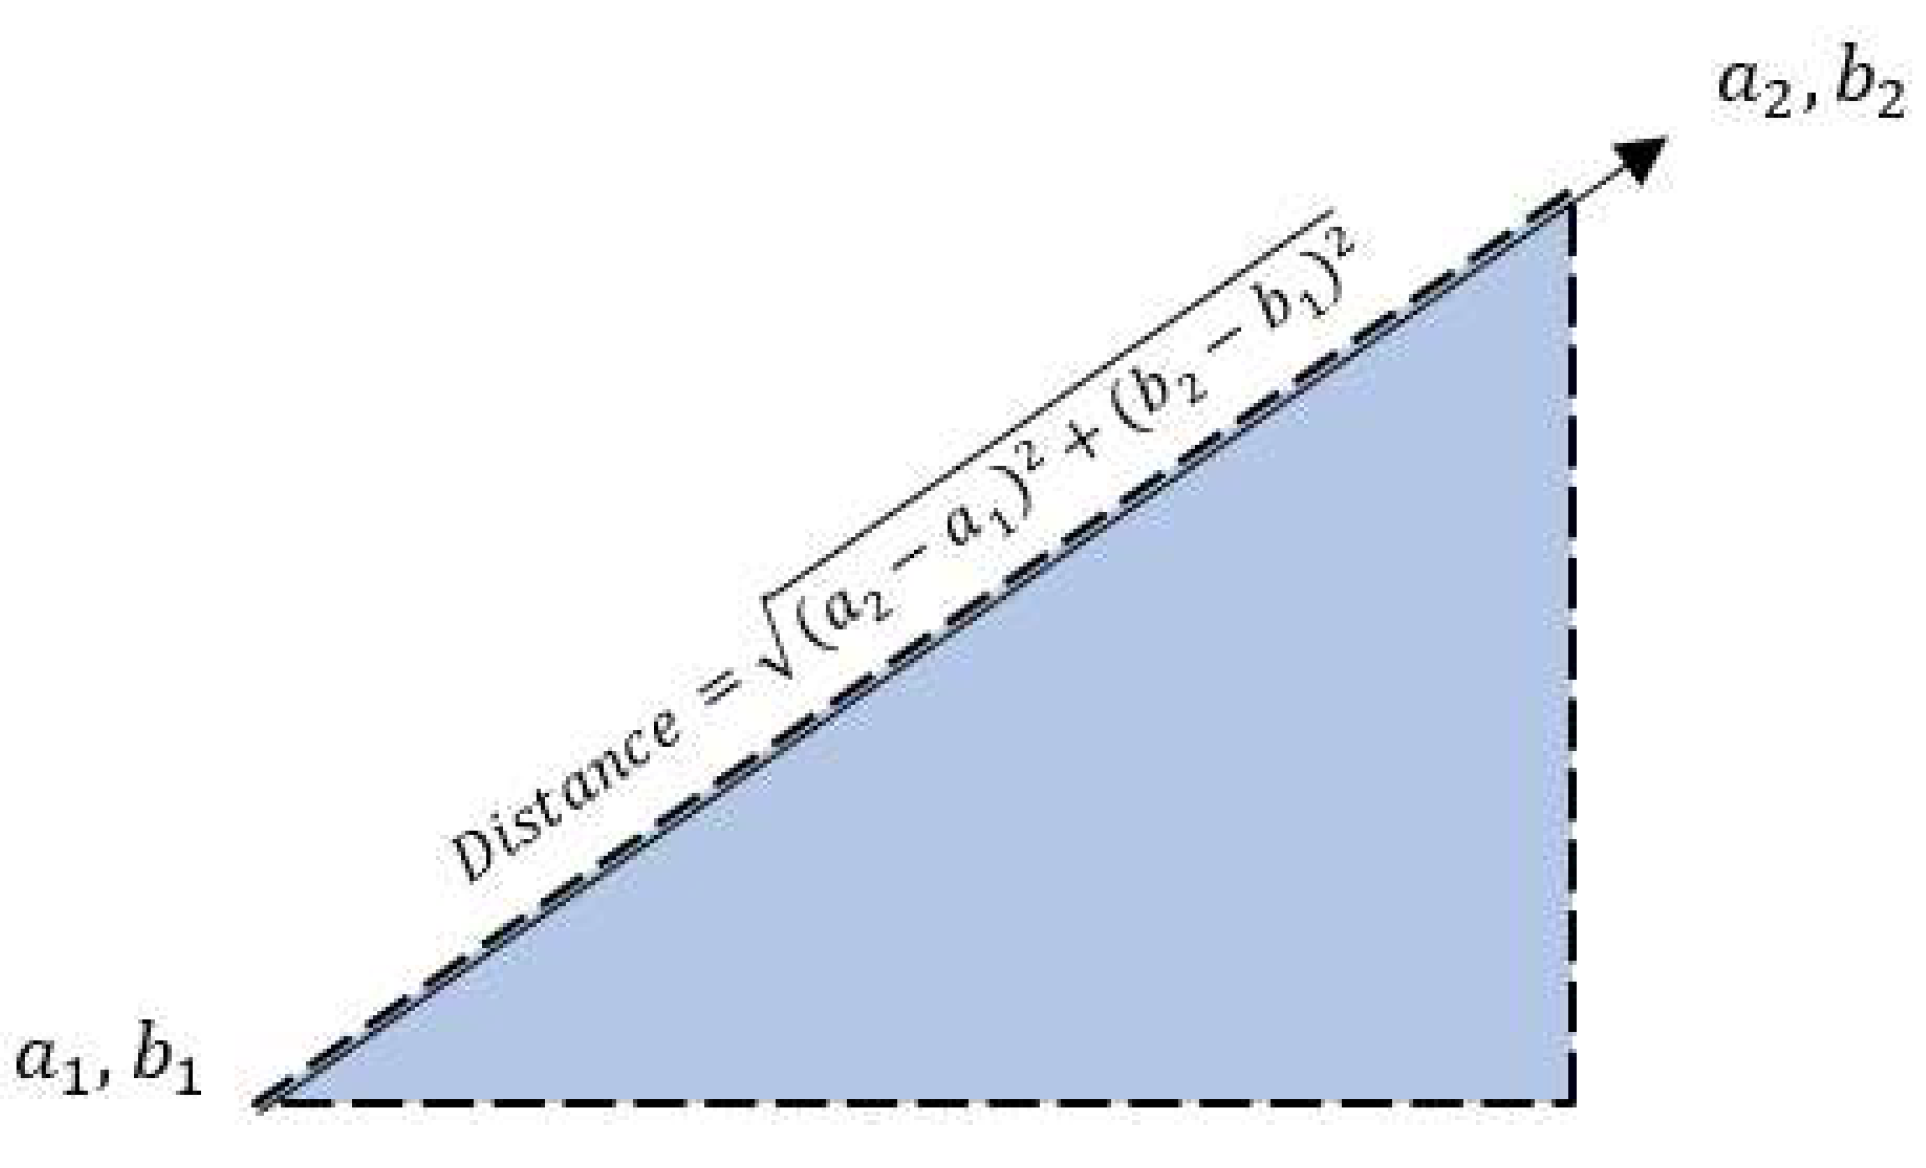
Figure 5.
Explanation of Sigmoid.
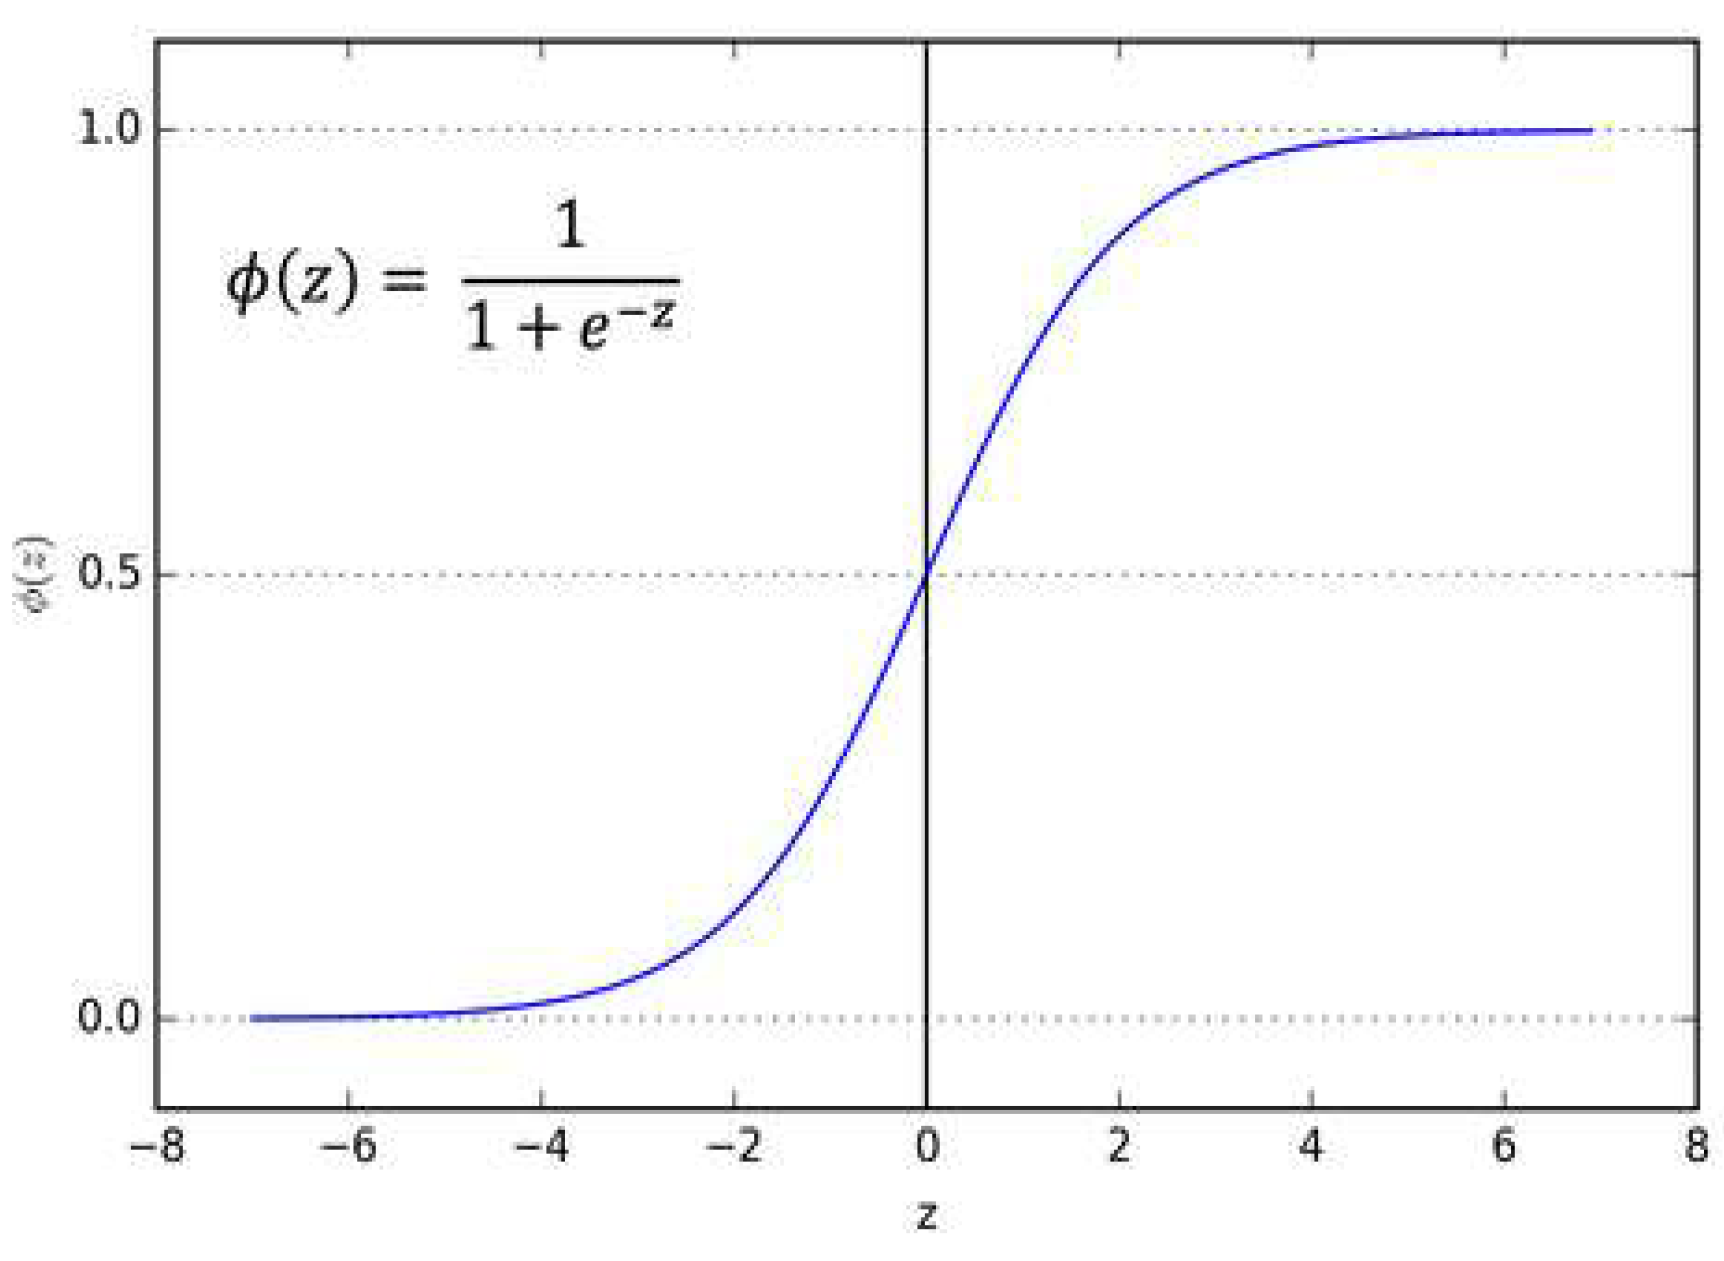
Figure 6.
ROC Curves Comparing KNN, Naive Bayes, and Logistic Regression Models in Predicting Health App Effectiveness (User Ratings: 1 = High, 2 = Low).
Figure 6.
ROC Curves Comparing KNN, Naive Bayes, and Logistic Regression Models in Predicting Health App Effectiveness (User Ratings: 1 = High, 2 = Low).
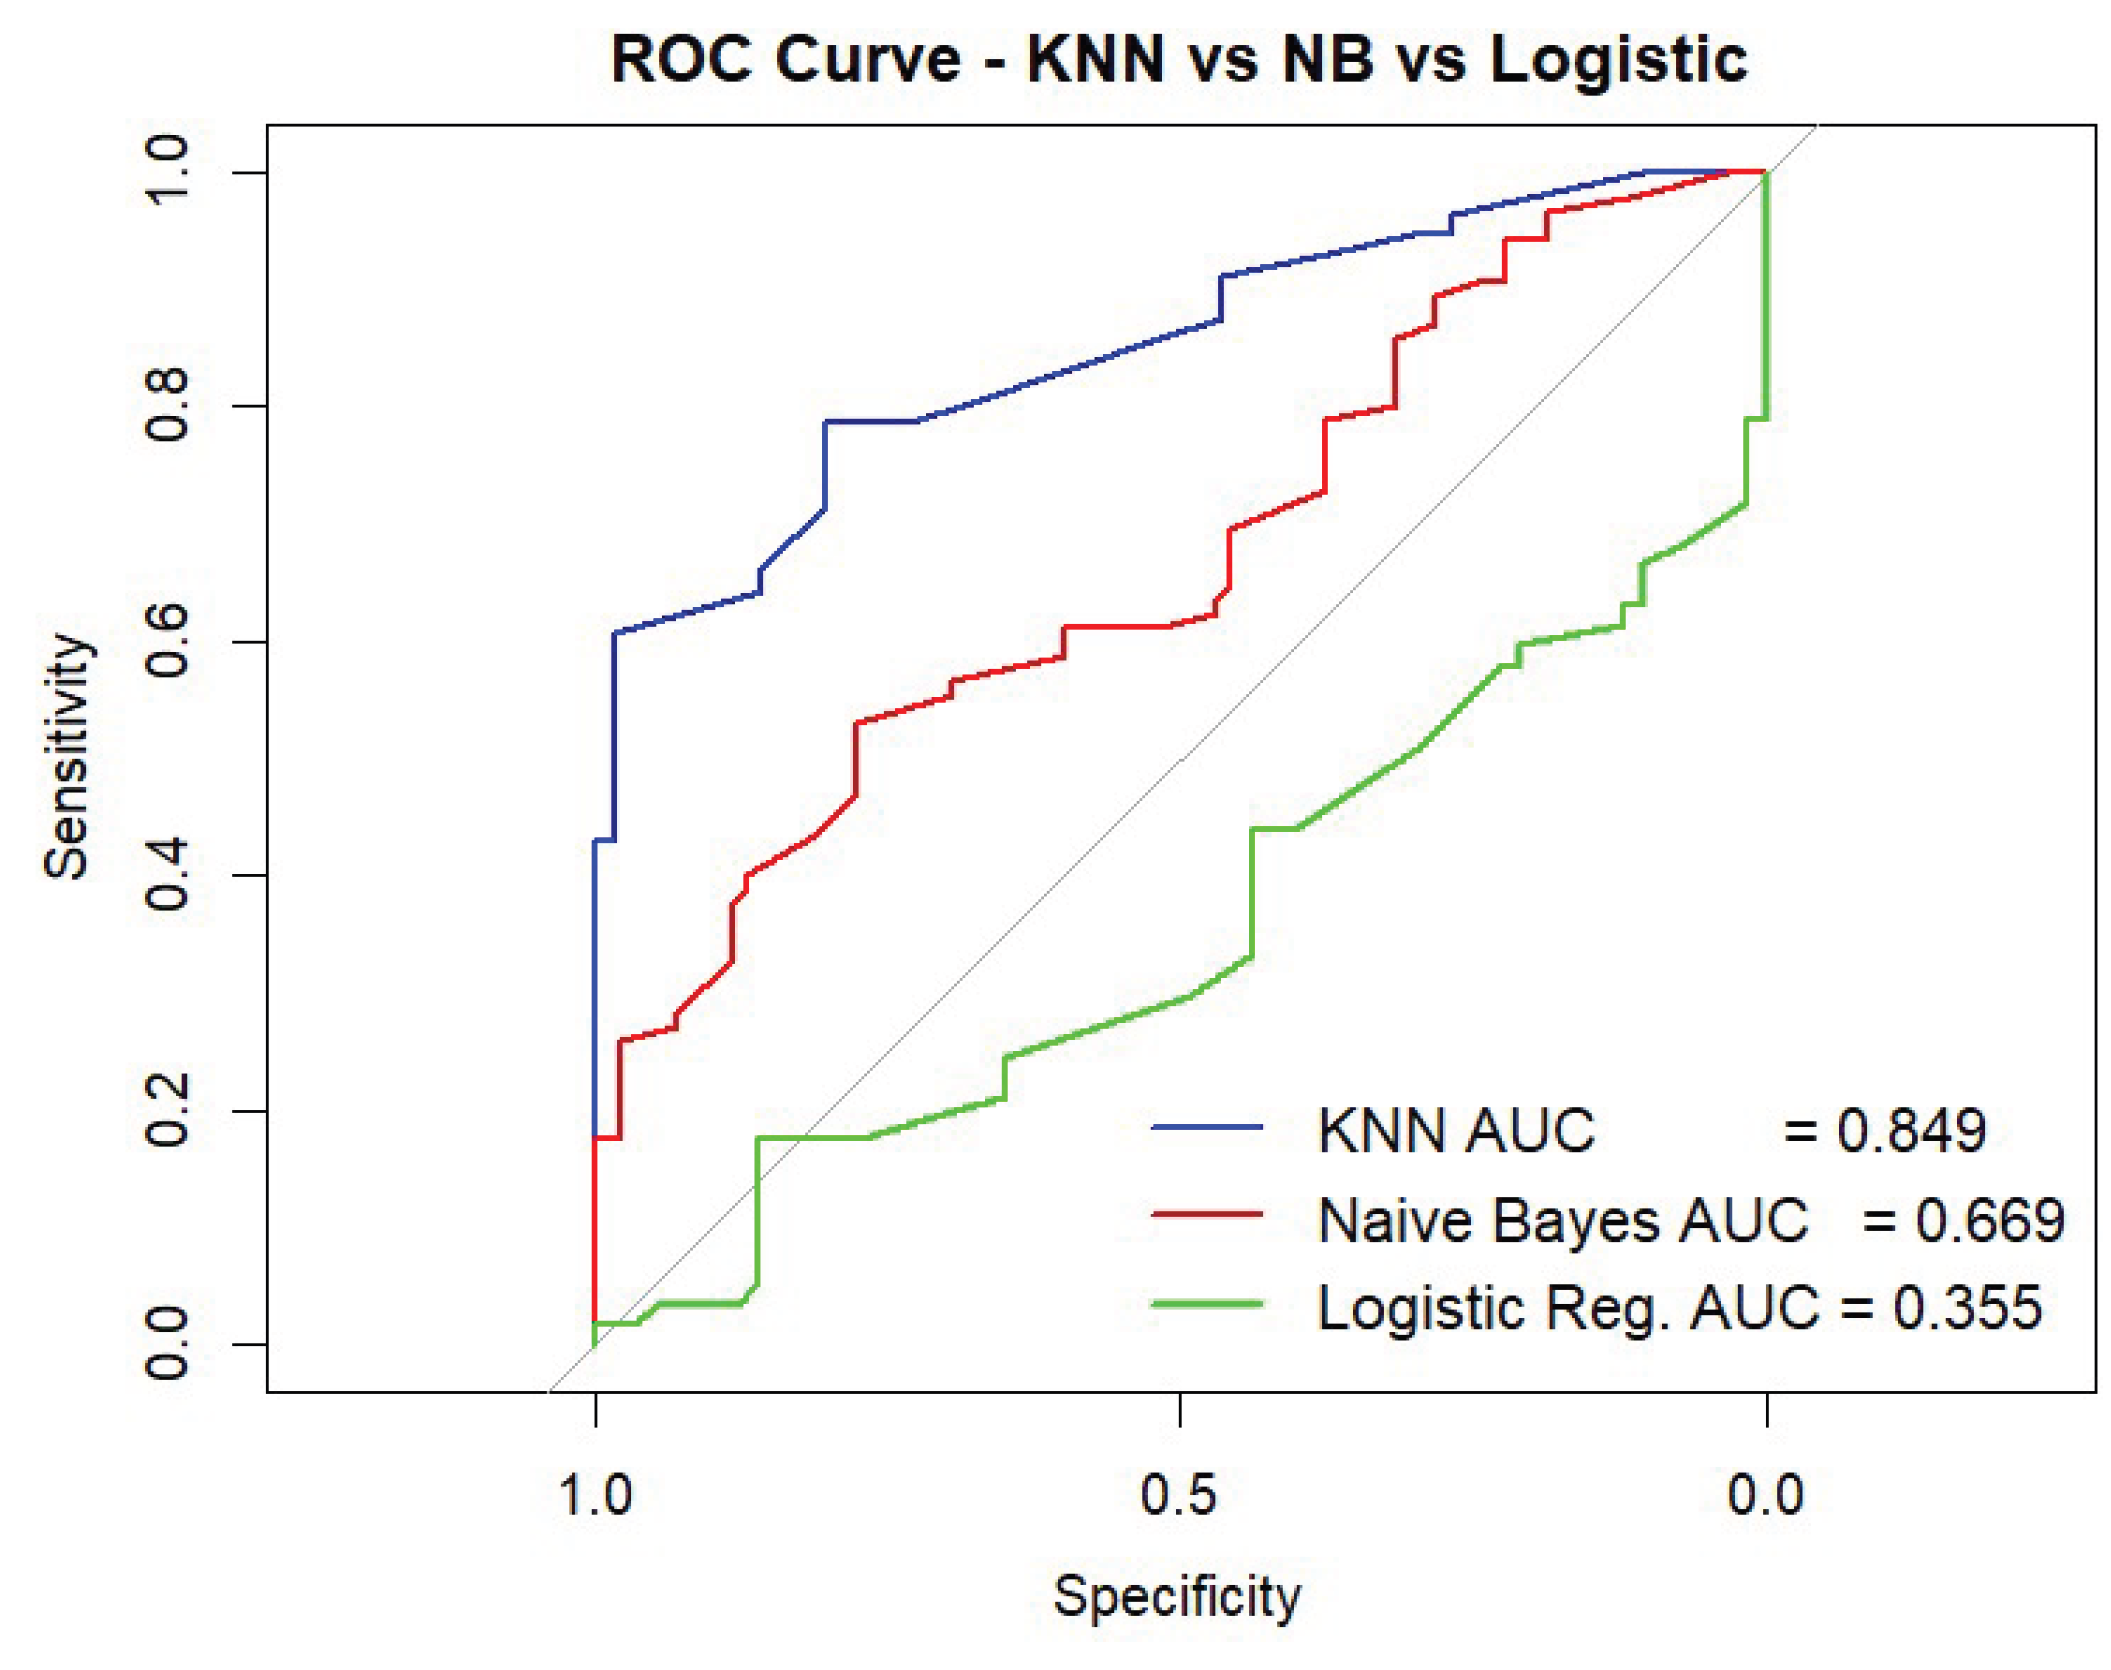
Table 2.
Model performance metrics for Naïve Bayes model.
| Metric | Value Test | Significance |
| Accuracy | 0.5706 | - |
| 95% CI | (0.4926, 0.6461) | - |
| No Information Rate (NIR) | 0.9294 | - |
| P-Value [Acc > NIR] | p = 1.00 | Not significant |
| Kappa | 0.1412 | - |
| Sensitivity | 1.000 | - |
| Specificity | 0.53797 | - |
| F1 Score | 0.2474 | - |
| Recall | 1.000 | - |
| Precision | 0.1412 | - |
| Balanced Accuracy | 0.7690 | - |
| Positive Predicted Class | 1 (High Rating) | - |
| Mcnemar's P-Value | p < .001 | Highly significant |
Note: p < .001 Highly Significant, p <.05 Significant, p> 0.5 Not significant.
Table 3.
Confusion Matrix for Naïve Bayes Model.
| Predicted: (1) | Predicted: (2) | |
| Actual: (1) | 12 | 73 |
| Actual: (2) | 0 | 85 |
Table 4.
Model performance metrics for K-nearest Neighbors.
| Metric | Value Test | Significance |
| Accuracy | 0.7589 | - |
| 95% CI | (0.669, 0.8347) | - |
| No Information Rate (NIR) | 0.5 | - |
| P-Value [Acc > NIR] | p < .001 | Highly significant |
| Kappa | 0.5179 | - |
| Sensitivity | 0.6607 | - |
| Specificity | 0.8571 | - |
| F1 Score | 0.7326 | - |
| Recall | 0.6607 | - |
| Precision | 0.8222 | - |
| Balanced Accuracy | 0.7589 | - |
| Positive Predicted Class | 1 (High Rating) | - |
| Mcnemar's P-Value | p = 0.0543 | Not significant |
Note: p < .001 Highly Significant, p <.05 Significant, p> 0.5 Not significant.
Table 5.
Confusion Matrix for KNN Model.
| Predicted: (1) | Predicted: (2) | |
| Actual: (1) | 37 | 8 |
| Actual: (2) | 19 | 48 |
Table 6.
Model performance metrics for Binomial Logistic Regression.
| Metric | Value Test | Significance |
| Accuracy | 0.7632 | - |
| 95% CI | (0.6744, 0.8378) | - |
| No Information Rate (NIR) | 0.5 | - |
| P-Value [Acc > NIR] | p < .001 | Highly significant |
| Kappa | 0.5263 | - |
| Sensitivity | 0.5263 | - |
| Specificity | 1.000 | - |
| F1 Score | 0.6897 | - |
| Recall | 0.5263 | - |
| Precision | 1.000 | - |
| Balanced Accuracy | 0.7632 | - |
| Positive Predicted Class | 1 (High Rating) | - |
| Mcnemar's P-Value | p < .001 | Highly significant |
Note: p < .001 Highly Significant, p <.05 Significant, p> 0.5 Not significant.
Table 7.
Confusion Matrix for KNN Model.
| Predicted: (1) | Predicted: (2) | |
| Actual: (1) | 30 | 0 |
| Actual: (2) | 27 | 57 |
Table 8.
Performance metrics of three classification models in predicting highly effective health applications (positive class = 1).
Table 8.
Performance metrics of three classification models in predicting highly effective health applications (positive class = 1).
| Models | Accuracy | Precision | Recall (Sensitivity) | Specificity | FI Score | AUC | Positive Class |
| Naïve Bayes Model | 57.06% | 14.12% | 100% | 53.80% | 24.74% | 0.669 | 1 (High) |
| K-nearest Neighbors (KNN) | 75.89% | 82.22% | 66.07% | 85.71% | 73.26% | 0.849 | 1 (High) |
| Binomial Logistic Regression | 76.32% | 100%% | 52.63% | 100% | 68.97% | 0.355 | 1 (High) |
Table 9.
Binomial Logistic Regression Model fit summary.
| Null Deviance | Residual Deviance | df | χ² | Nagelkerke R2 | p-value | AIC |
| 629.38 | 564.29 | 7 | 65.09 | 0.176 | p < .001 | 580.29 |
Table 10.
Logistic Regression Results Predicting High App Ratings.
| Variables (Features) | Coefficient (β) | SE | z value | p-value | Odds Ratio |
| Classification | 0.38671 | 0.20740 | 1.865 | 0.0622 | 1.47 |
| Category | 0.74795 | 0.21475 | 3.483 | 0.000*** | 2.11 |
| Reviews | -0.05642 | 0.17526 | -0.322 | 0.748 | 0.95 |
| Developer | 17.59158 | 730.13032 | 0.024 | 0.981 | 4.30 |
| Recent update | 0.65716 | 0.30734 | 2.138 | 0.032* | 1.93 |
| Version | 0.34434 | 0.17683 | 1.947 | 0.052 | 1.41 |
| Release Year | 0.03808 | 0.15261 | 0.250 | 0.803 | 1.04 |
| Significance levels —. p < .10 (marginal), *p < .05, **p < .01, **p < .001, ***p < .000 | |||||
Disclaimer/Publisher’s Note: The statements, opinions and data contained in all publications are solely those of the individual author(s) and contributor(s) and not of MDPI and/or the editor(s). MDPI and/or the editor(s) disclaim responsibility for any injury to people or property resulting from any ideas, methods, instructions or products referred to in the content. |
© 2025 by the authors. Licensee MDPI, Basel, Switzerland. This article is an open access article distributed under the terms and conditions of the Creative Commons Attribution (CC BY) license (http://creativecommons.org/licenses/by/4.0/).
Copyright: This open access article is published under a Creative Commons CC BY 4.0 license, which permit the free download, distribution, and reuse, provided that the author and preprint are cited in any reuse.


