Submitted:
14 July 2025
Posted:
16 July 2025
You are already at the latest version
Abstract
Deforestation monitoring is critical to support compliance with regulatory frameworks such as the EU Deforestation Regulation (EUDR), which requires that products containing or derived from beef, cacao, coffee, oil palm, rubber, soy, and timber are deforestation-free after December 31, 2020. Earth Observation (EO) offers a means to assess deforestation, yet map-based verification remains technically limited and uncertain. This study addresses the lack of a systematic assessment of global Forest/Non-Forest (FNF) and Land Use/Land Cover (LULC) datasets by identifying and evaluating 21 publicly available global forest reference maps for their alignment with EUDR criteria. Based on EUDR-related parameters (temporal proximity, spatial resolution, and forest definition) and accuracy metrics, eight datasets are evaluated as suitable. However, most fail to fully meet all EUDR requirements, particularly forest definitions, with only two datasets satisfying all indicators. Reported accuracy metrics reveal a general overestimation of forest areas, while canopy height-based maps tend to underestimate tree cover, potentially excluding forested regions. Regional comparisons show more consistent estimates in South America, while Europe and North America display greater variability. These findings support informed decision-making by companies and policymakers for selecting suitable datasets, while also highlighting reveals underlying conflicts and challenges associated with the use of global forest maps for regulatory compliance.
Keywords:
European Union Deforestation Regulation (EUDR)
; global forest maps
; EUDR compliance
; deforestation-free verification
; fitness for purpose
1. Introduction
Forest ecosystems provide a wide range of ecosystem services that are crucial for maintaining life on earth [1]. Nonetheless, over the last three decades forest loss is estimated to have reached almost half a billion hectares worldwide with anthropogenic disturbances contributing significantly to the loss of biodiversity, reduction in forest area, and degradation of forest conditions. This severely undermines the ability of forests to provide essential ecosystem services to local populations and people who depend on them [2,3,4].
Deforestation and forest degradation have complex, context-dependent causes, but are often linked to the production and trade of agricultural and forestry commodities [5,6]. During the past years, voluntary guidelines such as zero deforestation commitments (ZDC) were developed aiming to foster environmental, social and economic sustainability throughout the value chain [7,8]. Such governance mechanisms are meant to address related issues beyond national laws, extending responsibilities to all agents within the value chains [9]. Despite their proliferation, however, private governance mechanisms such as ZDCs have faced difficulties to address tropical deforestation and the overexploitation of natural resources as originally anticipated [10,11,12]. Against this backdrop, the European Union (EU) developed a regulation for deforestation-free products (EUDR, Regulation (EU) 2023/1115) in which commodities or products in scope cannot be placed on EU markets unless they are deforestation-free after the cut-off date of 31 December 2020, and were produced in accordance to national legislation. This includes products made from, fed by or containing derivates of oil palm, soy, cocoa, coffee, rubber, cattle, wood (hereafter EUDR-regulated commodities).
The EUDR came into force on 29 June 2023 and will take effect on 30 December 2025. The regulation is an integral component of the EU Forest Strategy embedded within the Green Deal, the EU Biodiversity 2030 Strategy and the Farm to Fork Strategy. Together, these initiatives target to foster a climate neutral and sustainable economy by 2050. The EUDR builds on the premises that the EU’s consumption of globally produced commodities contributes to the increase in carbon emissions, through deforestation, forest degradation and other ecosystem disturbances. Hence, the policy aims to reduce deforestation and forest degradation by preventing the access of specific unsustainable products into the EU market. The regulation entails a series of steps and requirements that must be followed in order to qualify the EUDR-regulated commodities eligible for entry into the EU market. Under this framework, EU-based companies can only place, process or distribute these commodities on the EU market if they provide a compulsory due diligence statement (DDS) confirming that the product is “deforestation-free”, and has been produced in accordance with national legislation. “Deforestation-free” means that EUDR-regulated commodities and their derived products are produced without subjecting forest cover to deforestation, or in the context of timber extraction, to forest degradation after the 31 December 2020. Although forest degradation is a key-element of EUDR regulation, we focus here primarily on deforestation as forest degradation deserves its own separate analysis. Therefore, in the following we only refer to deforestation (conversion of forest into agricultural use) when addressing the deforestation-free requirement in case of the EUDR.
EU-based companies have to fulfil certain information requirements, which must include among others i.) adequately conclusive and verifiable information that the relevant products are deforestation-free and ii.) must indicate the geocoordinates of the plot of land of production (1 point for plots < 4 ha and a polygon for plots > 4ha). Building on this, the fundamental roles of the key actors on assessing the “deforestation-free” criteria are clearly defined: affected companies need to submit their DDS, and the national competent authorities (NCAs) of the EU member states are in charge to verify whether the submitted statements comply to the “deforestation-free” production condition. For this case, data derived from earth observation (EO), e.g., satellite time-series imagery can be used to prepare a DSS (in case of companies) or to verify (in case of NCAs) the provided deforestation-free statements. Such an approach, however requires significant efforts, as it demands expert knowledge and in-house capacity, both of which are not always readily available. One less demanding way to verify deforestation-free production is by comparing geotagged production areas with forest reference information such as available from global forest or tree cover maps derived from EO analysis [13]. A multitude of different map products are publicly available, such as [14] which are used for deforestation monitoring, available with the open-data repository Global Forest Watch (https://www.globalforestwatch.org/map/) [15] and Google Earth Engine data catalog (https://developers.google.com/earth-engine/datasets/catalog/UMD_hansen_global_forest_change_2023_v1_11) [16].
In the era of big data, the production of global forest and tree cover maps rely on analyzing and processing large volumes of information, such as remotely sensed satellite imagery, and other geospatial datasets. This requires advanced computational methods and machine learning approaches, so that meaningful patterns and trends can be extracted from these data [17,18,19]. Therefore, the verification and proving of deforestation-free production using global map products are data-driven decisions, which can be subject to technical limitations. For example, one of the main technical challenges when using forest reference maps to verify the deforestation-free requirements of the EUDR is the potential false detection of deforestation originating from the mismatches when intersecting commodity production areas with forest reference maps. These potential discrepancies labeled as “false positives”, can result from several factors, including the poor quality of source reference dataset, the reliability of map in distinguishing forest from non-forest tree-covered areas, mismatches between map features and EUDR requirements, and inaccurate positioning of recorded geographic coordinates of the production areas.
In general, global forest datasets are known for having certain limitations [20,21], as they aim to provide a harmonized view of the world. This often leads to compromises in map accuracy, resulting in an inaccurate representation of forest status in certain regions of the world. This is particularly the case for tropical forests (both humid and dry) due to: high interference (cloud cover, cloud shadowing and terrain artifacts and atmospheric noises), seasonal limitations and inter-annual climate variability (varying spectral signature of vegetation cover), connectivity of forest (fragmented forest patches), presence of agricultural plantations and agroforestry, forests with low canopy density (dry deciduous forests), discrepancies between the specific features of particular forest ecosystems and those of globally-harmonized ones, among others [19,22,23,24,25,26,27,28,29,30,31].
One frequently debated global forest dataset is the Global Forest Cover of the Year 2020 [32] published by the Joint Research Centre (JRC). This map was generated with the intention of supporting the EUDR regulation, however, the use of the map is not mandatory, non-exclusive and it does not serve as a binding regulatory decision mechanism. This suggests that other global forest maps may be suitable to support the verification of deforestation-free production. For this reason, we perform a review of publicly available global Forest/Non-Forest (FNF) and Land Use/Land Cover (LULC) maps and their capability to match the EUDR requirements regarding mapping traits. Against this background, we firstly conduct a review of major geospatial data portals, relevant reports, and literature to produce an extended list of potential global reference maps based on remote sensing sensors. Secondly, we analyze the maps by applying criteria that follows EUDR guidelines, and maps’ reliability in accurately mapping forest cover.
While previous assessments on global FNF and LULC datasets have been conducted [29,33,34,35], they have not followed a systematic approach that aligns with the legal framework of the EUDR. Most published information on this subject is scientific news pinpointing particular and localized cases to illustrate a certain viewpoint. One study [36] closely addresses the suitability of global versus local FNF datasets as reference maps within the EUDR framework, but specifically assessing these datasets only for the case of Côte d’Ivoire.
The overall objective of this study is to identify, collect, describe and evaluate publicly available global FNF and LULC reference maps on their capability to match the EUDR requirements using two groups of relevant indicators, namely EUDR parameters (temporal proximity, spatial detail, forest cover definition standards) and technical parameters (reported accuracy metrics). We examine the identified FNF and LULC dataset based on the EUDR parameters criteria because these criteria (i) constitute the regulatory framework that must be followed by all, (ii) convey a clear and objective interpretation message, (iii) are independent from secondary factors such as the quality of input/observation data or the effectiveness of the chosen methodological approach, both of relevance for the generation of the forest reference maps. Additionally, we classify some of these datasets according to their bias toward overestimation or underestimation of forest cover, as determined by the interpretation of the reported accuracy results. Finally, we present a condensed short list of potential reference maps, and describe pros and cons of the individual maps by answering the following research questions:
1) Are the existing FNF and LULC datasets equally suitable as verification tools for EUDR compliance, given the specific requirements outlined in the EUDR regulation?
2) What specific traits hinder alignment of these datasets with EUDR requirements?
3) Do these datasets show a tendency to over-/underestimate forest7tree cover?
4) Are forest/tree cover estimates consistent across world regions, or do notable regional discrepancies exist?
2. Materials and Methods
2.1 Dataset Compilation and Dataset Information Extraction (Step 1)
We conduct a comprehensive search for publicly accessible global maps, which contain information on forest or tree cover derived from EO and remote sensing sensors, across major geospatial data portals, including Google Earth Engine, USGS Earth Explorer, NASA EarthData, ESA Copernicus Open Access Hub, Global Forest Watch, and FAO GeoNetwork, US Open Data Portal, UNEP Environmental Data Explorer, ArcGIS Living Atlas, UNdata, World bank Open Data. To supplement the data search, we inspect and cross-reference the datasets included in the Forest Resource Assessment report from 2020 [37], the digital public infrastructure for deforestation-related trade regulations [34], and perform a literature review using online search engines (Google Scholar, Scopus and Web of Science) to identify relevant scientific publications on available global FNF and LULC datasets [38,39,40,41]. We exclude datasets with a spatial resolution greater than 300 meters, as well as those of regional or local extent in the database compilation because the former lack sufficient spatial detail on tree and forest cover, while the latter do not represent global coverage. All datasets included in this analysis are identified and compiled as of November 2024.
After having finalized a comprehensive list of global map datasets, we collect specific information for each dataset by reviewing the respective accompanied literature references, tutorials, websites, reports or any other published document with relevance to a respective dataset. The retrieved information is used to understand the map features, conditions for its production, validation and adopted definition and parameters. These information are: a.) metadata (reference citation and published documents, b.) link to repositories, dataset short description, and dataset associated organization), c.) technical specifications (geographical coverage, spatial resolution, minimum mapping unit (MMU) of the map, temporal resolution, covered period, spectral range, indices/metrics, period of EOs), d.) land cover information (number of classes and short description of them), e.) map classification procedure (adopted methodology, description and number of training samples), f.) map validation procedure (validation method, number of validation samples, adopted validation dataset and its reference period, chosen accuracy metrics, reported accuracy values for overall accuracy, producer’s and user’s accuracy, values for measuring errors), g.) reported map limitations and h.) forest definition characteristics (general description and thresholds for height, MMU and canopy cover of forest class). When critical information is missing (i.e., parameters for defining forest/tree cover), we contact the referred map representative or corresponding author, in case of a peer-review publication, for clarification.
2.2 Indicator Nomination and Evaluation (Step 2)
To assess the suitability of the collected datasets as EUDR-reference maps, we extract details pertinent to EUDR requirements that characterize deforestation-free production and content on technical specification of forest mapping with EO systems. Therefore, we separate the indicators for assessing suitability into two categories: “EUDR Parameters” and “Technical Parameters”. The EUDR parameters comprise three indicators, namely i.) the time frame posed by the regulation (temporal proximity), ii.) the level of detail in the information provided by the map according to regulatory definitions (spatial detail), and iii.) the map parameters for defining forest. This builds on the rationale that each indicator can serve in case of the EUDR as criteria of assessing the reliability of a due diligence statement. The EUDR parameters are used in the first stage of selection process, as they directly determine whether a classified map is suitable or unsuitable according to the terminology of the EUDR. Further assessment of map suitability is provided by the Technical Parameters, which display the tendencies of the classified forest/tree cover class based on the reported accuracy values. We describe each particular indicator in the following sub-sections.
2.2.1. EUDR Parameters
Temporal Proximity
According to Art. 3, EUDR (a) EUDR-regulated commodities and products need to be “deforestation-free”, which is defined in Art. 2 (13) as not having caused deforestation or forest degradation after 31 December of 2020. This so-called “cut-off date”, is therefore the desired point in time to which a reference map should ideally refer to. While such a perfect image of the forest status at one day in time is not feasible, reference maps should display the forest status of the cut-off date as close as possible. On the contrary, reference maps that would refer to a period too far away from the cutoff date, e.g., five years, exhibit the risk that the information provided is essentially outdated and therefore not accurately reflect the 2020 forest cover status. The latter can introduce biases in the detection of deforestation according to the cut-off date in 2020 as specified by the regulation. Moreover, remote sensing-based maps may not accurately detect young forest patches. For example, a period of 4.2 to 7.4 years is required before saplings can be detected as forest in EO-based map [42]. This is in line with the Food and Agriculture Organization of the United Nations (FAO) [37] which describes that “forest areas can be temporarily unstocked due to clear-cutting as part of a forest management practice or natural disasters, and which are expected to regenerate within 5 years.”
For these reasons, we determine a threshold of ±5 years from 2020 to evaluate the ability of a global map to meet the temporal proximity indicator. In the context of EUDR, the ±5 years from 2020 enables us to identify possible land use transitions over time. If a map from 2015 classifies an area as agricultural land, it is very likely that this area continues to exhibit agricultural characteristics, as the spectral signature and canopy height of trees in a naturally regenerating or planted young forest may not yet have sufficiently developed to be detected as a forest in 2020. Similarly, an area classified as forest in 2025 is unlikely to have originated from a non-forest state in 2020, as the ecological processes required for the development of a late-successional forest typically exceed a five-year timeframe. Moreover, a ±5 years period may limit the inclusion of areas under shifting cultivation, that have not yet been converted to agricultural production, into a forest class.
EUDR-conform Forest Definition
A second indicator describes how the forest definition utilized by a reference map is in conformity to the forest definition stipulated by the EUDR. The latter one defines forest, according to the FAO [37] with forest defined as “land spanning more than 0.5 hectares with trees higher than 5 metres and canopy cover of more than 10%, or trees able to reach those thresholds in situ, excluding land that is predominantly under agricultural or urban land use”. Considering these parameters, we collect details on the adopted forest definition for each of the identified global maps: tree height, MMU of forest class and canopy cover density, and general description of forest/tree cover class. In cases information of these parameters is not provided, we contact the map developers directly to inquire about the missing information. Unless otherwise specified, we assume that the MMU refers to the pixel size, that is, the squared spatial resolution. For example, a map with a spatial resolution of 30 meters corresponds to a MMU of 0.09 hectares. The information on MMU is critical to assess map conformity with the EUDR forest definition, as the thresholds used to classify tree-covered areas as “forest” or another tree-based vegetation class contributes to mismatches and biases when verifying deforestation-free production [43,44,45,46,47,48,49].
Spatial Resolution
The third indicator refers to the level of detail that a certain global reference map is able to convey. Such kind of information is commonly referred to by the spatial resolution in remote sensing-based maps as it describes the real-world area covered by a single pixel-image information. As the EUDR applies the FAO’s definition of “forest” with land spanning more than 0,5 hectares (see Art. 2 (4)), the required MMU for a reference map is 0.5 ha, which sets the smallest unit that needs to be distinctly mapped and monitored for forest/tree cover classified areas. When a certain reference layer displays information in a single pixel equivalent to an area larger than the MMU requirement, verification of deforestation violation becomes complicated. For example, in reference maps with spatial resolution coarser than approximately 70 meters, a forest patch or agricultural land of 0.5 hectares would be aggregated onto neighboring landscape in order to form a single pixel value, passing undetected by the data [50]. Additionally, for better representation of vegetation changes and forest disturbances, through optical satellite sensor data such as available by Landsat, a resolution of 30 meters or finer is preferred [51], particularly in heterogenous landscapes [51]. Hence, we set a threshold of maximum spatial resolution of 30 meters. Table 1 summarizes the thresholds (range or limit) applied in each indicator within the EUDR Metrics group, to distinguish potentially suitable from unsuitable maps.
2.2.2. Technical Parameters
Complementary to the EUDR parameters, we review relevant technical descriptions and statistics to the assessment of map uncertainties and their potential implications for detecting true deforestation-free production through global forest/tree cover datasets. Among other characteristics, the reported map accuracy statistics, such as overall accuracy, producer’s and user’s accuracy, and mean bias errors, correspond to technical specifications of the datasets which allows to assess map quality. Thus, we use the reported map accuracy statistics as further assessment indicator and because they represent a quantifiable metric that can be directly related to EUDR-relevant compliance measures. Moreover, accuracy assessment and its metrics are standard procedures in map classification and are commonly provided by the map developers [52,53]. The other elements of the technical description are used as supporting information for a qualitative assessment, when applicable.
Map Accuracy Metrics
Accuracy assessments are essential for evaluating the precision of maps developed through EO tools and remote sensing sensors. One of the most commonly used metrics is the confusion matrix [53], which quantifies classification correctness and errors based on a set of validation sample points. This approach provides both overall accuracy (OA) values and class-specific analyses, often measured through producer’s accuracy (PA) and user’s accuracy (UA). These two metrics assess the truthfulness of classified samples from different perspectives: the user’s (actual landscape) and the producer’s (mapped landscape). Accordingly, we compute the ratio between PA and UA on forest/tree cover class to better represent the implications of PA and UA values for a considered map, and to understand potential systematic biases. Although, overall accuracy is the most commonly used metric for map validation, it is not the optimal measure for assessing map suitability in the context of the EUDR. This is because overall accuracy reflects the proportion of correctly classified samples across all existing classes in a certain map, which does not directly address the specific accuracy of the forest/tree cover class. In this context, the accuracy and precision of the forest/tree cover classification is rather the appropriate metric to assess the veracity of the forest/tree cover in the map of consideration. Therefore, we focus on the producer’s and user’s accuracy as technical indicators for the purpose of our assessment.
Maps with a certain number of land cover or land use classes are typically assessed for their accuracy using OA, PA, and UA. On the contrary, the accuracy of maps representing forest heights is commonly evaluated using metrics such as root mean square error (RMSE), mean absolute error (MAE), and mean bias error (MBE). These metrics derive from comparison between the classified map and a reference canopy height dataset, such as the Relative height at the 95th percentile (RH95), from the Global Ecosystem Dynamics Investigation (GEDI) Level-2A products [54]. In case of datasets referring to forest heights, the error metrics provide significant insights on the magnitude of differences between predicted/modeled values and (remotely sensed) observed ones, represented by RMSE and MAE, as well as the direction of these difference, known as MBE. The RMSE and MAE metrics partially reveals critical inaccuracies of the map, while MBE points out map error tendencies. MBE is more effective than RMSE and MAE in describing frequently occurring errors for a certain map, as it not only quantifies the errors but also indicates their direction (i.e., tendency). Table 2 summarizes information on the accuracy metrics considered for the technical assessment of identified global map products.
2.3 Exclusion of unsuitable datasets (Filtered Datasets I)—Step 2
The first selection criteria aim to identify those global reference datasets that comply with EUDR terminology based on two of the aforementioned metrics (see Figure 1). We choose two out of the described three EUDR metrics due to incompleteness of the reported forest definition parameter in some of the reviewed maps. With this approach, we seek to ensure an unbiased exclusion procedure. Subsequently, we filter out datasets that do not meet the thresholds for temporal proximity or spatial resolution as described in Section 2.3.1. These two indicators are the most commonly retrieved information across all datasets, while information on “forest definition” is not always consistently reported.
2.4 Removing Redundancies (Filtered Datasets II = Shortlisted Datasets)—Step 3
Based on the outcomes of the first selection, we apply a second selection criteria by reviewing further map characteristics. We review the initial list of maps (filtered datasets I) and exclude those already incorporated into the most recently listed dataset to avoid redundancies. Furthermore, we apply other exclusion criteria, such as condensing multiple year information into a single layer, refer to an outdated dataset according to the “temporal proximity” indicator, or do not provide a forest status layer but rather information on forest gains and losses. Based on this step, we compile a concise list of selected datasets that meet our inclusion criteria, hereafter referred to as “shortlisted datasets”.
2.5 Forest Extent Area Comparison (Map Variability)—Step 3
As a next step, we compare the shortlisted datasets with additional forest information concerning the size of the mapped forest area and conduct assessments on a per-continent basis. This assessment involves comparing shortlisted maps with one another, as well as against an additional and independent dataset. For this purpose, we rely on continental forest cover information reported for year 2020 by the forest resources assessments report (FRA) of FAO, referring to a sample-based approach of forest estimates reported at country level by national authorities [38]. Hence, we compare forest area estimates (in thousands of hectares) from the shortlisted datasets by counting the number of pixels for forest cover and scaling that to the respective area size.
3. Results
3.1 Complied Datasets
We identify in total 21 global datasets, that either are referring to FNF (N=11) or LULC (N=10) maps, spanning from 1992 to 2024 and with spatial resolutions of 300, 100, 30, 25, 10, and 1 meter (Table 3), respectively. The implemented methods for the creation of these maps include a range of Machine Learning algorithms (random forest, unsupervised classification, regression tree, continuous change detection, pixel-object-knowledge, and different decision tree model algorithms), deep learning models (convolutional neural network), and composite mapping techniques. Optical Multispectral sensors (MSS, e.g., Sentinel-2) are the most frequently applied type of data sources for global forest/tree cover and land cover maps, followed by Light Detection and Ranging (LiDAR, e.g., GEDI) and Synthetic Aperture Radar (SAR, e.g., Sentinel-1) instruments.
3.2. First Selection Criteria (Step 2)
Based on the temporal proximity to the “cut-off-date” in 2020 and adequate spatial resolution (EUDR Metrics), 6 global forest datasets are considered not suitable as reference maps for assessing deforestation-free compliance according to the EUDR. These maps represent information on forest cover older than 5 years prior to the required cut-off date, and further have a spatial resolution coarser than 30 meters. From the remaining 15 datasets only 2 (JRC GFC v2 and PALSAR-2-FNF) fully agree with all the adopted parameters for forest definition according to EUDR, while the other datasets either agree on at least one forest definition parameter or not fully report how forest cover is defined in their classification scheme (Figure 2). Among the forest definition parameters, tree height most commonly aligns with the standards adopted by the EUDR, as many datasets define a minimum tree height of 5 meters for forested areas. In conjunction with that, except for 5, all datasets, explicitly report the inclusion of non-forest tree cover classes (such as agroforestry, crop plantations, woodlands or savannas) into their forest or tree cover classification, which is in accordance to the EUDR’s definition of non-forest tree cover (see also: Table 3).
Nearly all datasets apply a randomly stratified validation approach based on selected thematic class groups. Some maps (Dynamic World, GFW/Hansen Map) make further distinction of strata per biome. Others use additional landscape information such as Köppen climate groups (GLC-FCS30D), geographic sub-regions (CHM-1m), or land ratio proportions (Forest Extent GLAD) for stratification. For most datasets, the reference validation sample collection derives independently through visual interpretation of very high-resolution satellite image. These images have a resolution finer than that of the corresponding map and are labeled by experts or trained interpreters. In fewer cases, reference samples are obtained from detailed third-party datasets, especially for the canopy height datasets (GEDI-height, Forest Height-GLAD, CHM-1m, ETH, GFCC30TCC-v4). The temporal coverage of the validation samples aligns with that of the created map. However, particular datasets include data from different years (Globcover, ESA WC, CGLS-LC100-v3, Forest Height-GLAD) or, in some cases, contain an older dataset of high quality (FROM-GLC10, Dynamic World, JRC GFC v2). In some instances, the sampling points consists of not only information of the corresponding class (thematic-label), but also include an attribute representing the robustness of the judgment of the expert into “high confidence/certain” or “low confidence/uncertain” and the homogeneous level of a certain point or validation unit.
Regarding the accuracy metrics, we evaluate the filtered 15 datasets (step 2) against their reported accuracy ranges, although not all datasets stated their values. The reported overall accuracies for forest status products range from 73.8% (Dynamic World) to 97.2% (Forest Extent-GLAD), which is typical for global datasets, where the minimum required accuracy is usually 70% (Table 4). Two of the FNF datasets, GEDI-Height (87.8%) and Forest Extent-GLAD (97.2%) reach the highest overall accuracies of all datasets (Table 4).
A PA/UA ratio above 1 suggests a tendency to incorrectly classify non-forest areas as forest cover (false positives), which could result in non-compliant production areas according to the EUDR (Figure 3). Conversely, a ratio below 1 indicates that the dataset favors missing true deforestation (false negatives). For 9 out of 11 datasets, the ratio of PA/UA is above one (Figure 4). Three datasets, FROM-GLC10, Forest Extent GLAD and GFW/Hansen Map Forest Loss (L), show PA/UA ratios very close to one, suggesting balanced commission and omission errors.
When considering exclusively tree and forest canopy height map products (Forest height-GLAD ARD, ETH and GFCC30TCC-v4), MBE values are negative for ETH and GFCC30TCC-v4, suggesting that the datasets have a tendency to underestimate canopy height by a reported average of 1,8m and 6%, respectively (Table 4, Figure 3). Although, the Forest height-GLAD ARD does not report MBE, it provides information on the magnitude of errors between predicted values and reference validation datasets, indicating that predicted canopy heights are often miscalculated by about 4,76m.
3.3 Second Selection Criteria (Step 3)
The second selection criterion filters out redundant datasets (marked with a “R” in Table 3) and particularly maps with EUDR-contextual constraints, such as the absence of forest status information (Table 3). Following the second filtering procedure (N=8), eight datasets are shortlisted for further analysis (JRC GFC v2, ESRI-10m, Dynamic World, GLC-FCS30D, FROM-GLC10, Forest Extent-GLAD, PALSAR-2 FNF v2.0.0, ETH). Furthermore, we compare the forest area, in 1.000 hectares, mapped by each shortlisted dataset with the reported forest area of FAO FRA 2020 [37] for selected world regions. The mapped forest area estimates are shown in Figure 5 categorized by region/continent. Shortlisted datasets consistently overestimate forest areas when compared to their counterparts as reported by FAO FRA. This is particularly visible in Central America and Caribbean regions, North America and Europe (excluding Russian federation), deviating on average by +49%, +56% and +86%, from the reported FAO FRA data in 2020, respectively. In case of South America, the shortlisted datasets exhibit greater consistency with FAO FRA, with significant discrepancies observed for JRC GFC v2 and ETH.
A notable case is the lower (-38%) forest area mapped by FROM-GLC10 in Africa compared to the FAO reference (Figure 5). Moreover, Dynamic World consistently exhibits lower forest/tree cover compared to the other datasets, including FAO FRA estimates. The datasets with the highest estimation of forest area on average and for all regions are ETH followed by PALSAR-2 FNF. These datasets belong to the FNF type of maps.
Figure 6 presents the summary of the eight shortlisted datasets in comparison to the chosen EUDR criteria and accuracy metrics, with additional information on whether non-forest tree-based systems are included in the considered forest cover information.
4. Discussion
The findings of this study suggest several key implications for the use of global FNF and LULC datasets in deforestation monitoring within the EUDR context, which are discussed in detail below.
4.1 Spatial detail and temporal proximity
The spatial resolution and the classification year of the map impact the level of spatial variation contained in a single pixel and influences the applicability of a map as reference for compliance checks under the EUDR regulation. Following this rationale, a pixel that is detailed enough to display small features in a landscape is thus more suitable to represent for example small-scale farming systems such as coffee or cacao, or heterogeneous mosaic landscapes common for agroforestry [75]. However, the compiled global datasets range from 10 to 30 meters resolution with the exception of CHM which has 1-meter spatial resolution. Therefore, a cropland plot with an area below the reported pixel size (e.g., 0.09 hectares, for a 30m spatial resolution) would be aggregated to the neighboring dominant landscape features to form a single pixel value. If the dominant landscape is a forested area, the small agricultural plot may be assigned to the forest class, even though in reality it represents a non-forest class, leading to false conclusions of non-compliance of deforestation-free production. This can increase the error of smallholder farming plots misidentification. For example, in case of coffee, one of the seven EUDR commodities, about 60% of total global production originates from plots smaller than 5 hectares [31]. Conversely, small-scale tree cover or forest cover losses may go undetected, as demonstrated by a study in the Mato Grosso region of Brazil, which identified more deforestation using a product with 5-meter spatial resolution compared to one with a coarser resolution of 6.5 hectares [50].
Another advantage of finer scaled datasets is the expected better representation of heterogenous landscapes, such as characterized by mixed farming plots of multi-cropping or agroforestry systems, shrub-grass-tree mixed landscapes or even the detection of small changes within a forest patch. A global cross-map comparison concluded that locations with more homogeneous characteristics typically exhibited higher overall accuracy, compared to areas where not all pixels within a block belong to the same class [35]. However, higher spatial resolution is not a definitive determinant of precision in capturing smaller features, as the accuracy of mapping classifications depends on quality, representativity and uniformity of the reference (e.g., training) data [35]. Furthermore, the spatial resolution and map capability to detect deforestation, particularly forest degradation is a trade-off between the wall-to-wall coverage and cost-time efficiency of monitoring over large areas, but reduces the ability to detect smaller changes and fragments [76]. Finally, the EUDR regulation lacks explicit guidance regarding the MMU for detecting forest change processes such as deforestation and forest degradation. This omission adds to the ambiguity surrounding the required spatial resolution for compliance monitoring, particularly in relation to whether the 0.5-hectare MMU defined for forest classification should also be applied to change detection.
The threshold for the temporal proximity metric is set by the requirements of the regulation, even though dynamics of natural ecosystems may not follow such a fixed “cut-off-date”. From the legality point of view of the regulation, a dataset older than the 2020 or 2021 may not necessarily represent an accurate status of forest around the cut-off date. Nevertheless, a global map dataset that is 5 years older or newer than the 2020 reference year, may still serve as good indicator for possible land use transitions. On the one hand, the likelihood that non-forest areas mapped in 2015 still exhibit properties of non-forest areas in 2020 is high, as forests do not usually regrow to a mature stage within this short period of time. On the other hand, naturally regenerating (young) forest stands may have been incorrectly classified as forest cover in 2015, or the regeneration process may have started at a later point in time, both resulting in a misclassification of forest cover in 2020 as non-forest. The latter scenario can implicate in missing true deforestation pixels (false negatives), while the former may prevent false allegation of regulation violation (false positives). A similar logic applies to maps created for 2025, where identifying mature forests in 2025 can provide better insights into the 2020 classification, helping determine whether an area was truly non-forest or a young regenerating forest in 2020.
Another point related to temporal proximity concerns the harvesting of wood as part of mapping forest degradation. Harvesting of wood can causes structural changes to forest cover and is considered as forest degradation under the EUDR. This activity occurs within a specific timeframe, typically over hours or days. Excepting the “forest disturbances alert” type of datasets [76] and other few exceptions, most static datasets of FNF and LULC represent the land use/cover status of a single year based on monthly satellite imagery, which poses threats to precise degradation detection. Consequentially the time in which degradation can be observed through remote sensing could be reported later than the respective DDS, permitting certain wood products to be mistakenly labeled as “deforestation-free” production. The compiled datasets in this study does not include “forest disturbances alert” datasets as we primarily focus on the tree cover or forest cover and deforestation.
4.2 Physical Thresholds Applied in Forest Definition
Of the selected datasets, only JRC GFC v2 and PALSAR-2 FNF v2.0.0 fully meet all three EUDR forest definition parameters, while the others align with at least one parameter, often forest height. In most cases, global datasets classify vegetation shorter than 5 or 3 meters as low vegetation such as shrubs and grasslands, excluding it from the “forest/tree cover” class. Vegetation taller than these thresholds is usually classified as “forest/tree cover”, with heights above 10 meters associated with tall trees. Among forest datasets, those generated using LiDAR technology offer tree cover maps with heights starting from zero, as LiDAR captures three-dimensional information on the shape of surface features [69]. This allows users to define specific height thresholds for “forest/tree cover” classification.
Regarding canopy cover, some datasets distinguish between dense/close and open canopies, with threshold set at values above 40% [58] or 70% of the surface [77] referring to dense canopies, and below the respective thresholds indicating open canopies. However, most global datasets adopt a more general threshold of 10% or 15% when defining forest/tree cover, with tree cover canopy below 10% typically classified as “Other wooded land”. The MMU parameter further defines the minimum area of tree cover required to classify an area as forest. Below a certain threshold, trees may be too sparse to meet the forest classification criteria, which is particularly problematic for dryland forests [78].
Major international environmental and forestry organizations commonly adopt a minimum tree height of 5 meters, a canopy cover threshold of 10%, and a minimum forest area of 0.5 hectares [43], similar to the FAO and corresponding to EUDR adopted definitions. However, these parameters do not always align with national standards. A comprehensive list of forest definition parameters available for several tropical countries reveals a range of thresholds, including minimum tree heights from 2 to 5 meters, minimum forest areas of 0.05 to 1 hectare, and canopy cover percentages between 15% and 30% [44]. In Germany, the parameter for canopy cover can be as high as 50% [45], a study in the flatlands of Ukraine identified the optimum threshold as 40% [46], while in Indonesia, it may reach up to 60% for certain regions [47]. These variations illustrate the discrepancies in forest classification standards across different regions and the EUDR defined parameters. Therefore, not only global datasets may disagree with the adopted parameters of forest definition by the EUDR, but also these parameters may not match certain national standards or regional guidelines. Taking the example of Indonesia, the minimum canopy cover density for a tree covered area to be classified as forest is 30%. The EUDR regulation defines forest as tree covered areas with a minimum canopy cover of 10%, which introduce uncertainties for locations with canopy cover between 10% and 30% due to mismatches between the applied thresholds of forest definition. Mismatches in any of the three forest definition parameters increase the uncertainties in verifying deforestation-free production using global generalized datasets. This likely contributes to the significant discrepancies in global forest area estimates derived from these datasets and national/regional forest estimates which is further discussed in the next section.
Moreover, [43] argued that these types of structural measures may be more relevant to ground-based inventories and not necessarily remote sensing surveys as they may (1) prevent the identification of real deforestation because an area, after considerable tree loss, is below an artificially set threshold, and (2) be unable to capture natural forest regeneration or early stages of restored forests that do not yet satisfy certain forest definition.
Beyond the structural measures, another frequently occurring issue is whether a forest assessment, either remotely sensed or sample-based approach, actually discriminate natural forest cover from planted forest and tree or agricultural plantations, thus dissociating “land use” from “land cover” [43]. A study [28] estimated that globally more than 43% of agricultural land is within agroforestry systems with 10% tree cover. Ensuring proper differentiation of tree cover classes is thus essential for accurately detecting deforestation.
4.3. Accuracy Metrics
Although the technical parameters are not applied in selection criteria (step 2 and step 3), they provide a further assessment of the shortlisted datasets. More precisely, the accuracy metrics give supporting evidence to the dataset quality in mapping forest and tree cover areas. All collected datasets, except the forest/tree canopy height products, provide a measure of overall accuracy. However, overall accuracies are not an appropriated way to particularly examine the forest or tree cover class precision. A better approach is to look at the producer’s and users’ accuracy of tree/forest class as a ratio. This ratio conveys the relationship between a measure of completeness in mapping forest or tree cover areas over the reliability in correctly classifying true forest areas.
With the exception of GEDI-Height and GFW/Hansen Map, all the shortlisted datasets display a PA/UA ratio above 1, which indicates that most maps potentially have a tendency to falsely identify areas of non-forest or non-tree cover as forest or tree cover (false positives, commission errors). In contrast, the 2 datasets with ratio lower than 1 suggest that potentially true forest or tree cover area is missing, thus they are inclined to omission errors. A key factor explaining this pattern is that these datasets aim to accurately map (individual) tree cover, rather than forest areas specifically, resulting in potential underestimation of tree cover and not inherently forest cover. This is because trees can also be present in non-forest environments, such as crop plantations, woodlands/ savannas, and shrublands. Evidence for this is found in the GEDI-height dataset, which features forest areas, with tree height ≥5 m, extending into savannas and open canopy forests in Africa [67].
Furthermore, FNF map datasets generally reveal a PA/UA ratio smaller or very close to 1 and higher OA. Binary maps like FNF implements a simpler classification scheme, reducing error potential and positively affecting OA. Conversely, multi-class land cover maps introduce more classes, increasing the likelihood of misclassifications due to, among other reasons, the difficulty of distinguishing similar classes. Hence, the PA/UA, for forest/tree cover class, and OA provide essential insights into systematic biases in the datasets and further reflect the map type under consideration (FNF or LULC). Nonetheless, the reported accuracy values may not truly represent the local and regional realities with diverse and complex landscapes, where typically land use classification experts expect higher commission than omission errors [35,52,79].
Another accuracy metric examined in this study is the MBE, which is applied to assess systematic bias in exclusively forest/tree canopy height datasets. While RMSE and MAE reveals the magnitude of the prediction errors observed in these datasets, they do not inform whether forest height estimations tend to overestimate or underestimate actual values. This distinction is important, as forest height is a key-parameter considered in forest definitions. MBE, therefore, suggest an indirect interpretation of these systematic biases and their implications in relation to the EUDR, as MBE relates to the tendency of a dataset in mapping higher (positive) or lower (negative) height than the validation data. Positive values imply that predicted heights exceed actual values, potentially classifying more tree covered areas as forest (overestimation). Contrarily, negative values indicate underestimation, possibly excluding certain tree covered areas due to lower height than the minimum threshold considered in the EUDR forest definition. Additionally, continuous forest canopy height datasets are less suitable to represent discrete multi-class land cover classifications than to function as datasets on vegetation structure and above ground biomass [67].
It is thus important to acknowledge common aspects that can influence the accuracy results, such as the quality of the employed reference datasets (including spatial resolution and geolocation errors) [80], the homogeneity of the landscape classes in question, the representativity of certain class (frequency of occurrence), the specific sampling strategy used for validation (e.g., stratified or area-weighted approaches), and independence of validation points [26,53].
4.4. Shortlisted Dataset Cross-Comparison on Forest Area
The three regions with the highest percentage average difference in forest estimations against the forest area statistics reported by the FAO FRA 2020 [37] are Central America and Caribbean, Europe and North America. Some of the commonly known issues in North America and Europe include the overestimation or underestimation of forest cover in the boreal and tundra ecotones and their transition zones [79], and the misclassification in low tree cover [78] and shrubland areas such as the Mediterranean region in Europe. The case of Europe is the most significant one, with the highest average differences shown. A plausible explanation for the observed pattern is the abundance of urban parks/forests, green spaces, and small tree-covered patches across Europe [20,46] in addition to differences in forest cover threshold definitions discussed in previous sections. The JRC GFC v2 dataset [79] reported persistent challenges in differentiating agricultural plantations and urban vegetation from forest cover in already present in its first version. These two land use types do not fall under the classification of forest according to EUDR, even though they contain trees. Urban green areas and urban tree parks are unlikely to conflict with EUDR regulation, as these areas are not expected to be sources of EUDR commodities. However, other tree-based land use systems, such as plantations, managed planted forests and agricultural plantations, may present conflicts with EUDR definitions. These classes are generally categorized as forest or tree cover in most global maps, without distinguishing whether they represent primary forests, secondary forests, plantations, or other sub-classes of tree-based land cover. This lack of differentiation contributes significantly to the discrepancy between FAO estimates and globally mapped areas.
South America is the region exhibiting the highest consistency between the shortlisted datasets and the reported FAO estimate. This region contains major dense forest areas primarily concentrated in the Amazon Basin, which facilitates the differentiation between forest and agricultural lands and certain plantations, often including clear edges and structural patterns such as oil palm plantations [21,78]. A paper [27] evaluated an index designed to measure the similarity of spatial patterns between two numerical raster maps at the pixel level. Their findings revealed that the Amazon Basin and Central Africa exhibited the highest similarity values among the regions analyzed globally. However, due to the systematic mapping of observed dense forest in this region the risk of misclassification of some agricultural plantations and agroforestry systems is quite high as most global FNF and LULC maps are often unable to capture such a fine scale information. Moreover, a large rate of misclassification of mixed landscapes and confusion between agriculture and natural landscapes is expected in intensively cultivated areas in South America [23]. Finally, transition zones between the Cerrado ecosystem and the rainforest in Brazil, may contribute to the map disagreements in the region with potential implications for EUDR, as Cerrado (commonly referred to as “other wooded land”) is not yet included in the regulation.
In the African region, frequently known issues are the proper identification of seasonally dry tropical forests due to related phenological seasonal effects [24,25], particularly in transition zones between deserts and tropical rain forest [26]. Other factors are correctly mapping areas of low tree cover density, degraded forest, small patches of forest, and forest edges [4,67,78], and the overlap between woodlands and forest areas based on the adopted forest definition [48]. A recent study in Côte d’Ivoire [36] highlighted inconsistencies between a national forest map and the JRC GFC first version map. Specifically, the JRC GFC first version map shows areas as forested, while the national map classifies the same areas as non-forest, resulting in an error of commission. A particular shortlisted dataset, FROM-GLC10 [66], considerably underestimates forest cover in Africa. The underlying causes for this particular pattern remain unclear and require further investigation. Nevertheless, most global forest cover maps tend to underestimate forest cover in low tree covered areas [78] and mapping of dry forest areas are particularly challenging with a tendency for omission errors [79].
Commonly challenging regions in the world for mapping forest cover include complex topographical areas (mountainous and hilly areas) that hinder the proper identification of forest cover due to terrain effects such as shading of slopes from illumination effects [22], and forest edge zones adjacent to non-forest areas [26]. Moreover, binary maps such as FNF maps requires a subjective visual interpretation decision to be made on to which class a certain area/pixel belongs that not always correspond to the continuous features of landscapes (transition zones) in reality. Furthermore, hard thresholds on forest definition do not always correspond to the local physiographical and phenological conditions of natural areas around the world varying from region to region [49].
Two datasets consistently and significantly overestimated forest cover in all regions, namely, ETH [73] and PALSAR-2 FNF [70]. The dataset ETH reveals a tendency to overestimate canopy height in areas where the canopy is lower than 5 meters. As a result, many areas that do not originally belong to the forest class were incorrectly included as forest, possibly due to the overestimation of canopy height. PALSAR-2 FNF shows tendencies for misclassifications of forest areas in highly fragmented landscapes [46]. Although the forest estimates from pixel counts of classified maps shown in Figure 5 derive from existing maps, they do not represent official estimates of forest areas in the respective regions and they do not accurately represent the forest status of 2020. The purpose of comparing forest area estimates from sample-based approaches, such as those used by the FAO, with mapped forest areas is to highlight the differences in the methods used for estimating forest cover. This comparison helps to illustrate the diversity in global forest mapping techniques and their varying results. Additionally, FAO reported forest estimates may also contain data inconsistencies and aggregation of non-forest cover, e.g., rubber and Christmas tree plantations, into forest cover [43] which contributes to discrepancies in the reported forest areas [70].
The observed forest area differences are especially notable when comparing global forest/LULC datasets with national maps, like the case of Côte d’Ivoire [36]. However, national maps are not always publicly available, thus in some cases the use of global maps is the most viable solution for verifying evident cases of deforestation, functioning as first screening. Nonetheless, in numerous instances involving EUDR due diligence statements, the risk of deforestation or forest degradation can be reduced by collecting further detailed information about the conditions surrounding production along the chain of custody. Cross-checking different sources of information such as national and regional mapping, management plans, and other relevant information are key to demonstrate that production is in conformity to the requirements of the EUDR and thus are allowed to enter the EU market. Moreover, global static annual LULC or FNF maps fail to capture intra-annual dynamics, which can result in misclassification, particularly when seasonal variations are not adequately considered. In such cases, inter- and intra-annual time series analyses may provide more robust evidence for detecting deforestation or verifying its absence [81]. In addition, other types of maps may be more reliable in reducing classification errors. Commodity-specific maps [82,83,84] improve the identification of tree crops and plantations, thereby reducing false positives compared to current state-of-the-art global FNF and LULC maps. Meanwhile, change detection and disturbance monitoring products, such as near-real-time alert systems [85,86] can reduce false negatives by capturing subtle or short-term forest loss events at intra-annual temporal scale often missed in static classifications. Finally, maps are produced using various methods and data sources, resulting in differing outcomes. Integrating multiple sensors (optical, microwave, etc.) can provide complementary spectral characteristics of different satellite properties [17,78]. Some methodologies may be more robust than others, with training sampling data that are better structured, clustered and thus more representative in certain cases [18].
We acknowledge that our approach of estimating forest area (in thousands of hectares) by counting forest-classified pixels and scaling them by pixel size, may introduce quantification bias [87]. Additionally, FRA reports and remote sensing survey data are not directly comparable, as remote sensing data do not adhere to the same formal procedures as FRA reports, and each dataset is derived using distinct methodologies. Nevertheless, our objective in this case is not to obtain precise forest area estimates, but rather to understand the variability among estimates and identify the sources of dataset diversity.
5. Conclusions
The results of this research provide insights into a systematic assessment of global FNF and LULC maps suitability to the EUDR. We evaluate 21 maps based on two groups of criteria, namely EUDR-relevant parameters and technical parameters. The EUDR parameters describe the ability of a dataset to align with three critical properties of the regulation, serving as an initial filtering criterion for identifying suitable maps: (1) temporal proximity, (2) forest definition specifications and (3) level of spatial detail. The technical parameters work as complementary evaluation to provide detailed information on map error tendencies based on accuracy metrics.
After application of the second filtering criteria, utilized to avoid redundancies and data inconsistencies, we extract a concise list of 8 global FNF and LULC maps that are potentially suitable for checking deforestation-free production within the EUDR framework. Some datasets are better suited than others, but all eight datasets are viable options in assisting the EUDR regulation. Finally, we run a cross map comparison of mapped forest areas estimates from each dataset against the FAO forest reports area estimates for the year 2020.
The main results of the study suggest that:
- Very few global FNF and LULC maps fully match the EUDR forest definition parameters (tree height, MMU of forest cover and forest canopy cover), which could be one of the major sources of uncertainty when assessing EUDR compliance using EO products.
- Tree height emerges as the most widely accepted specification among the forest definition parameters.
- The majority of global LULC maps show tendencies to display forest overestimation (commission errors), by classifying areas of non-forest cover as forest cover.
- Canopy height products display a tendency to underestimate canopy heights (MBE) possibly excluding certain tree covered areas but not necessarily forest covered areas.
- In addition to the accuracy metrics assessment, many datasets map tree cover rather than forest cover, which can include non-forest areas with trees, thereby contributing to uncertainties.
- Discrepancies between forest area estimates from the datasets and the FAO estimate reveals the difficulty of choosing a single mapping approach.
- The regions with the highest overestimation of forest areas, compared to FAO estimates, include Central America and the Caribbean, Europe, and North America. The African region shows the greatest underestimation, while South America has more or less consistent estimates.
This study contributes to the understanding of the key considerations for selecting geospatial data to include in DDS or to verify deforestation-free production. A detailed understanding of these map specifications offers valuable insights into how well a map dataset complies with EUDR requirements, as well as the misclassification tendencies within these maps. Additionally, the regional assessment of forest area estimates provides further understanding of regional differences and commodity-specific issues.
The presented study supports decision-makers, national competent authorities, operators, and producers in selecting forest cover maps for deforestation-free risk assessments, due diligence statements, by evaluating their compliance with the EUDR. Each map displays certain capabilities and limitations, and all maps contain inherent errors. Some of these capabilities and limitations can be higher for some world regions than others and can be aggravated for some EUDR commodities (e.g., agroforestry coffee systems). Therefore, the most effective approach is to utilize multiple datasets preferably with varying map specifications, such as different level of spatial detail (spatial resolution) and those generated through different satellite sensors or methodologies. Nevertheless, very high-resolution maps may not be accessible everywhere due to their large storage requirements, high computational demands, and time-consuming nature. As a result, relying on globally available, open-source maps becomes a necessary alternative.
While this study is comprehensive and extensive, it does not cover all available mapping possibilities. Moreover, the use of geospatial reference information in EUDR-processes is optional. Nevertheless, the findings of this study can serve as a guideline when opting for the use of remotely sensed map products in EUDR related measures. Further research should focus on the analysis of specific cases and critical regions in order to obtain detailed and accurate information on the sources of uncertainty regionally, and to better understand other related factors that lead to either false positive or false negatives.
Author Contributions
Conceptualization, J.F.B., M.K. and M.L.; methodology, J.F.B., M.K. and M.L; data curation, formal analysis, visualization and writing—original draft preparation, J.F.B.; project administration, and funding acquisition, M.K. and M.L.; writing—review and editing, J.F.B., M.K. and M.L. All authors have read and agreed to the published version of the manuscript.
Funding
This research was funded by German Federal Ministry for Economic Cooperation and Development (BMZ) based on a resolution of the German Bundestag, BMZ Project ID: “G34 E5030-0061/006”.
Data Availability Statement
The detailed data profiles for each of the shortlisted datasets are available at “https://www.openagrar.de/receive/openagrar_mods_00108745”.
Acknowledgments
We sincerely thank the BMZ for funding the research project. We are also grateful to the corresponding authors of the datasets assessed in this study for their valuable clarifications regarding their data. Lastly, we appreciate the internal feedback and minor reviews conducted within the Thünen Institute, which contributed to improving the quality of this paper. During the preparation of this manuscript, the main author used CITAVI, version 7 for the purposes of referenced management.
Conflicts of Interest
Declare conflicts of interest or state “The authors declare no conflicts of interest.”
Abbreviations
The following abbreviations are used in this manuscript:
| EUDR | EU Deforestation Regulation |
| EO | Earth Observation |
| FNF | Forest/Non-Forest |
| LULC | Land Use/Land Cover |
| ZDC | Zero Deforestation Commitments |
| EU | European Union |
| DDS | Due Diligence Statement |
| NCAs | National Competent Authorities |
| JRC | Joint Research Centre |
| MMU | Minimum mapping unit |
| FAO | Food and Agriculture Organization of the United Nations |
| OA | Overall accuracy |
| PA | Producer’s accuracy |
| UA | User’s accuracy |
| RMSE | Root mean square error |
| MAE | Mean absolute error |
| MBE | Mean bias error |
| RH95 | Relative height at the 95th percentile |
| GEDI | Global Ecosystem Dynamics Investigation |
| FRA | Forest resources assessments report |
| MSS | Optical multispectral sensors |
| LiDAR | Light Detection and Ranging |
| SAR | Synthetic Aperture Radar |
| RTM | Regression tree model |
| CM | Composite Map |
| RF | Random Forest |
| CCD | Continuous change detection |
| PB | Panchromatic band |
| POK | Pixel-Object-Knowledge |
| CNNs | Convolutional neural networks |
| ESA | European Space Agency |
| JRC | Joint Research Centre |
| IIASA | International Institute for Applied Systems Analysis |
| IO | Impact Observatory |
| WRI | World Resources Institute Google |
| CBAS | International Research Center of Big Data for Sustainable Development Goals |
| NGCC | National Geomatics Center of China |
| UMD-GLAD | Global Land Analysis and Discovery laboratory in the Department of Geographical Sciences at the University of Maryland USA |
| GFW | Global Forest Watch |
| JAXA | Japan Aerospace Exploration Agency |
| NASA | National Aeronautics and Space Administration |
References
- Raihan, A. A review on the integrative approach for economic valuation of forest ecosystem services. JESCAE 2023, 2, 1–18. [Google Scholar] [CrossRef]
- Bernhard, K.P.; Shapiro, A.C.; Hunt, C.A. Drivers of tropical deforestation: a global review of methodological approaches and analytical scales. Biodivers Conserv 2024, 33, 1–29. [Google Scholar] [CrossRef]
- FAO and UNEP. The State of the World’s Forests 2020; FAO and UNEP, 2020.
- Wingate, V.R.; Akinyemi, F.O.; Iheaturu, C.J.; Ifejika Speranza, C. A Remote Sensing-Based Inventory of West Africa Tropical Forest Patches: A Basis for Enhancing Their Conservation and Sustainable Use. Remote Sensing 2022, 14, 6251. [Google Scholar] [CrossRef]
- Curtis, P.G.; Slay, C.M.; Harris, N.L.; Tyukavina, A.; Hansen, M.C. Classifying drivers of global forest loss. Science (New York, N.Y.) 2018, 361, 1108–1111. [Google Scholar] [CrossRef] [PubMed]
- Pendrill, F.; Persson, U.M.; Godar, J.; Kastner, T.; Moran, D.; Schmidt, S.; Wood, R. Agricultural and forestry trade drives large share of tropical deforestation emissions. Global Environmental Change 2019, 56, 1–10. [Google Scholar] [CrossRef]
- Lambin, E.F.; Gibbs, H.K.; Heilmayr, R.; Carlson, K.M.; Fleck, L.C.; Garrett, R.D.; Le Polain de Waroux, Y.; McDermott, C.L.; McLaughlin, D.; Newton, P.; Nolte, C.; Pacheco, P.; Rausch, L.L.; Streck, C.; Thorlakson, T.; Walker, N.F. The role of supply-chain initiatives in reducing deforestation. Nature Clim Change 2018, 8, 109–116. [Google Scholar] [CrossRef]
- Partiti, E. Private Processes and Public Values: Disciplining Trade in Forest and Ecosystem Risk Commodities via Non-Financial Due Diligence. TEL 2022, 11, 141–172. [Google Scholar] [CrossRef]
- Bager, S.L.; Lambin, E.F. How do companies implement their zero-deforestation commitments. Journal of Cleaner Production 2022, 375, 134056. [Google Scholar] [CrossRef]
- Garrett, R.D.; Levy, S.; Carlson, K.M.; Gardner, T.A.; Godar, J.; Clapp, J.; Dauvergne, P.; Heilmayr, R.; Le Polain de Waroux, Y.; Ayre, B.; Barr, R.; Døvre, B.; Gibbs, H.K.; Hall, S.; Lake, S.; Milder, J.C.; Rausch, L.L.; Rivero, R.; Rueda, X.; Sarsfield, R.; Soares-Filho, B.; Villoria, N. Criteria for effective zero-deforestation commitments. Global Environmental Change 2019, 54, 135–147. [Google Scholar] [CrossRef]
- Haywood, C.; Henriot, C. Protecting Forests From Conversion: The Essential Role of Supply-Side National Laws. Front. For. Glob. Change, 2019, 2. [CrossRef]
- Schilling-Vacaflor, A.; Lenschow, A. Hardening foreign corporate accountability through mandatory due diligence in the European Union? New trends and persisting challenges. Regulation & Governance 2023, 17, 677–693. [Google Scholar] [CrossRef]
- Corona, P.; Di Stefano, V.; Mariano, A. Knowledge gaps and research opportunities in the light of the European Union Regulation on deforestation-free products. Annals of Silvicultural Research, 2023, 48(2), 87–89. [CrossRef]
- Hansen, M.C.; Potapov, P.V.; Moore, R.; Hancher, M.; Turubanova, S.A.; Tyukavina, A.; Thau, D.; Stehman, S.V.; Goetz, S.J.; Loveland, T.R.; Kommareddy, A.; Egorov, A.; Chini, L.; Justice, C.O.; Townshend, J.R.G. High-resolution global maps of 21st-century forest cover change. Science (New York, N.Y.) 2013, 342, 850–853. [Google Scholar] [CrossRef] [PubMed]
- World Resources Institute. Global Forest Watch. Global Forest Watch Interactive Map: Washington, D.C., 2024. https://www.globalforestwatch.org/map/.
- Hansen, M.C.; Potapov, P.V.; Moore, R.; Hancher, M.; Turubanova, S.; Tyukavina, A.; Thau, D.; Stehman, S.V.; Goetz, S.J.; Loveland, T.R.; Kommareddy, A.; Egorov, A.; Chini, L.; Justice, C.O.; Townshend, J.R.G. Global Forest Change, Version 1.11: University of Maryland, Google Earth Engine, 2023. https://developers.google.com/earth-engine/datasets/catalog/UMD_hansen_global_forest_change_2023_v1_11.
- Hirschmugl, M.; Gallaun, H.; Dees, M.; Datta, P.; Deutscher, J.; Koutsias, N.; Schardt, M. Methods for Mapping Forest Disturbance and Degradation from Optical Earth Observation Data: a Review. Curr Forestry Rep 2017, 3, 32–45. [Google Scholar] [CrossRef]
- Venter, Z.S.; Sydenham, M.A.K. Continental-Scale Land Cover Mapping at 10 m Resolution Over Europe (ELC10). Remote Sensing 2021, 13, 2301. [Google Scholar] [CrossRef]
- Zhang, C.; Li, X. Land Use and Land Cover Mapping in the Era of Big Data. Land 2022, 11, 1692. [Google Scholar] [CrossRef]
- Ottosen, T.-B.; Petch, G.; Hanson, M.; Skjøth, C.A. Tree cover mapping based on Sentinel-2 images demonstrate high thematic accuracy in Europe. International journal of applied earth observation and geoinformation: ITC journal 2020, 84, 101947. [Google Scholar] [CrossRef] [PubMed]
- Giri, C.; Long, J. Land Cover Characterization and Mapping of South America for the Year 2010 Using Landsat 30 m Satellite Data. Remote Sensing 2014, 6, 9494–9510. [Google Scholar] [CrossRef]
- Sandmeier, S.; Itten, K.I. A physically-based model to correct atmospheric and illumination effects in optical satellite data of rugged terrain. IEEE Trans. Geosci. Remote Sensing 1997, 35, 708–717. [Google Scholar] [CrossRef]
- Clark, M.L.; Aide, T.M.; Grau, H.R.; Riner, G. A scalable approach to mapping annual land cover at 250 m using MODIS time series data: A case study in the Dry Chaco ecoregion of South America. Remote Sensing of Environment 2010, 114, 2816–2832. [Google Scholar] [CrossRef]
- Särkinen, T.; Iganci, J.R.V.; Linares-Palomino, R.; Simon, M.F.; Prado, D.E. Forgotten forests—issues and prospects in biome mapping using Seasonally Dry Tropical Forests as a case study. BMC ecology 2011, 11, 27. [Google Scholar] [CrossRef] [PubMed]
- Fensholt, R.; Horion, S.; Tagesson, T.; Ehammer, A.; Ivits, E.; Rasmussen, K. Global-scale mapping of changes in ecosystem functioning from earth observation-based trends in total and recurrent vegetation. Global Ecology and Biogeography 2015, 24, 1003–1017. [Google Scholar] [CrossRef]
- Li, Y.; Zhao, M.; Mildrexler, D.J.; Motesharrei, S.; Mu, Q.; Kalnay, E.; Zhao, F.; Li, S.; Wang, K. Potential and Actual impacts of deforestation and afforestation on land surface temperature. JGR Atmospheres, 2016, 121. [CrossRef]
- Hu, T.; Su, Y.; Xue, B.; Liu, J.; Zhao, X.; Fang, J.; Guo, Q. Mapping Global Forest Aboveground Biomass with Spaceborne LiDAR, Optical Imagery, and Forest Inventory Data. Remote Sensing 2016, 8, 565. [Google Scholar] [CrossRef]
- Zomer, R.J.; Neufeldt, H.; Xu, J.; Ahrends, A.; Bossio, D.; Trabucco, A.; van Noordwijk, M.; Wang, M. Global Tree Cover and Biomass Carbon on Agricultural Land: The contribution of agroforestry to global and national carbon budgets. Scientific reports 2016, 6, 29987. [Google Scholar] [CrossRef] [PubMed]
- Cunningham, D.; Cunningham, P.; Fagan, M.E. Identifying Biases in Global Tree Cover Products: A Case Study in Costa Rica. Forests 2019, 10, 853. [Google Scholar] [CrossRef]
- Rochmyaningsih, D. European deforestation rules are flawed, scientists argue. Science (New York, N.Y.) 2024, 385, 485. [Google Scholar] [CrossRef] [PubMed]
- Siles, P.; Cerdán, C.R.; Staver, C. Smallholder Coffee in the Global Economy—A Framework to Explore Transformation Alternatives of Traditional Agroforestry for Greater Economic, Ecological, and Livelihood Viability. Front. Sustain. Food Syst., 2022, 6. [CrossRef]
- Bourgoin, C.; Verhegghen, A.; Degreve, L.; Ameztoy, I.; Carboni, S.; Colditz, R.; Achard, F. Global map of forest cover 2020—version 2., 2024. [Dataset] PID: http://data.europa.eu/89h/e554d6fb-6340-45d5-9309-332337e5bc26.
- Linyucheva, A.; Kindlmann, P. A review of global land cover maps in terms of their potential use for habitat suitability modelling. EUROPEAN JOURNAL OF ENVIRONMENTAL SCIENCES 2021, 11, 46–61. [Google Scholar] [CrossRef]
- D’Annunzio, R., O’Brien, V., Arnell, A., Neeff, T., Fontanarosa, R., Valbuena Perez, P., Shapiro, A.C., Sanchez-Paus Díaz, A., Merle, C. Towards a digital public infrastructure for deforestation-related trade regulations: Rome, 2024.
- Xu, P.; Tsendbazar, N.-E.; Herold, M.; de Bruin, S.; Koopmans, M.; Birch, T.; Carter, S.; Fritz, S.; Lesiv, M.; Mazur, E.; Pickens, A.; Potapov, P.; Stolle, F.; Tyukavina, A.; van de Kerchove, R.; Zanaga, D. Comparative validation of recent 10 m-resolution global land cover maps. Remote Sensing of Environment 2024, 311, 114316. [Google Scholar] [CrossRef]
- Verhegghen, A., Orlowski, K., Dontenville, A., Reboud, V., Riano, C., Njeugeut, A., Kouame Koffi, G., Tillie, P., Rembold, F. and Achard, F. Use of national versus global land use maps to assess deforestation risk in the context of the EU Regulation on Deforestation-free products: case study from Côte d‘Ivoire, Publications Office of the European Union: Luxembourg, 2024.
- FAO. Global Forest Resources Assessment 2020; FAO, 2020.
- FAO. FRA 2020 Remote Sensing Survey; FAO Forestry Paper No. 186: Rome, 2022.
- Galiatsatos, N.; Donoghue, D.N.; Watt, P.; Bholanath, P.; Pickering, J.; Hansen, M.C.; Mahmood, A.R. An Assessment of Global Forest Change Datasets for National Forest Monitoring and Reporting. Remote Sensing 2020, 12, 1790. [Google Scholar] [CrossRef]
- Sannier, C.; McRoberts, R.E.; Fichet, L.-V. Suitability of Global Forest Change data to report forest cover estimates at national level in Gabon. Remote Sensing of Environment 2016, 173, 326–338. [Google Scholar] [CrossRef]
- Nabil, M.; Zhang, M.; Wu, B.; Bofana, J.; Elnashar, A. Constructing a 30m African Cropland Layer for 2016 by Integrating Multiple Remote sensing, crowdsourced, and Auxiliary Datasets. Big Earth Data 2022, 6, 54–76. [Google Scholar] [CrossRef]
- Guo, J.; Gong, P. The Potential of Spectral Indices in Detecting Various Stages of Afforestation over the Loess Plateau Region of China. Remote Sensing 2018, 10, 1492. [Google Scholar] [CrossRef]
- Chazdon, R.L.; Brancalion, P.H.S.; Laestadius, L.; Bennett-Curry, A.; Buckingham, K.; Kumar, C.; Moll-Rocek, J.; Vieira, I.C.G.; Wilson, S.J. When is a forest a forest? Forest concepts and definitions in the era of forest and landscape restoration. Ambio, 2016, 45, 538–550. [CrossRef]
- Sasaki, N.; Putz, F.E. Critical need for new definitions of “forest” and “forest degradation” in global climate change agreements. Conservation Letters 2009, 2, 226–232. [Google Scholar] [CrossRef]
- BMEL. Aufnahmeanweisung für die vierte Bundeswalinventur (BWI 2022) (2021-2022)., 2021.
- Myroniuk, V.; Bell, D.M.; Gregory, M.J.; Vasylyshyn, R.; Bilous, A. Uncovering forest dynamics using historical forest inventory data and Landsat time series. Forest Ecology and Management 2022, 513, 120184. [Google Scholar] [CrossRef]
- Romijn, E.; Ainembabazi, J.H.; Wijaya, A.; Herold, M.; Angelsen, A.; Verchot, L.; Murdiyarso, D. Exploring different forest definitions and their impact on developing REDD+ reference emission levels: A case study for Indonesia. Environmental Science & Policy 2013, 33, 246–259. [Google Scholar] [CrossRef]
- Næsset, E.; Ørka, H.O.; Solberg, S.; Bollandsås, O.M.; Hansen, E.H.; Mauya, E.; Zahabu, E.; Malimbwi, R.; Chamuya, N.; Olsson, H.; Gobakken, T. Mapping and estimating forest area and aboveground biomass in miombo woodlands in Tanzania using data from airborne laser scanning, TanDEM-X, RapidEye, and global forest maps: A comparison of estimated precision. Remote Sensing of Environment 2016, 175, 282–300. [Google Scholar] [CrossRef]
- Lwin, K.K.; Ota, T.; Shimizu, K.; Mizoue, N. Assessing the Importance of Tree Cover Threshold for Forest Cover Mapping Derived from Global Forest Cover in Myanmar. Forests 2019, 10, 1062. [Google Scholar] [CrossRef]
- Wagner, F.H.; Dalagnol, R.; Silva-Junior, C.H.L.; Carter, G.; Ritz, A.L.; Hirye, M.C.M.; Ometto, J.P.H.B.; Saatchi, S. Mapping Tropical Forest Cover and Deforestation with Planet NICFI Satellite Images and Deep Learning in Mato Grosso State (Brazil) from 2015 to 2021. Remote Sensing 2023, 15, 521. [Google Scholar] [CrossRef]
- Petris, S. de; Sarvia, F.; Borgogno-Mondino, E. SENTINEL-1 DATA TIME SERIES TO SUPPORT FOREST POLICE IN HARVESTINGS DETECTION. ISPRS Ann. Photogramm. Remote Sens. Spatial Inf. Sci., 2022, V-3-2022, 225–232. [CrossRef]
- Ferrer Velasco, R.; Lippe, M.; Tamayo, F.; Mfuni, T.; Sales-Come, R.; Mangabat, C.; Schneider, T.; Günter, S. Towards accurate mapping of forest in tropical landscapes: A comparison of datasets on how forest transition matters. Remote Sensing of Environment 2022, 274, 112997. [Google Scholar] [CrossRef]
- Olofsson, P.; Foody, G.M.; Herold, M.; Stehman, S.V.; Woodcock, C.E.; Wulder, M.A. Good practices for estimating area and assessing accuracy of land change. Remote Sensing of Environment 2014, 148, 42–57. [Google Scholar] [CrossRef]
- Dubayah, R.; Hofton, M.; Blair, J.; Armston, J.; Tang, H.; Luthcke, S. GEDI L2A Elevation and Height Metrics Data Global Footprint Level V001, 2020.
- ESA. Land Cover CCI Product User Guide Version 2. Tech. Rep, 2017. maps.elie.ucl.ac.be/CCI/viewer/download/ESACCI-LC-Ph2-PUGv2_2.0.pdf.
- Defourny, P., Lamarche, Celine, Marrissiaux, Quentin, Brockman, Carsten, Boettcher, Martin, Kirches, Grit. Product User Guide and Specification: ICDR Land Cover 2016–2019: UCLouvain, 2019. https://datastore.copernicus-climate.eu/documents/satellite-land-cover/D3.3.12-v1.3_PUGS_ICDR_LC_v2.1.x_PRODUCTS_v1.3.pdf.
- Lesiv, M.; Schepaschenko, D.; Buchhorn, M.; See, L.; Dürauer, M.; Georgieva, I.; Jung, M.; Hofhansl, F.; Schulze, K.; Bilous, A.; Blyshchyk, V.; Mukhortova, L.; Brenes, C.L.M.; Krivobokov, L.; Ntie, S.; Tsogt, K.; Pietsch, S.A.; Tikhonova, E.; Kim, M.; Di Fulvio, F.; Su, Y.-F.; Zadorozhniuk, R.; Sirbu, F.S.; Panging, K.; Bilous, S.; Kovalevskii, S.B.; Kraxner, F.; Rabia, A.H.; Vasylyshyn, R.; Ahmed, R.; Diachuk, P.; Kovalevskyi, S.S.; Bungnamei, K.; Bordoloi, K.; Churilov, A.; Vasylyshyn, O.; Sahariah, D.; Tertyshnyi, A.P.; Saikia, A.; Malek, Ž.; Singha, K.; Feshchenko, R.; Prestele, R.; Akhtar, I.U.H.; Sharma, K.; Domashovets, G.; Spawn-Lee, S.A.; Blyshchyk, O.; Slyva, O.; Ilkiv, M.; Melnyk, O.; Sliusarchuk, V.; Karpuk, A.; Terentiev, A.; Bilous, V.; Blyshchyk, K.; Bilous, M.; Bogovyk, N.; Blyshchyk, I.; Bartalev, S.; Yatskov, M.; Smets, B.; Visconti, P.; Mccallum, I.; Obersteiner, M.; Fritz, S. Global forest management data for 2015 at a 100 m resolution. Scientific data 2022, 9, 199. [Google Scholar] [CrossRef] [PubMed]
- Arino, O.; Ramos Perez, J.J.; Kalogirou, V.; Bontemps, S.; Defourny, P.; van Bogaert, E. Global Land Cover Map for 2009 (GlobCover 2009), 2012.
- Zanaga, D.; van de Kerchove, R.; Keersmaecker, W. de; Souverijns, N.; Brockmann, C.; Quast, R.; Wevers, J.; Grosu, A.; Paccini, A.; Vergnaud, S.; Cartus, O.; Santoro, M.; Fritz, S.; Georgieva, I.; Lesiv, M.; Carter, S.; Herold, M.; Li, L.; Tsendbazar, N.-E.; Ramoino, F.; Arino, O. ESA WorldCover 10 m 2020 v100, 2021.
- Zanaga, D.; van de Kerchove, R.; Daems, D.; Keersmaecker, W. de; Brockmann, C.; Kirches, G.; Wevers, J.; Cartus, O.; Santoro, M.; Fritz, S.; Lesiv, M.; Herold, M.; Tsendbazar, N.-E.; Xu, P.; Ramoino, F.; Arino, O. ESA WorldCover 10 m 2021 v200, 2022.
- Buchhorn, M.; Lesiv, M.; Tsendbazar, N.-E.; Herold, M.; Bertels, L.; Smets, B. Copernicus Global Land Cover Layers—Collection 2. Remote Sensing 2020, 12, 1044. [Google Scholar] [CrossRef]
- Karra, K.; Kontgis, C.; Statman-Weil, Z.; Mazzariello, J.C.; Mathis, M.; Brumby, S.P. In: 2021 IEEE International Geoscience and Remote Sensing Symposium IGARSS, IGARSS 2021—2021 IEEE International Geoscience and Remote Sensing Symposium, Brussels, Belgium, 11.07.2021–16.07.2021; IEEE, 2021; pp. 4704–4707.
- Brown, C.F.; Brumby, S.P.; Guzder-Williams, B.; Birch, T.; Hyde, S.B.; Mazzariello, J.; Czerwinski, W.; Pasquarella, V.J.; Haertel, R.; Ilyushchenko, S.; Schwehr, K.; Weisse, M.; Stolle, F.; Hanson, C.; Guinan, O.; Moore, R.; Tait, A.M. Dynamic World, Near real-time global 10 m land use land cover mapping. Scientific data, 2022, 9.
- Liangyun Liu; Xiao Zhang; Tingting Zhao. GLC_FCS30D: the first global 30-m land-cover dynamic monitoring product with fine classification system from 1985 to 2022, 2023.
- CHEN, J.; LIAO, A.; CHEN, L.; ZHANG, H.; HE, C.; PENG, S.; WU, H.; ZHANG, W.; LI, R.; ZHENG, X.; MEI, Y.; LU, M.; LU, N.; LIU, J.; KANG, R.; XING, H.; ZHU, W.; LIU, L.; HAN, G.; WANG, J.; YANG, A.; SUN, L.; SONG, H.; CHEN, W.; ZHOU, X.; XIA, L.; JIANG, H.; HUO, J.; ZHANG, Y.; LIU, W.; LI, Y.; ZHAI, L.; SANG, H. GCdataPR.
- Gong, P.; Liu, H.; Zhang, M.; Li, C.; Wang, J.; Huang, H.; Clinton, N.; Ji, L.; Li, W.; Bai, Y.; Chen, B.; Xu, B.; Zhu, Z.; Yuan, C.; Ping Suen, H.; Guo, J.; Xu, N.; Li, W.; Zhao, Y.; Yang, J.; Yu, C.; Wang, X.; Fu, H.; Le Yu; Dronova, I.; Hui, F.; Cheng, X.; Shi, X.; Xiao, F.; Liu, Q.; Song, L. Stable classification with limited sample: transferring a 30-m resolution sample set collected in 2015 to mapping 10-m resolution global land cover in 2017. Science bulletin, 2019, 64, 370–373. [CrossRef]
- Potapov, P.; Hansen, M.C.; Pickens, A.; Hernandez-Serna, A.; Tyukavina, A.; Turubanova, S.; Zalles, V.; Li, X.; Khan, A.; Stolle, F.; Harris, N.; Song, X.-P.; Baggett, A.; Kommareddy, I.; Kommareddy, A. The Global 2000-2020 Land Cover and Land Use Change Dataset Derived From the Landsat Archive: First Results. Front. Remote Sens., 2022, 3. [CrossRef]
- Hansen, M. C., P. V. Potapov, R. Moore, M. Hancher, S. A. Turubanova, A. Tyukavina, D. Thau, S. V. Stehman, S. J. Goetz, T. R. Loveland, A. Kommareddy, A. Egorov, L. Chini, C. O. Justice, and J. R. G. Townshend. High-Resolution Global Maps of 21st-Century Forest Cover Change, 15 November. Data available on-line at: https://glad.earthengine.app/view/global-forest-change.
- Potapov, P.; Li, X.; Hernandez-Serna, A.; Tyukavina, A.; Hansen, M.C.; Kommareddy, A.; Pickens, A.; Turubanova, S.; Tang, H.; Silva, C.E.; Armston, J.; Dubayah, R.; Blair, J.B.; Hofton, M. Mapping global forest canopy height through integration of GEDI and Landsat data. Remote Sensing of Environment 2021, 253, 112165. [Google Scholar] [CrossRef]
- Shimada, M.; Itoh, T.; Motooka, T.; Watanabe, M.; Shiraishi, T.; Thapa, R.; Lucas, R. New global forest/non-forest maps from ALOS PALSAR data (2007–2010). Remote Sensing of Environment 2014, 155, 13–31. [Google Scholar] [CrossRef]
- Hansen, M.C.; Potapov, P.V.; Pickens, A.H.; Tyukavina, A.; Hernandez-Serna, A.; Zalles, V.; Turubanova, S.; Kommareddy, I.; Stehman, S.V.; Song, X.-P.; Kommareddy, A. Global land use extent and dispersion within natural land cover using Landsat data. Environ. Res. Lett. 2022, 17, 34050. [Google Scholar] [CrossRef]
- Tolan, J.; Yang, H.-I.; Nosarzewski, B.; Couairon, G.; Vo, H.; Brandt, J.; Spore, J.; Majumdar, S.; Haziza, D.; Vamaraju, J.; Moutakanni, T.; Bojanowski, P.; Johns, T.; White, B.; Tiecke, T.; Couprie, C. Very high-resolution canopy height maps from RGB imagery using self-supervised vision transformer and convolutional decoder trained on Aerial Lidar, 2023.
- Lang, N.; Jetz, W.; Schindler, K.; Wegner, J.D. A high-resolution canopy height model of the Earth. Nature ecology & evolution 2023, 7, 1778–1789. [Google Scholar] [CrossRef]
- Sexton, J.O.; Song, X.-P.; Feng, M.; Noojipady, P.; Anand, A.; Huang, C.; Kim, D.-H.; Collins, K.M.; Channan, S.; DiMiceli, C.; Townshend, J.R. Global, 30-m resolution continuous fields of tree cover: Landsat-based rescaling of MODIS vegetation continuous fields with lidar-based estimates of error. International Journal of Digital Earth 2013, 6, 427–448. [Google Scholar] [CrossRef]
- Rufin, P.; Meyfroidt, P.; Akinyemi, F.O.; Estes, L.; Ibrahim, E.S.; Jain, M.; Kerner, H.; Lisboa, S.N.; Lobell, D.; Nakalembe, C.; Persello, C.; Picoli, M.C.A.; Ribeiro, N.; Sitoe, A.A.; Waha, K.; Wang, S. To enhance sustainable development goal research, open up commercial satellite image archives. Proceedings of the National Academy of Sciences of the United States of America 2025, 122, e2410246122. [Google Scholar] [CrossRef] [PubMed]
- Slagter, B.; Reiche, J.; Marcos, D.; Mullissa, A.; Lossou, E.; Peña-Claros, M.; Herold, M. Monitoring direct drivers of small-scale tropical forest disturbance in near real-time with Sentinel-1 and -2 data. Remote Sensing of Environment 2023, 295, 113655. [Google Scholar] [CrossRef]
- Buchhorn, M.; Smets, B.; Bertels, L.; Roo, B. de; Lesiv, M.; Tsendbazar, N.-E.; Li, L.; Tarko, A. Copernicus Global Land Service: Land Cover 100m: version 3 Globe 2015-2019: Product User Manual, 2020.
- Qin, Y.; Xiao, X.; Dong, J.; Zhou, Y.; Wang, J.; Doughty, R.B.; Chen, Y.; Zou, Z.; Moore, B. Annual dynamics of forest areas in South America during 2007–2010 at 50-m spatial resolution. Remote Sensing of Environment 2017, 201, 73–87. [Google Scholar] [CrossRef]
- Bourgoin, C., Ameztoy, I., Verhegghen, A., Desclée, B., Carboni, S., Bastin, J., Beuchle, R., Brink, A., Defourny, P., Delhez, B., Fritz, S., Gond, V., Herold, M., Lamarche, C., Mansuy, N., Mollicone, D., Oom, D., Peedell, S., San-Miguel, J., Colditz, R. and Achard, F. Mapping Global Forest Cover of the Year 2020 to Support the EU Regulation on Deforestation-free Supply Chains, Publications Office of the European Union: Luxembourg, 2024.
- Santos, L.A.; Ferreira, K.R.; Camara, G.; Picoli, M.C.; Simoes, R.E. Quality control and class noise reduction of satellite image time series. ISPRS Journal of Photogrammetry and Remote Sensing 2021, 177, 75–88. [Google Scholar] [CrossRef]
- Santos, L.A.; Ferreira, K.; Picoli, M.; Camara, G.; Zurita-Milla, R.; Augustijn, E.-W. Identifying Spatiotemporal Patterns in Land Use and Cover Samples from Satellite Image Time Series. Remote Sensing 2021, 13, 974. [Google Scholar] [CrossRef]
- Forest Data Partnership. Community models 2025a, 2025. https://github.com/google/forest-data-partnership/edit/main/models/README.md.
- Adrià, D.; Serge, W.; Erik, M.; David, G.; Stephen, P.; Zoltan, S. High resolution global industrial and smallholder oil palm map for 2019, 2021.
- Song, X.-P.; Hansen, M.C.; Potapov, P.; Adusei, B.; Pickering, J.; Adami, M.; Lima, A.; Zalles, V.; Stehman, S.V.; Di Bella, C.M.; Conde, M.C.; Copati, E.J.; Fernandes, L.B.; Hernandez-Serna, A.; Jantz, S.M.; Pickens, A.H.; Turubanova, S.; Tyukavina, A. Massive soybean expansion in South America since 2000 and implications for conservation. Nature sustainability, 2021, 2021. [CrossRef]
- Doblas, J.; Reis, M.S.; Belluzzo, A.P.; Quadros, C.B.; Moraes, D.R.V.; Almeida, C.A.; Maurano, L.E.P.; Carvalho, A.F.A.; Sant’Anna, S.J.S.; Shimabukuro, Y.E. DETER-R: An Operational Near-Real Time Tropical Forest Disturbance Warning System Based on Sentinel-1 Time Series Analysis. Remote Sensing 2022, 14, 3658. [Google Scholar] [CrossRef]
- Hansen, M. OPERA Land Surface Disturbance Alert from Harmonized Landsat Sentinel-2 product (Version 1), 2024.
- Seebach, L.M.; Strobl, P.; San Miguel-Ayanz, J.; Gallego, J.; Bastrup-Birk, A. Comparative analysis of harmonized forest area estimates for European countries. Forestry 2011, 84, 285–299. [Google Scholar] [CrossRef]
Figure 1.
Schematic illustration of the systematic assessment procedures.
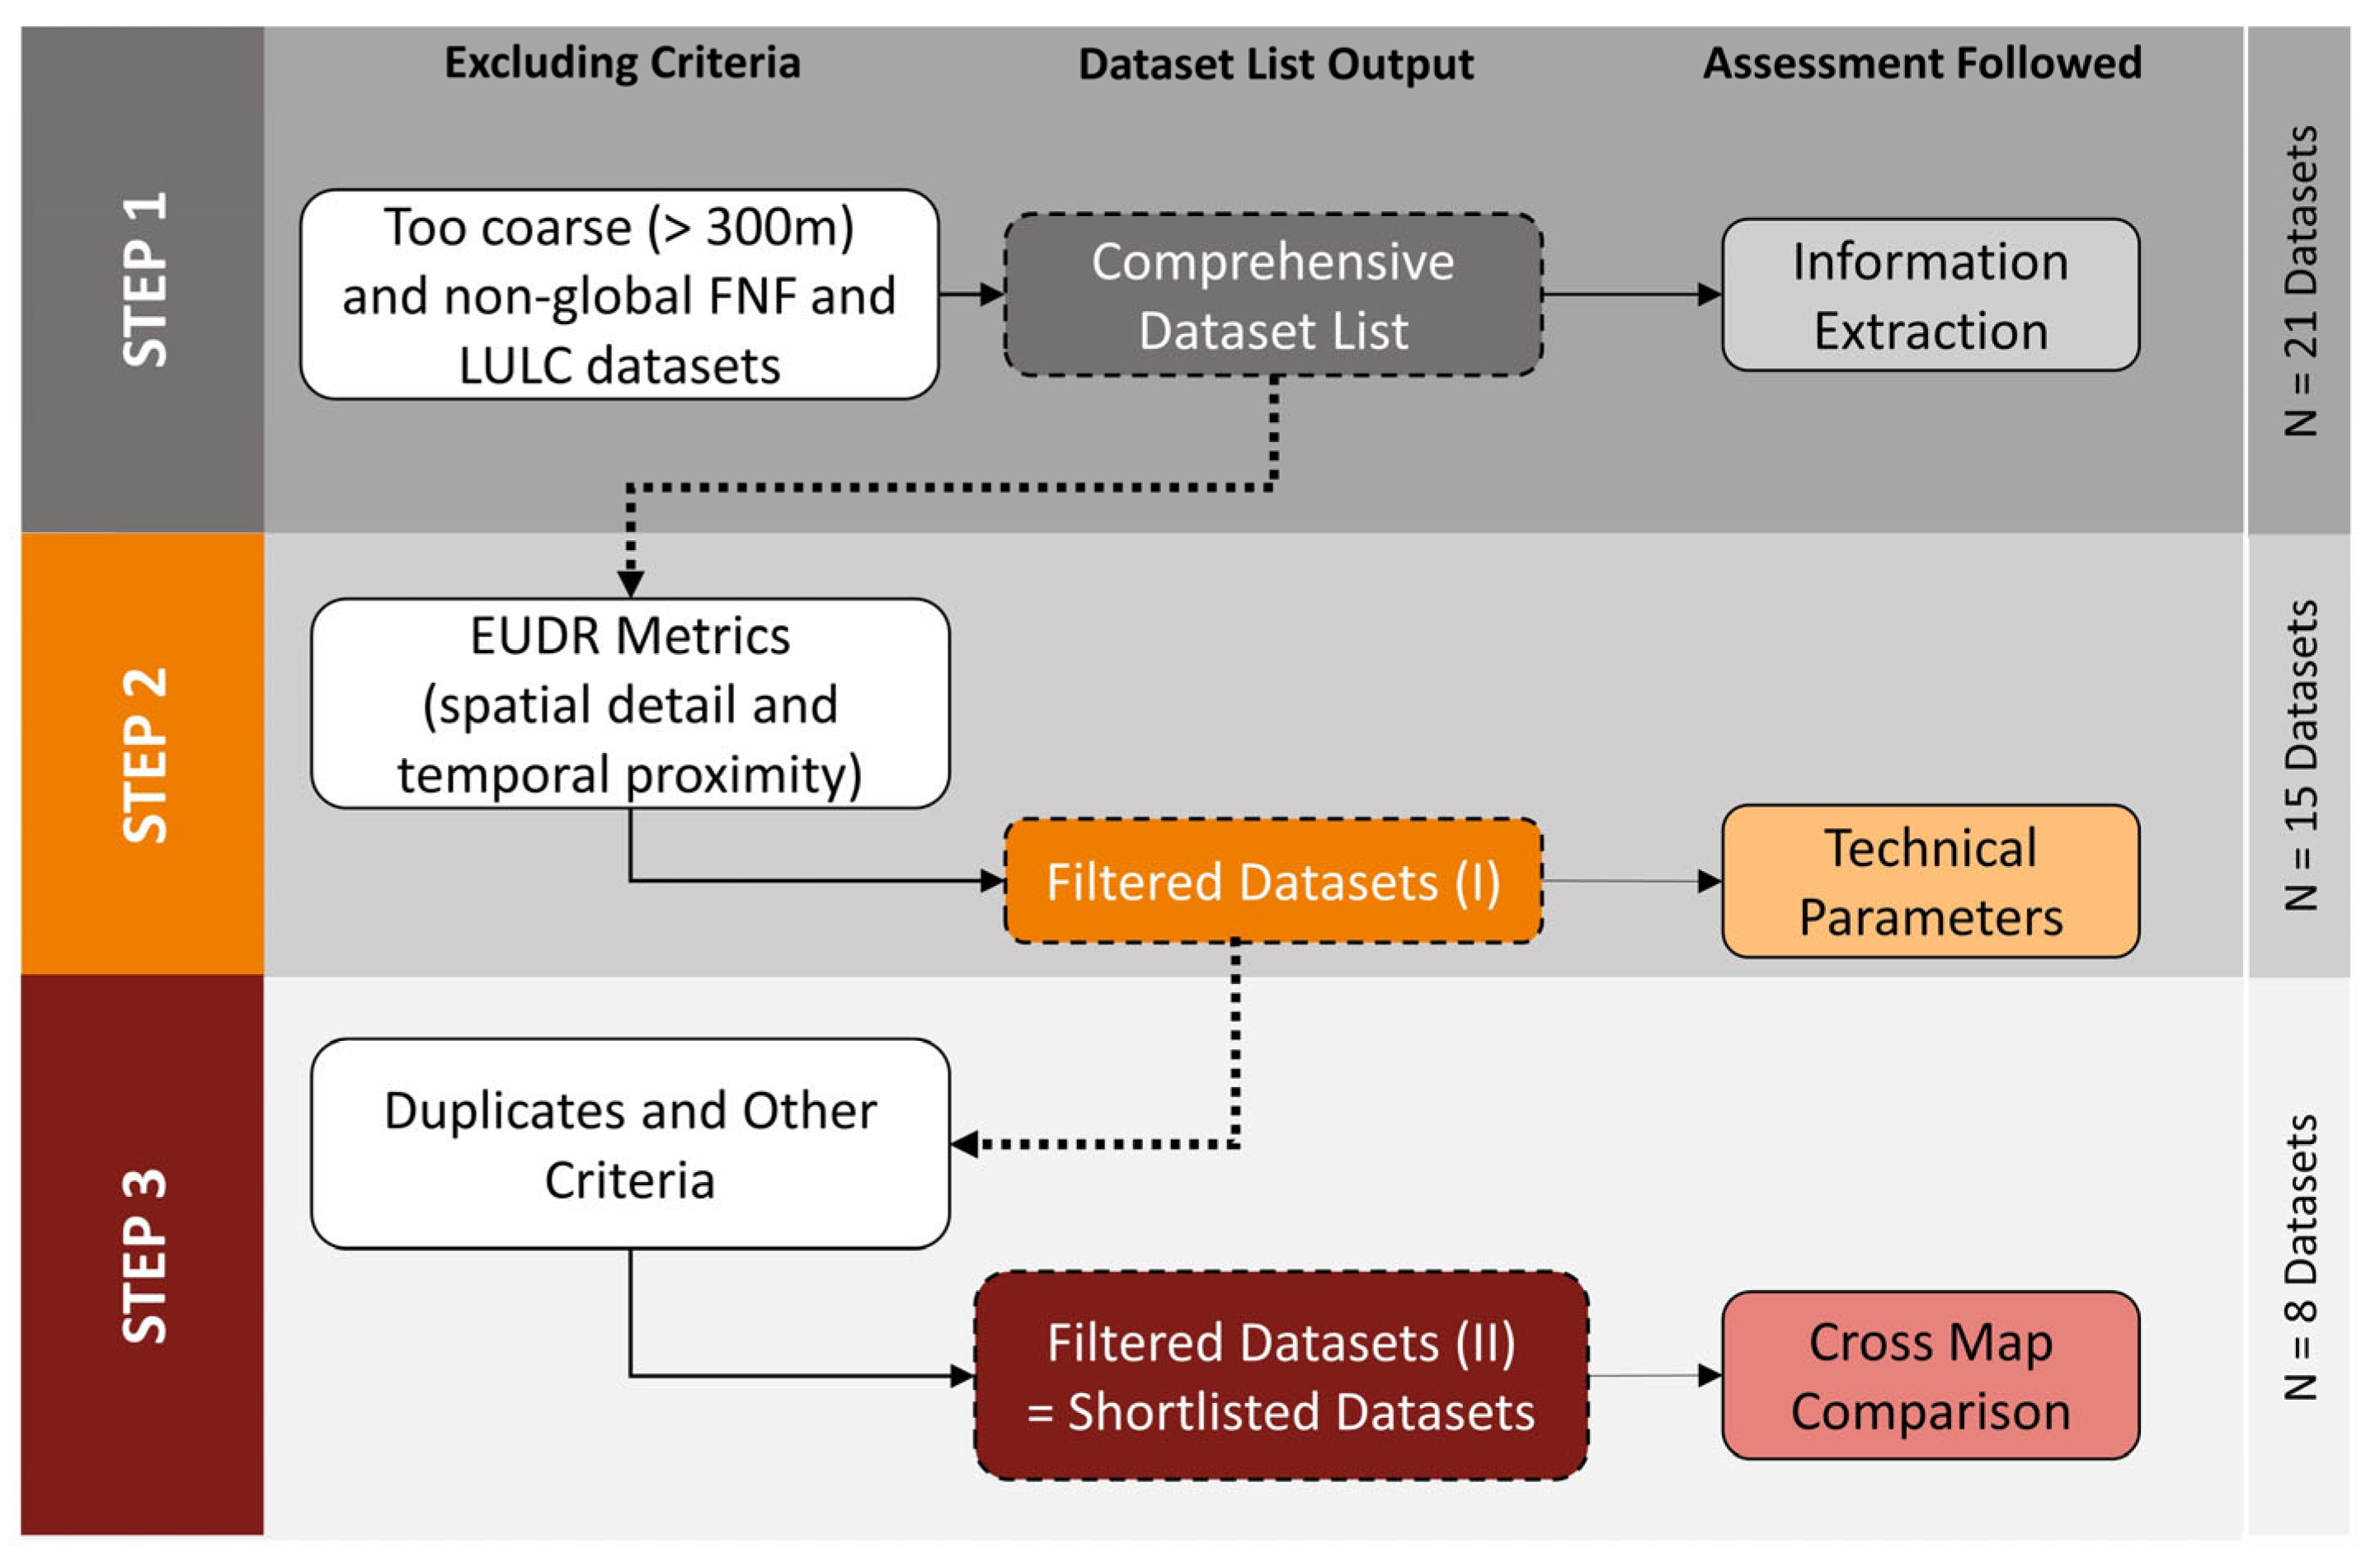
Figure 2.
All 21 compiled datasets and their matching capability with the EUDR metric indicators. Green color means that a dataset fulfils the minimum threshold set by EUDR for the respective indicator, while red color means not fulfilling. Gray-colored boxes represent unavailable information. The “*” sign refers to forest MMU is assumed according to the spatial resolution of the dataset. The “>” means that the dataset set a threshold above the minimum required parameter adopted by the EUDR (10%). The selected datasets by the first filter criteria, step 1 (N=15), are marked with “+”.
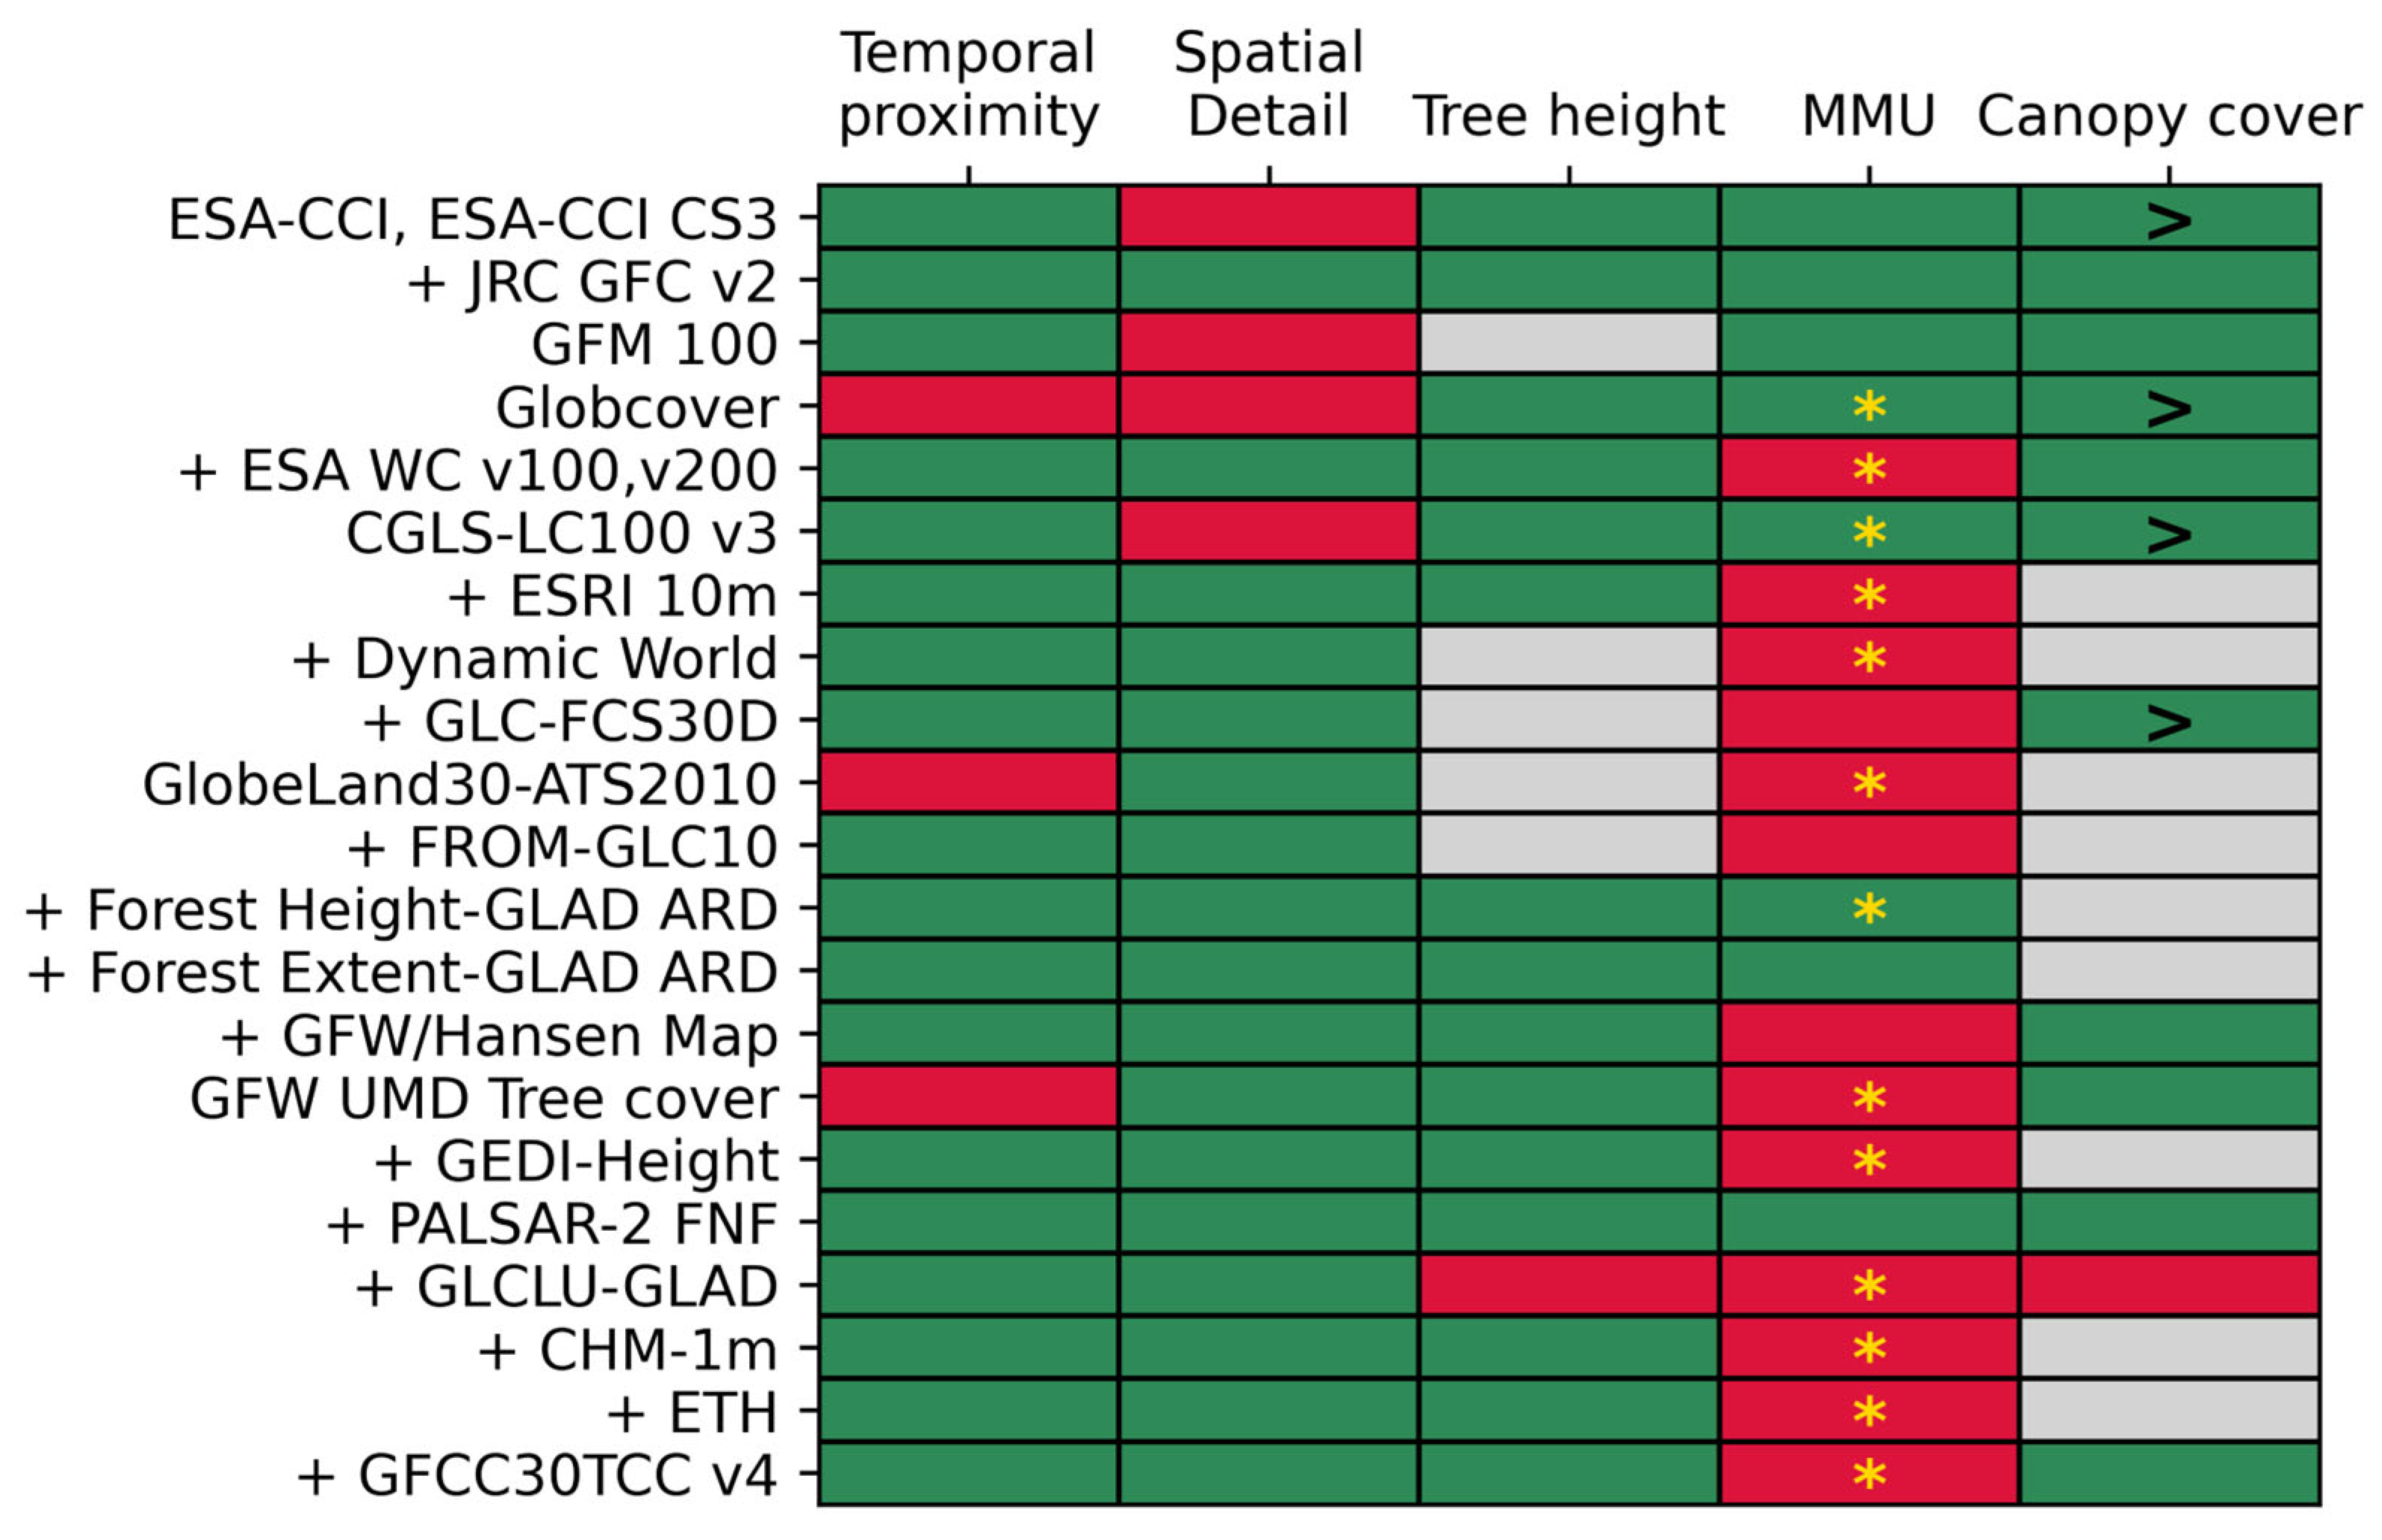
Figure 3.
Indicated tendencies from datasets based on accuracy metrics (ratio PA/UA above or below 1 and with positive or negative MBE) and their respective implications when verifying “deforestation-free” production for the EUDR.
Figure 3.
Indicated tendencies from datasets based on accuracy metrics (ratio PA/UA above or below 1 and with positive or negative MBE) and their respective implications when verifying “deforestation-free” production for the EUDR.
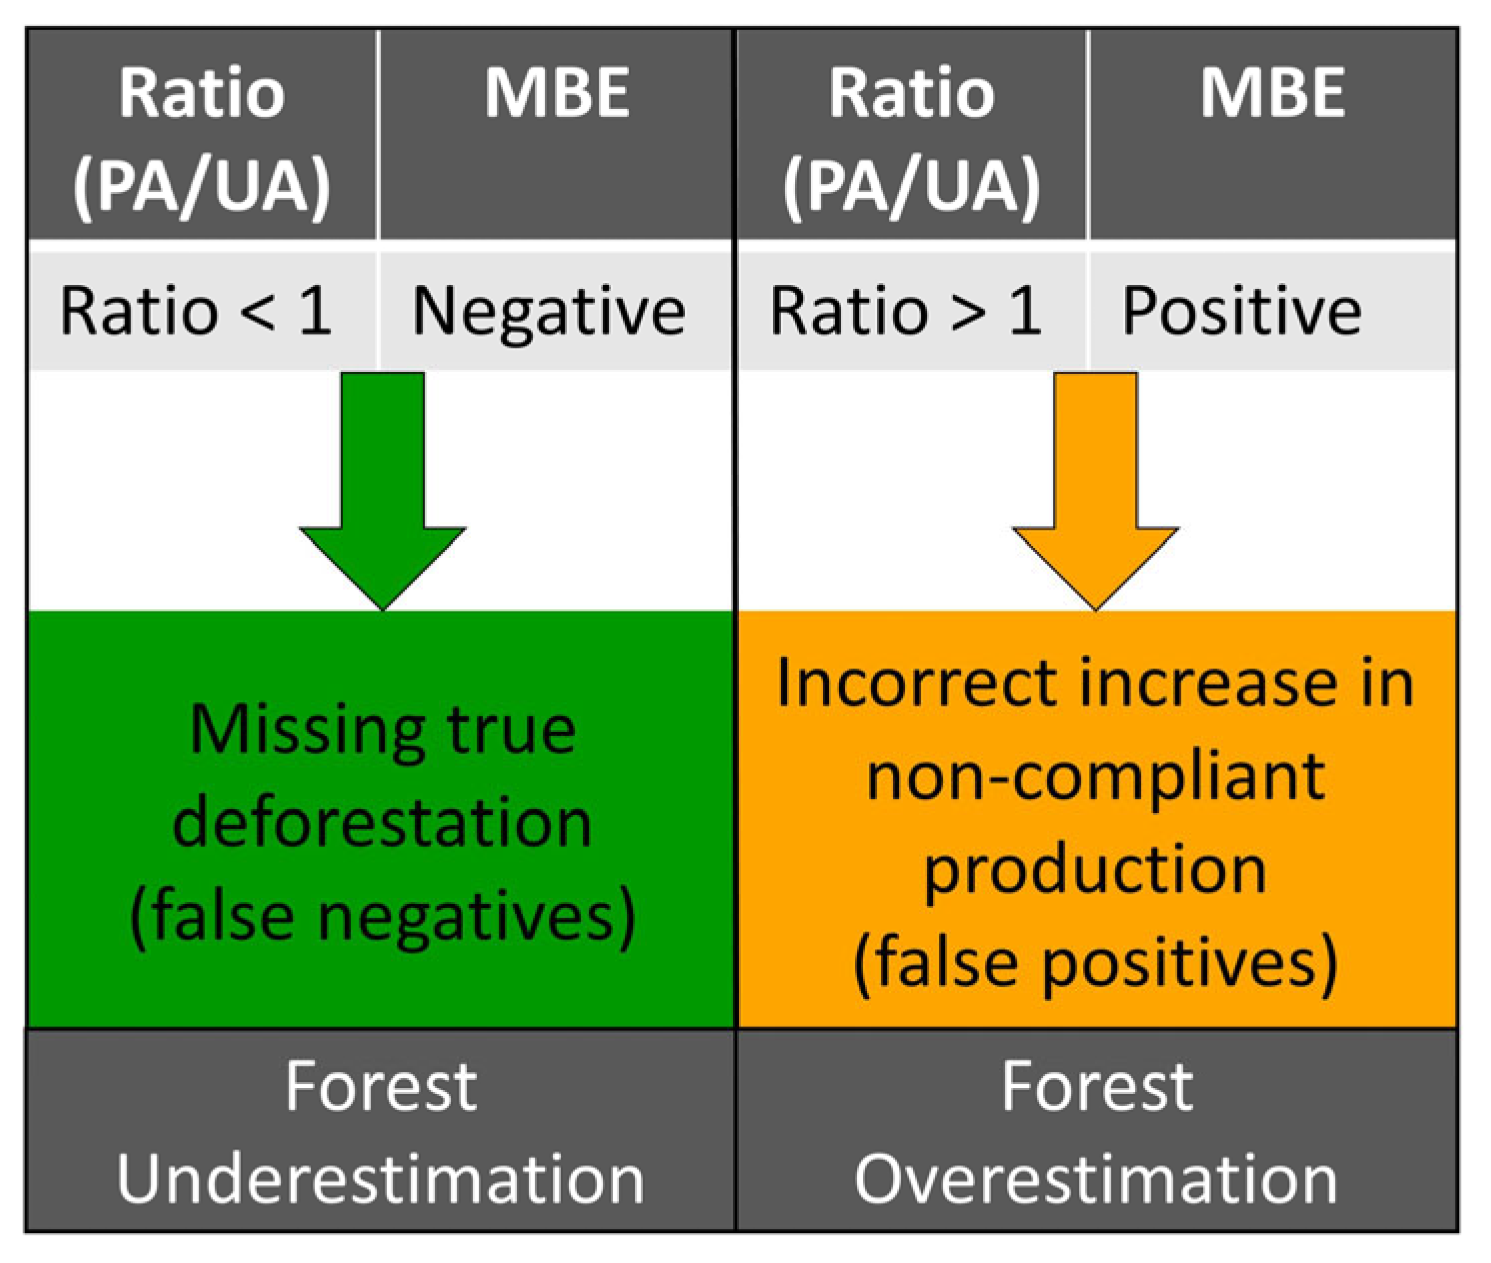
Figure 4.
PA/UA ratios against the OAs discriminated by the type of dataset (FNF or LULC). Datasets above the red dashed line, marked by orange color, denote datasets with tendencies to overestimate forest/tree cover, while datasets below the red line indicate and marked by green color denote a forest/ tree cover underestimation.
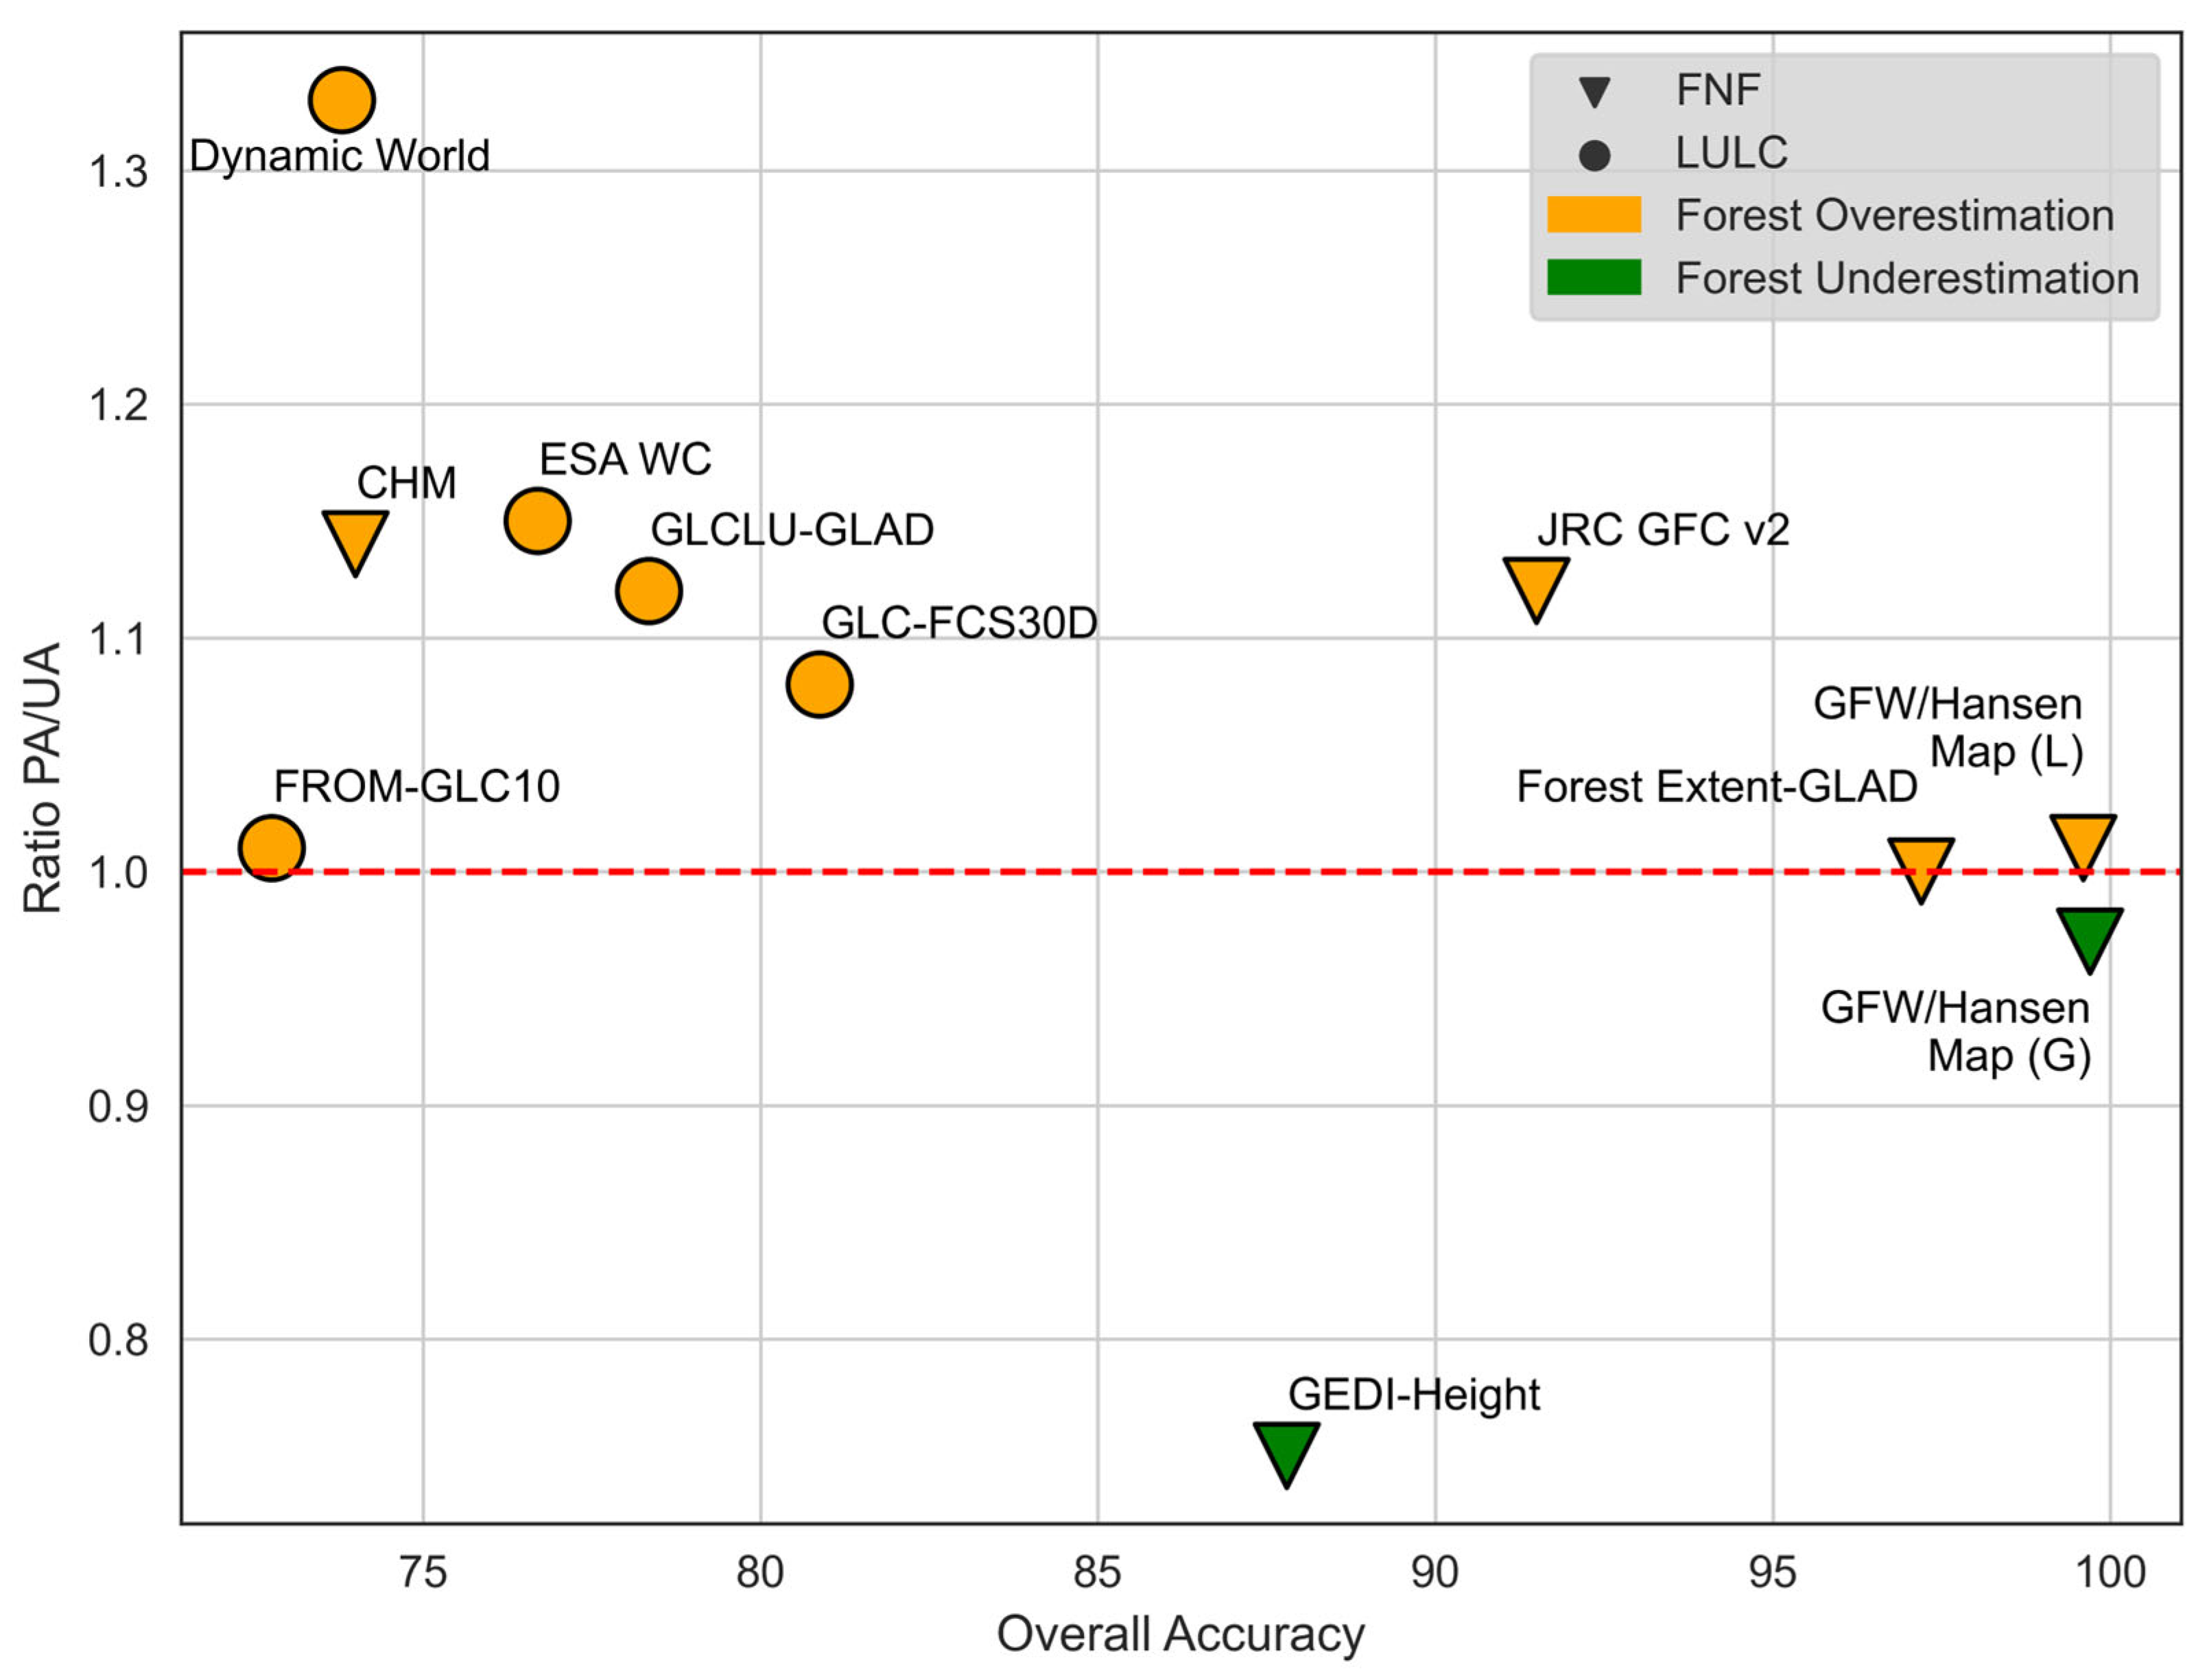
Figure 5.
Estimations of forest area per region estimation for each shortlisted dataset and the values from FAO FRA 2020 [37]. The red dashed line indicates the reference line, using FAO FRA as the basis for the comparison. The right Y-axis of each sub graph represent the percentage difference for each dataset relative to the FAO FRA reference. The green-colored number exhibit the average of the percentage differences within each region. The forest area estimate refers to the year shown in parentheses.
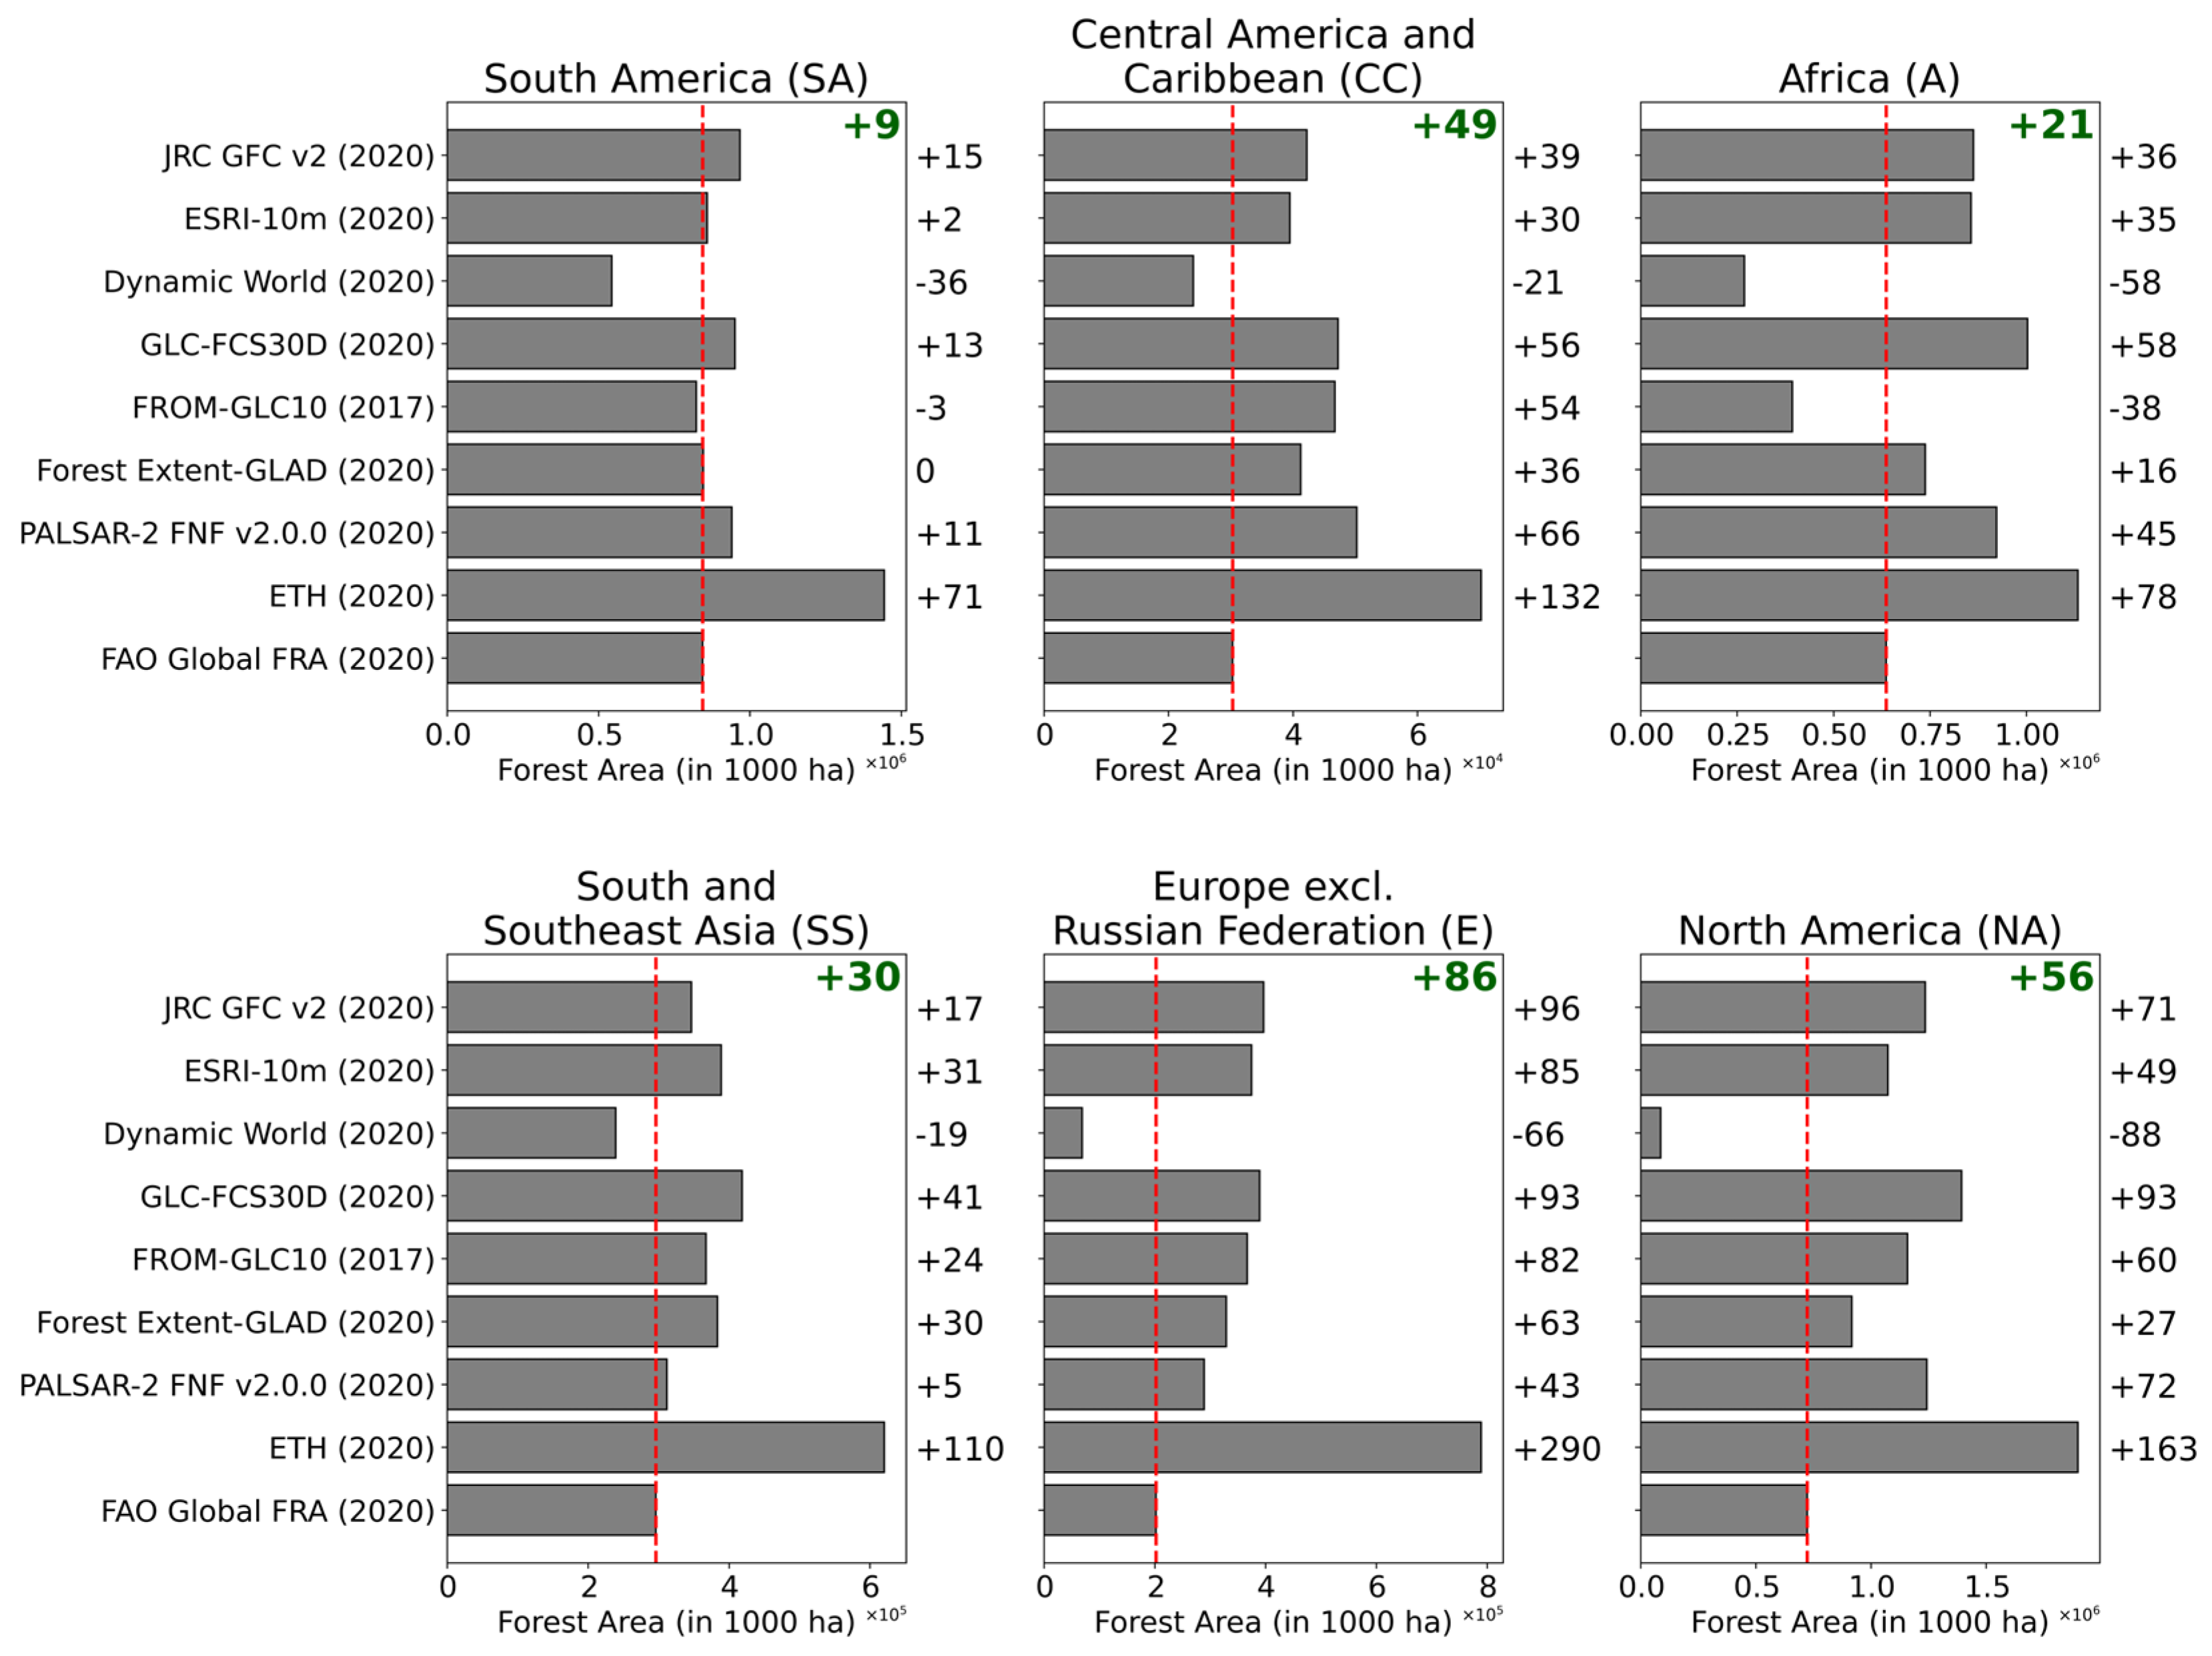
Figure 6.
Overview of each shortlisted dataset with respect to the EUDR and accuracy metrics, complemented by additional qualitative insights. Two datasets, ESRI-10m and PALSAR-2 FNF v2.0.0 did not report UA, PA or MBE accuracy metrics (see Table 4).
Figure 6.
Overview of each shortlisted dataset with respect to the EUDR and accuracy metrics, complemented by additional qualitative insights. Two datasets, ESRI-10m and PALSAR-2 FNF v2.0.0 did not report UA, PA or MBE accuracy metrics (see Table 4).
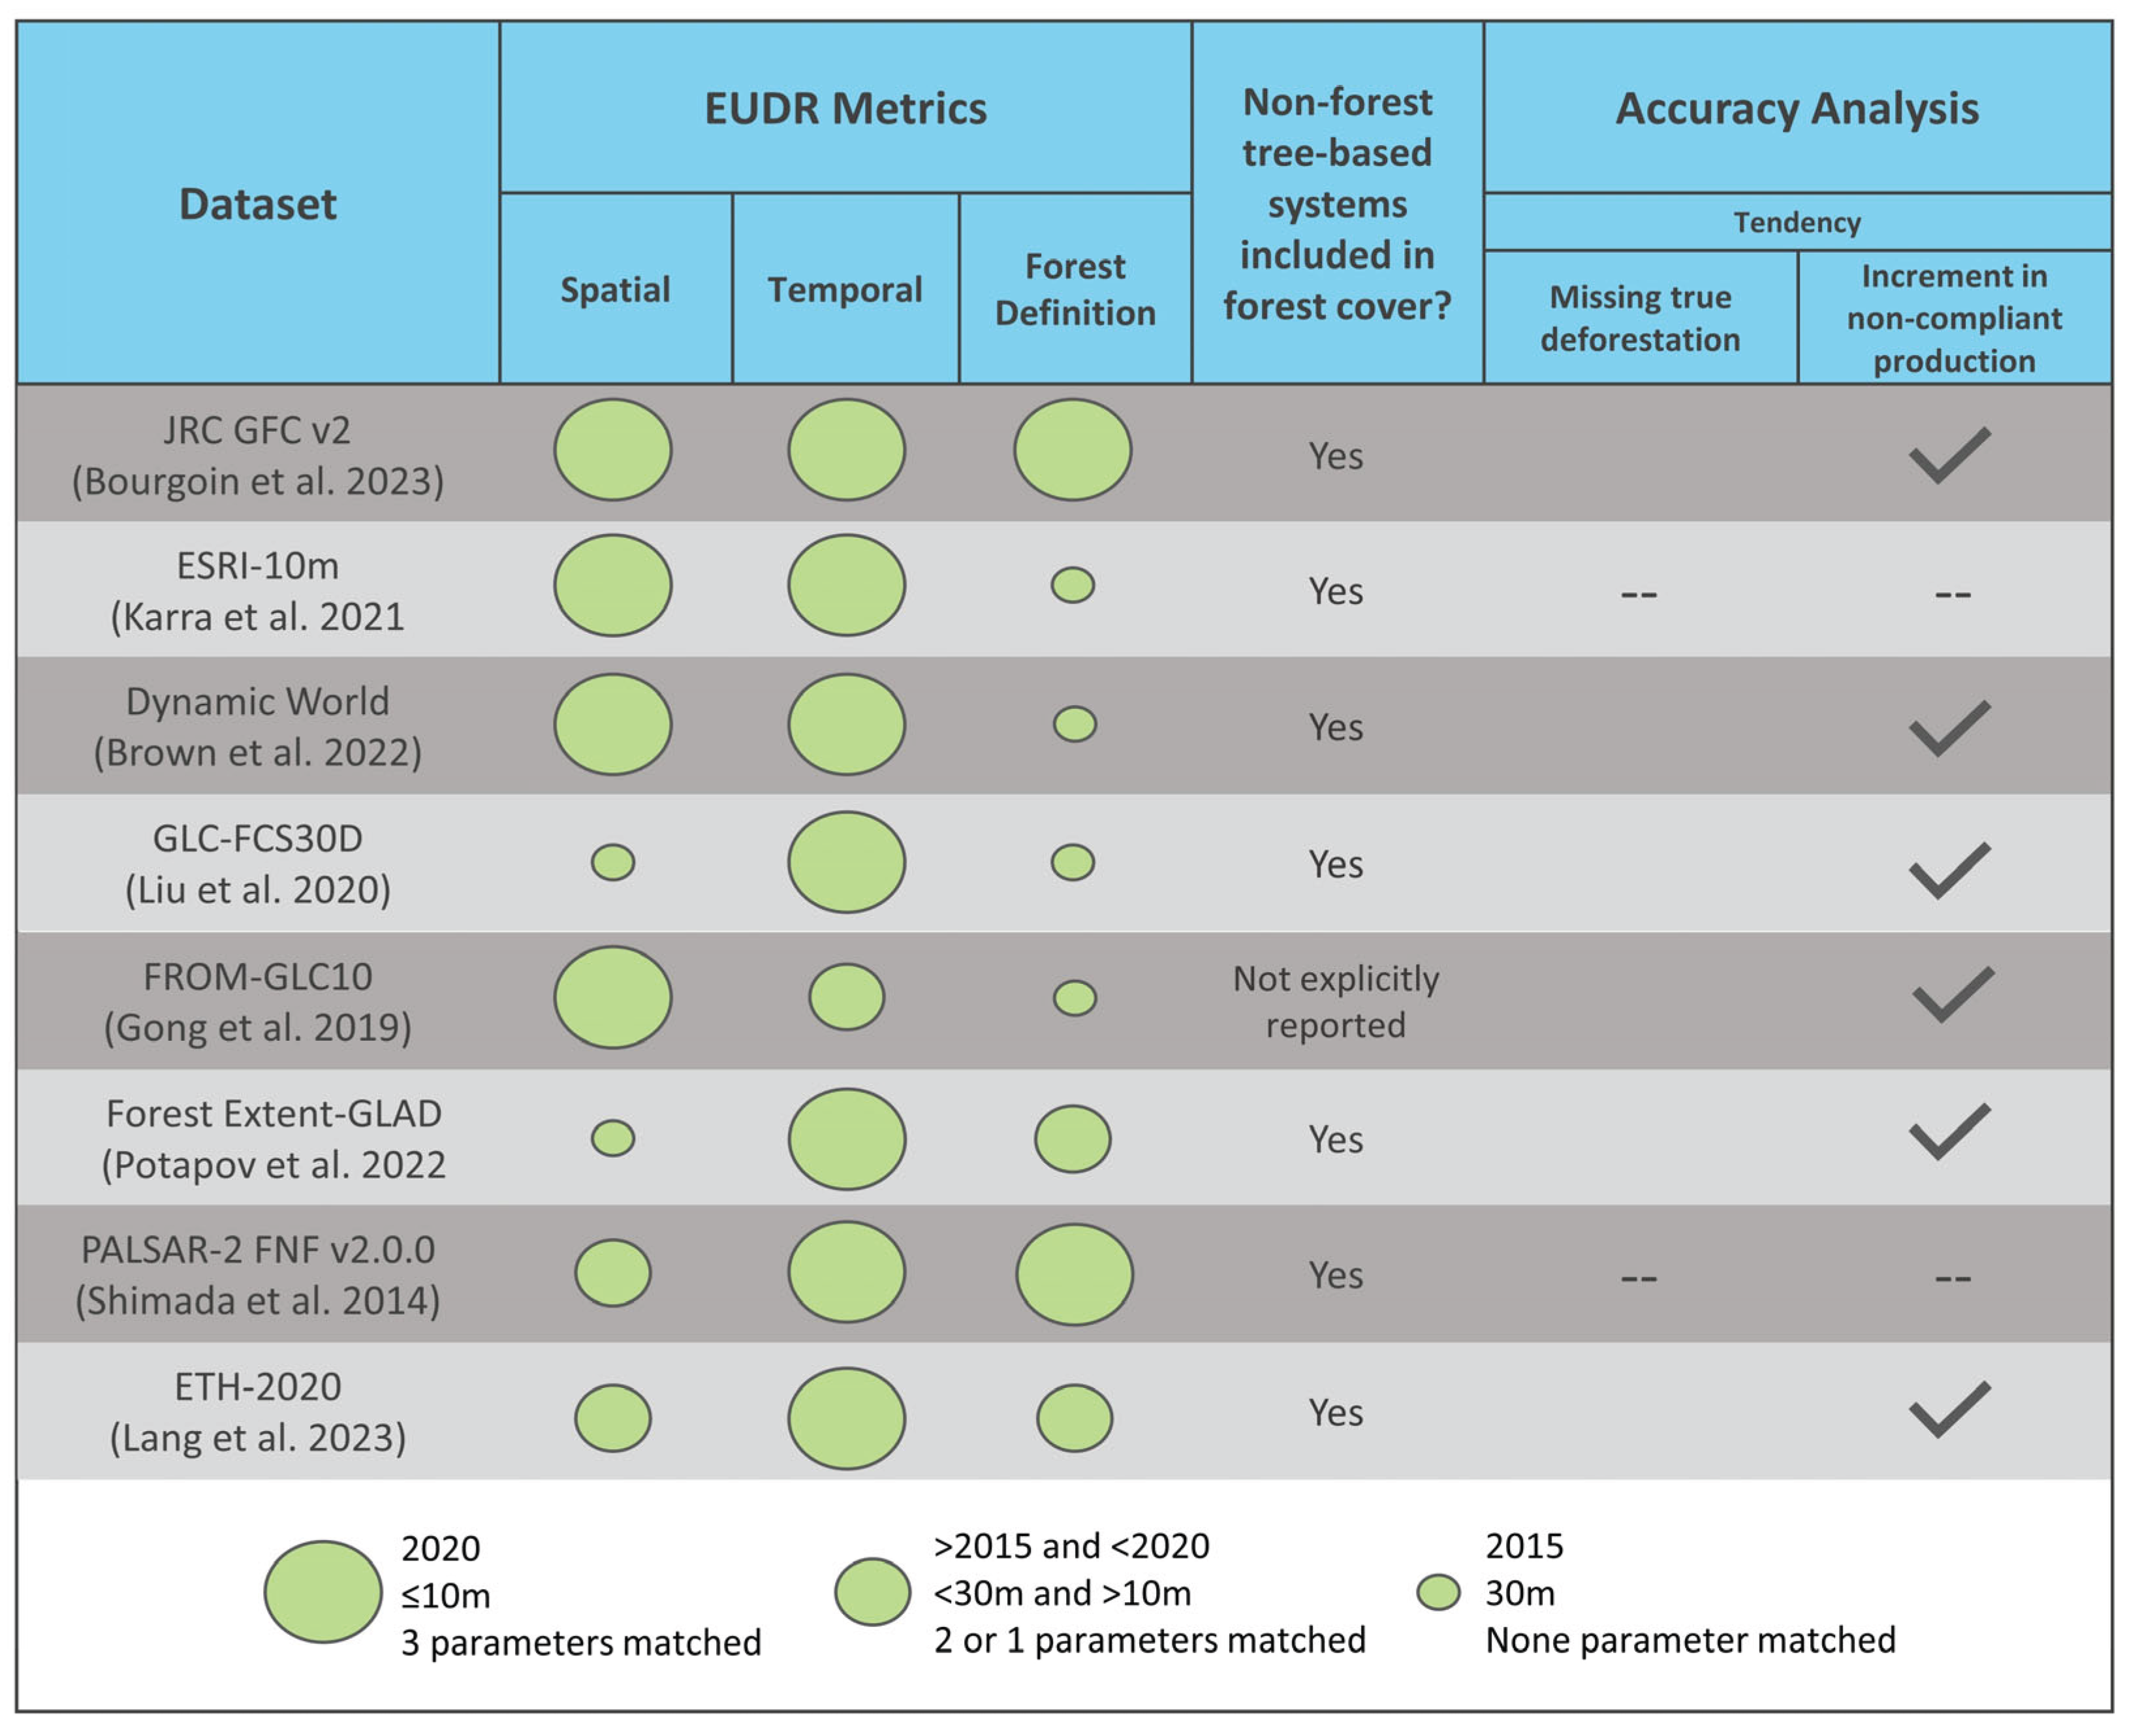

Table 1.
Thresholds for each indicator in the EUDR Metrics.
| Indicator | Threshold | |
|---|---|---|
| Temporal Proximity | 2020 ±5 years | |
| Spatial Resolution | ≤ 30m | |
| Forest Definition | Tree Height | ≥ 5m ±1m |
| MMU of forest cover | ≥ 0.5ha | |
| Forest Canopy Cover | ≥ 10% | |
Table 2.
Details on the accuracy metrics and their relationship to potential implications on EUDR DDS verification through global forest/tree cover maps.
Table 2.
Details on the accuracy metrics and their relationship to potential implications on EUDR DDS verification through global forest/tree cover maps.
| Producer’s Accuracy | User’s Accuracy | |
|---|---|---|
| Calculation (class-specific) | ||
| Probability | True forest pixel being classified as forest cover | Classified forest pixel actually representing forest cover |
| Measure | Completeness | Reliability |
|
Associated Error |
Omission error: number (%) of true forest pixels incorrectly identified | Commission error: number (%) of incorrectly classified pixels as forest |
| Interpretation | Low producer’s accuracy values may indicate forest underestimation | Low user’s accuracy values may indicate forest overestimation |
| Ratio (PA/UA) | Ratio > 1 (PA > UA; Oerror < Cerror) | Ratio < 1 (PA < UA; Oerror > Cerror) |
| RSME | MAE | |
| Definition | Squared differences between predicted/modeled values and the true values | Absolute differences between predicted/modeled values and the true values |
| Measure | Scale and magnitude of errors, where higher weights are given to large differences (spotting outliers) | Scale and magnitude of errors, where all errors are equally treated |
| MBE | ||
| Definition | Average of differences between predicted/modeled values and the true values considering | |
| Measure | Direction and tendency of errors | |
| Interpretation | Positive indicates overestimation; Negative indicates underestimation | |
Table 3.
List of collected datasets categorized by the EUDR metric indicators and data compilation methods. Shortlisted datasets, selected using criteria from steps 2 and 3 (Methods), are shown in bold and underlined letters.
Table 3.
List of collected datasets categorized by the EUDR metric indicators and data compilation methods. Shortlisted datasets, selected using criteria from steps 2 and 3 (Methods), are shown in bold and underlined letters.
| ID | Dataset Short Name/ Abbreviation |
Source | Institution | Type of Map | Spatial Resolution |
Temporal Coverage |
Forest/Tree cover Class Parameters |
Inclusion of non-forest tree cover?(Crop plantation, agroforestry, woodlands/savannas) |
Classification approach | Type of Satellite Sensor/Input Dataset |
Exclusion Rationale |
||
|---|---|---|---|---|---|---|---|---|---|---|---|---|---|
| Height (m) |
MMU (ha) |
Canopy (%) |
|||||||||||
| 1 | ESA-CCI (v207) and ESA-CCI CS3 (v2.1.1) | [55,56] | ESA | LULC | 300 | 1992 to 2020 | ≥ 5 | ≥ 9 | ≥ 15 | Not explicitly reported |
Unsupervised classification and Multiple-years Strategy | MSS | SP |
| 2 | JRC GFC v2 | [32] | JRC | FNF | 10 | 2020 | ≥ 5 | ≥0,5 | ≥ 10 | Yes | Composite Map (CM) | Multiple third-party datasets | |
| 3 | GFM 100 | [57] | IIASA | FNF | 100 | 2015 | n.a. | n.a. | ≥ 10 | No | Random Forest (RF) classifier | MSS | SP |
| 4 | Globcover | [58] | ESA | LULC | 300 | 2009 | ≥ 5 | n.a. | ≥ 15 | Not explicitly reported |
Supervised and unsupervised classifications, and Cluster-Based Classification | MSS | T + SP |
| 5 | ESA WC (v100 and v200) | [59,60] | ESA | LULC | 10 | 2020 to 2021 | ≥ 5 | n.a. | ≥ 10 | Yes | Gradient boosting decision tree algorithm (CatBoost) | MSS and SAR | R |
| 6 | CGLS-LC100 v3 | [61] | Copernicus EU | LULC | 100 | 2015 to 2019 | n.a. | n.a. | ≥15 | Yes | RF classification and Biome-cluster classification | MSS and SAR | SP |
| 7 | ESRI-10m | [62] | IO in cooperation with ESRI and Microsoft AI for Earth | LULC | 10 | 2017 to 2023 | ≥ 4.57 | n.a. | n.a. | Yes | Deep learning model (convolutional neural network for image segmentation) | MSS | |
| 8 | Dynamic World | [63] | WIR | LULC | 10 | 2015 to 2024 | Forest defined as significant clustering of dense vegetation with a closed or dense canopy that is taller and darker than surrounding vegetation (if surrounded by other vegetation). | Yes | Semi-supervised deep learning (supervised label data to train Fully Convolutional Neural Network | MSS | |||
| 9 | GLC-FCS30D | [64] | CBAS | LULC | 30 | 2000 to 2022 | n.a. | n.a. | ≥15 | Yes | Continuous change detection (CCD) algorithm with a local adaptive updating method | MSS with Panchromatic band (PB) | |
| 10 | GlobeLand30-ATS2010 | [65] | NGCC | LULC | 30 | 2010 | n.a. | ≥ 5.76 | n.a. | Not explicitly reported |
Pixel-Object-Knowledge (POK) | MSS with PB | T |
| 11 | FROM-GLC10 | [66] | Department of Earth System Science, Tsinghua University | LULC | 10 | 2017 | n.a. | n.a. | n.a. | Not explicitly reported |
RF classification | MSS | |
| 12 | Forest Height—GLAD ARD | [67] | UMD GLAD | FNF | 30 | 2000 and 2020 | ≥ 3* | ≥ 0,5 | n.a. | Yes | Regression tree model (RTM) ensembles | LiDAR | R |
| 13 | Forest Extent—GLAD ARD | [67] | UMD GLAD | FNF | 30 | 2000 and 2020 | ≥ 5 | ≥ 0,5 | n.a. | Yes | Dataset based on Forest height-GLAD | Forest Height GLAD ARD | |
| 14 | GFW/Hansen Map (Global Forest Change Data v1-11) | [68] | UMD GLAD and GFW | FNF | 30 | 2000 to 2023 | ≥ 5 | ≥ 0.09 | ≥ 10 | Yes | Bagged decision tree (bootstrap aggregating) | MSS with PB | R |
| 15 | GFW UMD Tree cover | [68] | UMD GLAD and GFW | FNF | 30 | 2010 | ≥ 5 | ≥ 0.09 | ≥ 10 | Yes | RTM | MSS with PB | T + R |
| 16 | GEDI-Height | [69] | UMD GLAD | FNF | 30 | 2019 | ≥ 0* | ≥ 0.09 | n.a. | Yes | RTM | LiDAR | R |
| 17 | PALSAR-2 FNF v2.0.0 (3-class) | [70] | JAXA | FNF | 25 | 2017 to 2020 | ≥ 5 | ≥ 0,5 | ≥ 10 | Yes | RF classification | SAR | |
| 18 | GLCLU-GLAD | [71] | UMD GLAD | LULC | 30 | 2019 | ≥ 3 | ≥ 0.09 | ≥ 0 | Yes | Global/Regional hybrid decision tree (RTM for global and regional classification and local calibration); Regional Quality Assurance models of water and snow/ice, Regional deep learning convolution neural networks. | MSS with PB | R |
| 19 | CHM-1m | [72] | Meta Sustainability and WIR | FNF | 1 | 2009 to 2020 | ≥ 1* | ≥ 0.0001 | n.a. | Yes | Self-Supervised learning and simple convolution network | MSS with PB | OC |
| 20 | ETH | [73] | EcoVision Lab, Photogrammetry and Remote Sensing, ETH Zürich | FNF | 10 | 2020 | ≥ 0* | ≥ 0.01 | n.a. | Yes | Convolutional neural networks (CNNs) | MSS and LiDAR | |
| 21 | GFCC30TCC-v4 | [74] | NASA | FNF | 30 | 2000, 2005, 2010 and 2015 | ≥ 5 | ≥ 0.09 | ≥ 0* | Yes | Rescaling Coarse dataset with finer dataset | MSS with PB | OC |
R = redundant, as it is utilized in JRC/GFC 2020; SP = low spatial resolution; T = older than 2015;OC = other criteria, such as newest version unavailable or absence of forest status layer; n.a. = not available information or a measure that does not apply; * tree height or canopy cover dataset is adjustable to user’s preferred value.
Table 4.
Accuracy metrics for the 15 datasets selected based on the first criterion (Step 2). Datasets that also met the second criterion (Step 3) are bolded and underlined (shortlisted datasets, N=8). Reported accuracy ranges represent the highest documented values for each dataset.
Table 4.
Accuracy metrics for the 15 datasets selected based on the first criterion (Step 2). Datasets that also met the second criterion (Step 3) are bolded and underlined (shortlisted datasets, N=8). Reported accuracy ranges represent the highest documented values for each dataset.
| ID | Name | General Validation Approach + Reference Dataset/Year | OA (%) | PA (%) | UA (%) | PA/UA | RSME | MAE | MBE |
|---|---|---|---|---|---|---|---|---|---|
| 2 | JRC GFC v2 | IIASA reference dataset. Year(s): 2015 | 91.5 | 91.8 | 82 | 1.12 | x | x | x |
| 5 | ESA WC 2020 (v100 and v200) | CGLS-LC validation dataset (Copernicus Global Land Service). Year(s): 2019 to 2021 | 76.7 | 91.9 | 80 | 1.15 | x | x | x |
| 7 | ESRI-10m (a) | Very high-resolution imagery visually interpreted. Year(s): n.a. | 85 | n.a. | n.a. | n.a. | x | x | x |
| 8 | Dynamic World | Samples per biome and region from NASA MCD12Q1 land cover. Year(s): 2017 | 73.8 | 93.2 | 70.2 | 1.33 | x | x | x |
| 9 | GLC-FCS30D | Visually interpreted global samples and two third-part datasets: Land Use/-Cover Area frame Survey (LUCAS) and the Land Cover Monitoring, Assessment, and Projection (LCMAP) Collection 1.0 annual land-cover product. Year(s): 2020 | 80.88 | 92.83 | 86.35 | 1.08 | x | x | x |
| 11 | FROM-GLC10 | Multi-seasonal sampling collected from Landsat 8 images. Year(s): 2015 | 72.76 | 84.2 | 83.47 | 1.01 | x | x | x |
| 12 | Forest Height-GLAD | Sampling from GEDI Collection 1 and Collection 2. Year(s): 2019 and 2020 | x | x | x | x | 6.75m | 4.76m | x |
| 13 | Forest Extent-GLAD | Sampling from Landsat GLAD ARD 16-day time series data, annual and bimonthly image composites, and high-resolution image time series from Google Earth, Year(s): n.a. | 97.2 | 94.8 | 94.6 | 1.00 | x | x | x |
| 14 | Global Forest Change Data v1-11—GFW/Hansen Map (b) | Image interpretation of time-series Landsat, MODIS and very high spatial imagery from Google Earth and LiDAR (light detection and ranging) data from NASA’s GLAS (Geoscience Laser Altimetry System). Year(s): n.a. | (L)99.6 (G)99.7 |
(L)87.8 (G)73.9 |
(L)87 (G)76.4 |
(L)1.01 (G)0.97 |
x | x | x |
| 16 | GEDI-Height | Sampling from 10% of the GEDI observations. Year(s): 2019 | 87.8 | 66.7 | 89 | 0.75 | x | x | x |
| 17 | PALSAR-2 FNF v2.0.0, 3-class | Visual interpretation of Google Earth imagery within a radius of 40m. Year(s): n.a. | 86 | n.a. | n.a. | n.a. | x | x | x |
| 18 | GLCLU-GLAD | Google Earth imagery and Moderate Resolution Imaging Spectroradiometer (MODIS) time-series data. Year(s): n.a. | 78.35 | 87.36 | 74 | 1.12 | x | x | x |
| 19 | CHM-1m | Sampling from 10% of NEON ALS collection (LiDAR observations) dataset. Year(s): n.a. | 74 | 77 | 78 | 1.14 | x | x | x |
| 20 | ETH | All samples located within 20% of the Sentinel-2 tiles (each 100 × 100 km). Year(s): 2020 | x | x | x | x | 7,3m | 5,5m | -1,8m |
| 21 | GFCC30TCC v4 | Sampling from 250-m MODIS VCF Tree Cover layer. Year(s): 2000-2005 (5-year dataset) | x | x | x | x | 16,83% | 13,16% | -6% |
(a) They do not provide PA and UA for the entire globe, only for certain places such as California, Costa Rica, Belgium and Laos. (b) They only provide validation based on forest loss (L) and forest gain (G).
Disclaimer/Publisher’s Note: The statements, opinions and data contained in all publications are solely those of the individual author(s) and contributor(s) and not of MDPI and/or the editor(s). MDPI and/or the editor(s) disclaim responsibility for any injury to people or property resulting from any ideas, methods, instructions or products referred to in the content. |
© 2025 by the authors. Licensee MDPI, Basel, Switzerland. This article is an open access article distributed under the terms and conditions of the Creative Commons Attribution (CC BY) license (http://creativecommons.org/licenses/by/4.0/).
Copyright: This open access article is published under a Creative Commons CC BY 4.0 license, which permit the free download, distribution, and reuse, provided that the author and preprint are cited in any reuse.


