
Submitted:
14 July 2025
Posted:
16 July 2025
You are already at the latest version
Abstract
The study focuses on the detection of breaking wave crests in the highly dynamic waters of an Antarctic coastal polynya using high-resolution panchromatic satellite imagery. Accurate as-sessment of whitecap coverage is crucial for improving our understanding of the interactions be-tween wave generation, air–sea heat exchange, and sea ice formation in these complex environ-ments. As open-ocean whitecap detection methods are inadequate in coastal polynyas partially covered with frazil ice, we discuss an approach that exploits specific lighting conditions: the alignment of sunlight with the dominant wind direction and low solar elevation. Under such conditions, steep breaking waves cast pronounced shadows, which are used as the primary indi-cator of wave crests, particularly in frazil streak zones. The algorithm is optimized to exploit these conditions and minimize false positives along frazil streaks boundaries. We applied the algorithm to a WorldView-2 image covering different parts of the Terra Nova Bay Polynya (Ross Sea), a dynamic polar coastal zone. This case study demonstrates that the spatial distribu-tion of detected breaking waves is consistent with ice conditions, and wind forcing patterns, while also revealing deviations that point to complex wind-wave-ice interactions. Although quantitative validation of satellite-derived whitecaps coverage wasn’t possible due to the lack of in situ data, the method performs reliably across a range of conditions. Limitations of the pro-posed approach are pointed out and discussed. Finally, the study highlights the risk of misinter-pretation of lower-resolution reflectance data in areas where whitecaps and sea ice coexist at subpixel scales.
Keywords:
Terra Nova Bay Polynya (TNBP)
; high resolution panchromatic image
; WorldView-2 (WV2)
; breaking waves
; frazil streaks
; wave-ice interactions
1. Introduction
Latent heat polynyas, such as Terra Nova Bay (TNB) in the Ross Sea, are sites of intense sea ice production driven by cold katabatic winds descending from the Antarctic continent. The continuous loss of heat from the ocean surface to the cold atmosphere promotes rapid sea ice formation, accompanied by brine rejection, which plays a crucial role in water mass formation and ocean mixing [1,2,3,4]. Dynamic interactions between wind, waves, and ice within these polynyas contribute to substantial ocean-atmosphere heat exchanges, often exceeding 500 W/m² during winter. This enhanced flux can be attributed to the generation of sea foam and spray by wave breaking, which has been shown to significantly increase heat exchange [5,6]. Consequently, this process accelerates ice growth and the associated brine production. At the same time, the presence of ice slows down wave growth and promotes damping of short wind waves, leading to a reduction of wave steepness and thus wave breaking intensity [7]. Overall, ocean–atmosphere heat exchange, sea ice formation and wind-wave processes in polynyas are a result of several mutual interactions that are only poorly understood and not taken into account in models. A better understanding of the spatial extent of sea foam coverage in areas of sea ice formation is a critical prerequisite for formulating better parametrizations of wave breaking in presence of sea ice and thus for improving estimates of ice production and enhancing the performance of spectral wave and weather models.
The foam generated by breaking waves has been shown to modify the spectral properties of the ocean surface, resulting in enhanced reflectance across the visible (VIS), near-infrared (NIR), and shortwave infrared (SWIR) parts of spectrum [8,9]. This facilitates remote detection of whitecaps using optical imagery from photographs, videos (e.g. [10,11,12,13,14]) and satellite radiometers (e.g. [15,16,17]). It has been demonstrated that foam significantly increases the reflectance of the sea surface due to the strong scattering of light by bubble conglomerates, even if the size of individual whitecaps is smaller than the pixel size of the image [8,18]. As a result, the presence of whitecaps not only enables the identification of regions with enhanced wave breaking activity [19], but can also lead to the misinterpretation of satellite reflectance data—particularly at lower spatial resolutions—when used to assess water quality or sea ice concentration [20,21]. Therefore, identifying areas of active wave breaking is crucial not only for improving our understanding of wave dynamics and air-sea interaction processes, but also for ensuring the accurate interpretation of ocean color and sea ice products derived from satellite observations.
In the majority of approaches, whitecaps are detected in high resolution images, acquired from various platforms, using brightness thresholding techniques optimized through analysis of the reflectance contrast between foam and water, often supported by derivative-based metrics [11,13,16,17]. Most existing studies on whitecap detection and their dynamics have focused on ice-free marine environments. In latent heat polynyas, where active sea ice formation occurs, the presence of frazil ice—consisting of small, randomly oriented ice crystals suspended within the upper ocean layer or floating at the surface—increases the overall brightness of the surface [22]. This additional optical signal can mimic or obscure the radiative signatures typically associated with whitecaps. Additionally, the optical contrast between foam and water is reduced under low-light conditions typical of polar regions [23]. Therefore, methods developed and calibrated for open-water conditions may not be directly applicable in ice-affected environments.
To date, the only study that has examined the spatial distribution of whitecaps in a coastal polynya is that of Herman and Bradtke [7], in which energy dissipation due to whitecapping was simulated using a spectral wave model. The model incorporated spatial information on frazil streaks derived from Sentinel-2 satellite data for selected polynya events. The resulting spatial patterns of wave breaking showed a marked reduction in whitecapping associated with the presence of frazil ice. For one of the polynya cases, model-derived whitecap coverage was compared with estimates obtained from high-resolution WorldView-2 imagery. The high degree of agreement between the two highlights the potential of high-resolution satellite observations as a valuable source of data for calibrating and validating wave models in ice-affected regions. Given that the severe winter conditions prevailing in polar regions significantly limit the feasibility of in situ observations, satellite remote sensing serves as a crucial tool for investigating ocean–ice–atmosphere interactions in these environments.
In the earlier study, preliminary results from our method for detecting breaking waves in high-resolution panchromatic imagery were introduced, although the method was applied under a limited range of wave development conditions and without a full discussion of the methodology. Building on this previously applied approach, and motivated by the consistency observed between modelled and satellite-derived whitecap coverage, the present study provides a comprehensive description, rationale, and performance assessment of the detection method under a broader range of conditions. The approach takes advantage of specific lighting conditions—namely, low solar elevation and the alignment of sunlight with the dominant wind direction—which cause steep waves within frazil streaks to cast visible shadows, allowing them to be identified in the imagery. Using additional fragments of the same WorldView-2 (WV2) panchromatic image and multispectral data, this study expands the spatial and environmental context of the analysis, enabling a more comprehensive assessment of the detection algorithm’s performance across varying wind, ice, and fetch conditions. We compare algorithm performance using alternative contrast metrics and evaluate the robustness and limitations of the proposed approach. Finally, we discuss the potential implications of unresolved subpixel-scale wave activity on reflectance values observed at medium spatial resolutions.
2. Materials and Methods
2.1. Area of Interest and the Case Overwiew
The Terra Nova Bay is located in the western Ross Sea, between Cape Washington and the Drygalski Ice Tongue (Figure 1). Satellite observations (e.g. [24,25,26]) reveal that the Terra Nova Bay Polynya exhibits a quasi-periodic behavior throughout the period of freezing (March-October), with a recurring cycle spanning several days. According to various authors, TNBP may cover an area from 1,000 to 8,500 km2 [25,27,28,29]. The opening of the polynya occurs as a result of strong downslope winds which flow into the bay and push sea ice away from the shore. Additionally, during transitional periods, intrusions of warmer and more moist air from the Pacific Ocean contribute to the polynya’s occurrence [30]. The polynya’s size depends on several factors, including wind speed, air temperature, and the thickness and drift patterns of the pack ice beyond its boundaries ([27,31]). The Drygalski Ice Tongue plays a role in maintaining an area of open water by blocking ice drift from the south [32,33,34].
Referring to the polynya driven by katabatic winds as an open water area is not entirely accurate. Wave-induced turbulence enhances frazil ice formation in the upper ocean to depths of tens of meters, contributing to extremely high sea-ice production rates, reaching up to 0.7 meters per day [35]. This ice accumulates in convergence zones between neighbouring Langmuir cells, forming characteristic streaks that are elongated in the direction of the wind [26,28,36]. These streaks can cover more than 70% of the polynya’s surface [28] and significantly impact wave conditions [7].
In the TNBP the combination of strong katabatic forcing, constrained fetch, and active wave-ice interactions establishes a unique regime of sea-ice formation and wave growth and attenuation distinct from more open marine environments. The intense wind forcing generates short, steep waves. Despite the short fetch, significant wave heights of up to 2 meters have been observed during katabatic events [5]. These short-period, high-frequency waves are prone to rapid breaking. The mosaic of open water and grease ice patches leads to a unique pattern of wave growth in which the high-frequency part of the wave energy spectra undergoes alternating dissipation within frazil streaks and re-growth between them [7].
During the polynya event that occurred on September 19, 2019, the average air temperature recorded at the automatic weather station Manuela located on Inexpressible Island (https://amrc.ssec.wisc.edu/aws/, last access: 7 August 2022) was -26.5°C and the wind speed exceeded 30 m/s. The polynya adjacent to the Nansen Ice Sheet (Figure 1a) covered an area of approximately 2,000 km2, and its downwind edge reached a maximum of near 56 km from the ice sheet. The surface of the polynya was covered with ice streaks in 74% [28]. According to wind field simulated by the Antarctic Mesoscale Prediction System (AMPS) [37] a westerly wind persisted over the TNBP attaining speeds over 20 m/s and occasionally peaking at over 35 m/s (Figure 1b). However, at the northernmost, most sheltered edge of the polynya, wind speeds were comparatively lower, ranging from 5 to 15 m/s. Most of the frazil streaks were oriented in a direction similar to that of the wind. The direction of wave propagation was also generally consistent with the direction of the wind measured at Manuela AWS, with a slight deviation of up to 25° north in the northern part of the bay and a deviation of up to 15° south in the southern part (Figure S1). Peak wavelengths increased with fetch from less than 25 to 95 m, but the increase was smaller than expected in analogous conditions in open water, as indicated by Fourier analysis of satellite imagery with 10 m resolution [28]. Additionally, high-resolution WV2 imagery (0.5 m) revealed the presence of shorter wind waves with wavelengths of a few metres, superimposed on the longer dominant wavelengths – presumably as a result of a local re-growth of waves in open water areas between streaks. These shorter wavelengths were manifested by clear modulations of brightness between streaks with a distance between the crests of about 3−4 m (Figure 2a).
2.2. Data
To capture the effects of breaking waves, very high resolution data collected by the WorldView-2 satellite (WV2) on September 19, 2019 at 21:22 UTC (imagery © 2019 Maxar Technologies) were used. During the satellite overpass the Sun illuminated the sea from an altitude of 7.7° and azimuth angle of 54.1° (north east). The satellite operated from an angle of 68.9° above the horizon and an azimuth of 213° (south west).
The WV2 satellite is a push broom scanner, which carries a panchromatic (PAN) sensor and two multispectral (MS1 and MS2) sensors, each recording in four spectral bands in visible and infrared parts of the spectrum (400–1040 nm). We utilized the standard LV2A product (“ortoready standard product”), consisting of geolocated Top-of-the Atmosphere (TOA) radiance resampled to grid of 0.5 m (PAN) or 2 m (multispectral) in UTM projection (EPSG:32758). The panchromatic channel (450−800 nm) has been used to assess the area of breaking waves due to its higher spatial resolution. The analysis was conducted for four subsets of the satellite swath with an area of approximately 50 km2 each. (Figure 1a). Subarea Ca (Figure 2) was used to calibrate the method of breakers detection, the remaining ones were used to assess its limitations and robustness.
For three of the analyzed subsets (excluding Cb), multispectral data were also available. The utility of WorldView-2 spectral profiles for distinguishing between ice and foam is limited by two major factors: the lower spatial resolution of the multispectral channels compared to the panchromatic band, and the temporal offset between acquisitions of different spectral bands. Due to its pushbroom sensor design, WorldView-2 captures each band sequentially, in the following order: Near-Infrared 2 (NIR2), Coastal, Yellow, Red-Edge, Panchromatic, Blue, Green, Red and Near-Infrared 1 (NIR1). The temporal offset between NIR2 and NIR1 is approximately 0.35 seconds [38], which introduces noticeable discrepancies in the appearance and location of short-lived, rapidly evolving features such as whitecaps. These temporal and spatial inconsistencies hinder the reliable use of per-pixel spectral reflectance profiles for differentiating whitecaps from ice. However, the NIR1 (770–895 nm) and NIR2 (860–1040 nm) bands were used as an supplementary information to support the assessment of potential false detections in whitecap identification. Within this spectral range, the reflectance contrast between water and frazil ice is relatively lower than between water and foam, potentially enabling a more reliable distinction between ice-covered and foam-covered surfaces (Figure 2). Accordingly, the detection algorithm (described in Section 2.3) was applied separately to the PAN, NIR1 and NIR2 images. Assuming that the overall spatial distribution of breaking waves remains broadly consistent across spectral bands - thus allowing for spatial pattern comparison - features detected in the PAN image but not in the NIR channels were examined as potential false positives.
To support the identification of potential false alarms, we additionally employed spatial maps of wave propagation direction and the orientation of frazil ice streaks (Figure S1). These maps were derived in a previous study [28] using Sentinel-2 imagery acquired 22 minutes prior to the WV2 acquisition. Given the stable wind and air temperature conditions observed during that day, it can be reasonably assumed that the wave and sea ice conditions (i.e., the mean wave properties, and sizes and location of frazil streaks) were nearly the same over this brief time period. For a detailed description of the image processing methods used to extract directional information from the Sentinel-2 data, the reader is referred to [28].
In parallel, to examine the relationship between the spatial distribution of wave breaking and environmental forcing, we utilized 10-m wind vectors from the Antarctic Mesoscale Prediction System (AMPS) available at https://www.earthsystemgrid.org/project/amps.html [37]. Model outputs from the nested Ross Island domain, with a spatial resolution of 0.89 km, were used. Specifically, 9-hour forecasts initialized at 12:00 UTC and valid at 21:00 UTC were selected, as this forecast hour corresponded most closely with the acquisition time of the WV2 imagery.
2.3. Detection of Potential Breakers—Data Processing Scheme
The satellite data processing scheme consists of several blocks (Figure 3). In the first pre-processing step, the ice sheet area covered by the image and the small iceberg present in subset N, were masked using manual digitization. The digital numbers were then converted into dimensionless reflectance using a standard formula [39]. Due to poor lighting conditions the level of noise over dark water may be relatively high, therefore a bilateral filter was applied to reduce noise and to enhance the difference between dark and bright spots.
The bilateral filter [40] is a non-linear, edge-preserving smoothing filter that generates an output image by combining input values, considering both their geometric proximity and radiometric similarity. To preserve edges, the standard deviation in the intensity domain was set to 0.03, which corresponds to the average value of the local standard deviation of analyzed reflectances outside regions with strong gradients (calculated in windows ranging from 3 × 3 to 9 × 9 pixels). The spatial domain standard deviation was set to 3. The choice of these parameters was based on preliminary experiments that aimed to optimize the visual quality of the processed image, ensuring that noise was significantly reduced without compromising the clarity of important features.
The influence of the atmosphere had not been corrected; however, due to the small area of analysis and the cloudless sky, we assumed that this influence was spatially uniform or at least did not generate patterns that could be confused with breaking waves effects.
As observed in the WV2 image, whitecaps exhibit a strong contrast against the darker water, even when the water reflectance in the panchromatic band is increased by the presence of frazil ice (Figure 2 and ). Steep wave crests in the ice also produce very bright structures in the panchromatic image, often seen as a continuation of whitecaps observed in open water between frazil streaks (e.g. Figure S2 d−f). The lighting conditions also enhance the visibility of these potentially breakers against the background of frazil streaks. Given the dominant eastward direction of wave propagation, the geometry of solar illumination in the analyzed case resulted in the shadowing of the windward slopes of steep waves. The patches of bright pixels with adjacent dark zones repeat their pattern in images from the near-infrared bands, where the reflectance of ice is lower (Figure 2), confirming that they are the result of breaking waves. Consequently, to detect potential breakers in the analyzed image, we first focused on identifying sharp contrasts between neighboring pixels. For this purpose, we used two different measures of reflectance changes calculated in a moving window of 5 × 5 pixels and compared the results. The first measure was a model describing the Haralick’s general curvature (HGC) of a 3D surface proposed by [41] and used by [17] to detect whitecaps from Sentinel-2 MSI multispectral data. Above the ice, only the shadowed slope behind the wave crest provides a dark background, which means Haralick’s model, measuring the overall curvature at a given point, may not sufficiently highlight the boundaries of potential breakers. Therefore, we proposed a directional filter (DF) based on modified Laplacian kernel as the second measure. The kernel (Figure 4) was designed to account only for the reflectance changes between the analyzed pixel and the neighborhood in the directions where shadowing effects were expected, e.g., from 225° to 315° (SW to NW). The filter calculates the sum of the reflectance differences between the analyzed pixel and the eight nearest pixels in the selected direction. The results of the contrast analysis were standardized over each subset separately (standardized values, hereinafter referred to as contrast index) and reclassified. To determine the uncertainty in the estimation of the whitecaps area, we used different thresholds of the contrast index, starting from the right corner of the histogram plot determined by the method proposed by [42]. The choice of the optimal threshold value will be discussed further in Section 3.1. Adjacent pixels classified as sharply contrasted were then grouped into objects (group of pixels connected by side or corner), which were then analyzed in terms of brightness and size for further selection (Figure 3).
Assuming that the effects of wave breaking in open water and frazil ice appear as bright spots in satellite imagery, we subsequently filtered the contrasted objects to retain only those containing bright pixels. To effectively identify these bright pixels, we employed the ISODATA clustering method. In the final step of whitecap detection using PAN images, we selected bright, contrasted objects consisting of at least three pixels. This size criterion was adopted for two reasons. Firstly, it allows for the verification of detection accuracy through visual assessment. Secondly, it enables the determination of the object’s orientation. In the case of detecting breaking waves in images from NIR channels, this criterion was omitted due to the lower spatial resolution.
Objects initially classified as potential breakers were flagged as likely false alarms if their orientation more closely aligned with the wave propagation direction—approximated by the average orientation of frazil streaks in the coastal zone, where direct wave direction data are unavailable (see Figure S1)—rather than being approximately perpendicular to the dominant wave direction, as would be expected for actual breaking wave fronts. We used false alarms fraction to assess results of different variants of the algorithm.
To generate the water–ice mask, the initial ISODATA clustering result—used to separate bright and dark pixels—was further generalized through a series of morphological operations. The ISODATA algorithm effectively classified water pixels as dark, except for whitecaps, which were classified as bright features, along with large portions (though not all) of frazil streaks. Pixels representing ice in shadows cast by steep waves were frequently classified as dark. The generalization process was thus designed to achieve two objectives: (1) to reassign whitecaps embedded in open water to the water class, and (2) to incorporate shadowed areas within frazil streaks into the ice category. This was accomplished through a sequence of shrink and closing operations that detached breaking crests between frazil bands from the ice, reclassified isolated whitecaps surrounded by water as water, and closed shadow gaps along ice edges. Small dark gaps within frazil streaks (up to 5,000 m²) were filled to account for shadowed ice, while larger dark patches were retained as open water trapped between ice bands.
To analyze the spatial distribution of wave breaking, we aggregated the surface area of the identified objects within a regular grid of 200 × 200 m cells, which we snapped to the grid of the wave model used in [7]. Then, we recalculated the fractional whitecap coverage (W) for each grid cell. Ice concentration (A) was calculated consistently using a binary sea ice mask derived from WV2 imagery. Furthermore, a 10-m wind speed value (U10) was assigned to each grid cell, obtained by bilinear interpolation from the AMPS model output. The fetch (X) was calculated for each grid cell as its Euclidean distance from the ice sheet margin. The relationships between whitecap coverage, ice concentration, wind speed, and fetch were then analyzed to evaluate whether the proposed method of identifying breaking wave crests from WV2 imagery produces spatial distributions consistent with the expected environmental forcing within the polynya [7,43]. Additionally, to assess the potential implications of wave-induced surface roughness on satellite reflectance at coarser resolutions, we simulated reflectance at 15 m resolution—corresponding to the panchromatic band of Landsat OLI sensors—by averaging WV2 reflectance data over 30 × 30 pixel windows. For each of these simulated pixels, we also recalculated whitecap fraction and ice concentration, enabling a direct comparison between subpixel-scale dynamics and aggregated reflectance signals.
To perform image processing and visualize maps the Trimble eCognition Developer software, SAGA system and ESRI ArcGIS Pro software were used.
3. Results
3.1. Contrast Analysis and Optimazation of Breakers Detection
In the proposed algorithm, two critical factors must be established to identify the breakers. First, the choice of contrast measure and second, the determination of a threshold value. Once this threshold is exceeded, the contrast will be considered adequate for identifying the breaking wave crests.
The high values of contrast index obtained by both methods facilitate the straightforward identification of foam-covered wave crests in the areas between frazil streaks, as well as narrow, steep wave crests in the ice-covered areas (Figure S2 a-f,h). The differences between the two indices become evident when the slope of the leeward side of the wave in ice is less steep, resulting in a wider area of high reflectance (Figure S2 g,i). This can indicate a non-breaking wave or the lip of a wave curling over. The directional filter has been shown to highlight the crest of such waves more clearly than the Haralick’s general curvature. Additionally, the directional filter is designed to be less sensitive to the gradient of reflectance at the ice-water boundary, which generally runs approximately perpendicular to the wave crests. Conversely, the Haralick’s model emphasises the contrast at the water-ice interface, which can lead to more false alarms (Figure S2 j-l).
Both contrast indices demonstrate unimodal distributions, with the right corner of the histogram plot ranging from 1.0 to 1.5, depending on the index and the consideration of all pixels or separately for water and ice. Therefore, the algorithm performance was tested on several runs with various thresholds of contrast indices, starting with value of 1.0. Regardless of the threshold used, the application of the Haralick’s model to the detection of potential breakers results in the discrimination of more objects than using the directional filter. Their average sizes are comparatively smaller, explaining the minor discrepancies in the total area of the breakers detected by both contrast indices (Figure 5). Fraction of breakers ranged from 5% to less than 0.5% of the total area of the tested subarea (Ca) depending on threshold value, regardless of the contrast measure. However, among objects detected using the Haralick’s model, those which had an orientation similar to the direction of wave propagation and the orientation of frazil streaks (false alarms), consisted of 2.5% up to 17% of the area identified as breakers. In the case of the directional filter, the proportion of false alarms was significantly lower and for thresholds above 3.0 it dropped to less than 0.5%.
The implementation of a bilateral filter to reduce noise in satellite imagery resulted in a decrease in the number of the smallest detected objects. These objects have been observed to significantly increase estimates of whitecap coverage when using the Haralick’s model, particularly at lower threshold values. In contrast, the directional filter demonstrated greater robustness to noise, with substantially smaller differences observed between results obtained with and without prior filtering (Figure 5).
The spatial distribution of whitecap coverage obtained from all algorithm variants tested shows a consistent pattern, with a maximum in the central part of the study area – where open water dominates – and a minimum along the eastern margin, where the ice concentration is highest (Figure S3). The largest discrepancies in whitecap estimates associated with the choice of contrast metric occur near broad frazil ice bands, reflecting an increased likelihood of false detections at the water-ice interface when using the HGC contrast metric. Variations in threshold have a greater effect in regions with higher ice cover (Figure S3), where smaller differences in pixel brightness within frazil zones (Figure S2) reduce detection sensitivity.
For subsequent analyses, the algorithm variant that combined pre-filtered reflectance data with a directional contrast filter was selected as optimal in regards of false alarm minimization. A contrast threshold of 3.0 was used. At this threshold, the detected breaking crest shapes and extents showed high agreement with those detected using the NIR channels (see Figure S4 with NIR2 example). However, the lower resolution of the NIR channel resulted in a systematic overestimation of the total whitecap coverage (1.35%) compared to the panchromatic data (near 1.00%). This overestimation was consistent across the study area, but more pronounced in regions of lower ice concentration (Figure S3). It should be noted, that visual inspection of areas with clearly identifiable whitecaps confirmed that both contrast indices captured the main breaking crests, despite differences in their detected area, continuity and precise location. However, the HGC contrast metric generated a noticeably higher number of false alarms (Figure 6), only some of which could be filtered out using a priori knowledge of the wave propagation direction. Remaining misclassifications typically occurred along irregular ice–water boundaries, particularly where frazil streaks were interrupted or on the opposite side of wave shadows, where brightness gradients resemble those produced by foam (Figure S5). This tendency results in a general overestimation of whitecap coverage in open-water regions (A < 15%) compared to the directional filter and frequently leads to overestimation also in partially ice-covered waters (A up to 50%). In contrast, the directional filter identifies a larger total area of breaking crests within frazil streak zones (A > 90%), as it is more sensitive to subtle reflectance gradients associated with wave-induced surface roughness.
3.2. Assessing Wave Breaking in Varying Ice Conditions: Method Outcomes and Its Limitations
As expected, inverse correlation between whitecap fraction and the presence of sea ice was consistently observed in all subregions to which the detection algorithm was applied. In three of the four subregions analyzed – Ca, Cb and S – the Pearson correlation coefficients ranged from -0.72 to -0.83, indicating a strong negative relationship between the extent of wave breaking (W) and the ice concentration (A). The only significant outliers from this relationship were identified in the northernmost subregion (N), where the correlation was weaker (-0.60) (Figure 7a). This finding suggests the presence of factors that locally disrupted the expected relationship, which may be attributable to either algorithm performance or natural phenomena.
A detailed examination of the northernmost subarea revealed that the principal outliers occurred within areas dominated by wide frazil ice streaks (A equal to or near 1) and were associated with false detections, resulting in overestimation of W. Two distinct reasons were identified as potential sources of these misclassifications, both associated with changes in image texture. The first involves the presence of ice floes, that were formed by the fragmentation of previously consolidated landfast ice and had been embedded within frazil streaks (Figure 7b). In the panchromatic imagery, these fragments appear with sharp, geometric edges and cast noticeable shadows, indicating their elevation above the surrounding surface. These structural edges create locally contrast, which the algorithm incorrectly interprets as wave breaking signatures. Another, analogous source of false alarms likely stems from morphological transformations of the young ice, such as the formation of pancake ice and/or rafting of pancakes on top of each other. This is supported by the presence of numerous small water-filled gaps within the ice cover, which introduce brightness heterogeneity and increase the likelihood of misclassification (Figure 7c). Due to the large area of ice cover where the image texture change was observed, the misclassified pixels causing local overestimation of the whitecap fraction accounted for approximately 12% of the total area initially classified as breaking wave crests in the northern subarea. These objects were excluded from further analysis.
The second group of outliers corresponds to areas of open water (A close to 0; Figure 7a), where relatively high whitecap fractions would typically be expected. However, in the subarea N, the coastal zone is characterized by markedly low whitecap coverage (W values close to 0). Importantly, these low values do not indicate algorithm underestimation but rather reflect true physical conditions. The discrepancy can be attributed to the sheltering effect of the mountains along the Terra Nova Bay coastline, which naturally slow down wave formation and breaking in this area (Figure S6 and Figure 7c). A similar phenomenon is observed on the leeward side of the offshore iceberg, where reduced wave development similarly leads to reduced whitecap occurrence (Figure 7d). These spatial patterns confirm that the algorithm correctly identifies regions where physical conditions naturally limit the occurrence of breaking waves, even in ice−free water. However, the presence of icebergs may also result in underestimation of whitecap fractions. In the specific illumination conditions of the satellite scene under analysis, pronounced shadows cast by the iceberg on its windward side obscure the sea surface reflectance, thus concealing potential whitecaps in shaded open−water areas from detection. A similar effect may occur locally in the shadowed zones of high waves, where breaking of superimposed shorter waves remains visually undetectable in the imagery.
3.3. Algorithm Robustness with Wind and Fetch Variability
As demonstrated in the preceding section, the algorithm effectively identifies zones of reduced wave activity. To further assess its robustness, we examined whether the resulting patterns of whitecap coverage remain spatially consistent with varying forcing conditions. For a given ice concentration, higher whitecap fractions are more frequently observed in the southern area (S), where the mean wind speed is highest (33.3 m/s; Figure 7a). Although this value is only slightly higher than that recorded in the central subareas Ca and Cb (31.1 m/s and 30.0 m/s, respectively), subarea S is further from the ice sheet margin. This combination of stronger winds and longer fetches is likely to support more developed wave fields, widening the frequency range of waves that undergo breaking and thus leading to a greater whitecapping intensity. In contrast, whitecap fractions in the northern subarea are generally lower than in other regions, particularly when frazil streaks cover more than 20% of the analyzed surface. This can be attributed to both weaker wind speeds (20–25 m/s) and shorter fetches due to proximity to the ice sheet margin.
Interestingly, however, under conditions of low ice concentration, the fraction of open water covered by whitecaps is often higher in the northern subarea (Figure 7 and Figure S6). This apparent inconsistency can be explained by the fact that whitecapping at any given location depends not only on local wind and fetch conditions, but also on the spatial pattern of sea ice and open water in the wider area upwave of that location. In the northern subarea, where, to a first approximation, sea ice concentration increases monotonously from west to east, open water is concentrated in a relatively wide coastal belt, enabling short, steep waves to develop over a distance of a few kilometers without any significant ice influence (Figure 8). In contrast, although the wind is stronger and the fetch is longer in subarea S, open water there occurs within relatively small patches scattered between streaks of frazil ice. As a result, short waves have only limited space to develop, and wave breaking is inhibited. The waves in subarea S have a more swell-like character: they are dominated by longer wavelengths and fewer steep fronts (compare Figure 8 c and d). This results in fewer visible whitecaps per unit area, despite the higher energy input from the wind. These differences highlight how local variations in wave dynamics, together with large-scale ice configuration and fetch geometry, modulate surface roughness and whitecap formation. The successful identification of such nuanced spatial patterns further supports the reliability of the detection algorithm.
As an additional evaluation of the detection algorithm's spatial consistency, we analyzed the orientation of individual features identified as breaking wave crests across the sub-regions, distinguishing between those in open water and those in ice-covered areas. (Figure 9). The majority of identified crests were oriented along the north-south axis, which is consistent with the dominant westerly wind forcing in the TNB. However, from the southern (S) to the northern (N) subarea, there is a clear decrease in the frequency of north-south alignment in favor of a northwest-southeast orientation, with crest axes deviating approximately 12.5° west of true north. This shift corresponds to local variations in the wave propagation direction, which is generally close to west-to-east in the central part of the TNBP and gradually veers leftward toward the north. (Figure S1). These observations confirm that the predefined angular range used in the directional filter is sufficiently broad to accommodate spatial variability in crest orientation associated with local changes in wave propagation direction. Therefore, the algorithm effectively captures this variability without requiring additional filtering based on external wave direction data.
3.4. Brightness of Whitecaps—Implications for Lower Resolution Data Interpretation
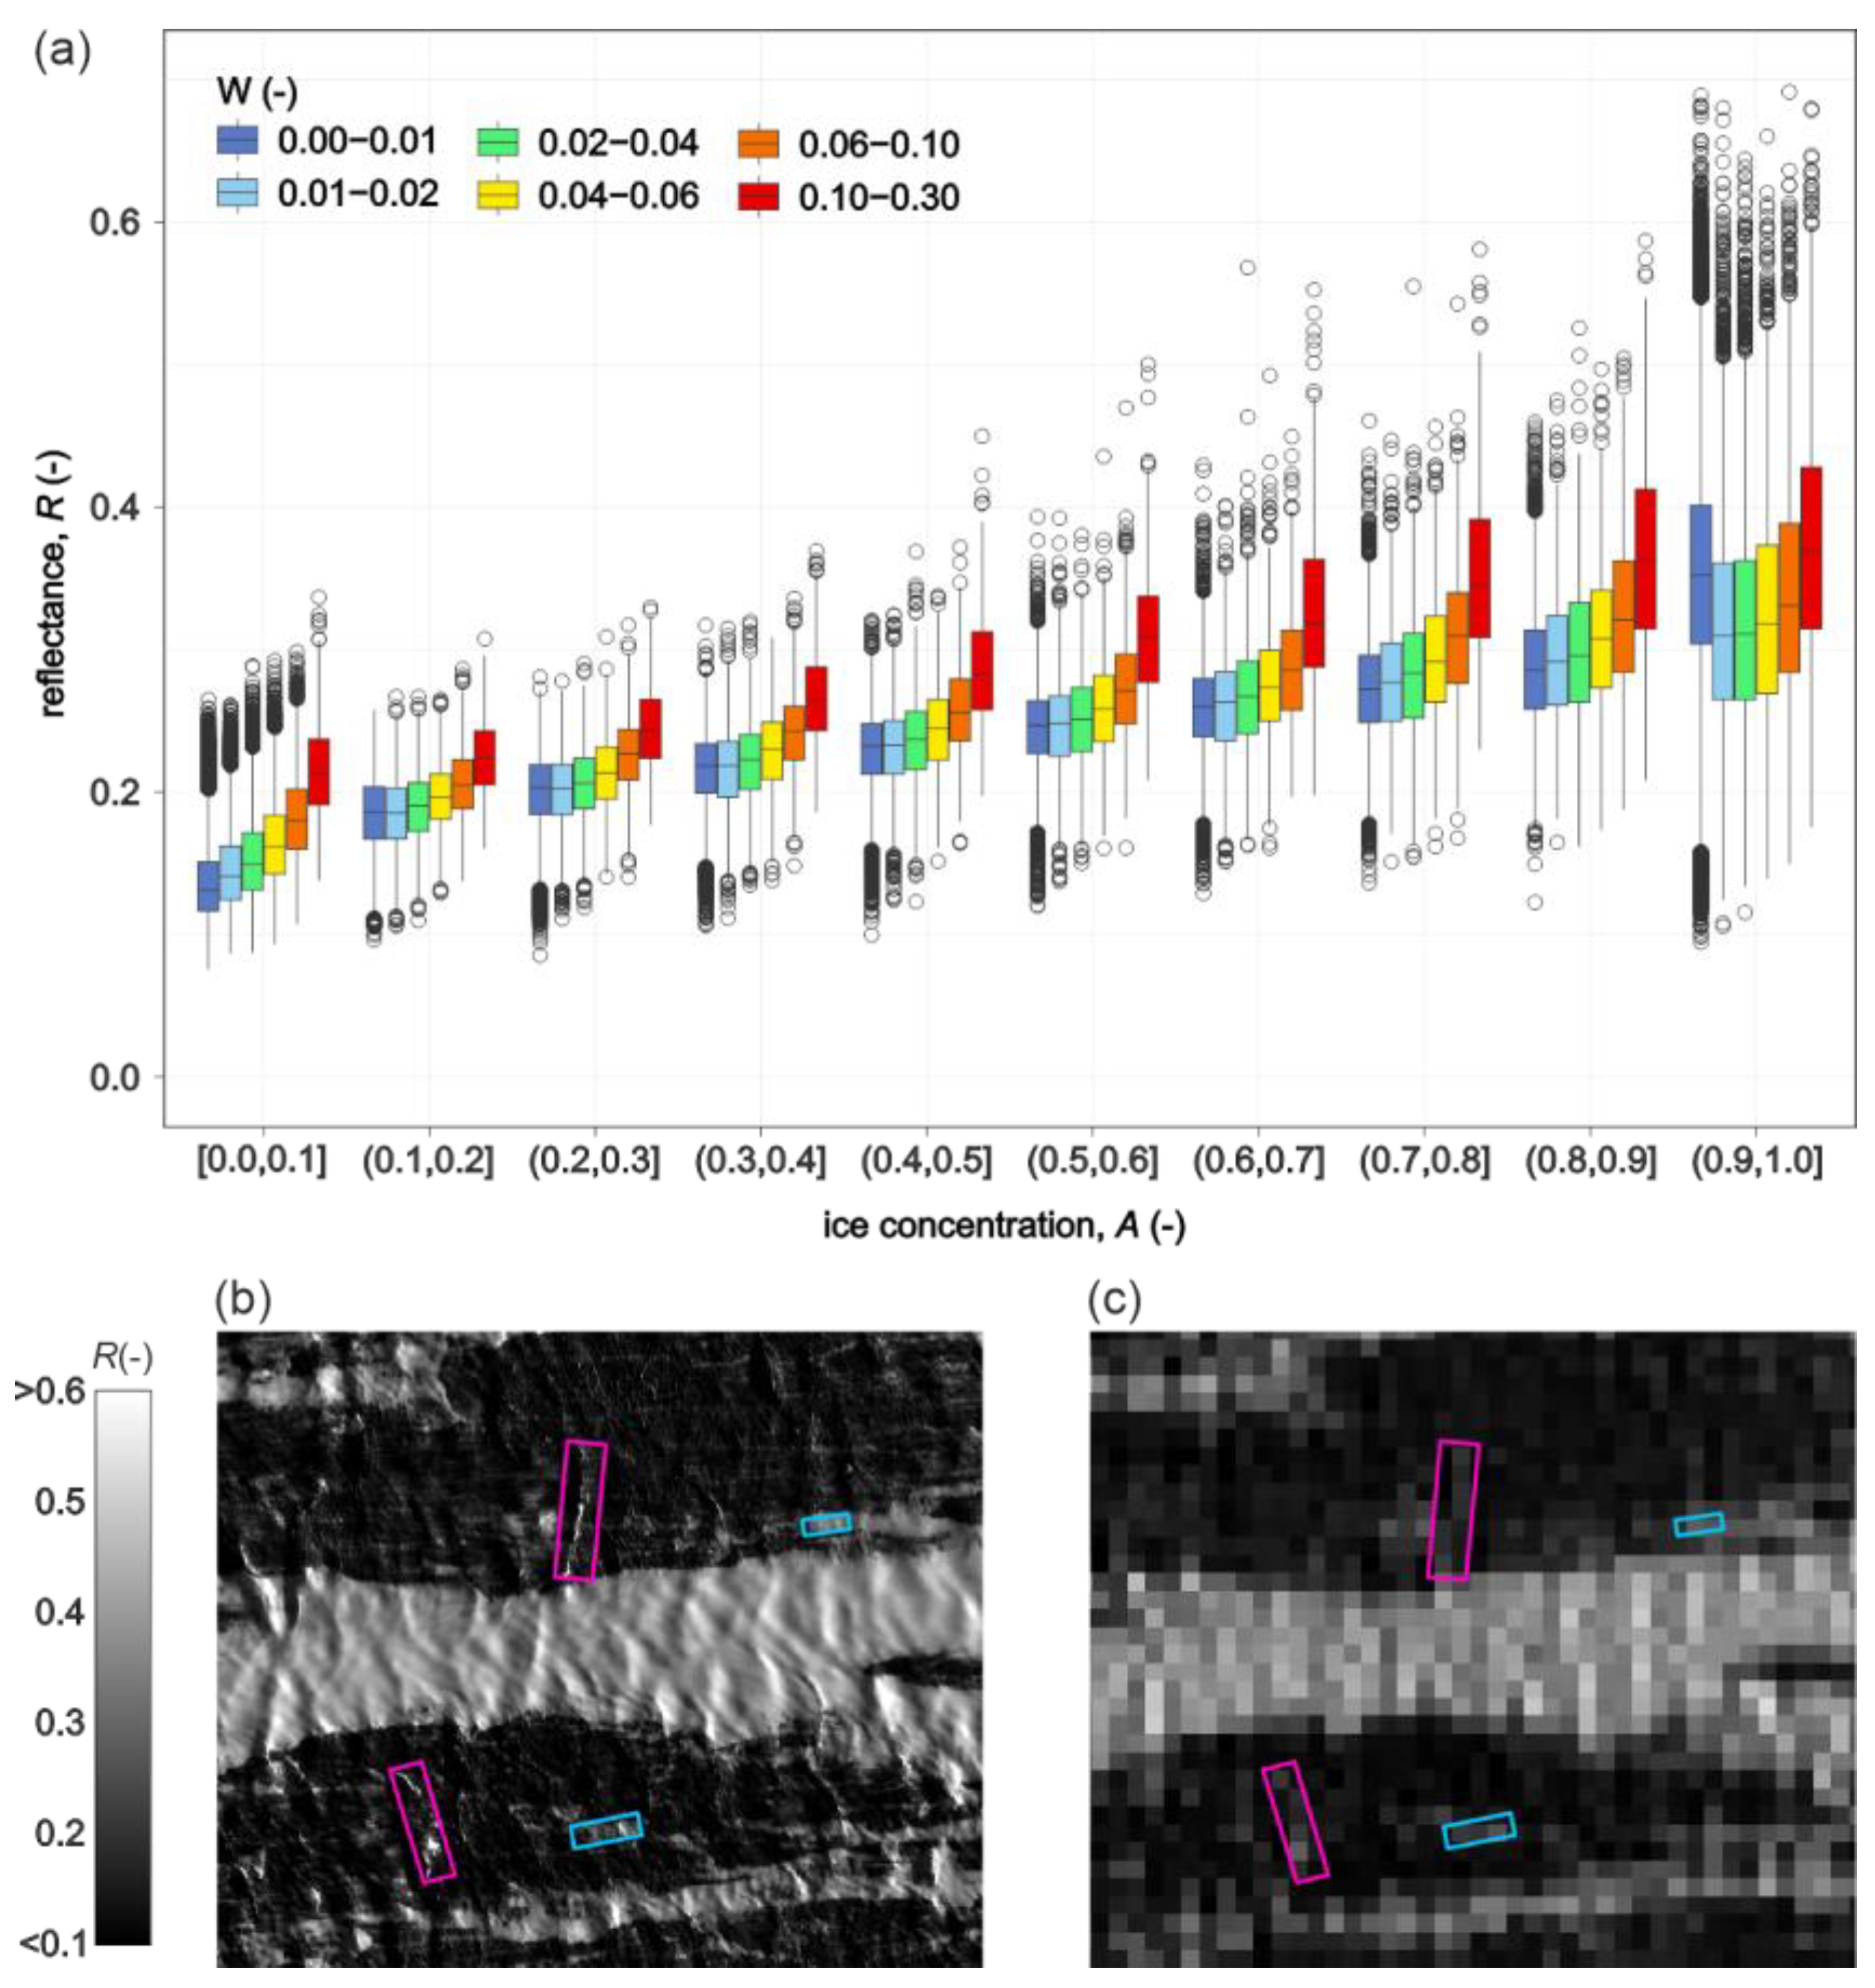
The analysis of reflectance values averaged over simulated low-resolution pixels (15 × 15 m) reveals a clear increase in reflectance with the growing fraction of whitecaps, regardless of frazil streak coverage. However, this increase is most pronounced at low ice concentration (Figure 10a). In the WV2 panchromatic channel , open water without visible frazil streaks is characterized by TOA reflectance values typically ranging from 0.10 to 0.20, decreasing to near 0.05 in shaded areas. These relatively high values may be attributed to the presence of frazil in the water column and atmospheric effects. Whitecaps exhibit much higher reflectance values ranging from approximately 0.4 to nearly 1.0 (see Figure S2). Across most open-water areas, whitecap coverage does not exceed 4% of the 15 × 15 m pixel area, resulting in only a minor increase in mean reflectance—typically around 0.03—compared to adjacent waters without visible wave breaking. However, under certain conditions, the breaking of long waves can locally generate larger whitecap-covered surfaces (W > 0.1), producing a stronger reflectance signal. This localized increase can be comparable to the reflectance enhancement caused by frazil streaks covering approximately 30–40% of the pixel area, when wave-breaking intensity is relatively low (Figure 10).
In pixels partially covered by frazil ice (A in the range of 0.4−0.9)—such as those encompassing narrow frazil streaks or located along the edges of broader ice bands—the whitecap fraction (W) can also locally exceed 0.1. In such cases, the associated increase in reflectance is comparable to that resulting from an increase in the frazil cover alone by 10–20% of the surface area (Figure 10a). This highlights the potential for breaking waves to exert a disproportionately large influence on the optical signature in mixed pixels, particularly when using sensors with spatial resolutions comparable to or coarser than the scale of surface heterogeneity. In regions covered by frazil streaks, the PAN reflectance exhibits a broader range of values compared to open water, primarily due to more pronounced contrasts between sunlit and shaded areas. At native high resolution, reflectance varies from approximately 0.2 to 0.6. Values exceeding 0.6 are observed on wave slopes facing towards the Sun, not only for steep waves that may potentially break but also for those with more gradual slopes, as inferred from smoother changes in reflectance. In these frazil-covered regions, the mean whitecap coverage remains generally low—typically around 1% of the area—so the dominant influence on reflectance stems from the high albedo of the ice surface, partially offset by shadowing effects related to surface roughness. Locally, an increase in whitecap coverage results in the appearance of very bright patches; however, in these cases bright crests are directly adjacent to extended shaded areas on the windward sides of the waves. Because such waves are relatively long, their shadowed portions can occupy a substantial part of the wave surface. As a result, the net effect on reflectance in a lower-resolution pixel may initially be a decrease, followed by a gradual increase as the whitecap fraction continues to grow (Figure 10a).
4. Discussion
This study discusses a method for detecting wave breakers in ice-affected environment and applies it to investigate the spatial variability of wave breaking intensity in a coastal polynya, using high-resolution optical imagery. The use of optical satellite data in polar regions is often constrained by low solar elevation and frequent cloud cover. However, we show that the availability of very high spatial resolution imagery (on the order of tens of centimeters) enables the extraction of valuable information even from single scenes. These snapshots provide unique insights into poorly understood processes such as wave development and wave-ice interactions under conditions of strong wind forcing and limited fetch [7]. Mapping the spatial distribution of whitecaps between frazil ice streaks also facilitates the evaluation of their potential impact on surface reflectance at different spatial resolutions—an important consideration for applications such as the automated detection of frazil ice streaks [28] or the retrieval of bio-optical properties from ocean color data [21].
The proposed detection algorithm takes advantage of specific illumination conditions, i.e. the low solar elevation and the alignment of sunlight with the dominant wave propagation direction. These conditions enhance the visibility of steep wave features through shadowing effects, especially within frazil streaks. Such lighting scenarios are typical for Terra Nova Bay during September and October between 19:00 and 22:00 UTC, when visible-light imaging becomes feasible while winter conditions persist and the polynya remains intermittently open. The algorithm employs a directional filter to derive a contrast index, specifically designed to minimize false detections of frazil ice at streak boundaries being misclassified as breaking wave crests. Compared to Haralick's general curvature model, used successfully with Sentinel-2 data for ice-free conditions [17], the proposed filter demonstrates improved robustness and reduced sensitivity to image noise. When using the HGC-based contrast index, the number of false detections along frazil streak boundaries is considerably higher, requiring additional object filtering based on a priori knowledge of wave propagation direction. However, even with wave direction constraints applied, such filtering does not fully eliminate false positives—especially in areas where frazil streaks are discontinuous or have irregular boundaries. In contrast, the directional filter inherently accounts for the dominant wave direction, which simplifies the overall detection process and reduces the need for post-processing.
Empirical relationships between whitecap coverage and wind speed reported by numerous researches (see reviews in [44,45]) suggest that under very strong winds—approaching 30 m/s, as observed during the analyzed TNBP event—whitecap coverage (W) would range from 1% to nearly 100%, typically exceeding 10%. However, our results indicate W values below 4% (see Figure 7 and Figure 8), with local increases up to 30% (Figure 10a) in limited areas. This discrepancy likely results from regional factors unique to coastal polynyas, which differ significantly from conditions in the open ocean or other coastal zones. First, the formation of frazil ice in the water column increases effective viscosity. Second, the fetch in TNB is severely constrained by the coastal topography and the presence of sea ice. These two factors jointly limit wave development and breaking intensity, even under strong wind forcing. These findings are supported by previous observations [28] and are consistent with results from spectral wave model simulations that incorporate observed frazil coverage and are tailored to the same polynya event [7].
A comparison between the spatial distribution of whitecap fraction derived from satellite imagery and that obtained from model simulations (see Figure S5 in Supplementary materials for [7]) reveals generally consistent patterns. Some discrepancies remain, however, and given the limited understanding of wave breaking physics in both ice-free and ice-affected conditions, it is reasonable to assume that these discrepancies can be attributed both to the limitations of the algorithm developed in this work, and to the limitations of whitecapping parameterizations used in models. It must be also noted that the whitecap fraction cannot be directly obtained from the results of spectral wave model outputs—it is estimated from the simulated wave energy dissipation with highly simplified, empirical formulae that introduce additional uncertainty to the analysis [7]. On the remote sensing side, the accuracy of satellite-derived whitecap fraction depends on the chosen contrast measure and threshold value.
Sensitivity analysis within the testing subarea (Ca) shows that threshold values between 2 and 3 effectively identify the same prominent wave crests (also visible in the NIR bands). Lowering the threshold leads to a widening of detected crest areas, approximately doubling the total breaker coverage, while introducing only a moderate increase in misclassifications of features that deviate from the direction of the wave crest. The lack of reliable validation data for whitecap fraction under ice-affected conditions limits our ability to adequately calibrate the proposed algorithm. For this reason, no calibration of the proposed algorithm against model outputs, or vice versa, was performed; instead, the comparison was used solely to evaluate the plausibility of spatial patterns in both datasets.
It should also be noted that the proposed algorithm tends to underestimate whitecap coverage in open water and may overestimate it within frazil ice bands. In open water, this underestimation stems from the algorithm’s limited ability to detect whitecaps that form on short waves obscured by adjacent long and steep waves. In such cases, insufficient illumination in shaded areas of dark water prevents these features from being detected. Additionally, the imposed minimum object size (requiring at least three contiguous pixels to be classified as a potential breaker) may lead to underdetection in areas of open-water dominated by short waves. Conversely, in wide frazil streaks, the algorithm may overstate whitecap presence, because it identifies all steep wave crests exhibiting strong brightness and associated shadows as breakers, even if they do not correspond to actual breaking events. Furthermore, in areas undergoing ice transformation, where image texture changes abruptly, the algorithm may generate numerous false positives. Such areas should be identified beforehand and excluded from the analysis.
Despite the limitations discussed above, the method reliably captures spatial variability in whitecaps coverage in response to changing environmental conditions. For example, it reflects suppression of wave breaking with increasing frazil ice concentration, and a general increase in breaker activity with stronger wind forcing and longer fetch. The satellite-derived whitecap patterns also reveal less intuitive phenomena, such as intensified breaker activity in the northern subarea, where relatively weaker winds act over shorter distances (Figure 8 and Figure S6). This pattern is also present in model outputs [7] and highlights the significant role of frazil ice distribution and fetch geometry in modulating wave dynamics. Additionally, thanks to the high spatial resolution of the WorldView-2 imagery (0.5-2.0 m), the proposed method allows for the identification of localized effects, such as wind sheltering by icebergs or coastal topography, on breaker distribution. These factors typically remain unresolved in simulations based on wind fields derived from coarser-resolution atmospheric models such as AMPS. Collectively, these observations underscore the complexity of wave–ice interactions in coastal polynyas and demonstrate that whitecap coverage (W) cannot be adequately parameterized as a simple function of wind speed alone. Instead, W in ice-affected environments depends on a combination of factors, including frazil ice concentration, fetch geometry, wave directionality, and small-scale topographic effects. This highlights the need for more sophisticated approaches when representing whitecapping processes in such regions.
In ice-free oceanic waters, the reflectance of fresh whitecaps can exceed that of the background sea surface by up to an order of magnitude in the visible spectrum [8,9,20]. This necessitates correction when reflectance is used, for example, to estimate biological productivity or derive surface properties. Similar optical effects must be considered in ice-affected environments such as coastal polynyas, where both sea ice and whitecaps co-exist and contribute to the observed signal. An analysis of reflectance values averaged over aggregated pixel sizes comparable to the spatial resolution of sensors like Landsat or Sentinel-2 reveals a consistent increase in mean reflectance with rising whitecap fraction, regardless of frazil coverage. Importantly, pixels partially covered by frazil ice and exhibiting elevated local whitecap fraction (W > 0.1) show reflectance levels comparable to those observed for a 10–20% increase in ice coverage alone. As a result, pixels with limited ice cover but substantial whitecap presence may display reflectance values indistinguishable from those of genuinely ice-covered areas, thereby complicating automated sea ice classification. This is particularly relevant for algorithms that rely solely on broadband reflectance thresholds or unsupervised clustering, as they may produce false positives and introduce spatial biases in ice extent estimates or frazil streak tracking.
In summary, the results presented in this study confirm the utility of the proposed detection algorithm for mapping spatial variations in whitecap coverage under complex, ice-affected conditions, despite certain limitations and the absence of precise uncertainty estimates. The observed patterns, consistent with expected responses to changes in wind forcing, ice concentration, and fetch, support the robustness of the method. Although the algorithm was developed and tested using a single satellite scene acquired under specific illumination conditions, such conditions recur daily during the late winter period in Terra Nova Bay, making more systematic analyses feasible. This opens opportunities for investigating the dependence of whitecap coverage on multiple environmental factors, which may lead to improved parameterizations in spectral wave models [7]. The insights gained using proposed algorithm are also likely relevant to other coastal polynyas, where lighting conditions do not support application of presented method. Furthermore, the presented approach could serve as a basis to collect datasets for training more advanced detection algorithms capable of overcoming current limitations, for instance, by inferring the presence of wave breaking features that remain hidden in shadowed regions of the water surface.
Supplementary Materials
The following supporting information can be downloaded at the website of this paper posted on Preprints.org. Figure. S1. Direction of wave propagation at the peak frequency peak and frazil streaks orientation derived from Sentinel-2 satellite data for the polynya event on 19.09.2019, averaged within 5.1 × 5.1 km (512 × 512 pixels) moving windows [7]; Figure. S2. Examples of reflectance variation and contrast index profiles along selected transects across breaking waves and sea ice features; Figure. S3. Spatial distribution of whitecap coverage (W) in subarea Ca, derived from various algorithm configurations using selected threshold values for contrast index. The scenarios differ by source image type (panchromatic or near infrared NIR 2), presence or absence of bilateral filtering, and the applied contrast index: either Haralick's General Curvature (HGC) or directional filter (DF). Whitecap coverage was calculated based on pixel fractions within 200 × 200 m blocks; Figure. S4. Zoomed fragments of WorldView-2 panchromatic image (Imagery ⓒ 2019 Maxar Technologies) illustrating variability in pixel brightness. Detected breaker outlines are marked in red and cyan, based on filtered panchromatic and NIR 2 images respectively, using the directional filter (DF) contrast index and threshold value 3.0. Yellow outlines indicate additional breakers detected only when the PAN image is not prefiltered.; Figure. S5. Comparison of breaker detection results using filtered panchromatic image and both contrast indices with a threshold value 3.0 and additional filtering of objects whose orientation is closely aligned with the wave propagation direction (deviation less than 45°). Figure. S6. Spatial distribution of whitecap coverage (W) (a) and ice concentration (A) (b) across all analyzed subareas. The background shows the Terra Nova Bay Polynya (TNBP) captured in a true color composite from Sentinel-2 imagery acquired on September 19, 2019 at 21:00 (Copernicus Sentinel data 2019). Both whitecap coverage and ice concentration were calculated based on pixel fractions within 200 × 200 m blocks.
Author Contributions
Conceptualization, K.B. and A.H.; methodology, K.B.; formal analysis, K.B and W.B.; writing—original draft preparation, K.B., W.B and A.H.; visualization, K.B. and W.B.; funding acquisition, K.B and A.H. All authors have read and agreed to the published version of the manuscript.
Funding
This research has been financed by the University of Gdansk, Laboratory of Physical Oceanography, DS 531-OA02-D425-23 and by Polish National Science Centre project no. 2022/47/B/ST10/01129 (“Sea ice, waves and turbulence – from laboratory scale to improved large-scale modelling”).
Data Availability Statement
Inquiries regarding the data generated during the study can be directed to the corresponding author.
Conflicts of Interest
The authors declare no conflicts of interest.
References
- Ohshima, K.I.; Fukamachi, Y.; Ito, M.; Nakata, K.; Simizu, D.; Ono, K.; Nomura, D.; Hashida, G.; Tamura, T. Dominant Frazil Ice Production in the Cape Darnley Polynya Leading to Antarctic Bottom Water Formation. Sci. Adv. 2022, 8, eadc9174. [Google Scholar] [CrossRef] [PubMed]
- Nakata, K.; Ohshima, K.I.; Nihashi, S.; Kimura, N.; Tamura, T. Variability and Ice Production Budget in the R Oss I Ce S Helf P Olynya Based on a Simplified Polynya Model and Satellite Observations. J. Geophys. Res. Oceans 2015, 120, 6234–6252. [Google Scholar] [CrossRef]
- Morales Maqueda, M.A.; Willmott, A.J.; Biggs, N.R.T. Polynya Dynamics: A Review of Observations and Modeling. Rev. Geophys. 2004, 42, 2002RG000116. [Google Scholar] [CrossRef]
- Golledge, N.R.; Keller, E.D.; Gossart, A.; Malyarenko, A.; Bahamondes-Dominguez, A.; Krapp, M.; Jendersie, S.; Lowry, D.P.; Alevropoulos-Borrill, A.; Notz, D. Antarctic Coastal Polynyas in the Global Climate System. Nat. Rev. Earth Environ. 2025, 6, 126–139. [Google Scholar] [CrossRef]
- Ackley, S.F.; Stammerjohn, S.; Maksym, T.; Smith, M.; Cassano, J.; Guest, P.; Tison, J.-L.; Delille, B.; Loose, B.; Sedwick, P.; et al. Sea-Ice Production and Air/Ice/Ocean/Biogeochemistry Interactions in the Ross Sea during the PIPERS 2017 Autumn Field Campaign. Ann. Glaciol. 2020, 61, 181–195. [Google Scholar] [CrossRef]
- Guest, P.S. Inside Katabatic Winds Over the Terra Nova Bay Polynya: 2. Dynamic and Thermodynamic Analyses. J. Geophys. Res. Atmospheres 2021, 126, e2021JD034904. [Google Scholar] [CrossRef]
- Herman, A.; Bradtke, K. Fetch-Limited, Strongly Forced Wind Waves in Waters With Frazil and Grease Ice – Spectral Modeling and Satellite Observations in an Antarctic Coastal Polynya. J. Geophys. Res. Oceans 2024, 129, e2023JC020452. [Google Scholar] [CrossRef]
- Koepke, P. Effective Reflectance of Oceanic Whitecaps. Appl. Opt. 1984, 23, 1816. [Google Scholar] [CrossRef] [PubMed]
- Kokhanovsky, A.A. Spectral Reflectance of Whitecaps. J. Geophys. Res. 2004, 109, C05021. [Google Scholar] [CrossRef]
- Stramska, M.; Petelski, T. Observations of Oceanic Whitecaps in the North Polar Waters of the Atlantic. J. Geophys. Res. 2003, 108, 3086. [Google Scholar] [CrossRef]
- Callaghan, A.H.; White, M. Automated Processing of Sea Surface Images for the Determination of Whitecap Coverage. J. Atmospheric Ocean. Technol. 2009, 26, 383–394. [Google Scholar] [CrossRef]
- Bakhoday-Paskyabi, M.; Reuder, J.; Flügge, M. Automated Measurements of Whitecaps on the Ocean Surface from a Buoy-Mounted Camera. Methods Oceanogr. 2016, 17, 14–31. [Google Scholar] [CrossRef]
- Randolph, K.; Dierssen, H.M.; Cifuentes-Lorenzen, A.; Balch, W.M.; Monahan, E.C.; Zappa, C.J.; Drapeau, D.T.; Bowler, B. Novel Methods for Optically Measuring Whitecaps under Natural Wave-Breaking Conditions in the Southern Ocean. J. Atmospheric Ocean. Technol. 2017, 34, 533–554. [Google Scholar] [CrossRef]
- Pivaev, P.; Kudryavtsev, V.; Korinenko, A.; Malinovsky, V. Field Observations of Breaking of Dominant Surface Waves. Remote Sens. 2021, 13, 3321. [Google Scholar] [CrossRef]
- Zhang, H.; Lou, X.; Li, Y.; Shi, A.; Li, D.; Fu, B. Whitecap Features Induced by Submarine Sand Waves in Stereo Optical Imagery. J. Geophys. Res. Oceans 2015, 120, 6225–6233. [Google Scholar] [CrossRef]
- Kubryakov, A.A.; Kudryavtsev, V.N.; Stanichny, S.V. Application of Landsat Imagery for the Investigation of Wave Breaking. Remote Sens. Environ. 2021, 253, 112144. [Google Scholar] [CrossRef]
- Zhao, B.; Lu, Y.; Ding, J.; Jiao, J.; Tian, Q. Discrimination of Oceanic Whitecaps Derived by Sea Surface Wind Using Sentinel-2 MSI Images. J. Geophys. Res. Oceans 2022, 127, e2021JC018208. [Google Scholar] [CrossRef]
- Frouin, R.; Iacobellis, S.F.; Deschamps, P.-Y. Influence of Oceanic Whitecaps on the Global Radiation Budget. Geophys. Res. Lett. 2001, 28, 1523–1526. [Google Scholar] [CrossRef]
- Deike, L. Mass Transfer at the Ocean–Atmosphere Interface: The Role of Wave Breaking, Droplets, and Bubbles. Annu. Rev. Fluid Mech. 2022, 54, 191–224. [Google Scholar] [CrossRef]
- Moore, K.D.; Voss, K.J.; Gordon, H.R. Spectral Reflectance of Whitecaps: Their Contribution to Water-leaving Radiance. J. Geophys. Res. Oceans 2000, 105, 6493–6499. [Google Scholar] [CrossRef]
- Dierssen, H.M. Hyperspectral Measurements, Parameterizations, and Atmospheric Correction of Whitecaps and Foam From Visible to Shortwave Infrared for Ocean Color Remote Sensing. Front. Earth Sci. 2019, 7, 14. [Google Scholar] [CrossRef]
- Perovich, D.K. The Optical Properties of Sea Ice 1996.
- Ma, L.X.; Wang, F.Q.; Wang, C.A.; Wang, C.C.; Tan, J.Y. Investigation of the Spectral Reflectance and Bidirectional Reflectance Distribution Function of Sea Foam Layer by the Monte Carlo Method. Appl. Opt. 2015, 54, 9863. [Google Scholar] [CrossRef] [PubMed]
- Kurtz, D.D.; Bromwich, D.H. A Recurring, Atmospherically Forced Polynya in Terra Nova Bay. In Antarctic Research Series; Jacobs, S., Ed.; American Geophysical Union: Washington, D. C, 1985; Vol. 43, pp. 177–201. ISBN 978-0-87590-196-1. [Google Scholar]
- Aulicino, G.; Sansiviero, M.; Paul, S.; Cesarano, C.; Fusco, G.; Wadhams, P.; Budillon, G. A New Approach for Monitoring the Terra Nova Bay Polynya through MODIS Ice Surface Temperature Imagery and Its Validation during 2010 and 2011 Winter Seasons. Remote Sens. 2018, 10, 366. [Google Scholar] [CrossRef]
- Ciappa, A.; Pietranera, L. High Resolution Observations of the Terra Nova Bay Polynya Using COSMO-SkyMed X-SAR and Other Satellite Imagery. J. Mar. Syst. 2013, 113–114, 42–51. [Google Scholar] [CrossRef]
- Lin, Y.; Yang, Q.; Mazloff, M.; Wu, X.; Tian-Kunze, X.; Kaleschke, L.; Yu, L.; Chen, D. Transiting Consolidated Ice Strongly Influenced Polynya Area during a Shrink Event in Terra Nova Bay in 2013. Commun. Earth Environ. 2023, 4, 54. [Google Scholar] [CrossRef]
- Bradtke, K.; Herman, A. Spatial Characteristics of Frazil Streaks in the Terra Nova Bay Polynya from High-Resolution Visible Satellite Imagery. The Cryosphere 2023, 17, 2073–2094. [Google Scholar] [CrossRef]
- Ciappa, A.; Pietranera, L.; Budillon, G. Observations of the Terra Nova Bay (Antarctica) Polynya by MODIS Ice Surface Temperature Imagery from 2005 to 2010. Remote Sens. Environ. 2012, 119, 158–172. [Google Scholar] [CrossRef]
- Fonseca, R.; Francis, D.; Aulicino, G.; Mattingly, K.S.; Fusco, G.; Budillon, G. Atmospheric Controls on the Terra Nova Bay Polynya Occurrence in Antarctica. Clim. Dyn. 2023, 61, 5147–5169. [Google Scholar] [CrossRef]
- Ding, Y.; Cheng, X.; Li, X.; Shokr, M.; Yuan, J.; Yang, Q.; Hui, F. Specific Relationship between the Surface Air Temperature and the Area of the Terra Nova Bay Polynya, Antarctica. Adv. Atmospheric Sci. 2020, 37, 532–544. [Google Scholar] [CrossRef]
- Bromwich, D.H.; Kurtz, D.D. Katabatic Wind Forcing of the Terra Nova Bay Polynya. J. Geophys. Res. Oceans 1984, 89, 3561–3572. [Google Scholar] [CrossRef]
- Stevens, C.; Sang Lee, W.; Fusco, G.; Yun, S.; Grant, B.; Robinson, N.; Yeon Hwang, C. The Influence of the Drygalski Ice Tongue on the Local Ocean. Ann. Glaciol. 2017, 58, 51–59. [Google Scholar] [CrossRef]
- Van Woert, M.L. Wintertime Dynamics of the Terra Nova Bay Polynya. J. Geophys. Res. Oceans 1999, 104, 7753–7769. [Google Scholar] [CrossRef]
- Thompson, L.; Smith, M.; Thomson, J.; Stammerjohn, S.; Ackley, S.; Loose, B. Frazil Ice Growth and Production during Katabatic Wind Events in the Ross Sea, Antarctica. The Cryosphere 2020, 14, 3329–3347. [Google Scholar] [CrossRef]
- Herman, A.; Dojczman, M.; Świszcz, K. High-Resolution Simulations of Interactions between Surface Ocean Dynamics and Frazil Ice. The Cryosphere 2020, 14, 3707–3729. [Google Scholar] [CrossRef]
- Powers, J.G.; Manning, K.W.; Bromwich, D.H.; Cassano, J.J.; Cayette, A.M. A Decade of Antarctic Science Support Through Amps. Bull. Am. Meteorol. Soc. 2012, 93, 1699–1712. [Google Scholar] [CrossRef]
- Kääb, A.; Leprince, S. Motion Detection Using Near-Simultaneous Satellite Acquisitions. Remote Sens. Environ. 2014, 154, 164–179. [Google Scholar] [CrossRef]
- Updike, T.; Comp, Ch. Radiometric Use of WorldView-2 Imagery. Technical Note 2010.
- Tomasi, C.; Manduchi, R. Bilateral Filtering for Gray and Color Images. In Proceedings of the Sixth International Conference on Computer Vision (IEEE Cat. No.98CH36271); Narosa Publishing House: Bombay, India, 1998; pp. 839–846. [Google Scholar]
- Haralick, R.M. Ridges and Valleys on Digital Images. Comput. Vis. Graph. Image Process. 1983, 22, 28–38. [Google Scholar] [CrossRef]
- Rosin, P.L. Unimodal Thresholding. Pattern Recognit. 2001, 34, 2083–2096. [Google Scholar] [CrossRef]
- Anguelova, M.D.; Hwang, P.A. Using Energy Dissipation Rate to Obtain Active Whitecap Fraction. J. Phys. Oceanogr. 2016, 46, 461–481. [Google Scholar] [CrossRef]
- Anguelova, M.D.; Webster, F. Whitecap Coverage from Satellite Measurements: A First Step toward Modeling the Variability of Oceanic Whitecaps. J. Geophys. Res. 2006, 111, C03017. [Google Scholar] [CrossRef]
- Brumer, S.E.; Zappa, C.J.; Brooks, I.M.; Tamura, H.; Brown, S.M.; Blomquist, B.W.; Fairall, C.W.; Cifuentes-Lorenzen, A. Whitecap Coverage Dependence on Wind and Wave Statistics as Observed during SO GasEx and HiWinGS. J. Phys. Oceanogr. 2017, 47, 2211–2235. [Google Scholar] [CrossRef]
Figure 1.
(a) The Terra Nova Bay Polynya on satellite image (true color composite) gathered by Sentinel-2 on September 19, 2019 at 21:00 (Copernicus Sentinel data 2019); outlines of the analyzed subsets of high resolution data collected by WorldView-2 satellite are marked with the orange rectangles. (b) Wind conditions (direction denoted by arrows) simulated by the Antarctic Mesoscale Prediction System for the polynya event (9-hour forecasts from 12 UTC valid for 21 UTC).
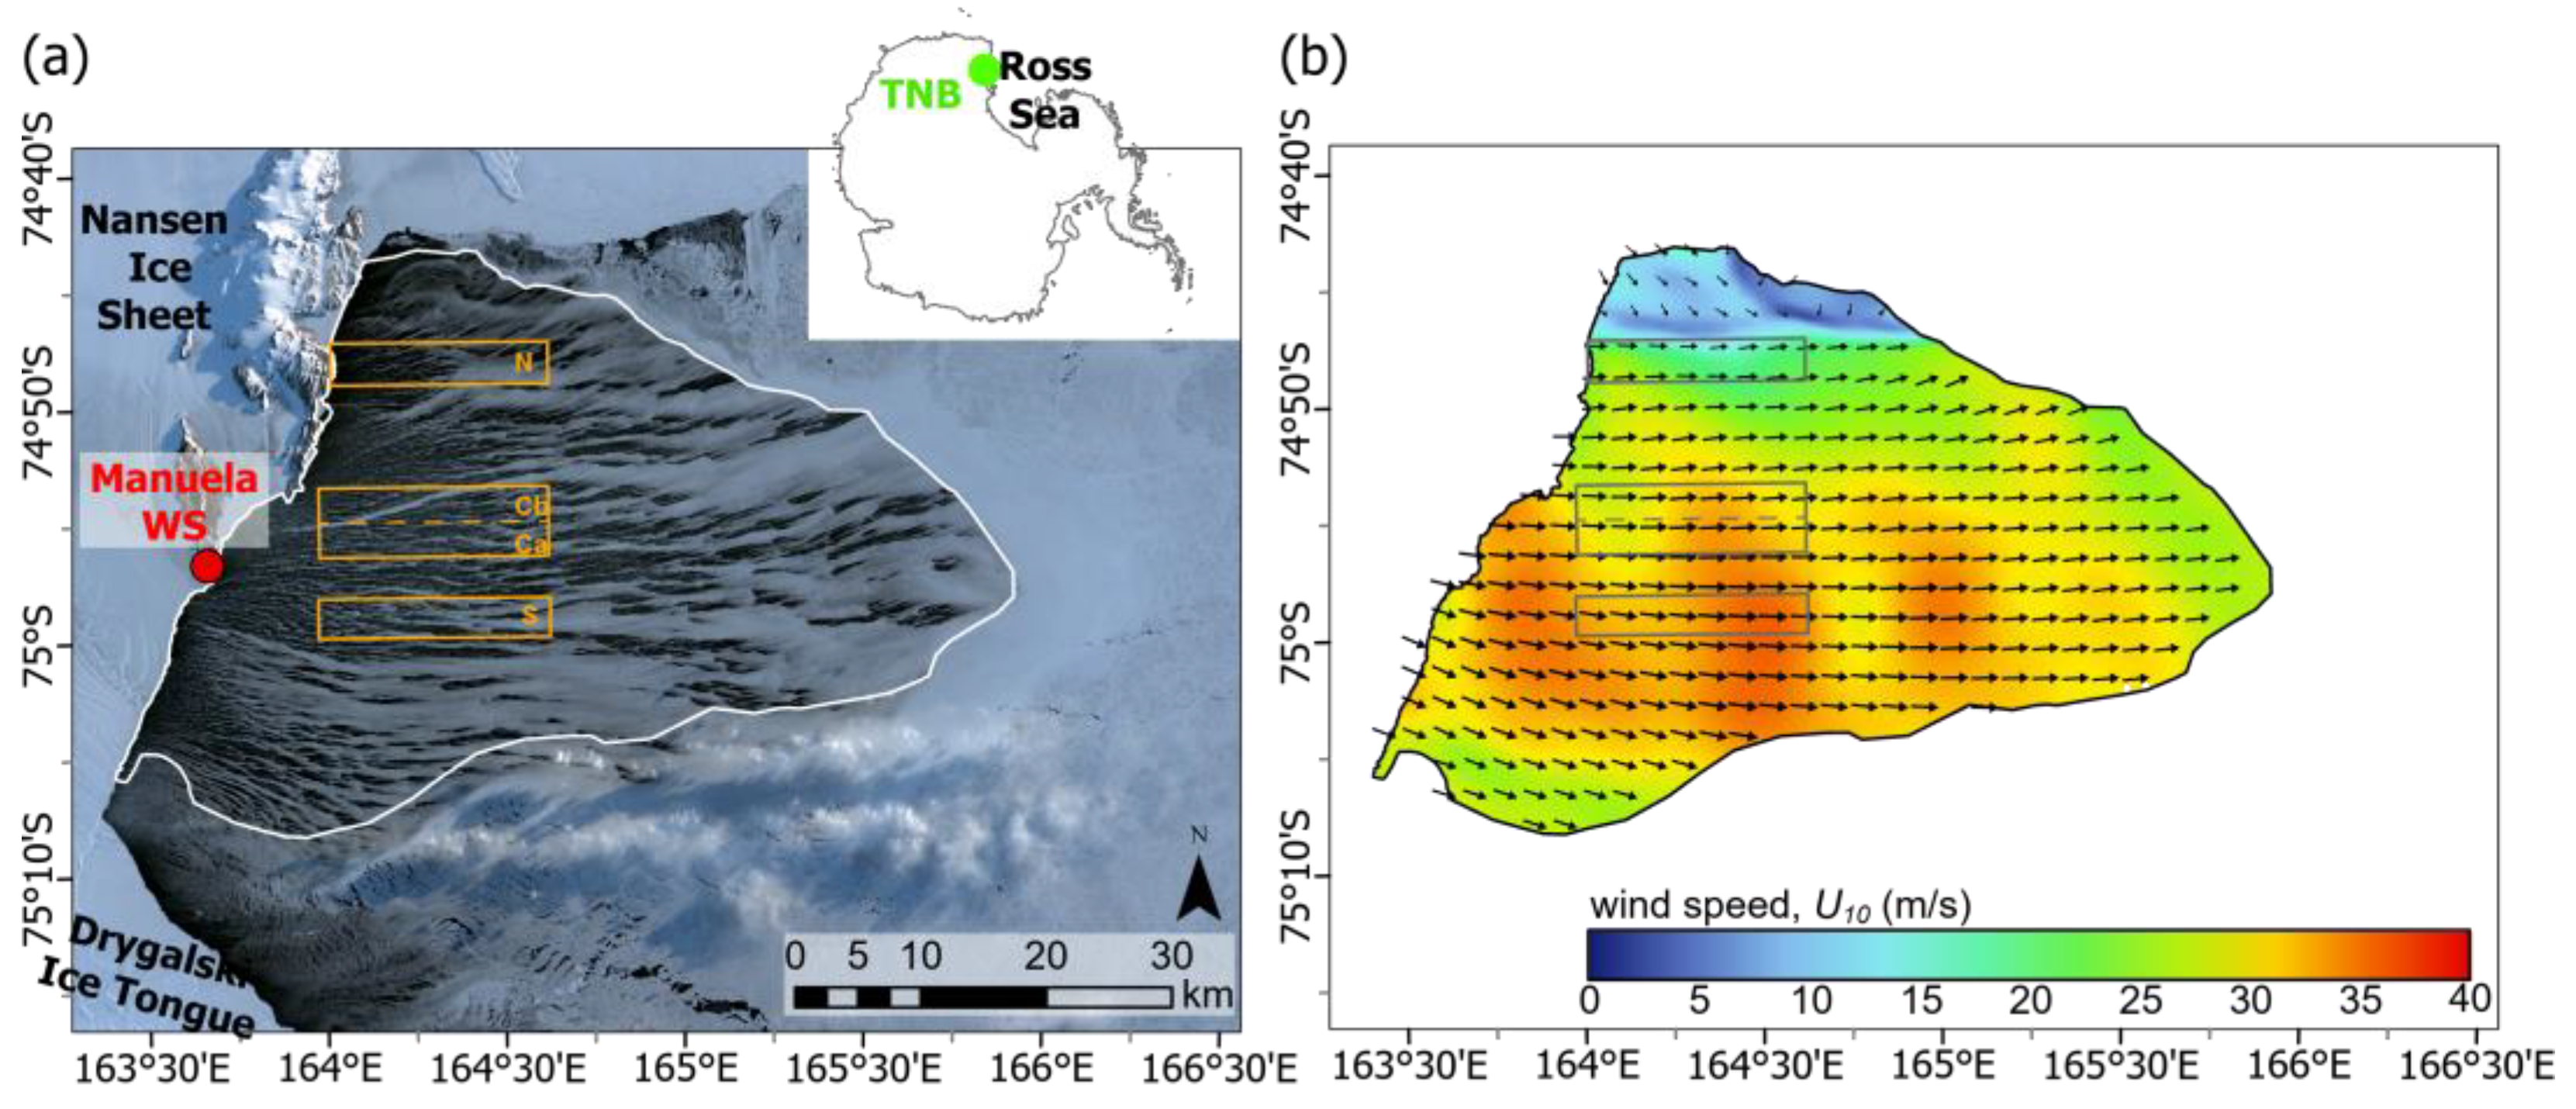
Figure 2.
WorldView-2 images (imagery © 2019 Maxar Technologies) in spectral bands: PAN (a), NIR1 (b) and NIR2 (c) for subset Ca and their enlarged parts.
Figure 2.
WorldView-2 images (imagery © 2019 Maxar Technologies) in spectral bands: PAN (a), NIR1 (b) and NIR2 (c) for subset Ca and their enlarged parts.
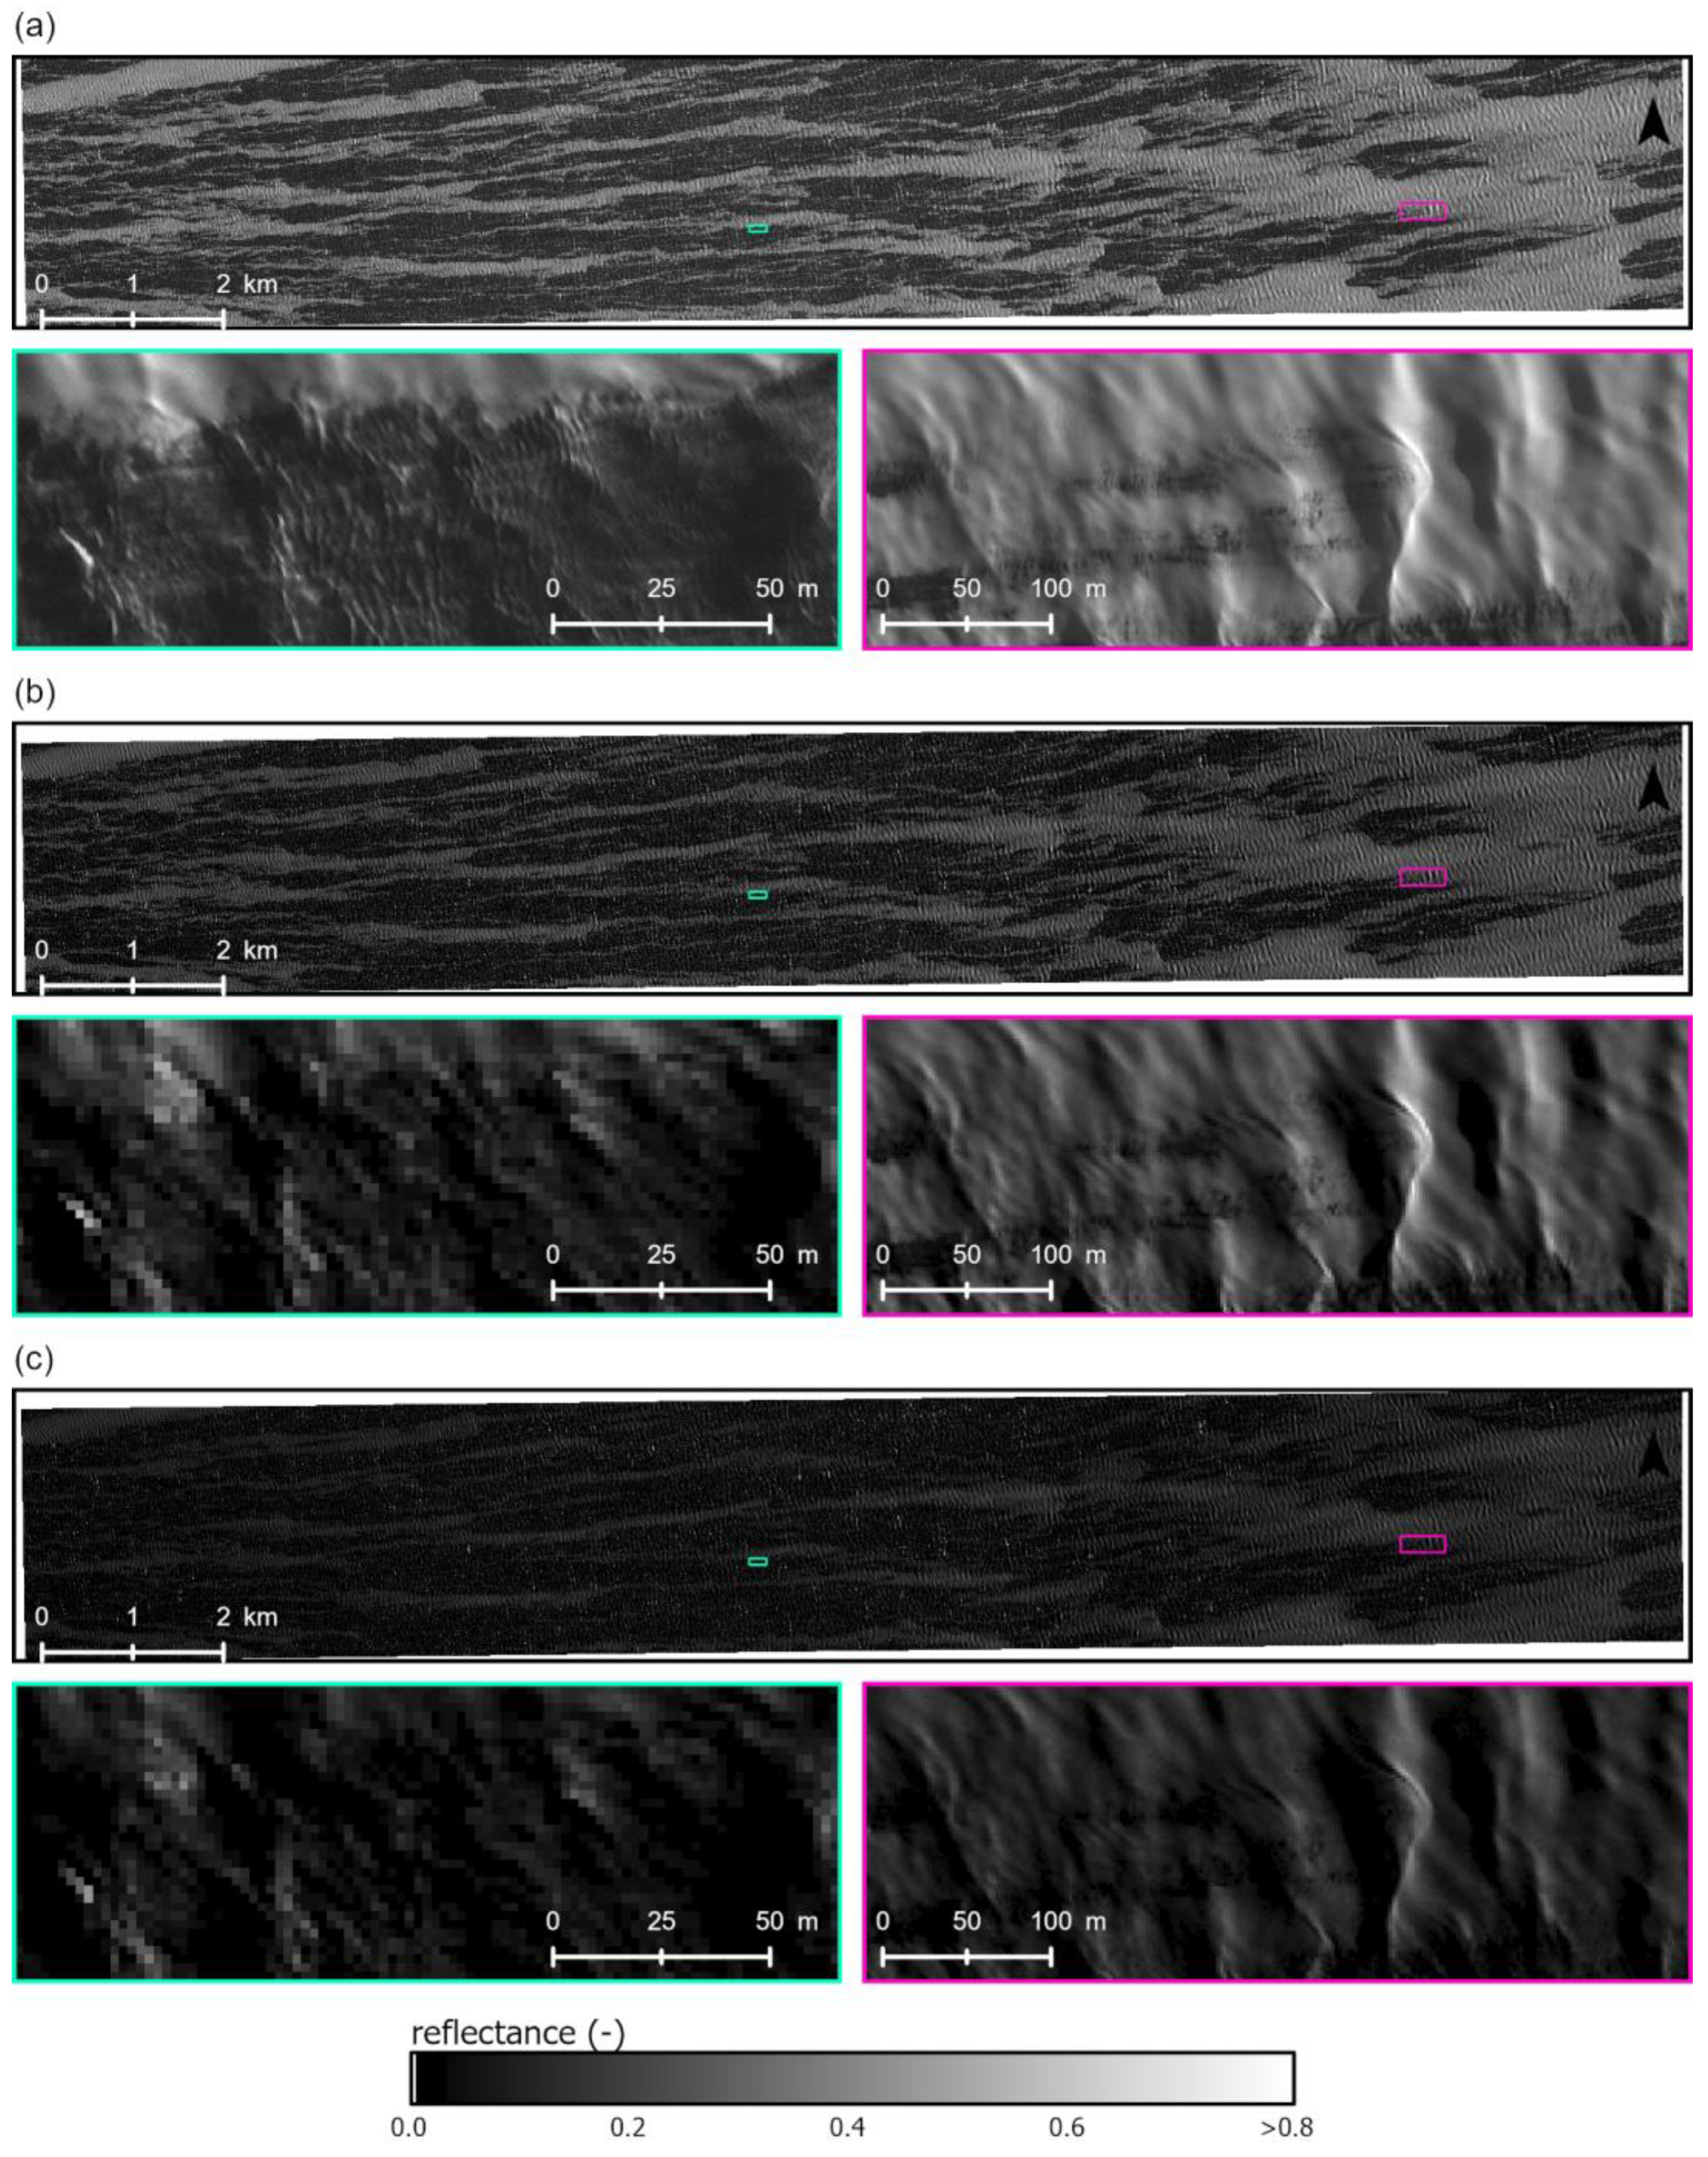
Figure 3.
Overall scheme of WV2 data processing.
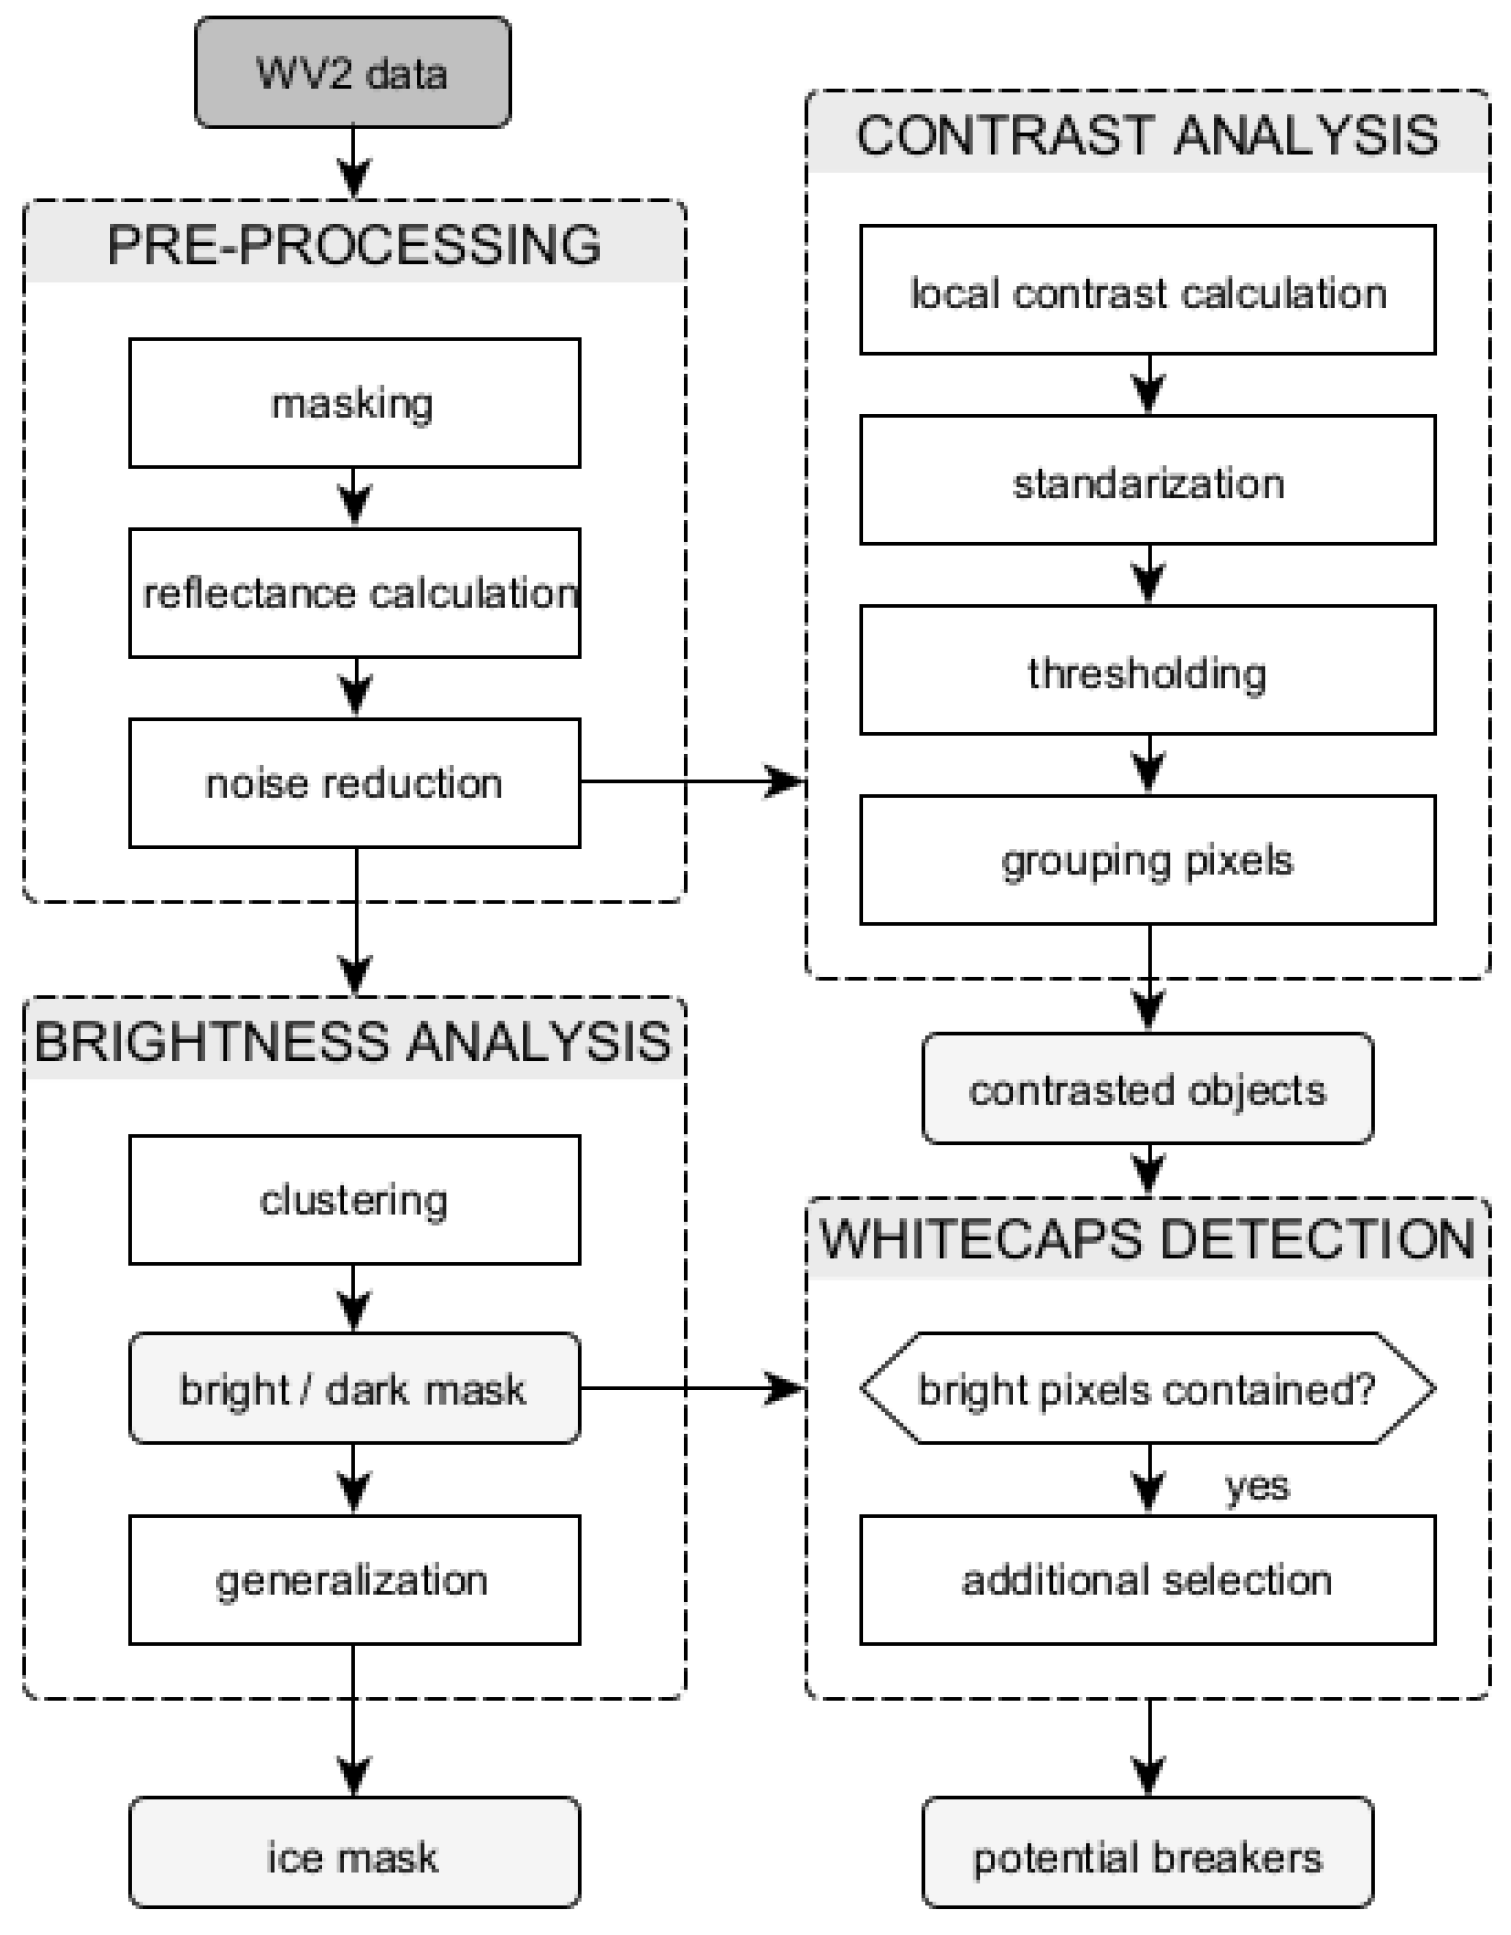
Figure 4.
Kernel of the convolutional filter used to highlight the boundaries of potential breakers using lighting conditions.
Figure 4.
Kernel of the convolutional filter used to highlight the boundaries of potential breakers using lighting conditions.
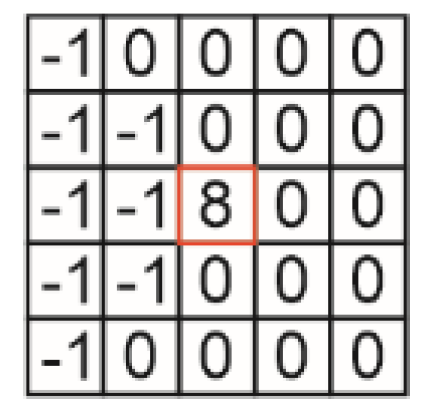
Figure 5.
Characteristics of objects detected as potential breakers using panchromatic image and both measures of contrast with different threshold values. Dashed lines indicate algorithm version without bilateral filtration.
Figure 5.
Characteristics of objects detected as potential breakers using panchromatic image and both measures of contrast with different threshold values. Dashed lines indicate algorithm version without bilateral filtration.
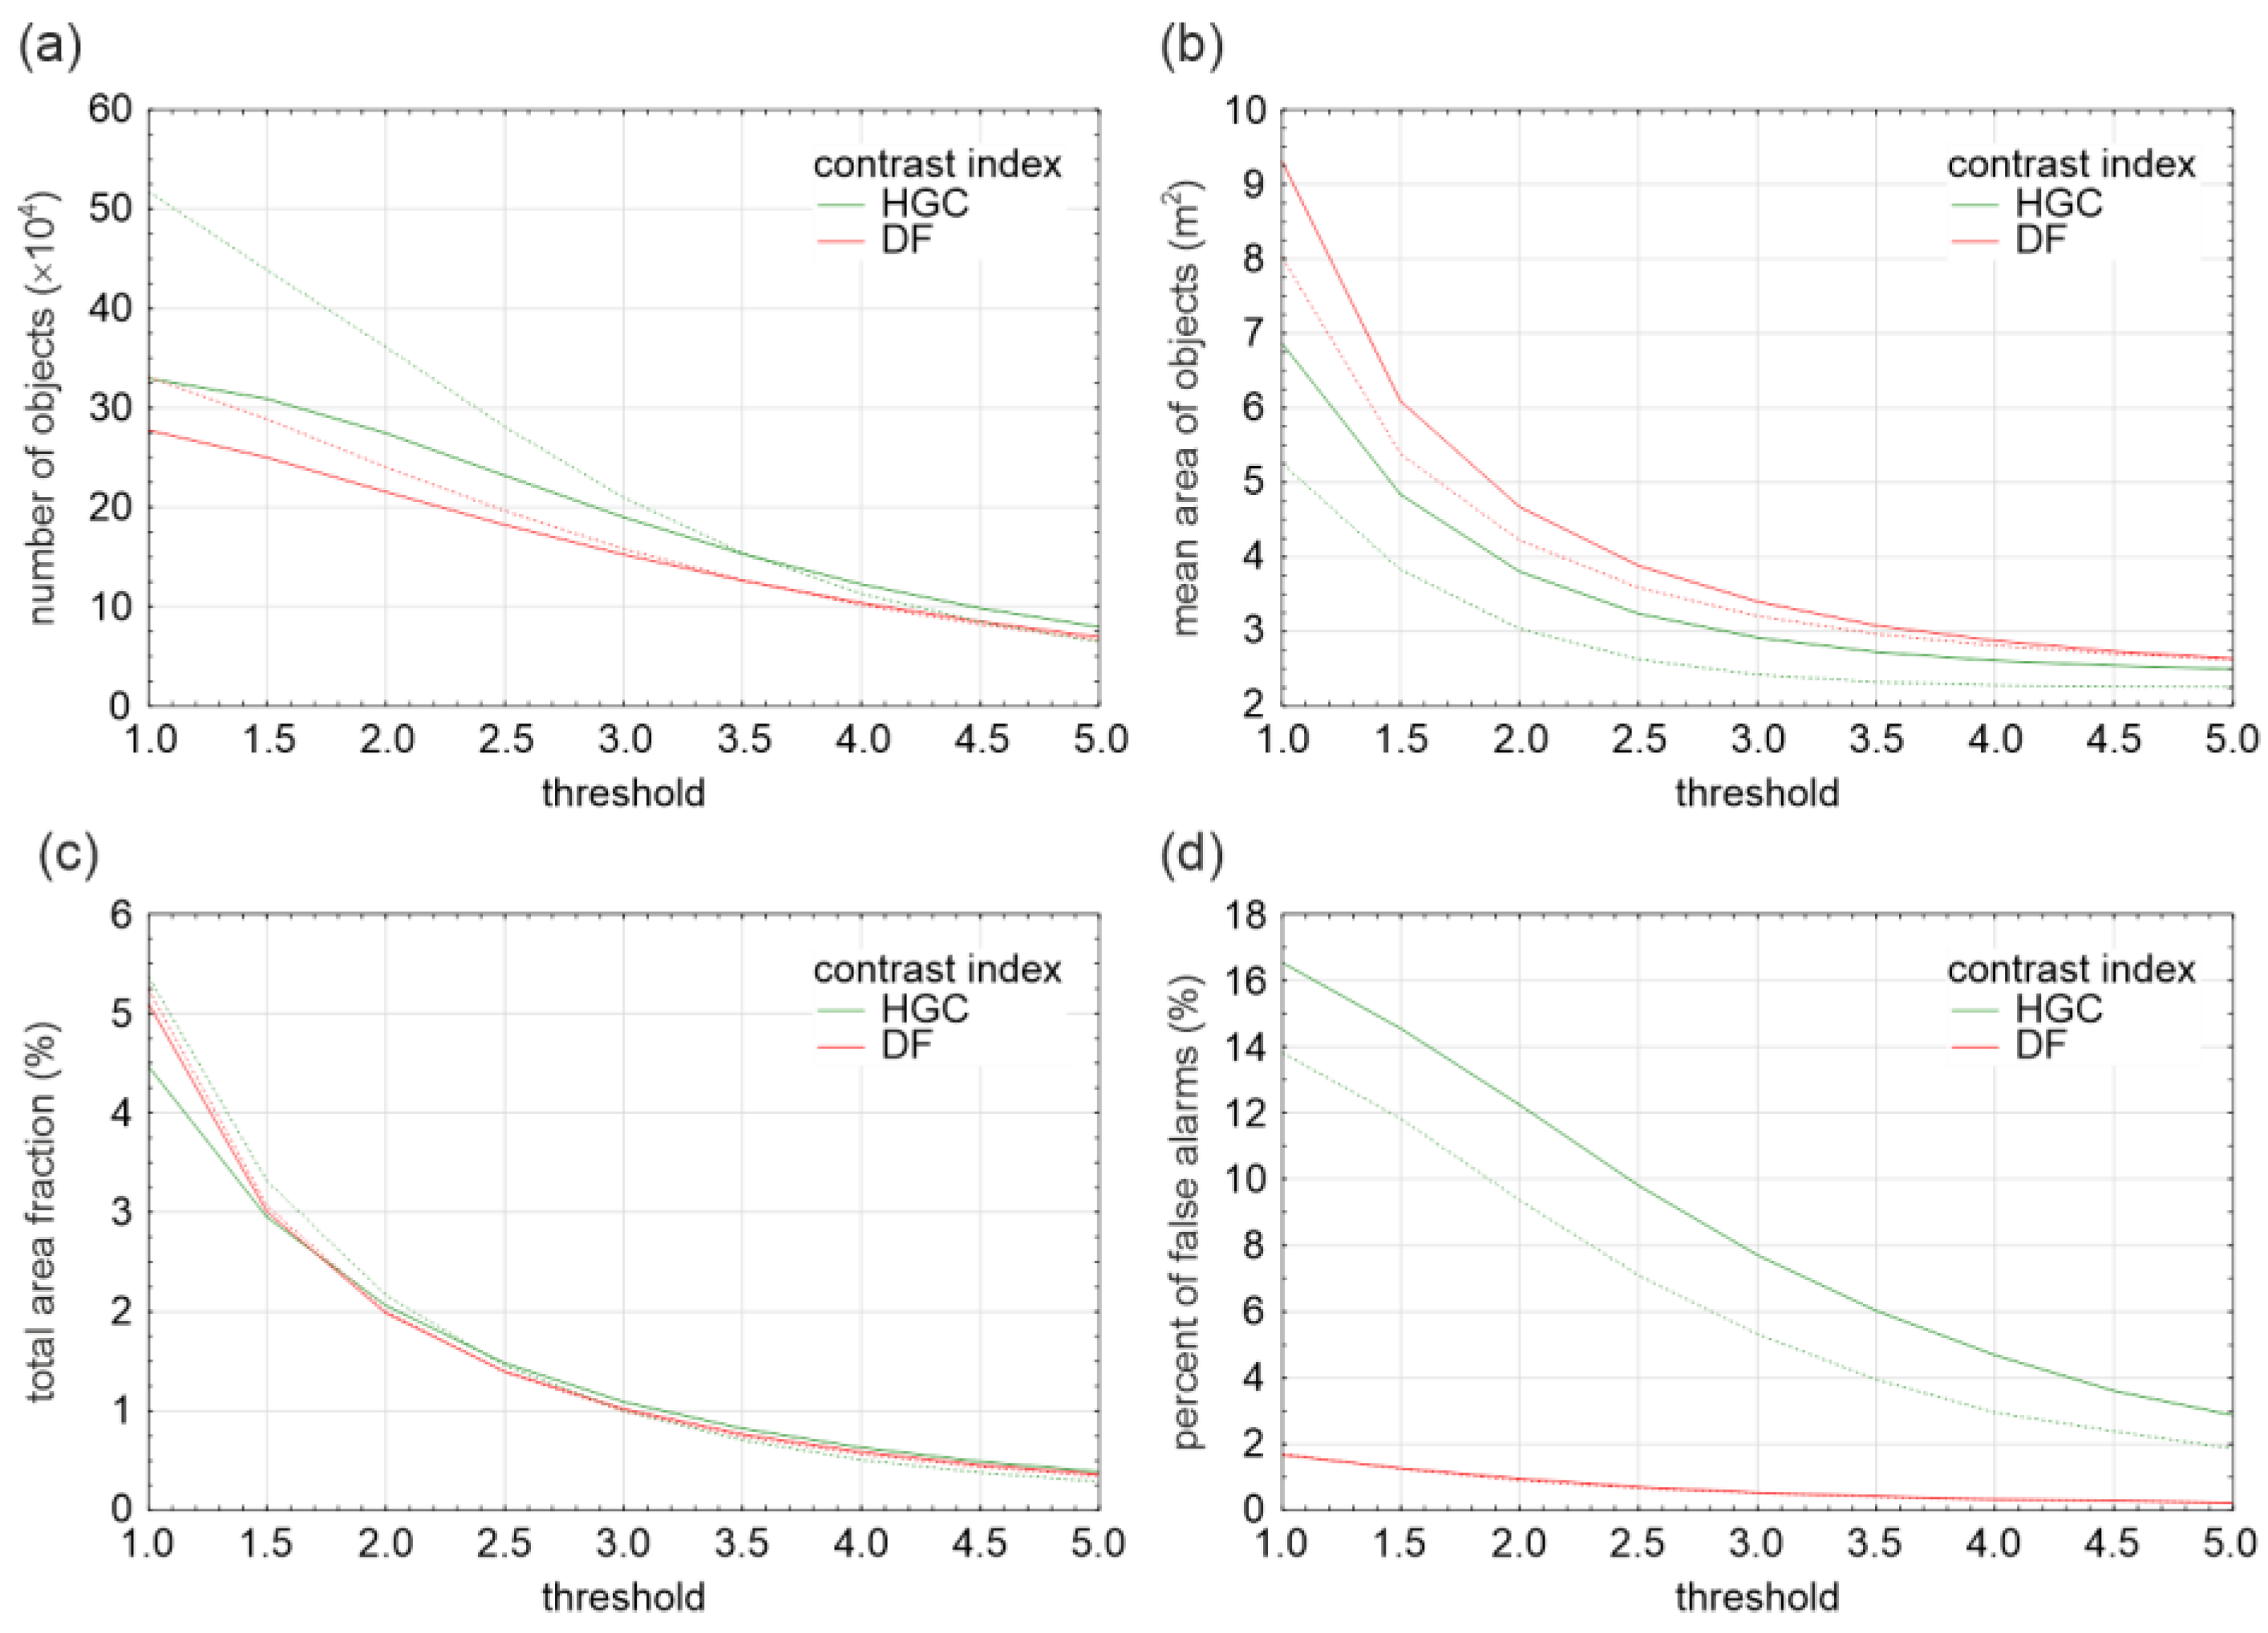
Figure 6.
Relationship between whitecap coverage (W) in 200 × 200 m blocks, derived using both measures of contrast with threshold value 3.0 without (a) and with (b) additional filtration of objects which orientation closely aligned with the wave propagation direction (deviation less than 45°), recognized as false alarms; colors show concentration of ice (A). Dashed lines indicate identity function.
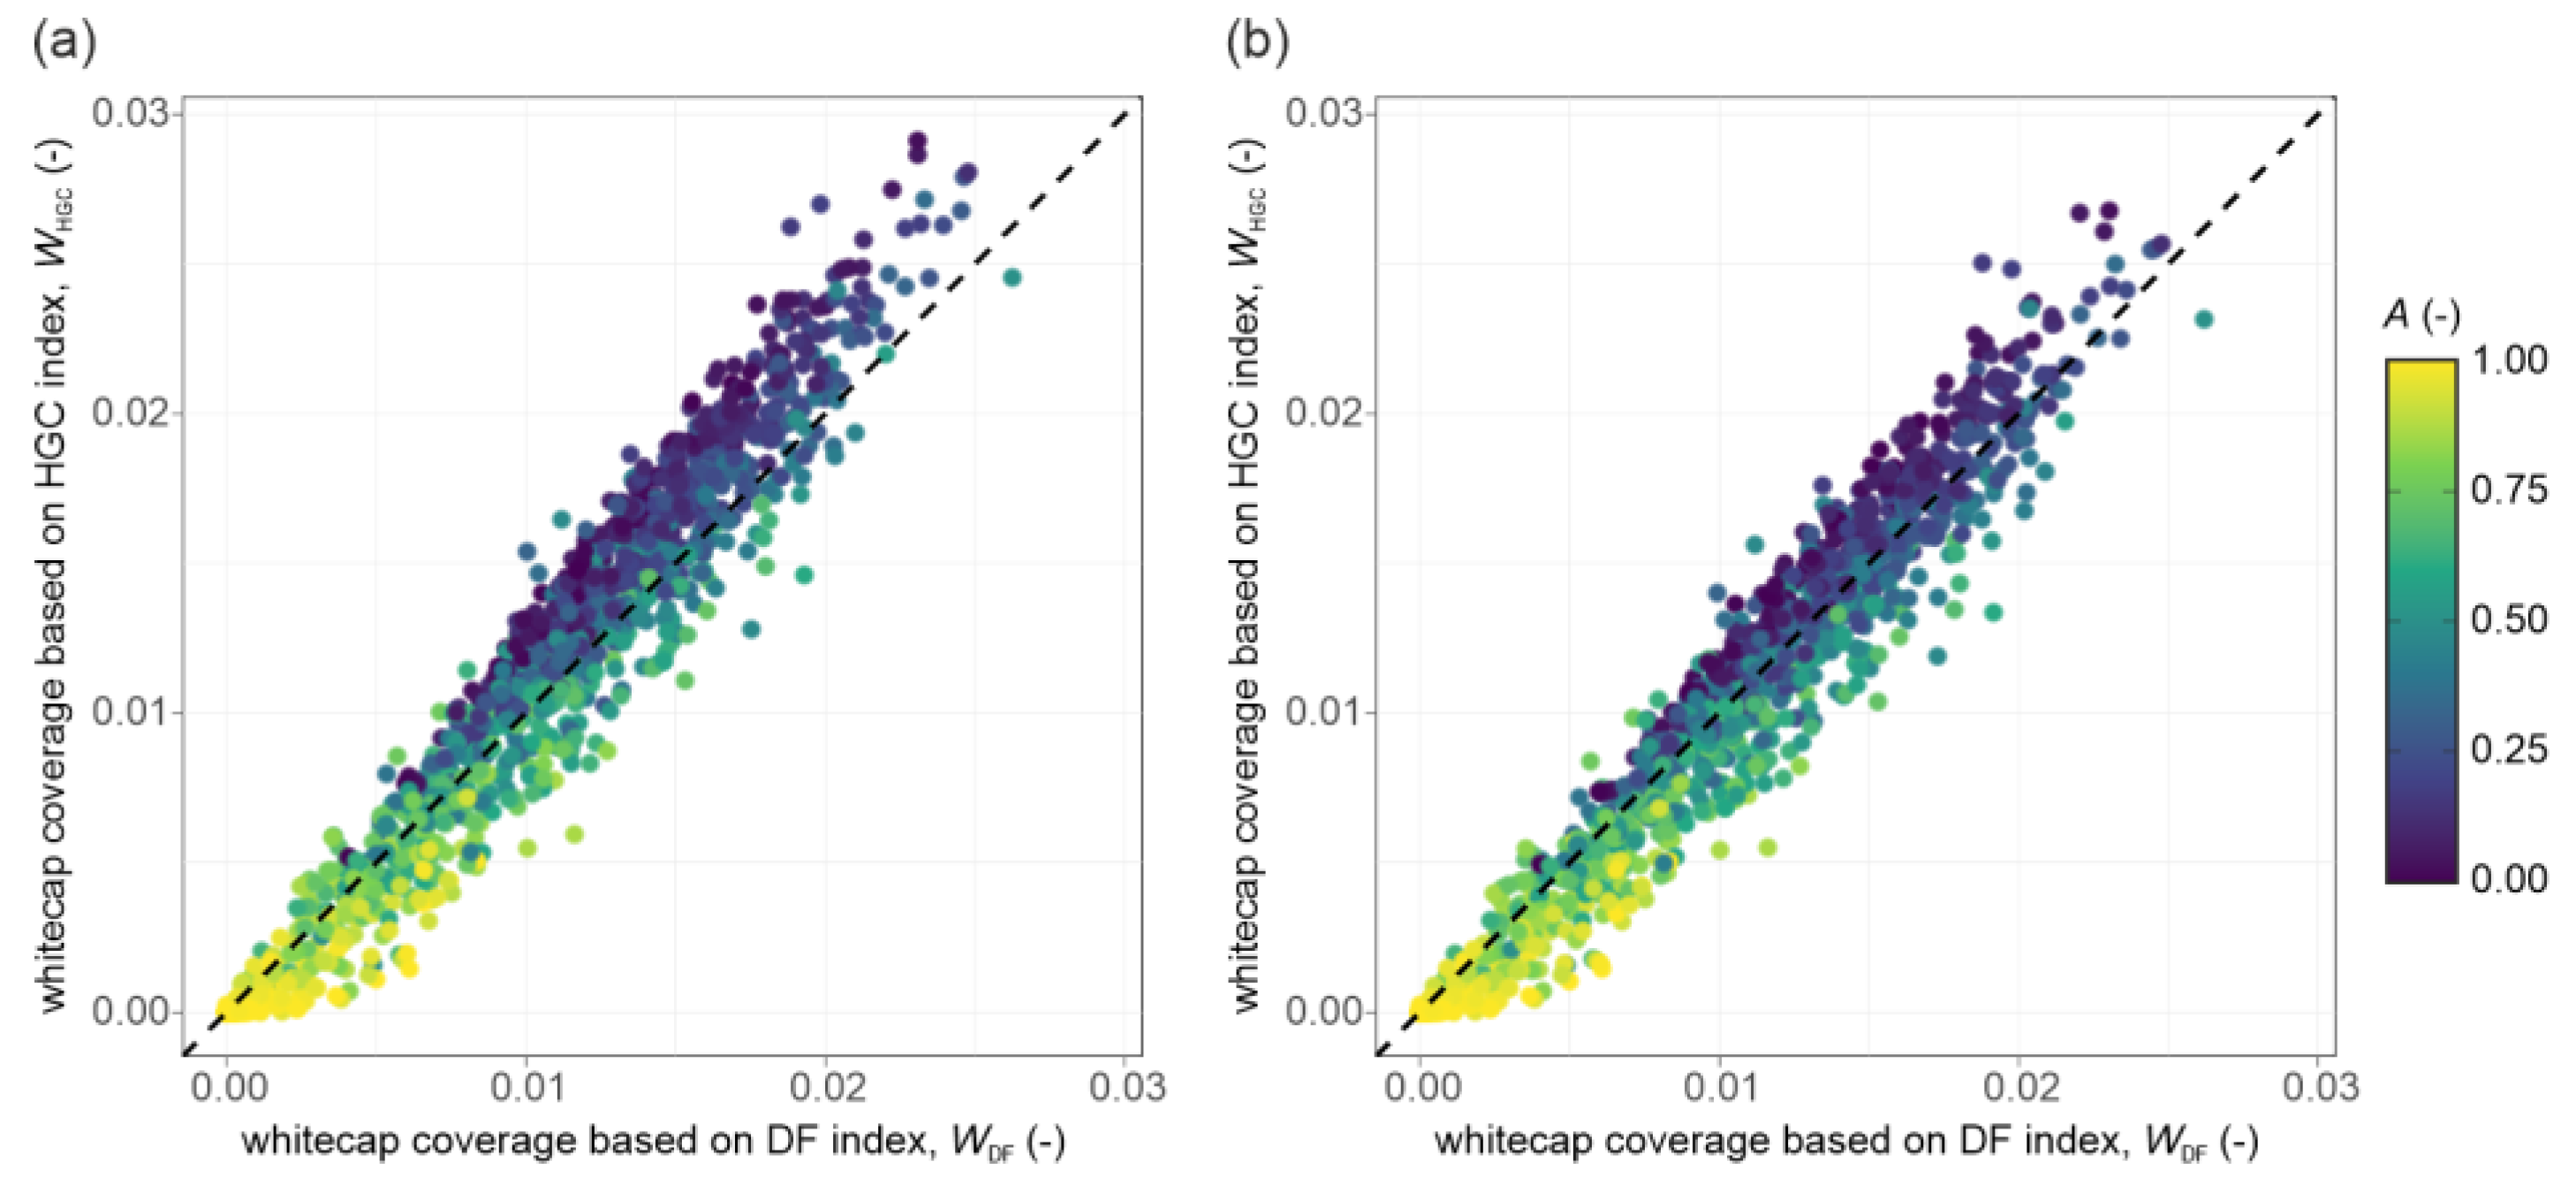
Figure 7.
Relationship between whitecap fraction (W) and sea ice concentration (A) in 200 × 200 m blocks for the four analyzed subareas (a); colors show wind speed (U10). In subarea N, two groups of outliers are highlighted with ellipses: the red ellipse indicates possible overestimation due to changes in image texture over ice (illustrated in panels b and c), while the blue ellipse corresponds to low W values in open-water zones caused by sheltering effect (examples in panels d and e). Panels (b–e) show zoomed fragments of the panchromatic image with contours of detected breakers outlined in magenta. The image beneath shows the full extent of subarea N with the locations of the examples marked.
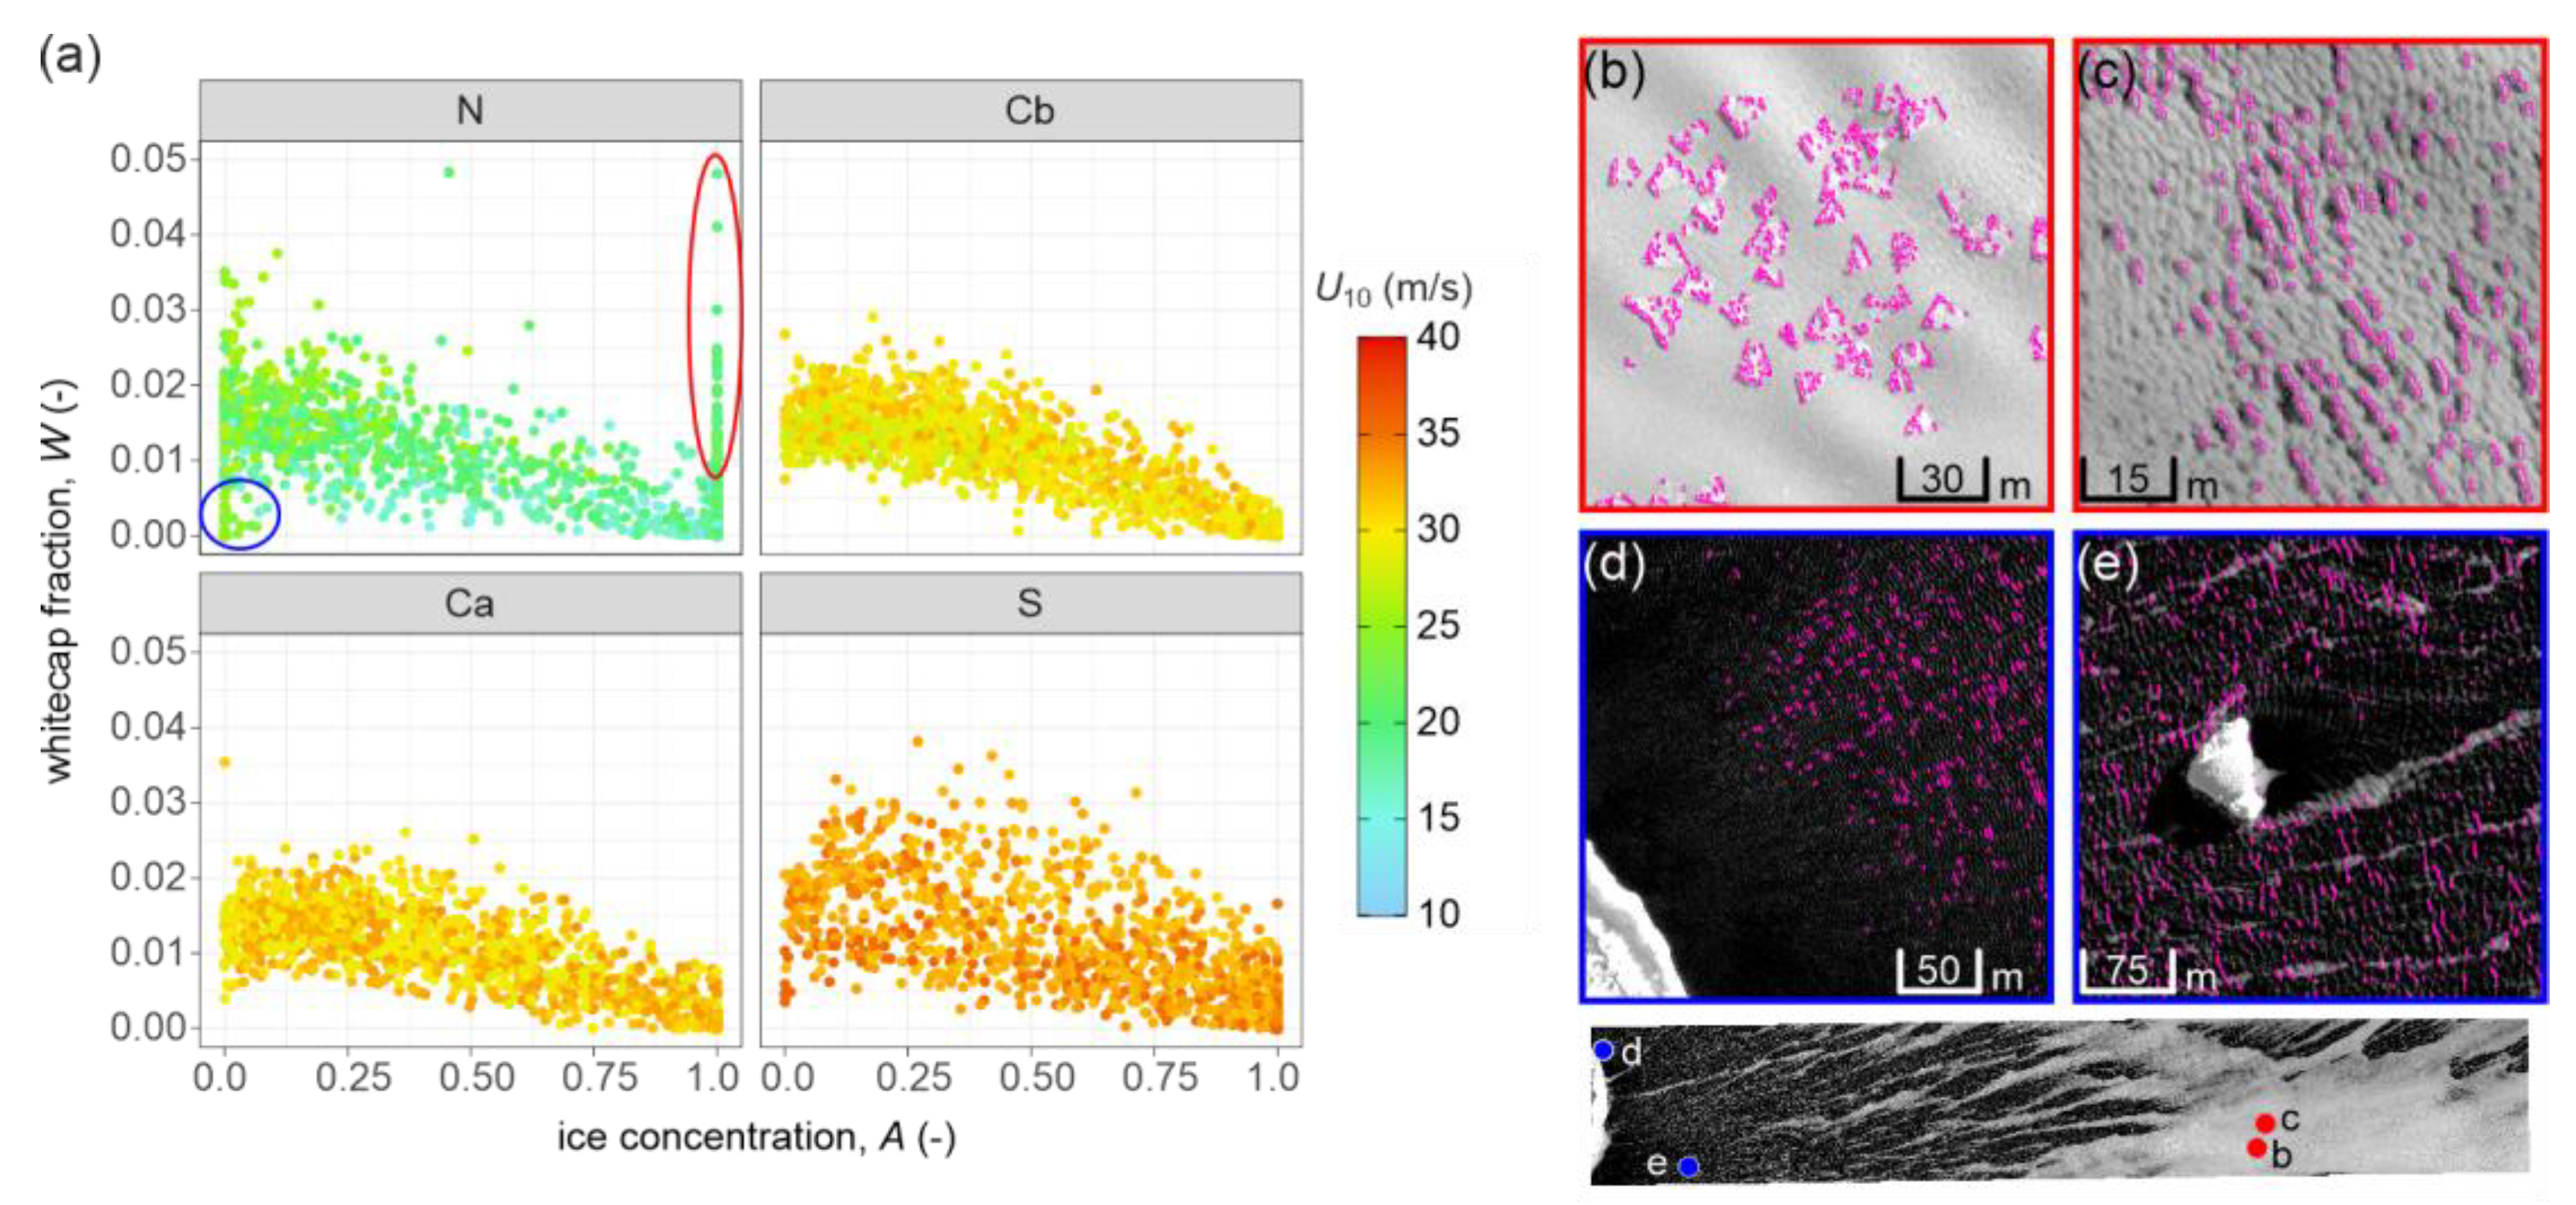
Figure 8.
Spatial distribution of whitecap coverage (W) in the northermost N (a) and southernmost S (b) subareas. Grey rectangles indicate location of panchromatic image spots (shown in panels c and d), presenting whitecaps in open water areas in different wind and fetch conditions: (c) subset N, wind speed 24.5 m/s (d) subset S wind speed 32.2 m/s.
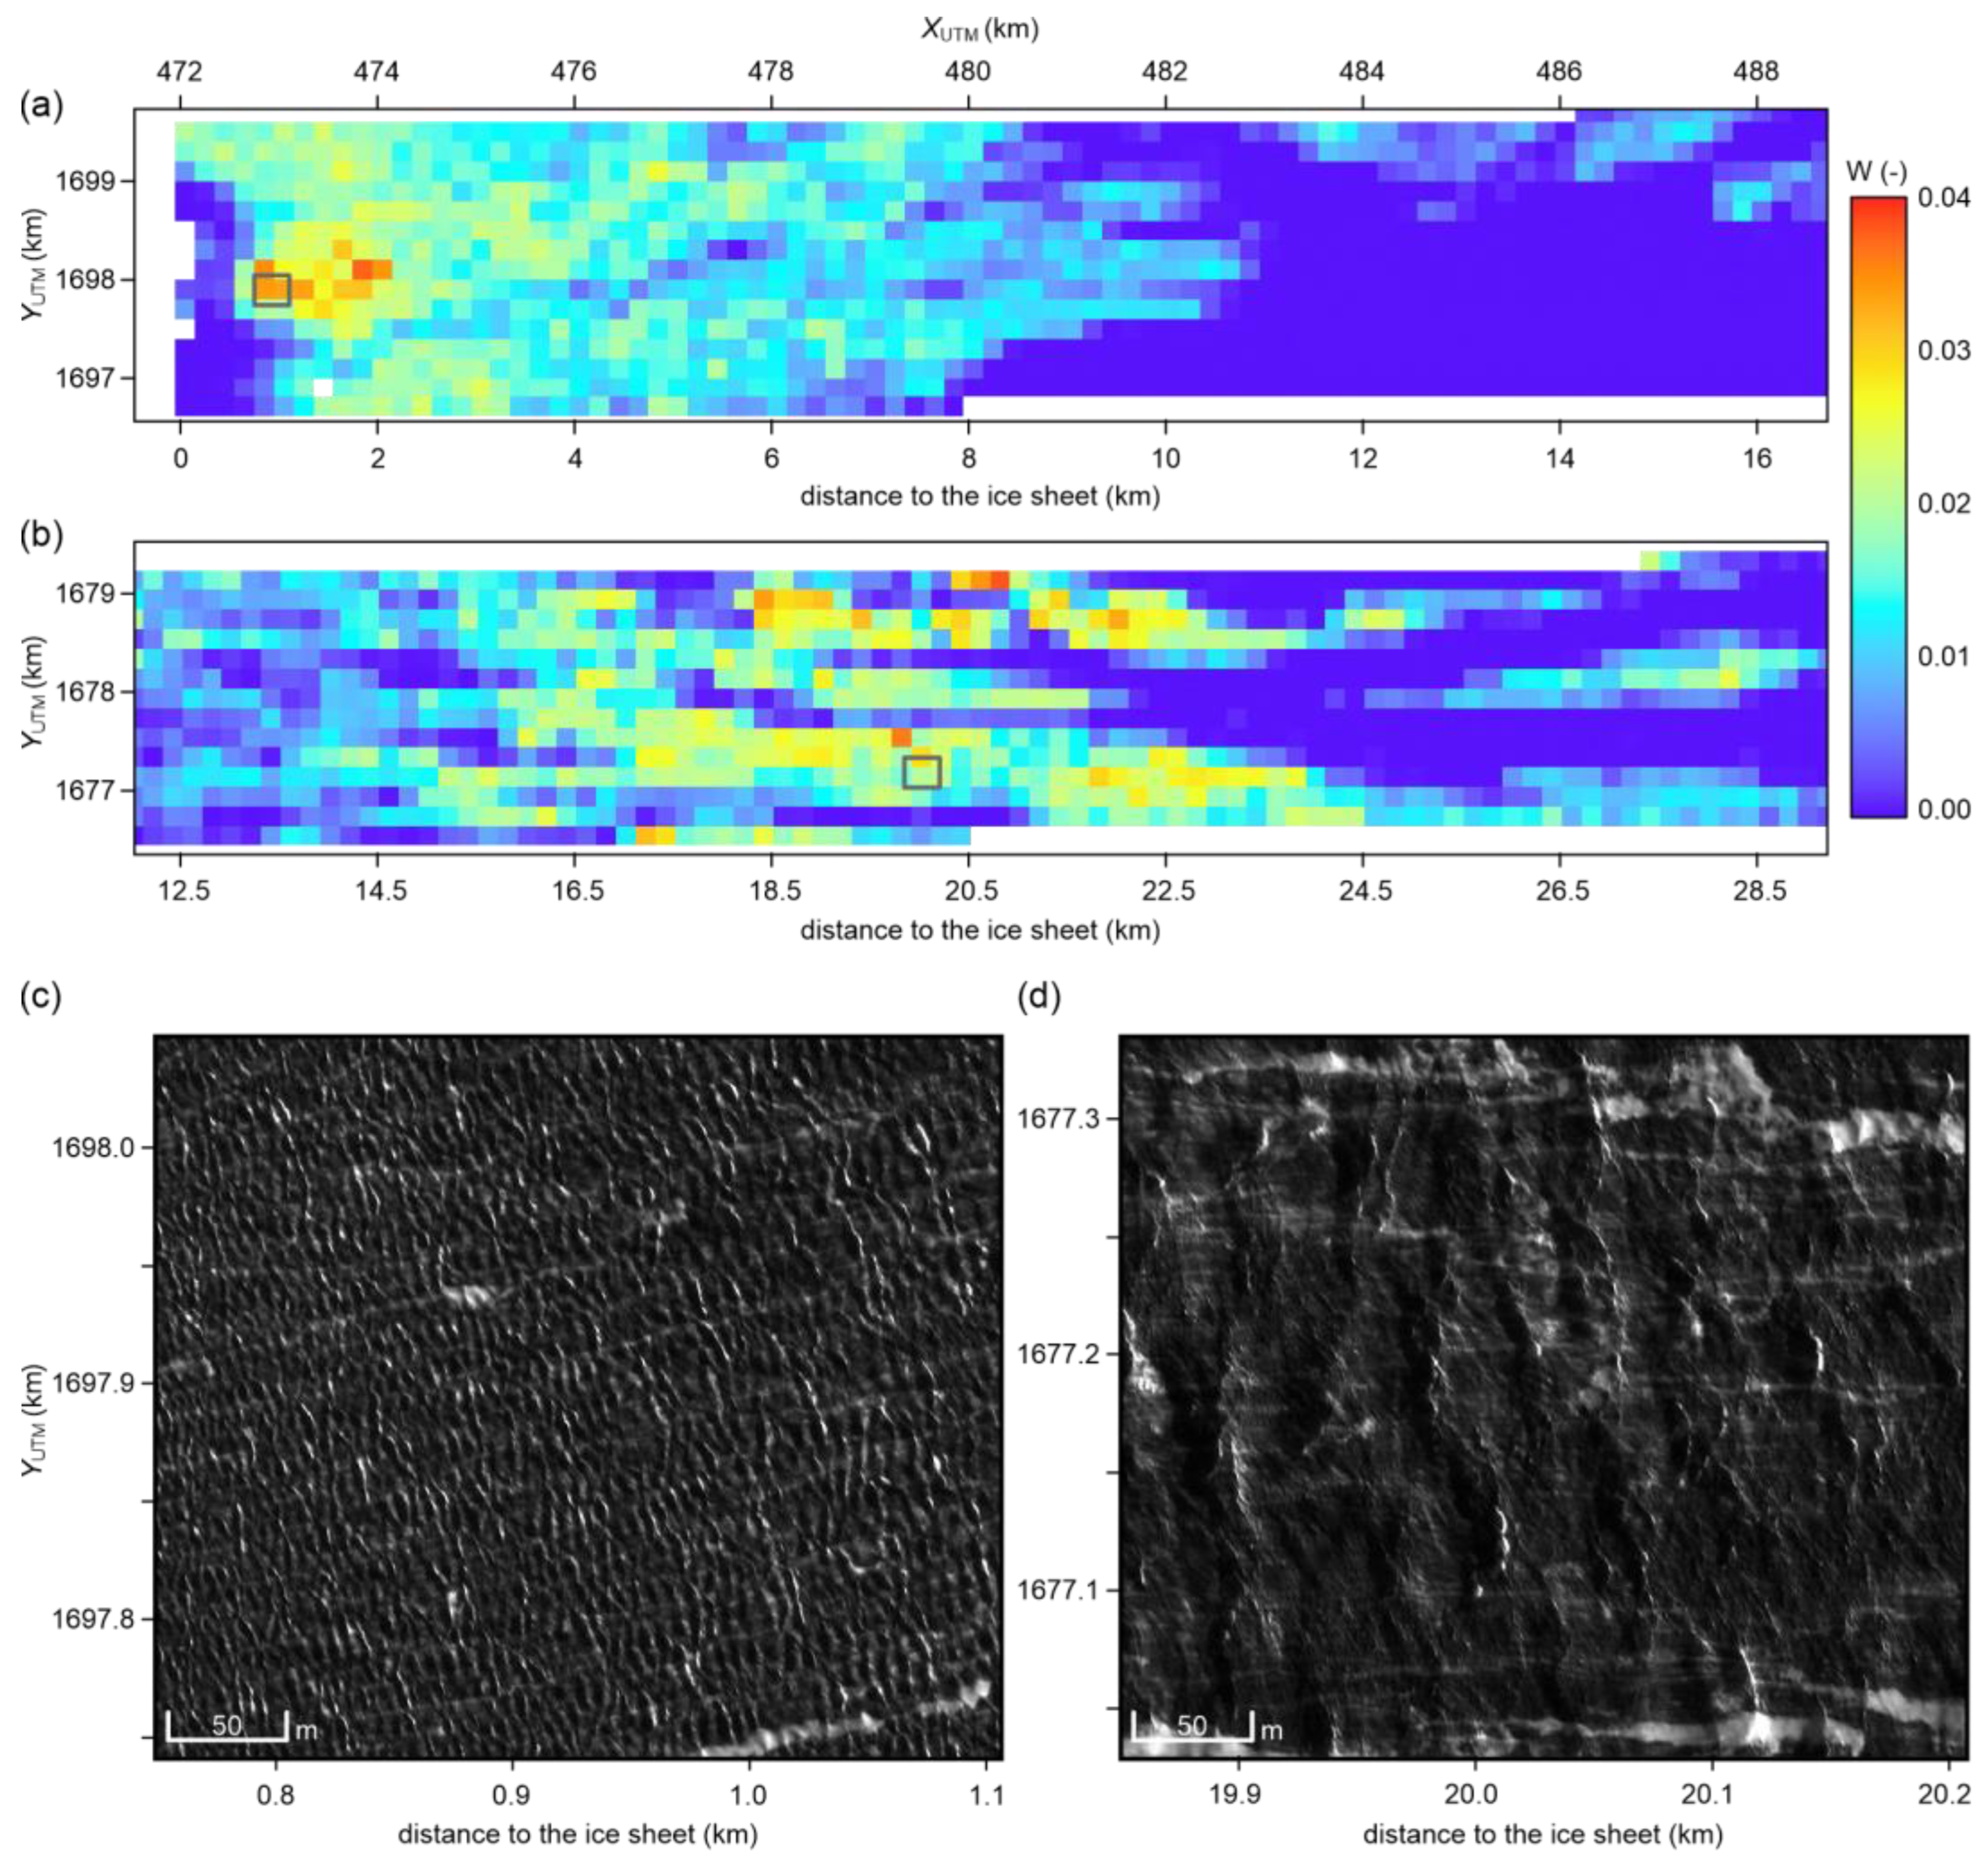
Figure 9.
Statistical distribution of crest orientation for individual objects identified as breakers in frazil ice streaks (red) and in the open water between them (blue). Orientation bins are defined in 12.5° intervals relative to true north. Frequencies are weighted by whitecaps surface area.
Figure 9.
Statistical distribution of crest orientation for individual objects identified as breakers in frazil ice streaks (red) and in the open water between them (blue). Orientation bins are defined in 12.5° intervals relative to true north. Frequencies are weighted by whitecaps surface area.
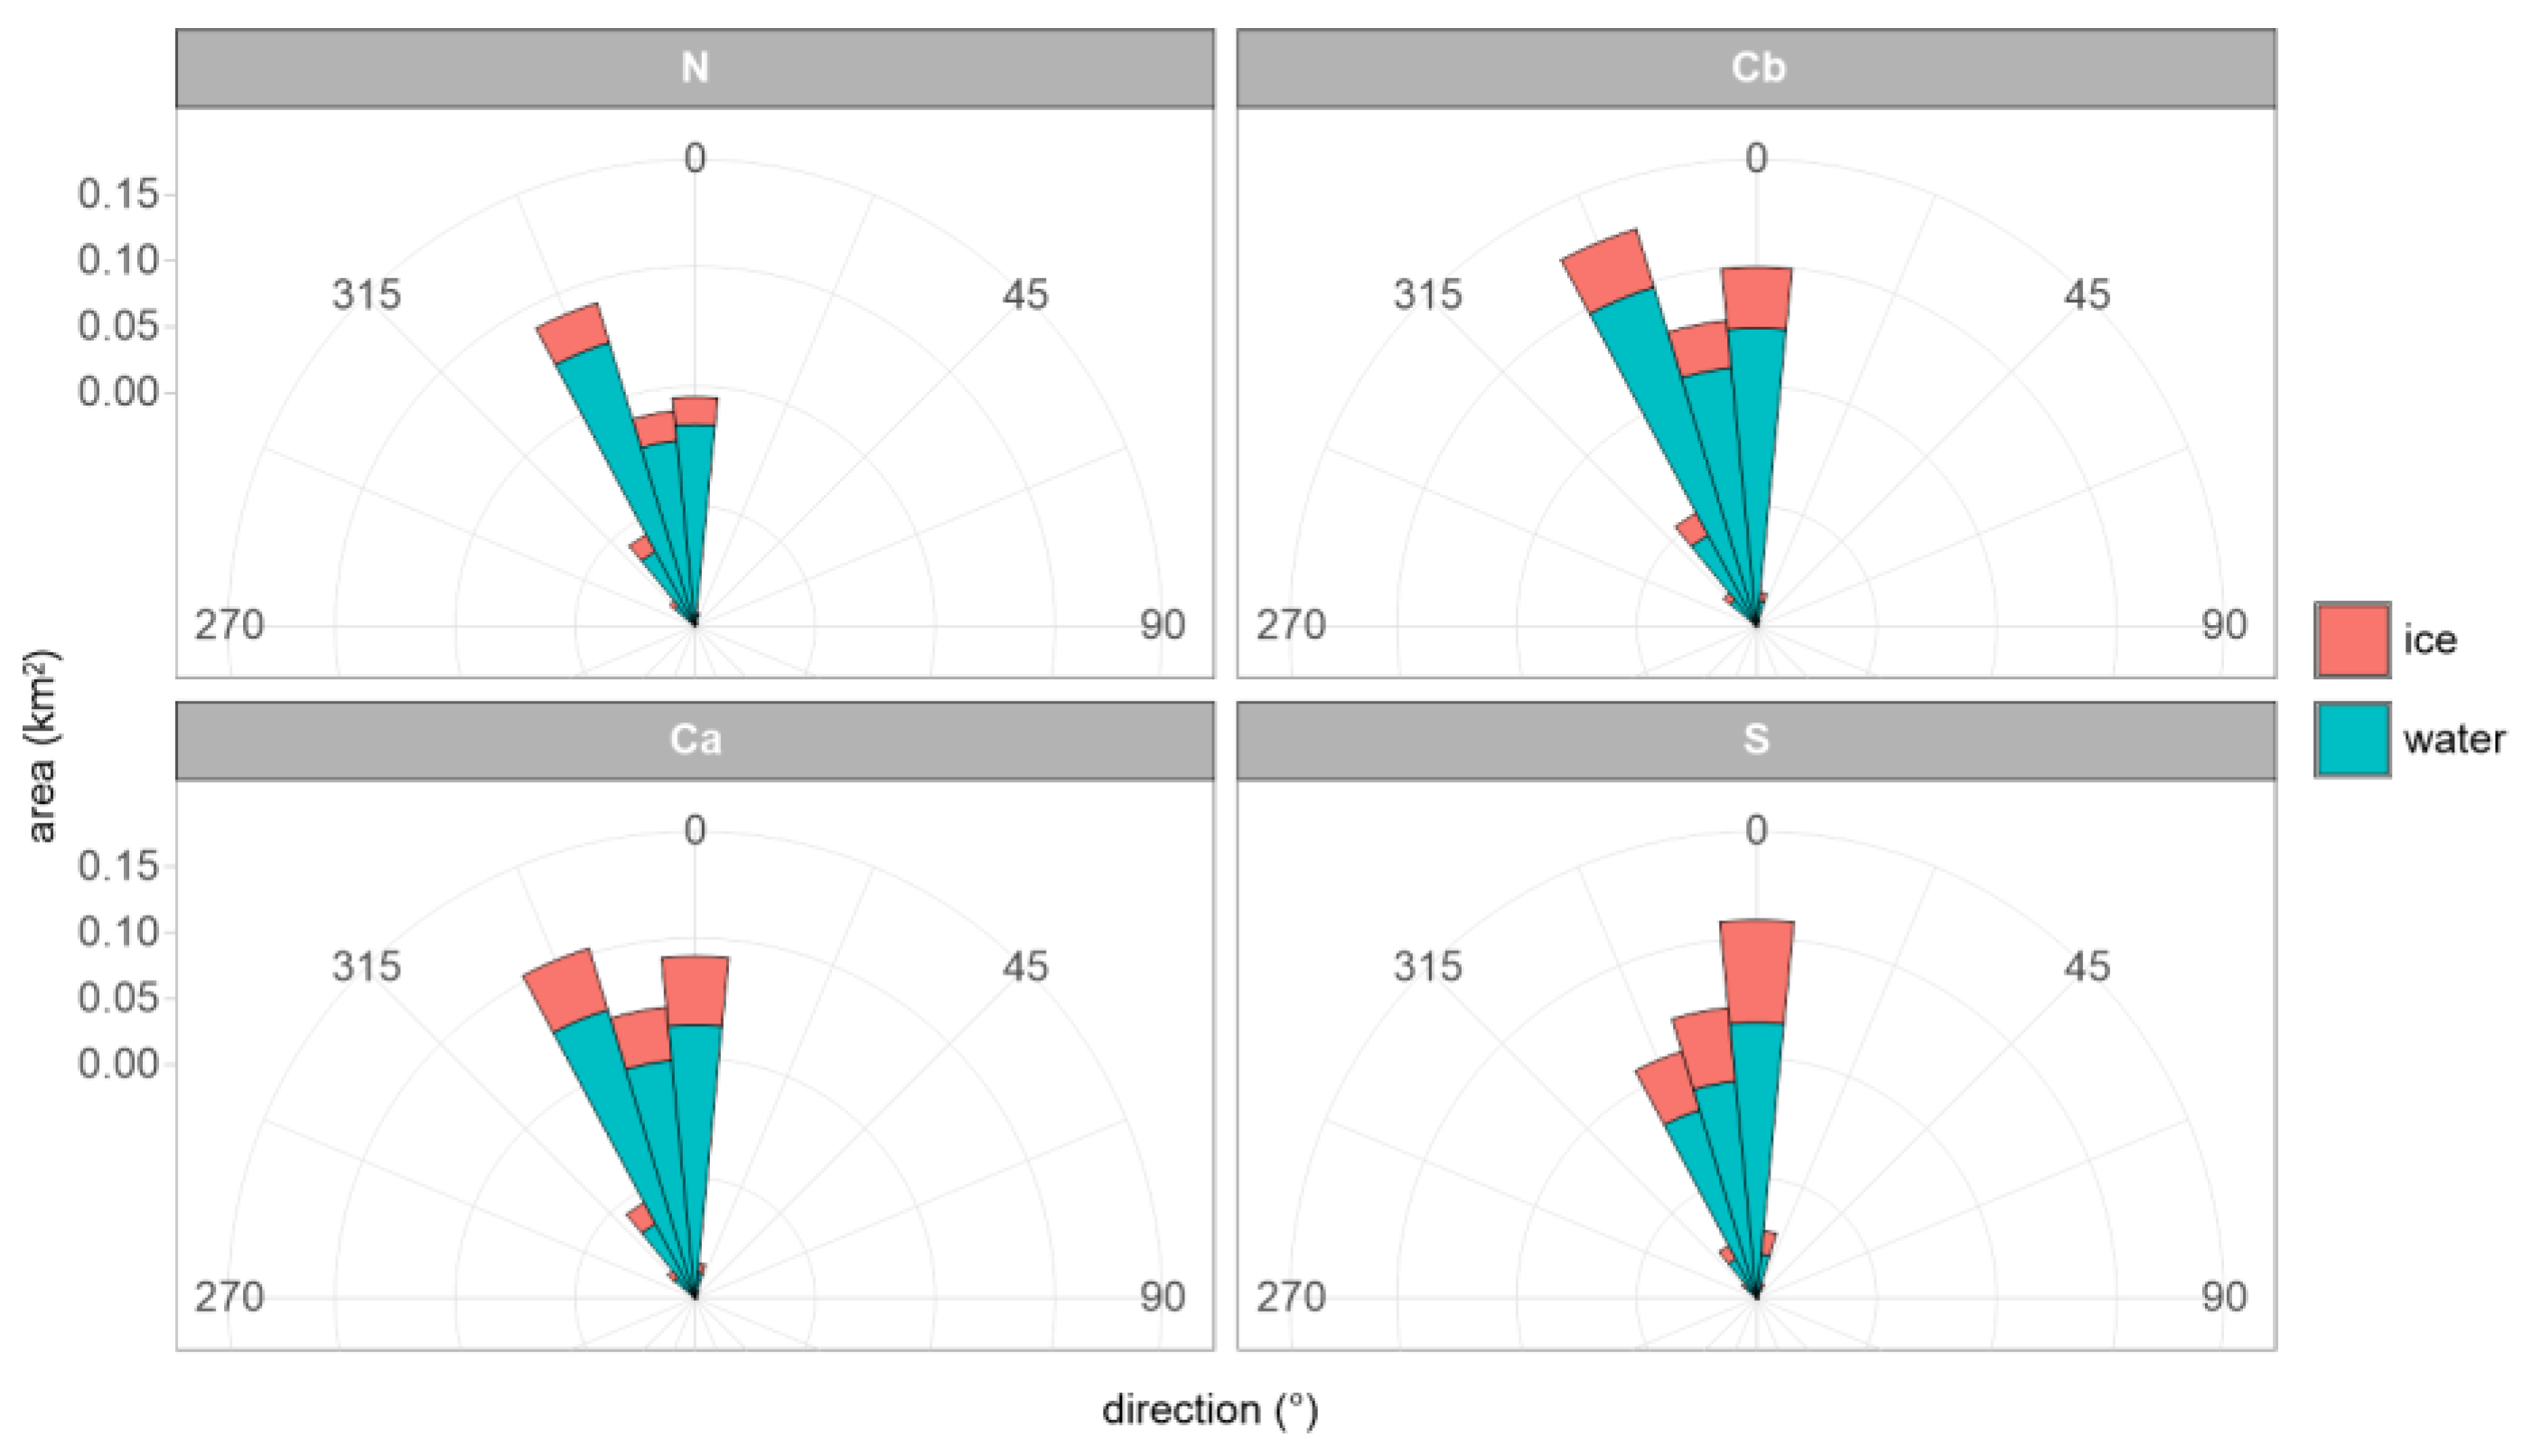
Figure 10.
(a) Box plots showing statistics of reflectance averaged over 15 × 15 m blocks (simulating lower-resolution satellite data) for different ice concentrations (A) and whitecap coverage (W). Circles, whiskers, boxes, and horizontal lines indicate, respectively: outliers, the range between the minimum and maximum non-outlier values, the interquartile range (IQR), and the median. (b-c) Subset of the WV2 panchromatic image at native resolution (b) and resampled to 15 m resolution (c). Polygons mark large whitecaps (magenta) and narrow frazil streaks (blue) which have a comparable effect on reflectance at coarser resolution.
Disclaimer/Publisher’s Note: The statements, opinions and data contained in all publications are solely those of the individual author(s) and contributor(s) and not of MDPI and/or the editor(s). MDPI and/or the editor(s) disclaim responsibility for any injury to people or property resulting from any ideas, methods, instructions or products referred to in the content. |
© 2025 by the authors. Licensee MDPI, Basel, Switzerland. This article is an open access article distributed under the terms and conditions of the Creative Commons Attribution (CC BY) license (http://creativecommons.org/licenses/by/4.0/).
Copyright: This open access article is published under a Creative Commons CC BY 4.0 license, which permit the free download, distribution, and reuse, provided that the author and preprint are cited in any reuse.


