Submitted:
14 July 2025
Posted:
16 July 2025
You are already at the latest version
Abstract
Tourism is one of the sectors with the highest weight in Portugal's Gross Domestic Product (GDP) and is expected to account for 56.4 billion euros (21.1%) of Portugal's GDP in 2033. In the case of the pandemic crisis (COVID-19), the impact on the sector was greater due to the restrictions imposed on international travel and the booking of holidays, resulting in unemployment in the sector and the closure of establishments. Faced with such restrictions, international tourists, especially domestic tourists, have discovered new, more remote, and less explored destinations. Using data provided by National Statistics Institute Portugal (2004 – 2024), we use robust econometric methods (particularly due to the presence of seasonality and autocorrelation), models autoregressive integrated moving average, to assess the impact of the pandemic and economic crises (2008 and Brexit) on the Portuguese tourism industry, namely by region (NUTS II – Nomenclature of Territorial Units for statistical purposes), to make a valid contribution to planning in future crises. The results allowed the impact of external effects on the behaviour of the number of overnight stays series to be identified. In addition to studying this behaviour, forecasts were made and the errors calculated based on indicators such as Mean percentage absolute error (MAPE) and U-Theil's statistical for periods after the historical series.
Keywords:
economic and pandemic crises
; time series
; ARIMA models
; Portuguese tourism
; NUTS II
1. Introduction
The tourism sector, which has a huge weight in Portugal's GDP. According to Instituto Nacional de Estatística – Portugal (INE), tourism GDP in 2023 increased by 15.2 per cent in nominal terms compared to 2022 and by 33.1 per cent compared to the pre-pandemic period (2019).
In Portugal, the economic crises have manifested themselves in a fall in demand, cancellations of bookings and reduced revenues. The direct economic effects include a reduction in the number of international tourists, unemployment in the tourism sector and the closure of establishments. Indirect effects include reduced investment in tourism infrastructure and a decline in local development. These effects have long-term consequences and affect the sustainability and competitiveness of tourist destinations in Portugal.
Given this, it would be appropriate to ask: Which of the crises mentioned above has had the greatest impact on the tourism sector in Portugal? In which of the crises did the number of overnight stays fall the most? If there was a drop in the number of overnight stays, was it general or was it more pronounced in certain regions of the country?
Thus, among other motivations, we can highlight: 1) insight into economic cycles, which will allow us to study crises that affect tourism, uncover patterns of consumer behaviour, and analyse the extent to which the tourism sector recovers and the most effective measures to ensure its stability; 2) a contribution to the development/formulation of economic policies to mitigate the negative impacts on the tourism sector. Understanding the dynamics of crises helps to develop support strategies for all the players in the sector concerned; 3) understanding the extent to which these crises affect consumer/tourist preferences, in the sense of possible changes of destination (region) and allowing companies in the sector to adapt their offers and promote marketing campaigns.
To answer the above questions, a literature review was conducted using the WoS, a database from 2004 to 2024 provided by INE Portugal, and robust econometric methods by region (NUTS II) using the number of overnight stays. The WoS search using the keywords "*economic crisis*", "*pandemic crisis*", "*econometric methods*" and "*Portugal tourism*" resulted in 53 scientific papers, including books, conferences, and articles in indexed journals, but very few related to the tourism industry in Portugal. In this paper, we decided to address economic crises (2008 global economic crisis and Brexit) and pandemic crises (COVID-19).
2. Literature Review
2.1. Econometric Models in Tourism
Econometric models are essential for analysing tourism demand and supply dynamics, particularly during crises. In Portugal, for example, where tourism is a major contributor to the economy, accurate modelling is critical to mitigating the adverse effects of crises.
These models are widely used for forecasting tourism demand. In the context of the pandemic, traditional time series models encountered difficulties due to its unprecedented nature. For instance, the stable seasonal patterns of tourism demand observed before the pandemic were not evident in 2020, resulting in forecast discrepancies ([1]). However, regions with higher domestic tourism showed greater resilience, suggesting that models incorporating regional and seasonal adjustments could improve forecast accuracy ([1,2]).
The Autoregressive Integrated Moving Average (ARIMA) model is a popular choice for tourism forecasting. A study comparing pre-pandemic forecasts with actual data during the pandemic found that, while ARIMA models accurately predicted the recovery of overnight stays in 2022, they struggled to predict the number of guests, which remained below pre-pandemic levels ([3]). This emphasises the importance of selecting models based on tourism-specific indicators.
The Autoregressive Vector Model (VAR) is useful for analysing the interdependencies between variables. A VAR framework was used to create a model of international tourism demand from Portugal's main source markets, considering factors such as income, cost of living, and prices in competing markets ([4]). This approach enables policymakers to understand the impact of external shocks, such as economic crises, on tourism demand.
Econometric models are also used to evaluate the short- and long-term effects of crises on tourism. For example, the sharp decline in international arrivals during the COVID-19 pandemic meant that intra-national mobility became one of the main drivers of tourism recovery ([5]). Campaigns encouraging domestic travel, for example, played a crucial role in mitigating the negative effects of the pandemic ([5]).
Economic base models relate employment and economic activity to primary industries, including tourism. Using such a model, a study of the Azores Islands showed that employment declined by 7% due to reduced tourism activity during the pandemic ([6]). This approach helps to identify the knock-on effects of a decline in tourism on local economies.
Logistic regression models are useful for analysing tourist behaviour and intentions. For example, a study of Portuguese tourists found that health and safety concerns, as well as sociodemographic factors, influenced travel intentions during the pandemic ([7]). Such models can provide valuable insights into how crises impact tourist behaviour and preferences.
The use of econometric models is widely recognised as a fundamental tool for analysing the dynamics of the tourism sector, especially in times of crisis. These models enable the interrelationships between the economic, political, and social factors influencing tourism demand behaviour to be captured. However, despite their popularity, classical models such as ARIMA have revealed significant limitations, particularly in contexts of structural disruption, such as the impact of the 2019–2020 SARS-CoV-2 pandemic.
While several studies acknowledge the effectiveness of ARIMA models in stable environments with a pronounced seasonal pattern ([1,3]), these models' predictive ability deteriorates significantly in the face of sudden external shocks. For instance, atypical seasonality and tourist demand patterns emerged during the pandemic, resulting in substantial forecasting errors and necessitating the reformulation of adjusted models ([4]). These authors emphasise the importance of considering exogenous variables or models with structural breaks.
Additionally, authors such as Gössling et al. [8] and Ritchie [9] argue that econometric modelling in tourism should integrate qualitative dimensions such as risk perceptions, consumer confidence, and regional resilience - factors that classical linear models do not adequately capture. To address this issue, hybrid approaches combining time series models with more flexible techniques, such as GARCH models for heteroscedasticity, structural regressions, or machine learning-based models, have been suggested.
In the Portuguese context, research has mainly focused on aggregate series and macroeconomic analysis, with few studies combining regional disaggregation with robust longitudinal analysis ([2]). This research aims to address this issue by applying ARIMA models at NUTS II regional level and comparing the effects of different exogenous shocks over time.
2.2. The Different Crisis in Tourism
Economic crises, caused by the impact of negative global events on tourism demand, can cause anxiety in certain tourism segments [10], leading to the construction of new segmentation concepts.
To assess the impact of the financial and economic crisis (on inbound and outbound tourists) in Asia, [11] used a distributed lag autoregressive model to calculate interval elasticities of demand and used them to generate interval forecasts for inbound and outbound tourism in Asia. The results suggest that the financial crisis will have a negative impact on tourism, but that demand will recover from 2010 onwards.
In the work of [12] also study the impact of the global economic crisis on the development of tourism in the Czech Republic. The authors analyse changes in tourism consumption from 2007 to 2011 and conclude that the economic downturn caused a change in consumption habits, with an adjustment in income based on tourism production, GVA, gross fixed capital formation and employment in the sector [13].
In an investigation into the efficiency of the tourism industry in Greek regions during the economic crisis from 2008 to 2016, using a stochastic frontier analysis methodology estimating regional efficiency scores and rankings, [14] show that the tourism industry in Greece enjoys high average levels of efficiency. The South Aegean and Crete regions are considered leaders in the efficiency ranking.
Sometimes socio-cultural, environmental and political crises lead to economic crises, which are approached critically, as in [15], but not quantitatively. In the [16] studied the impact of the economic crisis caused by Turkey's accession to the European Union on 200 bus companies and concluded that there was no impact on the sector.
The economic crisis and the competitiveness of tourism are also studied in the work of [10] (in Spain). Using econometric methods, the authors they conclude that when structural breaks are obtained endogenously, and there is a greater support for stationarity, and the break points in the series are identified with the main economic crises. Moreover, the impact of shocks on competitiveness is not neutral, with negative effects being more persistent in very severe crises, leading to the emergence of new competing destinations.
The United Kingdom has always been one of the most important European source markets for tourists. To analyse the impact of the Brexit on British tourism in Spain [17], use Bayesian structural time series models and conclude that between July 2016 and September 2017 (the period of preparation for the implementation of Brexit), Brexit had no negative impact on the arrival of British tourists or their spending in Spain.
In their work, Burnett and Johnston ([18]) present a study entitled 'The expected economic shock of Brexit on hotel and tourism planning in Ireland: resilience, volatility and exposure'. Through qualitative and pragmatic research involving interviews with senior Irish hotel managers, the authors concluded that the sector is facing few threats due to complacency and a 'wait and see' mentality. However, the authors also conclude that, although tourism has been resilient to economic shocks in the past, historical lessons have not been applied in anticipation of the potential shock that Brexit could cause.
In Coles ([19]), research combining the environmental crisis and Brexit is conducted. The authors analyse how the UK government approached the climate and political crises simultaneously between 2016 and 2019, with a particular focus on aviation and tourism. They conclude that tourism is a source of economic growth and post-Brexit resilience, and that the aviation sector's failure to achieve net zero emissions does not undermine this.
For the authors of [20], tourism as a component of overall economic growth in the UK is projected to grow at an annual rate of 3.8 per cent to 2025. Using seasonally adjusted series of tourist arrivals extracted from trends, together with the uncertainty of Brexit, they conclude that there is strong evidence of long-term persistence in the volatility of tourist arrivals.
To measure the potential impact of the pandemic on the tourism industry, researchers used panel structural vector autoregression (PSVAR) and data from 185 countries between 1995 and 2019. Using dynamic systems modelling, they estimated the impact of the pandemic on the global tourism industry. They conclude that the current pandemic is different from previous ones and that it will take longer than the expected 10 months for the global tourism sector to recover.
In this state of the art, we mention some of the studies with different approaches, methodologies and methods, but none of them adopt the approach we intend to adopt. However, some of these works use econometric methods that helped us define and select the methods we will use next. In addition, we can also see that the studies generally aim to contribute to better planning for the sector, its sustainability and its economy, which is also one of our objectives.
Thus, we can conclude that, while economic and pandemic crises are recognised as disruptive factors in the tourism sector, the literature continues to present mostly descriptive or case-specific approaches, with little generalisation to contexts such as Portugal.
Several authors (e.g. [11,14]) have analysed the 2008 financial crisis, emphasising its effects on demand elasticity and changes in consumption patterns. However, few studies have explored the impact at a regional level or considered variables such as the local economic structure and dependence on international tourism, as in the case of the Algarve. Studies in contexts such as Greece and Spain reveal marked divergences in the effects by region and type of tourism (urban versus coastal), which are equally relevant for Portugal but remain under-explored.
Regarding Brexit, existing studies ([17,18]) primarily highlight anticipated impacts on the Irish hotel sector and the arrival of British tourists in Spain. However, there are no empirical studies focusing on Portugal. As the United Kingdom is one of the Algarve's main source markets, there is an opportunity for further empirical research in this area.
In the case of the pandemic caused by the SARS-CoV-2 virus, most studies have focused on the immediate effects of travel disruption ([5,6]) or post-pandemic travel intentions ([7]). However, few studies analyse the recovery process or the differentiated impact on regions dependent on domestic versus international tourism in a longitudinal and regional manner. This distinction is important because the resilience observed in regions with a greater reliance on domestic tourism (e.g. the Centre) may contrast with the vulnerability of regions such as the Algarve, which depend heavily on external markets, such as the British market.
Furthermore, literature often emphasises the need for public policies that are more sensitive to the cyclical and regionally differentiated nature of tourism ([21,22]). However, few proposals have been made for operational indicators or regional risk metrics. This is another area to which this research aims to contribute.
3. Methodology and Methods
This study used a database for the period 2004/1Q to 2024/3Q provided by INE (a survey carried out by the INE/Tourism Portugal) with quarterly records of the following variables: number of overnight stays, number of guests and revenues by type of accommodation and by NUTS II region (Portugal is divided into 7 regions: Norte, Centro, Lisboa and Vale do Tejo, Alentejo, Algarve, Madeira and Açores). However, due to the scale of the results, the study of the impact of the above crises is only evaluated using the variable number of overnight stays by NUTS II. We have used the NUTS II segmentation of the country because this is the usual methodology of INE, since NUTS I has a small number of regions (3) and NUTS III an excessive number (25).
As the observations were recorded sequentially over time, the data were treated from a time series perspective, allowing the past to be analysed and interpreted, and future forecasts to be made. In general, a time series is characterised by 4 components: seasonality, trend, cyclicality and randomness. These components, and in particular the presence of seasonality [23] and/or trend, give rise to problems of non-stationarity (absence of constant mean and variance and/or presence of autocorrelation between time-lagged observations), which make modelling and forecasting difficult. In order to assess the presence of stationarity in each of the situations discussed, in addition to using the graph of the series, we have used statistical tests that are much more efficient than the graphical assessment, called unit root, such as the augmented Dickey-Fuller test [24], the Phillips-Perron test [25] or the KPSS-Kwiatkowski-Phillips-Schmidt-Shin test [26], which make it possible to carry out first differences.
After the first differences, we were able to apply autoregressive models, whether ARMA (Autoregressive Moving Average), ARIMA (Autoregressive Integrate Moving Average) or SARIMA (Seasonal Autoregressive Integrate Moving Average) [27].
The advantages of using these models over others are that they make it possible to capture the dynamics of the data over the period analysed; they can be applied to series with different characteristics, including trend and seasonality (the series on tourist overnight stays shows seasonal patterns); and the series on tourist overnight stays in Portugal shows a clear trend over time, which justifies the lack of stationarity. ARIMA models make an important contribution to the modelling of non-stationary series; the estimated autocorrelation coefficients and moving averages are easy to interpret, making it easier for decision-makers to define the strategies to be adopted, and the simple implementation of the model that best fits the data using numerous software packages, as well as the validation of the models using robust statistical criteria.
Because on forecasts of the COVID-19 pandemic crisis, we opted to split the time series into two parts, from 2004/1Q to 2019/4Q and 2020/1Q to 2024/3Q, given the significant break in structure. Including this period would drastically alter the patterns and trends of the series, making the forecasting models less accurate (with high errors). Once this break had been identified, dividing the series into pre-pandemic (2004-2019) and post-pandemic (2020-2024) allowed an ARIMA model to be applied to each period separately, considering the different dynamics in each period. Subsequently, it was possible to combine the forecasts of the two models to obtain a more accurate view of the future behaviour of the time series. In addition to the above, the application of ARIMA models depends on the assumption that the data has stationary or stable characteristics over time. The pandemic has generated economic and social shocks that may have altered the characteristics of the data (such as trends and seasonality). Separate analysis can make it possible to build more appropriate ARIMA models for each period, avoiding distortion of the model due to abrupt changes in the behaviour of the data. Finally, separation also allows for comparative analysis, where you can see how the pandemic has changed the behaviour of overnight stays in Portugal and assess the recovery of the tourism sector. This can provide useful information for public policy and tourism managers.
The database was provided to us in Excel format, but all data processing for this work was done in Gretl 1.9.4 (free econometric software) and JASP 0.18.3 (statistical software).
3.1. Methods
One way of describing a time series (), if stationary, is through linear stochastic models, including the ARMA, ARIMA and SARIMA models developed by Box, Jenkins, Reinsel, and Ljung [27]. These are stationary linear models, in levels or first differences, whose methodology is based on: i) analysing the stationarity of the series; it is often necessary to transform (logarithmic and/or differentiate) the series to "stationaries" it; ii) based on an analysis of the autocorrelation properties of the (possibly transformed) series, selecting a model that can represent it. In cases where several alternative models are considered, a model is selected based on "diagnostic tests" and statistics such as the Akaike Information Criterion (AIC) or the Schwartz Bayesian Criterion (SBC) ([27,28]). The autocorrelation function (ACF) and partial autocorrelation function (PACF) ([27,28]) are estimated from the information provided by the observed values of the series and must be compared with the theoretical descriptions of these functions for each of the models mentioned; iii) the model is identified and the parameters are estimated using appropriate software; iv) a diagnostic evaluation of the estimated model is carried out, using various criteria to assess its statistical quality and the quality of the fit to the series analysed. On the other hand, for a correctly specified model, the errors should evolve according to a white noise process; v) the selected model is used for forecasting purposes.
In this study, the Box et al. [27] methodology has been applied to the series of quarterly overnight stays by NUTS II regions in Portugal. This methodology makes it possible to analyse the behaviour of time series based on a double study: on the one hand, an autoregressive component determined according to the past statistical history of the variable in question, and, on the other hand, a treatment of random or stochastic factors specified by moving average processes. Because of their design and operational resolution, these models allow seasonal analyses to be carried out and the trend component to be isolated (as can be seen from the results obtained).
3.1.1. ARMA Model
The Box et al. (2015) [27] stationary series models, known in the literature as , models, are formalised using the relationship:
The series of interest, , is a function of its past values and the linear combination of random shocks , the autoregressive parameters of order , and the moving average parameters of order ,
In the general case and using the delay operator, the ARMA () model given in (1) is presented by:
where the parameters are such that the roots of the polynomials in module are strictly greater than one (guaranteeing the stationarity and invertibility of the process). When , the model is called a moving average of order , , and when , an autoregressive of order , .
3.1.2. ARIMA Model
Another linear statistical model used to analyse time series is the ARIMA (Autoregressive Integrated Moving Average) model. Theoretically, this type of model is the most widely used for forecasting time series that are not stationary but can be made stationary by differentiation. They are a generalisation of ARMA models, which basically aim to make the process stationary through difference operations, where the letter I stands for "integrated". In general, a process is said to be if:
where and are positive integers: is the order of the autoregressive model, d the degree of differentiation and the order of the moving average model.
Thus, if , then is a non-stationary process which, after differentiations, is an process f the form:
A process is said to be integrated of order d if the autoregressive polynomial of has several roots equal to one.
3.1.3. SARIMA Model
To take account of the seasonal behaviour of some time series, multiplicative seasonal ARIMA models (SARIMA) are used. SARIMA models have a non-seasonal part corresponding to the parameters and a seasonal part corresponding to the parameters . Thus, we have a seasonal autoregressive component and a moving average , and it is represented as where refers to the order of seasonal differentiation. Thus, this type of model has the form
where the first bracket refers to the non-seasonal part of the model and the second to the seasonal part. The letter m corresponds to the number of seasonal periods in the series.
The fitting of a SARIMA model is like the process of fitting an ARIMA to time series data, specified by:
with .
After presenting the different types of models and considering the main issues related to forecasting, a wide range of results has been obtained, which we present in the next section.
In terms of assessing the accuracy/performance of the selected models, and for forecasting purposes, an analysis of the behaviour of the residuals was carried out and the MAPE and U-Theil's metrics were presented. The MAPE measures the average of the absolute differences between the predicted values and the actual values, expressed as a percentage.
where is the absolute value of the error in period and the absolute real value of the variable in period ( being all the periods in the series). A MAPE of less than 10 per cent suggests perfect forecasts, below 20 per cent good forecasts and close to 30 per cent indicates that the model is not effective at forecasting.
The U-Theil's value (or Theil's Inequality Coefficient) is a metric used to assess the accuracy of an ARIMA model's forecasts. It compares the model's forecasts with the actual values, according to
where is the predicted value of the variable.
Values close to 0 indicate that the model has good accuracy. Conversely, values greater than 1 indicate that the model is worse than simply using the average of the actual values as a forecast. This suggests that the model needs to be adjusted or that the data is too volatile to be predicted accurately.
Choosing the right model to assess the impact of economic crises and pandemics on the tourism industry in Portugal is crucial to ensure that the forecasts are accurate, and representative of the reality observed. Among the various approaches available for modelling time series, ARIMA models stand out for their ability to deal with data that shows trends, seasonality and economic cycles, common characteristics in tourism time series.
In short, ARIMA models are a suitable choice for assessing the impact of the economic and pandemic crises on Portuguese tourism, due to their ability to capture temporal dependencies and adjust for long-term trends. Although there are limitations associated with the approach, the advantages of its simplicity, robustness and adaptability make it a valuable tool for analysing and forecasting the impact of the crises on the tourism sector.
4. Discussion and Results
4.1. Analysis of Overnight Stays Data in Lisboa, Algarve and Total NUTS II – Period Due 2004/2019
As the regions with the largest contribution to GDP from the tourism sector in Portugal are the Algarve, with a large part of its economy based on the tourism sector, and the Lisbon Metropolitan Area, which is a region with many international tourists, the focus of our study centres on these two regions. However, to complement the study, we also present an analysis of the total by NUTS II. The study will be carried out according to the proposed methodology, ending with a presentation of the forecast errors for the period 2020:1 to 2024:3. After aggregating the data by NUTSII region, the behaviour of the series is presented by Figure 1.
For all regions, and throughout the period analysed, there is an upward trend in the number of overnight stays, with the marked fluctuations between quarters being justified by the presence of seasonality. It should be noted that the ARIMA, suitable for short-term forecasts and in the case of series containing seasonal variations [23]. However, the models introduced by Box and Jenkins exclusively describe stationary series, i.e. with constant mean and variance over time and autocovariance dependent only on the degree of lag between the variables, and the first step is to verify or provoke the stationarity of the series [29].
4.1.1. Identification, Estimation and Evaluation of Diagnostics
Analysis of the stationarity of the series is intuitive, based on knowledge of the nature of the phenomenon being analysed and observation of the series timeline (Figure 1).
The ACF does not show a sharp drop to zero and there is greater autocorrelation at 4, due to quarterly seasonality. Multiples of 4 also show high values, although they tend to decrease over time. The PACF shows significant values for the first three lags, then drops to zero, showing some peaks outside the limits of the defined range.
To apply the Box-Jenkins methodology, it is first necessary to identify the series and remove the lack of stationarity. The stationarity of the series under study was achieved by applying a simple differentiation and a seasonal difference to the initial series. It should be noted that it is advisable to minimise data differencing (to avoid over differencing), as differencing leads to an increase in the variance of the forecast error. Although the series in the first differences and with a seasonal lag can be considered stationary.
As a basic tool for identifying the ARMA process in question, the estimated ACF and PACF of the stationary series (first differences of the series) should be considered. The seasonal and non-seasonal components are identified separately using the theoretical frameworks.
Using the “Best Fitting” option and including period 4 in the “Seasonal Custom”, we have the model for the three regions. The best model, compared to the others, was chosen based on the AIC criterion and the value of the coefficient of determination.
For the Lisboa region, the model selected is , leading to better indicators in terms of forecasting (Figure 2).
Applying the same methodology, the model identified and estimated for the Algarve region and for Total Nuts II, resulting in the following models (Figure 3 and Figure 4):
Based on what can be seen on selected models, and by analysing the statistical significance of the models’ coefficients, they are significantly different from zero (see the respective ), allowing us to conclude that the models are well identified. On the other hand, as far as invertibility is concerned, the coefficients of the two components (non-seasonal and seasonal) fulfil the conditions of invertibility, since the estimates of the parameters of the moving average components are, in module, less than unity. On the other hand, ensuring stationarity and invertibility, the roots of the polynomials and are modulo greater than unity.
After assessing the statistical quality of the model, it is important to evaluate the quality of the fit, which is done by analysing the residuals. In fact, if this model properly explains the series of overnight stays in the three selected regions, the residuals should behave like a process analogous to white noise.
Below are the respective graphs of the residual series and the QQ-plots (Figure 5), can be concluded that the residuals of the identified model behave like white noise and with a behaviour that can be described by a normal distribution?
Visually analysing the graph, the residuals seem to oscillate around the zero line, indicating exogeneity (zero mean). However, there are variations in the amplitude of the residuals over time, with noticeably larger peaks in certain periods (for example, between 2011 and 2015), suggesting possible heteroscedasticity. The graph shows some patterns and prolonged oscillations that may indicate autocorrelation, especially in periods where the residuals go up or down for several quarters in a row. Therefore, the ACF and PACF of the residuals that do not violate the hypothesis of no correlation are presented.
The ARCH test on the residuals for various lags produced a ,000 which rejects the null hypothesis of homoscedasticity. However, looking at the QQ-plot, the normality of the residuals does not seem to be in question. It can therefore be concluded that the residuals behave like white noise (although not pure).
For the Algarve region (Figure 6), the residuals behave more like white noise, but with some caveats. There are some residuals with extreme values (in 2013 and 2014), which may indicate the presence of outliers or slight heteroscedasticity.
There are also some visible oscillations in some periods, and there are times (between 2010-2014) when there are larger and more frequent variations, which could just be randomness.
Therefore, the ACF and PACF of the residuals that do not violate the hypothesis of no correlation are presented. The ARCH test on the residuals of order four produced a , which not rejects the null hypothesis of homoscedasticity. Looking at the QQ-plot, the normality of the residuals does not seem to be in question. It can therefore be concluded that the residuals behave like white noise.
In Figure 7, the residuals for the NUTS II total show a more complicated behaviour in relation to the hypothesis that they are white noise.
Although the residuals oscillate around the zero line and there is a certain randomness in the movements, the variance is increasing (a sign of heteroscedasticity). From 2005 until around 2010, the amplitude of the residuals is smaller, but after 2010 there are more intense oscillations, suggesting that the variance is not constant. On the other hand, systematic and regular peaks between 2011 and 2015 may indicate the presence of autocorrelation.
Therefore, the ACF and PACF of the residuals that do not violate the hypothesis of no correlation are presented. The ARCH test on the residuals of order four produced a , which not rejects the null hypothesis of homoscedasticity. Looking at the QQ-plot, the normality of the residuals does not seem to be in question. It can therefore be concluded that the residuals behave like white noise.
It should be noted that, especially in the Lisboa region, there was a peak in waste behaviour of residuals in 2008, which may have been the impact of the financial crisis. However, this period does not jeopardise the adjustment made. The sharp drop in waste in 2008 is justified as being related to the financial crisis in Portugal. It had a significant impact on various areas of the economy, including tourism, which may have influenced the number of overnight stays and, consequently, the model's residuals.
The Chow test checks whether there is a significant difference in the regression coefficients between two periods. The hypothesis being tested is that there is no change in the structure of a model's coefficients between two subsets of data (before and after 2008). The results (Table 1) of the test for the behaviour of the residuals of the selected models for the three regions are presented.
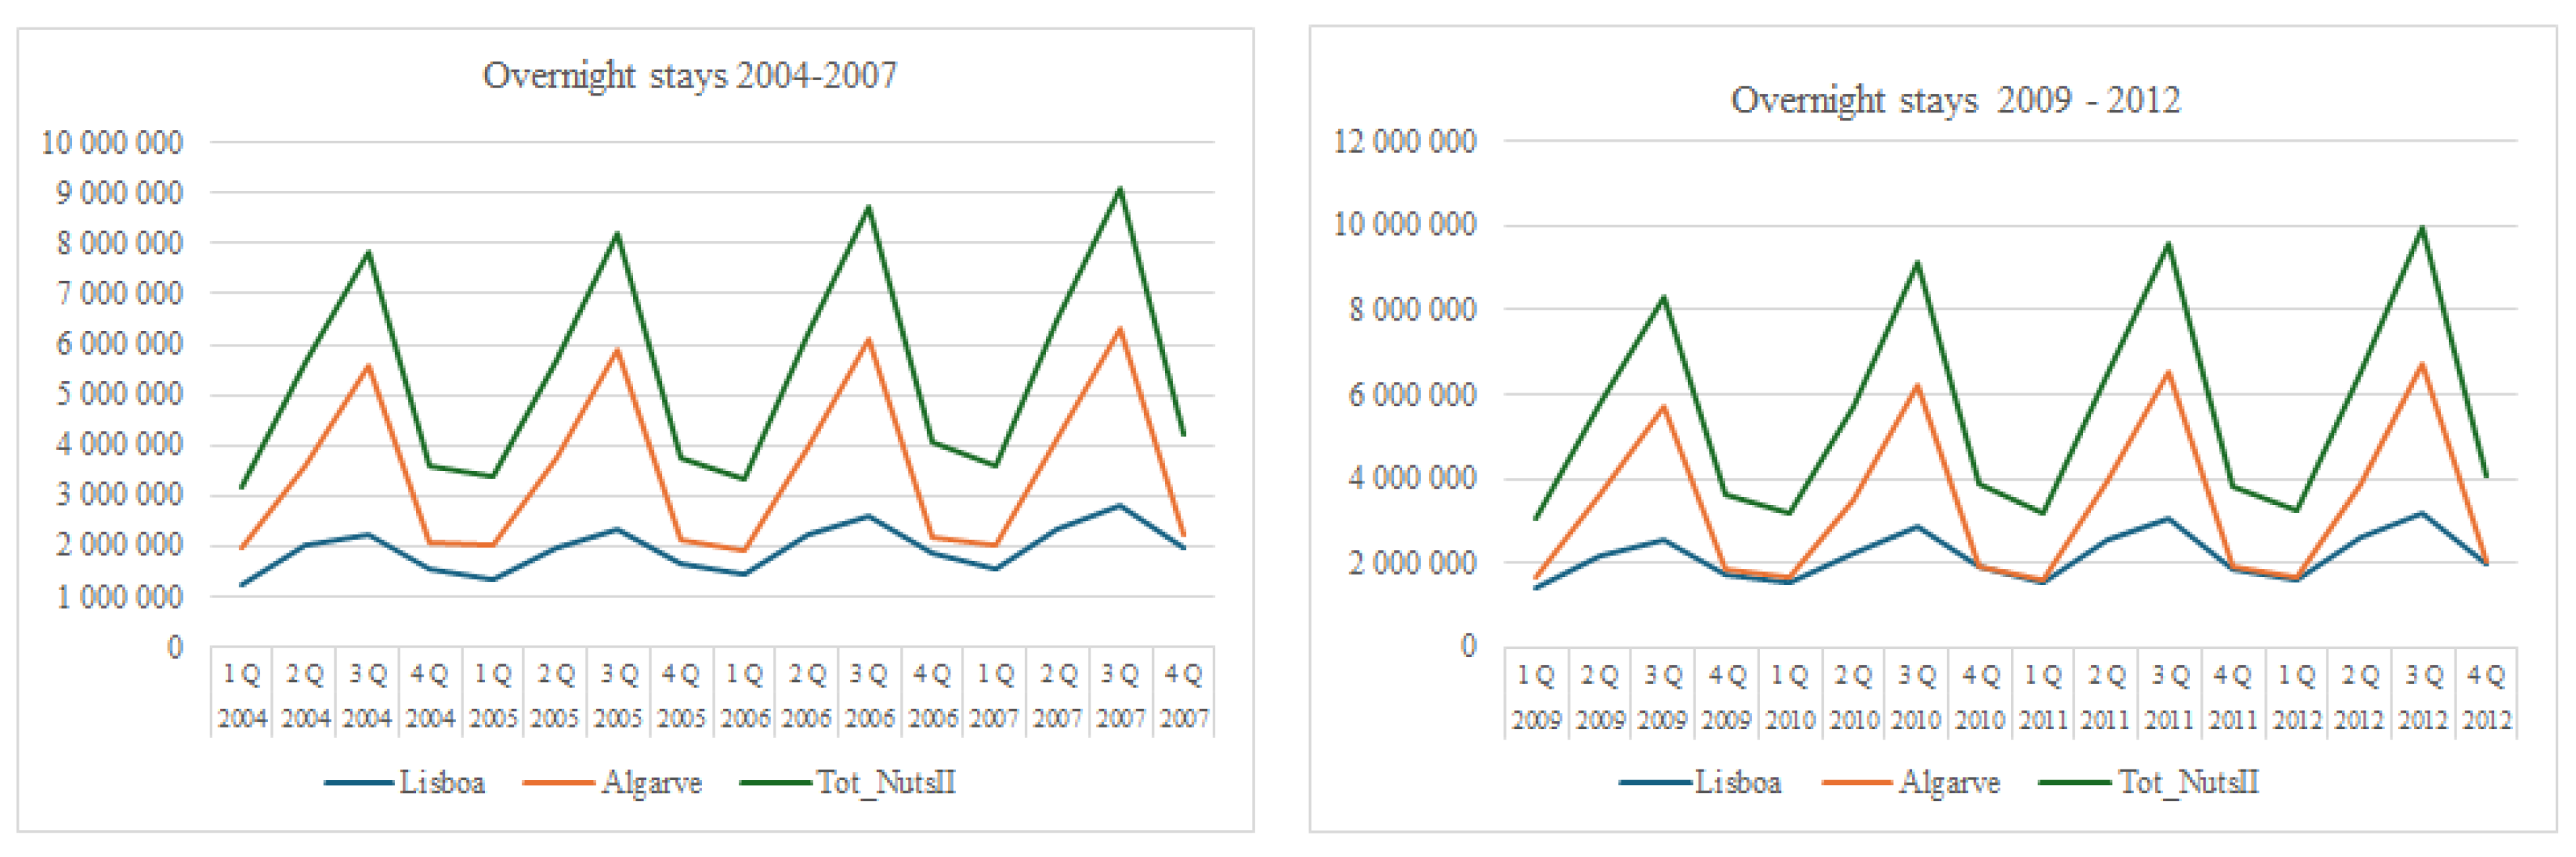
In view of the results and given that there is statistical evidence not to reject the hypothesis being tested, it can be concluded that any structural break is not significant. To support this conclusion, we present some results for two sub-periods, pre-crisis from 2004 to 2007 and post-crisis from 2008 to 2012, specifically the graphs of the series (Figure 8) and some descriptive statistics (Table 2).
Graphically, the structure of the evolution of the number of overnight stays in the three regions has remained the same.
In terms of descriptive indicators, and in the pre-crisis period of 2008, the Lisbon and Algarve regions had high average levels, with Lisbon at around 1.94 million and the Algarve at 3.5 million overnight stays. Variability, through the coefficient of variation (CV), was higher in the Algarve (47.9 per cent vs. 23.6 per cent in Lisbon), indicating greater instability in the region's data. Total of NUTS II reflected this difference, with an average of around 5.4 million and considerable dispersion (CV of 38.5 per cent). In the post-crisis period (after 2008), the Lisbon region saw average growth, rising to 2.19 million, despite a slight increase in dispersion. The Algarve suffered a slight drop in the average number of overnight stays, but saw its variability increase considerably (the CV rose to 56.7 per cent), suggesting greater economic instability. Total of NUTS II saw a small increase in the average (to 5.59 million overnight stays), but also with an increase in dispersion. In short, after the 2008 crisis, the averages generally remained the same or increased slightly, but the variability of the data increased significantly, especially in the Algarve, indicating a more volatile and unequal economic context between regions.
4.1.2. Forecast
Forecasting future values for a series of overnight stays in the three regions is one of the crucial objectives of this study. At the same time, we present the graphs (Figure 9) with the adjusted series and the forecasts based on a 95% confidence interval, until the year 2024, with historical data until 2020.
In the Lisbon region, values have increased consistently and seasonally over time. The forecast model is well calibrated up to 2020 and projects a continuation of growth, but with greater uncertainty after that point. From 2020 onwards, the confidence intervals are wider, reflecting greater uncertainty in the forecasts, especially from 2022 onwards. The Algarve shows a strongly seasonal behaviour and a gentle upward trend until 2020. The forecast indicates that this pattern will continue, but with greater uncertainty in the future. The strong seasonality and the widening of the confidence intervals reflect the dependence on variable factors such as tourism and the economic situation. The aggregate total of the NUTS II regions shows a clear pattern of growth and seasonality over time. The forecast model fits well until 2020, but uncertainties increase in the following years. Even so, the upward trend continues, suggesting a moderate economic recovery or expansion. Below are the metrics for assessing accuracy and a joint graph of the forecast error (see Table 3).
If the MAPE value is less than 10 per cent for any of the regions, it suggests perfect forecasts. On the other hand, based on the U-Theil's value, values close to 0 indicate that the model has good accuracy.
However, analysing the graph in Figure 10, which shows the evolution of the forecast errors (difference between the real value and the one estimated by the adjusted model), and as would be expected, the forecast errors are very high during the pandemic period, so it can be concluded that this period has a marked effect on the forecasting effectiveness of the ARIMA models. In subsequent quarters, the graph shows that the errors are much less marked and are close to the zero line. There is no doubt that the pandemic period had structural effects on the Portuguese economy and on the tourism sector.
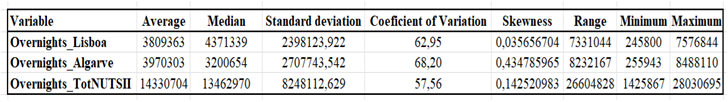
Finally, we present some descriptive statistics on the number of overnight stays in the three regions and for the period 2004:1 to 2019:4 (16 years - 64 quarters) (Table 4).
In addition to the comparison between the average and median number of overnight stays in the regions under study, which allows us to conclude that there is a positive asymmetry, indicating that the tourism sector has been growing throughout the series, the coefficient of variation, especially in the Algarve region, which exceeds 50 per cent, allows us to conclude that there is some relative dispersion in the data.
4.2. Analysis of Overnight Stays Data in Lisboa, Algarve and Total NUTS II – Period Due 2020/2024
Applying the same procedure for the previous period, now for the series from 2020 to 2024, we can see the behaviour of the number of overnight stays in the regions under study (Figure 11).
For all regions, and throughout the period analysed, there is an upward trend in the number of overnight stays, with the marked fluctuations between quarters being justified by the presence of seasonality. During 2020 and part of 2021, the figures are lower, possibly due to the impact of the COVID-19 pandemic on tourism. The region of Lisbon was one of the most affected by the COVID-19 pandemic, with a substantial drop in the number of overnight stays, especially in the first half of 2020. From 2022 onwards, Lisbon began to see a significant recovery, with an increase in the number of overnight stays, although still facing seasonal fluctuations and growing competition with other regions, such as the Algarve. From 2022 onwards, a recovery is observed, with upward trends. In short, the graph shows the behaviour of tourism over this period, with a general increase in the number of overnight stays and obvious seasonal variations.
4.2.1. Identification, Estimation and Evaluation of Diagnostics
To apply the same methodology, using the “Best Fitting” option and including period 4 in the “Seasonal Custom”, we have the model for the three regions. The best model, compared to the others, was chosen based on the AIC criterion and the value of the coefficient of determination.
For the Lisboa region, the model selected is , leading to better indicators in terms of forecasting (Figure 12).
The model identified and estimated for the Algarve region and for Total Nuts II, resulting in the following models (Figure 13 and Figure 14):
Based on what can be seen on selected models, and by analysing the statistical significance of the models’ coefficients, they are significantly different from zero, allowing us to conclude that the models are well identified.
The assessment of statistical quality, as explained above, considers the analysis of the residuals of the estimated models. Below are the respective graphs of the residual series (Figure 15, Figure 16 and Figure 17).
For the Lisbon region, between 2021 and 2022, the residuals appear to be larger, indicating greater variability, which could be explained by the pandemic crisis. From 2023 onwards, the residuals appear to be more stabilised, suggesting that the model can be used more accurately to make more consistent forecasts.
For the Algarve region, the residuals seem to oscillate around zero, but there are variations in the dispersion of the residuals over time (possible heteroscedasticity). In addition, there are cyclical patterns, suggesting autocorrelation. In this case, and due to the possible presence of heteroscedasticity, the behaviour of the residuals, which are not white noise, can be questioned. In any case, and given the respective FACP, none of the lagged values show significant autocorrelation, indicating that the adjusted ARIMA model has probably captured the structure of the data well.
For Portugal, NUTS II regions, there is a change in the variance of the residuals (heteroscedasticity). During the pandemic, there were severe travel restrictions, leading to a sharp reduction in tourism in 2020-2021. Then, with the reopening, there was a sudden recovery, with a significant increase in the number of overnight stays in 2022-2024. This increase in volatility may explain why the residuals appear more dispersed at first and then stabilise (indicating heteroscedasticity). As an alternative to the proposed methodology, and for this period, we could consider an ARIMA-GARCH model, to capture the heteroscedasticity in the residuals, making them closer to white noise.
4.2.2. Forecast
Forecasting future values for a series of overnight stays in the three regions is one of the crucial objectives of this study. At the same time, we present a graph (Figure 18) with the adjusted series and the forecasts based on a 95% confidence interval, until the year 2027. Below are the metrics for assessing accuracy and a joint graph of the forecast error.
Analysing the graphs, and for the Lisbon region, the series shows moderate fluctuations before the forecast period (2023-2024). The forecast suggests a gradual increase over time (from 2025 to 2027). For the Algarve, the graph shows periodic fluctuations, suggesting a seasonal pattern. Despite the seasonal fluctuations, the forecast suggests maintenance or slight growth over time. For Portugal, across the NUTS II region, despite the oscillations, explained by recurring seasonal patterns, the forecast indicates a gradual growth trend over time. In all regions, there is an increase in uncertainty over time: the confidence intervals become progressively wider as we move towards 2026 and 2027, which is common in long-term forecasts.

Table 5.
MAPE and U-Theil's metrics.
| Regions | MAPE (%) | U-Theil’s |
| Lisboa | 71,45 | 1,1649 |
| Algarve | 52,844 | 1,3631 |
| Tot NUTS II | 37,808 | 1,6303 |
The high MAPE and U-Theil values indicate inaccurate forecasts, especially for the Lisbon and Algarve regions. The fact that the series begins in 2020, during the pandemic crisis, may be the cause of this problem, as it generated a structural shock, causing an increase in volatility and altering behaviour patterns in the sector. The high MAPE value suggests that the models cannot accurately predict the real values, and U-Theil greater than 1 indicates that a simple model could have been more effective. To improve the forecasts, the 2020-2021 data could be excluded or smoothed, and models that better deal with structural breaks could be tested.
Finally, we present some descriptive statistics on the number of overnight stays in the three regions and for the period 2020:1 to 2024:3 (5 years - 19 quarters).
Table 6.
Descriptive statistics Overnights stay. Lisboa, Algarve and NUTS II.
 |
In terms of descriptive statistics, and for this period, the Algarve region shows greater relative variability (), indicating that the number of overnight stays in this region fluctuates more when compared to the other regions. Comparing the mean and median values, the Algarve shows a more marked asymmetry, indicating that the number of overnight stays in this region tends towards higher values. For the total of the regions, Tot NUTS II shows lower relative variability (), meaning that some regions of the country don't show such marked variability as Lisbon and the Algarve, allowing this indicator to fall.
4.3. Impact of External Shocks (Financial Crises and Pandemics) on the Number of Overnight Stays
Impacts of the Financial by NUTS II Regions
The 2008 financial crisis, which originated in financial deregulation (subprime), had an impact on the entire economy and in the tourism sector in Portugal. The financial crisis led to credit controls and a reduction in banks' financial capacity on the capital markets. This crisis had a significant impact on the rate of change of overnight stays in Portugal by NUTS II. Thus, overnight stays in Portugal were indirectly affected due to the decrease in investments and lower consumer confidence. This crisis, by having a negative impact on purchasing power, led to a reduction in spending on tourism, reflected in a decrease in occupancy rates in many regions of our country. Some regions have been hit harder than others.
A summary table are presented with the quarterly unit rates of change in three different periods, 2007 to 2008 which reflects the period before and during the crisis, 2008 to 2009 during and after the crisis and the 2009 to 2010 post-crisis period to verify the recovery or persistence of the effects.
In 2008 the tourism sector in Portugal was deeply affected by the global financial crisis that broke out in the middle of the year. This impact was reflected in the quarterly rates of change in the number of overnight stays in the country's main tourist regions: Lisbon, the Algarve and the NUTS II.
Table 7.
Quarterly Rate of Change (%) 2008/2007, 2009/2008 and 2010/2009.
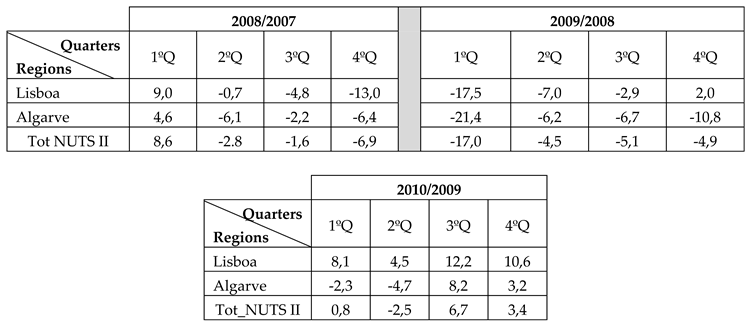 |
The year 2008 was marked by a slowdown in tourism in Portugal's main regions due to the global financial crisis. The quarterly rates of change in the number of overnight stays in Lisbon, the Algarve and the country reflect the decline in tourist demand, with sharper falls from the third quarter onwards. The impact of the crisis was felt most clearly in the last quarter of 2008, with the region’s most dependent on international tourism recording the biggest falls in overnight stays.
In 2009, the quarterly rates of change in the number of overnight stays in the Lisbon and Algarve regions and in Portugal reflected the impact of the global financial crisis, with sharp falls in the first quarters, followed by a gradual recovery in the second half of the year. Lisbon showed more obvious signs of recovery in the last quarter, with growth of 2.0 per cent, while the Algarve struggled to recover, especially in the last quarter, with a drop of -10.8 per cent. At national level, the recovery was modest but visible, with a slowdown in falls, particularly in the third and fourth quarters. The Portuguese tourism sector continued to be affected by the crisis, but 2009 marked the beginning of a gradual process of stabilisation.
In 2010, the Portuguese tourism sector began to show signs of recovery after the negative impacts of the global financial crisis that deeply affected 2009, reflected in the quarterly rates of change in the number of overnight stays. Lisboa performed particularly strongly, with growth rates in all quarters, while the Algarve, although showing signs of recovery in the third and fourth quarters, still struggled, especially in the first few months of the year. At a national level, the rates of change reflected a gradual recovery, with a strong performance in the third and fourth quarters. Although the impact of the financial crisis was still visible in 2010, the year marked a positive turning point for the tourism sector in Portugal, with a sustained recovery in the last few quarters.
This behaviour observed in the quarterly rates of change in the number of overnight stays in 2009 and 2010 is in line with the conclusions of the Chow test, which indicated that 2008 does not represent a significant structural break in the time series from 2004 to 2024. The Chow test suggested that there was no relevant structural change in the behaviour of the series after the 2008 financial crisis, which implies that the ARIMA models, which are based on time series with historical data, are not substantially affected by this crisis. Therefore, future forecasts based on ARIMA models are not jeopardised by the 2008 financial crisis, and the continuity of the time series can be considered valid for projections in subsequent years.
Brexit had a significant impact on overnight stays in all of Portugal's NUTS II regions, due to their extreme dependence on UK tourists as an inbound market. These two events, which coincide in time, Brexit and the Pandemic Crisis, should be analysed separately to identify the specific effects. However, since the data does not identify British holidaymakers, this will not be a priority in this article. Brexit (effective from 2021) introduced bureaucratic barriers, visa requirements and exchange rate changes, which may have reduced the flow of British tourists to Portugal. On the other hand, and from a theoretical point of view, if only the UK saw a drop after 2021, this indicates a specific effect of Brexit.
COVID-19 (2020-2021) has had a drastic impact on tourism due to travel restrictions, causing sharp falls and irregular recoveries. We will now analyse the impact of COVID-19 through the year-on-year rates of change in quarterly overnight stays in Portugal's NUTS II regions, starting by analysing behaviour in the pre-pandemic vs. pandemic period. The immediate impact, measured by the rates of change in the quarters from 2020 to 2019 (Table 8), reflects the period with the greatest restrictions.
According to the information above, the most severe impact is in the 2nd quarter of 2020, probably due to the lockdowns and travel restrictions caused by the pandemic crisis, with decreases of over 90% in all regions. The Lisbon region was the most affected, especially in the 2nd and 4th quarters. The Algarve, despite the decreases, had a better performance in the number of overnight stays by tourists, standing out in the 3rd quarter, which may suggest some level of recovery with tourism by residents or non-residents, albeit limited. The Total NUTS II follow the trend of the Lisbon and Algarve regions, reflecting the national composition.
Subsequently, we analysed behaviour in the recovery period, comparing the quarters of 2021 with 2020 (Table 8), assessing the initial recovery, and the rates of change of 2022 with 2019, with the aim of seeing if the number of overnight stays has returned to pre-pandemic levels.
Between 2020 and 2021, the Lisbon and Algarve regions were heavily impacted by the pandemic, with historic falls in 2020 and a slow recovery in 2021. In 2021, both regions showed signs of recovery. Variations turned slightly positive from the 2nd quarter onwards, with maximum growth (3.8%) in the Lisbon region. Even so, revealing the persistence of restrictions and the slow recovery of the tourism sector. Overall, Lisbon was the region most affected during the period, while the Algarve showed some seasonal resilience. Both territories ended 2021 still far from pre-pandemic levels.
The comparison between 2022 and 2019 (Table 9) allows us to gauge the degree of structural recovery after two years of pandemic impact. The evolution of the Lisbon and Algarve regions shows that, despite some positive signs, the sector was still recovering, with results still below pre-pandemic levels. In the 1st quarter, both regions showed sharp falls compared to 2019: Lisbon (-25.4%) and the Algarve (-23.6%), revealing a still fragile recovery at the start of the year. In the 2nd quarter, there was almost a complete recovery in Lisbon (-1.9%), while the Algarve saw a more significant drop (-7.8%). The 3rd quarter, historically the strongest for tourism, showed an increase in Lisbon (+3.1%), but a decrease in the Algarve (-6.9%), showing a reversal from previous years when the Algarve was more resilient in the summer. In the 4th quarter, Lisbon grew again compared to 2019 (+3.9%), while the Algarve remained below the pre-pandemic level (-3.5%). In short, Lisbon surpassed 2019 levels in the last two quarters, demonstrating a more solid recovery, while the Algarve remained below pre-pandemic values throughout the year, suggesting a slower and more uneven recovery between regions.
Between 2020 and 2022 (Table 8 and Table 9), Lisbon and the Algarve faced sharp falls due to the pandemic, with a slow and uneven recovery over the years. The year 2020 was the most critical: falls of over 90 per cent in the 2nd quarter in both regions. Lisbon was the worst affected overall, with sharper falls in all quarters. The year 2021 marked the beginning of a recovery, but still with very modest variations. The Algarve had a weak summer, and Lisbon recovered slightly better in the 2nd quarter. The year 2022 shows a more evident recovery in Lisbon, which surpassed 2019 levels in the last few quarters. The Algarve, on the other hand, remained below pre-pandemic values throughout the year, signalling a slower recovery.
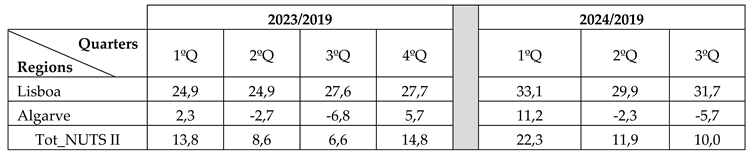
Finally, to assess the long-term trend, comparing 2023 with 2019 makes it possible to see whether the recovery has been sustained and whether structural changes are possible. Comparing the number of overnight stays in 2024 with 2019 aims to assess the recovery (or change) in 2024 (Table 10).
In 2023, compared to 2019 levels, the trends in the Lisbon and Algarve regions are quite different. Lisbon showed a strong recovery in all quarters, with consistent growth of between +24.9% and +27.7%, signalling a solid and sustained recovery, well above pre-pandemic levels. The Algarve had a more irregular behaviour, with growth in the 1st quarter (+2.3%), followed by falls in the 2nd (-2.7%) and 3rd quarters (-6.8%), even in high season. Only in the 4th quarter was there a visible recovery (+5.7%).
In 2024, the Lisbon region showed a strong and consistent performance over the three quarters. The Algarve showed a promising start but fell off in the following quarters. Portugal saw an increase, but with a gradual slowdown in the number of overnight stays compared to 2019. To summarise, we can conclude from the data that the tourism sector showed an overall recovery, but with regional differences, with Lisbon being the strongest and the Algarve presenting challenges.
Lisbon's superior performance in 2024 compared to the Algarve can be attributed to a combination of factors. The Lisbon region has benefited from a diversified tourist profile, the recovery of urban and business tourism, and greater international appeal. In contrast, the Algarve has faced challenges due to the seasonality of tourism, growing competition and changing tourist preferences. These factors, combined with economic difficulties, partly explain this region's weaker performance. In addition to the above, the Algarve region has always been very dependent on the British market. Fluctuations in the UK economy and possible post-Brexit difficulties, such as the devaluation of the pound and higher travel costs, may have had a negative impact on the number of overnight stays by British tourists in the Algarve in 2024.
5. Discussion and Results
In this study, the Box and Jenkins (Box et al., 2015) methodology has been applied to the series of quarterly overnight stays by NUTS II regions in Portugal. The main objective was to assess the impacts of the financial and pandemic crises. The graphical presentation of the series shows that there are breaks in the structure, so these abrupt changes can call into question the methodology of SARIMA models. The application of SARIMA models to the evolution of the number of quarterly overnight stays by NUTS II in Portugal made it possible to obtain some results, namely about the impact on the behaviour of the series of external effects such as the 2008 financial crisis, Brexit and the COVID-19 pandemic. In terms of the general results of applying this methodology, the seasonality component was clearly identified, and between regions, for example peaks in the 3rd quarter and troughs in the 4th quarter, and the trend of continuous growth in the number of overnight stays was visible, except for periods of shocks. Because the model shows statistical anomalies (higher than expected residuals) in crisis years, jeopardising the forecast, the analysis was carried out in two sub-periods: from 2004/1Q to 2019/4Q and 2020/1Q to 2024/3Q. In regional terms, Lisbon and the Algarve are the region’s most sensitive to external shocks, as they depend more on international tourism, justifying our choice.
The 2008 financial crisis, which stemmed from financial deregulation, had an impact on the entire economy and on Portugal's tourism sector, particularly foreign tourists. The regions that suffered the greatest impact, due to their dependence on tourism and all the associated activities, were the Algarve and Lisbon. The adjusted models show a drop in the growth trend after 2008 with a slow recovery until 2013-2014. The year 2008 was marked by a slowdown in tourism in Portugal's main regions due to the global financial crisis. The impact of the crisis was felt most clearly in the last quarter of 2008, with the region’s most dependent on international tourism recording the biggest falls in overnight stays.
In 2010, the Portuguese tourism sector began to show signs of recovery after the negative impacts of the global financial crisis that deeply affected 2009, reflected in the quarterly rates of change in the number of overnight stays. Lisboa performed particularly strongly, with growth rates in all quarters, while the Algarve, although showing signs of recovery in the third and fourth quarters, still struggled, especially in the first few months of the year. Although the impact of the financial crisis was still visible in 2010, the year marked a positive turning point for the tourism sector in Portugal, with a sustained recovery in the last few quarters.
Brexit had a significant impact on overnight stays in all of Portugal's NUTS II regions, due to their extreme dependence on UK tourists as an inbound market. However, since the data does not identify British tourists, this has not been analysed in this article. In qualitative terms, Brexit has led to a reduction in the growth of British tourists, especially in regions such as the Algarve.
During the pandemic crisis in 2020 and 2021, the number of overnight stays fell dramatically in all the regions under study. However, the regions most affected were Lisboa and the Algarve in the sum of the intermediate quarters (with average rates, considering the two intermediate quarters of 2021 compared to 2019), that exceed 60% and 50%, respectively. The immediate impact, measured by the rates of change in the quarters from 2020 to 2019, reflects the period with the greatest restrictions, with sharp drops in overnight stays of around 70 per cent in some quarters of 2020.
Between 2020 and 2021, the Lisbon and Algarve regions were heavily impacted by the pandemic, with historic drops in 2020 and a slow recovery in 2021. The comparison between 2022 and 2019 allows us to gauge the degree of structural recovery after two years of pandemic impact. The evolution of the Lisbon and Algarve regions shows that, despite some positive signs, the sector was still recovering, with results still below pre-pandemic levels.
In 2023, compared to 2019 levels, the trends in the Lisbon and Algarve regions are quite different. Lisbon showed a strong recovery in all quarters, with consistent growth above pre-pandemic levels. The Algarve, on the other hand, had a more irregular behaviour, with signs of recovery only in the 4th quarter.
In 2024, the Lisbon region showed a strong and consistent performance over the three quarters. The Algarve had a promising start but fell off in the following quarters. Portugal saw an increase, but with a gradual slowdown in the number of overnight stays compared to 2019. To summarise, we can conclude from the data that the tourism sector showed an overall recovery, but with regional differences, with Lisbon being the strongest and the Algarve presenting challenges.
In terms of forecasting, and for the period 2003-2019, there is a high degree of structural stability. The SARIMA models have a good predictive performance for the number of regional overnight stays, with low errors (see the values obtained for MAPE and U-Theil's). The series being analysed shows a positive trend over time for the various regions, and the models fitted over the period work well in short-term forecasting terms. For the 2020-2023 period, due to the structural break in the pandemic period, the estimate models fail to adequately predict the number of overnight stays with high forecast errors.
6. Conclusions and Future Research
SARIMA models capture well the dynamics of the number of overnight stays in Portugal in the absence of exogenous shocks and can be used for forecasting purposes. Each NUTS II region analysed has its own seasonal parameters, revealing the diversity of tourism in Portugal. This methodology revealed forecasting failures in the face of shocks such as the 2008 financial crisis and the COVID-19 pandemic, suggesting the need to readjust parameters or use alternative modelling for the 2020 to 2023 sub-period. After the 2021 period, the series began to return to previous patterns, but with changes in trend and seasonality, with the most prominent region being Lisbon.
In short, the external shocks left clear marks on the behaviour of the model's residuals and the recovery seen in the overnight stays series varies between regions, with a more consistent recovery in Lisbon standing out, while the Algarve region is subject to greater challenges. The Lisbon region proved to be more resilient, while the Algarve was more vulnerable to shocks. This can be explained by the Algarve's high dependence on international tourism, mainly from the UK, less tourism diversification and the fact that it is very seasonal.
In future research, we intend to apply alternative econometric models, such as autoregressive models with structural breaks, to include the variable type of accommodation, to consider regression models with number of overnight stays, type of accommodation, and turnover, and to cross-reference type of accommodation and NUTS II. To improve the forecasts, the 2020-2021 data could be excluded or smoothed to test models that deal better with structural breaks.
7. Implications and Contributions to Practice and Future Research
The results of this study make a valuable contribution to public policy, regional tourism management, and scientific research in tourism crisis contexts. Using ARIMA and SARIMA models to analyse the evolution of the number of overnight stays in NUTS II regions in the Portuguese context proved to be a robust approach in scenarios of statistical normality but was limited in the face of exogenous shocks such as the 2008 financial crisis or the 2020–22 global pandemic caused by SARS-CoV-2.
In terms of public policy, the empirical evidence presented here enables the region’s most vulnerable to external crises to be clearly identified, which could inform the development of more targeted and effective policies. For example, in the case of the Algarve, where there is high dependence on international tourism, recovery has been slower, suggesting the need for measures to promote diversification of source markets and tourism products ([2]). Furthermore, the econometric models demonstrate their usefulness as a tool for supporting planning and public decision-making by enabling the anticipation of downturn patterns and guiding promotional, financial and organisational resource management measures. [1] emphasise the importance of forecasting systems in supporting evidence-based strategic decisions, particularly during recovery phases.
The results of this study offer relevant strategic support for planning risk mitigation actions for tour operators and regional tourism entities. For example, the information broken down by region and the forecast of future tourism demand patterns enable more efficient resource management, adaptation of tourism portfolios to new consumer preferences and creation of synergies between regions to mitigate the effects of seasonality. The study also highlights the importance of digital data collection and analysis systems in promoting more responsive and informed tourism management, as [21] have pointed out.
From a scientific perspective, the study confirms the suitability of ARIMA/SARIMA models for regular time series but highlights their limitations in volatile contexts. Therefore, we suggest applying models with structural breaks, such as Bai-Perron or Markov-switching models, to future research. These models can capture abrupt transitions in the series regimes. Additionally, we recommend testing ARIMA-GARCH models, which are suitable for heteroscedastic series, and exploring hybrid approaches combining classical statistics and machine learning, as proposed by [30]. Including exogenous variables, such as exchange rates, lockdown measures, and mobility data, may also improve the predictive robustness of the models ([3]). Combining this approach with qualitative methods, such as interviews with tourism industry professionals or surveys of tourists, could provide additional insights into behavioural factors and risk perception that are not captured in quantitative models.
Finally, this analysis has important implications for the sustainability of tourism and its capacity to adapt to future crises. As argued by [8], the integration of environmental, social and carrying capacity indicators into predictive models could significantly enrich planning and management tools. Digital transformation also emerges as a central strategic axis, with tourism intelligence systems based on big data, artificial intelligence and digital platforms being fundamental to an effective, coordinated, real-time response to fluctuations in tourism demand.
In summary, this study contributes to our understanding of the differential impact of economic and pandemic crises on regional tourism in Portugal and paves the way for new methodological approaches, more robust planning practices, and more sustainable and resilient tourism development strategies.
Author Contributions
M.d.C.: Investigation, Project administration, Data collection, Supervision, Writing original draft, Writing review and editing. T.F.: Conceptualisation, Investigation, Data collection, Resources, Validation, Writing original draft, Writing review and editing. S.C.: Data curation, Formal analysis, Methodology, Resources, Validation, Writing original draft, Writing review and editing. All authors have read and agreed to the published version of the manuscript.
Funding
This study was also partially funded by national funds through the FCT-Foundation for Science and Technology under Project No. UIDB/05183/2020 (MED) and Project No. UID/MAT/04674/2020(CIMA). Funds from https://doi.org/10.54499/UIDB/04674/2020 support the author Manuel do Carmo.
Institutional Review Board Statement
The study was conducted in accordance with the Declaration of Helsinki and approved by the Ethics Committee of European University (11 November 2024).
Informed Consent Statement
Informed consent was obtained from all subjects involved in the study.
Data Availability Statement
The original contributions presented in this study are included in the article. Further inquiries can be directed at the corresponding author.
Acknowledgments
The authors are pleased to acknowledge the financial support from Lisbon Accounting and Business School – Lisbon Polytechnic Institute, Portugal (ISCAL-IPL).
Conflicts of Interest
The authors declare no conflicts of interest.
References
- Rosanna Mueller; Nuno Sobreira Tourism Forecasts after COVID-19: Evidence of Portugal. Ann. Tour. Res. Empir. Insights 2024. [CrossRef]
- Fernando Rebola; Luís Loures; Paulo Ferreira; Ana Loures Inland or Coastal: That’s the Question! Different Impacts of COVID-19 on the Tourism Sector in Portugal. Sustainability 2022, 14, 16248–16248. [CrossRef]
- Maria de Fatima Brilhante; Maria Luísa Rocha COVID-19 Pre-Pandemic Tourism Forecasts and Pos-Pandemic Signs of Recovery Assessment for Portugal. Res. Glob. 2023. [CrossRef]
- Daniel, A.; Rodrigues, P. Assessing the Impact of Shocks on International Tourism Demand for Portugal. Tour. Econ. 2012, 18, 617–634. [Google Scholar] [CrossRef]
- Silva, S.; Carvalho, P. Impact of COVID-19 on Summer Holiday Behaviours: Evidence from Portugal. ANATOLIA-Int. J. Tour. Hosp. Res. 2022, 33, 688–691. [Google Scholar] [CrossRef]
- Sass, K.S.; Maciel, R.F.; Dentinho, T.P. The Impact of COVID-19 on Tourism, Employment, and Population of the Azores Islands. Lett. Spat. Resour. Sci. 2023, 16, 42. [Google Scholar] [CrossRef]
- Castro, C.; Dieguez, T. Tourist Behaviour in the COVID-19 Pandemic Context. In Proceedings of the Advances in Tourism, Technology and Systems; Abreu, A., Liberato, D., Garcia Ojeda, J.C., Eds.; Springer Nature Singapore: Singapore, 2022; pp. 77–89.
- Gössling, S.; Scott, D.; Hall, C.M. Pandemics, Tourism and Global Change: A Rapid Assessment of COVID-19. J. Sustain. Tour. 2020, 29, 1–20. [Google Scholar] [CrossRef]
- Ritchie, B.W. Chaos, Crises and Disasters: A Strategic Approach to Crisis Management in the Tourism Industry. Tour. Manag. 2004, 25, 669–683. [Google Scholar] [CrossRef]
- Xu, H.L.; Han, F. Fear Segments in Tourism under Current Economic Crisis. Presented at the STATISTIC APPLICATION IN SCIENTIFIC AND SOCIAL REFORMATION, 2010.
- Song, H.; Lin, S. Impacts of the Financial and Economic Crisis on Tourism in Asia. J. TRAVEL Res. 2010, 49, 16–30. [Google Scholar] [CrossRef]
- Mertlová, L.; Smith, V. THE IMPACT OF THE GLOBAL ECONOMIC CRISIS ON THE DEVELOPMENT OF TOURISM IN THE CZECH REPUBLICy. Presented at the AKTUALNI PROBLEMY CESTOVNIHO RUCHU: CESTOVNI RUCH A JEHO DOPADY NA SPOLECNOST / TOURISM AND ITS IMPACTS ON SOCIETY. TOURISM AND ITS IMPACTS ON SOCIETY, 2014.
- Page, S. Tourism Management : Managing for Change; 3rd ed.; Routledge: Burlington, 2014; ISBN 1-136-43392-9. [Google Scholar]
- Pegkas, P. The Efficiency of the Tourism Industry in Greece during the Economic Crisis (2008 - 2016). Eur. J. Tour. Res. 2022, 32. [Google Scholar] [CrossRef]
- Visser, G.; Ferreira, S. Global Change and Economic Crisis in Tourism. Tour. Geogr. 2011, 13, 325–327. [Google Scholar] [CrossRef]
- Özcan, S.; Erbiyik, H.; Karaboga, K. The Effects of European Economic Crisis on the Tourism Travel Companies in Turkey. Presented at the 8TH INTERNATIONAL STRATEGIC MANAGEMENT CONFERENCE, 2012.
- Perles-Ribes, J.F.; Ramón-Rodríguez, A.B.; Padilla, A.O. Brexit Announcement: Immediate Impact on British Tourism in Spain. CORNELL Hosp. Q. 2019, 60, 97–103. [Google Scholar] [CrossRef]
- Burnett, M.; Johnston, T. Brexit Anticipated Economic Shock on Ireland’s Planning for Hospitality and Tourism: Resilience, Volatility and Exposure. Tour. Rev. 2020, 75, 595–606. [Google Scholar] [CrossRef]
- Coles, T. Tourism, Brexit and the Climate Crisis: On Intersecting Crises and Their Effects. J. Sustain. Tour. 2021, 29, 1529–1546. [Google Scholar] [CrossRef]
- Dutta, A.; Mishra, T.; Uddin, G.S.; Yang, Y. Brexit Uncertainty and Volatility Persistence in Tourism Demand. Curr. ISSUES Tour. 2021, 24, 2225–2232. [Google Scholar] [CrossRef]
- Almeida, F.; Silva, O. THE IMPACT OF COVID-19 ON TOURISM SUSTAINABILITY: EVIDENCE FROM PORTUGAL. Adv. Hosp. Tour. Res.-AHTR 2020, 8, 440–446. [Google Scholar] [CrossRef]
- Lopes, A.; Sargento, A.; Carreira, P. Vulnerability to COVID-19 Unemployment in the Portuguese Tourism and Hospitality Industry. Int. J. Contemp. Hosp. Manag. 2021, 33, 1850–1869. [Google Scholar] [CrossRef]
- Witt, S.F.; Witt, C.A. Modeling and Forecasting Demand in Tourism; Academic Press: London, 1992; ISBN 0-12-760740-4. [Google Scholar]
- Dickey, D.A.; Fuller, W.A. Distribution of the Estimators for Autoregressive Time Series with a Unit Root. J. Am. Stat. Assoc. 1979, 74, 427–431. [Google Scholar] [CrossRef]
- PHILLIPS, P.C.B.; PERRON, P. Testing for a Unit Root in Time Series Regression. Biometrika 1988, 75, 335–346. [Google Scholar] [CrossRef]
- Kwiatkowski, D.; Phillips, P.C.B.; Schmidt, P.; Shin, Y. Testing the Null Hypothesis of Stationarity against the Alternative of a Unit Root: How Sure Are We That Economic Time Series Have a Unit Root? J. Econom. 1992, 54, 159–178. [Google Scholar] [CrossRef]
- Box, G.E.; Jenkins, G.M.; Reinsel, G.C.; Ljung, G.M. Time Series Analysis: Forecasting and Control; John Wiley & Sons, H., Ed.; 5th ed.; 2015; ISBN 978-1-118-67502-1.
- Hyndman, R.J.; Athanasopoulos, G. Forecasting: Principles and Pratice; OTexts. com, Ed.; 3nd ed.; OTexts: Melbourne, Australia, 2021.
- Pulido, A.; Pérez, J. Modelos Econométricos. Ediciones Pirámide Mex. 2001.
- Zopiatis, A.; Pericleous, K.; Theofanous, Y. COVID-19 and Hospitality and Tourism Research: An Integrative Review. J. Hosp. Tour. Manag. 2021, 48, 275–279. [Google Scholar] [CrossRef]
Figure 1.
Time Series Plot. Lisboa, Algarve and regions NUTS II.
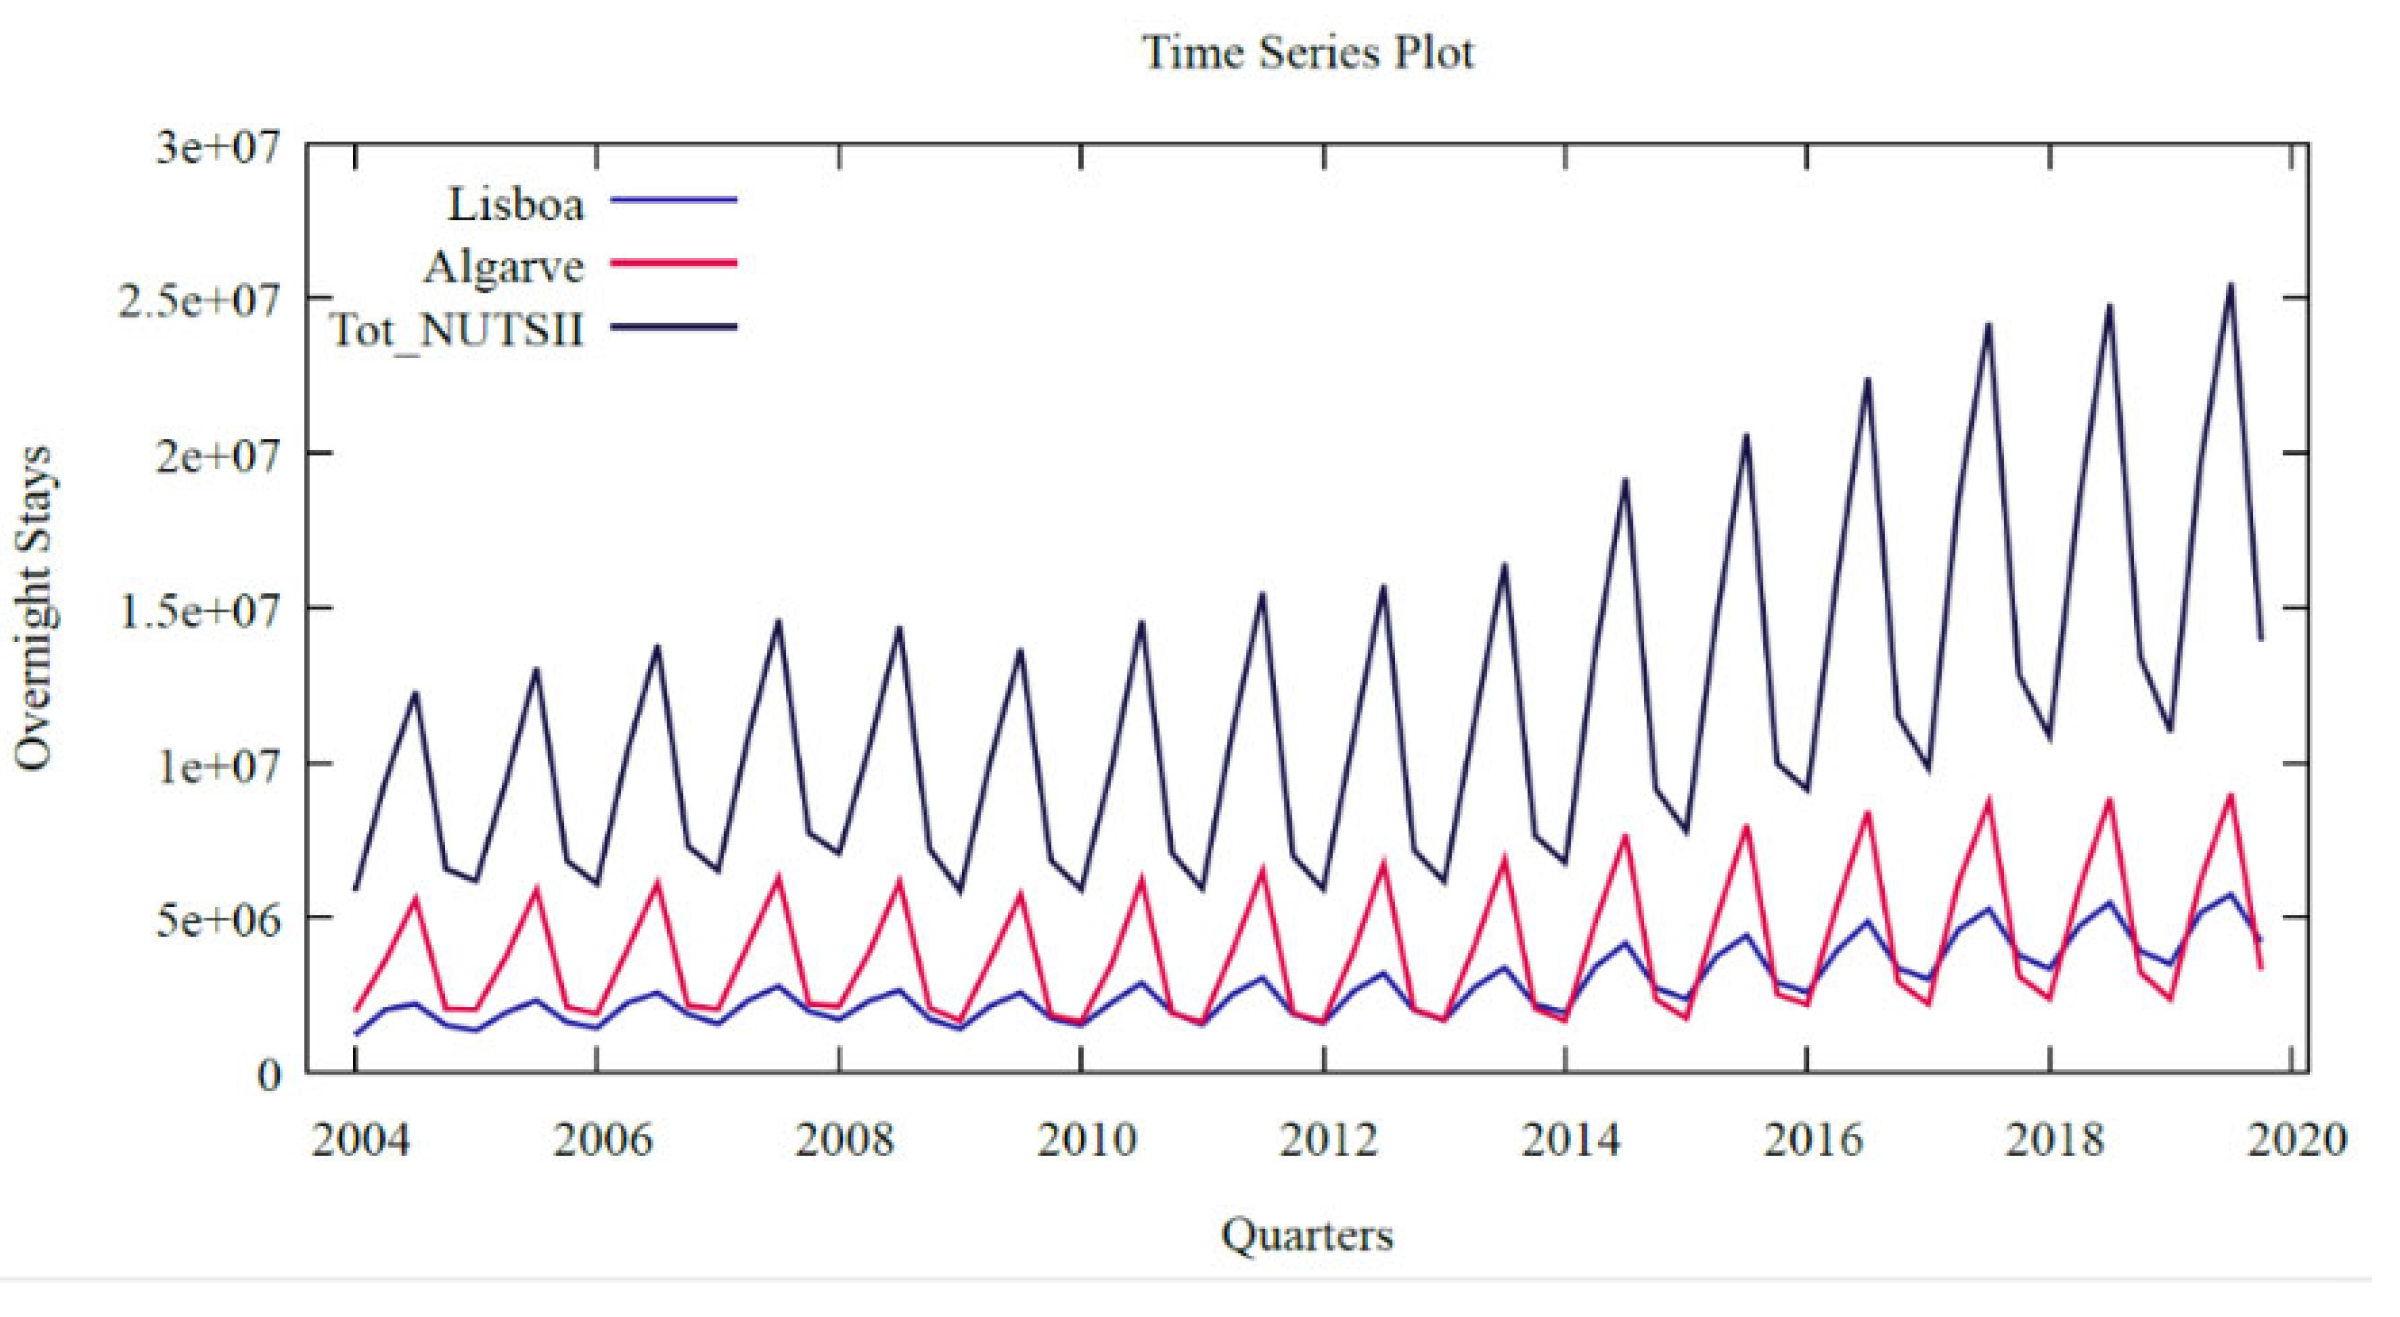
Figure 2.
model. Lisboa.
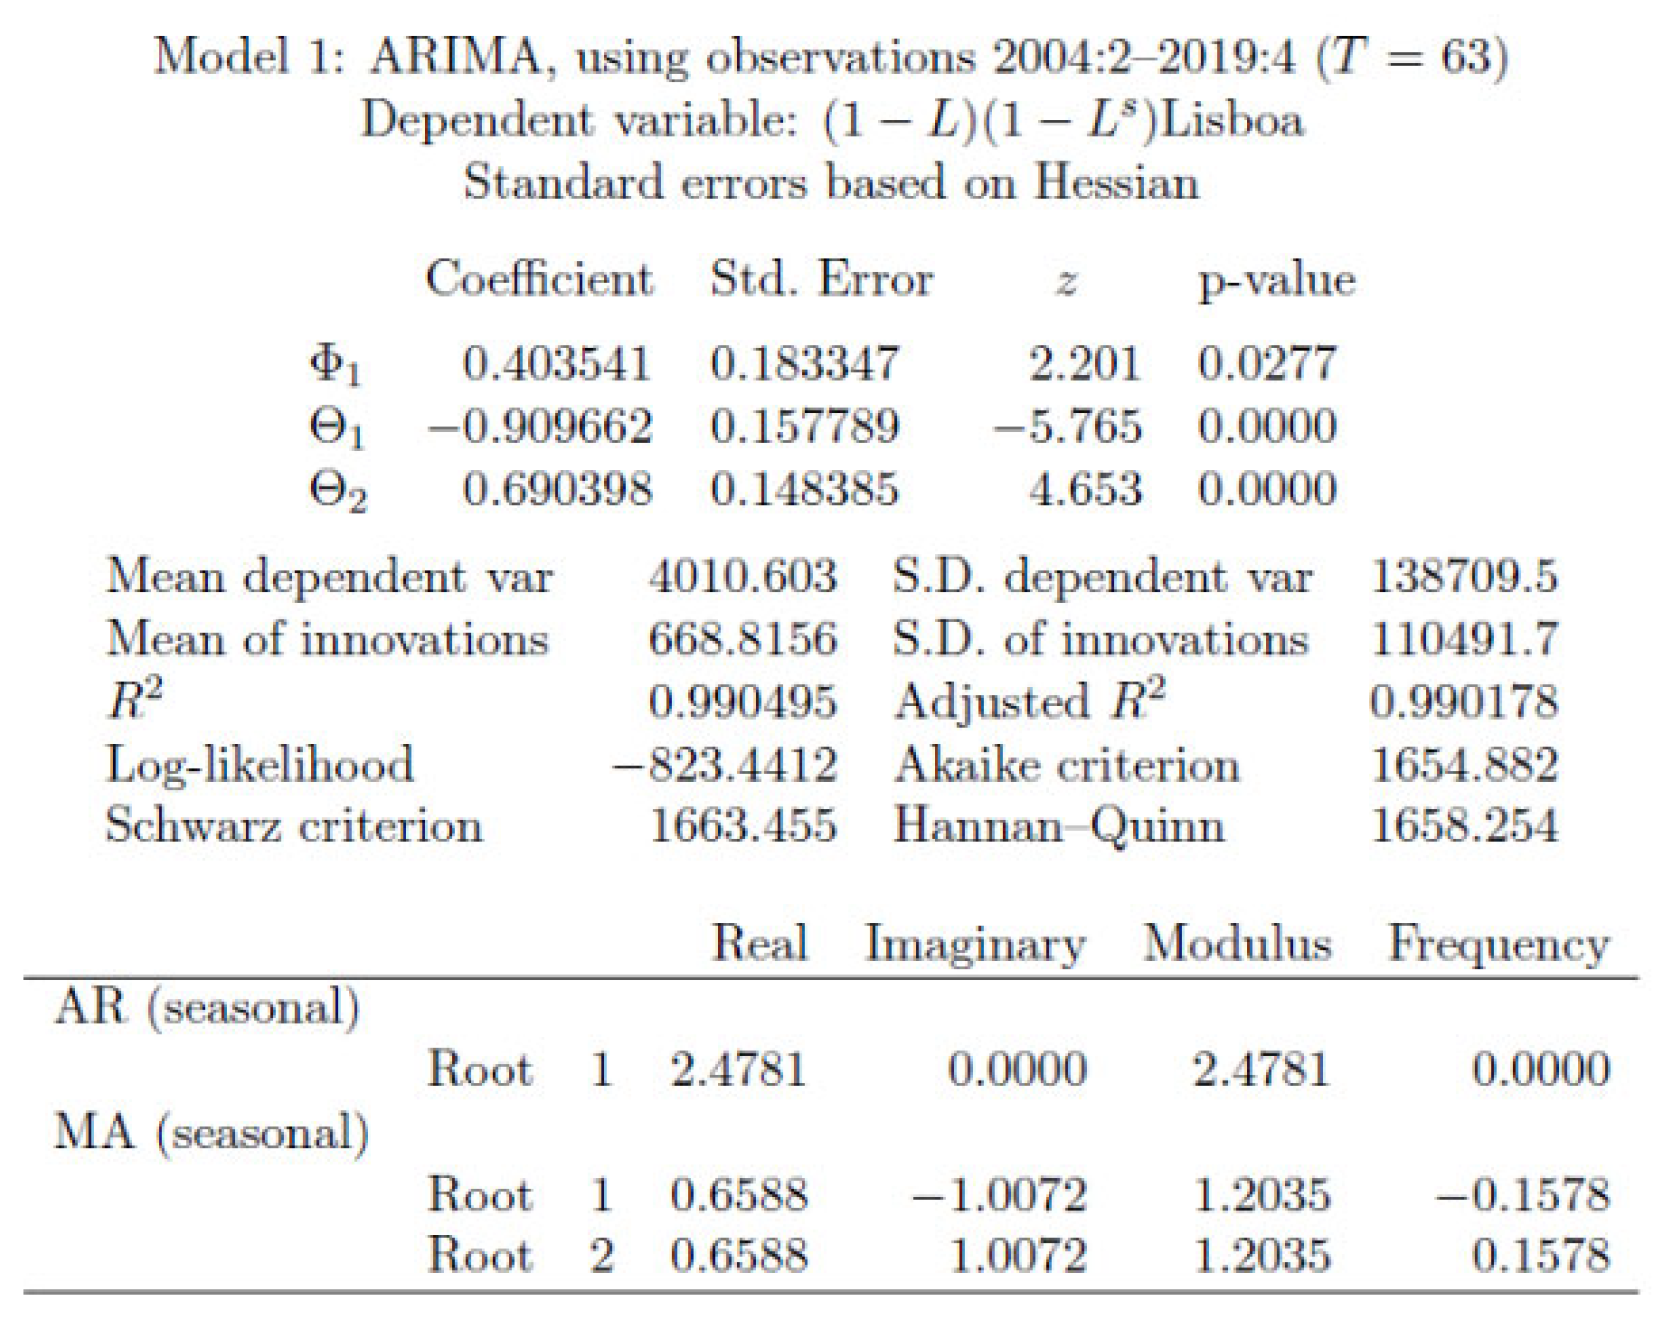
Figure 3.
model. Algarve.
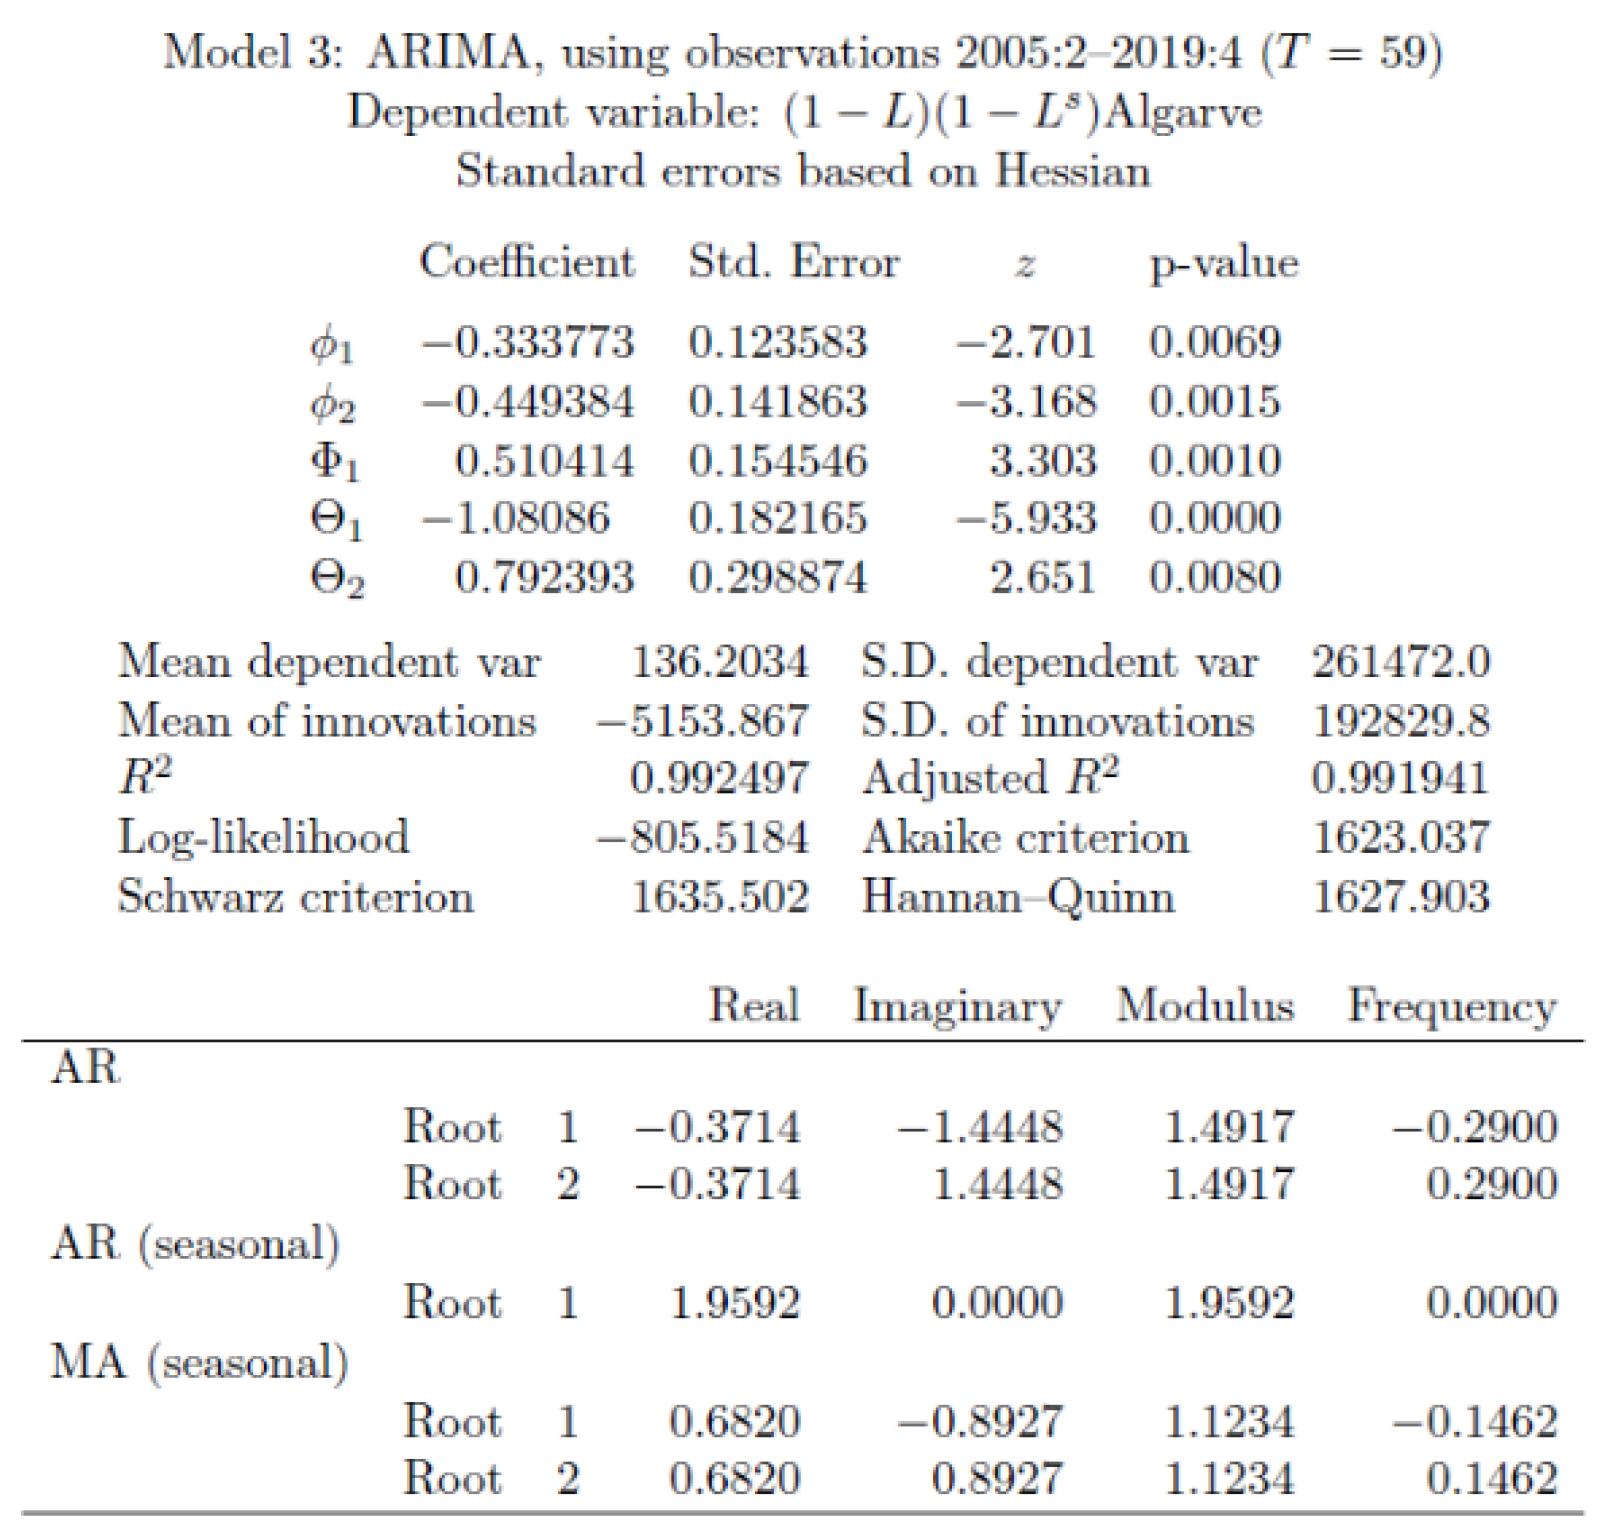
Figure 4.
model. Total NUTS II.
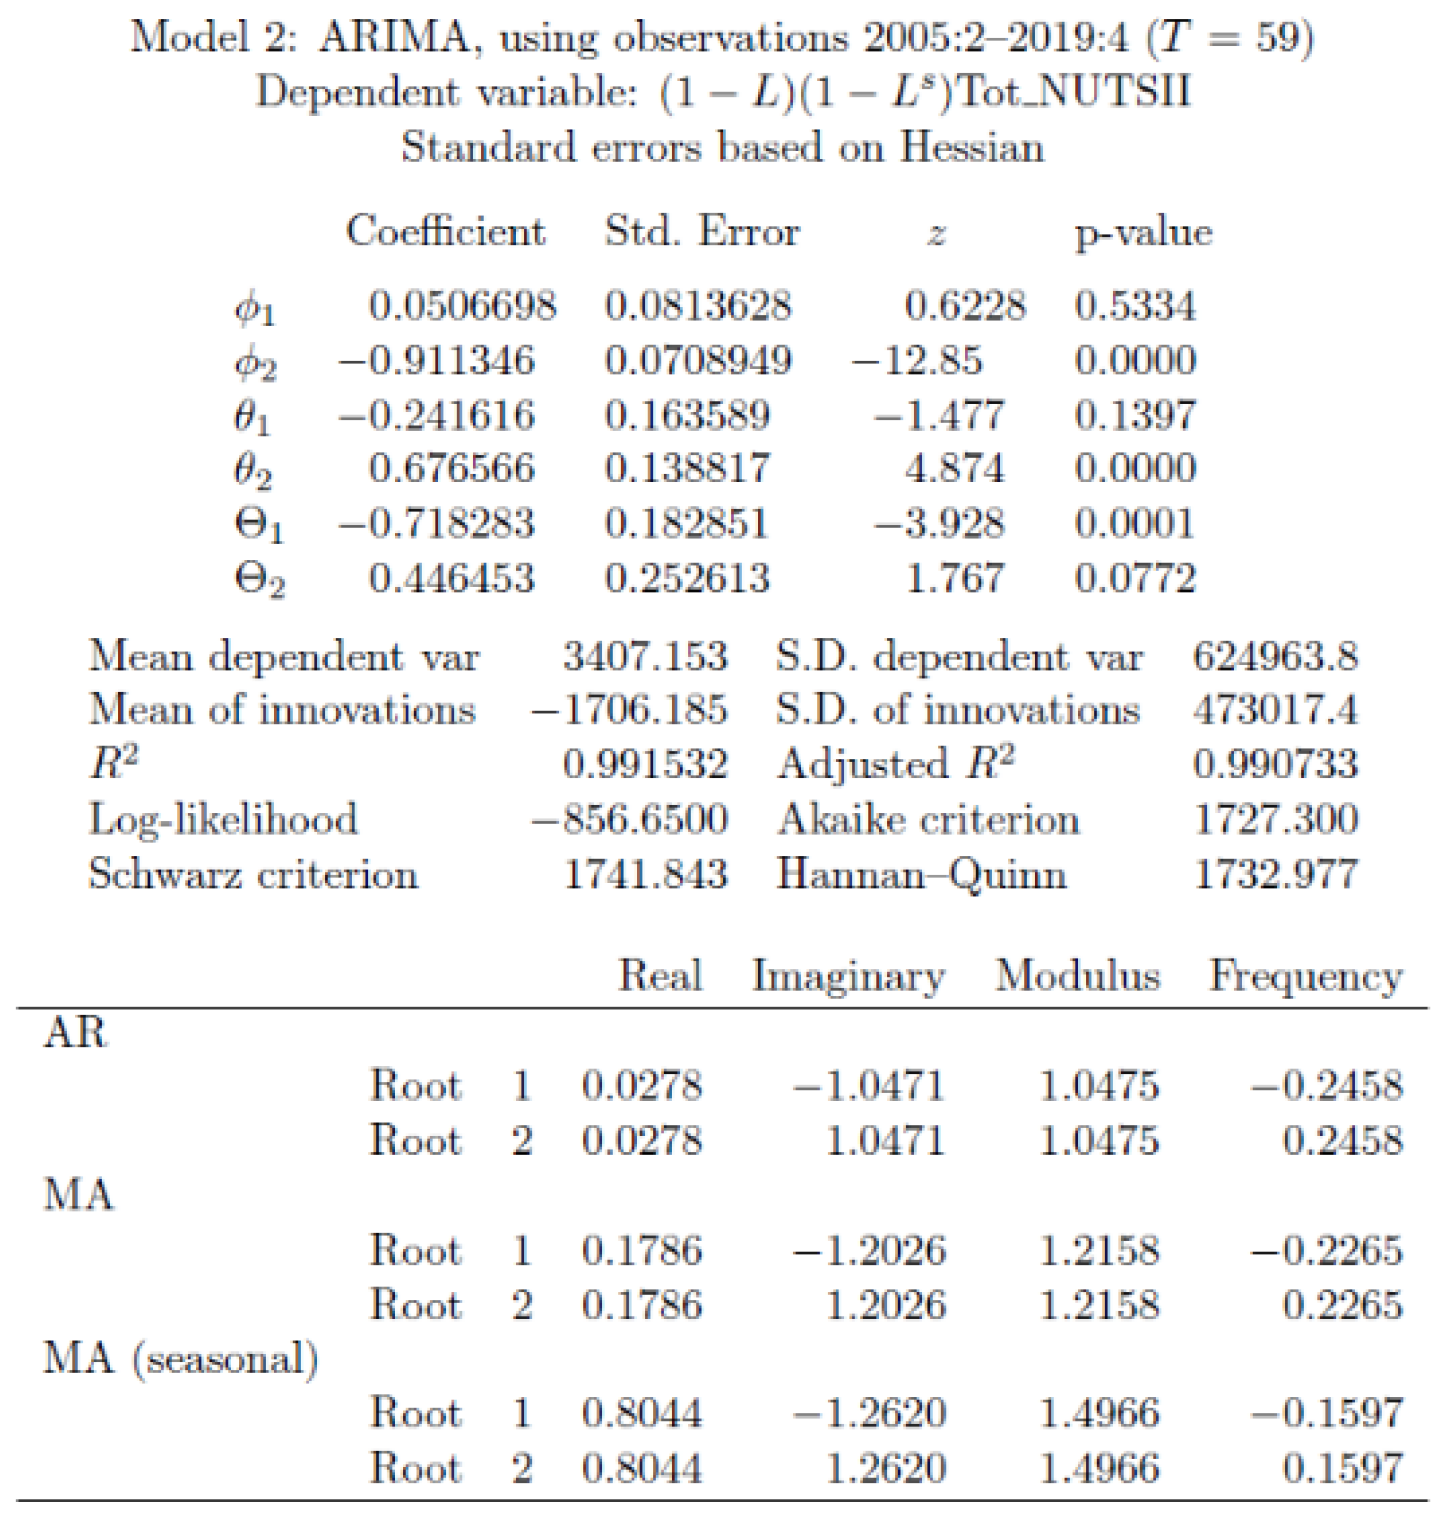
Figure 5.
Time Series Plot Residuals. Residuals Autocorrelation Functions (ACF and PAF). QQ Plot. Lisboa.
Figure 5.
Time Series Plot Residuals. Residuals Autocorrelation Functions (ACF and PAF). QQ Plot. Lisboa.
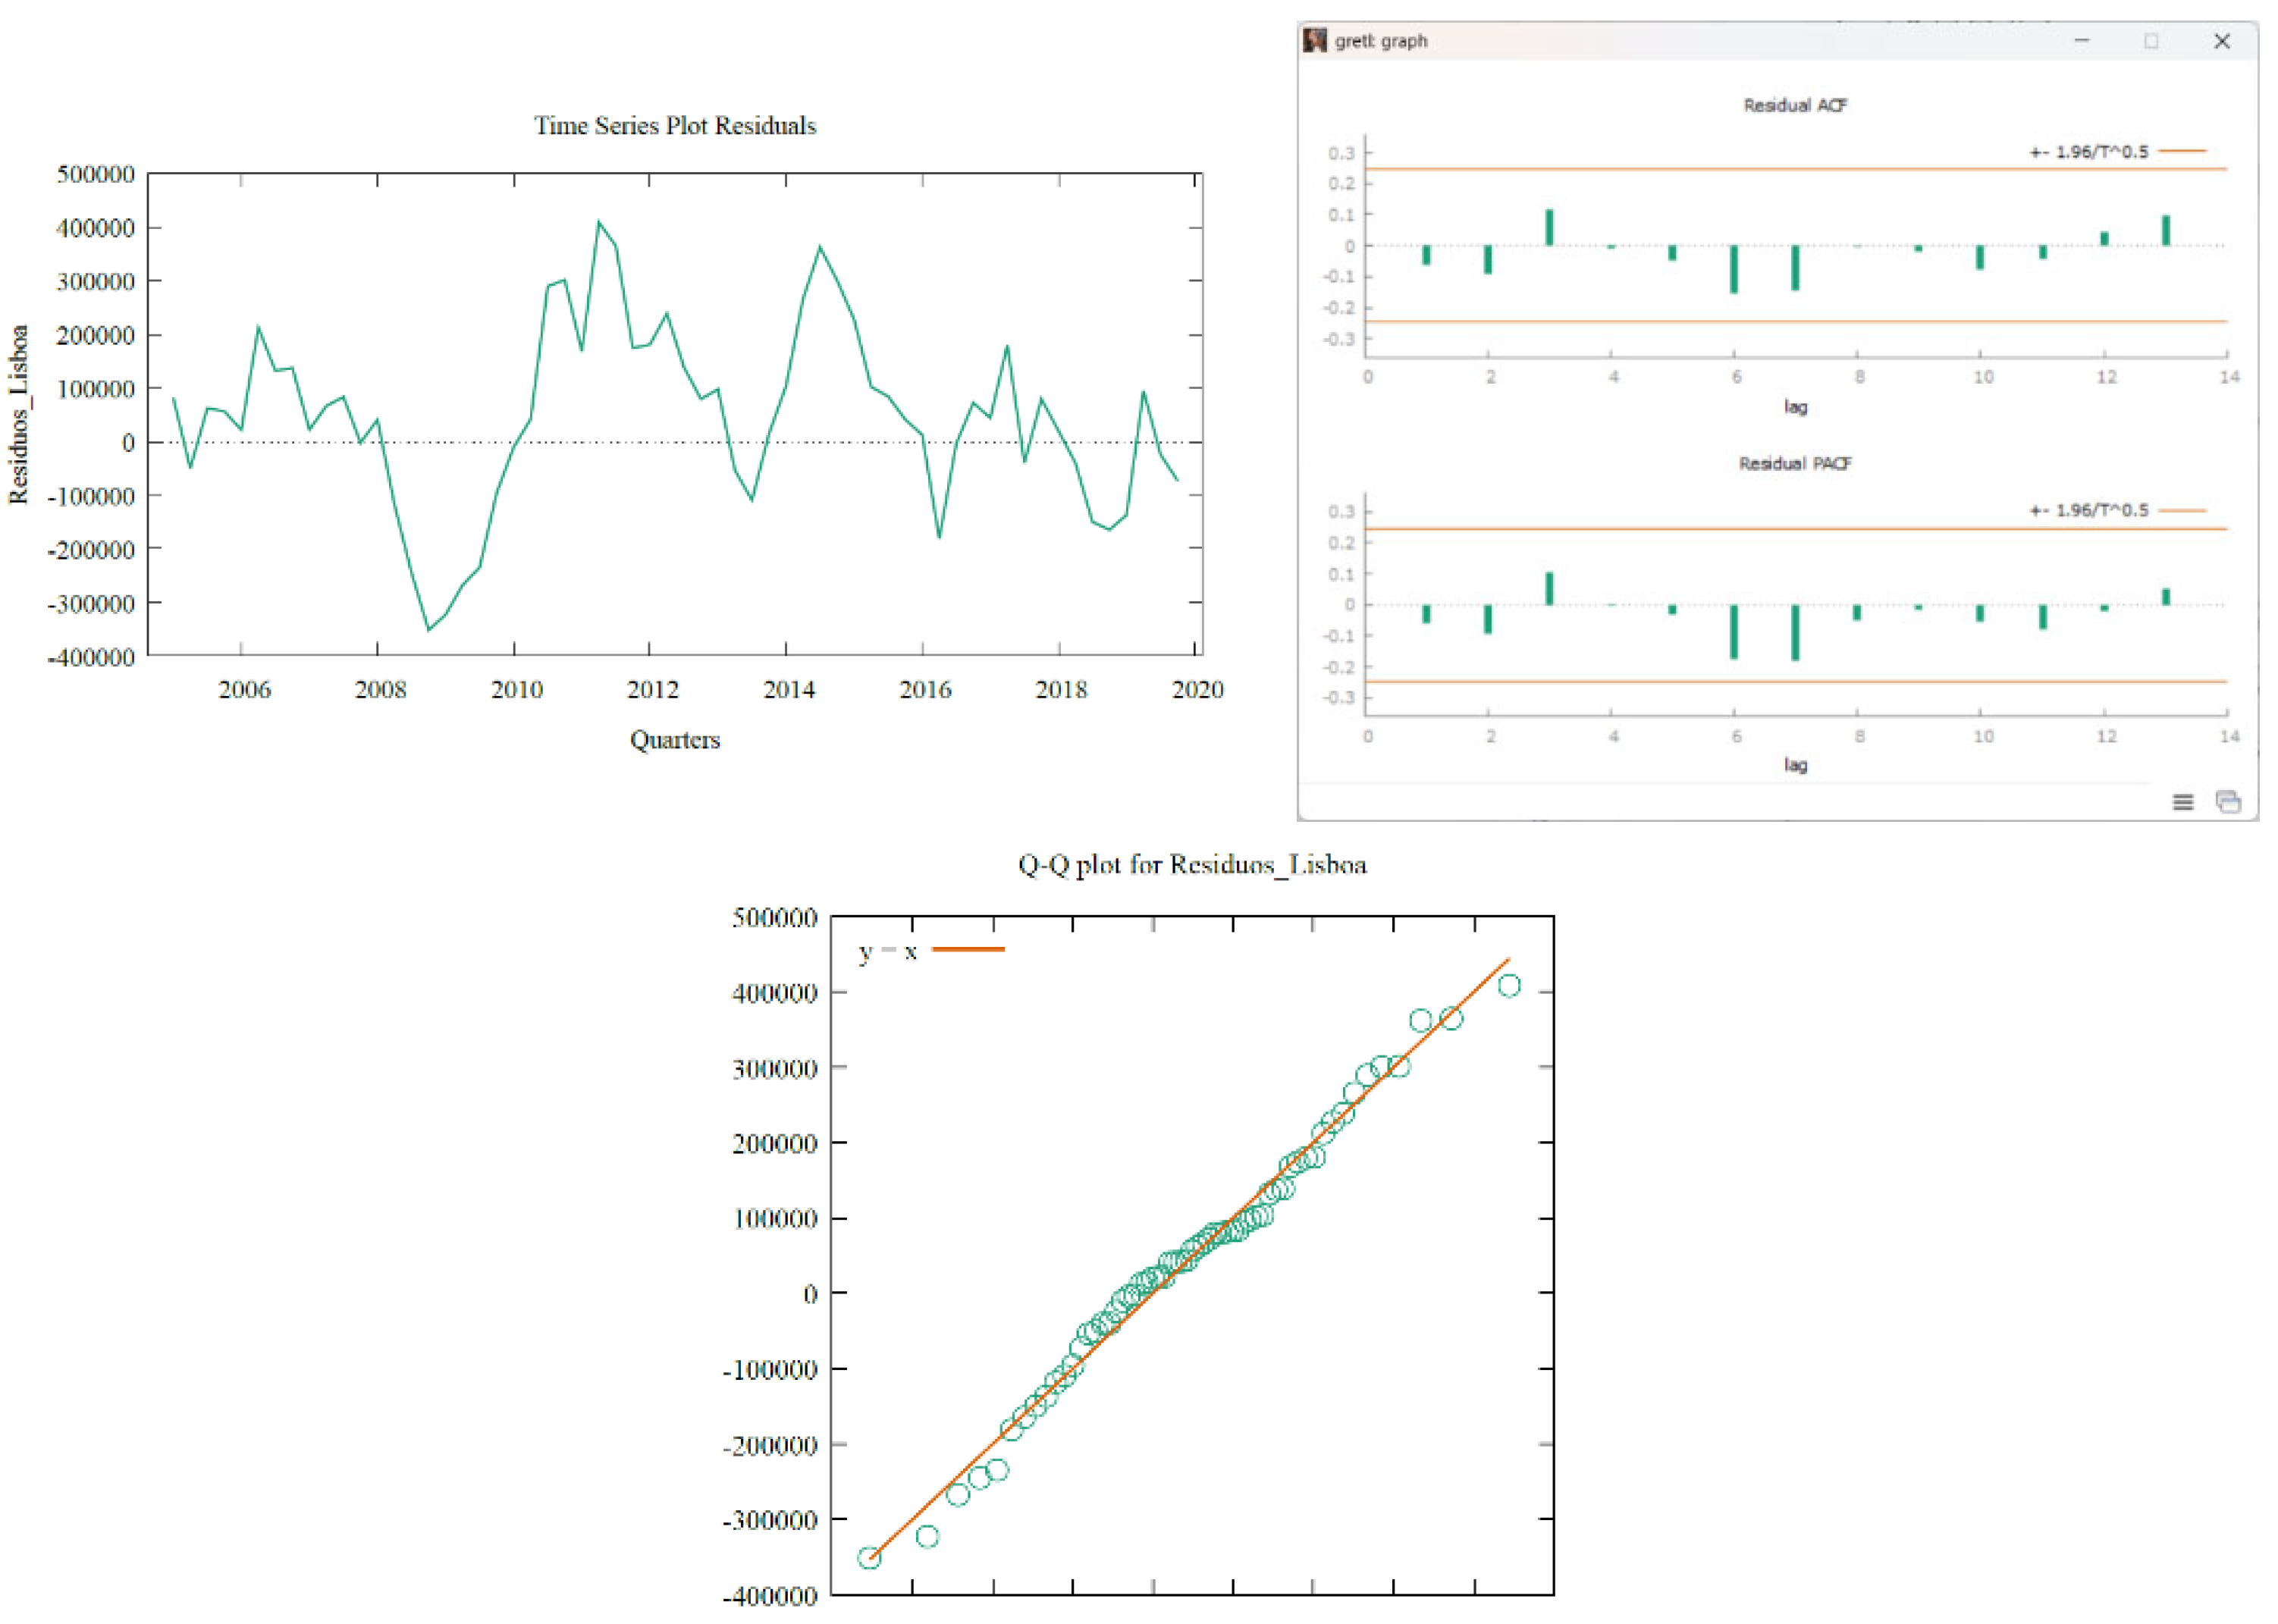
Figure 6.
Time Series Plot Residuals. Residuals Autocorrelation Functions (ACF and PAF). QQ Plot. Algarve
Figure 6.
Time Series Plot Residuals. Residuals Autocorrelation Functions (ACF and PAF). QQ Plot. Algarve
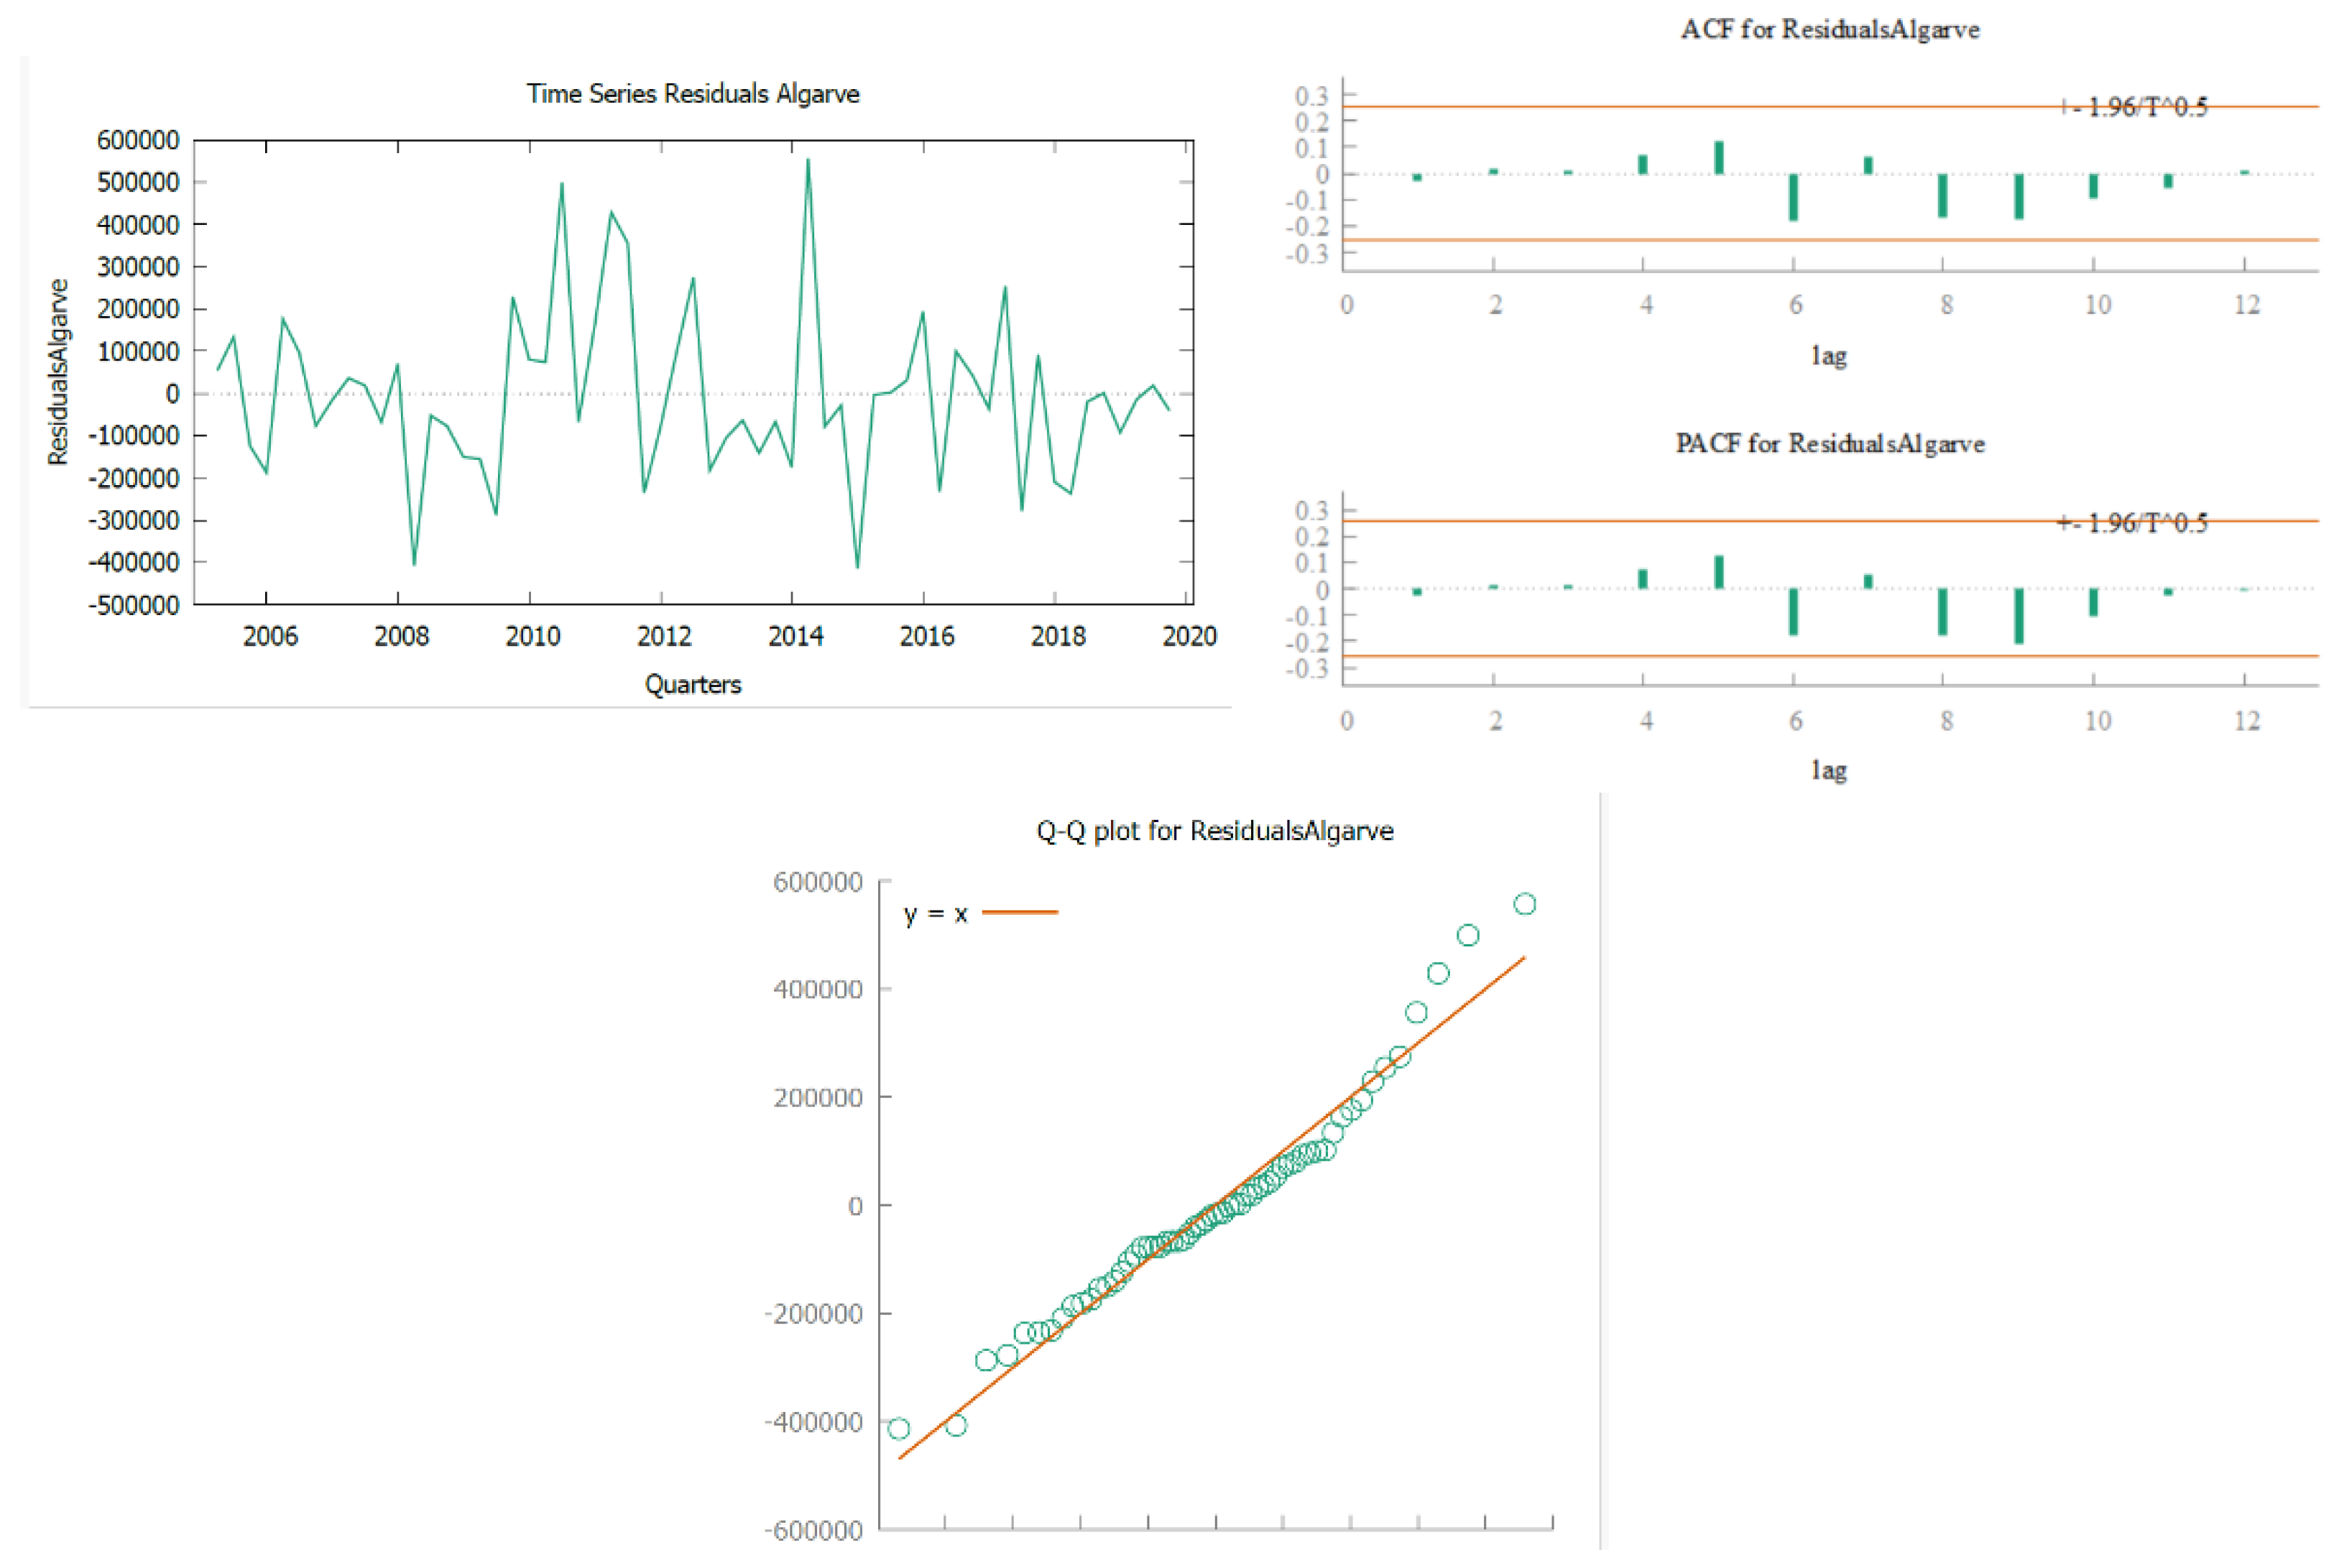
Figure 7.
Time Series Plot Residuals. Residuals Autocorrelation Functions (ACF and PAF). QQ Plot. NUTS II.
Figure 7.
Time Series Plot Residuals. Residuals Autocorrelation Functions (ACF and PAF). QQ Plot. NUTS II.
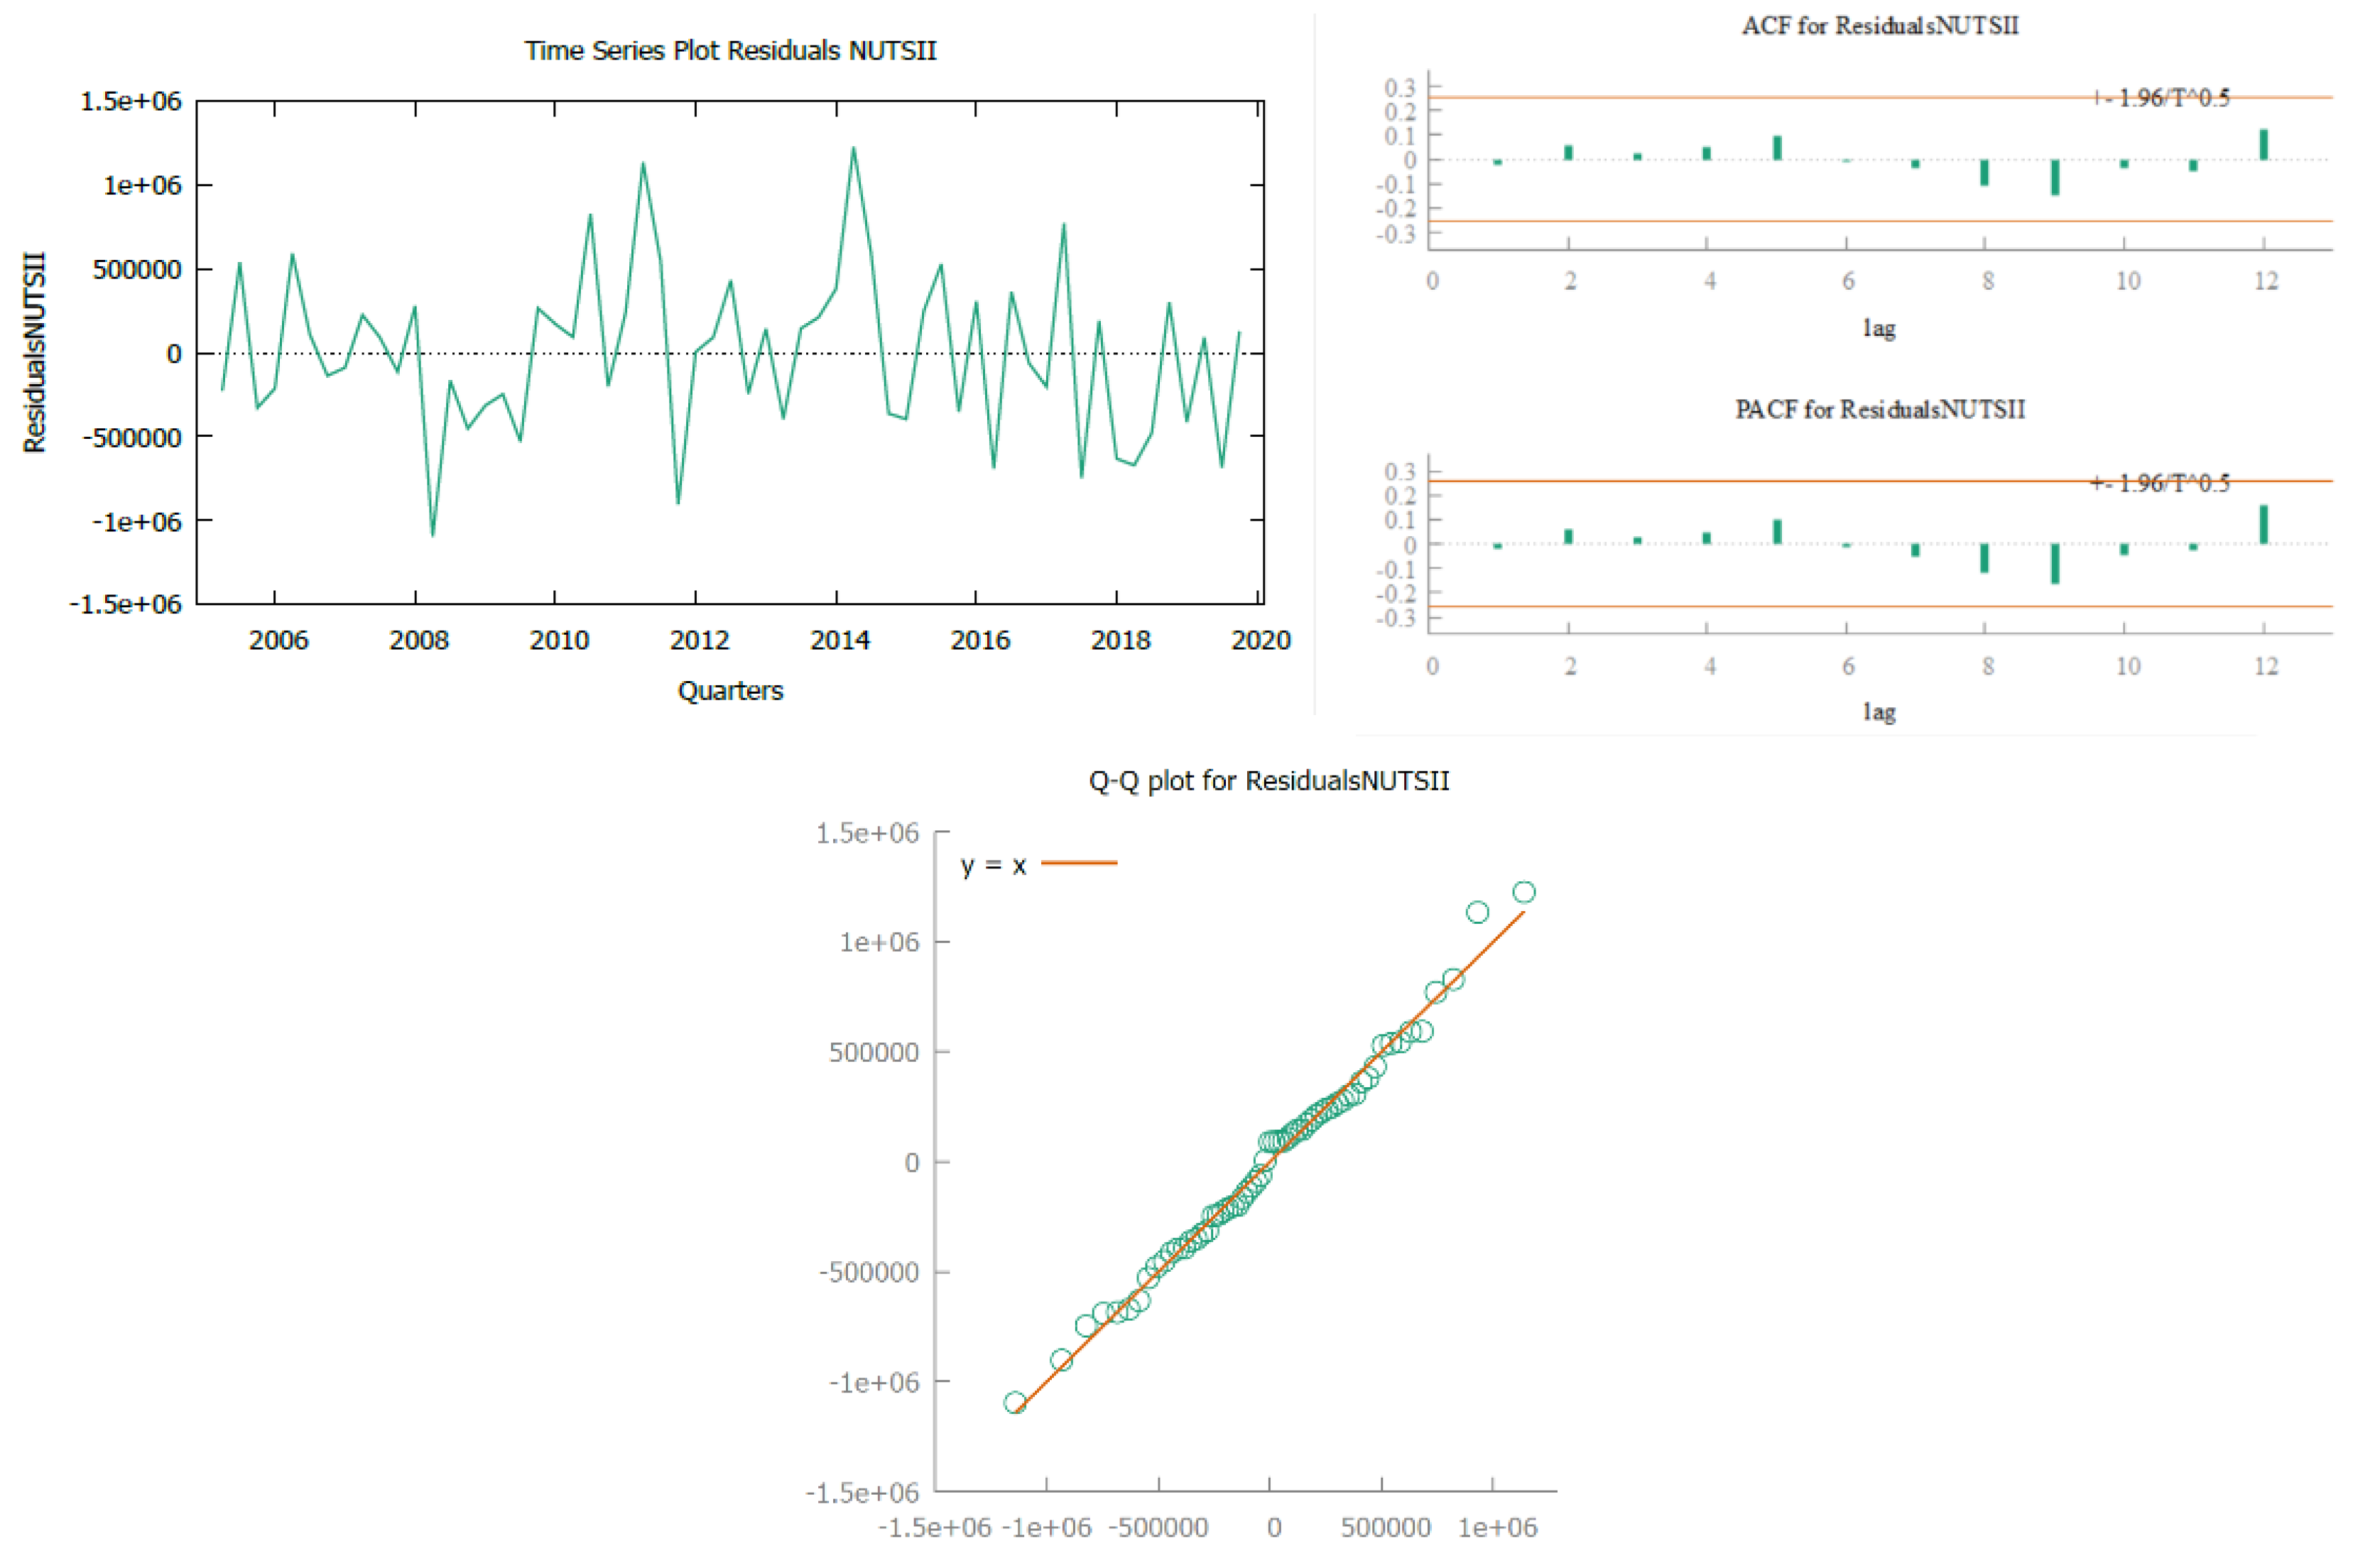
Figure 8.
Time Series Plot overnight stays (2004-2007) and (2009-2012).
| Adjusted Model Region Lisboa: with |
| Adjusted Model Region Algarve: with |
| Adjusted Model Region NUTS II: with |
Figure 9.
Forecast Lisboa, Algarve and NUTS II (2020:1 to 2024:4).
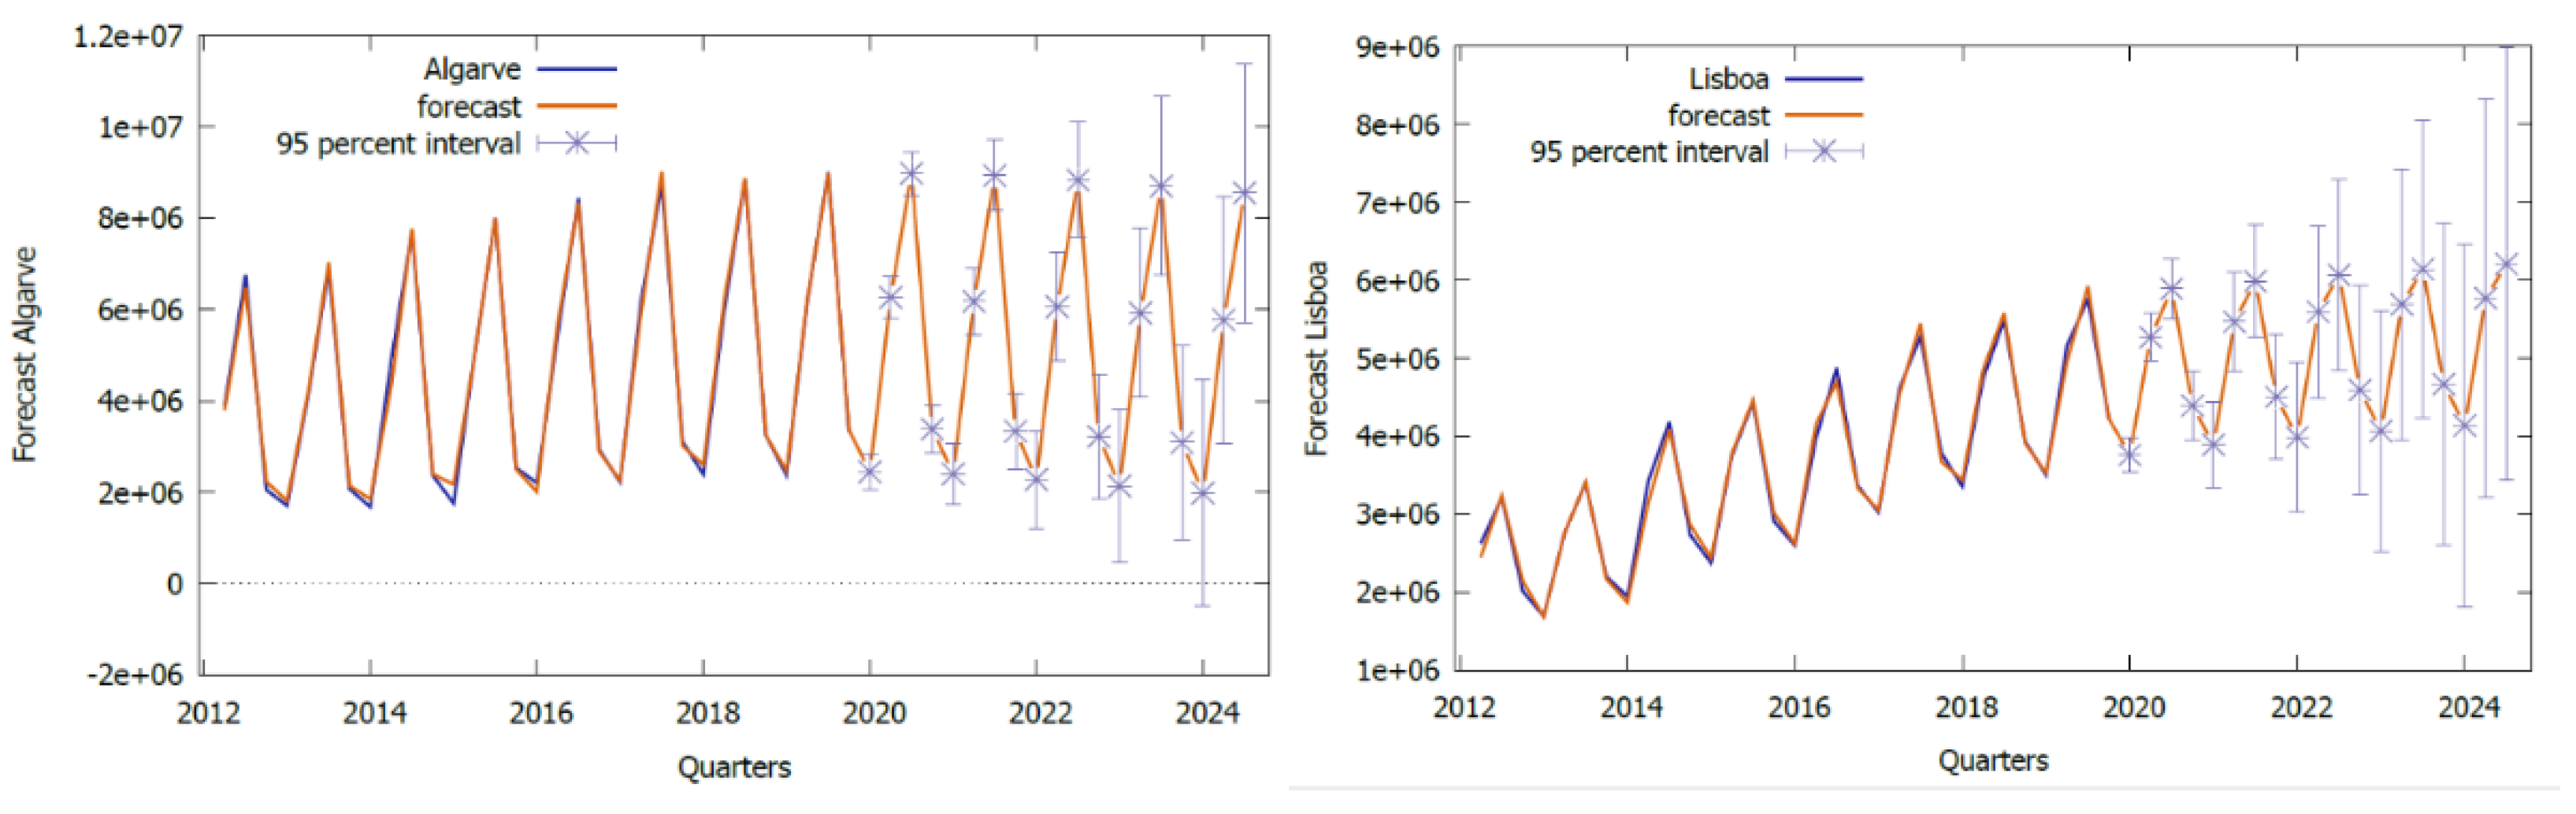
Figure 10.
Forecast Error (2020:1 to 2024:4).
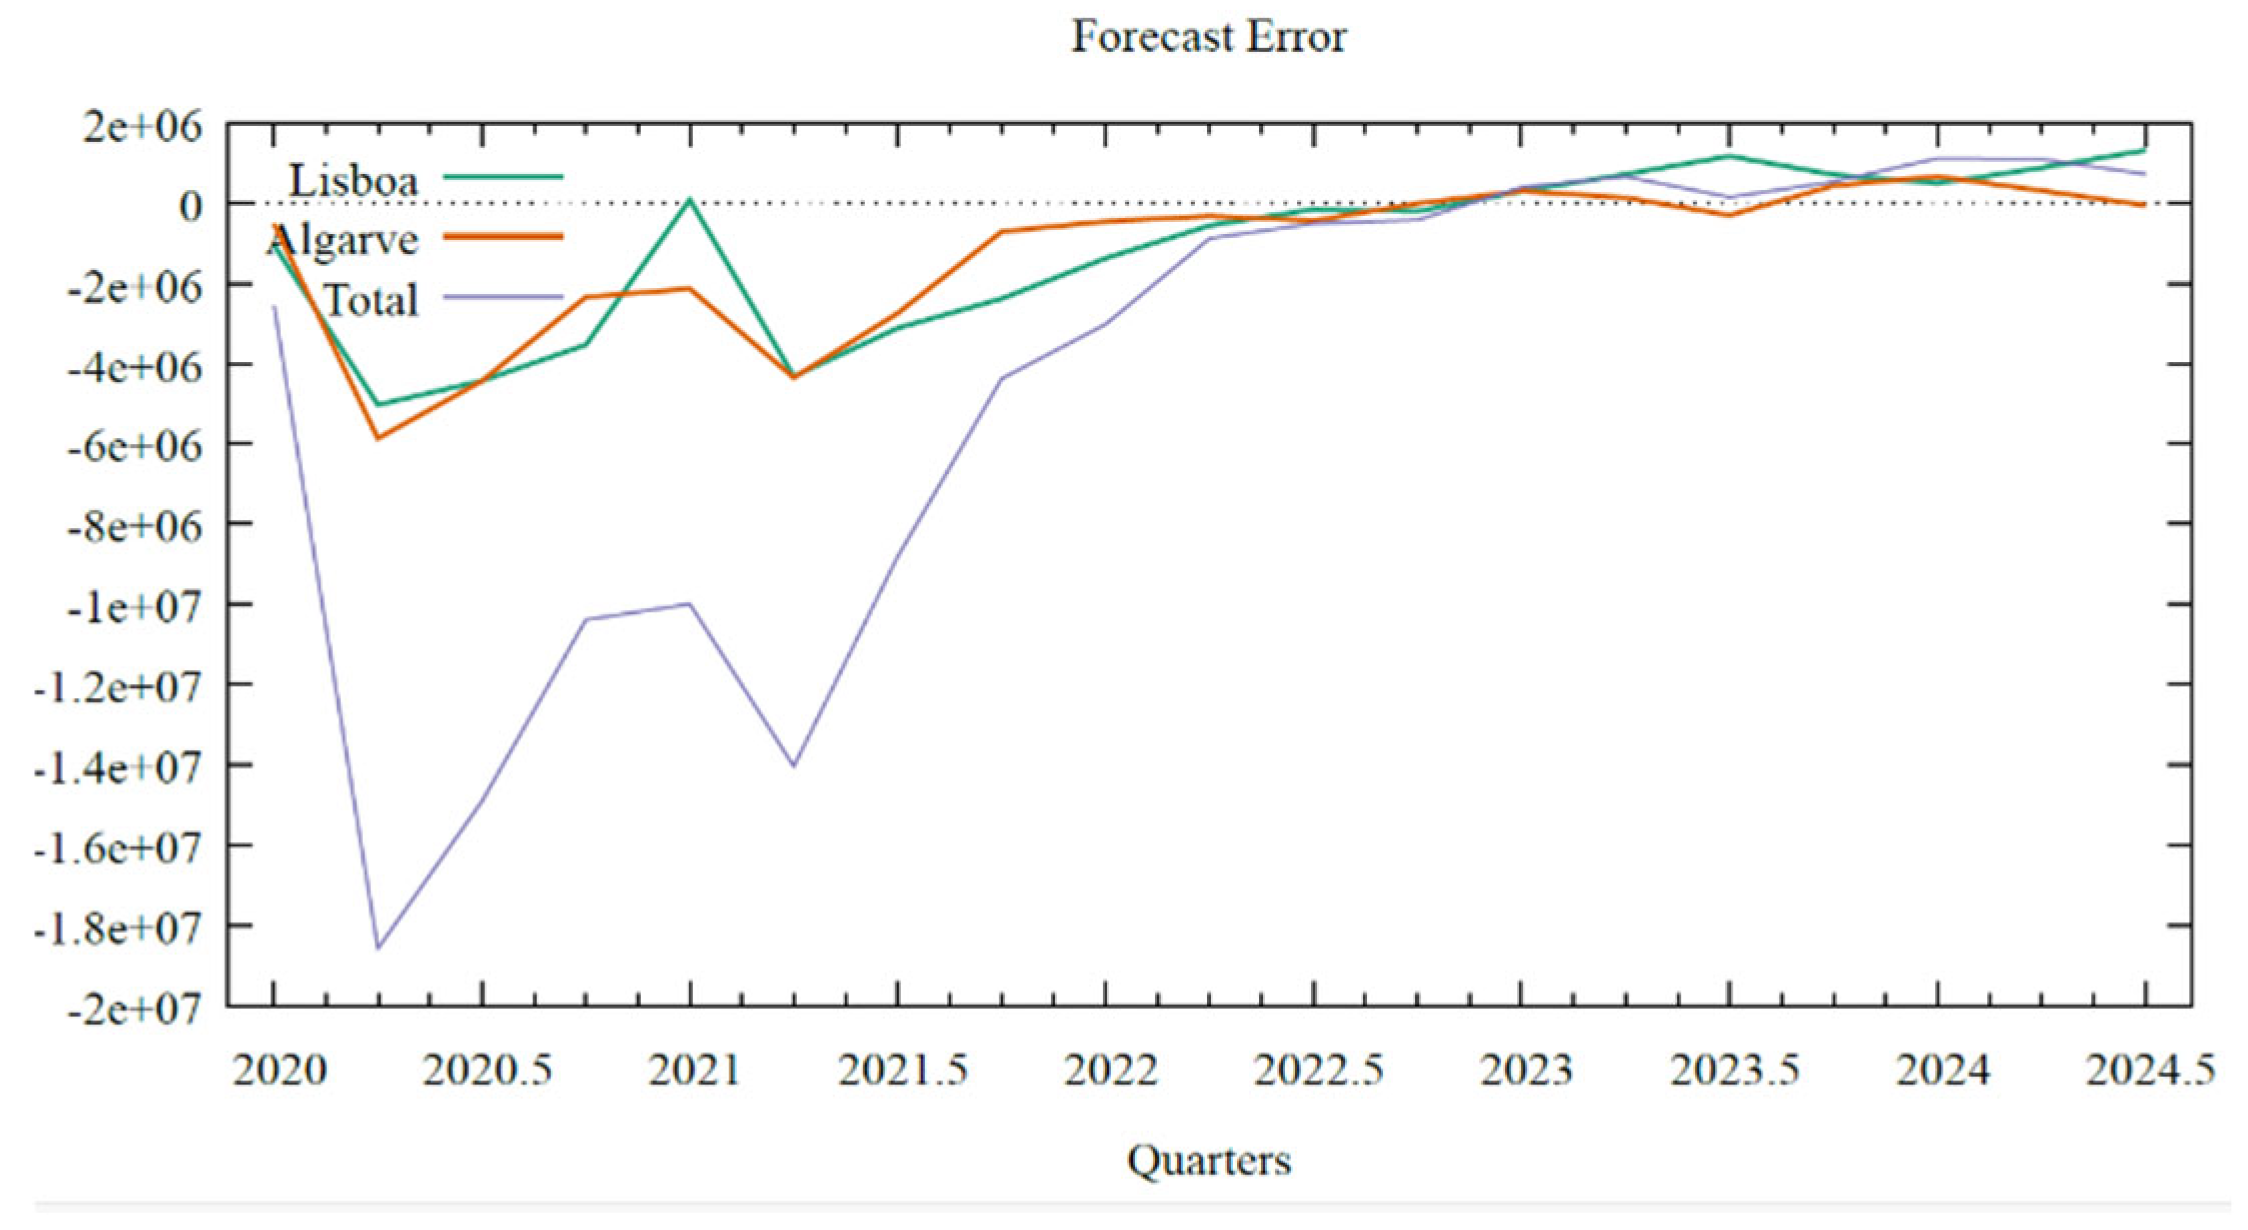
Figure 11.
Time Series Plot. Lisboa, Algarve and regions NUTS II.
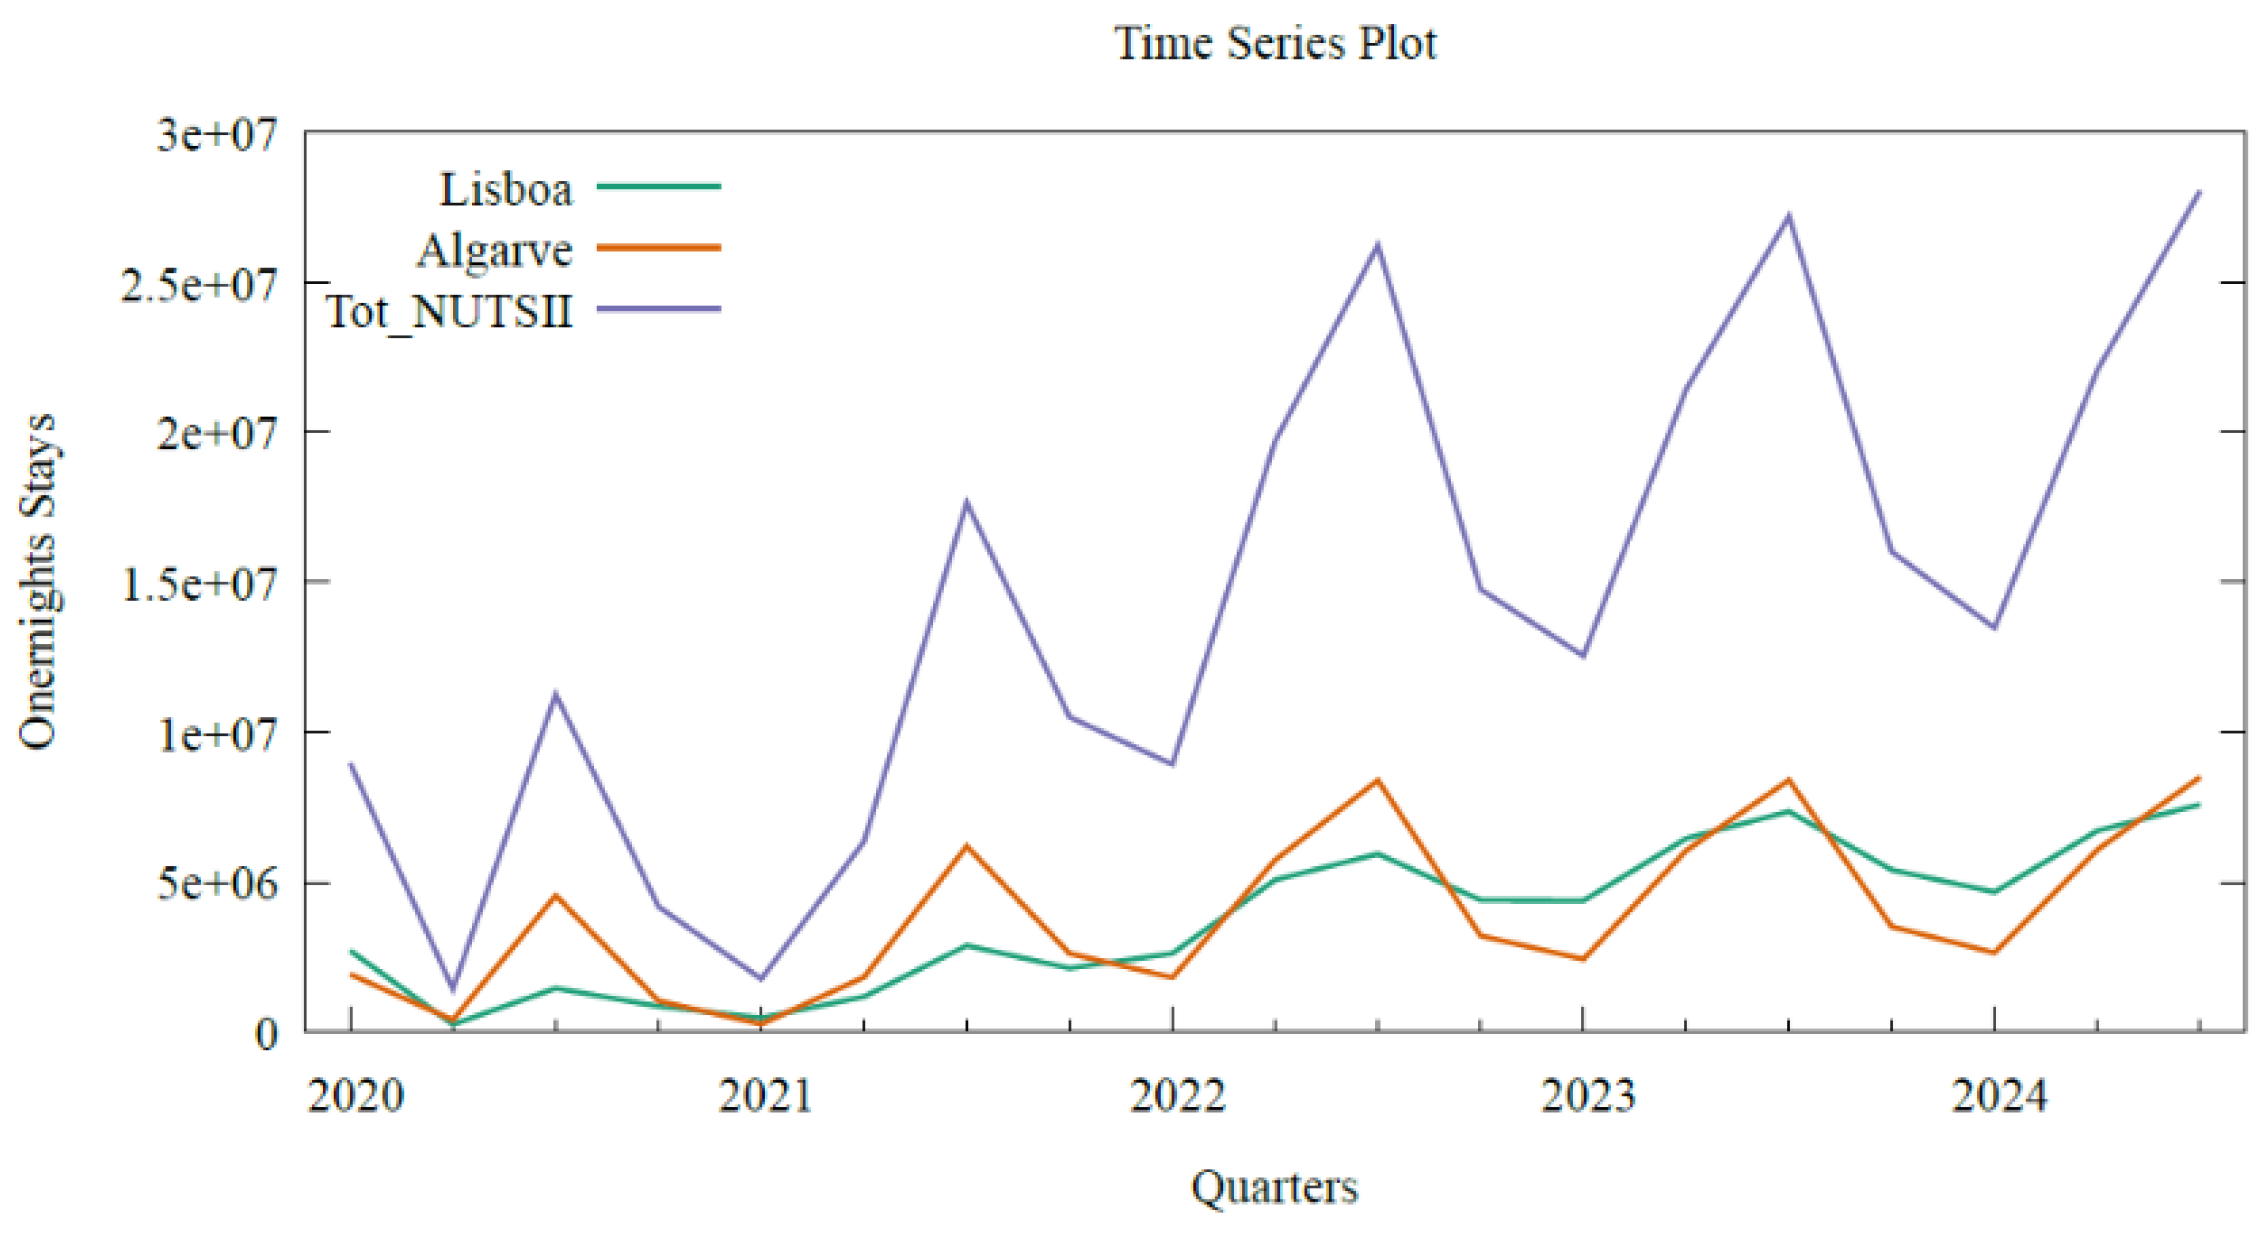
Figure 12.
model. Lisboa.
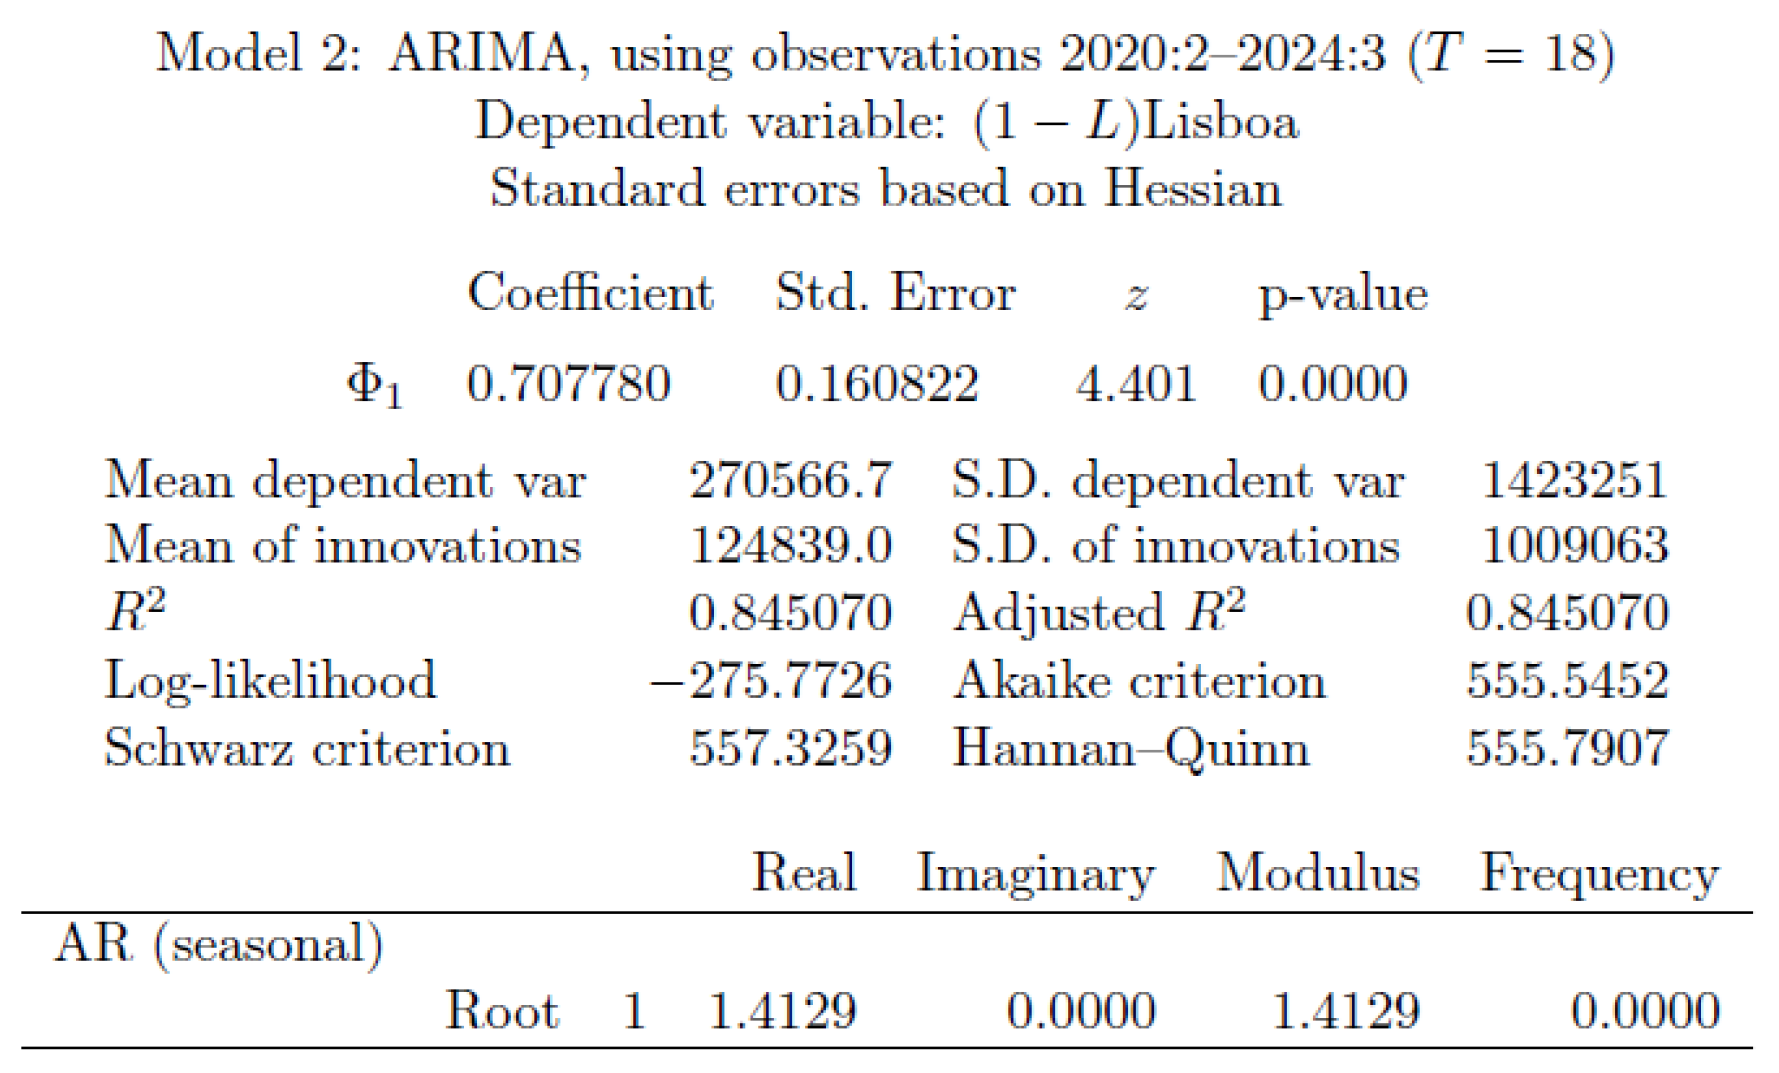
Figure 13.
model. Algarve.
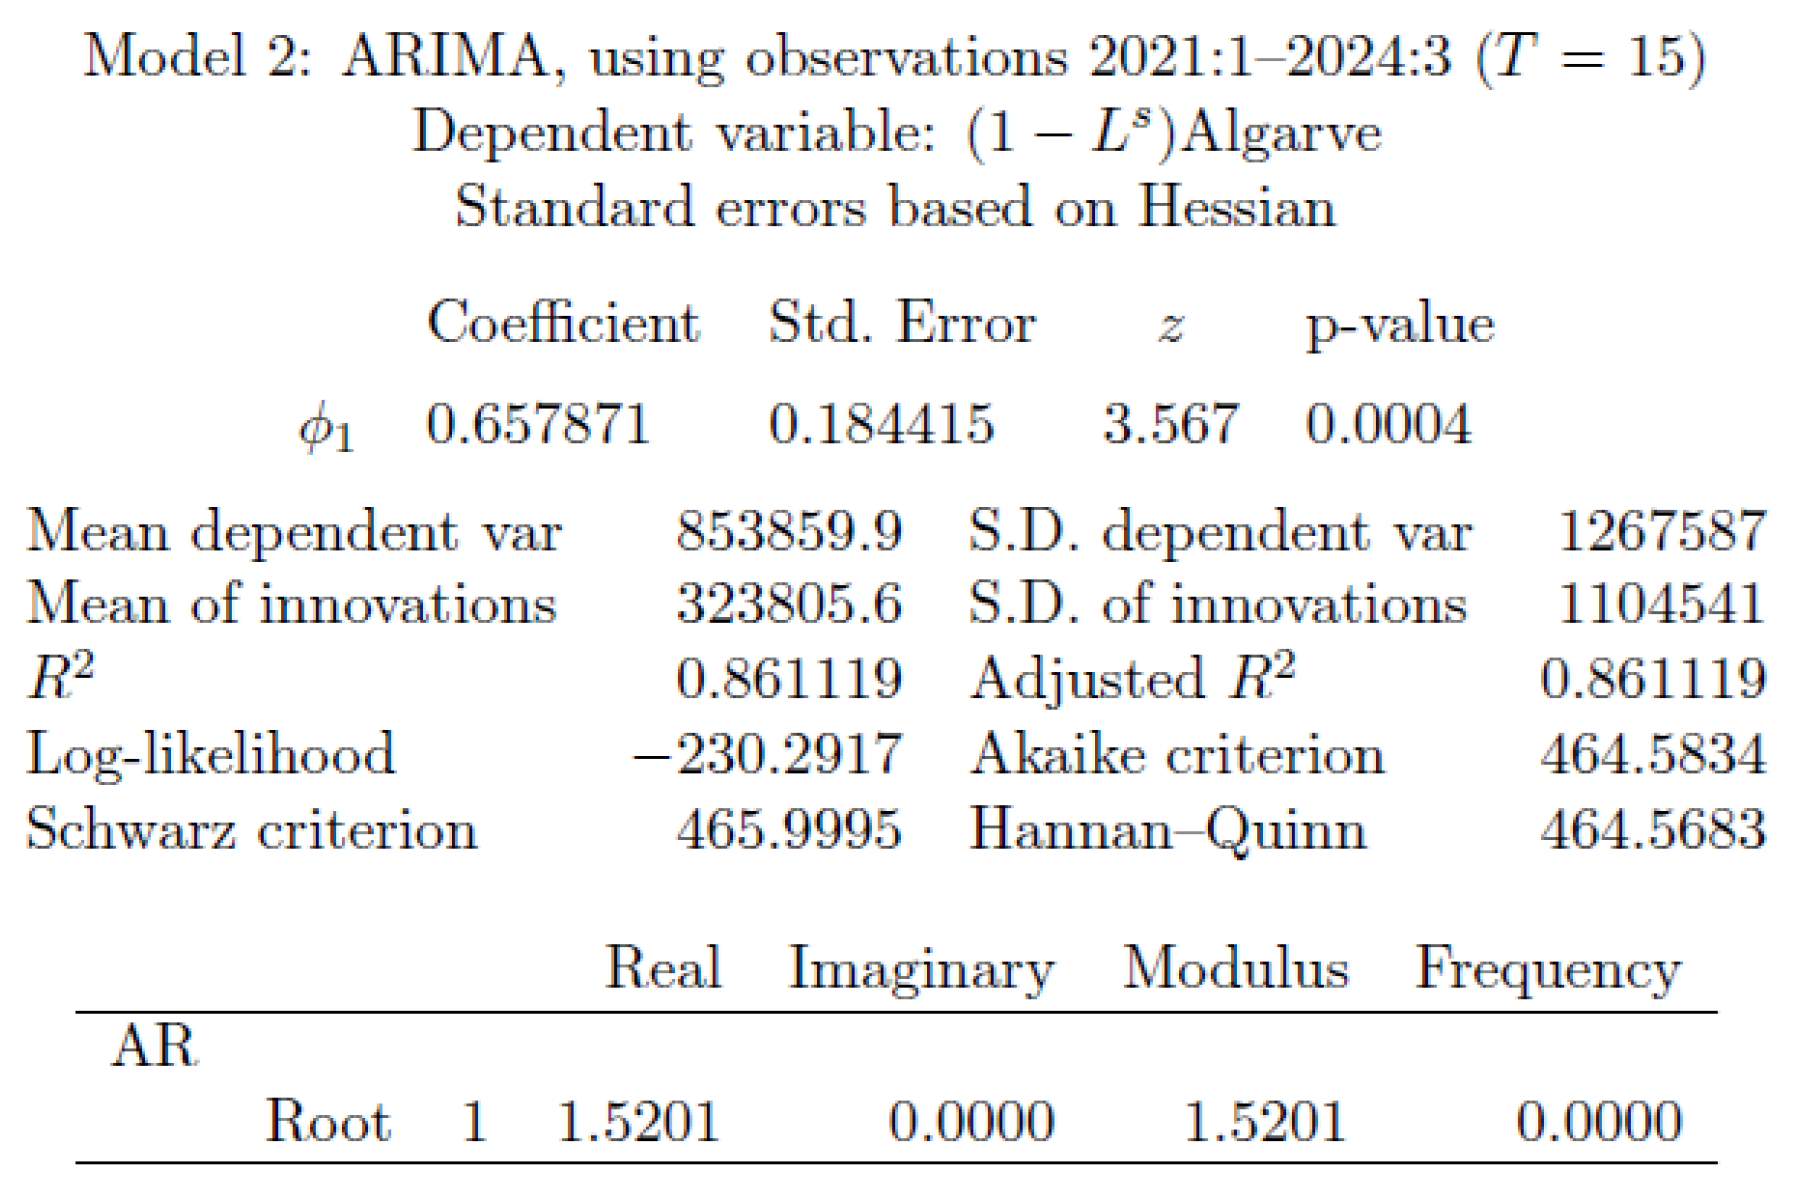
Figure 14.
model. Total NUTS II.
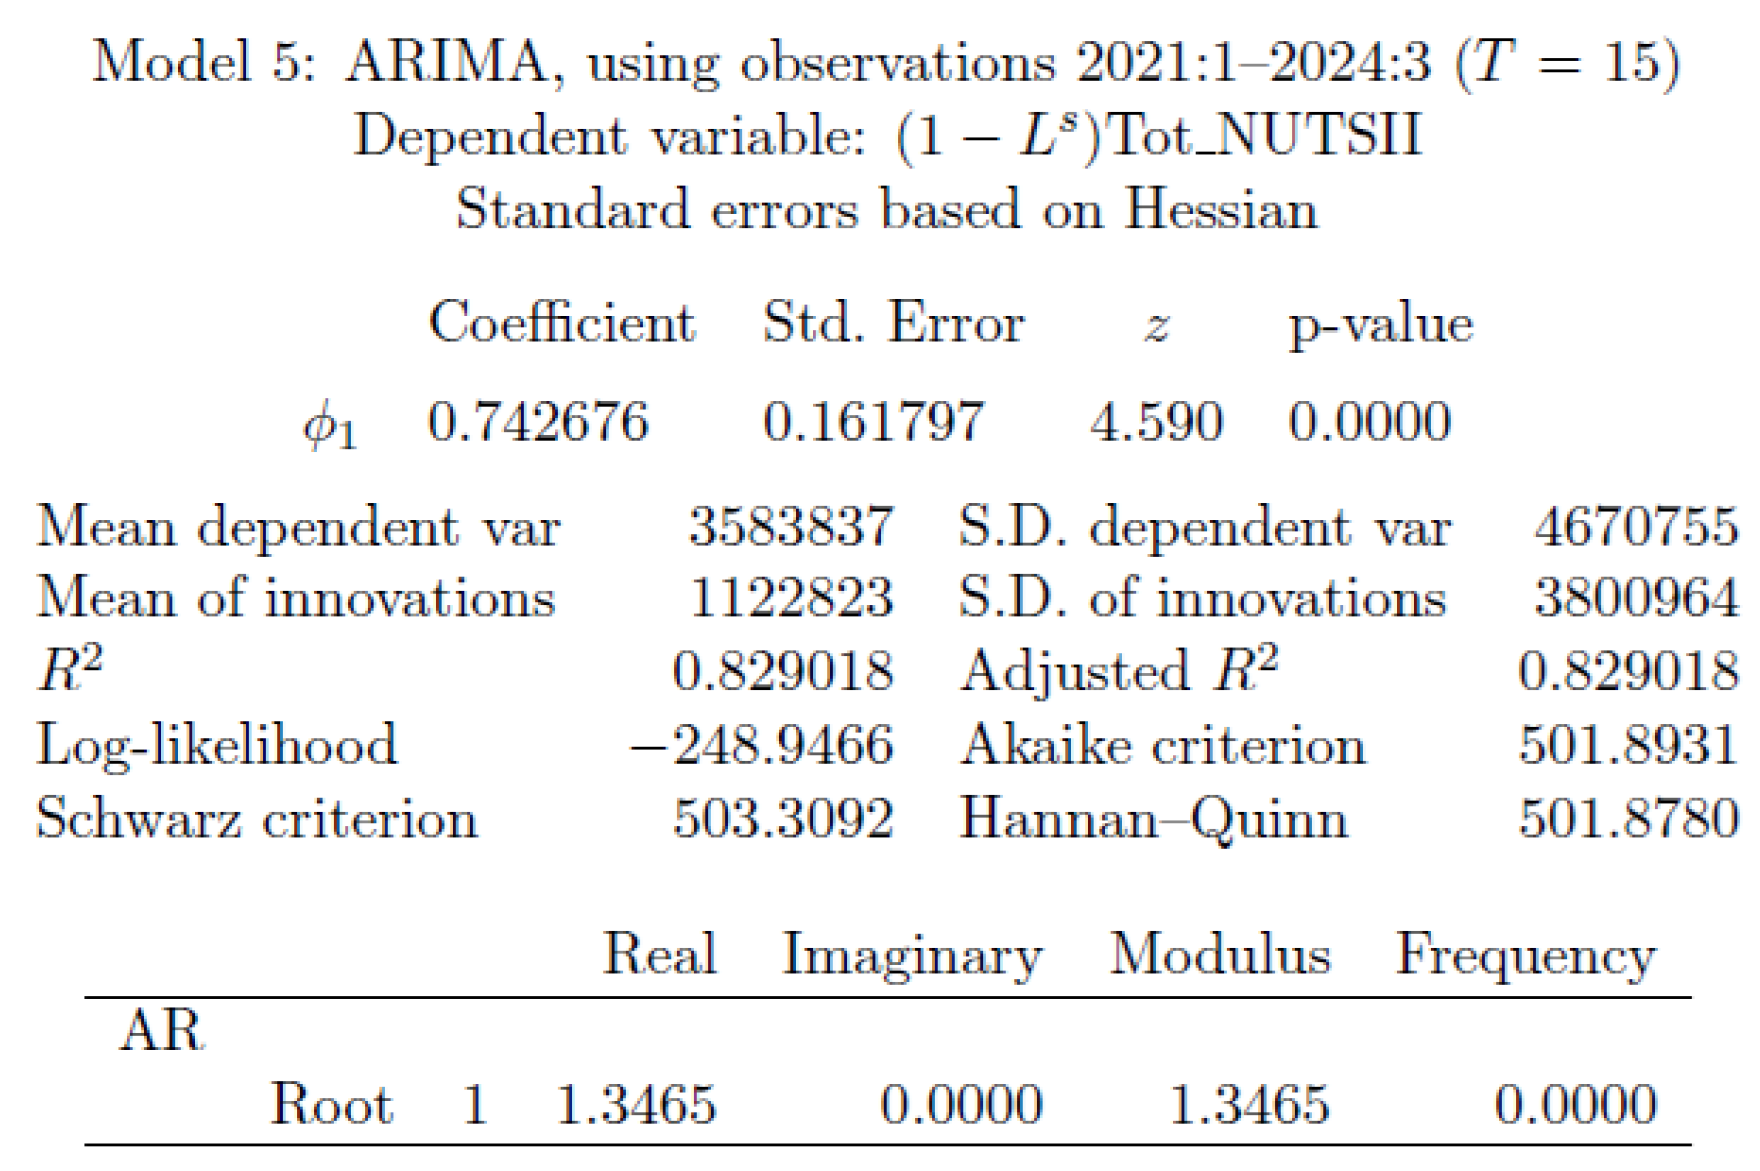
Figure 15.
Time Series Plot Residuals and Residuals PACF. Lisboa.
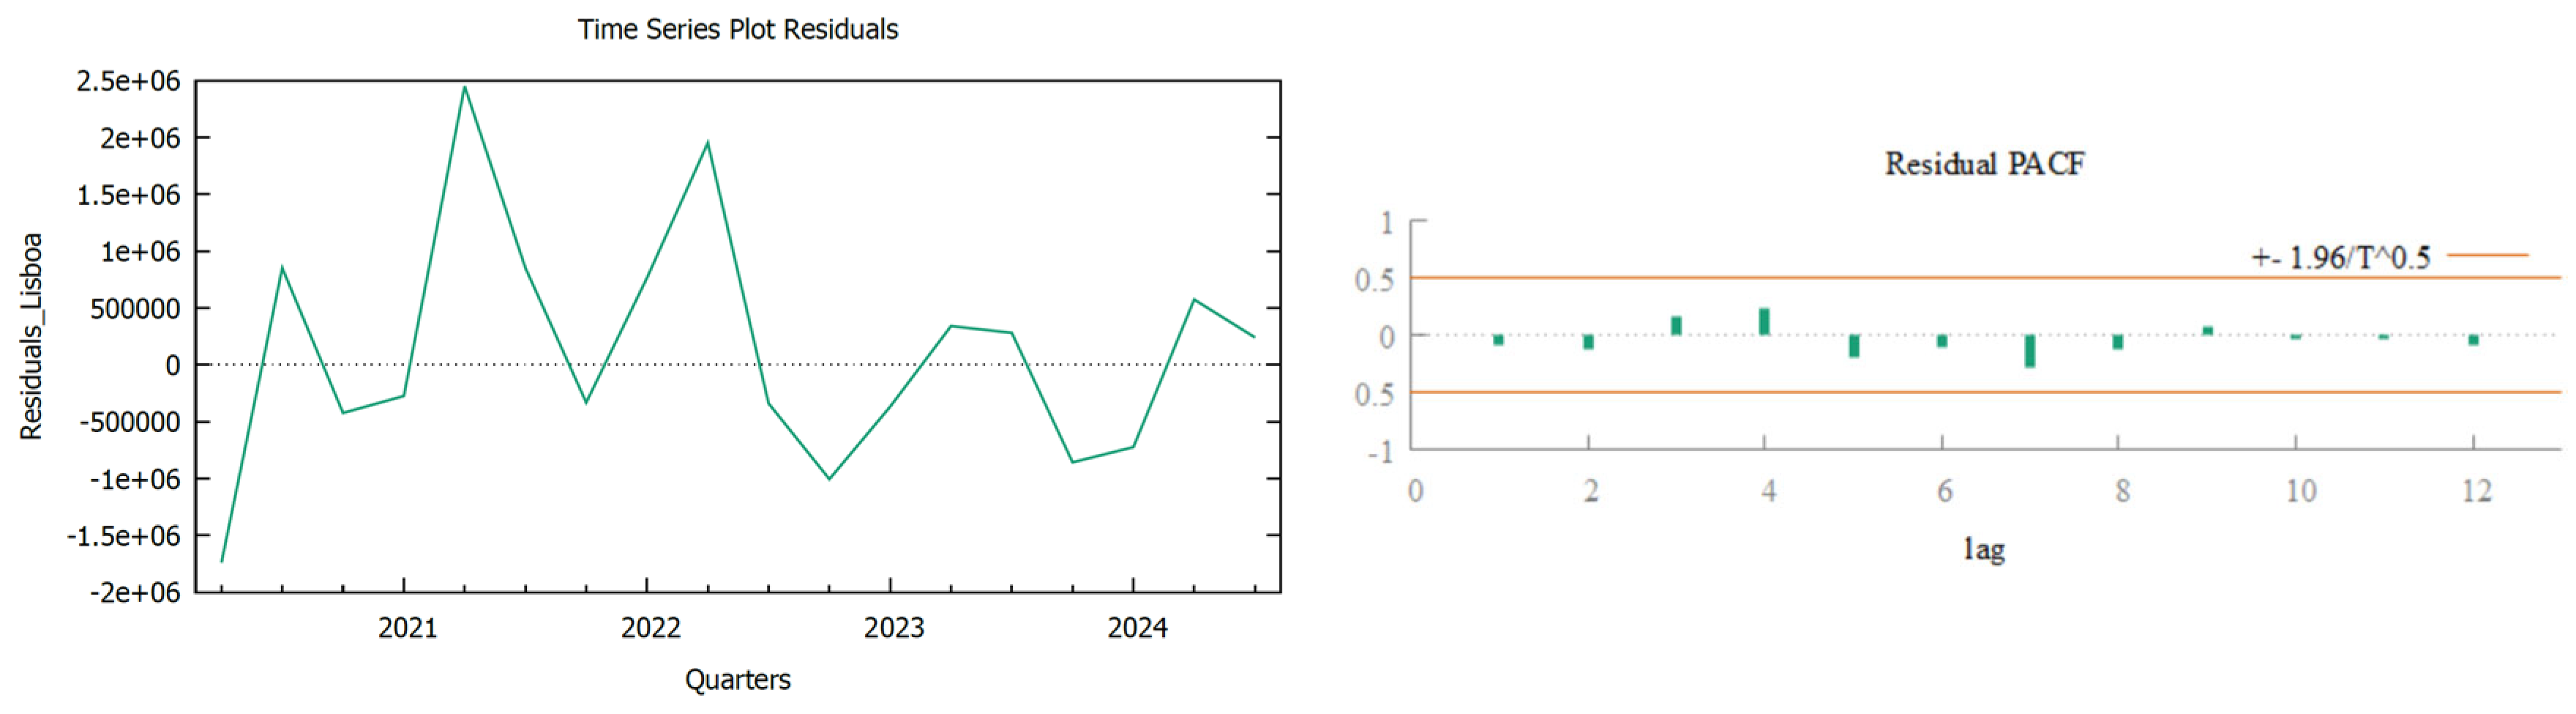
Figure 16.
Time Series Plot Residuals and Residuals PACF. Algarve.
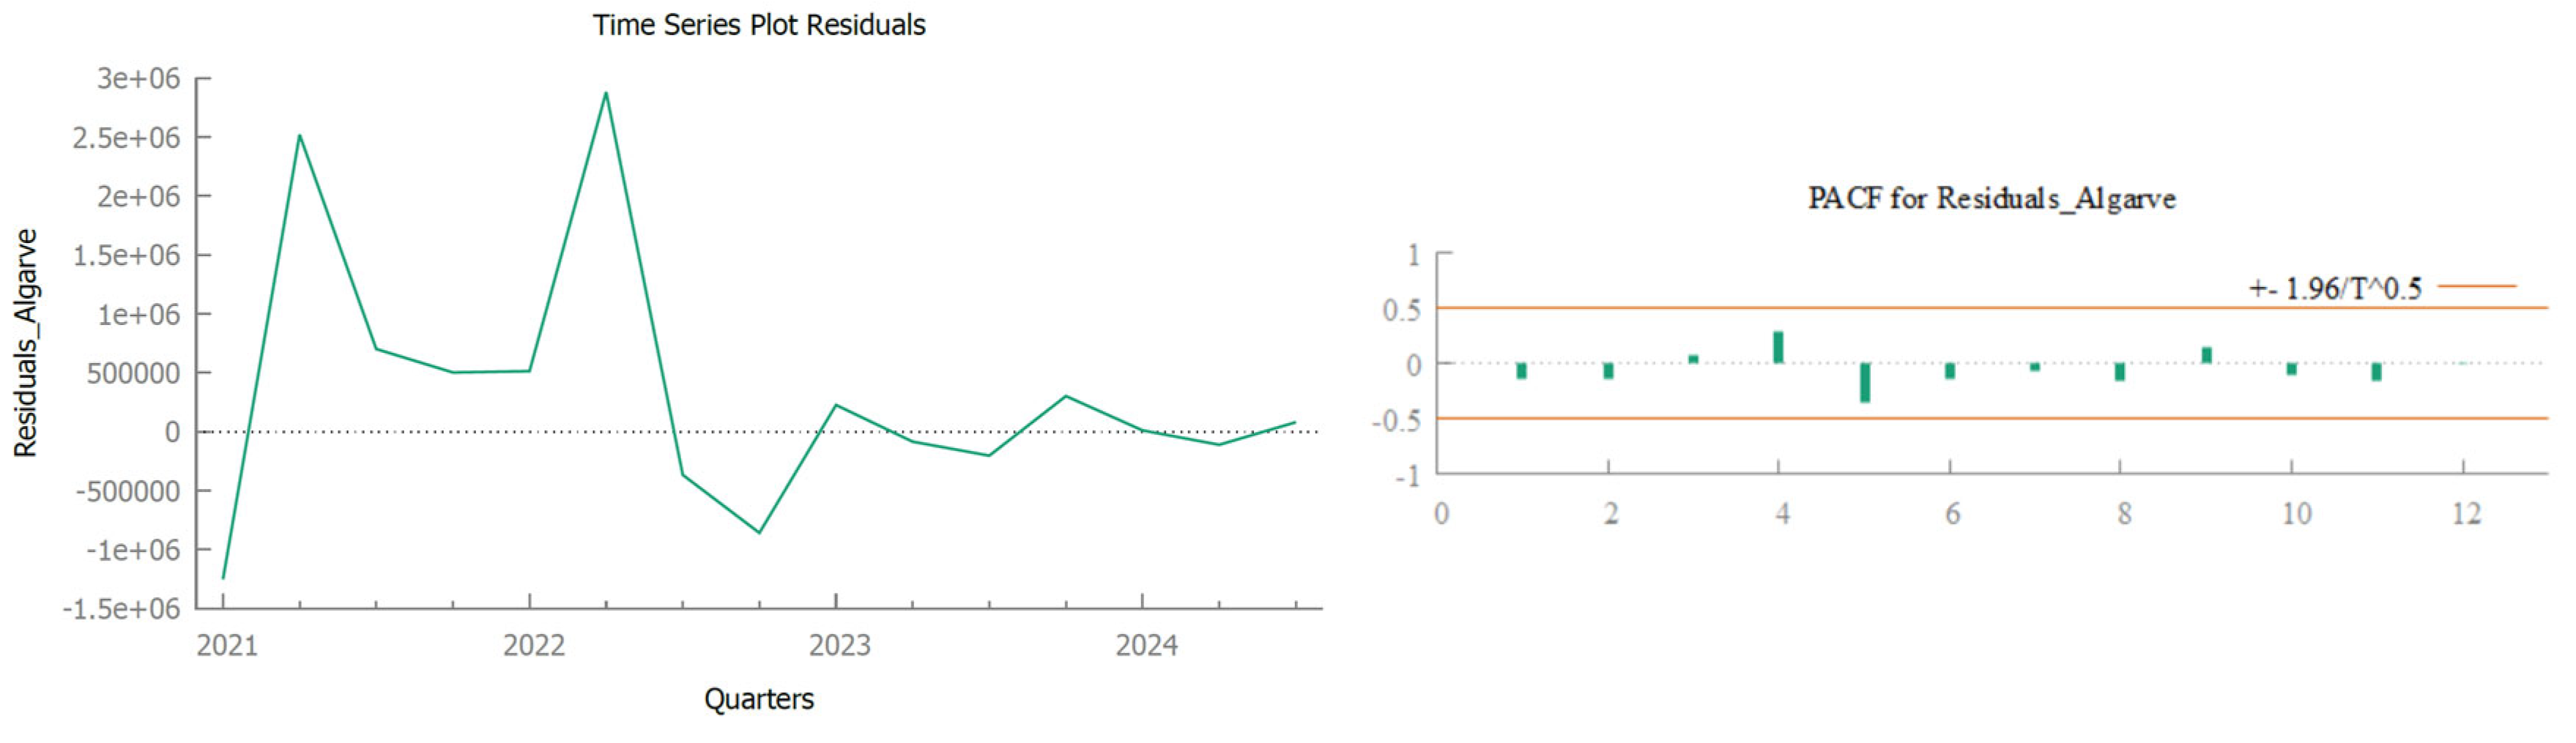
Figure 17.
Time Series Plot Residuals and Residuals PACF. NUTS II.
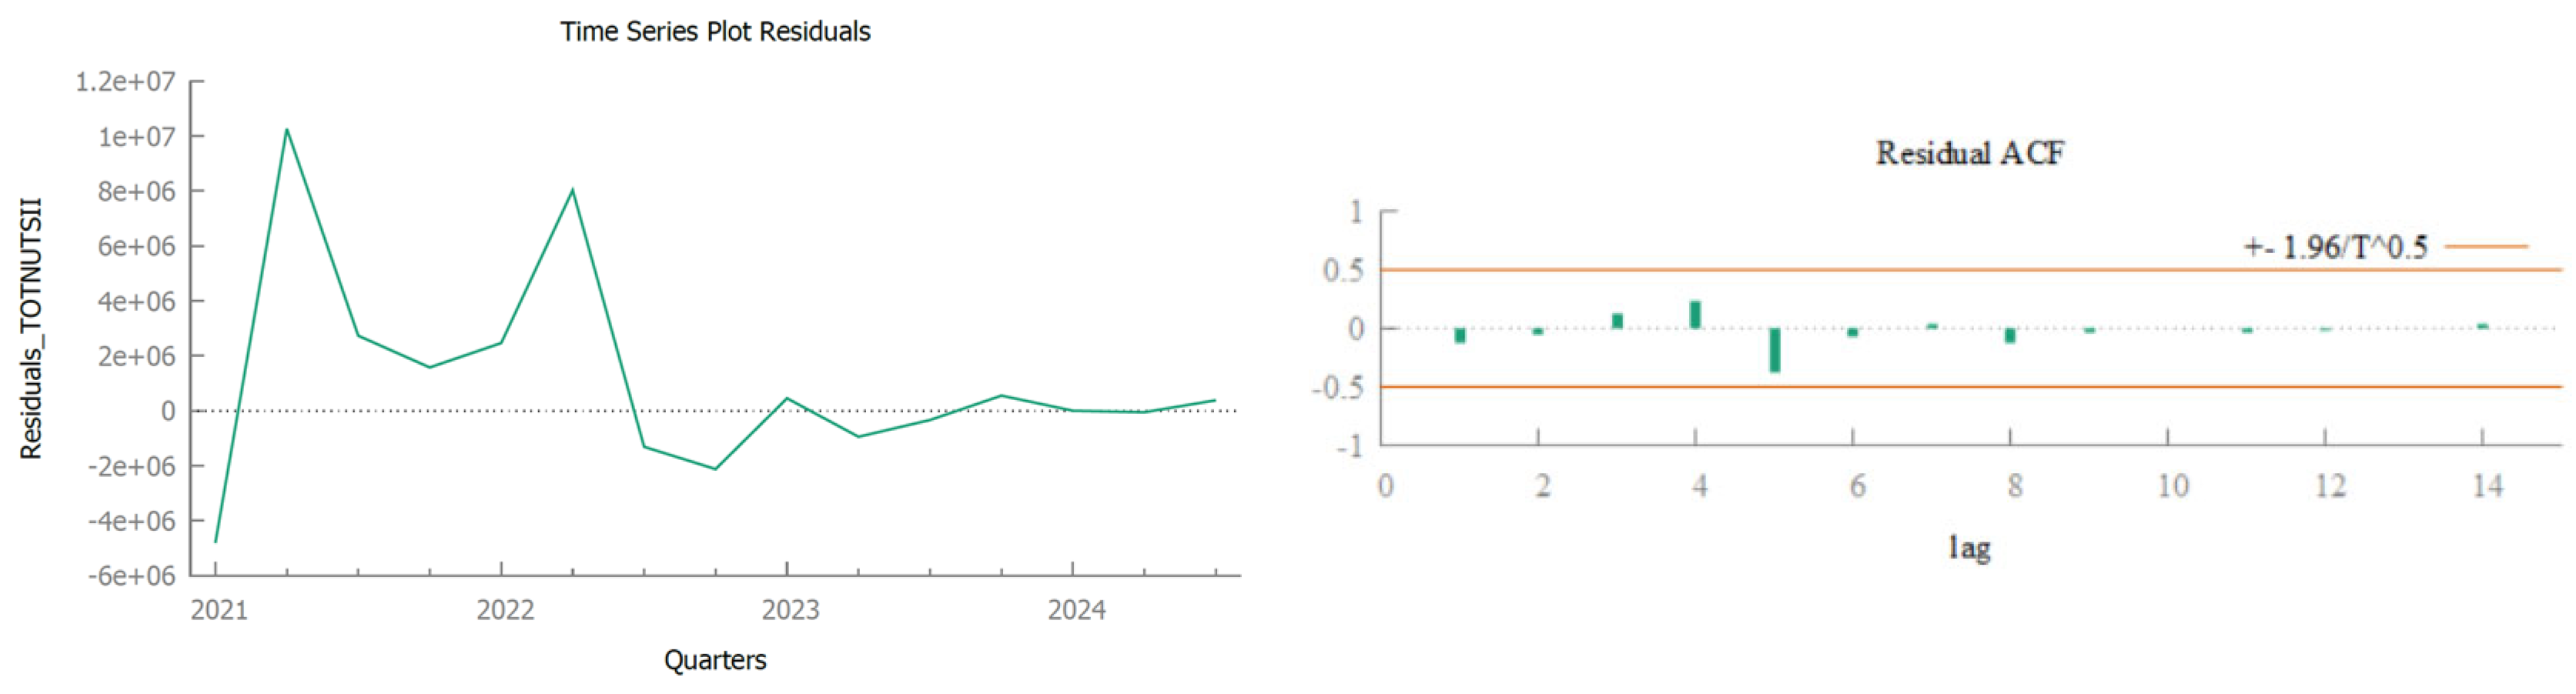
Figure 18.
Forecast Lisboa, Algarve and NUTS II (2024:4 to 2027:4).
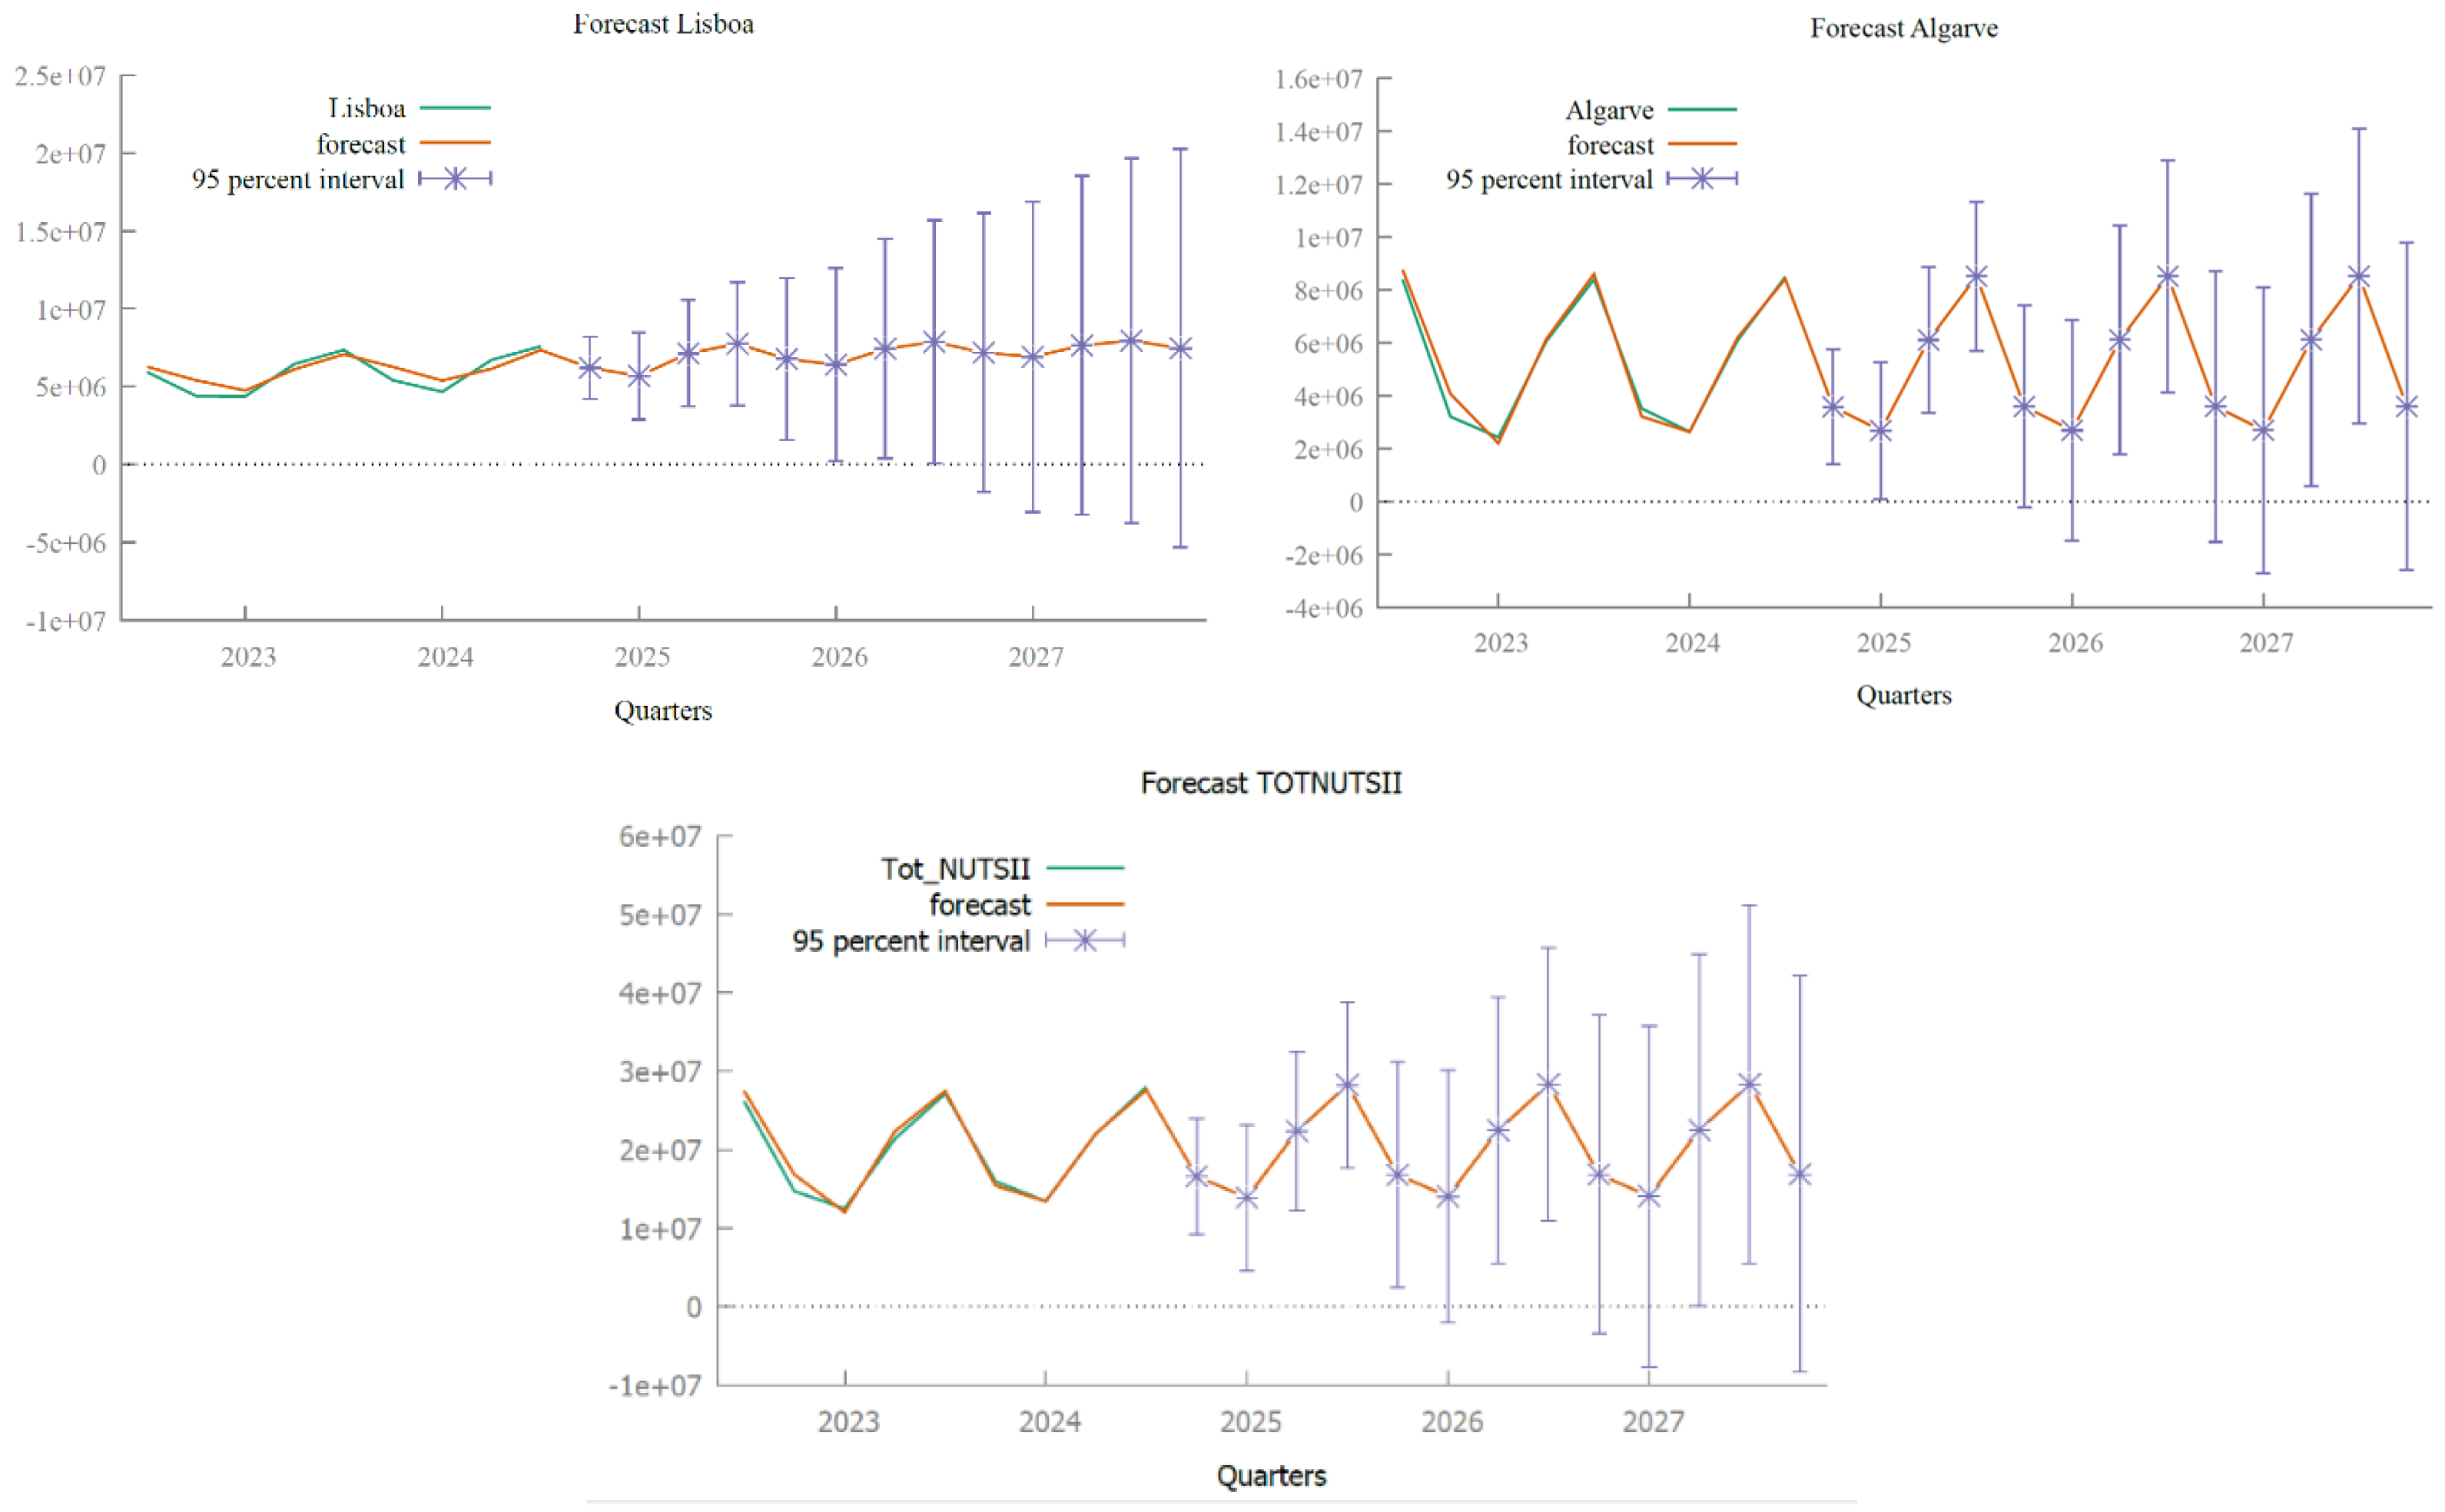
Table 1.
Chow test for structural break at observation 2008:1.
| Adjusted Model Region Lisboa: with |
| Adjusted Model Region Algarve: with |
| Adjusted Model Region NUTS II: with |
Table 2.
Descriptive Statistics pre and post crises of 2008.
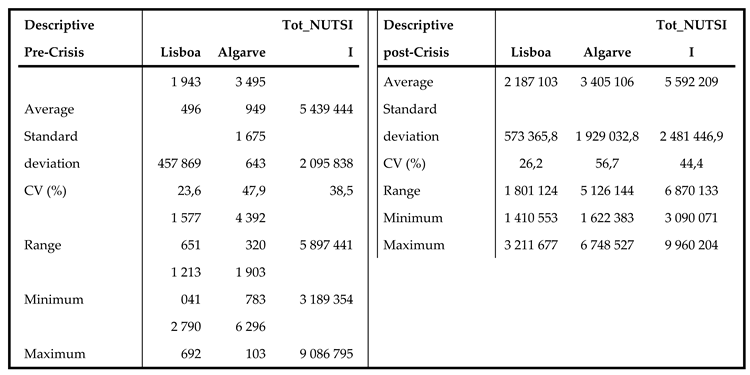 |
Table 3.
MAPE and U-Theil's metrics.
| Regions | MAPE (%) | U-Theil’s |
| Lisboa | 3,2065 | 0,14819 |
| Algarve | 4,5517 | 0,09923 |
| Tot NUTS II | 3,4263 | 0,10866 |
Table 4.
Descriptive statistics Overnights stay. Lisboa, Algarve and NUTSII.
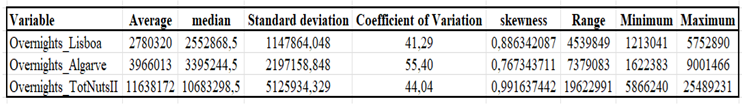 |
Table 8.
Quarterly Rate of Change (%) 2020/2019 and 2021/2020.
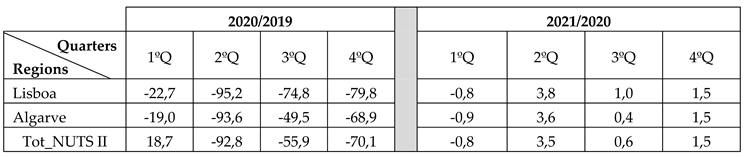 |
Table 9.
Quarterly Rate of Change (%) 2022/2019.
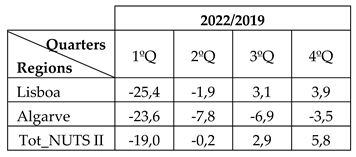 |
Table 10.
Quarterly Rate of Change (%) 2023/2019 and 2024/2019.
 |
Disclaimer/Publisher’s Note: The statements, opinions and data contained in all publications are solely those of the individual author(s) and contributor(s) and not of MDPI and/or the editor(s). MDPI and/or the editor(s) disclaim responsibility for any injury to people or property resulting from any ideas, methods, instructions or products referred to in the content. |
© 2025 by the authors. Licensee MDPI, Basel, Switzerland. This article is an open access article distributed under the terms and conditions of the Creative Commons Attribution (CC BY) license (http://creativecommons.org/licenses/by/4.0/).
Copyright: This open access article is published under a Creative Commons CC BY 4.0 license, which permit the free download, distribution, and reuse, provided that the author and preprint are cited in any reuse.


