Submitted:
14 July 2025
Posted:
15 July 2025
You are already at the latest version
Abstract
This study examines the strategic complexity of decision-making inside live e-commerce supply chains, especially in relation to the impact of Netflix-style entertainment marketing. As live commerce integrates digital retail with immersive experiences, businesses must optimize pricing, quality, and marketing strategies in real time. This study constructs a game-theoretic framework to analyze interactions between manufacturers and online celebrity retailers (OCRs), examining centralized, manufacturer-led, and retailer-led scenarios. We present engagement-driven marketing as a strategic variable and incorporate consumer regret and switching costs into the demand function. To illustrate practical trade-offs in strategy, we incorporate a Multi-Criteria Decision-Making (MCDM) layer with AHP-TOPSIS, assessing profit, consumer surplus, engagement score, and channel efficiency. The experiment results indicate that Netflix-style marketing markedly increases demand and profit in retailer-led frameworks, whereas centralized tactics enhance overall channel performance. The TOPSIS analysis prioritizes high-effort, high-engagement methods, whereas the Stackelberg experiment underscores the influence of power dynamics on profit distribution. This study presents an innovative integrative decision-making methodology for enhancing live-streaming commerce tactics in data-driven and consumer-focused markets.
Keywords:
live e-commerce
; entertainment marketing
; supply chain power structure
; Stackelberg game theory
; Multi-Criteria Decision Making (MCDM)
1. Introduction
The rapid expansion of digital commerce has given rise to live e-commerce. Among these advances, live e-commerce has emerged as a dominant force, integrating real-time engagement with influencer-led product marketing and immediate purchasing methods. Platforms like Taobao Live, TikTok Shop, and YouTube Live have revolutionized conventional supply chains by facilitating closer, swifter, and more engaging consumer interactions [1,2]. A groundbreaking retail strategy that integrates real-time video streaming with immediate purchasing, resulting in an engaging and immersive shopping experience [3,4]. Platforms like Taobao Live, TikTok Shop, and Amazon Live have transformed customer engagement by merging entertainment, influencer marketing, and effortless transactions [5,6]. The dynamic nature of live e-commerce presents challenges in supply chain decision-making, particularly in demand forecasting, inventory management, and logistics coordination [5].
The entertainment economy, exemplified by streaming platforms such as Netflix, has transformed consumer expectations regarding content and engagement. Netflix-style marketing captivates people with serialized material, heightened involvement, and emotive narrative. These marketing strategies are now being utilized in live e-commerce, where viewer engagement directly correlates with buy intent [7,8]. The amalgamation of entertainment and commerce cultivates a more profound psychological bond between consumers and brands, hence augmenting perceived value and brand allegiance. Netflix-style marketing techniques are defined by data-driven personalization, subscription models, and algorithmic recommendations, which have proven effective in customer retention and enhancing engagement [9,10]. Implementing these tactics in real e-commerce may augment consumer retention, refine pricing, and promote supply chain responsiveness [11,12]. Nevertheless, the interaction between Netflix’s marketing strategies and live e-commerce supply chains is still little examined in the current literature.
Notwithstanding advancements in consumer interaction, decision-making inside supply chains in these dynamic and entertainment-oriented environments remains intricate. The existence of power imbalances between manufacturers and online celebrity retailers (OCRs), common in decentralized supply chains, hampers decisions on pricing, investment, and marketing efforts. Game theory, particularly Stackelberg models, offers a valuable framework for analyzing hierarchical interactions, wherein one actor takes the lead and predicts the response of the following [13,14].
A pivotal aspect of supply chain management is the power dynamics among stakeholders, manufacturers, retailers, and e-commerce platforms [15,16]. In live e-commerce, power dynamics are altered by the impact of key opinion leaders (KOLs), platform algorithms, and instantaneous consumer feedback [17,18]. A supply chain dominated by manufacturers may emphasize production efficiency, whereas a retailer-led model prioritizes promotions and inventory turnover [19,20]. Simultaneously, platform-centric models (thus, Taobao, TikTok Shop) dominate influencers and suppliers, transforming conventional decision-making hierarchies. Comprehending the interaction of these power structures with Netflix-inspired marketing is essential for enhancing supply chain efficiency.
Furthermore, supply chain decision-making must increasingly consider several, frequently conflicting objectives, including profit maximization, consumer surplus, marketing efficiency, and engagement. This requires the utilization of multi-criteria decision-making (MCDM) techniques, such as AHP and TOPSIS, which are extensively employed in strategic supply chain planning, supplier selection, and retail optimization [21,22].
This study introduces an integrated multi-criteria decision-making (MCDM) approach to tackle these complexities, utilizing methodologies such as AHP (analytic hierarchy process), TOPSIS (technique for order preference by similarity to ideal solution), and DEMATEL (decision-making trial and evaluation laboratory) [23,24]. MCDM frameworks are particularly effective in assessing trade-offs among cost efficiency, service quality, and demand responsiveness within live e-commerce supply chains [25,26]. Nevertheless, a gap persists in the literature regarding the integration of live-streaming e-commerce, power-structured supply chains, and entertainment-based marketing into a unified decision-making model. This study seeks to fill that gap by proposing a simulation-based framework that:
- Models the interaction between a manufacturer and an OCR under both centralized and decentralized (Stackelberg) scenarios.
- Introduces Netflix-style engagement effort as a controllable decision variable.
- Evaluates outcomes using AHP-TOPSIS to balance competing objectives.
This integrated framework seeks to offer theoretical and managerial insights into optimal pricing, quality, and marketing tactics within the booming and competitive realm of live e-commerce.
The research objectives of this study aim to
- Examine the influence of Netflix-inspired marketing tactics on live e-commerce supply chain choices.
- Examine the impact of various power arrangements (manufacturer-led, retailer-led, platform-dominated) on pricing, inventory management, and revenue-sharing frameworks.
- Construct a comprehensive MCDM model to enhance supply chain decision-making under fluctuating market conditions.
This study offers multiple significant contributions to the current body of literature. Initially, it connects entertainment-oriented marketing methods, particularly those like Netflix engagement, with real e-commerce supply chain decision-making. The study enhances the comprehension of consumer-centric tactics in digital retail by evaluating the impact of marketing on demand, pricing, and customer behavior. Secondly, it offers a comparative examination of various supply chain power structures, including manufacturer-led and retailer-led Stackelberg models, in the realm of live-streaming commerce. This elucidates the impact of leadership dynamics on strategic outcomes. The paper presents an innovative multi-criteria decision-making (MCDM) framework that combines AHP and TOPSIS, specifically designed to assess situations in real-time, influencer-mediated e-commerce contexts. This cohesive strategy facilitates more equitable and informed decision-making that embodies both operational efficacy and consumer involvement.
This study is motivated by the transformation of customer interaction with products due to the emergence of live e-commerce, which integrates real-time engagement with entertainment-oriented marketing. Motivated by platforms such as Netflix, online retailers are progressively employing immersive storytelling and influencer-led marketing to enhance engagement and stimulate sales. Nonetheless, these shifting customer behaviors pose challenges to conventional supply chain decision-making frameworks, particularly in contexts where manufacturers and merchants possess disparate power dynamics.
Despite the increasing interest in live-streaming commerce, there is a paucity of study examining its effects on supply chain strategy within the realm of entertainment marketing. Moreover, little research amalgamates behavioral demand, power dynamics, and multi-criteria assessment into a unified framework. This study aims to describe these processes and provide a comprehensive decision-making framework that captures the intricacies of contemporary e-commerce ecosystems.
The remaining parts of this work are structured as follows: Section 2 examines the literature of live e-commerce, Netflix marketing, and the dynamics of supply chain power structures. Section 3 shows the methodology of the study. Section 4 presents the results analysis and discussion, and Section 5 concludes the paper.
2. Literature Review
In recent years, the emergence of live e-commerce has transformed the retail industry by integrating the interactive components of live broadcasting with online buying [27]. This concept enables businesses to interact with customers in real-time, offering a dynamic buying experience similar to the techniques utilized by successful platforms such as Netflix. This literature study examines the supply chain decision-making processes utilized in live e-commerce environments, taking into account the impact of Netflix marketing techniques and the diverse power dynamics that influence these decisions. The investigation will employ a comprehensive multi-criteria decision-making (MCDM) methodology to enhance supply chain results in this swiftly changing environment.
Live e-commerce integrates live-streaming video to display products, enabling consumers to engage with hosts and make immediate purchases [27,28]. This paradigm poses distinct problems for supply chain decision-making, necessitating swift reactivity to consumer behavior, real-time inventory oversight, and logistical coordination. In this setting, effective supply chain management must consider demand variability and customer preferences, which might change significantly during a live event. Businesses must cultivate flexible logistics and inventory strategies that allow for rapid responses to fluctuating consumer needs while ensuring customer satisfaction.
The incorporation of innovative technologies is essential for improving supply chain efficiency in live e-commerce. Companies employ advanced algorithms and data analytics to track viewer engagement and purchasing activities, enabling precise demand forecasting through predictive modeling. Technologies like artificial intelligence (AI) and machine learning can evaluate large datasets in real time to guide supply chain decisions, assisting companies in optimizing operations such as inventory distribution and delivery routes [5,29]. Live e-commerce integrates real-time streaming with product presentation, revolutionizing the marketing and sales of products. It facilitates immediate customer engagement and enhances purchase intention by diminishing uncertainty and augmenting trust [1,30]. Prominent sites like Taobao Live and TikTok Shop employ this format to transform conventional supply chains [2].
Netflix’s marketing techniques offer significant insights into engaging digital consumers and enhancing supply chain operations. The platform utilizes data-driven methodologies to produce tailored recommendations based on viewer preferences, hence improving user engagement and retention. In the domain of e-commerce, employing analogous strategies, such as tailored marketing and targeted promotions, can profoundly impact customer decision-making during live selling events. Live e-commerce enterprises might gain advantages by employing Netflix-inspired strategies, utilizing viewer data to customize content and promotional offers according to specific consumer preferences [27]. This customization fosters stronger relationships with clients and promotes impulsive purchases, so assuring enhanced synchronization between supply chain activities and consumer needs. Utilizing comprehensive analytics to guide decision-making enables organizations to more accurately forecast sales and optimize inventories accordingly [5]. Moreover, Netflix’s pioneering content distribution and strategic partnerships enhance customer loyalty and brand visibility, which live e-commerce platforms can replicate by developing distinctive, captivating buying experiences that appeal with audiences. These tactics emphasize the importance of incorporating marketing methods into overarching supply chain choices. Netflix-inspired marketing amalgamates narrative, engagement, and amusement within digital marketing initiatives. This approach enhances emotional involvement and customer loyalty [7,8]. In live e-commerce, entertainment marketing is widely utilized as a strategic instrument by retailers to enhance consumer engagement and perceived value.
Diverse power dynamics within supply chains affect decision-making processes, especially in real-time e-commerce environments. The interactions between supply chain participants, namely, suppliers, manufacturers, and retailers, determine the dissemination of information and the authority over decision-making. Power dynamics can emerge in diverse forms, including collaborative, competitive, or coercive relationships. The negotiation capabilities of each participant and the quality of their interactions substantially influence the efficacy of supply chain management in live e-commerce. Power asymmetry within supply networks influences profit distribution and decision-making processes. The Stackelberg game model is a hierarchical decision-making framework in which leaders predict the responses of followers [13,14]. These models are essential in live e-commerce environments, where smart pricing and marketing initiatives rely on supply chain management.
Multi-Criteria Decision-Making (MCDM) methodologies offer frameworks for evaluating decision-making in contexts defined by varied power dynamics. Utilizing MCDM methodologies, decision-makers can assess alternatives based on many criteria pertinent to supply chain operations, including cost, speed, quality, and service level [5]. Integrating MCDM with power structure dynamics enables firms to comprehend the performance of diverse tactics under fluctuating situations, thereby aligning their supply chain decisions with organizational objectives and market requirements. The incorporation of MCDM approaches in supply chain decision-making highlights a thorough assessment of both qualitative and quantitative elements influencing performance. By evaluating variables pertinent to live e-commerce, including consumer interaction, real-time feedback, order fulfillment velocity, and cost effectiveness, firms may make informed decisions that enhance their competitive advantage. Diverse Multi-Criteria Decision-Making (MCDM) approaches, including the Analytic Hierarchy Process (AHP), Weighted Sum Model (WSM), and Technique for Order Preference by Similarity to Ideal Solution (TOPSIS), can be utilized to enhance the decision-making process. These methods allow decision-makers to assess the significance of different criteria and prioritize alternatives, considering the impact of power dynamics on results. By employing these tactics, enterprises may adeptly maneuver the intricacies of supply chain management within live e-commerce, while efficiently applying insights from the marketing strategies of successful companies such as Netflix.
MCDM tools like AHP and TOPSIS facilitate the assessment of options in the presence of many conflicting objectives. They have been extensively utilized in the assessment of supply chain performance, sustainability evaluation, and supplier selection [21,22,31]. The convergence of live e-commerce, Netflix marketing, and supply chain decision-making highlights the necessity for a cohesive multi-criteria decision-making strategy to enhance performance in this dynamic landscape. Organizations may enhance supply chain responsiveness and align operations with consumer preferences through data-driven strategies. Comprehending the function of power structures enhances the decision-making framework, enabling organizations to maneuver through diverse influences and achieve success in the dynamic e-commerce environment. As live e-commerce expands, continuous research must concentrate on enhancing these integrated methodologies and investigating the wider ramifications of decision-making dynamics on industry performance and consumer involvement.
While research on entertainment marketing and supply chain modeling is available, there is a scarcity of studies that combine multi-criteria decision-making with game-theoretic frameworks in live streaming contexts. This research addresses the gap by modeling live e-commerce inside various power structures and ranking scenarios via AHP-TOPSIS.
3. Methodology
3.1. Problem Setting and Assumptions
We examine a dual-level live-streaming supply chain including a single producer and an online celebrity retailer (OCR). The OCR markets items to consumers via live e-commerce platforms and uses entertainment-oriented marketing strategies akin to Netflix-style interaction. The choice variables comprise retail pricing p, product quality q, and marketing effort e. Consumer behavior is influenced by regret , search cost , and engagement in entertainment . The demand function is formulated based on U and conventional assumptions of diminishing price sensitivity and heightened engagement and quality responsiveness.
The supply chain faces the following:
- Consumer anticipated regret() diminishes utility when customers miss opportunities or face price discrepancies.
- Search cost (), which deters consumers from changing platforms or postponing purchases.
- Engagement effort (e) propelled by Netflix-style marketing that enhances user usefulness.
- Quality level (q) and product price (p), collectively established under varying power dynamics.
We analyze a Stackelberg game involving a manufacturer and a live e-commerce retailer (OCR) under various power dynamics, utilizing the methodology established by von Stackelberg, H. [32].
3.2. Power Structure Scenarios
Centralized Model: The supply chain is cohesive, and the overall profit is optimized collectively.
Manufacturer-led Stackelberg Game: The manufacturer assumes the leadership role, determining w and q; the merchant responds by selecting p and e.
Retailer-led Stackelberg Game: The OCR establishes p, e, and maybe q, whereas the manufacturer thereafter adheres to w.
Backward induction is utilized to ascertain subgame perfect equilibrium methods in decentralized models.
3.3. Netflix Marketing Integration
To assess Netflix-style promotion in live e-commerce, we establish a utility-enhancing function:
This variable is incorporated into the consumer utility equation and the demand function. It additionally imposes a convex cost on the retailer:
The impact of e on is modeled as follows:
where:
- A: market potential,
- : price sensitivity,
- : sensitivity to quality,
- : sensitivity to entertainment engagement.
3.4. Utility and Demand Model
Consumer utility is defined as:
The demand function is modeled as:
3.5. Profit Functions
Manufacturer:
Retailer (OCR):
3.6. Game Tree Representation
The Stackelberg game tree in Figure 1 depicts strategic interactions under varying power dynamics: manufacturer-led and retailer-led. In the manufacturer-driven situation, the manufacturer establishes the wholesale price and quality initially, anticipating the retailer’s subsequent pricing and marketing strategies. The results demonstrate moderate benefits for the manufacturer, albeit marginally limited profits for the retailer. In contrast, within the retailer-led configuration, the retailer dictates decisions concerning pricing, effort, and product quality, while the producer reacts accordingly. This framework produces greater returns for the store, reaching in the best scenario, indicating a distinct strategic benefit when the retailer takes the initiative. Although the manufacturer obtains relatively diminished revenues under this approach, the whole system retains its efficiency. These results highlight the strategic importance of leadership in supply chain decision-making, particularly in live e-commerce environments where consumer engagement and real-time pricing dynamics are essential. Engagement marketing like Netflix significantly strengthens the retailer’s standing, especially in retailer-driven contexts where responsiveness to consumer behavior is essential.
3.7. Decision Variables and Objectives
Manufacturer: Sets the wholesale price w and optionally the quality level q.
Retailer (OCR): Sets retail price p, marketing effort e, and possibly quality level q under the power of leadership.
Each player maximizes its profit.
For the manufacturer, we recall from Equation (6)
Also, for the retailer, we recall from Equation (7)
where and represent cost coefficients for quality and effort, respectively.
3.8. MCDM Framework: Integration of AHP-TOPSIS
We utilize a hybrid MCDM technique to incorporate management decision-making inside a multi-criteria framework. We employ the Analytic Hierarchy Process (AHP) approach introduced by Saaty T. L [33] to consolidate the weights of the criteria, as detailed below.
3.8.1. AHP (Analytic Hierarchy Process Procedure):
AHP is used to determine the weights for each criterion based on expert evaluations about the following:
- Consumer Surplus ()
- Profit Margin ()
- Engagement Score ()
- Channel Efficiency ()
3.8.2. 1. AHP for Weight Derivation
The Analytic Hierarchy Process (AHP) is employed to ascertain weights for criteria. The pairwise comparison matrix is define as follows:
The weight vector is computed by normalizing the geometric means of the rows:
3.8.3. Consistency Check
Where is the maximum eigenvalue of A and is the random index. The matrix is consistent if .
3.9. TOPSIS (Technique for Order Preference by Similarity to Ideal Solution):
We rank the decision scenarios (centralized, manufacturer-led, retailer-led) with AHP weights and apply the TOPSIS approach as proposed by Hwang, C. L., & Yoon, K. [34]. The procedure comprises the following steps:
- Constructing the decision matrix .
- Normalizing the matrix.
- Applying AHP-derived weights.
- Determining ideal (best) and anti-ideal (worst) values.
- Calculating Euclidean distances to both ideals.
- Ranking alternatives based on relative closeness.
3.9.1. 2. TOPSIS Ranking Procedure
Let be the decision matrix, where i is the alternative and j is the criterion.
- We normalized the decision matrix using:
- Applying AHP-derived weights as:
- Determine the positive and negative ideal solutions:
-
Calculate Euclidean distances to the positive ideal and negative-ideal solutions as follows:For a positive ideal solutionFor a negative ideal solution
- Calculate the closeness coefficient:
- Finally, rank the alternatives based on in descending order.
3.9.2. Decision Criteria
The following criteria are evaluated for each scenario:
- : Consumer Surplus
- : Profit
- : Engagement Score
- : Channel Efficiency
3.9.3. Decision Structure and Equilibrium
Two Stackelberg equilibrium are examined:
- Manufacturer-led: The manufacturer sets the wholesale price w and quality q, anticipating the retailer’s response.
- Retailer-led: The retailer chooses price p, quality q, and marketing effort e first, followed by the manufacturer.
Subgame Perfect Nash Equilibria (SPNE) are obtained using backward induction.
4. Results Analysis and Discussion
4.1. Descriptive Statistics
A total of 30 situations were evaluated. Variables including price, quality, effort, demand, and consumer surplus were extracted and illustrated.
The scatter plot in Figure 2 illustrates entertainment effort versus demand, color-coded by engagement efficacy (Theta), and highlights the non-linear relationship between marketing intensity and consumer response. The image distinctly illustrates that elevated engagement levels () enhance the influence of effort on demand. When Theta is low, augmentations in effort result in comparatively minor increases in demand. This indicates that merely expanding marketing efforts is inadequate; the efficacy of the engagement approach is crucial in transforming attention into action. These findings underscore that Netflix-style marketing, which depends on continuous engagement and emotional appeal, is most effective when customers are inclined towards such stimuli. This underscores the necessity for supply chain planners to implement selected, high-caliber influencer or content-driven marketing initiatives that effectively engage targeted audiences.
The correlation matrix in Figure 3 provides a comprehensive analysis of the interrelationships among critical supply chain and customer behavior factors. It demonstrates a significant negative connection between price and demand (-0.82), confirming traditional economic theory that elevated prices generally diminish customer purchasing intent. Significantly, price exhibits a perfect negative link with consumer surplus (-1.00), indicating that pricing decisions profoundly affect perceived value among customers. Conversely, profit demonstrates a robust positive association with price (0.97) and revenue (0.89), suggesting that from the retailer’s viewpoint, increasing prices may enhance returns, albeit at the expense of reduced demand. Variables linked to Netflix-style marketing, including effort and engagement (Theta), exhibit moderate positive impacts on demand, with Theta marginally augmenting demand via its interaction with entertainment effort. These insights advocate for the integration of behavioral marketing strategies in real e-commerce models and underscore the trade-offs among profitability, consumer value, and marketing efficiency.
4.2. Decision Matrix
Table 1 displays the unprocessed performance indicators for all 30 assessed scenarios across four criteria: profit, consumer surplus, engagement score, and channel efficiency. The outcomes were subsequently normalized and displayed in Table 2 to guarantee comparability, establishing the basis for utilizing the AHP-derived weights in the TOPSIS ranking methodology.
4.3. AHP Aggregated Weights Derived
The AHP-derived weights provide significant insight into the relative importance of the criteria used to assess real e-commerce supply chain strategies. Of the four factors, the Engagement Score was assigned the greatest weight (0.4307), underscoring its preeminent influence in the decision-making process. This underscores the significance of entertainment-oriented marketing methods, like Netflix-style campaigns, in shaping customer behavior and enhancing overall supply chain efficiency in live commerce environments.
Profit ranked as the second most prioritized criterion, assigned a weight of 0.2847. This suggests that, although profitability is essential for both manufacturers and online celebrity retailers (OCRs), it is regarded as marginally less significant than consumer interaction in the realm of digital commerce. Consumer Surplus possessed a moderate significance of 0.1522, indicating that customer contentment and the perceived value derived from purchases are important, however not the principal determinants in the ranking of strategic scenarios. Ultimately, Channel Efficiency was assigned the lowest weight (0.1323), indicating that while operational efficiency within the supply chain is vital, it is relatively less critical when juxtaposed with engagement and profitability in influencer-centric, entertainment-oriented retail frameworks. The weight distribution highlights the strategic transition from conventional cost-oriented supply chains to consumer-focused, media-enhanced retail ecosystems, where engagement and experience are crucial for achieving competitive advantage.
We then apply equations (13) to (14) and (15) to aggregate the positive and negative ideal solutions shown in Table 4:
The TOPSIS technique assesses the closeness of each scenario to both positive-ideal and negative-ideal solutions, as illustrated in Table 4. The values are computed using the AHP-weighted normalized matrix, to ensure consistency with the strategic priorities established during the criterion weighting procedure.
4.4. TOPSIS Rankings
The TOPSIS rankings were determined by assessing each scenario based on four criteria: Profit, Consumer Surplus, Engagement Score, and Channel Efficiency. Following normalization and weight application, proximity coefficients were calculated for each scenario. The results indicated that the highest-ranked scenarios achieved a balance between substantial marketing effort, reasonable pricing, and robust quality levels. Significantly:
Scenarios exhibiting balanced effort (e = 0.6–0.8) and elevated customer engagement () attained the highest closeness coefficients (exceeding 0.80). Profit-oriented scenarios with insufficient involvement received worse scores due to diminished customer surplus and impaired channel efficiency. This affirms that MCDM integration encapsulates intricate trade-offs between profitability and customer-centric performance metrics, directing more sustainable and adaptive tactics.
We finally apply equations (16) to obtain the closeness coefficient and rank the alternatives in Table 5:
The TOPSIS (Technique for Order Preference by Similarity to Ideal Solution) results provide a ranked assessment of thirty real e-commerce scenarios, taking into account various performance metrics: profit, customer surplus, engagement score, and channel efficiency. These represent fundamental aspects of strategic decision-making within a supply chain affected by Netflix-style marketing across different power dynamics.
Scenario S12, the highest-ranking, received a closeness coefficient of 0.6565, signifying its proximity to optimal performance across all criteria. This indicates a robust equilibrium of financial and engagement metrics, demonstrating that under the particular circumstances of these events (which presumably entail significant engagement effort, ideal pricing, and quality standards), retailers and manufacturers can mutually benefit. Scenarios S8 (rank 2) and S29 (rank 3) exhibited strong performance, likely indicative of optimal marketing resource allocation and adept responsiveness to customer behavior factors such as anticipated regret () and engagement sensitivity ().
Conversely, scenarios S22 and S11, with closeness values of 0.3940 and 0.3789, respectively, are positioned at the lowest ranks (29 and 30). These instances may have entailed either inflated price, inefficient marketing expenditure, or a lack of alignment between producer and store objectives. Their inadequate performance highlights the need of multi-criteria alignment in decision-making and validates the application of AHP-TOPSIS for assessing these trade-offs.
Furthermore, the intermediate situations (such as S21 to S15) underscore intricate arrangements where compromises were probably established between profitability and engagement or between customer surplus and cost efficiency. This offers significant insights into how various structural decisions centralized versus decentralized control, or manufacturer-led versus retailer-led Stackelberg strategies, can influence supply chain performance outcomes in live e-commerce platforms.
Figure 4 graphically rates the performance of each scenario based on its closeness to the optimal option. situations S12, S8, and S29 exhibit optimal performance, but situations S22 and S11 are the least advantageous. This visualization facilitates informed decision-making in real-time e-commerce supply chain optimization through the integrated MCDM technique.
4.5. Stackelberg Game Results
In Table 6, it is demonstrated that the leadership structure directly influences profit distribution, affirming that retailer-led models more effectively align with consumer preferences in entertainment-driven marketing.
The outcomes of a Stackelberg game that simulates the decision-making interactions between a manufacturer and a retailer in an active e-commerce supply chain. In this scenario, the manufacturer assumes the role of the leader, establishing the wholesale price, while the retailer subsequently determines the retail price. The retail price is constantly established with a markup of 30 units over the wholesale price. This framework facilitates the delineation of the strategic hierarchy in decision-making across various power systems. As the wholesale price escalates from 40 to 80, the manufacturer’s profit continually improves from 38,200 to 60,400. This increase is logical, as elevated wholesale prices enhance the manufacturer’s unit profit margin, assuming demand remains sufficiently strong. Simultaneously, the total profit of the supply chain (including both manufacturer and retailer profit) demonstrates an upward trajectory, fluctuating between around 60,165 and 77,765. This indicates that the market continues to be lucrative even at elevated price points, perhaps owing to the mitigating influence of Netflix-style marketing methods that bolster user engagement and diminish price sensitivity.
Netflix-style marketing, as shown by metrics for engagement effort and entertainment intensity, seems to support demand maintenance throughout ascending price tiers. These techniques presumably elicit psychological gratification and entertainment value among consumers, prompting them to make purchases despite increasing pricing. Therefore, involvement is crucial in reducing demand elasticity, thereby reinforcing the feasibility of premium pricing methods in live e-commerce.
While the outcomes of the Stackelberg game indicate increasing profit levels with elevated pricing, these situations may not be the most favorable from a multi-criteria decision-making (MCDM) perspective. For example, optimizing profit may compromise customer surplus, retailer involvement, or the sustainability of long-term engagement. In the context of MCDM utilized in this research (employing TOPSIS and AHP), decision-makers evaluate aspects such as profit, consumer surplus, engagement score, and channel efficiency. Consequently, although Scenario 20 (with the highest prices) generates the most total profit, it may not attain the top ranking when evaluated against overarching strategic objectives.
The Stackelberg game underscores the significance of power dynamics in influencing supply chain results. Manufacturer-led strategies optimize upstream profit, while Netflix-style engagement marketing sustains profitability across the chain by bolstering demand resilience. Strategic supply chain decisions in live e-commerce must ultimately reconcile profitability with consumer-focused criteria to guarantee long-term survival, particularly in competitive and entertainment-oriented contexts.
The findings further validate that Netflix-style entertainment promotion, represented by as an effort, significantly enhances customer utility and demand. Retailers implementing immersive, influencer-driven experiences experience elevated engagement metrics, which immediately improve both profitability and consumer surplus. In retailer-led Stackelberg frameworks, OCRs dominate pricing and marketing, synchronizing their tactics with consumer trends more proficiently than manufacturer-led channels. Furthermore, the incorporation of AHP-TOPSIS into supply chain assessment yields refined insights into decision-making quality. The high-ranking scenarios identified by TOPSIS not only generated substantial profits but also excelled in channel engagement and efficiency, indicating that profit alone is no longer an adequate criteria in contemporary e-commerce. Game-theoretic examination uncovers strategic conflict: makers seek elevated wholesale prices, whilst retailers favor reduced costs to optimize margins and enhance demand through exertion. This underscores the necessity for coordination structures, such as contracts and income sharing, to synchronize incentives.
The visualization in Figure 5 shows the 30 scenarios ranked from the AHP-TOPSIS assessment that offers significant insights into the interplay of numerous performance measures and their contribution to the overall ranking of scenarios within the realm of live e-commerce supply chain decision-making.
The Profit versus Scenario Rank figure indicates that situations with higher rankings typically exhibit robust profitability. For instance, Scenario S12, ranked first, attains a significantly elevated profit level, indicating that profit is a vital determinant in ascertaining best decision outcomes. Nonetheless, it has been noted that many high-profit scenarios (e.g., S15) do not achieve top rankings, suggesting that profit alone is inadequate without complementary success in other areas such as engagement or efficiency.
Consumer Surplus scenarios, particularly S8 (Rank 2), are notable for their very high values, underscoring the efficacy of price and demand tactics that are well-aligned with consumer preferences. However, consumer surplus is not invariably the predominant reason. Numerous scenarios with substantial consumer surplus are relegated to lower rankings because to inferior performance in other metrics, such as engagement or efficiency.
The Engagement Score graph demonstrates the significance of viewer participation, a crucial factor in live e-commerce. Scenarios within the top five ranks continuously exhibit heightened engagement scores, underscoring that effective live commerce strategies must promote active viewer interaction, potentially affected by elements such as entertainment value and influencer charisma (denoted by Theta). Inferior-ranked situations exhibit markedly decreased engagement, indicating a lessened influence on the audience.
The Channel Efficiency analysis elucidates the effectiveness of profit generation from revenue. High-ranking scenarios generally demonstrate robust efficiency ratings, with S29 attaining the greatest, but with a little reduced consumer surplus. As rank diminishes, efficiency correspondingly declines, underscoring the necessity of sustaining streamlined and effective operational tactics for enhanced overall performance.
Collectively, these observations highlight the complex trade-offs involved in live e-commerce decision-making. An integrated MCDM method, such as AHP-TOPSIS, is crucial for capturing these subtleties, ensuring that no single metric prevails and that decisions are consistent with both strategic and operational objectives.
The evaluation of 30 e-commerce supply chain scenarios in Table 7 indicates that effective decision-making depends on a harmonious combination of entertainment efforts, consumer involvement (), pricing, and quality. High-ranking situations like S12 and S8 illustrate that elevated customer engagement and entertainment initiatives markedly enhance demand, profitability, and channel efficiency, resulting in superior TOPSIS closeness coefficients. S12 notably integrates strong engagement with steady profitability and efficiency, rendering it the best balanced scenario. Conversely, S2, although yielding the largest profit, is ranked marginally worse due to its inferior consumer surplus and engagement score, highlighting that financial measurements alone are inadequate for optimal performance in multi-criteria decision-making. Inferior situations, such as S22 and S11, frequently experience diminished engagement, feeble demand, and inadequate efficiency, underscoring the significance of audience participation and value-centric propositions in live-streamed commerce. The results highlight that success in live e-commerce is multifaceted, including a deliberate alignment of content quality, pricing, and interaction to optimize supply chain performance.
4.6. Study Implications
This study highlights numerous critical implications that enhance both the theoretical framework and actual implementation of live-streaming e-commerce techniques in supply chain management. This study presents an innovative multidisciplinary framework that combines consumer behavior, digital marketing, and operations research by incorporating Netflix-style entertainment marketing into supply chain decision-making models. This integration expands the supply chain strategy and emphasizes the increasing significance of emotional and engagement-driven factors in operational settings.
Theoretically, the study enhances literature by modeling the strategic implications of entertainment-driven marketing, particularly Netflix-style customer involvement, on demand and price frameworks. Integrating this engagement variable (Theta) into a Stackelberg game model elucidates how emotional resonance and media interactivity can transform traditional notions of price sensitivity and product value. The application of game theory to manufacturer-retailer interactions in both centralized and decentralized power structures enhances the comprehension of leadership roles within supply chains. The results highlight that retailer-driven models, especially those influenced by marketing through social media figures, might surpass manufacturer-driven models by better aligning with consumer trends and preferences.
The novel approach of AHP and the TOPSIS MCDM framework offers a more profound analysis of strategic supply chain assessment. This method allows decision-makers to assess trade-offs among various competing objectives, profit, customer surplus, engagement, and channel efficiency rather than depending exclusively on financial performance. The study reveals that the engagement score holds the greatest significance in the AHP hierarchy, highlighting its strategic relevance in entertainment-focused business. The outcome indicates a fundamental change in the assessment of success in digital commerce, prioritizing customer experience and engagement in conjunction with financial profits.
The findings possess numerous practical implications for management. Initially, they emphasize the increasing power and impact of online celebrity retailers (OCRs) in shaping consumer demand and enhancing performance. Retailers that manage price, marketing strategies, and quality decisions are more adept at responding to immediate consumer feedback, particularly in settings enhanced by interactive content. Consequently, supply chains must modify leadership paradigms to provide enhanced strategic autonomy to downstream partners or create collaborative mechanisms that synchronize incentives throughout the chain.
Secondly, companies should emphasize investments in engagement-optimized methods, acknowledging that entertainment value, influencer appeal, and tailored content substantially improve customer retention and conversion rates. This necessitates collaboration with content creators and the use of real-time data analytics to monitor and react to viewer actions. The efficacy of Netflix-style interaction demonstrates the capacity of algorithmic customisation and emotive storytelling in driving consumer behavior and loyalty.
The study enhanced contract frameworks between manufacturers and merchants. Given that manufacturer-led tactics may provide increased profits at the expense of consumer preferences, it is essential to implement profit-sharing, revenue-sharing, or coordination contracts to align objectives and secure long-term success. Retailers and manufacturers that implement shared performance indicators, such as engagement or channel efficiency, can more effectively connect their actions with consumer value.
The findings prompt digital commerce platforms to incorporate algorithmic fairness and engagement incentives into their governance frameworks at both the platform and policy levels. Platforms such as TikTok Shop or Taobao Live could improve ecosystem efficacy by incentivizing content that optimizes customer surplus and engagement, rather of solely focusing on conversion rates or sales volume. Moreover, authorities and platform designers ought to investigate methods to promote sustainable commerce models that integrate qualitative measures, including emotional value, experience design, and participatory engagement. The research provides a comprehensive and progressive paradigm for supply chain decision-making in the context of live e-commerce and entertainment marketing. The findings provide a framework for firms aiming to excel in consumer-focused, media-oriented markets by integrating behavioral economics and strategic operations.
5. Conclusion
This study introduces a comprehensive framework that combines behavioral economics, supply chain game theory, and multi-criteria decision-making (MCDM) to investigate strategic decision-making in live e-commerce contexts. The primary contribution is the modeling of the effects of entertainment-driven marketing, particularly Netflix-style engagement methods, on supply dynamics within different power systems. This research provides useful insights on the interactions of consumer involvement, pricing, quality, and marketing efforts within manufacturer-retailer relationships, particularly relevant for contemporary e-commerce platforms where decisions are increasingly influenced by real-time content and influencers.
The results emphasize the essential function of supply chain power allocation. In retailer-led frameworks, where online celebrity retailers (OCRs) drive decision-making, the model demonstrates enhanced performance across several criteria, including profit, customer surplus, and engagement scores. This is primarily due to retailers’ capacity to directly affect demand via adaptive marketing methods and individualized involvement. Conversely, manufacturer-led Stackelberg models exhibit profit centralization upstream, frequently sacrificing adaptability to consumer behavior. These observations underscore the increasing impact of downstream partners in digital commerce ecosystems and highlight the necessity for adaptable leadership models that can fit with swiftly evolving consumer expectations.
The combination of AHP-TOPSIS as a hybrid MCDM instrument was crucial in assessing and prioritizing decision scenarios beyond mere single-objective profit maximization. The strategy facilitated the incorporation of significant yet frequently disregarded metrics, including engagement score and channel efficiency. The findings demonstrate that approaches featuring moderate pricing, robust product quality, and significant marketing efforts consistently surpass tactics focused solely on profit maximization. This affirms that in entertainment-focused commerce, companies must account for both economic and experience factors to maintain long-term competitiveness.
Furthermore, the Stackelberg game offered a detailed insight into the impact of leadership roles on profit distribution and overall channel efficacy. Game-theoretic conclusions indicate that although manufacturers can maximize their profits by establishing advantageous wholesale prices, such unilateral approaches may diminish retailer incentives and consumer pleasure. Conversely, balanced tactics that include the objectives of both parties, potentially through contractual procedures or coordination schemes, can augment overall supply chain profitability.
This research enhances the burgeoning literature on digital retail by providing a decision-making framework specifically designed for live e-commerce settings. It effectively encapsulates the multifaceted nature of consumer behavior shaped by entertainment, the intricate strategy of dispersed supply chains, and the significance of multi-criteria assessment in facilitating optimal decision-making.
Future research may enhance this model by integrating stochastic demand, platform-level interventions, and empirical streaming data to validate and develop the framework. Furthermore, investigating contract coordination instruments, such as revenue sharing or subsidy incentives, may further improve supply chain collaboration. As live e-commerce expands, driven by interactive technologies and customer engagement, decision frameworks like these will become essential for informing strategic decisions in competitive digital markets.
Author Contributions
Conceptualization, T.M.G. and L.Y.; methodology, T.M.G. and L.Y.; software, T.M.G.; validation, T.M.G., L.Y. and C.J.; formal analysis, T.M.G. and L.Y.; investigation, C.J.; resources, C.J.; data curation, T.M.G.; writing—original draft preparation, T.M.G. and L.Y.; writing—review and editing, L.Y.; T.M.G.; and C.J.; visualization, T.M.G.; supervision, C.J.; project administration, L.Y.; funding acquisition, C.J. All authors have read and agreed to the published version of the manuscript.
Funding
The original contributions and raw data presented in this study are included in this article. However, further inquiries can be directed to the corresponding author.
Conflicts of Interest
The authors declare no conflicts of interest.
References
- P. Purboyo, L. R. Said, M. R. Firdaus, and P. A. Mayvita, “A systematic literature review on live-streaming commerce: trends, consumer behavior, and business implications,” Access Journal - Access to Science, Business, Innovation in the Digital Economy, 2025. Available: https://api.semanticscholar.org/CorpusID:278348857.
- C. Li, J. A. L. Yeap, and T. Ramayah, “A systematic literature review and analysis of live streaming commerce: Implications for future,” in Proceedings, Available: https://api.semanticscholar.org/CorpusID:266047725.
- R. Adibah and M. Sufiati, “Analysis of purchasing intention in the fashion industry: Enhancing product sales through live commerce streaming,” International Journal of Current Science Research and Review, 2024. Available: https://api.semanticscholar.org/CorpusID:268735554.
- W.-K. Chen, C.-W. D. Chen, and A. D. K. Silalahi, “Understanding consumers’ purchase intention and gift-giving in live streaming commerce: Findings from SEM and fsQCA,” Emerging Science Journal, 2022. Available: https://api.semanticscholar.org/CorpusID:248272219.
- Y. Sun, X. Shao, X. Li, Y. Guo, and K. Nie, “How live streaming influences purchase intentions in social commerce: An IT affordance perspective,” Electronic Commerce Research and Applications, vol. 37, 2019. Available: https://api.semanticscholar.org/CorpusID:201901757.
- A. Wongkitrungrueng and N. Assarut, “The role of live streaming in building consumer trust and engagement with social commerce sellers,” Journal of Business Research, 2020. Available: https://api.semanticscholar.org/CorpusID:158377481.
- S. O’Flynn, “Data science, Disney, and the future of children’s entertainment,” The Palgrave Handbook of Children’s Film and Television, 2019. Available: https://api.semanticscholar.org/CorpusID:189995733.
- Waseem, M. U. Abbasi, and F. Hamid, “Impact of digital marketing strategies on marketing performance: Role of social media performance and e-commerce,” International Journal of Management Research and Emerging Sciences, 2024. Available: https://api.semanticscholar.org/CorpusID:272800184.
- C. Gomez-Uribe and N. Hunt, “The Netflix recommender system,” ACM Transactions on Management Information Systems (TMIS), vol. 6, pp. 1–19, 2015. Available: https://api.semanticscholar.org/CorpusID:207233222.
- M.-H. Huang and R. T. Rust, “A strategic framework for artificial intelligence in marketing,” Journal of the Academy of Marketing Science, vol. 49, pp. 30–50, 2020. Available: https://api.semanticscholar.org/CorpusID:228811228.
- M. Faishol and F. U. Zuhro, “Dakwah’s communication strategies in the digital age: the influence of Alaydrus’s platform of Instagram,” Jurnal Kajian Manajemen Dakwah, 2024. Available: https://api.semanticscholar.org/CorpusID:269797596.
- F. Dost, U. Phieler, M. Haenlein, and B. Libai, “Seeding as part of the marketing mix: Word-of-mouth program interactions for fast-moving consumer goods,” Journal of Marketing, vol. 83, pp. 62–81, 2018. Available: https://api.semanticscholar.org/CorpusID:169280650.
- R. Zhang, X. Zhang, and B. Liu, “Stackelberg game perspective on pricing decision of a dual-channel supply chain with live broadcast sales,” Complexity, vol. 2022, pp. 6102963:1–6102963:11, 2022. Available: https://api.semanticscholar.org/CorpusID:248221324.
- Z.-W. Yu and J. Zhao, “Pricing and service decisions in a dual-channel supply chain with manufacturer’s direct channel service and retail service,” in Proceedings, 2014. Available: https://api.semanticscholar.org/CorpusID:20024908.
- S. C. Choi, “Price competition in a channel structure with a common retailer,” Marketing Science, vol. 10, pp. 271–296, 1991. Available: https://api.semanticscholar.org/CorpusID:155027596.
- X. Chen, X. Wang, and X. Jiang, “The impact of power structure on the retail service supply chain with an O2O mixed channel,” Journal of the Operational Research Society, vol. 67, pp. 294–301, 2016. Available: https://api.semanticscholar.org/CorpusID:3487688.
- M. Qin and M. Liu, “How consumer perceptions of virtual streamers affect purchase intention in live streaming commerce: based on cognition-affect-behavior model,” Asia Pacific Journal of Marketing and Logistics, 2024. Available: https://api.semanticscholar.org/CorpusID:273998433.
- J. Liu, Y. Zhang, and Z. Sun, “Pricing and service effort strategy in live streaming commerce supply chain under the equal proportion settlement mode,” PLOS ONE, vol. 19, 2024. Available: https://api.semanticscholar.org/CorpusID:272201173.
- Y. Zhang, J. Zhang, Y. Zhou, H. Zhao, and Y. Cheng, “Blockchain adoption and mode selection strategies for remanufacturing supply chain under cap-and-trade policy,” Computers & Industrial Engineering, vol. 192, p. 110246, 2024. Available: https://api.semanticscholar.org/CorpusID:269932317.
- H. Yang and W. Chen, “Retailer-driven carbon emission abatement with consumer environmental awareness and carbon tax: Revenue-sharing versus cost-sharing,” Omega, 2017. Available: https://api.semanticscholar.org/CorpusID:157791499.
- M. Velasquez and P. T. Hester, “An analysis of multi-criteria decision making methods,” in Proceedings of the 2013 Conference, 2013. Available: https://api.semanticscholar.org/CorpusID:6891121.
- E. K. Zavadskas and Z. Turskis, “Multiple criteria decision making (MCDM) methods in economics: an overview,” Technological and Economic Development of Economy, vol. 17, pp. 397–427, 2011. Available: https://api.semanticscholar.org/CorpusID:154281839.
- S. S. Panigrahi, B. K. Bahinipati, K. Govindan, and S. Parhi, “An advanced dual-layered framework for sustainable supply chain performance,” Journal of Modelling in Management, 2024. Available: https://api.semanticscholar.org/CorpusID:272905632.
- P. Chithambaranathan, N. Subramanian, A. Gunasekaran, and P. K. Palaniappan, “Service supply chain environmental performance evaluation using grey based hybrid MCDM approach,” International Journal of Production Economics, vol. 166, pp. 163–176, 2015. Available: https://api.semanticscholar.org/CorpusID:13018080.
- İ. G. Yazar Okur, B. D. Duman, E. Demirci, and B. F. Yıldırım, “Evaluating logistics sector sustainability indicators using multi-expert Fermatean fuzzy entropy and WASPAS methodology,” Journal of International Logistics and Trade, 2025. Available: https://api.semanticscholar.org/CorpusID:276871272.
- B. Balraj and T. Haripriya, “The effect of visual influencer marketing on social commerce engagement: a multi-variable approach,” International Journal of Scientific Research in Engineering and Management, 2025. Available: https://api.semanticscholar.org/CorpusID:277721894.
- T. Fan, L. Wang, and Y. Song, “Impact of live commerce spillover effect on supply chain decisions,” Industrial Management & Data Systems, vol. 122, no. 5, pp. 1109–1127, 2022. Available: https://api.semanticscholar.org/CorpusID:247825036.
- F. Liu, Y. Wang, X. Dong, and H. Zhao, “Marketing by live streaming: How to interact with consumers to increase their purchase intentions,” Frontiers in Psychology, vol. 13, 2022. Available: https://api.semanticscholar.org/CorpusID:251772722.
- Q. Wang, N. Zhao, and X. Ji, “Reselling or agency selling? The strategic role of live streaming commerce in distribution contract selection,” Electronic Commerce Research, pp. 1–34, 2022. Available: https://api.semanticscholar.org/CorpusID:250437594.
- B. Febrianti, K. Kussudyarsana, and M. H. Maimun, “The effect of social media, packaging, and product quality on MSME sales performance,” Proceedings of the International Conference on Economics and Business Studies (ICOEBS 2022), 2022. Available: https://api.semanticscholar.org/CorpusID:249900180.
- K. Govindan, S. Rajendran, J. Sarkis, and P. Murugesan, “Multi criteria decision making approaches for green supplier evaluation and selection: a literature review,” Journal of Cleaner Production, vol. 98, pp. 66–83, 2015. Available: https://api.semanticscholar.org/CorpusID:110435285.
- H. von Stackelberg, “Market structure and equilibrium,” in Proceedings, 2010. Available: https://api.semanticscholar.org/CorpusID:152548236.
- T. L. Saaty, “The analytic hierarchy process: planning, priority setting, resource allocation,” in Proceedings, 1980. Available: https://api.semanticscholar.org/CorpusID:120643630.
- C.-L. Hwang and K. Yoon, “Multiple attribute decision making: methods and applications – a state-of-the-art survey,” in Lecture Notes in Economics and Mathematical Systems, 1981. Available: https://api.semanticscholar.org/CorpusID:63825953.
Figure 1.
Stackelberg Game Tree: Manufacturer-led and Retailer-led Scenarios with Payoffs
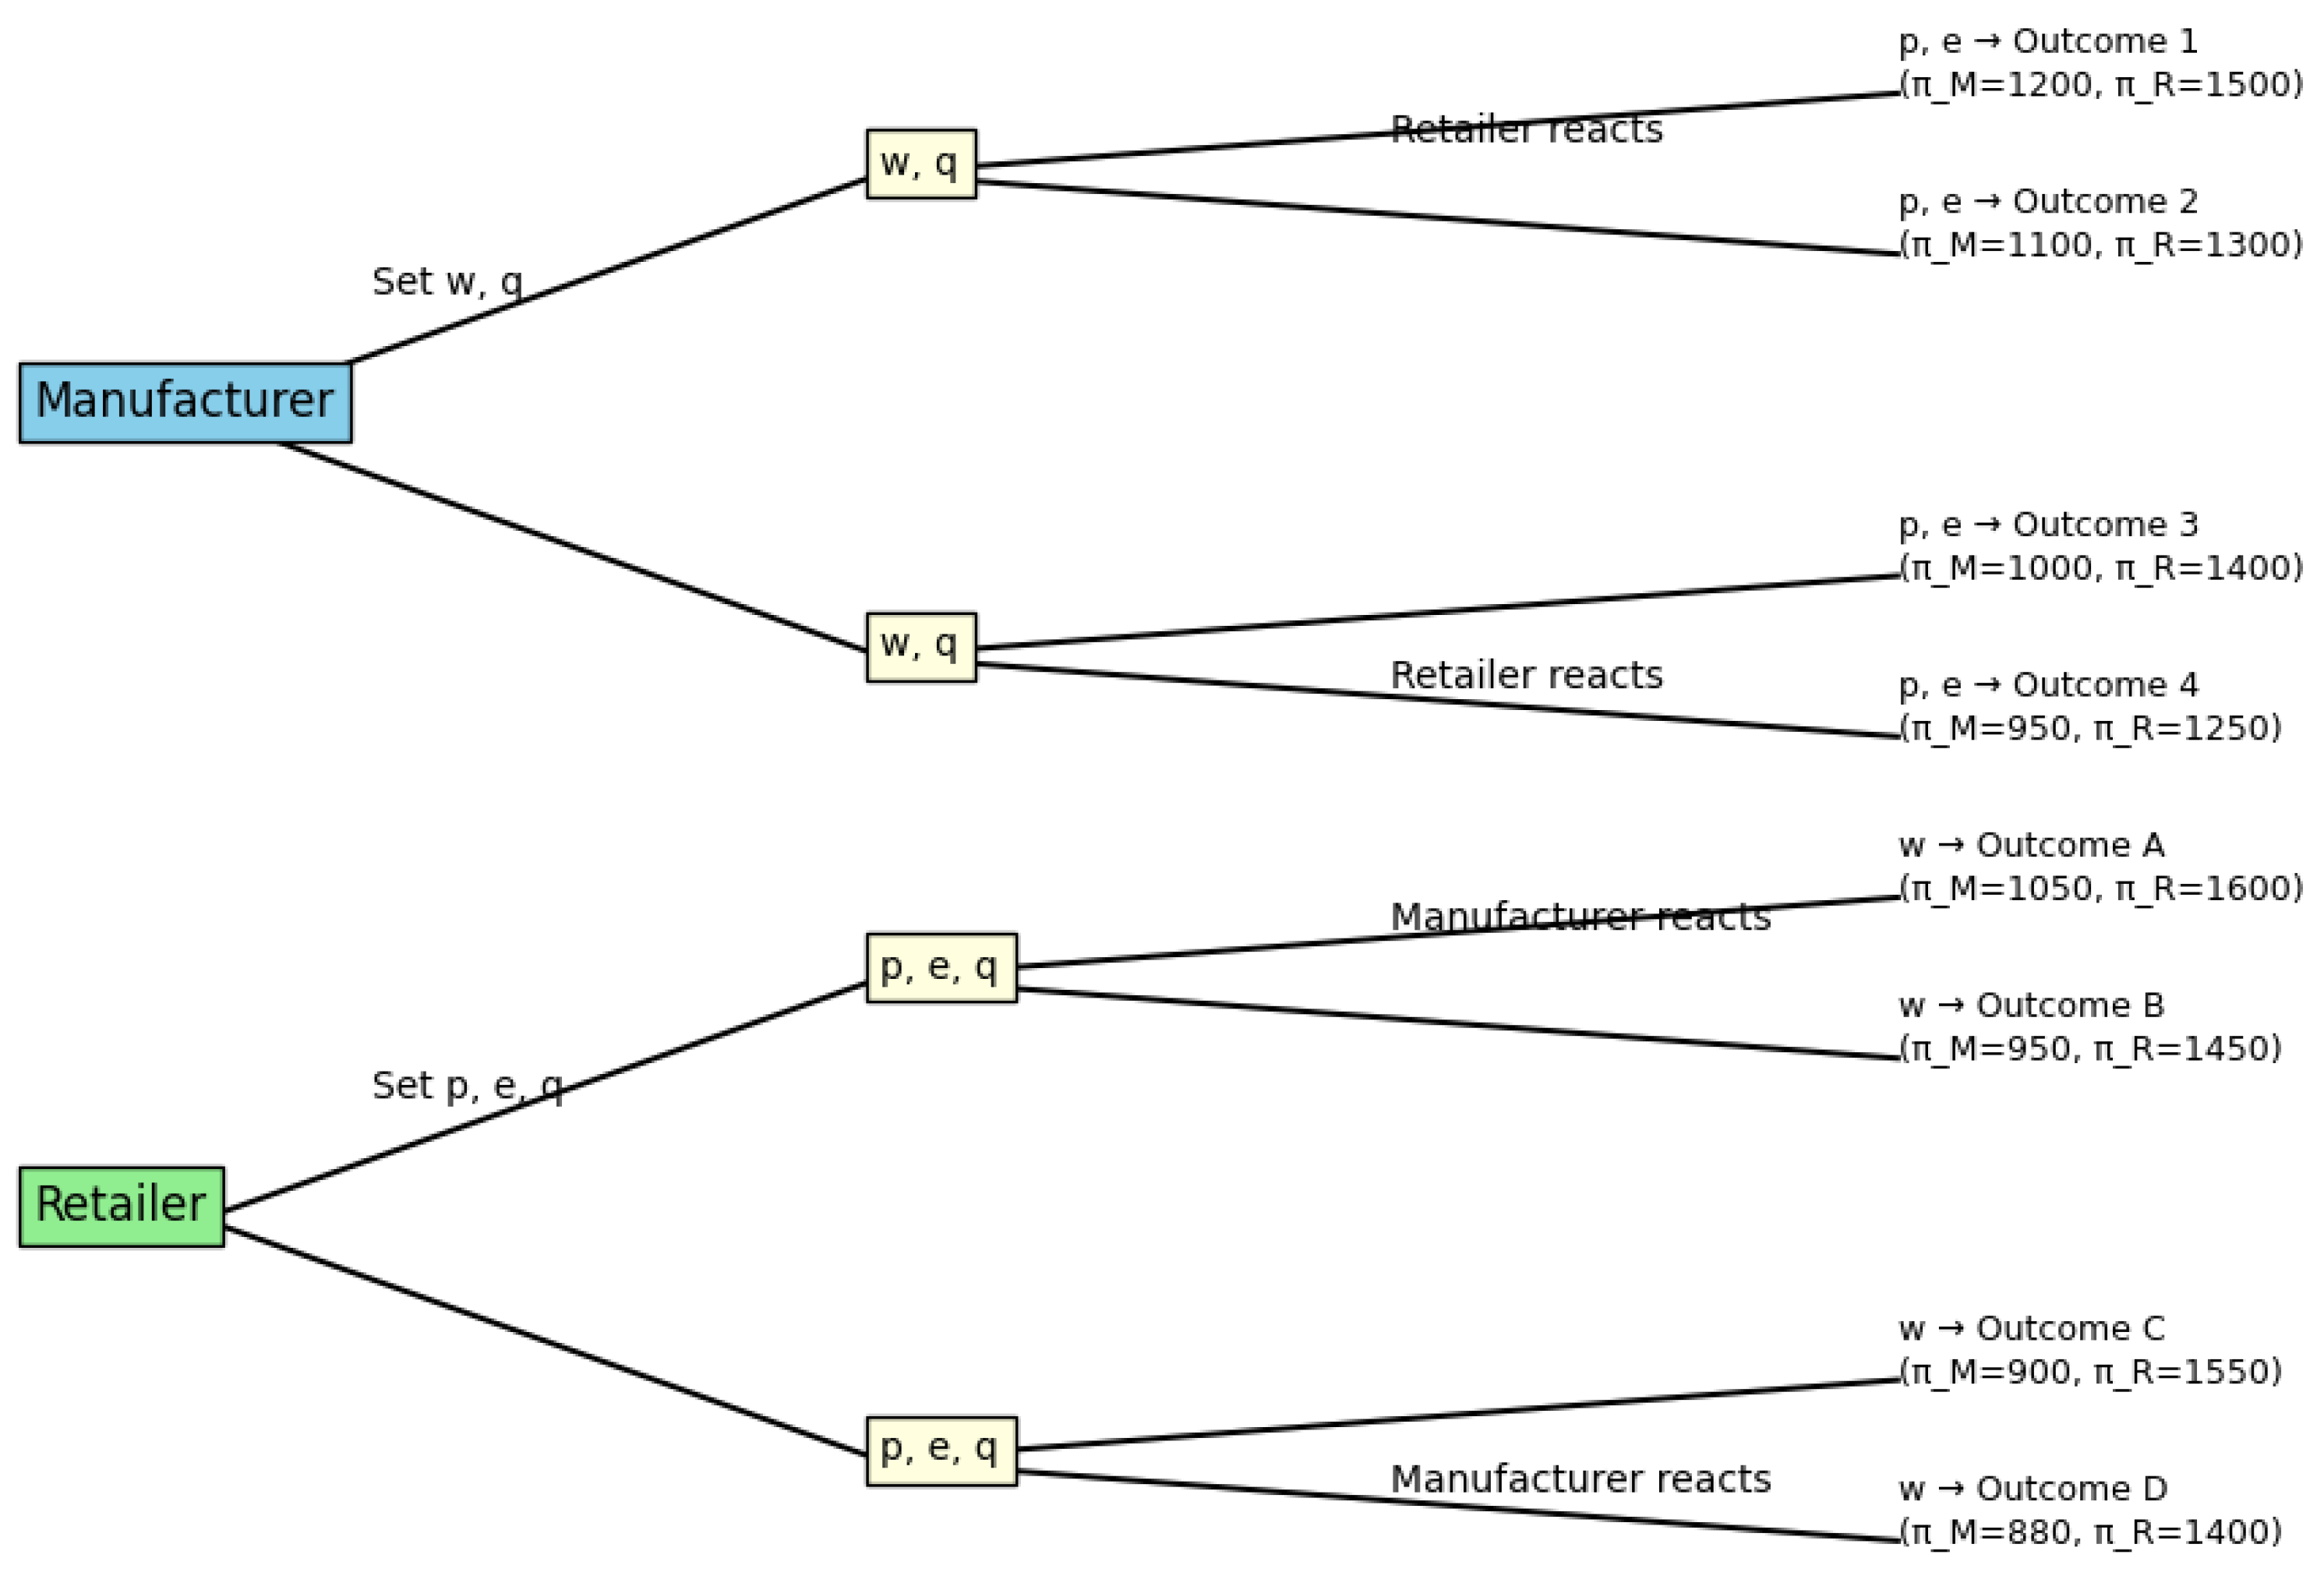
Figure 2.
Effort vs Demand Colored by Engagement (Theta)
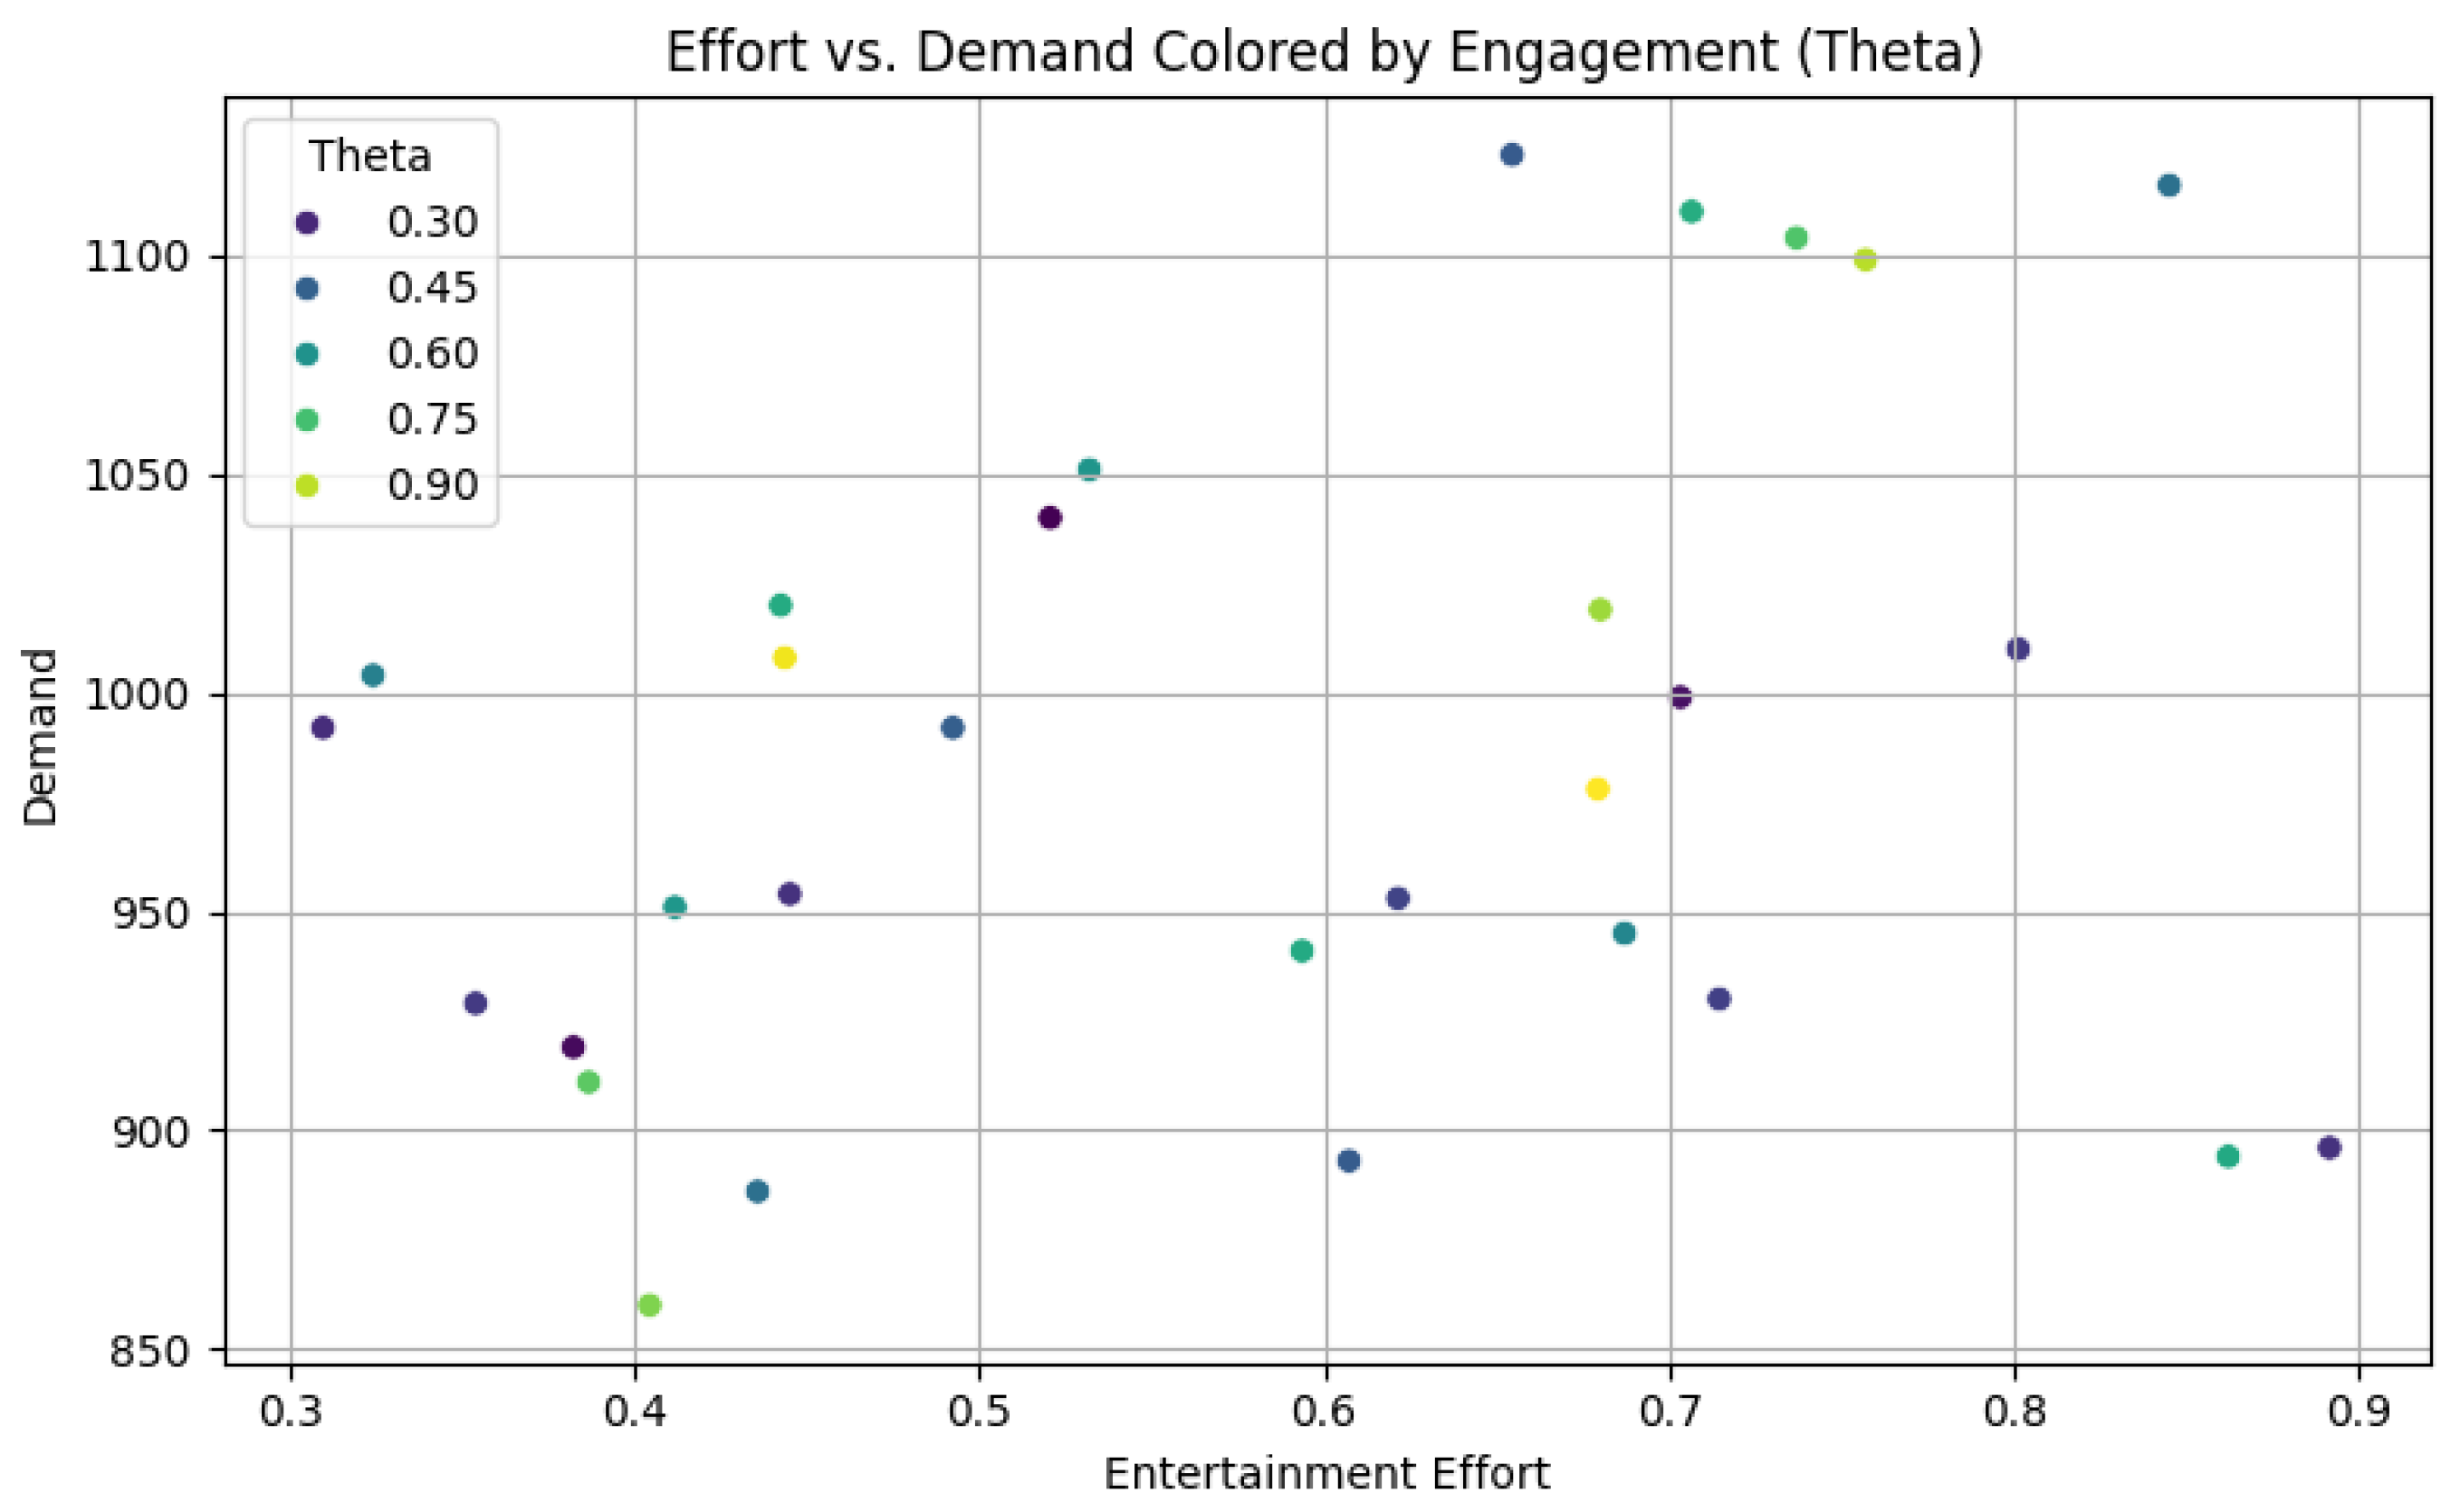
Figure 3.
Correlation Matrix of Key Features
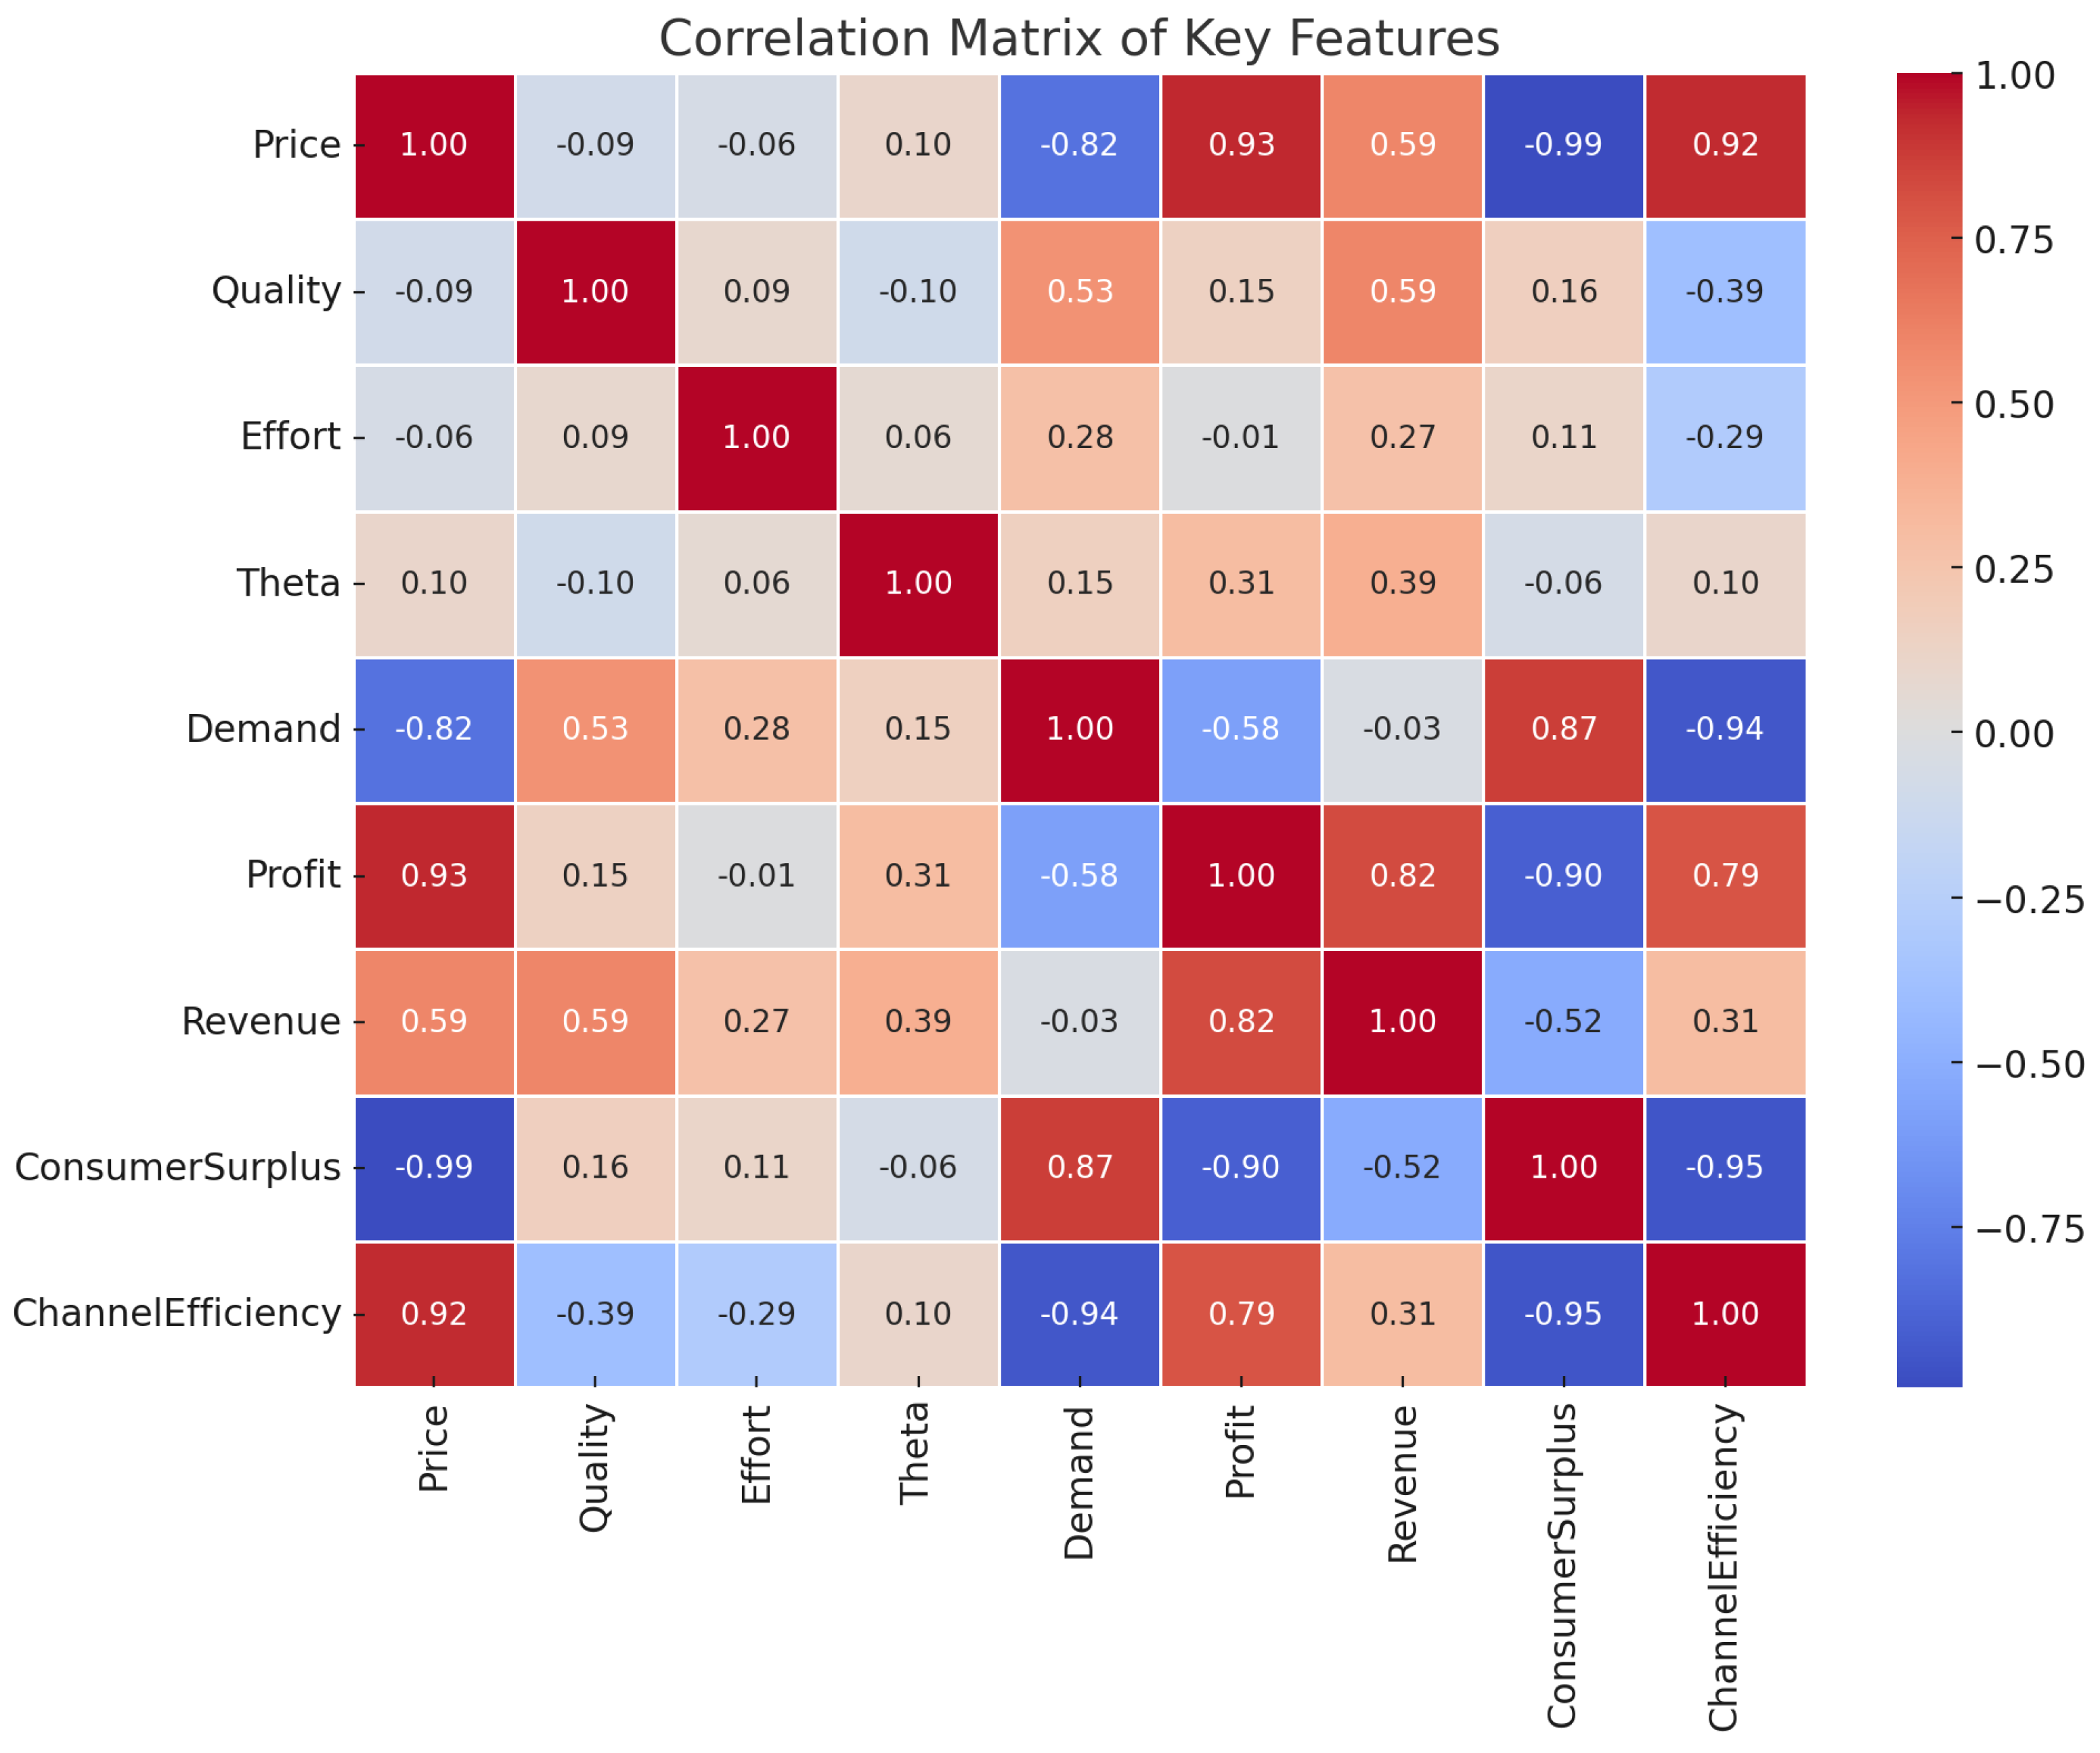
Figure 4.
TOPSIS Ranking
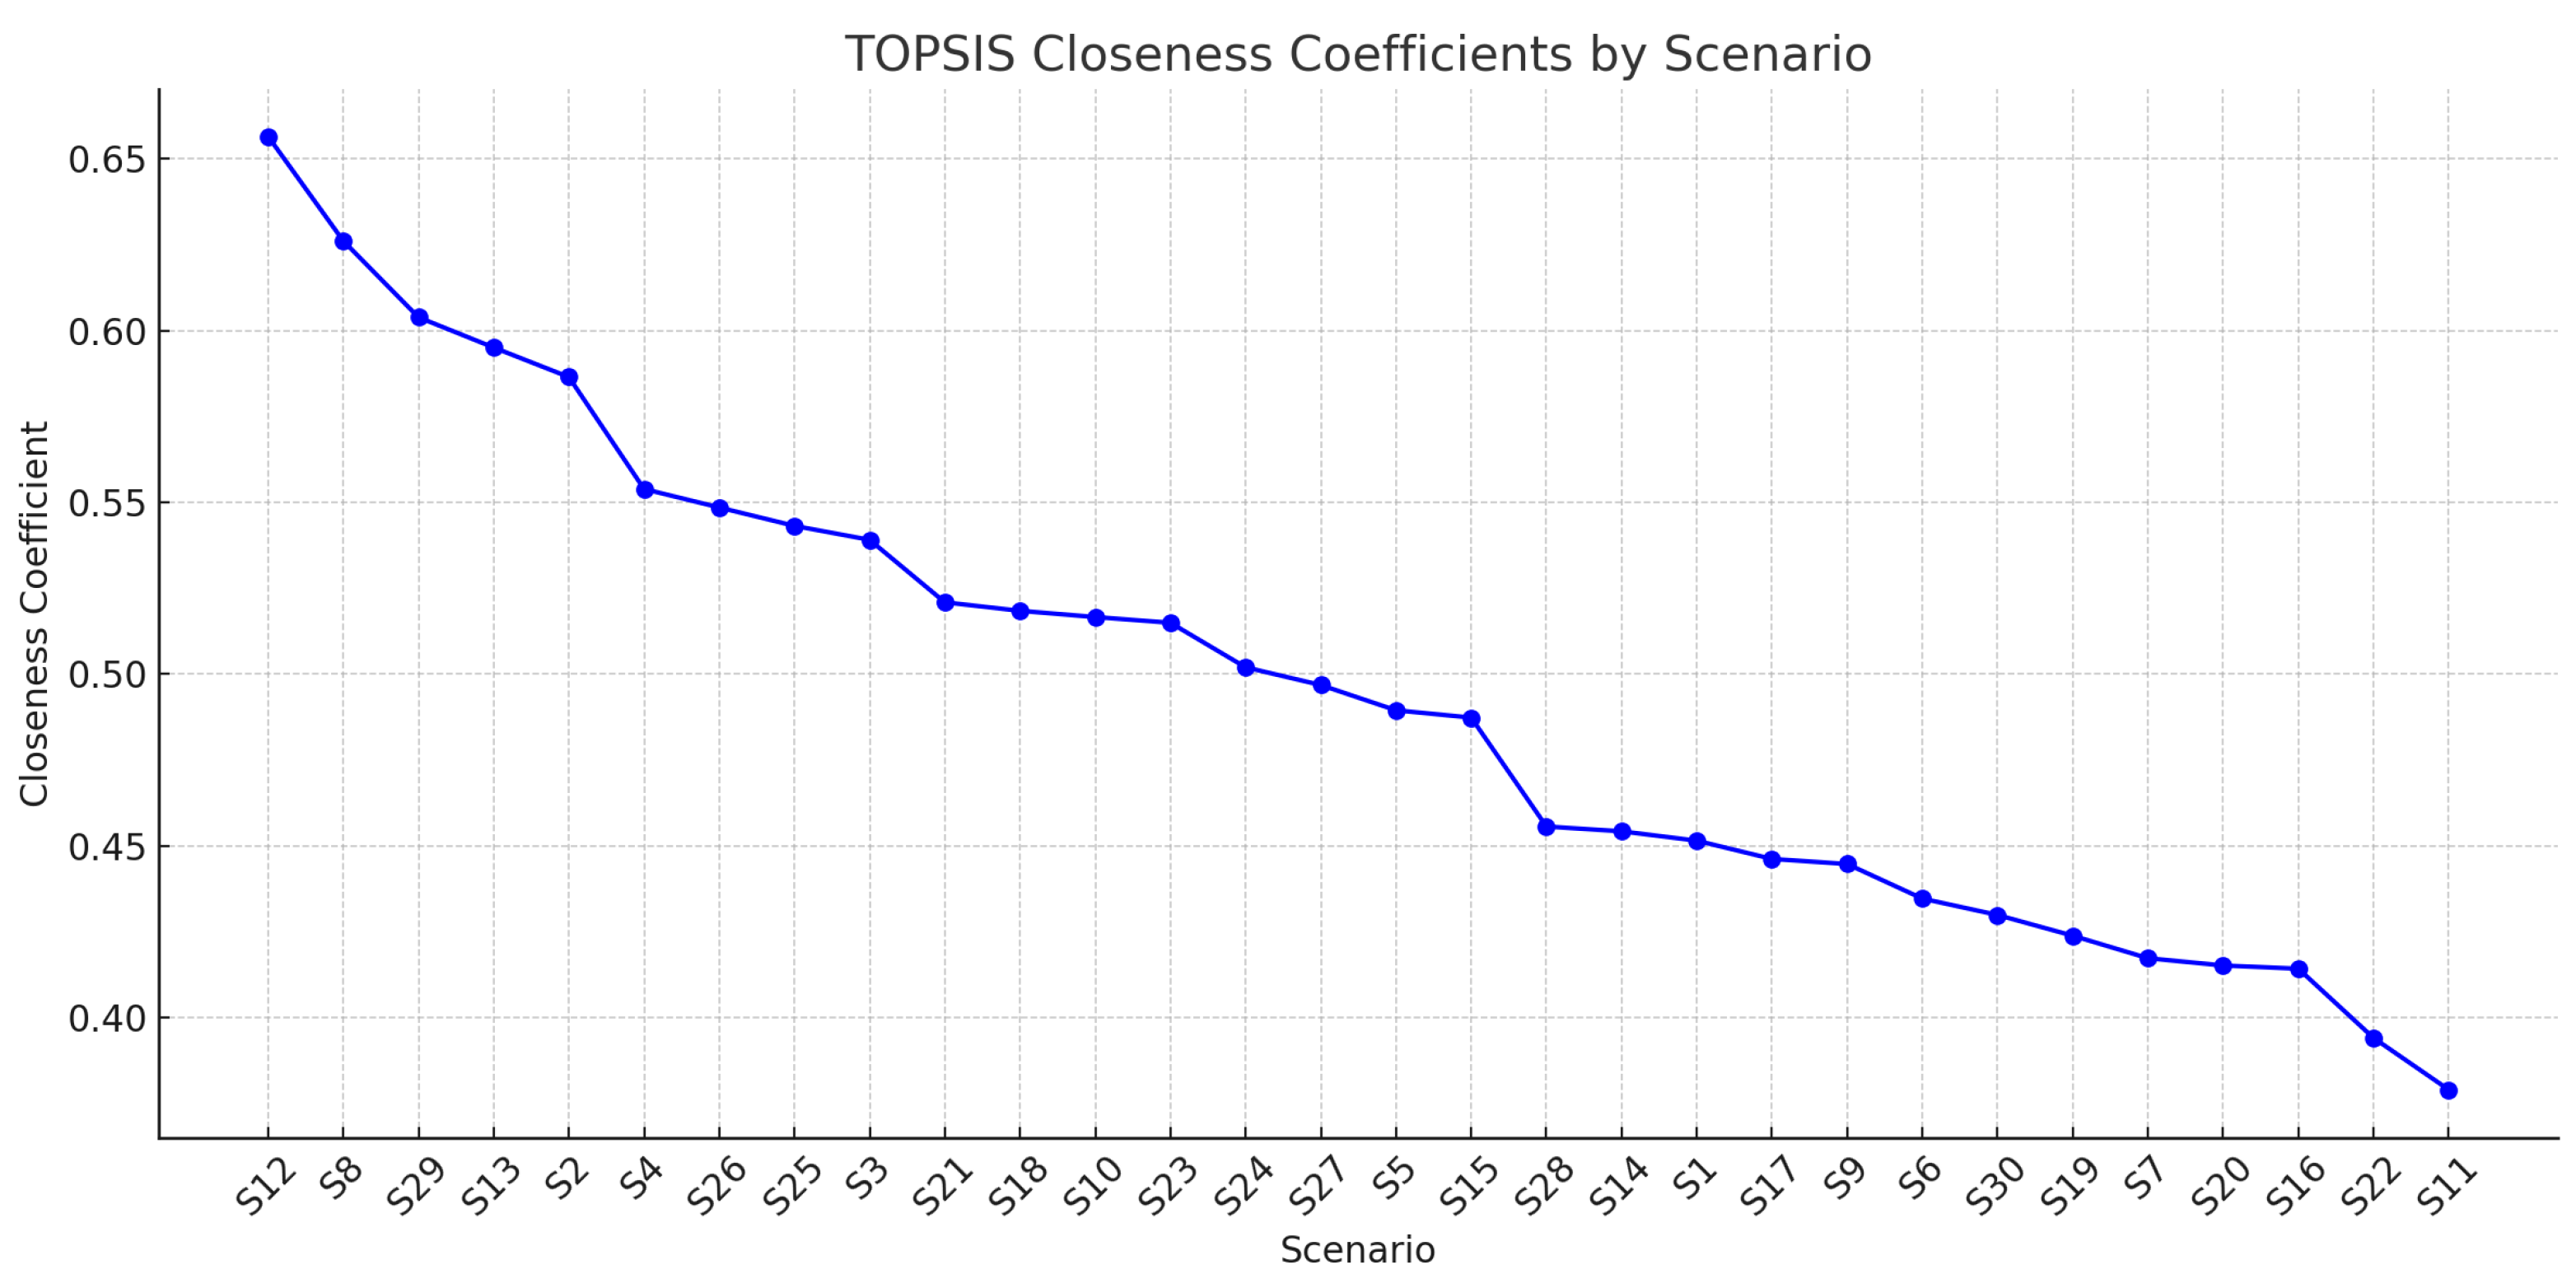
Figure 5.
Channel Efficiency by Scenario Rank
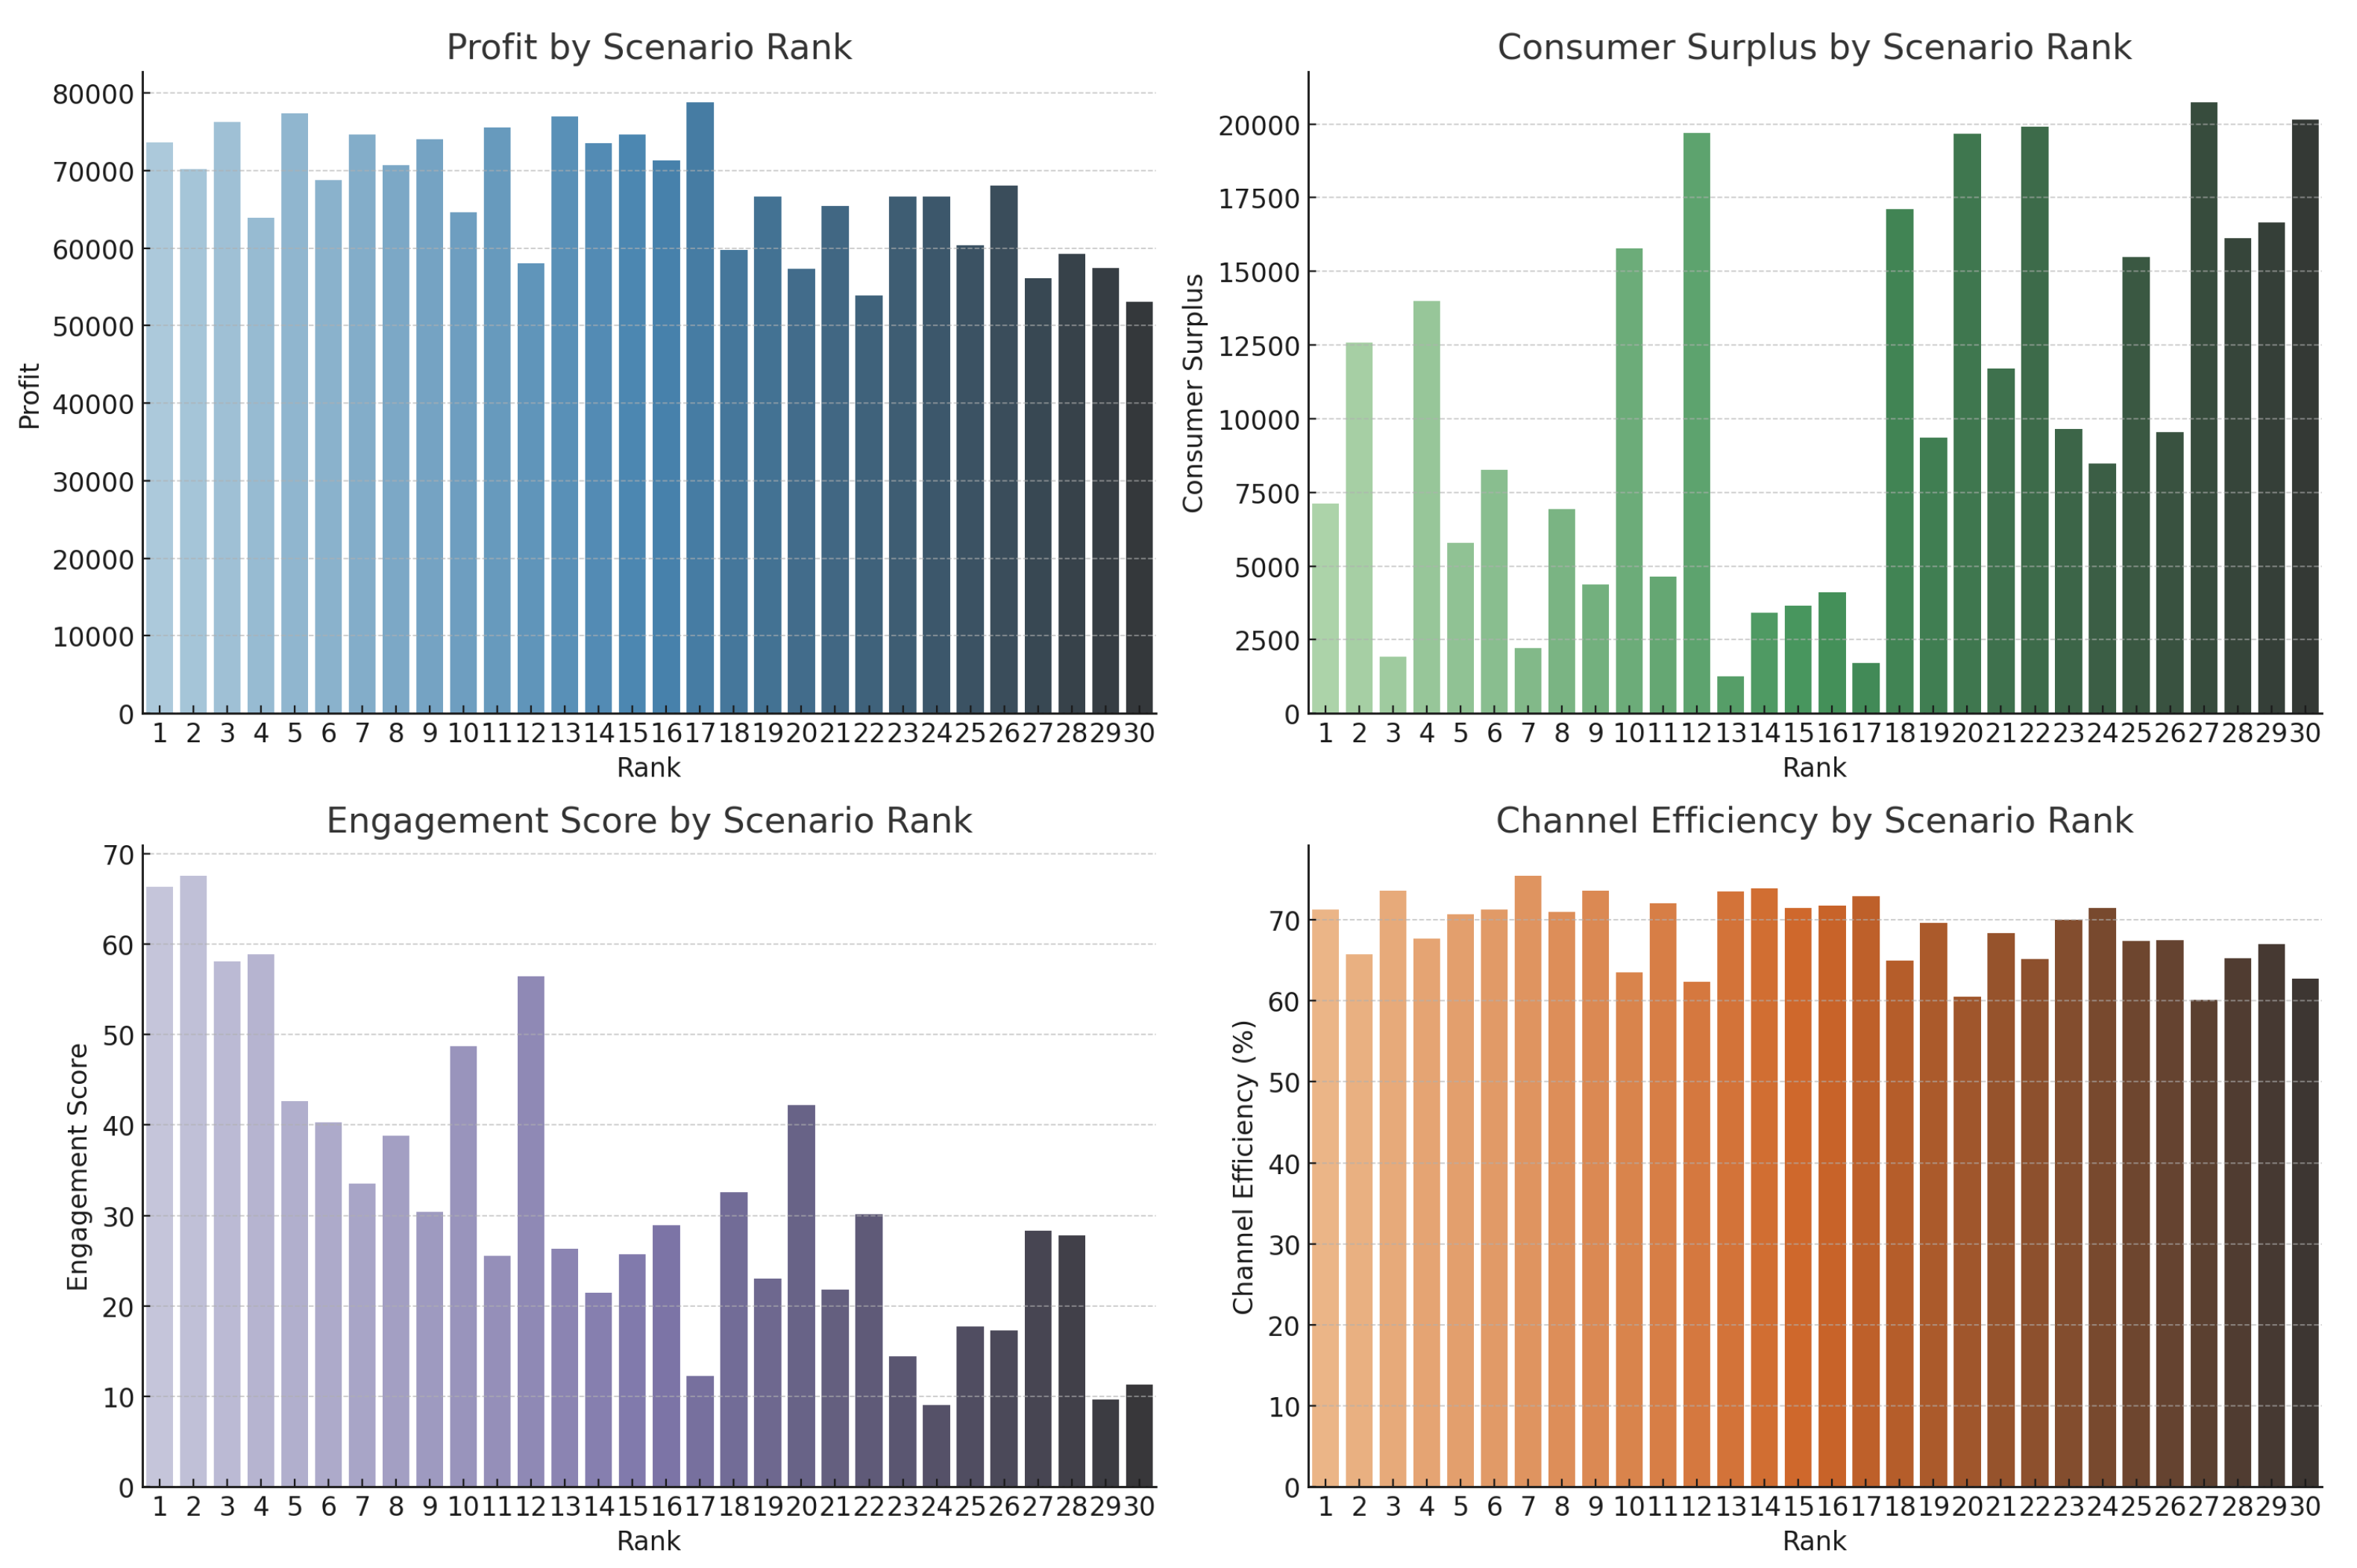

Table 1.
Decision Matrix for all the 30 Scenarios.
| Profit | ConsumerSurplus | EngagementScore | ChannelEfficiency | |
|---|---|---|---|---|
| S1 | 57298.76 | 19655.93 | 42.22 | 60.54 |
| S2 | 77403.33 | 5785.68 | 42.62 | 70.70 |
| S3 | 74044.42 | 4361.37 | 30.40 | 73.55 |
| S4 | 68762.94 | 8260.36 | 40.31 | 71.30 |
| S5 | 71251.95 | 4106.97 | 28.95 | 71.70 |
| S6 | 66618.57 | 9660.26 | 14.46 | 69.99 |
| S7 | 68094.66 | 9541.67 | 17.33 | 67.51 |
| S8 | 70208.17 | 12584.58 | 67.59 | 65.78 |
| S9 | 53881.86 | 19900.03 | 30.14 | 65.14 |
| S10 | 58080.06 | 19705.52 | 56.48 | 62.37 |
| S11 | 53059.72 | 20160.02 | 11.27 | 62.74 |
| S12 | 73579.34 | 7117.81 | 66.30 | 71.28 |
| S13 | 63939.00 | 13985.15 | 58.90 | 67.72 |
| S14 | 66619.94 | 9369.38 | 22.99 | 69.65 |
| S15 | 78825.99 | 1719.24 | 12.24 | 72.88 |
| S16 | 59294.56 | 15173.22 | 27.78 | 65.21 |
| S17 | 65412.18 | 11708.99 | 21.84 | 68.33 |
| S18 | 75505.71 | 4652.10 | 25.53 | 71.99 |
| S19 | 60341.10 | 15492.33 | 17.70 | 67.39 |
| S20 | 56095.83 | 20744.48 | 28.34 | 60.09 |
| S21 | 64646.22 | 15776.26 | 48.71 | 63.55 |
| S22 | 57455.26 | 16649.03 | 9.66 | 66.97 |
| S23 | 76963.63 | 1255.93 | 26.34 | 73.53 |
| S24 | 73546.31 | 3402.88 | 21.49 | 73.84 |
| S25 | 70703.03 | 6933.93 | 38.81 | 70.97 |
| S26 | 74585.87 | 2211.90 | 33.51 | 75.47 |
| S27 | 74604.17 | 3655.51 | 25.71 | 71.46 |
| S28 | 59733.70 | 17111.31 | 32.53 | 64.93 |
| S29 | 76225.42 | 1922.78 | 58.10 | 73.63 |
| S30 | 66683.09 | 8468.52 | 9.07 | 71.42 |
Table 2.
Normalized Decision Matrix for the 30 Scenarios.
| Profit | ConsumerSurplus | EngagementScore | ChannelEfficiency | |
|---|---|---|---|---|
| S1 | 0.1645 | 0.9441 | 0.5664 | 0.0296 |
| S2 | 0.9448 | 0.2324 | 0.5733 | 0.6895 |
| S3 | 0.8144 | 0.1593 | 0.3644 | 0.8751 |
| S4 | 0.6094 | 0.3594 | 0.5337 | 0.7284 |
| S5 | 0.7060 | 0.1463 | 0.3397 | 0.7547 |
| S6 | 0.5262 | 0.4312 | 0.0921 | 0.6437 |
| S7 | 0.5835 | 0.4252 | 0.1412 | 0.4823 |
| S8 | 0.6655 | 0.5813 | 1.0000 | 0.3700 |
| S9 | 0.0319 | 0.9567 | 0.3599 | 0.3286 |
| S10 | 0.1948 | 0.9467 | 0.8101 | 0.1484 |
| S11 | 0.0000 | 0.9700 | 0.0376 | 0.1727 |
| S12 | 0.7964 | 0.3008 | 0.9780 | 0.7276 |
| S13 | 0.4222 | 0.6532 | 0.8514 | 0.4963 |
| S14 | 0.5263 | 0.4163 | 0.2378 | 0.6213 |
| S15 | 1.0000 | 0.0238 | 0.0541 | 0.8314 |
| S16 | 0.2420 | 0.7141 | 0.3197 | 0.3331 |
| S17 | 0.4794 | 0.5364 | 0.2181 | 0.5356 |
| S18 | 0.8711 | 0.1743 | 0.2812 | 0.7737 |
| S19 | 0.2826 | 0.7305 | 0.1475 | 0.4743 |
| S20 | 0.1178 | 1.0000 | 0.3293 | 0.0000 |
| S21 | 0.4497 | 0.7451 | 0.6774 | 0.2252 |
| S22 | 0.1706 | 0.7899 | 0.0100 | 0.4471 |
| S23 | 0.9277 | 0.0000 | 0.2950 | 0.8734 |
| S24 | 0.7951 | 0.1102 | 0.2123 | 0.8939 |
| S25 | 0.6847 | 0.2914 | 0.5082 | 0.7076 |
| S26 | 0.8354 | 0.0491 | 0.4176 | 1.0000 |
| S27 | 0.8361 | 0.1231 | 0.2842 | 0.7389 |
| S28 | 0.2590 | 0.8136 | 0.4008 | 0.3149 |
| S29 | 0.8991 | 0.0342 | 0.8377 | 0.8799 |
| S30 | 0.5287 | 0.3701 | 0.0000 | 0.7367 |
Table 3.
AHP-Derived Weights for Decision Criteria.
| Criterion | Weight |
|---|---|
| Profit | 0.2847 |
| Consumer Surplus | 0.1522 |
| Engagement Score | 0.4307 |
| Channel Efficiency | 0.1323 |
Table 4.
Positive-Ideal and Negative-Ideal Solutions.
| Criterion | Positive-Ideal (Best) | Negative-Ideal (Worst) |
|---|---|---|
| Profit | 0.2847 | 0.0000 |
| Consumer Surplus | 0.1522 | 0.0000 |
| Engagement Score | 0.4307 | 0.0000 |
| Channel Efficiency | 0.1323 | 0.0000 |
Table 5.
TOPSIS Ranking Results
| Scenario | Closeness Coefficient | Rank |
|---|---|---|
| S12 | 0.6565 | 1 |
| S8 | 0.6261 | 2 |
| S29 | 0.6038 | 3 |
| S13 | 0.5950 | 4 |
| S2 | 0.5864 | 5 |
| S4 | 0.5538 | 6 |
| S26 | 0.5485 | 7 |
| S25 | 0.5431 | 8 |
| S3 | 0.5390 | 9 |
| S21 | 0.5209 | 10 |
| S18 | 0.5184 | 11 |
| S10 | 0.5166 | 12 |
| S23 | 0.5149 | 13 |
| S24 | 0.5019 | 14 |
| S27 | 0.4968 | 15 |
| S5 | 0.4894 | 16 |
| S15 | 0.4873 | 17 |
| S28 | 0.4556 | 18 |
| S14 | 0.4542 | 19 |
| S1 | 0.4515 | 20 |
| S17 | 0.4461 | 21 |
| S9 | 0.4447 | 22 |
| S6 | 0.4346 | 23 |
| S30 | 0.4298 | 24 |
| S19 | 0.4238 | 25 |
| S7 | 0.4172 | 26 |
| S20 | 0.4151 | 27 |
| S16 | 0.4142 | 28 |
| S22 | 0.3940 | 29 |
| S11 | 0.3789 | 30 |
Table 6.
Stackelberg Game Results
| Wholesale Price | Retail Price | Effort | Demand | Retailer Profit | Manufacturer Profit | Total Profit |
|---|---|---|---|---|---|---|
| 40.00 | 70.00 | 0.7 | 955.00 | 21965.00 | 38200.00 | 60165.00 |
| 42.11 | 72.11 | 0.7 | 944.47 | 21722.89 | 39767.31 | 61490.21 |
| 44.21 | 74.21 | 0.7 | 933.95 | 21480.79 | 41290.30 | 62771.09 |
| 46.32 | 76.32 | 0.7 | 923.42 | 21238.68 | 42768.98 | 64007.66 |
| 48.42 | 78.42 | 0.7 | 912.89 | 20996.58 | 44203.32 | 65199.90 |
| 50.53 | 80.53 | 0.7 | 902.37 | 20754.47 | 45593.35 | 66347.83 |
| 52.63 | 82.63 | 0.7 | 891.84 | 20512.37 | 46939.06 | 67451.43 |
| 54.74 | 84.74 | 0.7 | 881.32 | 20270.26 | 48240.44 | 68510.71 |
| 56.84 | 86.84 | 0.7 | 870.79 | 20028.16 | 49497.51 | 69525.66 |
| 58.95 | 88.95 | 0.7 | 860.26 | 19786.05 | 50710.25 | 70496.30 |
| 61.05 | 91.05 | 0.7 | 849.74 | 19543.95 | 51878.67 | 71422.62 |
| 63.16 | 93.16 | 0.7 | 839.21 | 19301.84 | 53002.77 | 72304.61 |
| 65.26 | 95.26 | 0.7 | 828.68 | 19059.74 | 54082.55 | 73142.29 |
| 67.37 | 97.37 | 0.7 | 818.16 | 18817.63 | 55118.01 | 73935.64 |
| 69.47 | 99.47 | 0.7 | 807.63 | 18575.53 | 56109.14 | 74684.67 |
| 71.58 | 101.58 | 0.7 | 797.11 | 18333.42 | 57055.96 | 75389.38 |
| 73.68 | 103.68 | 0.7 | 786.58 | 18091.32 | 57958.45 | 76049.76 |
| 75.79 | 105.79 | 0.7 | 776.05 | 17849.21 | 58816.62 | 76665.83 |
| 77.89 | 107.89 | 0.7 | 765.53 | 17607.11 | 59630.47 | 77237.58 |
| 80.00 | 110.00 | 0.7 | 755.00 | 17365.00 | 60400.00 | 77765.00 |
Table 7.
Complete Scenario Analysis Results with Multiple Performance Metrics
| Scenario | Price | Quality | Effort | Theta | Alpha | Gamma | Demand | Profit | ConsumerSurplus | EngagementScore | ChannelEfficiency | ClosenessCoefficient | Rank |
|---|---|---|---|---|---|---|---|---|---|---|---|---|---|
| S12 | 105.46 | 0.69 | 0.68 | 0.98 | 0.30 | 0.08 | 978 | 73579.34 | 7117.81 | 66.30 | 71.28 | 0.66 | 1 |
| S8 | 97.10 | 0.94 | 0.76 | 0.89 | 0.14 | 0.17 | 1099 | 70208.17 | 12584.58 | 67.59 | 65.78 | 0.63 | 2 |
| S29 | 115.70 | 0.62 | 0.86 | 0.67 | 0.12 | 0.18 | 894 | 76225.42 | 1922.78 | 58.10 | 73.63 | 0.60 | 3 |
| S13 | 92.57 | 0.65 | 0.68 | 0.87 | 0.11 | 0.05 | 1019 | 63939.00 | 13985.15 | 58.90 | 67.72 | 0.60 | 4 |
| S2 | 108.53 | 0.96 | 0.44 | 0.96 | 0.17 | 0.09 | 1008 | 77403.33 | 5785.68 | 42.62 | 70.70 | 0.59 | 5 |
| S4 | 102.45 | 0.64 | 0.59 | 0.68 | 0.48 | 0.10 | 941 | 68762.94 | 8260.36 | 40.31 | 71.30 | 0.55 | 6 |
| S26 | 114.86 | 0.61 | 0.40 | 0.83 | 0.47 | 0.10 | 860 | 74585.87 | 2211.90 | 33.51 | 75.47 | 0.55 | 7 |
| S25 | 105.34 | 0.71 | 0.69 | 0.56 | 0.34 | 0.10 | 945 | 70703.03 | 6933.93 | 38.81 | 70.97 | 0.54 | 8 |
| S3 | 110.43 | 0.73 | 0.39 | 0.79 | 0.13 | 0.17 | 911 | 74044.42 | 4361.37 | 30.40 | 73.55 | 0.54 | 9 |
| S21 | 91.59 | 0.98 | 0.71 | 0.69 | 0.49 | 0.18 | 1110 | 64646.22 | 15776.26 | 48.71 | 63.55 | 0.52 | 10 |
| S18 | 110.22 | 0.88 | 0.41 | 0.62 | 0.31 | 0.06 | 951 | 75505.71 | 4652.10 | 25.53 | 71.99 | 0.52 | 11 |
| S10 | 84.32 | 0.80 | 0.74 | 0.77 | 0.28 | 0.20 | 1104 | 58080.06 | 19705.52 | 56.48 | 62.37 | 0.52 | 12 |
| S23 | 117.19 | 0.80 | 0.61 | 0.43 | 0.48 | 0.10 | 893 | 76963.63 | 1255.93 | 26.34 | 73.53 | 0.51 | 13 |
| S24 | 112.32 | 0.72 | 0.44 | 0.49 | 0.46 | 0.06 | 886 | 73546.31 | 3402.88 | 21.49 | 73.84 | 0.50 | 14 |
| S27 | 112.15 | 0.84 | 0.71 | 0.36 | 0.14 | 0.16 | 930 | 74604.17 | 3655.51 | 25.71 | 71.46 | 0.50 | 15 |
| S5 | 110.84 | 0.69 | 0.89 | 0.32 | 0.49 | 0.09 | 896 | 71251.95 | 4106.97 | 28.95 | 71.70 | 0.49 | 16 |
| S15 | 116.30 | 0.98 | 0.35 | 0.35 | 0.20 | 0.16 | 929 | 78825.99 | 1719.24 | 12.24 | 72.88 | 0.49 | 17 |
| S28 | 87.46 | 0.80 | 0.53 | 0.61 | 0.18 | 0.15 | 1051 | 59733.70 | 17111.31 | 32.53 | 64.93 | 0.46 | 18 |
| S14 | 100.34 | 0.74 | 0.62 | 0.37 | 0.46 | 0.17 | 953 | 66619.94 | 9369.38 | 22.99 | 69.65 | 0.45 | 19 |
| S1 | 84.78 | 0.92 | 0.84 | 0.50 | 0.34 | 0.11 | 1116 | 57298.76 | 19655.93 | 42.22 | 60.54 | 0.45 | 20 |
| S17 | 96.42 | 0.81 | 0.49 | 0.44 | 0.22 | 0.17 | 992 | 65412.18 | 11709.00 | 21.84 | 68.33 | 0.45 | 21 |
| S9 | 81.02 | 0.60 | 0.44 | 0.68 | 0.37 | 0.06 | 1020 | 53881.86 | 19900.03 | 30.14 | 65.14 | 0.44 | 22 |
| S6 | 99.75 | 0.77 | 0.45 | 0.32 | 0.42 | 0.13 | 954 | 66618.57 | 9660.26 | 14.46 | 69.99 | 0.43 | 23 |
| S30 | 101.57 | 0.71 | 0.38 | 0.24 | 0.23 | 0.12 | 919 | 66683.09 | 8468.52 | 9.07 | 71.42 | 0.43 | 24 |
| S19 | 89.15 | 0.75 | 0.32 | 0.55 | 0.32 | 0.10 | 1004 | 60341.10 | 15492.33 | 17.70 | 67.39 | 0.42 | 25 |
| S7 | 100.91 | 0.93 | 0.70 | 0.25 | 0.22 | 0.07 | 999 | 68094.66 | 9541.67 | 17.33 | 67.51 | 0.42 | 26 |
| S20 | 83.08 | 0.99 | 0.65 | 0.43 | 0.17 | 0.07 | 1123 | 56095.83 | 20744.48 | 28.34 | 60.09 | 0.42 | 27 |
| S16 | 89.97 | 0.73 | 0.80 | 0.35 | 0.37 | 0.16 | 1010 | 59294.56 | 15173.22 | 27.78 | 65.21 | 0.41 | 28 |
| S22 | 86.45 | 0.70 | 0.31 | 0.31 | 0.41 | 0.14 | 992 | 57455.26 | 16649.03 | 9.66 | 66.97 | 0.39 | 29 |
| S11 | 81.26 | 0.77 | 0.52 | 0.22 | 0.15 | 0.17 | 1040 | 53059.72 | 20160.02 | 11.27 | 62.74 | 0.38 | 30 |
Disclaimer/Publisher’s Note: The statements, opinions and data contained in all publications are solely those of the individual author(s) and contributor(s) and not of MDPI and/or the editor(s). MDPI and/or the editor(s) disclaim responsibility for any injury to people or property resulting from any ideas, methods, instructions or products referred to in the content. |
© 2025 by the authors. Licensee MDPI, Basel, Switzerland. This article is an open access article distributed under the terms and conditions of the Creative Commons Attribution (CC BY) license (http://creativecommons.org/licenses/by/4.0/).
Copyright: This open access article is published under a Creative Commons CC BY 4.0 license, which permit the free download, distribution, and reuse, provided that the author and preprint are cited in any reuse.


