Submitted:
11 July 2025
Posted:
15 July 2025
You are already at the latest version
Abstract
Water quality monitoring and evaluation are essential across multiple sectors, including public health, environmental protection, agriculture and livestock management, industrial processes, and broader sustainability efforts. Conventional water analysis techniques, although accurate, they are often constrained by the labor-intensive nature, extended processing times, and limited applicability for in-situ, real-time monitoring. In recent years, spectroscopy-based methods have gained prominence as alternatives for water quality assessment, particularly when combined with chemometric analyses and advanced technological systems. This review provides an overview of the current advancements of spectroscopy-based water monitoring, with a focus on spectroscopy techniques operating within the Ultraviolet/Visible (UV/Vis) and Infrared (IR) spectral regions, which are currently applied for the assessment of a broad range of physicochemical, and biological parameters relevant to livestock water management, including chemical oxygen demand (COD), dissolved organic carbon (DOC), nitrates, microbial contamination, and heavy metal ions. The findings highlight the growing utility of spectroscopy as a reliable tool in water quality monitoring and underpin for the need for continued research into scalable, sensor-integrated solutions tailored for use in livestock faming environments.
Keywords:
water quality analysis
; water quality parameters
; spectroscopic methods
; spectroscopy
; chemometrics
; machine learning
; precision livestock farming
1. Introduction
Water is the most vital resource on Earth and indispensable for sustaining life. It occupies approximately 75% of the planet’s surface [1] playing a crucial role in climate regulation and ecological balance. In the human body, it constitutes about 60-65% and serves biochemical reactions, thermoregulation and metabolic function [2]. Roughly 97% of the surface water is saline, leaving only 3% as freshwater available for consumption and other antrhropogenic applications. However, merely 0.06% of this freshwater is contained in accessible reservoirs such as lakes and rivers, while the remaining 99.4% is found in subsurface aquifers, glaciers and wetland ecosystems showcasing the dependence on groundwater resources for potable and agricultural water supply[3].
The universal dependency of all life forms on Earth underscores the critical role of water in maintaining biological homeostasis and ecosystem stability. Nowadays, the One Health approach emphasizes the interdependence of human, animals’, and environmental health and includes water safety as a basic component. Globally, institutions such as the World Health Organization (WHO), the Centers for Disease Control and Prevention (CDC), and the World Organisation for Animal Health (WOAH) actively support integrative approaches to public health and environmental sustainability [4,5,6]. Recognizing the deep interconnections between various sectors including health, food safety, water resources and energy it becomes evident that effective prevention and risk mitigation strategies require interdisciplinary collaboration among professionals from medicine, veterinary science, chemistry, physics, environmental science, epidemiology, public health, and policy development. In this context, addressing the increasing challenge of improperly managed water resources and sanitation services remains a priority for billions of people worldwide. The Sustainable Development Goal (SDG) 6 emphasizes the necessity of sustainable management of water resources, wastewater treatment, and ecosystems preservation, while recognizing the significance of universal access to clean water for everyone by 2030.
Recent advancements across multiple production sectors, including industrial manufacturing, agriculture, and livestock farming, have resulted in various pollutants entering critical water sources, either directly, via seas, rivers, and lakes or indirectly through atmospheric deposition and soil infiltration impacting water quality and safety. Additionally, the rapid growth of industrial and agricultural production promptly affects the global water footprint [7], as vast amounts of water are consumed in the manufacturing of goods. For example, approximately 11,000 liters of water are needed to produce a liter of milk [8], while 15,400 liters are needed for a kilogram of boneless beef [9]. Except from the increasing demands for production, water contamination, excessive evaporation driven by climate change, and disruptions to the typical water cycle pattern further contribute to the water sources degradation and scarcity.
Various factors, including natural disasters, seasonal variations, and fluctuations in water availability, can lead to rapid or gradual changes in water quality with respect to its potability and in some cases its suitability for other applications [10]. The early detection of water quality fluctuations is of pivotal importance to secure the desirable water quality and safety status, enabling efficient responses to contamination events. Indeed, the increasing frequency of extreme weather events, such as heavy rainfall resulting in floods, and prolonged droughts causing water shortages, have a devastating impact on both water quality and availability.
Therefore, the need for sustainable water resource exploitation and advanced, real-time, in-situ, monitoring systems of water quality has emerged, with applications aiming to support evidence-based and sustainable water management strategies of surface and groundwater sources [11]. Spectroscopy has emerged as a versatile and efficient tool for water quality assessment across a wide range of applications. Spectroscopic techniques are extensively utilized in almost all technological and scientific domains [12], enabling the determination of the composition, structural properties, and physicochemical characteristics of materials and substances [13], applications of key importance for agriculture and livestock farming, where accurate and reliable monitoring of water quality is essential for optimizing productivity, reinforcing animal health and welfare, and maintaining sustainable resource management.
The objective of this review was to summarize and compile the available literature on spectroscopy for water quality assessment applications, with particular focus on contaminants that are commonly present in livestock farming environment. In particular, Ultraviolet/Visible (UV/Vis) and Infrared (IR) spectroscopy are mainly examined, with applications ranging from monitoring key water quality parameters, including chemical oxygen demand (COD), dissolved organic carbon (DOC), phosphorus, nitrates, and microbial contamination, across different types of water sources such as surface water, groundwater, wastewater, and drinking water supplies. Additionally, the performance, applicability, and adaptability of each spectroscopic method and applications thereof are discussed. Finally, the review explores chemometric techniques, discussing their contribution to improving data interpretation, accuracy, and predictive modeling in spectroscopic analyses of water quality.
2. Spectroscopy Principles
2.1 Spectroscopy
Spectroscopy is the study of the light absorbance and emission in relation to the wavelength of the radiation that a medium is exposed to. It measures and interprets electromagnetic spectra[12,14] based on the principle that the energy of light is inversely related to its wavelength () as described by the Planck’s equation.
Where is the energy of the light in , is the Planck's constant , is the wavelength of the light in and is the speed of light .
2.2 Electromagnetic Spectrum
The distribution of electromagnetic radiation by wavelength or frequency is known as the electromagnetic spectrum [15]. The term spectrum was first used by Isaac Newton in 1666 to refer to the multicolored band of light that appeared when he placed a glass prism in the path of a sunbeam [16]. Later, in 1800, William Herschel was researching the temperature of various colors when he discovered infrared radiation while passing a thermometer through prism-split light [17]. One year later, Johann Ritter noticed invisible rays beyond the violet end of the visible spectrum, that cause specific chemical reactions, he called them "chemical rays". This spectral region was given the name ultraviolet [18].
The electromagnetic spectrum consists of the whole range of electromagnetic radiation and includes many subranges, such as Visible (Vis) light in the region from 380 nm to 750 nm, Ultraviolet (UV) radiation in the region from 10 nm to 400 nm, and Infrared (IR) radiation in the region from 750 nm to 1 mm as illustrated Figure 1. Currently, the majority of frequencies and wavelengths of electromagnetic radiation are exploited in spectroscopic applications.
2.3 Lambert-Beer Law
The quantitative analysis of a range of substances' quality parameters using absorption spectra is based on the Lambert-Beer law [20,21]. An illuminated medium partially absorbs the light energy that irradiates its surface, allowing a weakened intensity to pass through it. This phenomenon is governed by Lambert-Beer’s law [22] and the following mathematical expression:
In equation (2) the absorbance (A) is proportional to the product of the optical path length (d) in and the analyte’s concentration (c) in ; (ε) is the molar absorptivity in )), and inversely proportional to the transmittance (T). In Figure 2 a schematic representation is shown.
3. Water Quality and Its Importance in Livestock Farming
Chemical contamination of water is a challenging issue of major concern with the potential detrimental immediate and long-term effects on ecosystems and public health [23]. Water resources are broadly classified into surface water and groundwater distinguished by their origin [24]. Water pollution occurs in both categories due to a variety of anthropogenic factors associated with industrial discharge, agricultural runoff, and waste from livestock operations.
Livestock farming and animal-derived product industry account for nearly one-third of the global agricultural water consumed, highlighting their substantial demand for freshwater resources [25]. Livestock sector alone consumes approximately 10% of the estimated annual global water flows [26], while the quality standards of potable water are similar in both animals and humans [27]. Nevertheless, in many cases, the source of water in livestock farms may vary significantly. Table 1 summarizes the acceptable thresholds of different analytes in the water used for animal watering and irrigation in the USA. The variation between the two thresholds is evidenced, despite irrigation water being widely used in animal watering.
Some water sources other than tap water utilized to cover farm animal water demands include i) wells, ii) rivers, ponds, lakes and other surface water spots, and iii) boreholes constructed for water extraction, providing a reliable alternative in areas with limited surface water availability.
The livestock sector needs a substantial quantity of water to support the increasing production demands and has a considerable impact on water resources quality and hygiene [28]. The excessive manure and overall livestock-related waste production that affects water quality has resulted by the intensification of livestock farming, also known as the "livestock revolution" [29]. Particularly in intensively reared animals, mineral and protein supplementation frequently surpass the animals’ nutritional requirements, leading to nutrient-rich manure. While this can be beneficial for agriculture, it also poses environmental risks. Excess nitrogen and phosphorus from manure can seep into groundwater and flow into surface waters, contributing to water contamination [30,31,32].
Additionally, manure application introduces heavy metals like copper and zinc which accumulate in soils and enter the aquifer and the food chain [33]. Moreover, fertilizers, pesticides, and other agrochemicals in agricultural production introduce relevant residues and pollutants into water bodies [34]. Finally, antibiotics used in livestock prophylaxis and metaphylaxis further contribute to water pollution, as 30–90% of them are excreted unmetabolized into the environment facilitating antimicrobial resistance within the ecosystems [35].
Figure 3.
Diffuse and source point paths of different pollutants in catchment water in livestock farming areas (modified) [31].
Figure 3.
Diffuse and source point paths of different pollutants in catchment water in livestock farming areas (modified) [31].
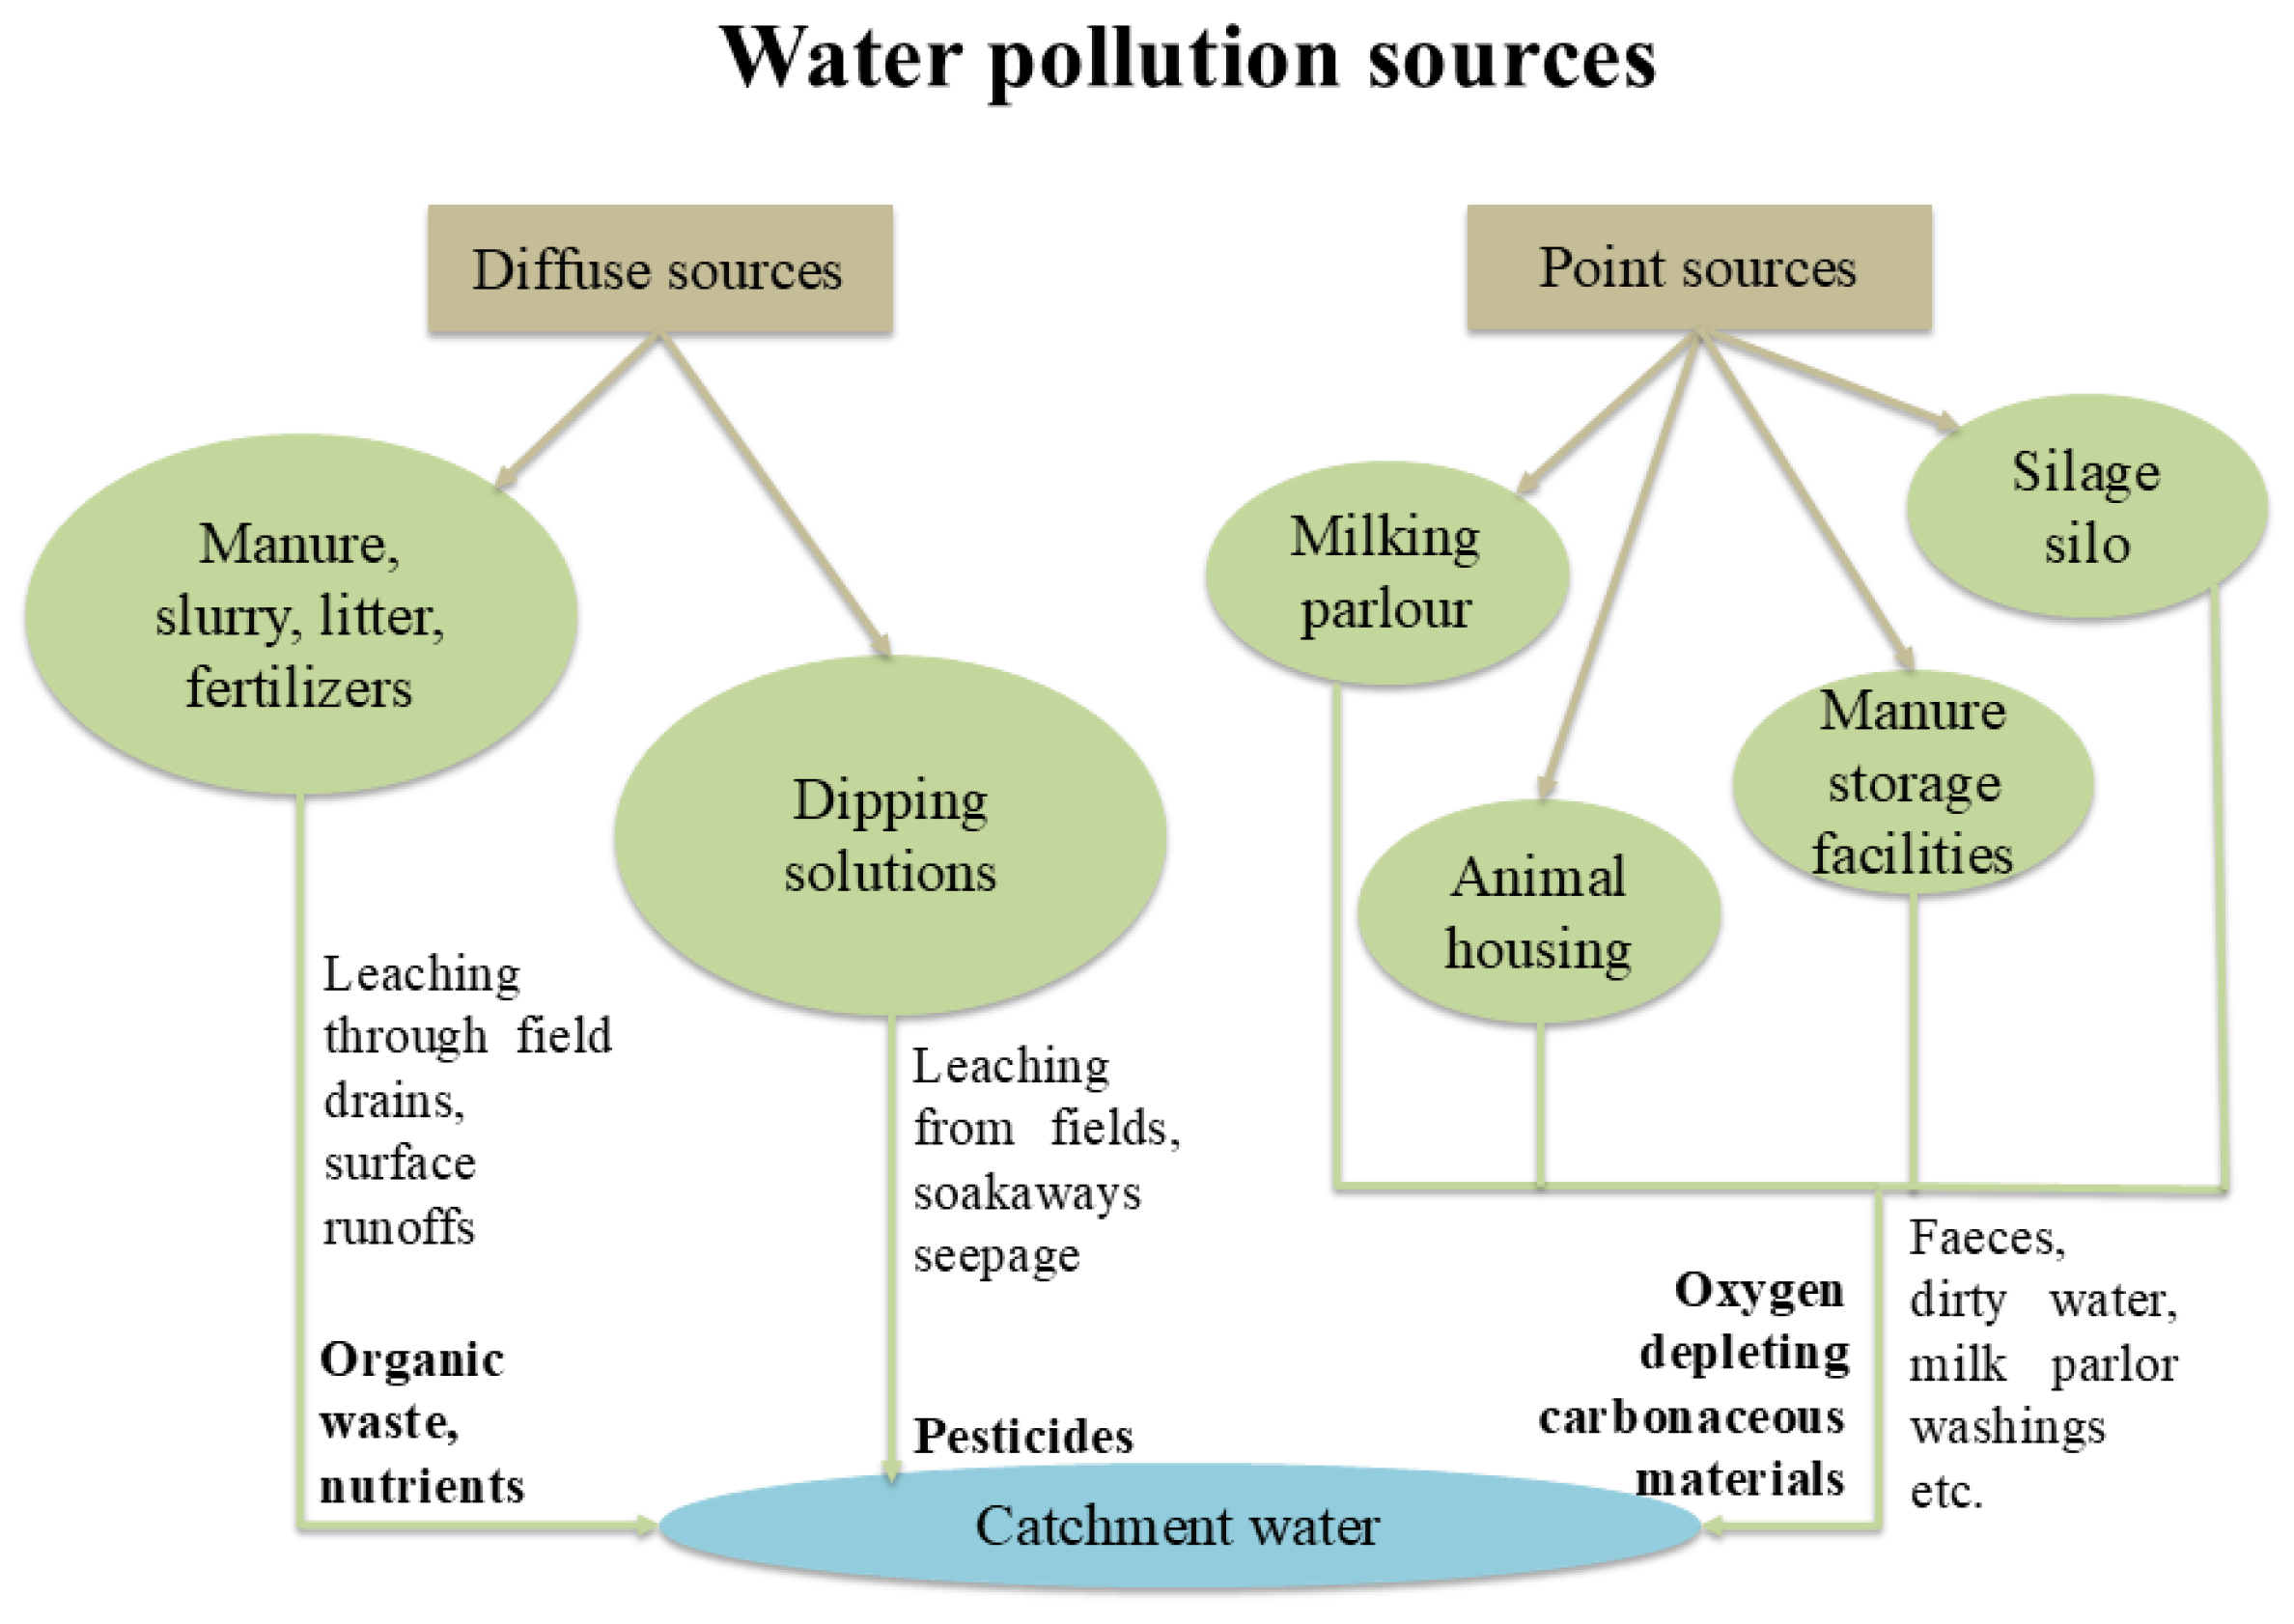
There are multiple sources of water contamination in livestock farms making it increasingly important to efficiently assess the quality and safety of the water consumed by animals.
3.1 Water Quality Parameters and Standards
Water quality is defined by a variety of characteristics which determine its suitability for different purposes. Water is classified in four categories according to its quality, namely, potable, palatable, polluted, and infected water (Figure 4) [24].
Various parameters are essential for the comprehensive assessment of water quality [36]. These parameters are typically classified into three main groups: physical, chemical, and biological as outlined in Table 2 [37]. The presence of extraneous substances in water, which do not inherently pose a health risk, such as sediments, color, or taste-altering compounds, is described as water contamination [38]. In contrast, water pollution denotes contamination that adversely affects the suitability of water for specific uses, resulted from anthropogenic activities [39].
Physical parameters refer to the observable properties of the water such as temperature, turbidity, color, electrical conductivity, and total suspended solids. Physical parameters of the water influence its appearance and its capacity to carry or dissolve other substances, while excessive turbidity or temperature fluctuations can reduce water intake in farm animals impairing their welfare, productivity and thermoregulation efficiency.
Chemical parameters refer to inorganic and organic compounds, including pH, dissolved oxygen, nitrates, phosphates, heavy metals (e.g., lead, arsenic), and salinity. These elements affect the metabolic functions of animals, with contaminants like nitrates or abnormal pH levels potentially causing toxicity or reduced productivity. Some of the chemical parameters are explained below:
- Chemical oxygen demand (COD) is defined as the quantity of oxidants consumed by the reducing substances in an one-liter oxidized water sample under specific conditions, expressed in milligrams per liter. It demonstrates the level of contamination brought on by introducing reducing agents into water [21].
- Dissolved organic carbon (DOC) is representing a universal element of the freshwater carbon cycle. It is a water disinfection byproduct that affects human health and can impair the effectiveness of aquatic ecosystems and weaken ultraviolet radiation [40].
- Nitrogen and phosphorus-containing compounds (e.g., detergents, fertilizers) are being released into the aquifer in mass quantities, disrupting the nitrogen and phosphorus equilibrium in aquatic ecosystems and causing eutrophication, the rapid and excessive growth of algae and other microorganisms, and the aquatic ecosystem degradation due to hypoxia. Consequently, water quality will eventually deteriorate and aquatic life will be challenged, which will have a remarkable impact on marine ecosystems and human production activities. [21].
The permissible limits for the aforementioned water quality parameters are variable and contingent upon factors, including the intended application of the water (e.g., drinking, agricultural irrigation, industrial use), as well as the regulatory framework established by individual countries or international organizations [37]. Drinking quality indicators and the thresholds of various relevant analytes in Europe and as proposed by the WHO are presented in Table 3.
Biological parameters refer to the presence of microorganisms such as bacteria, viruses, protozoa, and algae, with some of them being critical in livestock systems due to their association with waterborne infections and related diseases.
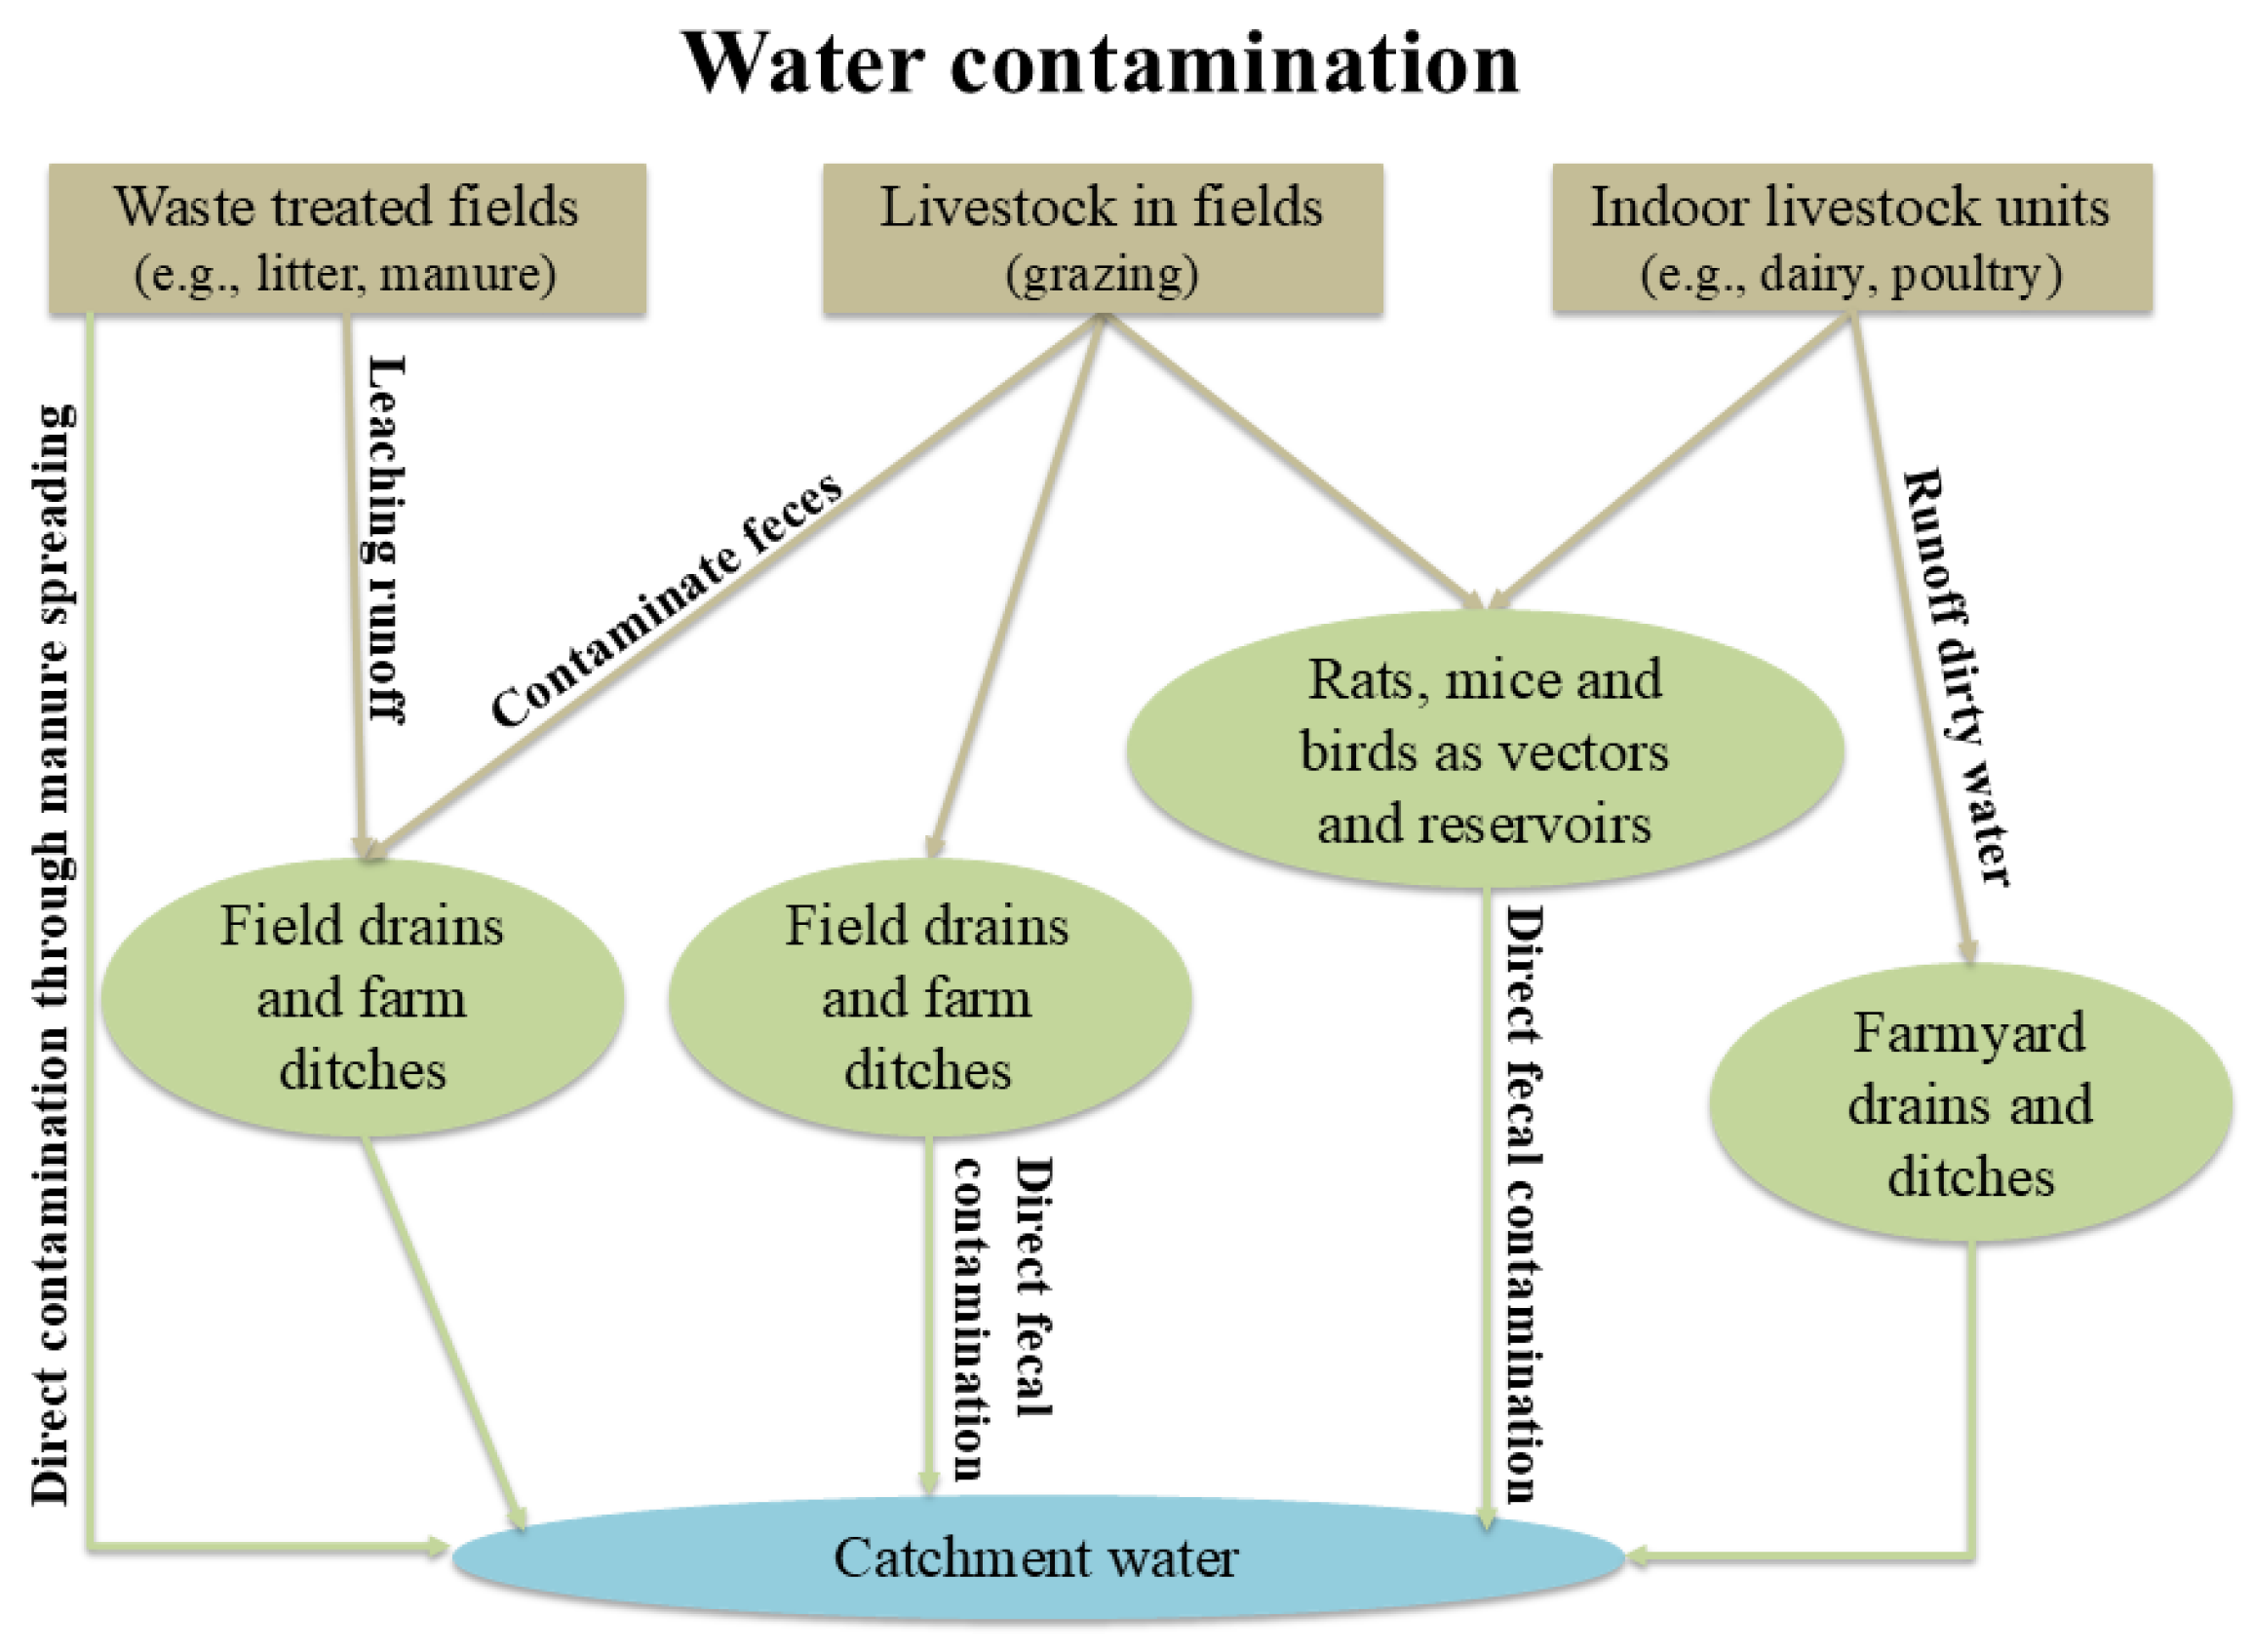
Waterborne diseases arise when pathogens are transmitted through the consumption of contaminated water. Water contamination primarily occurs via fecal pollution, with enteric bacteria such as Escherichia coli serving as key indicators of fecal presence; however, their detection alone does not suffice for assessing water safety. Moreover, environmental factors such as rising water temperature, flooding, and extreme weather events exacerbate the risk of pathogens’ survival and transmission, increasing the likelihood of disease outbreaks in both animals and humans [23]. Indeed, diarrheal diseases - often caused by waterborne pathogens - are responsible for 1.8 million deaths annually, particularly among children in developing countries. Some of the most common waterborne pathogens include Vibrio cholerae (Cholera), Shigella spp. (Dysentery), Salmonella spp. (Typhoid) [43].
The integration of spectroscopy-based spectrum acquisition with machine learning-based analytical techniques has emerged as an increasingly popular approach for the detection of pathogens in the water. A representative example is the study by Feng et al. [44], in which the UV/Vis spectra were captured for samples contaminated with bacteria species such as E. coli and Salmonella typhi, while artificial neural networks were used to build classification models enabling the automated pathogen identification based on distinct spectral features.
Figure 5.
Paths of catchment water contamination with microbial and protozoan micro-organisms in livestock farming areas (modified) [31].
Figure 5.
Paths of catchment water contamination with microbial and protozoan micro-organisms in livestock farming areas (modified) [31].
4. Chemometrics
Spectroscopic techniques and chemometrics are harmoniously and effectively combined in water quality analysis. Chemometrics refer to a broad range of statistical methods utilized to analyze chemical data, as well as to data mining techniques and machine learning (ML) algorithms. Based on the occurrence of data labeling, chemometric methods are divided into supervised and unsupervised methods. Supervised chemometric methods are applied either on classification problems of items assigned to discrete categories or on regression problems where the input data are associated with a continuous variable. Contrarily, unsupervised learning builds on uncovering typical patterns or structures in data sets without external labeling input. Unsupervised learning is commonly employed during the initial stages of analysis to reduce the dimensionality of datasets, ensuring that only the most meaningful and informative data are kept for further processing.
One of the most widely used unsupervised learning algorithms is Principal Component Analysis (PCA), which reduces a large dataset of intercorrelated variables to a smaller dataset, while explaining the largest variance of the dataset through newly established independent variables known as principal components [45].
The most popular supervised chemometric algorithms used in water analysis applications are:
- Partial Least Squares (PLS): It is a regression model that predicts a group of dependent variables from a group of independent variables (predictors). By projecting both input and output variables into a new space which maximizes the covariance allowing to model the interactions between them, it is considered efficient when there are more predictors than observations or in cases of multicollinearity [46].
- Support Vector Machines (SVM): They are supervised learning models, considered as binary linear classifiers that classify observations by finding the optimal boundary which maximizes the distance (margin) between different classes [47]. Using various kernel functions, they are effective in high-dimensional issues and perform well on both linear and non-linear classification tasks.
- Artificial Neural Networks (ANNs): ANNs are computational models based on a network that consists of several connected nodes inspired by the human brain which are known as artificial neurons, with the simplest one being perceptron (used for binary classification of linearly separable data) [48]. There are many types of NNs specialized in different scientific areas and applications including spatial data and image-like pattern analyses (Convolutional NNs) [49].
- Decision Trees (DT): It is a tree-like non-parametric method that can be used to solve classification and regression problems. The leaves of the trees represent different labels or outcomes (classes). They are easy to implement however, in the case of complex datasets they are sensitive to overfitting [50].
- Random Forest (RF): is considered an ensemble learning method for which multiple DTs are trained. For classification problems, the model outputs the class chosen by the majority of trees, while for regression problems, it returns the average of the trees’ outputs [51].
There are numerous studies assessing the performance of ML algorithms in water quality analysis (Table 4, 5). In one of them, Zhu et al. [52] reviewed various ML methods across different aquatic environments (groundwater, drinking water, wastewater, and marine environments), with Support Vector Machines (SVM) and Artificial Neural Networks showing the best performance. In other studies, various ML algorithms were evaluated based on their efficiency when used either in water quality classification or in prediction applications. Specifically, Nasir et al. [53] studied numerous different classifiers, such as RF, DT, and SVM on a dataset derived from the analysis of 1679 water samples and found that the CATBoost algorithm achieved the highest accuracy for the prediction of the studied water quality parameters. Similarly, in the study by Kaddoura [54] the aim was to evaluate different ML algorithms for the prediction of water quality, with eleven algorithms being tested; based on the F1 scores and the ROC curve values, SVM and k-nearest neighbor (k-nn) algorithms were found to perform better. Finally, Najah Ahmed et al. [55] also investigated the use of ML methods with Adaptive Neuro-Fuzzy Inference System (ANFIS), Radial Basis Function Neural Networks (RBF-ANN), and Multi-Layer Perceptron Neural Networks (MLP-ANN) being exploited to improve the prediction capacity of water quality.
5. Water Quality Analysis Applications
Spectroscopy has a wide range of applications in water quality analysis across various aquatic systems including surface water, groundwater, and wastewater [34,56,57]. Herein, we present different applications in these aquatic systems; however, it is important to note that spectroscopic methods also play a significant role in water quality assessment for fish farming and in the analysis of water content in soil [58,59]. Spectroscopic techniques such as NIR spectroscopy, and UV/Vis spectroscopy, are primarily employed in evaluating livestock water resources, facilitating the detection of analytes and specific contaminants, and assessing the quality of valuable water resources. A key advantage of these methods is their ability to enable real-time, on-site analysis, in contrast to conventional water quality assessment techniques, which are time-consuming and typically conducted in specialized laboratories.
A typical spectroscopical water analysis set-up is demonstrated in Figure 6. Using the appropriate spectroscopic method, spectral data are collected, analyzed, and combined with a variety of chemometric techniques to acquire the desirable results for water quality.
5.1 Ultraviolet-Visible (UV/Vis) Spectroscopy
Ultraviolet-Visible spectroscopy is a low-cost spectroscopic method that can efficiently and accurately detect and identify a variety of physical, chemical, and microbiological water quality parameters [20]; it is currently utilized for a variety of water analyses applications extending from bacterial or contamination detection to Dissolved organic carbon (DOC) quantification as summarized in Table 4.
Feng et al. [60] used a UV/Vis spectrophotometer to acquire the spectra of water samples contaminated by bacteria at 200-900 nm; for the characterization of samples, principal component analysis-Monte Carlo (PCA-MC) was used to separate the spectrum of mixed-bacteria contaminated water samples and measure the microbial content. The method succeeded to efficiently monitor water microbial content achieving a 0.9954 coefficient of determination (R2) in the testing set. Similarly, several studies have applied UV/Vis spectroscopy combined with chemometric tools for the monitoring of chemical oxygen demand (COD). Chen et al. [61] monitored (COD) in wastewater using UV/Vis spectroscopy combined with partial least squares (PLS); measuring the spectra of 82 samples with wavelength ranging from 200 to 650 nm for different wavelength paths they generated a slope-derived spectrum achieving a coefficient of determination (R²) equal to 0.936. The combination of UV/Vis spectroscopy with PLS to measure COD was also used by Li et al. [62]; specifically, the best prediction performance was acquired using synergy interval PLS (siPLS) with correlation coefficient of prediction (Rpred) of 0.8334 and root mean square error of prediction (RMSEP) of 2.63. Diffuse reflectance UV/Vis spectroscopy and PLS were also used by Agustsson et al. [63] to assess COD and turbidity in water, achieving R² values equal to 0.85 and 0.96, respectively, between the reference and the measured concentrations. Further advancing COD analysis, Hu et al. [64] measured COD by compensating the impact of turbidity in the spectral measurements acquired using UV/Vis spectroscopy. The method reached 0.99 R2 and 2.42 mg/L root mean square error (RMSE). Moreover, in another study, Hu et al. [65] used UV/Vis spectrum for the detection of eight typical contaminants and proposed four surrogate parameters for rapid prediction of the contaminants’ category.
The applications of UV/Vis spectroscopy have also been extended to natural water bodies, demonstrating the potential for real-time, field monitoring. Zhu et al. [66], used a portable UV/Vis spectrophotometer (spectro:lyser, S:CAN Messtechnik GmbH, Austria) for the quantification of DOC and iron (Fe) in river water samples originated from northern Europe. They acquired in-situ and ex-situ spectral data, and exploited three different analysis models, namely, PLS, principal component regression (PCR) and multiple stepwise regression (MSR). For both DOC and Fe, the MSR model proved to be the most efficient one, reaching R2 values of 0.971 and 0.989 respectively. Similarly, Cook et al.[67] studied DOC in tropical peatlands, achieving validation R2 values that ranged from 0.86 to 0.93.
The classification of drainage water into four different categories (domestic sewage, mixed rainwater, rainwater, and industrial sewage) using the UV/Vis spectral data and neural networks (NN) algorithms was studied by Zhu et al. [68], achieving an overall sensitivity of 97.9% and specificity of 99.3% with the application of convolutional NN (CNN). In the study by Wang et al. [69], the goal was to detect in real-time contamination events in the water distribution system with UV/Vis spectrometry and Bayesian analysis for event classification; for contamination events with concentrations above 30 μg/l, the results were satisfying, though further work was deemed necessary to improve and broaden the applicability of the proposed method.
Finally, UV/Vis spectroscopy has also proven effective for quantifying a variety of analytes in different aquatic environments. In the study by Etheridge et al. [70], the concentration of nitrogen, carbon, phosphorus and suspended solids in tidal marsh was investigated, among other parameters; combining UV/Vis absorption spectrum with different calibration models, depending on the parameter, they achieved R2 values ranging from 0.750 to 0.995. Furthermore, UV/Vis spectroscopy was also employed by Mason et al. [71] in their work to detect and quantify residues of the antibiotics lincomycin and tylosin.

Table 4.
Ultraviolet-Visible spectroscopy (UV/Vis) applications and performance.
| Wavelength |
No of samples | Origin of sample | Chemometrics | Application | RMSE | Reference | |
| 200 – 900 | 11 | cultivated bacteria | PCA-MC | bacteria detection | 0.9954 | - | [60] |
| 220 – 750 | 66 | fabricated | PLS | COD, turbidity | 0.99 | 2.42 mg/L | [64] |
| 200 – 1100 | 25 | wastewater | - | organic contaminant detection | - | - | [65] |
| 270, 350 | 252 | tropical peatlands | NLR, LR |
DOC quantification | 0.86 – 0.98 | 1.51 - 6.89 mg/L | [67] |
| 200 – 800 | 183, 142 | catchments water | MSR | DOC, Fe | 0.973, 0.989 | 2.599 mg/L, 108.905 μg/L |
[66] |
| 193.91 – 1121.69 | 144 | lake water | siPLS | COD | 0.8334 | 2.631 | [62] |
| 200 – 650 | 98 | wastewater | FiPLS | COD | 0.936 | 122 mg/L2 | [61] |
| 200 – 1100 | 48 | fabricated | PLS | COD, turbidity | 0.69, 0.95 | 35%, 21%3 | [63] |
| 220 – 700 * | 192 | different sewer networks | FNN, CNN | drainage type recognition | - | - | [68] |
| 225 – 260 260 – 320 320 – 700 |
144 | fabricated | PLS | nitrate, COD, turbidity |
0.993, 0.982, 0.998 |
1.29 mg/L, 2.337 mg/L, 0.696 mg/L |
[72] |
| 250 – 600 | ND | fabricated | EKF-DM | copper, cobalt, nickel |
0.9958, 0.9976, 0.9915 |
- | [73] |
| 520 / 610 ** | ND | fabricated | ND | metal ions | - | - | [74] |
RMSE: Root Mean Square Error, PCA: Principal Component Analysis, MC: Monte Carlo, PLS: Partial Least Squares, COD: Chemical Oxygen Demand, NLR: Non-Linear Regression, LR: Linear Regression, DOC: Dissolved Organic Carbon, MSR: Multiple Stepwise Regression, siPLS: synergy interval Partial Least Squares, 1,2RMSEP: Root Mean Square Error of Prediction, FiPLS: Forward interval Partial Least Squares, 3 SEP: Standard Error of Prediction, FNN: Fully connected Neural Network, CNN: Convolutional Neural Network, EKF-DM: Extended Kalman Filter and Derivative Method *sensitivity (%): 95.8, 97.8, specificity (%): 98.6, 99.3, **Limit of Detection: 30 parts per billion for lead ions and 89 parts per billion for aluminum ions, ND: Not Defined
5.2 Infrared Spectroscopy
Infrared (IR) spectroscopy has emerged as a rapid spectroscopic analytical technique with high precision and a plethora of applications [20]. In water analysis, its range of application extends from measuring key water quality parameters such as COD and alkalinity [75] to detecting various analytes including heavy metals [76] (Table 5). Infrared spectroscopy encompasses several techniques including Near-Infrared Spectroscopy (NIRS), Mid-Infrared Spectroscopy (MIRS), and Fourier Transform Infrared Spectroscopy (FTIR). The main distinction between NIRS, MIRS, and FTIR lies in their operational wavelength ranges, with NIRS operating in the range of 750 to 2500 nm, MIRS from 2.5 to 10 μm, while FTIR typically operates within the MIR region, but in some cases extends into the NIR and the Far-Infrared (FIR) regions.
The absorbance spectrum of 83 polluted samples was collected using a NIR spectrophotometer (NIRSystems 5000, produced by Foss, Denmark) in the study by Chen et al. [77]. The aim was the rapid evaluation of water pollution in agricultural applications. To this end, a CNN was designed and trained to enhance the prediction accuracy of NIR spectroscopy, attaining a calibration correlation coefficient Rc of 0.938 and reducing the RMSE of calibration to 19.86 mg/L. In another study by Chen et al. [57], focusing on water pollution assessment, the prediction of the samples’ COD values was performed using a least square support vector machine (LSSVM) algorithm. The optimal results (RMSECV = 20.19 mg/L) were obtained using a 5-fold cross-validation LSSVM model, with 5 hidden layers and 12 neurons per layer, enhanced with logistic-based kernel function. Pollution detection via NIRS was also investigated by Xu et al. [34], where they successfully distinguished polluted from non-polluted samples. Similarly, in a study by Skou et al. [78] the combination of NIRS and PLS was applied to monitor water quality in dairy processing units. In particular, they focused on urea content, a compound with potential biological risk, and achieved a RMSEP of 12.1 ppm concerning the process model validation. Bacterial identification was the focus of studies by Alexandrakis et al. [79] and Cámara-Martos et al. [80], both employing NIRS alongside multivariate analysis. Alexandrakis et al. suspended bacteria in water, and collected NIR spectra from aqueous solutions, achieving classification accuracies ranging from 77.4% to 100.0% using different chemometrics methods. Cámara-Martos et al. utilized FT-NIR, demonstrating successful quantification at high bacterial concentrations (3-9 log cfu/mL), with R values between 0.98 and 0.99. The quantification of pharmaceutical compounds, such as ibuprofen (IBU), sulfamethoxazole (SMX) and β-estradiol (E2) in wastewater using FT-NIR spectroscopy was investigated by Quintelas et al. [81], yielding promising results with R2 values ranging from 0.858 to 0.963 across the studied compounds.
The application of FTIR-ATR (attenuated total reflectance) spectroscopy to urban water bodies was investigated by Wu et al. [82] and Zheng et al. [83] focusing on nitrate and phosphorus concentrations, respectively. Fourier Transform Infrared is used as a biochemical fingerprint technique [84], while ATR serves as a sampling method used alongside with FTIR, allowing solid and liquid samples to be placed directly onto a crystal surface, with minimal preparation, where infrared light is directed onto them [85,86]. In another study, Wu et al. [82] reported R2 values ranging from 0.889 to 0.972, depending on the sampling month, and R2 values ranging from 0.784 to 0.994 across different nitrate concentrations. Regarding phosphorus monitoring, Zheng et al.[83] found that integrating FTIR-ATR with machine learning techniques was highly effective; indeed, self-adaptive PLS model yielded the most promising results with R2 = 0.973 and RMSEV = 0.015 mg/L.
Table 5.
Infrared spectroscopy applications and performance in water analysis.
| Wavelength | No of samples | Origin of sample | Chemometrics | Application | RMSE | Reference | |
| 200 – 14000 cm-1 | 276 | sludge wastewater treatment | PCA, PLS | IBU, SMX, E2, EE2, CRB |
0.943, 0.948, 0.951, 0.858, 0.963 |
5.47 %, 4.91 %, 6.16 %, 10.12%, 5.10 % |
[81] |
| 4000 – 650 cm-1 | 94 | river and lake water | PCA, PLSR | nitrate monitoring |
0.8868 – 0.9720, 0.7836 – 0.9938 |
- | [82] |
| 4000 – 800 cm-1 | 100 | river and lake water | PCA, SA-PLS | phosphorus monitoring |
0.973 | 0.015 mg/L | [83] |
| 390 – 1000 nm | ND | lake water | - | polluted/ non polluted |
- | - | [34] |
| 780 – 2500 nm | 83 | industrial wastewater | CNN | pollution level |
0.914 | 25.471 | [77] |
| 780 – 2500 nm | 83 | wastewater | LSSVM | COD | 0.912 | 20.19 mg/L* | [57] |
| 700 – 900 nm * | 418 | cultivated bacteria | PCA, PLS2-DA, SIMCA |
bacterial identification |
- | - | [79] |
| 1100 – 2500 nm | 140 | cultivated bacteria | PCA, PLS | bacterial identification |
0.983 – 0.99 | 0.09 – 0.28 log cfu/mL | [80] |
| 700 – 2500 nm | 32 | dairy process | PLS | urea, lactose | 12.1 ppm | [78] |
RMSE: Root Mean Square Error, PCA: Principal Component Analysis, PLS: Partial Least Squares, IBU: ibuprofen, SMX: sulfamethoxazole, E2: β-estradiol, EE2: ethinylestradiol, CRB: carbamazepine, PLSR: Partial Least Squares Regression, SA-PLS: Self-adaptive Partial Least Squares, CNN: Convolutional Neural Network, 1: RMSEC: Root Mean Square Error of Calibration, COD: Chemical Oxygen Demand, ND: Not Defined, LSSVM: Least Squares Support Vector Machine,*accuracy (%): 77.4 – 100, PLS2-DA: Partial Least Squares Discriminant Analysis, SIMCA: Soft Independent Modeling of Class Analogy
5.3 Other Spectroscopy Methods
Over the years, various methods have been studied for water analysis. Some of the studies have focused on water quality monitoring, addressing either instrumentation or application aspects [87,88,89], while others have investigated numerous techniques from a biosensor perspective, emphasizing the analytes detected [90]. Collectively, these studies illustrate the advancing landscape of analytical technologies in environmental monitoring and, more specifically, water quality assessment.
A combination of Raman scattering and Laser Induced Breakdown Spectroscopy (LIBS) was utilized by Liao et al. [91] for bacterial detection, achieving a linear detection range from 5 × 10³ to 5 × 10⁷ CFU/mL, with recovery values between 81.0% and 101.7%. In the study by Meng et al. [92], LIBS was applied in on-line/on-site water analysis for heavy metal detection. While aluminum enrichment resulted in a good limit of detection, the method was time consuming and unsuitable for real-time monitoring. In contrast, graphite enrichment proved more efficient in practical applications. Zhang et al. [56] employed fluorescence spectroscopy to identify water pollution originating from livestock farming. By integrating fluorescence measurements with multivariate statistical methods, the characteristics of dissolved organic matter (DOM) in groundwater were examined; their findings demonstrated that fluorescence-based techniques are effective for water pollution assessment, as hierarchical cluster analysis successfully classified samples into three distinct clusters based on varying degrees of contamination.
6. Future Research
Further development, specialization and validation of spectroscopic technologies for water analysis applications are still needed to overcome operational challenges, while improving their reliability under real-world conditions.
One of the main challenges is the use of portable or handheld instruments to obtain real-time water analysis results, either with respect to pollutant concentration measurement or to microbial/bacterial detection. Several studies have focused on this direction, employing different methods, such as LIBS or fluorescence spectroscopy for on-site analysis [11,92], however, further research is still needed to conclude their performance. Other spectroscopic methods with a proven analytical potential, should be further explored for the water analysis, such as Quantum Cascade Lasers (QCLs), which have demonstrated great promise in detecting ammonia in water [93]. Quantum cascade lasers are advantageous as a light source due to their adjustable energy bandgap engineering, which enables the design and production of lasers with highly specific emission spectra in the MIR and Terahertz (THz) regions. Additionally, the integration of QCLs into photonic integrated circuits (PIC) presents an attractive solution offering resilience, a compact device footprint, and the potential for low-cost production [94]. Considering these advantages, QCLs should be a key focus of future investigations in the field of water analysis.
An important direction that should be prioritized in future research is the implementation of ensemble methods wherein multiple algorithms will be combined to enhance prediction accuracy, rather than relying to a single algorithm. A similar approach could also be applied to spectroscopic techniques, where the fusion of of multiple methods could yield more robust analytical capabilities.
Finally, another highly promising direction in water analysis is the combination of spectral analyses with other emerging digital technologies such as Internet of Things (IoT), cloud computing, remote sensing, blockchain, satellite imaging, etc. These technologies have the potential to significantly enhance spectroscopic methods through real-time monitoring, data fusion, and secure data management [95]. For instance, IoT sensors and cloud platforms can facilitate continuous analysis and instantaneous processing, while blockchain technology can provide data integrity and traceability [96]. Integrating these technologies with spectroscopic water analysis methods could lead to smarter, faster, and more reliable water quality assessment systems.
7. Conclusions
Based on the reviewed studies, spectroscopy-based methods appear as some of the most advanced tools for water quality evaluation. Their fast, non-invasive, and sensitive nature makes them ideal for environmental monitoring, especially in real-time conditions. Techniques like IR and UV-Vis spectroscopy have demonstrated robust performance across diverse aquatic environments (such as surface, drinking, or industrial water sources). When combined with chemometric modeling, these methods exhibit enhanced precision and strong predictive potential for the classification, forecasting, and continuous monitoring of key quality parameters.
The exploration of ensemble ensemble learning techniques and hybrid AI models should be further explored to more effectively leverage the strengths of spectroscopic data and chemometric tools. Moreover, the fusion of spectroscopy with emerging digital technologies, such as the IoT, cloud computing, and blockchain, could facilitate the development of automated, tamper-proof systems that enable real-time diagnostics, remote monitoring, and secure data traceability. Despite the promising results, real-world implementation of spectroscopic methods for water analysis remains limited in the livestock sector, showcasing a pressing need for field-scale validation and deployment of relevant technologies and for a relevant and updated regulatory framework. In any case, targeted applications should be prioritized in sectors like livestock farming, emphasizing on the detection of contaminants and pathogens of high relevance to animal health and food safety, utilizing sustained collaboration across disciplines—including analytical chemistry, data science, engineering, and agricultural sciences—to ensure these technologies are both scalable and sustainable.
Author Contributions
Conceptualization, A-A.A. and A.I.G.; methodology, A-A.A., T.B., N.C., A.I.G.; investigation, A-A.A.; writing—original draft preparation, A-A.A.; writing—review and editing, A.I.G., T.B. and N.C.; supervision, A.I.G., funding acquisition: A.I.G. All authors have read and agreed to the published version of the manuscript.
Funding
This research is being implemented within the framework of the National Recovery and Resilience Plan «Greece 2.0» funded by European Union – NextGenerationEU: ΥΠ1TA-0558937. 
Acknowledgments
The authors would like to thank TCB Avgidis Automations S.A. for the invaluable support in the preparation of this review. The resources, administrative assistance, and access to relevant materials provided by TCB Avgidis Automations S.A. were essential in enabling the authors to thoroughly analyze and compile the information presented in this manuscript. This support is gratefully acknowledged.
Conflicts of Interest
A-A.A. was employed by TCB Avgidis Automations S.A. The remaining authors declare that the research was conducted in the absence of any commercial or financial relationships that could be construed as a potential conflict of interest.
References
- The Water Cycle. Available online: https://earthobservatory.nasa.gov/features/Water (accessed on 3 January 2025).
- Body Water - Wikipedia. Available online: https://en.wikipedia.org/wiki/Body_water (accessed on 3 January 2025).
- Musie, W.; Gonfa, G. Fresh Water Resource, Scarcity, Water Salinity Challenges and Possible Remedies: A Review. Heliyon 2023, 9, e18685. [Google Scholar] [CrossRef] [PubMed]
- One Health. Available online: https://www.who.int/health-topics/one-health?#tab=tab_1 (accessed on 25 February 2025).
- About One Health | One Health | CDC. Available online: https://www.cdc.gov/one-health/about/index.html? (accessed on 25 February 2025).
- One Health - WOAH - World Organisation for Animal Health. Available online: https://www.woah.org/en/what-we-do/global-initiatives/one-health/ (accessed on 25 February 2025).
- Aldaya, M.M.; Chapagain, A.K.; Hoekstra, A.Y.; Mekonnen, M.M. The Water Footprint Assessment Manual; 0 ed.; Routledge, 2012; ISBN 978-1-136-53852-0.
- How Much Water Does It Take to Make One Litre of Milk? | News | Te Herenga Waka—Victoria University of Wellington. Available online: https://www.wgtn.ac.nz/news/2022/05/how-much-water-does-it-take-to-make-one-litre-of-milk (accessed on 29 April 2025).
- How Much Water Is in 1 Kilo of Beef? | FAO. Available online: https://www.fao.org/family-farming/detail/en/c/1300546/ (accessed on 29 April 2025).
- Shi, Z.; Chow, C.W.K.; Fabris, R.; Liu, J.; Jin, B. Applications of Online UV-Vis Spectrophotometer for Drinking Water Quality Monitoring and Process Control: A Review. Sensors 2022, 22, 2987. [Google Scholar] [CrossRef] [PubMed]
- Baker, A.; Cumberland, S.A.; Bradley, C.; Buckley, C.; Bridgeman, J. To What Extent Can Portable Fluorescence Spectroscopy Be Used in the Real-Time Assessment of Microbial Water Quality? Science of The Total Environment 2015, 532, 14–19. [Google Scholar] [CrossRef] [PubMed]
- Spectroscopy | Definition, Types, & Facts | Britannica. Available online: https://www.britannica.com/science/spectroscopy (accessed on 8 January 2025).
- Pu, Y.-Y.; O’Donnell, C.; Tobin, J.T.; O’Shea, N. Review of Near-Infrared Spectroscopy as a Process Analytical Technology for Real-Time Product Monitoring in Dairy Processing. International Dairy Journal 2020, 103, 104623. [Google Scholar] [CrossRef]
- Spectroscopy - Wikipedia. Available online: https://en.wikipedia.org/wiki/Spectroscopy (accessed on 8 January 2025).
- Electromagnetic Spectrum | Definition, Diagram, & Uses | Britannica. Available online: https://www.britannica.com/science/electromagnetic-spectrum (accessed on 8 January 2025).
- Newton, I. A New Theory about Light and Colors. American Journal of Physics 1993, 61, 108–112. [Google Scholar] [CrossRef]
- Herschel, W. Investigation of the Powers of the Prismatic Colours to Heat and Illuminate Objects; with Remarks, That Prove the Different Refrangibility of Radiant Heat. To Which Is Added, an Inquiry into the Method of Viewing the Sun Advantageously, with Telescopes of Large Apertures and High Magnifying Powers. Philosophical Transactions of the Royal Society of London 1800, 90, 255–283. [Google Scholar] [CrossRef]
- Frercks, J.; Weber, H.; Wiesenfeldt, G. Reception and Discovery: The Nature of Johann Wilhelm Ritter’s Invisible Rays. Studies in History and Philosophy of Science Part A 2009, 40, 143–156. [Google Scholar] [CrossRef]
- Agiomavriti, A.-A.; Nikolopoulou, M.P.; Bartzanas, T.; Chorianopoulos, N.; Demestichas, K.; Gelasakis, A.I. Spectroscopy-Based Methods and Supervised Machine Learning Applications for Milk Chemical Analysis in Dairy Ruminants. Chemosensors 2024, 12, 263. [Google Scholar] [CrossRef]
- Qi, X.; Lian, Y.; Xie, L.; Wang, Y.; Lu, Z. Water Quality Detection Based on UV-Vis and NIR Spectroscopy: A Review. Applied Spectroscopy Reviews 2024, 59, 1036–1060. [Google Scholar] [CrossRef]
- Guo, Y.; Liu, C.; Ye, R.; Duan, Q. Advances on Water Quality Detection by UV-Vis Spectroscopy. Applied Sciences 2020, 10, 6874. [Google Scholar] [CrossRef]
- Swinehart, D.F. The Beer-Lambert Law.
- Schwarzenbach, R.P.; Egli, T.; Hofstetter, T.B.; Von Gunten, U.; Wehrli, B. Global Water Pollution and Human Health. Annu. Rev. Environ. Resour. 2010, 35, 109–136. [Google Scholar] [CrossRef]
- Omer, N.H. Water Quality Parameters; Water Quality-Science, Assessments and Policy IntechOpen: London, UK, 2019; Vol. 18. [Google Scholar]
- Mekonnen, M.M.; Hoekstra, A.Y. A Global Assessment of the Water Footprint of Farm Animal Products. Ecosystems 2012, 15, 401–415. [Google Scholar] [CrossRef]
- Minasyan, K. WATER USE IN LIVESTOCK PRODUCTION SYSTEMS AND SUPPLY CHAINS.
- Schlink, A.C.; Nguyen, M.L.; Viljoen, G.J. Water Requirements for Livestock Production: A Global Perspective: -EN- -FR- L’utilisation de l’eau Dans Le Secteur de l’élevage : Une Perspective Mondiale -ES- Necesidades de Agua Para La Producción Pecuaria Desde Una Perspectiva Mundial. Rev. Sci. Tech. OIE 2010, 29, 603–619. [Google Scholar] [CrossRef] [PubMed]
- Tullo, E.; Finzi, A.; Guarino, M. Review: Environmental Impact of Livestock Farming and Precision Livestock Farming as a Mitigation Strategy. Science of The Total Environment 2019, 650, 2751–2760. [Google Scholar] [CrossRef] [PubMed]
- Delgado, C.; Rosegrant, M.; Steinfeld, H.; Ehui, S.; Courbois, C. Livestock to 2020: The Next Food Revolution. Outlook Agric 2001, 30, 27–29. [Google Scholar] [CrossRef]
- Almeida, C.M.R.; Santos, F.; Ferreira, A.C.F.; Lourinha, I.; Basto, M.C.P.; Mucha, A.P. Can Veterinary Antibiotics Affect Constructed Wetlands Performance during Treatment of Livestock Wastewater? Ecological Engineering 2017, 102, 583–588. [Google Scholar] [CrossRef]
- Hooda, P.S.; Edwards, A.C.; Anderson, H.A.; Miller, A. A Review of Water Quality Concerns in Livestock Farming Areas. Science of The Total Environment 2000, 250, 143–167. [Google Scholar] [CrossRef] [PubMed]
- Wilkinson, J.; Garnsworthy, P. Impact of Diet and Fertility on Greenhouse Gas Emissions and Nitrogen Efficiency of Milk Production. Livestock 2017, 22, 140–144. [Google Scholar] [CrossRef]
- Mantovi, P.; Bonazzi, G.; Maestri, E.; Marmiroli, N. Accumulation of Copper and Zinc from Liquid Manure in Agricultural Soils and Crop Plants.
- Xu, P. Research and Application of Near-Infrared Spectroscopy in Rapid Detection of Water Pollution. Desalination and Water Treatment 2018, 122, 1–4. [Google Scholar] [CrossRef]
- Li, X.; Liu, C.; Chen, Y.; Huang, H.; Ren, T. Antibiotic Residues in Liquid Manure from Swine Feedlot and Their Effects on Nearby Groundwater in Regions of North China. Environ Sci Pollut Res 2018, 25, 11565–11575. [Google Scholar] [CrossRef] [PubMed]
- Boyd, C.E. Water Quality: An Introduction; 2nd ed. 2015.; Springer International Publishing : Imprint: Springer: Cham, 2015. ISBN 978-3-319-17446-4.
- Kruse, P. Review on Water Quality Sensors. J. Phys. D: Appl. Phys. 2018, 51, 203002. [Google Scholar] [CrossRef]
- Definition of “Contaminant” | US EPA. Available online: https://www.epa.gov/ccl/definition-contaminant (accessed on 19 May 2025).
- Water Pollution - Wikipedia. Available online: https://en.wikipedia.org/wiki/Water_pollution?utm_source=chatgpt.com (accessed on 19 May 2025).
- Karlsson, J.; Byström, P.; Ask, J.; Ask, P.; Persson, L.; Jansson, M. Light Limitation of Nutrient-Poor Lake Ecosystems. Nature 2009, 460, 506–509. [Google Scholar] [CrossRef] [PubMed]
- The Council of the European Union 2020 European Union Council Directive 98/83/EC of 23 December 2020 on the Quality of Water Intended for Human Consumption Official Journal of the European Communities 41 34–61.
- Guidelines for Drinking-Water Quality; World Health Organization, Ed.; Fourth edition incorporating the first and second addenda.; World Health Organization: Geneva, 2022; ISBN 978-92-4-004506-4.
- Forstinus, N.; Ikechukwu, N.; Emenike, M.; Christiana, A. Water and Waterborne Diseases: A Review. IJTDH 2016, 12, 1–14. [Google Scholar] [CrossRef] [PubMed]
- Feng, C.; Zhao, N.; Yin, G.; Gan, T.; Yang, R.; Chen, X.; Chen, M.; Duan, J. Artificial Neural Networks Combined Multi-Wavelength Transmission Spectrum Feature Extraction for Sensitive Identification of Waterborne Bacteria. Spectrochimica Acta Part A: Molecular and Biomolecular Spectroscopy 2021, 251, 119423. [Google Scholar] [CrossRef] [PubMed]
- Abdi, H.; Williams, L.J. Principal Component Analysis. WIREs Computational Stats 2010, 2, 433–459. [Google Scholar] [CrossRef]
- Abdi, H. Partial Least Squares Regression and Projection on Latent Structure Regression (PLS Regression). WIREs Computational Stats 2010, 2, 97–106. [Google Scholar] [CrossRef]
- Cortes, C.; Vapnik, V. Support-Vector Networks. Mach Learn 1995, 20, 273–297. [Google Scholar] [CrossRef]
- Neural Network (Machine Learning) - Wikipedia. Available online: https://en.wikipedia.org/wiki/Neural_network_(machine_learning) (accessed on 14 April 2025).
- Convolutional Neural Network - Wikipedia. Available online: https://en.wikipedia.org/wiki/Convolutional_neural_network (accessed on 14 April 2025).
- Quinlan, J.R. Induction of Decision Trees. Mach Learn 1986, 1, 81–106. [Google Scholar] [CrossRef]
- Random Forest - Wikipedia. Available online: https://en.wikipedia.org/wiki/Random_forest (accessed on 14 April 2025).
- Zhu, M.; Wang, J.; Yang, X.; Zhang, Y.; Zhang, L.; Ren, H.; Wu, B.; Ye, L. A Review of the Application of Machine Learning in Water Quality Evaluation. Eco-Environment & Health 2022, 1, 107–116. [Google Scholar] [CrossRef] [PubMed]
- Nasir, N.; Kansal, A.; Alshaltone, O.; Barneih, F.; Sameer, M.; Shanableh, A.; Al-Shamma’a, A. Water Quality Classification Using Machine Learning Algorithms. Journal of Water Process Engineering 2022, 48, 102920. [Google Scholar] [CrossRef]
- Kaddoura, S. Evaluation of Machine Learning Algorithm on Drinking Water Quality for Better Sustainability. Sustainability 2022, 14, 11478. [Google Scholar] [CrossRef]
- Najah Ahmed, A.; Binti Othman, F.; Abdulmohsin Afan, H.; Khaleel Ibrahim, R.; Ming Fai, C.; Shabbir Hossain, M.; Ehteram, M.; Elshafie, A. Machine Learning Methods for Better Water Quality Prediction. Journal of Hydrology 2019, 578, 124084. [Google Scholar] [CrossRef]
- Zhang, Y.; Liu, Y.; Zhou, A.; Zhang, L. Identification of Groundwater Pollution from Livestock Farming Using Fluorescence Spectroscopy Coupled with Multivariate Statistical Methods. Water Research 2021, 206, 117754. [Google Scholar] [CrossRef] [PubMed]
- Chen, H.; Xu, L.; Ai, W.; Lin, B.; Feng, Q.; Cai, K. Kernel Functions Embedded in Support Vector Machine Learning Models for Rapid Water Pollution Assessment via Near-Infrared Spectroscopy. Science of The Total Environment 2020, 714, 136765. [Google Scholar] [CrossRef] [PubMed]
- Figueiró, C.S.M.; Bastos De Oliveira, D.; Russo, M.R.; Caires, A.R.L.; Rojas, S.S. Fish Farming Water Quality Monitored by Optical Analysis: The Potential Application of UV–Vis Absorption and Fluorescence Spectroscopy. Aquaculture 2018, 490, 91–97. [Google Scholar] [CrossRef]
- Mouazen, A.M.; Karoui, R.; De Baerdemaeker, J.; Ramon, H. Characterization of Soil Water Content Using Measured Visible and Near Infrared Spectra. Soil Science Soc of Amer J 2006, 70, 1295–1302. [Google Scholar] [CrossRef]
- Feng, C.; Zhao, N.; Yin, G.; Gan, T.; Yang, R.; Chen, M.; Duan, J.; Hu, Y. A New Method for Detecting Mixed Bacteria Based on Multi-Wavelength Transmission Spectroscopy Technology. Spectrochimica Acta Part A: Molecular and Biomolecular Spectroscopy 2022, 270, 120852. [Google Scholar] [CrossRef] [PubMed]
- Chen, B.; Wu, H.; Li, S.F.Y. Development of Variable Pathlength UV–Vis Spectroscopy Combined with Partial-Least-Squares Regression for Wastewater Chemical Oxygen Demand (COD) Monitoring. Talanta 2014, 120, 325–330. [Google Scholar] [CrossRef] [PubMed]
- Li, J.; Tong, Y.; Guan, L.; Wu, S.; Li, D. Optimization of COD Determination by UV–Vis Spectroscopy Using PLS Chemometrics Algorithms. Optik 2018, 174, 591–599. [Google Scholar] [CrossRef]
- Agustsson, J.; Akermann, O.; Barry, D.A.; Rossi, L. Non-Contact Assessment of COD and Turbidity Concentrations in Water Using Diffuse Reflectance UV-Vis Spectroscopy. Environ. Sci.: Processes Impacts 2014, 16, 1897–1902. [Google Scholar] [CrossRef] [PubMed]
- Hu, Y.; Wen, Y.; Wang, X. Novel Method of Turbidity Compensation for Chemical Oxygen Demand Measurements by Using UV–Vis Spectrometry. Sensors and Actuators B: Chemical 2016, 227, 393–398. [Google Scholar] [CrossRef]
- Hu, Y.; Wang, X. Application of Surrogate Parameters in Characteristic UV–Vis Absorption Bands for Rapid Analysis of Water Contaminants. Sensors and Actuators B: Chemical 2017, 239, 718–726. [Google Scholar] [CrossRef]
- Zhu, X.; Chen, L.; Pumpanen, J.; Keinänen, M.; Laudon, H.; Ojala, A.; Palviainen, M.; Kiirikki, M.; Neitola, K.; Berninger, F. Assessment of a Portable UV–Vis Spectrophotometer’s Performance for Stream Water DOC and Fe Content Monitoring in Remote Areas. Talanta 2021, 224, 121919. [Google Scholar] [CrossRef] [PubMed]
- Cook, S.; Peacock, M.; Evans, C.D.; Page, S.E.; Whelan, M.J.; Gauci, V.; Kho, L.K. Quantifying Tropical Peatland Dissolved Organic Carbon (DOC) Using UV-Visible Spectroscopy. Water Research 2017, 115, 229–235. [Google Scholar] [CrossRef] [PubMed]
- Zhu, Q.; Gu, A.; Li, D.; Zhang, T.; Xiang, L.; He, M. Online Recognition of Drainage Type Based on UV-Vis Spectra and Derivative Neural Network Algorithm. Front. Environ. Sci. Eng. 2021, 15, 136. [Google Scholar] [CrossRef]
- Wang, K.; Yu, J.; Hou, D.; Yin, H.; Yu, Q.; Huang, P.; Zhang, G. Optical Detection of Contamination Event in Water Distribution System Using Online Bayesian Method with UV–Vis Spectrometry. Chemometrics and Intelligent Laboratory Systems 2019, 191, 168–174. [Google Scholar] [CrossRef]
- Etheridge, J.R.; Birgand, F.; Osborne, J.A.; Osburn, C.L.; Burchell, M.R.; Irving, J. Using in Situ Ultraviolet-visual Spectroscopy to Measure Nitrogen, Carbon, Phosphorus, and Suspended Solids Concentrations at a High Frequency in a Brackish Tidal Marsh. Limnology & Ocean Methods 2014, 12, 10–22. [Google Scholar] [CrossRef]
- Mason, A.; Soprani, M.; Korostynska, O.; Amirthalingam, A.; Cullen, J.; Muradov, M.; Carmona, E.N.; Sberveglieri, G.; Sberveglieri, V.; Al-Shamma’a, A. Real-Time Microwave, Dielectric, and Optical Sensing of Lincomycin and Tylosin Antibiotics in Water: Sensor Fusion for Environmental Safety. Journal of Sensors 2018, 2018, 1–11. [Google Scholar] [CrossRef]
- Chen, X.; Yin, G.; Zhao, N.; Gan, T.; Yang, R.; Xia, M.; Feng, C.; Chen, Y.; Huang, Y. Simultaneous Determination of Nitrate, Chemical Oxygen Demand and Turbidity in Water Based on UV–Vis Absorption Spectrometry Combined with Interval Analysis. Spectrochimica Acta Part A: Molecular and Biomolecular Spectroscopy 2021, 244, 118827. [Google Scholar] [CrossRef] [PubMed]
- Zhou, F.; Li, C.; Yang, C.; Zhu, H.; Li, Y. A Spectrophotometric Method for Simultaneous Determination of Trace Ions of Copper, Cobalt, and Nickel in the Zinc Sulfate Solution by Ultraviolet-Visible Spectrometry. Spectrochimica Acta Part A: Molecular and Biomolecular Spectroscopy 2019, 223, 117370. [Google Scholar] [CrossRef] [PubMed]
- Zhao, C.; Zhong, G.; Kim, D.-E.; Liu, J.; Liu, X. A Portable Lab-on-a-Chip System for Gold-Nanoparticle-Based Colorimetric Detection of Metal Ions in Water. Biomicrofluidics 2014, 8, 052107. [Google Scholar] [CrossRef] [PubMed]
- Steyer, J.P.; Bouvier, J.C.; Conte, T.; Gras, P.; Harmand, J.; Delgenes, J.P. On-Line Measurements of COD, TOC, VFA, Total and Partial Alkalinity in Anaerobic Digestion Processes Using Infra-Red Spectrometry. Water Science and Technology 2002, 45, 133–138. [Google Scholar] [CrossRef] [PubMed]
- Zhang, Y.; Ye, A.; Yao, Y.; Yao, C. A Sensitive Near-Infrared Fluorescent Probe for Detecting Heavy Metal Ag+ in Water Samples. Sensors 2019, 19, 247. [Google Scholar] [CrossRef] [PubMed]
- Chen, H.; Chen, A.; Xu, L.; Xie, H.; Qiao, H.; Lin, Q.; Cai, K. A Deep Learning CNN Architecture Applied in Smart Near-Infrared Analysis of Water Pollution for Agricultural Irrigation Resources. Agricultural Water Management 2020, 240, 106303. [Google Scholar] [CrossRef]
- Skou, P.B.; Berg, T.A.; Aunsbjerg, S.D.; Thaysen, D.; Rasmussen, M.A.; Van Den Berg, F. Monitoring Process Water Quality Using Near Infrared Spectroscopy and Partial Least Squares Regression with Prediction Uncertainty Estimation. Appl Spectrosc 2017, 71, 410–421. [Google Scholar] [CrossRef] [PubMed]
- Alexandrakis, D.; Downey, G.; Scannell, A.G.M. Detection and Identification of Bacteria in an Isolated System with Near-Infrared Spectroscopy and Multivariate Analysis. J. Agric. Food Chem. 2008, 56, 3431–3437. [Google Scholar] [CrossRef] [PubMed]
- Cámara-Martos, F.; Zurera-Cosano, G.; Moreno-Rojas, R.; García-Gimeno, R.M.; Pérez-Rodríguez, F. Identification and Quantification of Lactic Acid Bacteria in a Water-Based Matrix with Near-Infrared Spectroscopy and Multivariate Regression Modeling. Food Anal. Methods 2012, 5, 19–28. [Google Scholar] [CrossRef]
- Quintelas, C.; Mesquita, D.P.; Ferreira, E.C.; Amaral, A.L. Quantification of Pharmaceutical Compounds in Wastewater Samples by near Infrared Spectroscopy (NIR). Talanta 2019, 194, 507–513. [Google Scholar] [CrossRef] [PubMed]
- Wu, K.; Ma, F.; Li, Z.; Wei, C.; Gan, F.; Du, C. In-Situ Rapid Monitoring of Nitrate in Urban Water Bodies Using Fourier Transform Infrared Attenuated Total Reflectance Spectroscopy (FTIR-ATR) Coupled with Deconvolution Algorithm. Journal of Environmental Management 2022, 317, 115452. [Google Scholar] [CrossRef] [PubMed]
- Zheng, S.; Ma, F.; Zhou, J.; Du, C. Monitoring of Total Phosphorus in Urban Water Bodies Using Silicon Crystal-Based FTIR-ATR Coupled with Different Machine Learning Approaches. Water 2024, 16, 2479. [Google Scholar] [CrossRef]
- Pampoukis, G.; Lytou, A.E.; Argyri, A.A.; Panagou, E.Z.; Nychas, G.-J.E. Recent Advances and Applications of Rapid Microbial Assessment from a Food Safety Perspective. Sensors 2022, 22, 2800. [Google Scholar] [CrossRef] [PubMed]
- Sampling Techniques for FTIR Spectroscopy - JASCO. Available online: https://jascoinc.com/learning-center/theory/spectroscopy/fundamentals-ftir-spectroscopy/sampling/ (accessed on 9 April 2025).
- Attenuated Total Reflectance - Wikipedia. Available online: https://en.wikipedia.org/wiki/Attenuated_total_reflectance (accessed on 9 April 2025).
- Li, Z.; Deen, M.; Kumar, S.; Selvaganapathy, P. Raman Spectroscopy for In-Line Water Quality Monitoring—Instrumentation and Potential. Sensors 2014, 14, 17275–17303. [Google Scholar] [CrossRef] [PubMed]
- Yu, X.; Li, Y.; Gu, X.; Bao, J.; Yang, H.; Sun, L. Laser-Induced Breakdown Spectroscopy Application in Environmental Monitoring of Water Quality: A Review. Environ Monit Assess 2014, 186, 8969–8980. [Google Scholar] [CrossRef] [PubMed]
- Ren, J.; Zhao, Y.; Yu, K. LIBS in Agriculture: A Review Focusing on Revealing Nutritional and Toxic Elements in Soil, Water, and Crops. Computers and Electronics in Agriculture 2022, 197, 106986. [Google Scholar] [CrossRef]
- Aloisi, A.; Della Torre, A.; De Benedetto, A.; Rinaldi, R. Bio-Recognition in Spectroscopy-Based Biosensors for *Heavy Metals-Water and Waterborne Contamination Analysis. Biosensors 2019, 9, 96. [Google Scholar] [CrossRef] [PubMed]
- Liao, W.; Lin, Q.; Xie, S.; He, Y.; Tian, Y.; Duan, Y. A Novel Strategy for Rapid Detection of Bacteria in Water by the Combination of Three-Dimensional Surface-Enhanced Raman Scattering (3D SERS) and Laser Induced Breakdown Spectroscopy (LIBS). Analytica Chimica Acta 2018, 1043, 64–71. [Google Scholar] [CrossRef] [PubMed]
- Meng, D.; Zhao, N.; Wang, Y.; Ma, M.; Fang, L.; Gu, Y.; Jia, Y.; Liu, J. On-Line/on-Site Analysis of Heavy Metals in Water and Soils by Laser Induced Breakdown Spectroscopy. Spectrochimica Acta Part B: Atomic Spectroscopy 2017, 137, 39–45. [Google Scholar] [CrossRef]
- Apostolakis, A.; Aoust, G.; Maisons, G.; Laurent, L.; Pereira, M.F. Photoacoustic Spectroscopy Using a Quantum Cascade Laser for Analysis of Ammonia in Water Solutions. ACS Omega 2024, 9, 19127–19135. [Google Scholar] [CrossRef] [PubMed]
- Wang, D.; Kannojia, H.K.; Jouy, P.; Giraud, E.; Suter, K.; Maulini, R.; Gachet, D.; Hetier, L.; Van Steenberge, G.; Kuyken, B. Innovative Integration of Dual Quantum Cascade Lasers on Silicon Photonics Platform. Micromachines 2024, 15, 1055. [Google Scholar] [CrossRef] [PubMed]
- Sagan, V.; Peterson, K.T.; Maimaitijiang, M.; Sidike, P.; Sloan, J.; Greeling, B.A.; Maalouf, S.; Adams, C. Monitoring Inland Water Quality Using Remote Sensing: Potential and Limitations of Spectral Indices, Bio-Optical Simulations, Machine Learning, and Cloud Computing. Earth-Science Reviews 2020, 205, 103187. [Google Scholar] [CrossRef]
- Lin, Y.-P.; Mukhtar, H.; Huang, K.-T.; Petway, J.R.; Lin, C.-M.; Chou, C.-F.; Liao, S.-W. Real-Time Identification of Irrigation Water Pollution Sources and Pathways with a Wireless Sensor Network and Blockchain Framework. Sensors 2020, 20, 3634. [Google Scholar] [CrossRef] [PubMed]
Figure 1.
The electromagnetic spectrum and wavelength ranges of electromagnetic radiation applied in water quality analyses [19] (modified).
Figure 1.
The electromagnetic spectrum and wavelength ranges of electromagnetic radiation applied in water quality analyses [19] (modified).
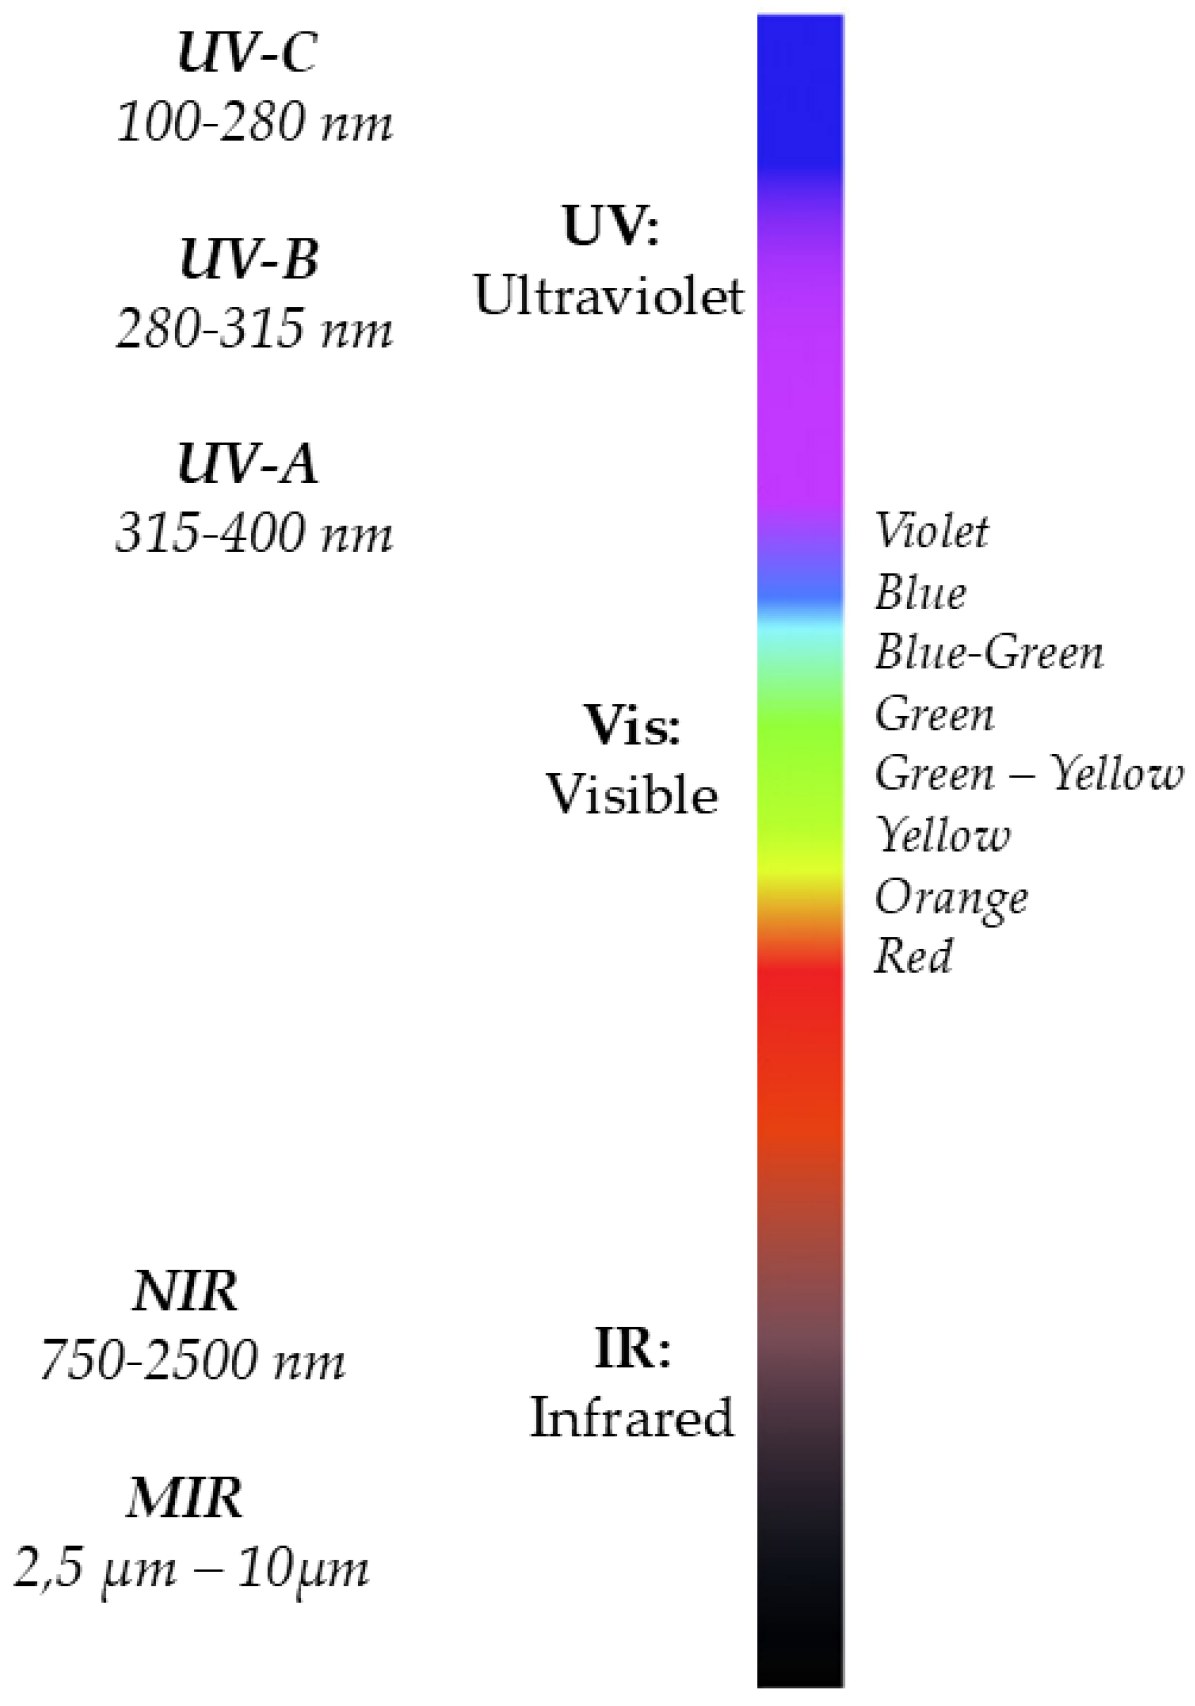
Figure 2.
Schematic representation of Lambert-Beer’s law.
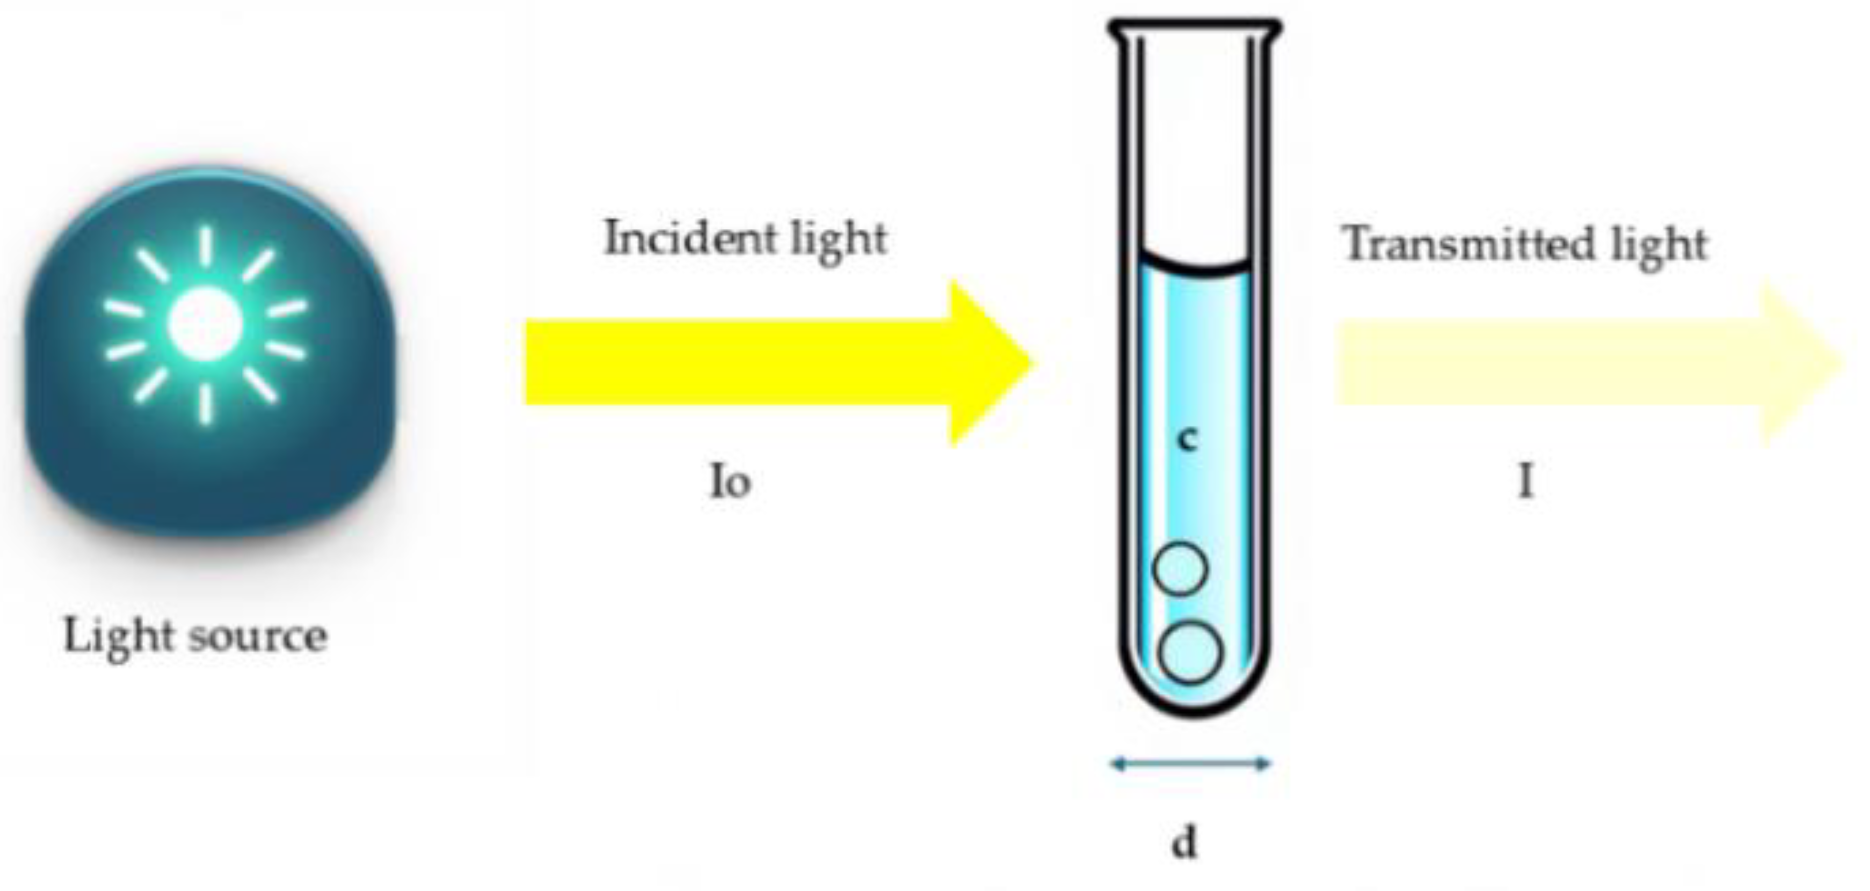
Figure 4.
The four water quality categories.
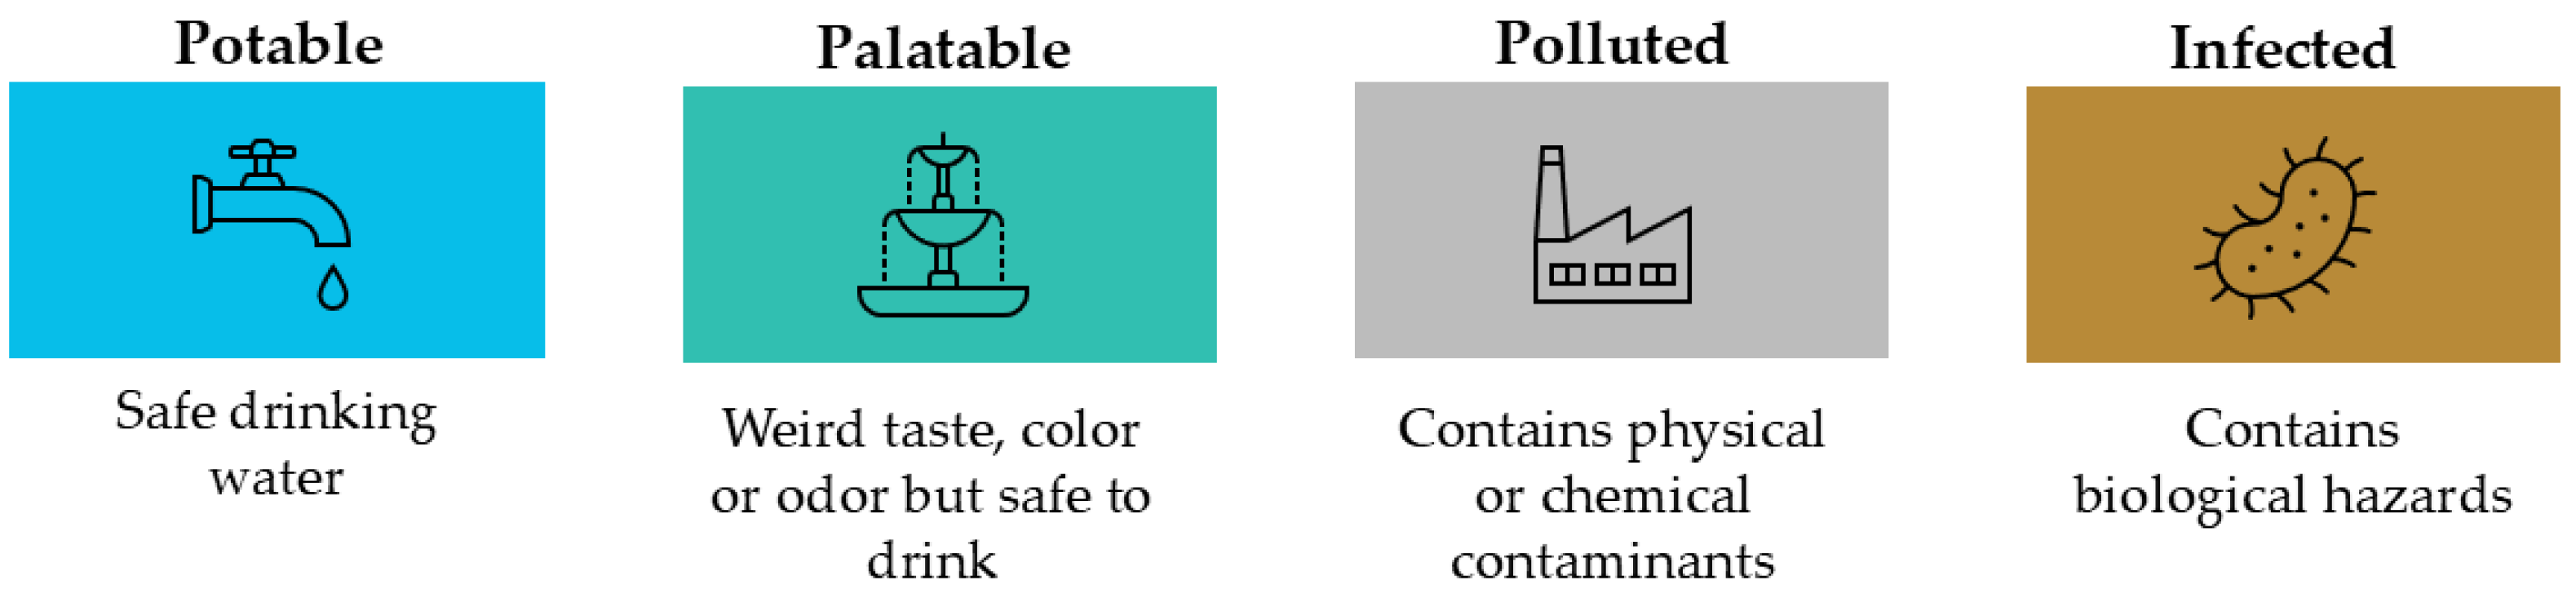
Figure 6.
Schematic representation of the spectroscopic analysis process in the water quality assessment.
Figure 6.
Schematic representation of the spectroscopic analysis process in the water quality assessment.
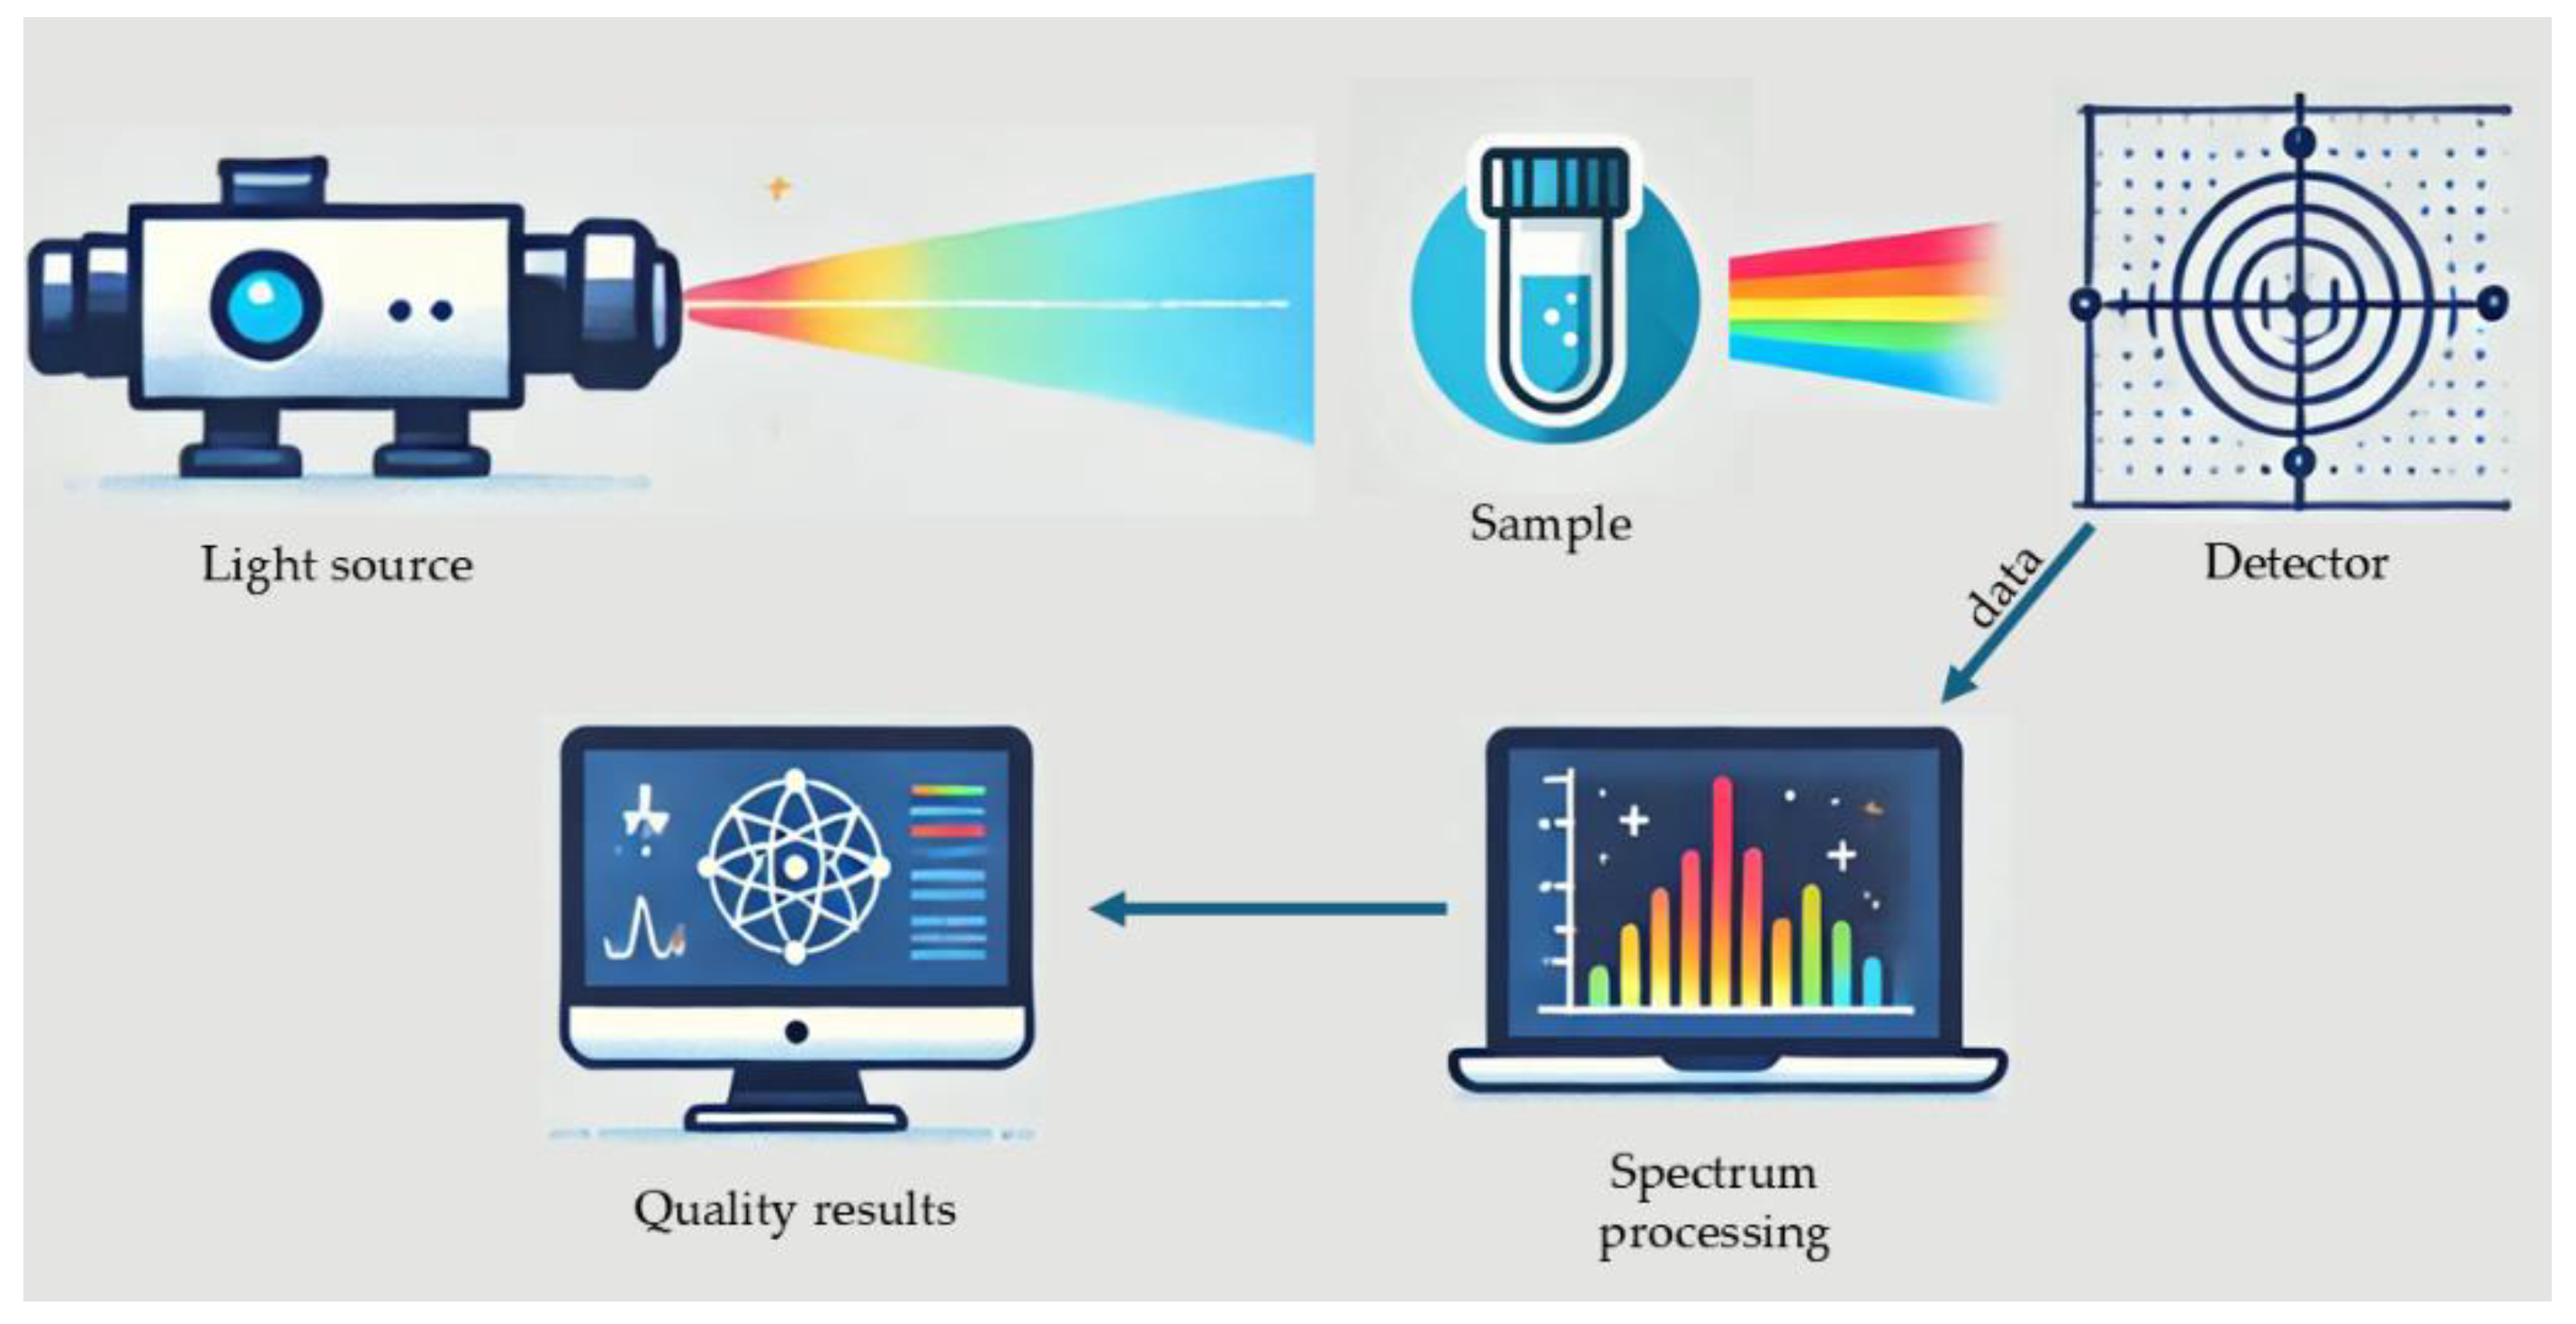
Table 1.
Water quality thresholds for animal watering and crop irrigation in the USA [27].
Table 1.
Water quality thresholds for animal watering and crop irrigation in the USA [27].
| Elements | Threshold for animal watering | Threshold for crop irrigation |
|---|---|---|
| chlorine (ppm) | 300 | |
| chromium (ppm) | 1.0 | 1.0 |
| copper (ppm) | 0.5 | 5.0 |
| lead (ppm) | 0.1 | 10.0 |
| mercury (ppm) | 0.01 | |
| nickel (ppm) | 1.0 | 2.0 |
| nitrate nitrogen (ppm) | 100 | |
| pH | 8.5 | |
| phosphorus (ppm) | 0.7 | |
| sulphates (ppm) | 300 | |
| total bacteria (n/100 ml) | 1000 | |
| total dissolved solids (ppm) | 5000 |
ppm: parts per million, n: numbers
Table 2.
Physical, chemical, and biological parameters used to define water quality [24].
Table 2.
Physical, chemical, and biological parameters used to define water quality [24].
| Physical | Chemical | Biological |
|---|---|---|
| turbidity | pH | bacteria |
| temperature | acidity | algae |
| color | alkalinity | viruses |
| taste and odor | chloride | protozoa |
| solids | chloride residual | |
| electrical conductivity (EC) | sulfate | |
| fluoride | ||
| iron and manganese | ||
| copper and zinc | ||
| hardness | ||
| dissolved oxygen | ||
| biochemical oxygen demand (BOD) | ||
| chemical oxygen demand (COD) | ||
| toxic inorganic substances | ||
| toxic organic substances | ||
| radioactive substances |
Table 3.
Indicative parameters for drinking water quality and associated limits [37].
Table 3.
Indicative parameters for drinking water quality and associated limits [37].
| Parameter | Europe [41] | WHO [42] |
|---|---|---|
| pH | 6.5-9.5 | - |
| Electrical conductivity (μS cm-1 at 20 °C) | 2500 | - |
| ammonia/ammonium (mg/l) | 0.5 | 0.2 |
| chloride (mg/l) | 250 | 250 |
| chromium (μg/l) | 25 | 50 |
| copper (mg/l) | 2.0 | 2.0 |
| fluoride (mg/l) | 1.5 | 1.5 |
| lead (μg/l) | 5.0 | 10 |
| nitrate (mg/l) | 50 | 50 |
| nitrite (mg/l) | 0.5 | 3.0 |
| sulphate (mg/l) | 250 | - |
| pesticides (total) (μg/l) | 0.5 | - |
Disclaimer/Publisher’s Note: The statements, opinions and data contained in all publications are solely those of the individual author(s) and contributor(s) and not of MDPI and/or the editor(s). MDPI and/or the editor(s) disclaim responsibility for any injury to people or property resulting from any ideas, methods, instructions or products referred to in the content. |
© 2025 by the authors. Licensee MDPI, Basel, Switzerland. This article is an open access article distributed under the terms and conditions of the Creative Commons Attribution (CC BY) license (http://creativecommons.org/licenses/by/4.0/).
Copyright: This open access article is published under a Creative Commons CC BY 4.0 license, which permit the free download, distribution, and reuse, provided that the author and preprint are cited in any reuse.


